doctor of philosophy degree - welcome |...
TRANSCRIPT
FIELD BASED TESTING PROTOCOLS
TO MONITOR TRAINING
ADAPTATIONS AND PERFORMANCE
IN ELITE ROWERS
Andrew J. Vogler, BASc, BSc (Hons)
Doctor of Philosophy Degree
Flinders University Exercise Physiology Laboratory, School of Education
Adelaide, Australia
Australian Institute of Sport Department of Physiology
Canberra, Australia
January 2010
Field based testing protocols to monitor training adaptations and performance in elite rowers
i
THESIS CONTENTS
CHAPTER 1 - I�TRODUCTIO�, BACKGROU�D A�D STATEME�T OF
PROBLEM
1.1 INTRODUCTION ................................................................................................. 1
1.2 BACKGROUND ................................................................................................... 3
1.2.1 Competitive rowing ................................................................................. 3
1.2.2 Descriptive characteristics of elite rowers ............................................... 3
1.2.3 Physiological demands of competitive rowing ....................................... 5
1.2.4 Physiological testing of elite rowers ....................................................... 7
1.3 STATEMENT OF PROBLEM ............................................................................. 9
1.3.1 Aims ........................................................................................................ 9
1.3.2 Limitations ............................................................................................. 11
1.3.3 Delimitations ......................................................................................... 12
1.4 DATA ANALYSIS CONSIDERATIONS .......................................................... 14
CHAPTER 2 - LITERATURE REVIEW: ROWI�G TESTI�G –
LABORATORY A�D FIELD PROTOCOLS
2.1 INTRODUCTION ............................................................................................... 16
2.2 ROWING ERGOMETRY ................................................................................... 16
2.2.1 Metabolic cost of rowing ....................................................................... 17
2.2.2 Aerobic and anaerobic energy contribution .......................................... 19
2.2.3 Performance determinants and modelling ............................................. 21
2.2.4 Fitness monitoring ................................................................................. 23
2.3 LABORATORY BASED ROWING TESTING ................................................. 24
2.3.1 Evaluation of training adaptations ......................................................... 24
2.3.2 Definition of lactate thresholds ............................................................. 26
2.3.3 Prescription of rowing training intensities ............................................ 29
2.4 VALIDITY OF ERGOMETER ROWING ......................................................... 32
2.4.1 Movement patterns ................................................................................ 32
2.4.2 Biomechanics ........................................................................................ 34
2.4.3 Rowing performance ............................................................................. 36
2.4.4 Physiological responses ......................................................................... 36
2.5 ON-WATER INCREMENTAL ROWING PROTOCOLS ................................ 38
2.5.1 Methodological limitations .................................................................... 39

Field based testing protocols to monitor training adaptations and performance in elite rowers
ii
2.5.2 Measurement of on-water rowing power output ................................... 40
2.5.3 Measurement of metabolic load during on-water rowing ..................... 41
2.5.4 Reliability .............................................................................................. 43
2.6 CONCLUSIONS ................................................................................................. 44
CHAPTER 3 - VALIDATIO� OF THE CO�CEPT2 MODEL D ROWI�G
ERGOMETER
3.1 INTRODUCTION ............................................................................................... 45
3.2 METHODS .......................................................................................................... 48
3.2.1 Subjects ................................................................................................. 48
3.2.2 Experimental protocol ........................................................................... 48
Incremental rowing protocol ............................................................... 48
3.2.3 Statistical analyses ................................................................................. 50
3.3 RESULTS ............................................................................................................ 51
3.3.1 Subjects ................................................................................................. 51
3.3.2 Comparison between ergometer models (C2C vs. C2D) ...................... 51
Submaximal performance ................................................................... 51
Maximal performance ......................................................................... 51
Blood lactate thresholds ...................................................................... 51
3.3.3 Reliability of test results using the C2D ergometer............................... 53
Submaximal performance ................................................................... 53
Maximal performance ......................................................................... 53
Blood lactate thresholds ...................................................................... 53
3.4 DISCUSSION ...................................................................................................... 60
3.4.1 Comparison between ergometer models (C2C vs. C2D) ...................... 60
3.4.2 Reliability of test results using the C2D ergometer............................... 61
3.4.3 Practical applications ............................................................................. 61
3.5 CONCLUSION ................................................................................................... 65
CHAPTER 4 - VALIDITY OF THE METAMAX3B PORTABLE
METABOLIC SYSTEM
4.1 INTRODUCTION ............................................................................................... 66
4.2 METHODS .......................................................................................................... 69
4.2.1 Subjects ................................................................................................. 69
4.2.2 Indirect calorimetry equipment ............................................................. 69
Portable metabolic system .................................................................. 69
Laboratory metabolic system .............................................................. 69
Calibration of the metabolic systems .................................................. 72
Metabolic simulation system .............................................................. 74
4.2.3 Experimental protocol ........................................................................... 74
Incremental rowing protocol ............................................................... 76
4.2.4 Statistical analyses ................................................................................. 77
Reliability ............................................................................................ 77

Field based testing protocols to monitor training adaptations and performance in elite rowers
iii
Accuracy ............................................................................................. 78
4.3 RESULTS ............................................................................................................ 79
4.3.1 Simulated metabolic outputs ................................................................. 79
4.3.2 Power output during biological trials .................................................... 79
4.3.3 Biological trials ..................................................................................... 81
4.4 DISCUSSION ...................................................................................................... 88
4.4.1 Reliability of repeated MM3B measurements ....................................... 88
4.4.2 Accuracy of the MM3B compared with an automated Douglas bag
system (MOUSe) ........................................................................................ 89
4.5 CONCLUSIONS ................................................................................................. 93
CHAPTER 5 - COMPARISO� OF ERGOMETER A�D O�-WATER
I�CREME�TAL ROWI�G TESTS
5.1 INTRODUCTION ............................................................................................... 94
5.2 METHODS .......................................................................................................... 98
5.2.1 Subjects ................................................................................................. 98
5.2.2 Experimental protocol ........................................................................... 98
Laboratory test protocol .................................................................... 101
On-water test protocol ....................................................................... 101
Blood lactate thresholds .................................................................... 102
5.2.3 Data treatment ..................................................................................... 103
5.2.4 Statistical analyses ............................................................................... 107
5.3 RESULTS .......................................................................................................... 109
5.3.1 Comparison between test modalities (laboratory vs. on water) .......... 109
Power output measurements ............................................................. 109
Submaximal performance ................................................................. 109
Maximal performance ....................................................................... 109
Blood lactate thresholds .................................................................... 112
5.3.2 Reliability of measures on water ......................................................... 112
Submaximal performance ................................................................. 112
Maximal performance ....................................................................... 112
Typical error results .......................................................................... 112
5.4 DISCUSSION .................................................................................................... 116
5.4.1 Comparison between test modalities (laboratory vs. on water) .......... 117
5.4.2 Reliability of measures on water ......................................................... 121
5.5 CONCLUSION ................................................................................................. 125
CHAPTER 6 - MO�ITORI�G FIT�ESS A�D PERFORMA�CE WITH
ERGOMETER A�D O�-WATER I�CREME�TAL ROWI�G TESTS
6.1 INTRODUCTION ............................................................................................. 126
6.2 METHODS ........................................................................................................ 129
6.2.1 Subjects ............................................................................................... 129
6.2.2 Experimental protocol ......................................................................... 129

Field based testing protocols to monitor training adaptations and performance in elite rowers
iv
2000-m ergometer time-trial ............................................................. 131
Laboratory test .................................................................................. 131
On-water incremental test ................................................................. 132
Blood lactate thresholds .................................................................... 133
6.2.3 Data treatment ..................................................................................... 133
6.2.4 Statistical analyses ............................................................................... 134
Classification of magnitude-based differences ................................. 134
Practically substantial differences based on the smallest
worthwhile change ............................................................................ 135
Prediction of rowing time-trial performance .................................... 135
6.3 RESULTS .......................................................................................................... 138
6.3.1 Training logs ........................................................................................ 138
6.3.2 2000-m ergometer time-trial................................................................ 138
6.3.3 Ergometer and on-water incremental rowing tests .............................. 138
Magnitude-based differences between baseline and post-
training results ................................................................................... 138
Practical interpretation of the baseline to post-training
changes .............................................................................................. 139
Comparison of physiological responses to ergometer and on-
water rowing ..................................................................................... 139
6.3.4 Relationship between incremental rowing test results and
performance .............................................................................................. 145
6.4 DISCUSSION .................................................................................................... 147
6.4.1 Magnitude-based differences between baseline and post-training
results ....................................................................................................... 147
Practical interpretation of the baseline to post-training
changes .............................................................................................. 149
6.4.2 Comparison of ergometer and on-water physiological responses ....... 149
6.4.3 Relationship between incremental rowing test results and
performance .............................................................................................. 150
6.5 CONCLUSIONS ............................................................................................... 152
CHAPTER 7 - SUMMARY, CO�CLUSIO�S A�D RECOMME�DATIO�S
7.1 SUMMARY....................................................................................................... 153
7.2 PRACTICAL APPLICATIONS ........................................................................ 158
7.3 FUTURE DIRECTIONS ................................................................................... 159
REFERE�CES ....................................................................................................... 161
APPE�DIX - PUBLICATIO�S ............................................................................ 175

Contents
v
FIGURES
Figure 2-1: LT1 (aerobic threshold) and LT2 (AT) blood lactate thresholds
determined by ADAPT software (AIS, Canberra, Australia) from the
blood lactate-power output curve established during a 6-stage
incremental rowing test. ........................................................................ 28
Figure 2-2: Kinetic energy of the rower’s body during a single rowing stroke
performed on a stationary ergometer (ergo) and on-water (boat) and the
kinetic energy of the boat (shell). .......................................................... 33
Figure 3-1: (A) Blood lactate concentration and (B) heart rate during the
incremental rowing protocol performed on Concept2 Model C and
Model D ergometers.. ............................................................................ 55
Figure 3-2: Oxygen economy during the incremental rowing protocol performed on
Concept2 Model C and Model D ergometers. ....................................... 57
Figure 3-3: (A) Blood lactate concentration, (B) heart rate and (C) oxygen
consumption during both incremental rowing protocols performed on
the Concept2 Model D ergometer. ........................................................ 58
Figure 4-1: Oxygen consumption ( 2OV& ), carbon dioxide production ( 2COV& ),
respiratory exchange ratio (RER) and ventilation ( EV& ) as measured by
the criterion MOUSe system during the incremental rowing test, and by
the MM3B during Trial 1 and Trial 2 of duplicate rowing tests. .......... 83
Figure 4-2: Bland-Altman plots of individual errors from duplicate MM3B trials
(Trial 2 - Trial 1) during each workload of the incremental rowing test
for oxygen consumption ( 2OV& ), carbon dioxide production ( 2COV& ),
respiratory exchange ratio (RER) and ventilation ( EV& ). ...................... 85
Figure 4-3: Bland-Altman plots of individual errors (MM3B - MOUSe) from each
of the workloads during the incremental rowing test for oxygen
consumption ( 2OV& ), carbon dioxide production ( 2COV& ), respiratory
exchange ratio (RER) and ventilation ( EV& ). ........................................ 87
Figure 5-1: Mean power output during submaximal and maximal workloads for the
ergometer (ERG) and on-water (OW) incremental tests. .................... 104
Figure 5-2: Mean results for A) blood lactate (BLa), B) heart rate (HR) and C)
oxygen consumption ( 2OV& ) using untreated data that does not account
for the differences in submaximal workloads between ergometer (ERG)
and on-water (OW) incremental rowing tests. .................................... 105
Figure 5-3: Mean submaximal results for A) heart rate (HR), B) blood lactate
(BLa), C) oxygen consumption ( 2OV& ) and D) distance completed
during ergometer (ERG) and on-water (OW) tests based on power
normalised data using the standard power outputs. ............................. 110
Figure 5-4: Trial 1 (x axis) vs. Trial 2 (y axis) scatter plots and linear regression
trendlines for A) heart rate (HR), B) blood lactate concentration (BLa),
C) oxygen consumption ( 2OV& ) and D) distance completed during
repeated on-water (OW) incremental rowing tests. ............................. 114
Contents
vi
Figure 6-1: Mean results for heart rate (HR) using untreated data that does not
account for the differences in submaximal workloads between A) the
ergometer (ERG) and on-water (OW) incremental rowing tests, and B)
the baseline and post-training tests using the OW protocol. ............... 136
Figure 6-2: Average change in power output for individual athletes during the
baseline and post-training 2000-m ergometer time-trials (TT). .......... 142
Figure 6-3: Mean results using normalised submaximal data based on the standard
power outputs for A) blood lactate (BLa), B) heart rate (HR) and C)
oxygen consumption ( 2OV& ) during the baseline and post-training
ergometer (ERG; left) and on-water (OW; right) incremental rowing
tests. ..................................................................................................... 143

Contents
vii
TABLES
Table 1-1: 2000-m race times for finalists in World Cup, World Championship and
Olympic regattas 2000-2004. .................................................................. 4
Table 1-2: Summary of published literature relating to the physiological demands
of competitive rowing for national level rowers. .................................... 6
Table 2-1: Summary of literature on performance modelling of competitive
rowing. Displayed values are correlation coefficients (R) between
selected physiological and anthropometric variables and rowing time-
trial performance. .................................................................................. 22
Table 2-2: Contemporary training intensity zones and traditional rowing
classifications based on LT1 and LT2 blood lactate thresholds, and
approximate heart rate and blood lactate concentration equivalents for a
male heavyweight rower. ...................................................................... 31
Table 3-1: Subject description and performance characteristics during 4 min
maximal ergometer rowing for males (n=6) and females (n=2)........... 52
Table 3-2: Power output, stroke rate and selected physiological variables during
incremental rowing performed on Concept2 Model C and Model D
ergometers. ............................................................................................ 56
Table 3-3: LT1 and LT2 thresholds calculated from blood lactate-power output
relationships during incremental rowing performed on Concept2 Model
C and Model D ergometers.................................................................... 57
Table 3-4: Reliability (% TE) of repeated measurements during the submaximal
and maximal portions of the incremental rowing tests performed on the
Concept2 Model D rowing ergometer. .................................................. 59
Table 4-1: Physical characteristics of the subjects. ................................................ 70
Table 4-2: Simulated metabolic outputs for five different settings using the
metabolic calibrator (italicised) and the corresponding mean results
from either one trial (MM3B) or duplicate trials (MM3B2) with the
MM3B portable metabolic system. ....................................................... 80
Table 4-3: Differences between MM3B results during each stage of the duplicate
incremental rowing tests (trial 2 - trial 1). ............................................. 84
Table 4-4: Differences between metabolic measurements from the criterion
MOUSe system and mean results from the two MM3B trials during
each stage of the incremental rowing tests (MM3B - MOUSe). ........... 86
Table 5-1: Physical characteristics of the subjects. ................................................ 99
Table 5-2: Regression analyses between measured variables and power output
during ergometer (ERG) and on-water (OW) incremental rowing tests
using pooled results from all subjects. ................................................ 106
Table 5-3: Mean (SD) performance characteristics during the maximal stage of the
ergometer (ERG) and on-water (OW) tests. ........................................ 111
Table 5-4: LT1 (aerobic) and LT2 (anaerobic) thresholds calculated from blood
lactate-power output relationships using untreated data from the
ergometer (ERG) and on-water (OW) tests. ........................................ 111

Contents
viii
Table 5-5: Reliability of repeated measurements during submaximal and maximal
performance of on-water (OW) and ergometer (ERG) incremental
rowing tests as indicated by relative typical error (%TE) and 90%
confidence limits (90% CL). ............................................................... 115
Table 5-6: Heart rate based training zones for two athletes displaying divergence
between LT1 and LT2 heart rate results from the ergometer and on-water
rowing tests .......................................................................................... 122
Table 6-1: Physical characteristics of the 7 subjects. ........................................... 130
Table 6-2: Regression analyses between measured variables and power output
during ergometer (ERG) and on-water (OW) incremental rowing tests
using pooled results from all subjects. ................................................ 137
Table 6-3: Summary of the training completed during the 6-wk training period
based on self-reported training logs. ................................................... 141
Table 6-4: Mean (SD) performance characteristics during the 2000-m ergometer
time-trial (TT). ..................................................................................... 142
Table 6-5: Lactate threshold results and performance characteristics from the
maximal stages of the ergometer (ERG) and on-water (OW)
incremental rowing tests during baseline and post-training testing.. .. 144
Table 6-6: Linear regression analyses between selected results from the ergometer
(ERG) and on-water (OW) incremental rowing tests and rowing
performance (2000-m ergometer time-trial time and maximal power
output from the on-water test) during the baseline and post-training test
blocks. .................................................................................................. 146
Contents
ix
PLATES
Plate 3-1: The Concept2 Model C ergometer (C2C), including: A) PM2 work
monitor unit; B) flywheel enclosure, and C) straight-design handle. ...... 47
Plate 3-2: The Concept2 Model D ergometer (C2D), including: A) PM3 work
monitor unit; B) updated flywheel enclosure, and C) new 10°°°° bent-
handle. ...................................................................................................... 47
Plate 4-1: The MetaMax3B portable indirect calorimetry system, including: A) gas
analysis-data telemetry module; B) telemetry receiver unit, and C)
volume turbine assembly. ........................................................................ 71
Plate 4-2: The laboratory-based Maximum Oxygen Uptake System electronic
(MOUSe) indirect calorimetry system, including: A) volume piston; B)
AEI Technologies CD-3A CO2 gas analyser; C) AEI Technologies S-3AI
O2 analyser; D) computer interface, and E) Mylar Douglas bags. .......... 73
Plate 4-3: The metabolic simulation system, including: A) computer interface; B)
respiratory port, and C) internal mechanics. ............................................ 75
Plate 5-1: The WEBA Sport biomechanics system .................................................. 97
Plate 5-2: A rower undertaking an on-water test on the Lake Burley Griffin rowing
course. .................................................................................................... 100
Field based testing protocols to monitor training adaptations and performance in elite rowers
x
ABSTRACT
Laboratory-based rowing tests are the established standard for assessing fitness traits
among elite rowers, and for prescribing individualised exercise intensities for
training. But because tests occur on a rowing ergometer, the specificity of laboratory
testing has been questioned compared with the criterion of on-water rowing. This
project validated equipment required to replicate a laboratory-based rowing test in
the field and evaluated the feasibility of on-water tests. Ergometer and on-water test
results were compared to assess the validity of ergometer-derived training
prescriptions and to establish the effectiveness of on-water tests for monitoring
longitudinal fitness changes and for predicting rowing performance.
Concept2 rowing ergometers (Morrisville, USA) have frequently been used for
rowing tests. Although subtle design variations exist between the different models of
Concept2 ergometer, there were no substantial differences between the results from
incremental rowing tests using Model C and Model D ergometers. The Concept2
Model D was therefore accepted as the standard ergometer for subsequent laboratory
tests. Typical error (TE) results from duplicate Concept2 Model D tests conducted 2-
4 d apart showed that laboratory tests were highly reliable (TE: maximal power =
2.8%, peak oxygen consumption = 2.5%).
As oxygen consumption ( 2OV& ) is measured routinely during laboratory rowing tests,
it is necessary to obtain similar measurements during any on-water protocol. The
MetaMax 3B portable indirect calorimetry system (Cortex, Leipzig, Germany) was
therefore validated against a first-principles, laboratory-based indirect calorimetry
system (MOUSe, Australian Institute of Sport, Canberra, Australia). 2OV& from the
MetaMax was significantly higher during submaximal exercise (p=0.03), although
results were within 0.16 L.min-1 (4.1%) across all exercise intensities. There was
good agreement between duplicate MetaMax trials separated by ~2 d; mean 2OV&
was within 0.11 L.min-1 (2.5%) and TE was ≤2.3%.
The specificity of rowing testing was improved using an On-water incremental test
that replicated a laboratory-based Ergometer protocol. However, the individual
variation in physiological responses between-tests meant that training intensity
recommendations from the Ergometer test were not always applicable to on-water

Field based testing protocols to monitor training adaptations and performance in elite rowers
xi
training. Furthermore, measurements from the On-water protocol displayed similar
or lesser reliability (TE=1.9-19.2%) compared with the Ergometer test (TE=0.1-
11.0%).
As an effective fitness test must also be sensitive to longitudinal changes, the
responses to 6 wks training were compared between the Ergometer and On-water
methods. The magnitude of On-water training effects were usually greater (small
Cohen’s effect size) compared with the Ergometer test (trivial effect), although On-
water and Ergometer tests both indicated that training responses were negligible
because virtually all changes were less than one of their respective TEs. Correlations
between test results and rowing performance were largest when rowing mode was
matched between conditions, but Ergometer results provided the highest correlations
(Ergometer vs. 2000-m ergometer time-trial: R= -0.92 to -0.97 compared with On-
water vs. On-water maximal power output: R=0.52 to 0.92).
Although On-water tests improved the specificity of on-water training prescriptions,
these tests provided no obvious benefits for monitoring longitudinal fitness changes
or performance compared with Ergometer tests. Given that On-water tests are also
more time consuming and logistically challenging, their practical application is
limited.

Field based testing protocols to monitor training adaptations and performance in elite rowers
xii
DECLARATIO�
I certify that this thesis does not incorporate without acknowledgement any material
previously submitted for a degree or diploma in any university; and that to the best of
my knowledge and belief it does not contain any material previously published or
written by another person except where due reference is made in the text.
Andrew J. Vogler

Field based testing protocols to monitor training adaptations and performance in elite rowers
xiii
ACK�OWLEDGEME�TS
I would like to take the opportunity to recognise the following people who have
assisted and supported me during my PhD candidature.
I wish to express my gratitude to my industry supervisor, Dr Tony Rice (Australian
Institute of Sport; AIS), for his intellectual input, guidance and encouragement
throughout my candidature. His knowledge and mentoring have been invaluable in
developing my skills as a researcher. I would also like to thank Prof Chris Gore for
accepting the role as my university supervisor despite his already full schedule as the
Head of the AIS Physiology Department. His publication expertise and
comprehensive feedback on all aspects of my written work have been greatly
appreciated. Additionally, thankyou to Tony and Chris for their considerable
encouragement and understanding during the periods where this PhD seemed
destined to fail (repeatedly), this support was fundamental to my perseverance and
ultimately the completion of this thesis.
Many thanks also go to my former university supervisor, Emeritus Prof Bob Withers.
His encouragement and inspiration led me to undertake this PhD, and it was with
great sadness that his ill-health prevented his continuation as my supervisor. Bob,
you are sadly missed by all in the Australian sport science community.
I would like to acknowledge the physiologists, technical staff and students of the AIS
Department of Physiology for their ongoing support, and assistance with data
collection. Thankyou also to Margy Galloway and Angela McCoombe from the AIS
Department of Biomechanics and Performance Analysis, and to Rebecca Tanner and
Kate Fuller from the National Sport Science Quality Assurance Program; their
expertise with the specialised equipment required for aspects of my data collection
were greatly appreciated. I have thoroughly enjoyed the friendship of my AIS
colleagues and the opportunity to work with such a committed and enthusiastic team.
Thankyou to all the rowers who participated in my research; this PhD would not
have been possible without their time and effort.
Finally, thankyou to my family and friends; their continued support, encouragement
and belief have been fundamental to maintaining my determination to succeed, and
in retaining some degree of sanity.

Chapter 1 - Introduction, background and statement of problem
1
CHAPTER 1
INTRODUCTION, BACKGROUND AND
STATEMENT OF PROBLEM
1.1 I�TRODUCTIO�
This sport-based Doctorate of Philosophy (PhD) was underpinned by a collaboration
between Flinders University and the Australian Institute of Sport (AIS). Given the
core business of the AIS, the fundamental aims were to provide outcomes that would
improve performance among elite Australian rowers and ultimately enhance the
prospects of winning medals at international rowing competitions. The current PhD
aimed to develop techniques to improve the specificity of physiological tests for
rowing, with the anticipated downstream effects of a better understanding of training
and ultimately an improved competitive performance. In essence, the aim was to
provide the rowing coaches and scientists with more contextually relevant data about
exercise prescriptions and the efficacy of training by conducting physiological tests
in the field rather than in the laboratory. To achieve these aims, a series of studies
were conducted to validate the equipment required to replicate a laboratory-based
rowing test in the field and evaluate the feasibility of conducting on-water
incremental rowing tests. Once the feasibility of on-water tests was established,
subsequent studies compared results between ergometer and on-water tests to assess
the validity of ergometer-derived training prescriptions and to establish the
effectiveness of on-water tests for monitoring longitudinal fitness changes as well as
for predicting rowing performance.
As the AIS is ultimately a training facility for elite athletes, the ability of the athletes
and coaches to effectively coordinate training, competition and travel is clearly of
paramount importance. Thus, applied sport science research conducted at the AIS
must accommodate the extensive training and competition demands of the athletes
and coaches. So, although the experimental data were collected with the support of
the AIS Rowing program, it was not possible for AIS scholarship athletes to provide

Chapter 1 - Introduction, background and statement of problem
2
the commitment necessary to participate in rigorously controlled scientific research.
Other populations of high-calibre rowers were therefore recruited for this project,
including rowers from the Australian Capital Territory Academy of Sport and from
national and state-based talent identification squads.
Chapter 1 - Introduction, background and statement of problem
3
1.2 BACKGROU�D
1.2.1 Competitive rowing
Standard competitive rowing regattas are raced over 2000 m, with races grouped
according to discipline (sculling or sweep-oared rowing), boat class (crew
complement), weight caterory (heavyweight or lightweight) and gender. Sculling
uses two oars (sculls), one on each side of the boat; while sweep rowing involves a
single oar operated with both hands (Secher 1990). Sweep rowing involves crews of
two, four or eight oarsmen and may also include a coxswain to steer the boat. While
a coxswain is always present in the eights; pairs and fours are raced both with and
without a coxswain. Sculling races are performed with single, double or quadruple
boats, which again reflect the number of rowers involved - this form of rowing rarely
involves a coxswain. Race times for 2000 m differ between rowing disciplines,
sculling being generally faster than sweep rowing for boats with the same number of
athletes. Table 1-1 displays median 2000-m race times for World Cup, World
Championship and Olympic regattas during the 2000-2004 period. The variation in
performance times within each of the rowing categories is largely the result of
environmental influences. Wind and water conditions may fluctuate within and
between races, meaning that rowing races must ideally be conducted head-to-head,
and race times can not necessarily be used to compare rowing performances.
1.2.2 Descriptive characteristics of elite rowers
The physical characteristics of elite rowers have been summarised in numerous
rowing reviews (Hagerman et al. 1979; Hahn 1990; Steinacker 1993; Shephard 1998;
Mäestu and Jürimäe 2000). Typically, elite rowers are large individuals both in terms
of height and body mass; this contributes to the long limb lengths, large muscle
mass, high ventilatory capacity and maximal aerobic power associated with
successful rowing performance. Indeed, normative anthropometric data for national
level Australian rowers (Hahn 1990) reveal mean height and weight for heavyweight
males as 191.9 cm and 90.2 kg, respectively; and for females 179.2 cm and 74.0 kg,
respectively. Hahn (1990) also suggested that rowers exhibit longer arm and leg
lengths as a proportion of total height compared with the general population. Due to
the large body dimensions of elite heavyweight rowers, physiological characteristics
such as minute ventilation ( EV& ) and maximum oxygen consumption ( 2OV& max) are

Chapter 1 - Introduction, background and statement of problem
4
Table 1-1: 2000-m race times for finalists in World Cup, World Championship and
Olympic regattas 2000-2004.
2000-m race time
Rower category Boat class Median Fastest Slowest
Men 1X 06:58.5 06:36.3 07:51.3
2X 06:28.2 06:05.7 07:28.2
4X 05:57.5 05:39.5 06:42.4
2+ 07:11.5 06:47.9 08:04.8
2- 06:37.7 06:14.3 07:32.6
4+ 06:15.4 06:04.7 06:58.8
4- 06:04.6 05:41.3 06:43.8
8+ 05:39.9 05:26.0 06:18.8
Women 1X 07:39.7 07:07.7 09:03.2
2X 07:05.4 06:38.8 08:05.6
4X 06:31.8 06:13.0 07:47.1
2- 07:19.5 06:53.8 08:22.9
4- 06:44.3 06:26.1 07:08.8
8+ 06:19.6 06:01.8 07:06.8
Lightweight men a 1X 07:13.9 06:49.4 08:27.6
2X 06:28.6 06:10.8 07:27.7
4X 06:05.4 05:50.8 06:55.5
2- 06:47.2 06:30.0 08:20.6
4- 06:03.8 05:47.2 06:52.5
8+ 05:45.7 05:35.0 06:28.0
Lightweight women b 1X 07:59.0 07:28.9 09:31.6
2X 07:10.8 06:52.8 08:30.2
4X 06:42.4 06:29.5 07:44.0
2- 07:38.6 07:23.0 08:30.8
1X = single scull; 2X = double scull; 4X = quadruple scull; 2+ = coxed pairs; 2- = coxless pairs; 4+ =
coxed four; 4- = coxless four; 8+ = eight; a weight restricted (72.5 kg maximum body weight, 70.0 kg
crew average); b weight restricted (59.0 kg maximum body weight, 57.0 kg crew average).

Chapter 1 - Introduction, background and statement of problem
5
among the largest observed in athletic populations. EV& has commonly been reported
to exceed 200 L.min-1 (Hagerman et al. 1978; Hagerman et al. 1979; McKenzie and
Rhodes 1982; Secher 1983) with values as high as 250-270 L.min-1 (McKenzie and
Rhodes 1982). Similarly, world-class male rowers exhibit large oxygen consumption
( 2OV& ) values of 6.0-6.6 L.min-1 (Hagerman et al. 1978; Secher 1983; Steinacker
1993). Normative physiological data relating to Australian national heavyweight
males show that 2OV& values span 4.9-6.2 L.min-1 during progressive ergometer
tests, and that the equivalent data from female athletes ranges 3.5-4.6 L.min-1 (Hahn
et al. 2000).
1.2.3 Physiological demands of competitive rowing
The demands of competitive rowing have also been extensively considered
(Hagerman et al. 1978; Hagerman and Staron 1983; Droghetti et al. 1991; Hartmann
et al. 1993; Steinacker 1993; Jürimäe et al. 1999; Klusiewicz et al. 1999; Pripstein et
al. 1999; Mäestu and Jürimäe 2000). For heavyweight males, peak force production
during the drive phase is reported to span 1000-1500 N during maximal rowing
(Hartmann et al. 1993; Steinacker 1993) and 500-700 N during the majority of a
typical race (Steinacker 1993). Average power during ergometer rowing spans 358-
412 W for male oarsmen during 2000-m or 6 min time-trials (Hagerman et al. 1978;
Hagerman and Staron 1983; Droghetti et al. 1991; Jürimäe et al. 1999; Klusiewicz et
al. 1999) and 266-277 W for experienced female rowers during 2000-m time-trials
(Klusiewicz et al. 1999; Pripstein et al. 1999). The average (SD) power for
heavyweight and lightweight males during a 2500-m ergometer time-trial are 351
(29) W and 286 (32) W, respectively (Mäestu and Jürimäe 2000). Furthermore,
Steinacker (1993) suggests that the power sustained throughout the majority of a
single scull race ranges 350-450 W. Table 1-2 reflects the variables most commonly
reported in the literature but other physiological factors including hormonal
responses (Steinacker et al. 1993b; Jürimäe and Jürimäe 2001), rate of perceived
exertion (Gullstrand 1996; Bruce et al. 2000), muscle morphology (Roth et al. 1993),
blood pressure (Clifford et al. 1994), energy system contribution (Hagerman et al.
1978; Pripstein et al. 1999; Romer et al. 1999) and seasonal fitness variations
(Hagerman and Staron 1983; Vermulst et al. 1991; Womack et al. 1996; Petibois et
al. 2003) have all been considered. The anaerobic threshold concept and its
relationship to rowing performance has also been investigated comprehensively

6
Chapter 1 - Introduction, background and statement of problem
Tab
le 1
-2:
Sum
mar
y of
pub
lish
ed l
iter
atur
e re
lati
ng t
o th
e ph
ysio
logi
cal
dem
ands
of
com
peti
tive
row
ing
for
nati
onal
lev
el r
ower
s.
Val
ues
are
mea
n (S
D).
P
hysi
olo
gic
al
chara
cter
isti
c
P
ow
er
2O
V&
EV&
BT
PS
HR
B
La
Au
thor
Cate
gory
M
od
e (W
) (L
.min
-1)
(L.m
in-1
) (b
pm
) (m
mol.
L-1
)
Jack
son
& S
eche
r (1
976)
H
WM
2X
& 2
-
5.8-
6.0
H
ager
man
et al. (
1978
) M
L
yons
erg
omet
er c
360
(13.
8)
5.95
(0.
33)
190
(11.
3)
185
(6.9
) 18
.7 (
1.7)
H
ager
man
et al.
(19
79)
HW
M
Row
ing
ergo
met
er c
374
(13.
2)
6.1
(1.6
) 19
2 (1
0.8)
18
7 (2
.5)
18.7
(1.
7)
L
WM
R
owin
g er
gom
eter
c 35
8 (7
.6)
5.1
(0.7
) 16
4 (4
.6)
179
(2.2
) 18
.2 (
1.5)
F
Row
ing
ergo
met
er d
284
(21.
0)
4.1
(0.4
) 16
5 (1
5.6)
19
0 (1
.8)
16.6
(1.
6)
Sec
her et al.
(19
82b)
M
G
jess
ing
ergo
met
er c
360
(8.2
) 5.
6 (0
.1)
169
(5.2
) 19
4 (1
.5)
F
Gje
ssin
g er
gom
eter
e 27
7 (9
.5)
3.92
(0.
50)
112
(4.7
) 19
9 (2
.1)
H
ager
man
& S
taro
n (1
983)
H
WM
S
tanf
ord
ergo
met
er c
397.
7 (1
4.9)
6.
01 (
0.45
) 18
9.1
(14.
4)
185
(4.4
)
Sec
her et al.
(19
83)
LW
M
Gje
ssin
g er
gom
eter
c 33
1 (7
.5)
5.13
(0.
03)
164
(5.2
)
M
ahle
r et al.
(19
84)
LW
M
Con
cept
II
ergo
met
er c
420
(43.
0)
4.6
(0.2
) 17
3 (1
8.0)
18
3 (6
.0)
H
ahn et al.
(19
88)
F
Con
cept
II
ergo
met
er f
255.
5 (2
3.3)
3.
50 (
0.33
) 12
7.1
(11.
4)
185
(6.0
) 14
.9 (
3.1)
S
eche
r (1
990)
H
WM
1X
, 2X
& 2
-
6.6*
D
rogh
etti
et al.
(19
91)
HW
M
Gje
ssin
g er
gom
eter
c 40
9 (1
5.0)
5.
58 (
0.21
) 19
7.5
(16.
5)
193
(7.9
) 16
.1 (
1.8)
K
lusi
ewic
z et al.
(19
99)
M
Con
cept
II
ergo
met
er a
412
(37.
0)
5.55
(0.
48)
177.
2 (2
5.4)
18
6 (7
.0)
14.7
(2.
4)
F
266
(25.
0)
4.00
(0.
45)
132
(14.
7)
191
(6.0
) 12
.8 (
3.0)
H
ahn et al.
(20
00)
HW
M
Con
cept
II
ergo
met
er e
5.
48 (
0.32
)
H
WF
3.
93 (
0.32
)
Mäe
stu et al.
(20
00)
HW
M
Con
cept
II
ergo
met
er b
350.
8 (2
9.3)
19
2.3
(4.4
) 16
.9 (
1.6)
LW
M
28
6.0
(31.
5)
190.
4 (8
.0)
18.2
(3.
6)
Jüri
mäe
et al.
(20
02a)
M
C
once
pt I
I er
gom
eter
a 36
1.9
(28.
5)
4.85
(0.
7)
18
4.6
(7.5
) 19
.2 (
2.9)
M
ikul
ić et al.
(20
07)
M
Row
ing
ergo
met
er g
5.
51 (
0.4)
HW
M =
hea
vyw
eigh
t m
ale;
M =
mal
e (w
eigh
t ca
tego
ry n
ot s
peci
fied
); F
= f
emal
e (w
eigh
t ca
tego
ry n
ot s
peci
fied
); L
WM
= l
ight
wei
ght
mal
e; a =
200
0-m
tim
e-
tria
l; b =
250
0-m
tim
e-tr
ial;
c = 6
-min
tim
e-tr
ial;
d = 3
-min
tim
e-tr
ial;
e =
4-m
in t
ime-
tria
l; f =
5-7
min
tim
e-tr
ial,
g = c
onti
nuou
s pr
ogre
ssiv
e ro
win
g te
st.

Chapter 1 - Introduction, background and statement of problem
7
(Mickelson and Hagerman 1982; Beneke 1995; Forsyth and Reilly 2003); as have
mechanical considerations such as stroke rate (Martin and Bernfield 1980),
mechanical efficiency (Di Prampero et al. 1971; Celentano et al. 1974; Fukunaga et
al. 1986; Droghetti et al. 1991; Affeld et al. 1993) and technique (Bompa 1980;
Bompa et al. 1985; Sanderson and Martindale 1986; Dawson et al. 1998). However,
the vast majority of the rowing literature is based on ergometer simulations of
competitive rowing attempting to match either the duration or distance of the 2000-m
race (1000 m for females until 1985).
1.2.4 Physiological testing of elite rowers
As the demands of competitive rowing have been extensively studied, and the
physiological and anthropometric characteristics of successful rowers thoroughly
described, the physiological traits that are known to contribute strongly to rowing
performance can be assessed using specialised laboratory-based rowing tests.
Rowing test results may then be used to identify talented athletes based on their
physiological profiles (Hahn 1990), or to monitor longitudinal training adaptations
(Hagerman and Staron 1983; Vermulst et al. 1991; Womack et al. 1996; Petibois et
al. 2003) and provide training intensity prescriptions for individual athletes
(Urhausen et al. 1993b). Given fitness results from laboratory rowing tests provide
insights into rowing performance potential and fitness progression, results from these
tests may even represent a component of the selection criteria for national
representation (Koutedakis 1989).
During the initial stages of this PhD, the test protocol endorsed by Rowing Australia
for the physiological assessment of elite Australian rowers was referred to as the “2-
in-1 test”, which consisted of a 5-stage submaximal progressive incremental test
followed by a simulated 2000-m time-trial (Bourdon et al. 2009). This laboratory test
allowed the evaluation of submaximal exercise responses, rowing economy, 2OV& max
and maximal accumulated oxygen deficit (MAOD). However, an abridged version
using a 4-min maximal stage instead of the 2000-m time-trial was also commonly
used in Australia. While this ‘4-min max’ variation did not incorporate an evaluation
of MAOD, it had the advantage of being less taxing for the athlete and provided an
effective and expedient alternative to the “2-in-1” test. The abridged “4-min max”
protocol therefore formed the basis for the incremental rowing protocols used

Chapter 1 - Introduction, background and statement of problem
8
throughout the majority of this project.
Laboratory-based physiological assessments at the AIS are performed at regular
intervals throughout the domestic rowing season (October-March), usually at
intervals of approximately 8-12 wk. This frequency provides an effective means for
tracking the progression of fitness adaptations and providing insights into the
effectiveness of the preceding training block. Test results are also used to adjust
individualised training recommendations and to assist with the development of
strategies for upcoming training cycles. Although the laboratory test is adequately
sensitive to track changes in physiological status across testing sessions, actual on-
water performance is observed to change considerably in this time (personal
communication, Prof Allan Hahn). The 8-12 wk time frame between laboratory tests
therefore not only leaves some uncertainty about the acute response to training
micro-cycles within a training block, but also appears to lack the specificity to detect
modulation of some factors that contribute to actual on-water performance.
Furthermore, the literature suggests that the physiological response to exercise differs
between rowing performed on an ergometer and on-water (Steinacker et al. 1987;
Chènier and Leger 1991; Urhausen et al. 1993b; Payne et al. 1996; Ryan-Tanner et
al. 1999b). Thus, the training intensity recommendations derived from a laboratory
test do not necessarily translate to the on-water environment and are specific only to
ergometer rowing. Issues such as these could potentially be circumvented by
improving the specificity of physiological testing through the development of on-
water testing protocols that mimic those undertaken in the laboratory.

Chapter 1 - Introduction, background and statement of problem
9
1.3 STATEME�T OF PROBLEM
Laboratory-based ergometer tests have been used extensively by the rowing
community to measure training related changes in fitness traits and to prescribe
submaximal training thresholds that can be applied to training on and off the water.
Specifically, sport scientists use blood lactate-power output and heart rate-blood
lactate relationships obtained from laboratory testing to prescribe individualised on-
water training intensities. In recent years, it appears that the intended transfer of data
from laboratory-based tests to the field environment has not been used by many
coaches because the relevance and specificity of the ergometer based testing has
been challenged with regard to on-water rowing.
1.3.1 Aims
The major aim of this PhD was to evaluate whether a field-based rowing test that
replicated established laboratory-testing practices could provide specific on-water
training intensity prescriptions and better monitor fitness adaptations and
performance readiness compared with laboratory tests. If laboratory testing
techniques could be replicated in the field and if the results from on-water tests could
be reproduced consistently, a sensitive and reliable on-water test could supplement
routine laboratory tests by providing regular quantitative feedback from training
scenarios and could generate specific recommendations for on-water training. It was
hypothesised that on-water evaluation would enhance the specificity of rowing test
results compared with current practices, as laboratory assessments are based on
simulated rowing on an ergometer. Thus, on-water tests could potentially provide
more accurate training prescriptions for on-water rowing and better feedback
regarding the efficacy of the preceding training block. The results from on-water
tests would therefore provide additional information that is directly applicable to on-
water rowing and allow coaches to better refine the on-water aspect of their training
programmes. Ultimately, if on-water testing proved to be a viable assessment
method, the results would improve the quality of training and enhance rowing
performance by maximising the time spent at an optimal training load.
While the overall aim of this PhD was to develop and evaluate an on-water
incremental rowing test, intermediate issues relating to the validity of the equipment
used during laboratory and on-water tests had to be addressed beforehand, in order

Chapter 1 - Introduction, background and statement of problem
10
for on-water testing to proceed and to enable thorough comparisons between the
laboratory and on-water methods. Thus, the following series of studies were used to
systematically address aspects of the development of the on-water test and to
compare the on-water method to the standard laboratory test. The aims of each of
these studies were:
Study 1 – Validation of the Concept2 Model D rowing ergometer
• Establish the validity of the Concept2 Model D rowing ergometer compared with
the Concept2 Model C.
• Determine the reliability of measurements obtained during laboratory-based
rowing tests to establish the magnitude of physiological and performance
variations between duplicate tests performed within 2-4 d.
Study 2 – Accuracy and reliability of the Cortex MetaMax3B portable metabolic
system
• Validate the accuracy and reliability of the Cortex MetaMax3B portable metabolic
system against the criterion of the automated Douglas bag system used by the AIS
Department of Physiology.
• Evaluate the feasibility of using the portable system during on-water testing.
Study 3 – Physiological responses and training intensity recommendations from
ergometer and on-water incremental rowing tests
• Evaluate the specificity of laboratory test results by comparing the physiological
responses and training intensity prescriptions between matched laboratory and on-
water incremental rowing tests.
• Determine the reliability of duplicate on-water tests separated by 1-3 d in
comparison with the reliability results established for the laboratory test during
Study 1.
Study 4 – Monitoring fitness and performance with ergometer and on-water
incremental rowing tests
• Evaluate the effectiveness of the on-water test for monitoring longitudinal fitness
changes compared with the current laboratory protocol.
• Determine the efficacy of the on-water test as a means of monitoring performance
readiness.
Chapter 1 - Introduction, background and statement of problem
11
1.3.2 Limitations
There are a number of possible limitations associated with the experimental protocols
used during this project that have the potential to confound any conclusions,
including:
a) The recruited rowers were not elite open class athletes, so findings may not
necessarily extend to the intended target population of international standard
athletes.
b) As senior AIS rowers were unable to participate in this project, there was limited
access to rowers of an appropriate standard, thus sample sizes were limited to 6-8
athletes and statistical power to detect small effect sizes will be low (Hopkins et
al. 2009).
c) Time constraints imposed by the need to collect data during dedicated research
camps, typically less than one week in duration, meant that there was limited time
for subject familiarisation, as well as potential for fatigue to influence results
when tests were performed on consecutive days.
d) Subject compliance to the stipulated pre-experimental subject preparation
protocols was not always confirmed.
e) Injury and illness prevented some athletes from completing all aspects of some
experimental protocols.
f) Variable environmental conditions between field testing occasions may have
impacted on the reproducibility of on-water testing results and confounded
comparisons between laboratory and on-water tests and between duplicate on-
water tests.
g) The potential for non-steady-state conditions during on-water assessments of
metabolic demand due to fluctuations in rowing intensity resulting from variable
environmental conditions or uneven pacing.
h) The potential for inflated measurement error due to alterations in the effort of
performance or technique as a consequence of being observed, or due to potential
movement-pattern restriction imposed by the equipment used for indirect
calorimetry measurements.
i) Error introduced from the linear regression models used to normalise
physiological data and enable comparisons between laboratory and on-water tests
at equivalent power outputs.
j) Laboratory and on-water power output measurements were assumed to be

Chapter 1 - Introduction, background and statement of problem
12
equivalent; physiological comparisons using power normalised data will be
confounded if this assumption is violated.
1.3.3 Delimitations
To control for the above and other confounding factors, the following measures were
undertaken:
a) Participants were high calibre age group (under 23) athletes that had at least
attained state-representation in national-level competition, although some of the
rowers also achieved national (Australian) selection.
b) Data collection was conducted during dedicated research camps to allow invited
interstate athletes to participate, thereby increasing the available number subjects.
Additionally, contemporary data analysis techniques (Hopkins et al. 2009) were
used to limit the potential impact of small sample sizes on statistical tests.
c) Subject familiarisation was addressed using shortened test protocols when time
constraints prevented replication of the entire test protocol and where possible,
tests were scheduled so that athletes avoided performance on consecutive days.
d) The pre-experimental subject preparation protocols controlled for factors such as
fatigue from prior exercise, recommendations regarding feeding in preparation for
exercise tests and diurnal variation.
e) In the instances where injury or illness prevented an athlete from completing an
isolated aspect of the experimental protocol, but the remainder of their data were
unaffected, only the missing data were removed from subsequent data analyses.
f) Rowing power output was measured during the on-water tests to quantify exercise
intensity and to permit comparisons between test results at equivalent power
outputs.
g) The likelihood of achieving steady-state conditions was maximised by allowing at
least 2-3 min (of 4-min exercise bouts) for physiological responses to equilibrate
with the exercise demands prior to metabolic data being recorded for subsequent
analysis. Additionally, rowers were provided with visual feedback of their
instantaneous stroke rate and were instructed to maintain a constant stroke rate
throughout each workload.
h) Indirect calorimetry equipment that was fitted to the subjects (respiratory valve
and portable metabolic system) was adjusted to maximise subject comfort and
minimise any potential movement-pattern restrictions - none of the rowers
reported movement-pattern or rowing technique alterations due to the equipment.

Chapter 1 - Introduction, background and statement of problem
13
All rowers were familiar with being supervised whilst rowing, as this was
consistent with the athletes’ normal experiences during rowing training.
i) Very strong relationships (Pearson correlation coefficients) were obtained
between physiological results and power outputs during the laboratory and on-
water rowing tests, thereby ensuring that the errors from predictions using the
linear regression models were minimised.
j) It was not possible to use the same equipment to measure power output during the
laboratory and on-water tests. However, diligent calibration procedures were
always employed to ensure the accuracy and reliability of all measurements.

Chapter 1 - Introduction, background and statement of problem
14
1.4 DATA A�ALYSIS CO�SIDERATIO�S
Hypothesis testing with traditional inferential statistics calculates the probability (p
value) that an observed effect (regardless of direction) is different to the null
hypothesis based on a distribution corresponding to the degrees of freedom for the
number of sample observations. An arbitrary value of p<0.05 is usually used to reject
the null hypothesis (no statistical difference or relationship) and report the observed
effect as statistically significant. However, the p value alone does not account for the
magnitude or direction of the actual effect, or the precision of the statistical estimate
of the effect (Cohen 1990). A non-statistically significant result (p>0.05) can
therefore fail to elucidate important effects if data is derived from a small sample
size and/or experimental techniques are subject to considerable measurement
variability. However, new approaches to data analysis are emerging in the
biomedical, clinical and sports sciences that are based on interpretations of the
magnitude of effects (changes and differences) in relation to practically or clinically
important thresholds (Hopkins et al. 2009). This analytical approach is especially
relevant to elite athletic population as very small changes or differences can make
substantial differences to performance outcomes (Hopkins et al. 1999).
Magnitude-based inferences (Batterham and Hopkins 2006) centre on the
interpretation of experimental effects with regard to practically or clinically relevant
thresholds, and may offer a more useful approach for interpreting the magnitude of
experimental effects than traditional inferential statistics (Sterne and Davey Smith
2001). The magnitude of the effect is interpreted relative to the smallest worthwhile
change (SWC), which is a reference value for the smallest important outcome for a
given test or event. In applied sport science settings, the SWC has often be derived
from reliability assessments (duplicate measures) of test protocols and measurement
techniques (Driller et al. 2009), or where possible, modelling of athletic competition
to determine the smallest performance improvement required to benefit race results
(Batterham and Hopkins 2006; Robertson et al. 2009). Alternatively, the magnitude
of the experimental effect can also be quantified using Cohen’s effect size units to
determine the likelihood that the effect is small, moderate, or large (Cohen 1988).
Either way, the experimental effect (including the distribution for the confidence
limits defining the precision of the statistical estimate) is compared to the SWC to
determine the likelihood that the true effect conforms to one of three possible

Chapter 1 - Introduction, background and statement of problem
15
outcomes: 1) substantially positive (greater than the SWC in a positive direction), 2)
trivial (less than the SWC), or 3) substantially negative (greater than SWC in a
negative direction). To make inferences about population effects, 90% confidence
limits show an outcome is clear when estimates for the true value of the experimental
effect are unlikely (<5% probability) to be simultaneously substantial in a positive
and negative direction, and when the most likely outcome (either positive, trivial or
negative) returns a probability ≥75% (Hopkins 2007; Hopkins et al. 2009). When
these criteria are not met, the effect is unclear, although the probability results still
provide an indication of the possible magnitude and direction of the true effect. This
analytical approach therefore permits rigorous but practically-based interpretations
regarding the magnitude of the physiological differences resulting from the mode of
rowing (i.e. ergometer or on-water), and between measurement devices (Concept2
ergometers and indirect calorimeters). Hypothesis testing as well as contemporary
magnitude-based inferences have both been used to analyse each of the experimental
sections and have generally shown good agreement in elucidating important
differences between data comparisons. However, the magnitude-based approach did
sometimes indicate substantial differences when statistical significance was not
attained. In instances where hypothesis testing approached statistical significance and
magnitude-based effects were substantial, the latter results were favoured given the
potential for our small sample sizes to impact on the results from hypothesis tests.

Chapter 2 - Literature review: Rowing testing - laboratory and field protocols
16
CHAPTER 2
LITERATURE REVIEW: ROWING TESTING –
LABORATORY AND FIELD PROTOCOLS
2.1 I�TRODUCTIO�
Laboratory based ergometer testing has been used extensively to measure training
related changes in fitness and prescribe sub-maximal training thresholds that can be
applied to training on and off the water. Specifically, sport scientists have used
average power output-blood lactate (BLa) and heart rate (HR)-BLa relationships
obtained from laboratory testing to prescribe individualised on-water training
intensities for incorporation into training programs (Urhausen et al. 1993b). In recent
years, it appears that the intended transfer of data from laboratory based tests to the
field environment has not been used by many Australian coaches (unpublished
personal observation), as the relevance and specificity of ergometer based testing has
been questioned. This review therefore considers the specificity of current rowing
testing techniques by examining the role of laboratory-based ergometer testing and
providing an overview of the validity of ergometer rowing with respect to the
criterion of on-water performance.
2.2 ROWI�G ERGOMETRY
Rowing ergometers have become a standard feature of most sport science facilities.
However, much of the early work investigating the physiological response to rowing
was non sport-specific and relied on exercise tests using cycle ergometers or
treadmills (Saltin and Astrand 1967; Secher et al. 1974; Larsson and Forsberg 1980).
The specificity of research into the physiological demands of rowing was therefore
greatly improved with the introduction of mechanically braked rowing ergometers to
simulate sweep-oar rowing (Hagerman and Lee 1971; Bloomfield and Roberts 1972)
and subsequent work using test protocols that simulated the distance or duration of
the competitive 2000 m distance (Hagerman et al. 1972; Hagerman et al. 1978;

Chapter 2 - Literature review: Rowing testing - laboratory and field protocols
17
Secher et al. 1982a). Indeed, Hagerman et al. (1979) used simulated rowing on an
ergometer to present one of the first thorough physiological profiles of elite rowers,
including values for: power output, 2OV& max, EV& , HR and serum lactate
concentration. However, numerous other studies have also considered the
competitive demands of rowing (Table 1-2; pg. 6). Indeed, rowing ergometry has
allowed thorough evaluation of many facets of rowing physiology and performance
including: the metabolic cost of rowing (Hagerman et al. 1979; Secher et al. 1983;
Sanderson and Martindale 1986; Beneke 1995; Pripstein et al. 1999), the relationship
between ergometry results and rowing performance (Bloomfield and Roberts 1972;
Hagerman et al. 1972; Secher et al. 1982b; Cosgrove et al. 1999), and the magnitude
and pattern of seasonal fitness changes (Bloomfield and Roberts 1972; Secher et al.
1982a; Hagerman and Staron 1983).
2.2.1 Metabolic cost of rowing
The metabolic cost of rowing is determined by the work performed to overcome the
drag forces acting on the boat shell and ‘internal work’ due to movement of the
rower’s body mass that does not contribute to propulsion. The major component of
the drag force is from friction between the boat shell and water, although wave drag
and air resistance also contribute. However, because the latter sources of drag are
relatively small (~7% and 10%, respectively) in comparison to the drag of water,
they are usually ignored (Sanderson and Martindale 1986). Therefore, drag force
depends on boat velocity, the weight of oarsmen and technical proficiency (Secher
and Vaage 1983; Sanderson and Martindale 1986). During rowing, drag is
proportional to the square of boat velocity. Hence, an altered movement pattern
during recovery has been proposed to reduce drag by minimising fluctuations in peak
velocity relative to mean boat speed (Sanderson and Martindale 1986). Additionally,
differing techniques between rowers may also contribute to differences in energy loss
due to drag; for instance Sanderson & Martindale (1986) noted variations in boat
speed efficiency between four single scullers according to gender and experience.
The mechanical efficiency of rowing is reported to range 10-23% (Di Prampero et al.
1971; Droghetti et al. 1991), with the large range mainly due to the efficiency
differences reported between simulated and actual rowing. During on-water rowing
Di Prampero et al. (1971) reports an efficiency of 18% increasing to 23% at higher
stoke rates, which is confirmed by other values reported in the literature of 20-22%
(Secher 1983). The efficiency during simulated rowing is generally lower, with

Chapter 2 - Literature review: Rowing testing - laboratory and field protocols
18
minimum reported values of 10-14% (Di Prampero et al. 1971; Hagerman et al.
1978), but improving to 20-21% when stroke rate approximates racing cadence (Di
Prampero et al. 1971; Droghetti et al. 1991).
When 2OV& is measured during on-water rowing, the metabolic cost of the activity
increases with boat speed to the power of 2.2-2.6 depending on rowing discipline
(Secher 1983). Similarly, when on-water 2OV& was estimated from the HR- 2OV&
relationship established during stationary sweep rowing in a tank, the metabolic cost
was related to boat speed to the power of 3.2 (Di Prampero et al. 1971). However,
movement of the rower’s body mass during the stroke cycle also contributes to the
metabolic cost of the activity regardless of whether or not force is applied to the oars
(Secher 1983; Sanderson and Martindale 1986). Indeed, the oxygen cost of ‘no-load’
rowing on an ergometer increases with stroke rate from 0.75-1.25 L.min-1 at 16
strokes.min-1 to 1.75-2.8 L.min-1 at 32 strokes.min-1 depending on inter-individual
efficiency (Droghetti et al. 1991) and approaches a value of 3.5 L.min-1 at 40
strokes.min-1 (Secher 1983). When the oxygen cost of this additional internal work is
subtracted from the total oxygen requirement, the metabolic cost of rowing increases
according to mean boat velocity to the power of 3.1 (Secher 1983). Thus confirming
the theoretical relationship, that requires a cubic power function to overcome the
energy dissipated due to drag (Di Prampero et al. 1971; Celentano et al. 1974;
Secher 1983; Sanderson and Martindale 1986).
According to prediction equations by Secher (1983), the metabolic cost of rowing at
racing velocity during FISA championships has increased from 5.1 L O2.min-1 in
1919 to 6.4 L O2.min-1 in 1979. Also, Di Prampero et al. (1971) estimated the total
oxygen requirement of an individual during a 2000-m race in a pair-oared boat as 46
L, or 6.3 L O2.min-1. Using the equations of Secher (1983) to predict oxygen
requirement from rowing velocity, the mean metabolic cost of rowing in the 2008
Beijing Olympics was ~7 L O2.min-1 for males competing in the single or double
sculls and coxless pairs. However, the degree to which performance improvements
can be attributed to improved athletic conditioning or technological advancements in
rowing equipment is unknown. It is therefore unlikely that the prediction for Beijing
is a true reflection of metabolic cost given the equation from which it is based is ~25
years old. However, several researchers have directly measured 2OV& during on-

Chapter 2 - Literature review: Rowing testing - laboratory and field protocols
19
water rowing using Douglas bags (Jackson and Secher 1976; Chènier and Leger
1991) or a modern portable metabolic system (Kawakami et al. 1992). Of these, only
Jackson and Secher (1976) is based on elite rowers, reporting 2OV& values of 5.8-6.0
L.min-1 at “ideal racing speeds”. However, none of these measurements were
conducted over the full 2000-m race distance, and do not represent the total
metabolic cost of the activity as they do not include the contribution from anaerobic
energy sources.
It is also interesting to note the pattern of energy utilisation during a rowing race.
Rather than accelerating to a pace that can be maintained for the entire duration of
the race, rowers display an initial ‘spurt’ in which stroke rate, power output and boat
velocity are considerably higher than those maintained for the majority of the race
(Hagerman et al. 1978; Secher et al. 1982a; Steinacker 1993). This is reflected in the
500 m split times observed during a race. Typically, the first 500 m is the fastest,
followed by a reasonably consistent middle 1000 m and slightly faster final 500 m as
crews push for the finish (Hagerman et al. 1978; Secher et al. 1982a). The mean
500m split times for all crews competing in the final of the men’s coxless four at the
2008 Beijing Olympics provides an ideal example of this: 1:28.4, 1:35.2, 1:35.0 and
1:33.3 (min:s).
2.2.2 Aerobic and anaerobic energy contribution
Given the typical 5.5-8.0 min duration of a rowing race, the majority of the total
metabolic requirement is met aerobically. However, BLa concentrations of 15-17
mmol.L-1 following national and international regattas (Vaage 1977; Mäestu and
Jürimäe 2000) and maximal values of 16-19 mmol.L-1 (Jürimäe et al. 1999; Jürimäe
et al. 2002a; Jürimäe et al. 2002b) after competition or ergometer-based race
simulations indicate a significant anaerobic energy contribution. Given the pacing
strategy adopted during racing, a considerable anaerobic effort is required during the
initial 1.5-2 min, as indicated by the oxygen deficit (Hagerman et al. 1978; Pripstein
et al. 1999) and peak BLa response (Hagerman et al. 1978). In fact, Secher et al.
(1982a) suggest that the ‘spurt’ is performed to maximise 2OV& kinetics which are
faster for higher workloads. Following this rapid start, male rowers are able to
sustain 96-98% of their 2OV& max (Hagerman et al. 1978), and female rowers 91% of
2OV& max (Pripstein et al. 1999), for the remainder of the race.

Chapter 2 - Literature review: Rowing testing - laboratory and field protocols
20
The contribution of aerobic energy to the total metabolic cost of rowing can be
reliably assessed by measuring 2OV& (Hagerman et al. 1978); however, the relative
contribution of anaerobic metabolism is not so easily determined. In studies of
rowing, anaerobic metabolism has generally been estimated from measurements of
excess post exercise oxygen consumption (EPOC; Hagerman et al. 1978; Hagerman
et al. 1979; Secher et al. 1982a) or oxygen deficit (Droghetti et al. 1991; Russell et
al. 1998; Pripstein et al. 1999; Bourdon et al. 2009), for performances on a rowing
ergometer. Both methods have limitations, processes that are not related to anaerobic
metabolism during exercise also contribute to the EPOC - including elevated
metabolic rate from increased body temperature and sympathetic nerve activity, and
additional oxygen demand from the heart and respiratory muscles (Åstrand et al.
2003) - and may therefore cause the anaerobic energy contribution to be
overestimated by this method (Hagerman 1984; Secher 1993). Conversely, the
oxygen deficit method may underestimate the oxygen demand and therefore
anaerobic contribution at supra-maximal workloads (Pripstein et al. 1999). Using
EPOC, Hagerman et al. (1978) measured a 30 min post exercise oxygen
consumption of 13.4 L; when combined with the 30.9 L of oxygen consumed during
the 6-min row, the relative contribution of aerobic and anaerobic energy was 69.8%
and 30.2%, respectively. Alternatively, anaerobic energy contribution determined
from oxygen deficit during 6-min rowing revealed a value of 19.9% total energy
expenditure (Droghetti et al. 1991). However, the 6 min duration adopted in the
above studies is designed to replicate the competitive demands of the larger crewed
boats (e.g. eights, fours and quads) and thus represents a shorter effort than what is
required for the smaller classes of boat (Hagerman 1984). In the case of smaller
boats, this leads to an overestimation of anaerobic contributions due to a lower total
energy expenditure compared to a longer effort that better simulates the duration of a
2000-m race (Secher 1993). Thus, Pripstein et al. (1999) measured oxygen deficit
during a 2000-m time-trial and reported a 12% anaerobic contribution for female
rowers. Otherwise, much of the early research investigating anaerobic energy
contribution in female rowers is based on rowing exercise of 3-4 min duration
designed to simulate a 1000 m race distance (Hagerman et al. 1979; Secher et al.
1982a). Thus, for the reasons outlined above, these data are not comparable to those
simulating the 2000 m race distance and have not been considered in this review.

Chapter 2 - Literature review: Rowing testing - laboratory and field protocols
21
2.2.3 Performance determinants and modelling
In the recent literature, rowing performance modelling has been widely considered
(Klusiewicz et al. 1991; Kramer et al. 1994; Womack et al. 1996; Cosgrove et al.
1999; Jürimäe et al. 1999; Jürimäe et al. 2000; Mäestu et al. 2000; Ingham et al.
2002b; Jürimäe et al. 2002a; Yoshiga and Higuchi 2003; Bourdin et al. 2004).
Physiological and anthropometric measures have been correlated with 2000-m and
2500-m ergometer time-trial performances and 2000-m on-water performances
(Table 2-1). Many of the variables listed in Table 2-1 have been included in multiple
regression analyses in an attempt to determine which parameters best predict 2000-m
rowing performance. Performance models utilising between two and 10 independent
variables display mixed results in accounting for performance variations in 2000-m
rowing time or velocity on ergometers and single sculls. When the 2000-m ergometer
time-trial is the performance criterion, the various models of ergometer performance
generate R2 ranging 0.50–0.99 with associated standard errors of estimate (SEE)
spanning 10.6–1.42 s, respectively (Jürimäe et al. 2000; Yoshiga and Higuchi 2003).
Similarly, when rowing velocity is the criterion, R2 ranges 0.87 (Cosgrove et al.
1999) to 0.98 (Ingham et al. 2002b), and Ingham et al. (2002b) report limits of
agreement between predicted and actual values of -0.006 to 0.098 m.s-1 (-1.52 to 6.89
s). Prediction of on-water performance accounts for less variation (R2=0.65–0.89)
and is associated with larger SEEs of 11.3 s using a two variable model of metabolic
parameters (Jürimäe et al. 1999) and 6.3 s for a five variable model using metabolic
and anthropometric predictors (Jürimäe et al. 1999). The effect of training has also
been considered with performance models (Womack et al. 1996). Variables
including peak ergometer velocity, peak oxygen consumption ( 2OV& peak) and 2OV&
and velocity corresponding to 4.0 mmol.L-1 BLa are strongly correlated with 2000-m
ergometer time-trial performance both before and after training, but training induced
changes in peak velocity display the best relationship (R2=0.59) with actual changes
in time-trial performance (Womack et al. 1996). So although some of these models
account for considerable variation in rowing performance, it has typically been the
more complex models that utilise multiple variables that display the strongest
relationships. Additionally, as all independent variables are derived from ergometer
rowing, it is not surprising that stronger relationships occur when the ergometer time-
trial is the performance criterion rather than the on-water condition. Furthermore,
although some of these investigations considered the relationship between selected
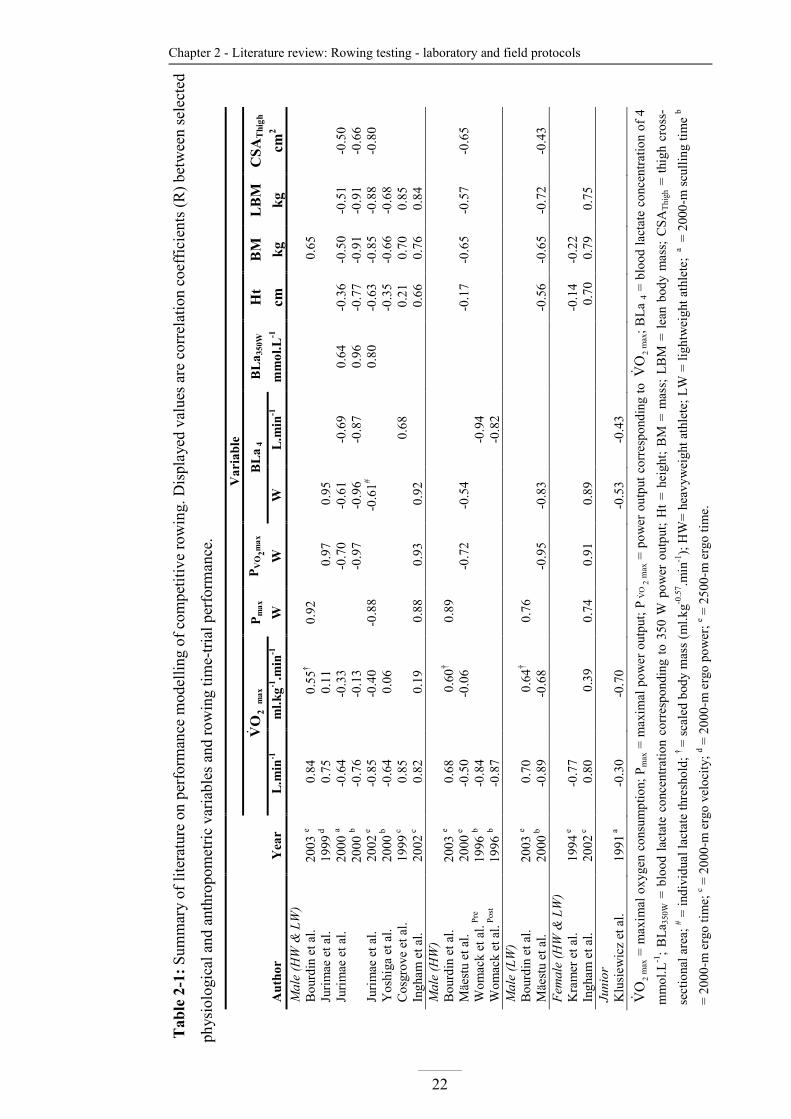
Chapter 2 - Literature review: Rowing testing - laboratory and field protocols
22
Tab
le 2
-1:
Sum
mar
y of
lit
erat
ure
on p
erfo
rman
ce m
odel
ling
of
com
peti
tive
row
ing.
Dis
play
ed v
alue
s ar
e co
rrel
atio
n co
effi
cien
ts (
R)
betw
een
sele
cted
phys
iolo
gica
l an
d an
thro
pom
etri
c va
riab
les
and
row
ing
tim
e-tr
ial
perf
orm
ance
.
Va
ria
ble
2O
V& m
ax
Pm
ax
PV
O2
ma
x
BL
a 4
BL
a350W
H
t B
M
LB
M
CS
AT
hig
h
Au
tho
r Y
ear
L.m
in-1
m
l.k
g-1
.min
-1
W
W
W
L.m
in-1
m
mo
l.L
-1
cm
kg
kg
cm2
Male (HW & LW)
Bou
rdin
et
al.
2003
e 0
.84
0.5
5† 0
.92
0
.65
Juri
mae
et
al.
1999
d
0.7
5 0
.11
0
.97
0.9
5
Ju
rim
ae e
t al
. 20
00 a
-0.6
4 -0
.33
-0
.70
-0.6
1 -0
.69
0.64
-0
.36
-0.5
0 -0
.51
-0.5
0
2000
b -0
.76
-0.1
3
-0.9
7 -0
.96
-0.8
7 0.
96
-0.7
7 -0
.91
-0.9
1 -0
.66
Juri
mae
et
al.
2002
e
-0.8
5 -0
.40
-0.8
8
-0.6
1#
0.80
-0
.63
-0.8
5 -0
.88
-0.8
0 Y
oshi
ga e
t al
. 20
00 b
-0
.64
0.0
6
-0.3
5 -0
.66
-0.6
8
Cos
grov
e et
al.
19
99 c
0
.85
0.6
8
0.2
1 0
.70
0.8
5
Ingh
am e
t al
. 20
02 c
0
.82
0.1
9 0
.88
0.9
3 0
.92
0
.66
0.7
6 0
.84
Male (HW)
Bou
rdin
et
al.
2003
e 0
.68
0.
60†
0.8
9
M
äest
u et
al.
20
00 e
-0
.50
-0.0
6
-0.7
2 -0
.54
-0.1
7 -0
.65
-0.5
7 -0
.65
Wom
ack
et a
l. P
re
1996
b -0
.84
-0.9
4
Wom
ack
et a
l. P
ost
1996
b -0
.87
-0.8
2
Male (LW)
Bou
rdin
et
al.
2003
e 0
.70
0.
64†
0.7
6
M
äest
u et
al.
20
00 b
-0
.89
-0.6
8
-0.9
5 -0
.83
-0.5
6 -0
.65
-0.7
2 -0
.43
Female (HW & LW)
Kra
mer
et
al.
1994
e
-0.7
7
-0
.14
-0.2
2
In
gham
et
al.
2002
c
0.8
0 0
.39
0.7
4 0
.91
0.8
9
0.
70
0.7
9 0
.75
Junior
Klu
siew
icz
et a
l.
1991
a
-0.3
0 -0
.70
-0.5
3 -0
.43
2O
V&m
ax =
max
imal
oxy
gen
cons
umpt
ion;
Pm
ax =
max
imal
pow
er o
utpu
t; P
2O
V&m
ax =
pow
er o
utpu
t co
rres
pond
ing
to
2O
V&m
ax;
BL
a 4
= b
lood
lac
tate
con
cent
rati
on o
f 4
mm
ol.L
-1;
BL
a 350
W =
blo
od l
acta
te c
once
ntra
tion
cor
resp
ondi
ng t
o 35
0 W
pow
er o
utpu
t; H
t =
hei
ght;
BM
= m
ass;
LB
M =
lea
n bo
dy m
ass;
CS
AT
high
= t
high
cro
ss-
sect
iona
l ar
ea;
# = i
ndiv
idua
l la
ctat
e th
resh
old;
† =
sca
led
body
mas
s (m
l.kg
-0.5
7 .min
-1);
HW
= h
eavy
wei
ght
athl
ete;
LW
= l
ight
wei
ght
athl
ete;
a =
200
0-m
scu
llin
g ti
me
b
= 2
000-
m e
rgo
tim
e; c =
200
0-m
erg
o ve
loci
ty;
d = 2
000-
m e
rgo
pow
er;
e = 2
500-
m e
rgo
tim
e.

Chapter 2 - Literature review: Rowing testing - laboratory and field protocols
23
variables and on-water time-trials, there appear to be no publications using
independent variables measured during actual on-water rowing.
2.2.4 Fitness monitoring
Beyond using simulated rowing to describe the demands of the sport, to profile
successful athletes, and to attempt to predict performance, it was recognised that
ergometer tests could regularly assess fitness changes and provide training feedback.
Incremental rowing protocols were therefore developed to determine the anaerobic
threshold (AT) so that training intensities and fitness adaptations could be better
prescribed (Mickelson and Hagerman 1982; Steinacker et al. 1982). Although it is
unclear when rowing ergometers became standard equipment for routine
physiological assessments of elite rowers, Steinacker et al. (1982) describe a
formalised rowing ‘step-test’ protocol that is remarkably similar to those currently
common in Australia (Hahn et al. 2000) and Britain (Godfrey and Whyte 2006).
However, by the mid-1980s, rowing specific exercise tests on mechanically braked
Gjessing ergometers or air-braked Concept2 ergometers were used regularly to
evaluate training adaptations in US collegiate rowers (Mahler et al. 1985) and for
routine testing of Australian rowers (Hahn et al. 1988). Furthermore, by the latter
stages of the 1980s, it was accepted practice for the results of laboratory based
rowing tests to contribute towards national team selection (Koutedakis 1989).

Chapter 2 - Literature review: Rowing testing - laboratory and field protocols
24
2.3 LABORATORY BASED ROWI�G TESTI�G
Incremental rowing tests are designed to assess physiological characteristics that are
relevant to competitive rowing. As 2000-m ergometer time-trials require 70-88%
aerobic energy contribution and 12-30% anaerobic contribution (Hagerman et al.
1978; Droghetti et al. 1991; Pripstein et al. 1999), the relationship between time-trial
performance and various aerobic and anaerobic variables has therefore been
considered. Of these, absolute 2OV& max (Secher et al. 1982b; Kramer et al. 1994;
Womack et al. 1996; Jürimäe et al. 2000; Jürimäe et al. 2002a; Yoshiga and Higuchi
2003; Bourdin et al. 2004), power output at 2OV& max (Jürimäe et al. 2000; Mäestu et
al. 2000; Ingham et al. 2002a; Jürimäe et al. 2002a) and power output at 4 mmol.L-1
BLa concentration (Jürimäe et al. 1999; Jürimäe et al. 2000; Ingham et al. 2002a) or
individual anaerobic threshold (IAT; Jürimäe et al. 2002a) have shown the strongest
single variable associations. Progressive incremental rowing tests to exhaustion have
consequently been used to establish relationships between power output and BLa,
HR and 2OV& , thereby permitting determination of lactate thresholds, 2OV& max and
associated power outputs. These tests typically comprise 5-7 workloads, with the
initial stages set according to predetermined sub-maximal workloads, so exercise
intensity ranges from relatively low levels during the early stages to maximal
performance during the final stage. Work-stage duration is sufficient to achieve
steady-state conditions and is therefore usually about 4 min or slightly longer, and
stages are separated by 30 s to 1 min to allow for BLa sampling (Hahn et al. 2000;
Vogler et al. 2007). Physiological variables measured during these tests include:
HR, 2OV& , BLa and rating of perceived exertion (RPE). Data may be continuously
monitored during the test, or recorded during the latter parts of the sub-maximal
workloads to reflect the steady-state nature of the task, and peak values recorded
during maximal exercise. Additionally, power output, stroke rate and total distance
completed are also recorded for each of the stages, either from the ergometer display
unit or directly measured using specialised instrumentation (Lormes et al. 1993;
Boyas et al. 2006). Overviews of laboratory testing procedures are supplied by Hahn
et al. (2000) and Godfrey & Whyte (2006).
2.3.1 Evaluation of training adaptations
A major role of laboratory based rowing testing has been to monitor the progress of
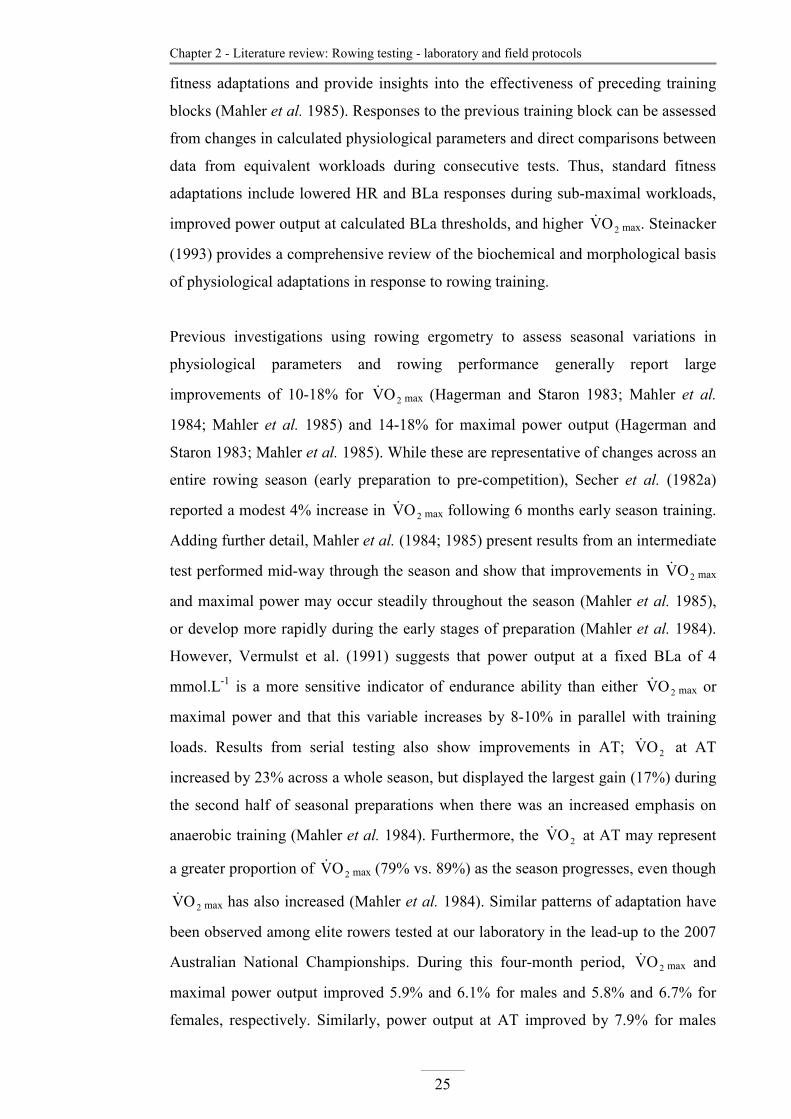
Chapter 2 - Literature review: Rowing testing - laboratory and field protocols
25
fitness adaptations and provide insights into the effectiveness of preceding training
blocks (Mahler et al. 1985). Responses to the previous training block can be assessed
from changes in calculated physiological parameters and direct comparisons between
data from equivalent workloads during consecutive tests. Thus, standard fitness
adaptations include lowered HR and BLa responses during sub-maximal workloads,
improved power output at calculated BLa thresholds, and higher 2OV& max. Steinacker
(1993) provides a comprehensive review of the biochemical and morphological basis
of physiological adaptations in response to rowing training.
Previous investigations using rowing ergometry to assess seasonal variations in
physiological parameters and rowing performance generally report large
improvements of 10-18% for 2OV& max (Hagerman and Staron 1983; Mahler et al.
1984; Mahler et al. 1985) and 14-18% for maximal power output (Hagerman and
Staron 1983; Mahler et al. 1985). While these are representative of changes across an
entire rowing season (early preparation to pre-competition), Secher et al. (1982a)
reported a modest 4% increase in 2OV& max following 6 months early season training.
Adding further detail, Mahler et al. (1984; 1985) present results from an intermediate
test performed mid-way through the season and show that improvements in 2OV& max
and maximal power may occur steadily throughout the season (Mahler et al. 1985),
or develop more rapidly during the early stages of preparation (Mahler et al. 1984).
However, Vermulst et al. (1991) suggests that power output at a fixed BLa of 4
mmol.L-1 is a more sensitive indicator of endurance ability than either 2OV& max or
maximal power and that this variable increases by 8-10% in parallel with training
loads. Results from serial testing also show improvements in AT; 2OV& at AT
increased by 23% across a whole season, but displayed the largest gain (17%) during
the second half of seasonal preparations when there was an increased emphasis on
anaerobic training (Mahler et al. 1984). Furthermore, the 2OV& at AT may represent
a greater proportion of 2OV& max (79% vs. 89%) as the season progresses, even though
2OV& max has also increased (Mahler et al. 1984). Similar patterns of adaptation have
been observed among elite rowers tested at our laboratory in the lead-up to the 2007
Australian National Championships. During this four-month period, 2OV& max and
maximal power output improved 5.9% and 6.1% for males and 5.8% and 6.7% for
females, respectively. Similarly, power output at AT improved by 7.9% for males

Chapter 2 - Literature review: Rowing testing - laboratory and field protocols
26
and 3.6% for females. 2OV& at AT also increased as a proportion of 2OV& max (from
86% to 90%), but only for male rowers. These comparatively modest gains may be
due to the shorter assessment period (4 months vs. 6-9 months), as further gains are
likely to occur as preparation continues for international competition. Alternatively,
improved off-season training practices may curtail detraining between rowing
seasons, thereby limiting seasonal fitness variations for current athletes compared to
the reported assessments from the 1980s (Secher et al. 1982a; Hagerman and Staron
1983; Mahler et al. 1984; Mahler et al. 1985).
While ergometer testing reveals large pre-season to race-season changes in
physiological conditioning and is adequately sensitive to track changes in
physiological status across testing sessions (Hagerman and Staron 1983; Mahler et
al. 1984; Mahler et al. 1985; Vermulst et al. 1991; Petibois et al. 2003), the
improvement in on-water performance over this time may be far greater (unpublished
personal observation about Australian international rowers). Additionally,
comparisons between ergometer time-trials and competitive on-water scenarios
display only moderate to strong shared variation as indicated by coefficients of
determination of 0.52–0.81 (Jürimäe et al. 1999; Ryan-Tanner et al. 1999a; Jürimäe
et al. 2000; Barrett and Manning 2004). So although there is an association between
factors contributing to competitive and ergometer performances, laboratory based
ergometer testing may lack the specificity to detect important factors that contribute
to actual on-water performance.
2.3.2 Definition of lactate thresholds
The anaerobic threshold concept has generated much discussion surrounding BLa
and ventilatory responses to graded exercise and the transition from primarily aerobic
metabolism to a state where anaerobic energy contribution becomes increasingly
important (Skinner and McLellan 1980; Brooks 1985; Davis 1985; Meyer et al.
2005b). Criticism of the concept has mainly focused on the mechanism and
description presented by Wasserman and McIlroy (1964), whereby increases in BLa
are the direct result of muscle hypoxia and anaerobic processes (Davis 1985).
However, the validity of this original hypothesis has been questioned by evidence
that: lactate production is not intrinsically linked to muscle hypoxia (Green et al.
1983; Chirtel et al. 1984; Connett et al. 1984); BLa may not be indicative of muscle
lactate concentration as BLa is the net result of lactate production and removal

Chapter 2 - Literature review: Rowing testing - laboratory and field protocols
27
(Donovan and Brooks 1983; Green et al. 1983), and decoupling between BLa and
ventilatory thresholds (Hagberg et al. 1982; Hughes et al. 1982; Hagberg 1984).
Review articles by Brooks (1985) and Davis (1985) provide a thorough discussion of
the controversy surrounding the validity of this concept. Furthermore, the complexity
of this issue is also compounded by inconsistent terminology and alternative
descriptions of BLa and ventilatory responses that use one or two critical points. The
initial increase in BLa above resting levels (AT according Wasserman and McIlroy
1964) has therefore also been termed lactate threshold (LT; Coyle et al. 1983;
Hagberg and Coyle 1983) or ‘aerobic threshold’ (Kindermann et al. 1979; Skinner
and McLellan 1980). Similarly, the point beyond which BLa rapidily accumulates
has also been called the AT (Skinner and McLellan 1980); or alternatively, the IAT
(Stegmann and Kindermann 1982; McLellan and Jacobs 1993; Urhausen et al.
1993a; Beneke 1995; Coen et al. 2003), or maximal lactate steady-state (MLSS)
(Stegmann and Kindermann 1982; Urhausen et al. 1993a; Beneke 1995). Similarly,
ventilatory breakpoints (Wasserman and McIlroy 1964; Mickelson and Hagerman
1982; Davis 1985) and fixed BLa concentrations of ~2 mmol.L-1 (LaFontaine et al.
1981; Payne et al. 1996) and 4 mmol.L-1 (onset of blood lactate accumulation,
OBLA; Kindermann et al. 1979; Sjodin et al. 1982; Heck et al. 1985; Payne et al.
1996) have also been used to indicate these metabolic transitions. But caution should
be used when interpreting thresholds based on fixed BLa values, as these do not
account for individual variation in these parameters (Bourdon 2000; Buckley et al.
2003). Alternatively, an individualised two threshold model that results in a three
phase transition from rest to maximal exercise, designates the two reference points as
the aerobic and anaerobic thresholds, respectively (Skinner and McLellan 1980). For
the purpose of this review, these thresholds will be termed LT1 (aerobic threshold)
and LT2 (AT) in accordance with Australian Sport Science practices, although when
discussing the literature, AT will be used as a generic term for the various lactate and
ventilatory thresholds. Figure 2-1 shows a BLa-power output curve from an
incremental rowing test that displays LT1 and LT2.
Despite on-going controversy surrounding the AT threshold concept, a large volume
of research across a variety of sports has considered the effectiveness of AT
determinations in monitoring fitness status (Mickelson and Hagerman 1982; Bunc et
al. 1989; Vermulst et al. 1991; Lucía et al. 1998; Lucía et al. 2000) and defining
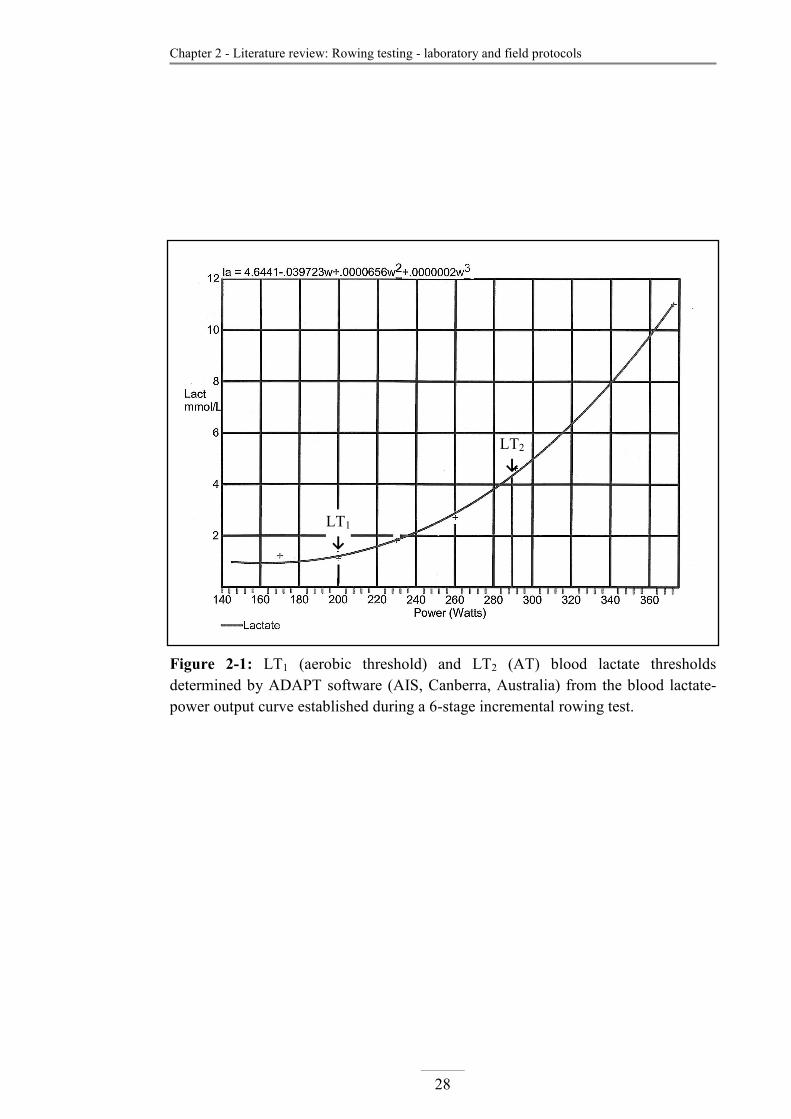
Chapter 2 - Literature review: Rowing testing - laboratory and field protocols
28
Figure 2-1: LT1 (aerobic threshold) and LT2 (AT) blood lactate thresholds
determined by ADAPT software (AIS, Canberra, Australia) from the blood lactate-
power output curve established during a 6-stage incremental rowing test.
LT1
↓
LT2
↓
Chapter 2 - Literature review: Rowing testing - laboratory and field protocols
29
training intensities (Mickelson and Hagerman 1982; Mahler et al. 1985; Urhausen et
al. 1993a; Lucía et al. 1999; Meyer et al. 1999). Table 2-1 (pg. 23) shows that
estimates of AT are strongly related to rowing performance despite the wide range of
methodologies used to determine AT. Similarly, AT has been shown to differentiate
between professional cyclists and elite amateurs (Lucía et al. 1998), and is indicative
of endurance fitness changes for rowers (Mickelson and Hagerman 1982; Mahler et
al. 1984; Mahler et al. 1985; Vermulst et al. 1991), cyclists (Lucía et al. 2000) and
runners (Bunc et al. 1989). Furthermore, AT provides a better indication of
endurance ability than 2OV& max because AT may continue to improve
disproportionally more than 2OV& max once 2OV& max approaches a plateau (Davis
1985; Mahler et al. 1985; Jacobs 1986), thereby limiting the effectiveness of 2OV& max
as a means of differentiating endurance capacities’ between highly trained athletes
(Lucía et al. 1998; Lucía et al. 2000). Additionally, given that exercise prescriptions
based on percentages of 2OV& max or maximal heart rate (HRmax) do not allow for
between-individual variations in BLa response, a workload corresponding to 75%
2OV& max has been shown to result in exercise intensities between 86-118% of an
individual athletes AT (Meyer et al. 1999). Based on similar findings, the AT has
been recommended as a more appropriate means of prescribing exercise intensities
for endurance training than the ‘fixed percentage’ method (Katch et al. 1978;
McLellan and Skinner 1981; Meyer et al. 1999). Thus, AT determinations have
frequently been used to calculate exercise intensity zones for application to athletic
training (Urhausen et al. 1993a; Lucía et al. 1999; Hagerman 2000; Hahn et al. 2000;
Meyer et al. 2005b). BLa thresholds therefore continue to be routinely calculated
from incremental rowing tests to evaluate training adaptations and as a basis for
individualised training intensity recommendations.
2.3.3 Prescription of rowing training intensities
Another function of laboratory based rowing tests has been to provide individualised
exercise intensity guidelines for on-water and land-based rowing training. Rowing
training has traditionally been divided into a continuum of 6-7 training zones
according to intensity and targeted training outcome (Hagerman 2000; Hahn et al.
2000), although more recently, a standardised 5 tier classification system has been
adopted in Australia (Table 2-2). Each of these divisions are calculated from an
athlete’s BLa-workload curve (3rd order polynomial relationship; Figure 2-1) and are

Chapter 2 - Literature review: Rowing testing - laboratory and field protocols
30
based on identification of LT1 (aerobic) and LT2 (anaerobic) thresholds (Hahn et al.
2000). Intensities below LT1 are termed T1 (Light aerobic), while work between LT1
and LT2 is divided into two zones, such that T2 (Moderate aerobic) represents the
lower half and T3 (Heavy aerobic) the upper end (Hahn et al. 2000). LT2 is assigned
a separate training zone (T4; Threshold) and is regarded as the highest sustainable
steady-state workload (Heck et al. 1985; Beneke 1995). Beyond this, the T5 zone
(Maximal aerobic) has an increased reliance on anaerobic energy pathways, whereby
the development of metabolic acidosis limits the duration and interval training is
favoured. However, traditional rowing training classifications also assign an
Anaerobic zone that is not directly based on the BLa-workload curve, but instead
involves intensities equivalent to, or beyond race pace (Hahn et al. 2000) and may be
subdivided into two zones depending on the duration of efforts, and the lactic or
alactic training focus (Hagerman 2000). The International Rowing Federation (FISA)
have also provided guidelines for rowing fitness training that include training zone
recommendations, these are described by Altenburg (1992). Furthermore, HR-
workload data from the laboratory test can be used to align HR values with the
training zones established from the BLa-workload curve, thereby providing a
guideline by which the calculated training zones can be applied during on-water
sessions. However, as some evidence suggests, biomechanical (Martindale and
Robertson 1984; Lamb 1989; Smith et al. 1993; Dawson et al. 1998; Kleshnev 2005)
and physiological differences (Clausen 1976; Steinacker et al. 1987; Urhausen et al.
1993b; Payne et al. 1996; Ryan-Tanner et al. 1999b) exist between ergometer and
on-water rowing conditions. Consequently, the specificity of ergometer testing has
been questioned by rowing coaches because the training recommendations from
laboratory tests are not readily applied to on-water training.

Chapter 2 - Literature review: Rowing testing - laboratory and field protocols
31
Tab
le 2
-2:
Con
tem
pora
ry t
rain
ing
inte
nsit
y zo
nes
and
trad
itio
nal
row
ing
clas
sifi
cati
ons
base
d on
LT
1 an
d L
T2
bloo
d
lact
ate
thre
shol
ds,
and
appr
oxim
ate
hear
t ra
te a
nd b
lood
lac
tate
con
cent
rati
on e
quiv
alen
ts f
or a
mal
e he
avyw
eigh
t
row
er.
Tra
inin
g z
on
e T
rad
itio
nal
row
ing
class
ific
ati
on
s L
act
ate
th
res
hold
B
La
(mm
ol.
L-1
)
HR
ma
x
(%)
A
naer
obic
1
M
axim
al
100
A
naer
obic
2
10
.0 –
14.
0 95
– 1
00
T5:
Max
imal
aer
obic
T
rans
port
>
LT
2 5.
0 –
10.0
90
– 9
5
T4:
Thr
esho
ld
Ana
erob
ic t
hres
hold
L
T2
(ass
umin
g 4.
0 m
mol
.L-1
) 4.
0 –
5.0
85 –
90
T3:
Hea
vy a
erob
ic
Uti
lisa
tion
1
Upp
er 5
0% (
LT
2-L
T1)
2.
8 –
4.0
75 –
85
T2:
Mod
erat
e ae
robi
c U
tili
sati
on 2
L
ower
50%
(L
T2-
LT
1)
1.5
– 2.
8 65
– 7
5
T1:
Lig
ht a
erob
ic
Rec
over
y <
LT
1 (a
ssum
ing
1.5
mm
ol.L
-1)
< 1
.5
< 6
5
BL
a =
blo
od l
acta
te c
once
ntra
tion
; H
Rm
ax =
max
imal
hea
rt r
ate.
A
ssum
es b
lood
lac
tate
con
cent
rati
ons
of 1
.5 m
mol
.L-1
and
4.0
mm
ol.L
-1 f
or t
he L
T1
and
LT
2 th
resh
olds
, re
spec
tive
ly,
alth
ough
act
ual
LT
1 an
d L
T2
bloo
d la
ctat
e co
ncen
trat
ions
wil
l va
ry o
n an
ind
ivid
ual
basi
s.

Chapter 2 - Literature review: Rowing testing - laboratory and field protocols
32
2.4 VALIDITY OF ERGOMETER ROWI�G
A variety of methods have been used to validate simulated rowing on an ergometer
against the criterion of on-water rowing. Research has focussed on kinematic
analyses (Martindale and Robertson 1984; Lamb 1989; Dawson et al. 1998; Elliott et
al. 2002), mathematical relationships between time-trial performances (Ryan-Tanner
et al. 1999a) and assessments of physiological responses (Clausen 1976; Steinacker
et al. 1987; Chènier and Leger 1991; Urhausen et al. 1993b; Payne et al. 1996;
Ryan-Tanner et al. 1999b) to compare rowing under laboratory and field conditions.
2.4.1 Movement patterns
Digitised footage of ergometer and on-water rowing has been employed to compare
movement patterns and stroke characteristics between the two environments
(Martindale and Robertson 1984; Lamb 1989). Gjessing (Martindale and Robertson
1984), Stanford (Lamb 1989) and RowPerfect (Elliott et al. 2002) ergometer designs
have all been used to compare sculling (Martindale and Robertson 1984) or sweep-
oar rowing (Lamb 1989). Martindale and Robertson (1984) compared ergometer and
on-water rowing using a kinematic film analysis to calculate total body and
segmental mechanical energy characteristics throughout one complete stroke cycle.
When linear handle displacement was compared between rowing modes, sculling
resulted in handle movements ~10-30 cm shorter than ergometer rowing, although
the difference would be reduced if total handle movement was used instead of linear
displacement as the handles actually travel through an arc (Martindale and Robertson
1984). However, work-time relationships also differed between the ergometer and
rowing shell due to different interactions between the rower’s body mass and the
boat or ergometer (Martindale and Robertson 1984). Hence, the boat was able to
move both with, and independently of the rower, in response to movement of their
body mass, whereas the ergometer was stationary and motion therefore limited to
movement of the rower’s body mass forward and back along the slide (Figure 2-2).
Given the additional kinetic energy from movement of the rower-boat system during
the on-water condition, it was not possible to directly compare the rowing devices
using total work calculations derived only from the video footage. Instead,
Martindale and Robertson (1989) addressed differences according to calculations of
energy saved via exchange between body segments and interconversion between
potential and kinetic energy. Energy exchange as a proportion of total work was

Chapter 2 - Literature review: Rowing testing - laboratory and field protocols
33
0
10
20
30
40
50
60
70
80
90
100
110
120
-10 0 10 20 30 40 50 60 70 80 90 100 110
% Total stroke time
% Kinetic energy peak
Boat
Shell
Ergo
Catch Finish Catch
Figure 2-2: Kinetic energy of the rower’s body during a single rowing stroke
performed on a stationary ergometer (ergo) and on-water (boat) and the kinetic
energy of the boat (shell). Adapted from Martindale and Robertson (1984).

Chapter 2 - Literature review: Rowing testing - laboratory and field protocols
34
therefore greater during on-water rowing as a consequence of the energy transferred
from body to boat during sculling. Martindale and Robertson (1984) therefore
concluded that there were substantial differences between the movements of on-
water sculling and rowing performed on Gjessing ergometers.
Similarly, Lamb (1989) used a ‘vector loop model’ that separated the rower into
body segments (e.g. trunk, upper arm, lower leg) and upper and lower body ‘loops’
to permit between rowing mode comparisons of each body segment’s contribution to
total linear velocity at intervals representing 10% of the drive time. Differences in
movement pattern were again apparent between ergometer and boat, most notably
during the early and late stages of the drive. The author explained that these
differences may be due to water ‘slippage’ around the blade during sculling thereby
reducing the arms’ contribution to oar velocity compared to the ergometer and that
ergometer rowing did not require the rower to ‘feather’ in preparation for recovery
(Lamb 1989). Nevertheless, Lamb (1989) concludes that these differences are trivial
given the arms contribute relatively little to overall linear velocity during the drive
phase compared to the trunk and leg segments.
Kinematic analyses have also been employed to investigate the relative timing of the
drive and recovery phases across increasing stroke rates during ergometer and on-
water conditions (Dawson et al. 1998). Although strong linear relationships
(R2=0.94-0.97) were reported between changes in drive to recovery ratio and stroke
rate, when the coefficient of variation for phase proportion was plotted against stroke
rate, it was apparent that the recovery was associated with the greatest variability,
particularly during on-water rowing. Dawson et al. (1998) therefore suggest the
recovery phase is the most difficult portion of the rowing stroke and that variations in
stroke timing during on-water rowing are more difficult to overcome compared to
ergometer performance. Findings such as these fundamentally challenge the
conclusion of Lamb (1989), that there is no appreciable difference in rowing
technique between ergometer and on-water conditions, given that the recovery phase
was not included in the analysis.
2.4.2 Biomechanics
Further research investigating biomechanical differences between ergometer rowing
and sculling is provided by Elliott et al. (2002) in their comparison of the

Chapter 2 - Literature review: Rowing testing - laboratory and field protocols
35
RowPerfect ergometer and on-water sculling. Owing to the floating foot stretcher
design of the RowPerfect, Elliott et al. (2002) propose that this style of ergometer
will better simulate the inertial forces experienced in the boat thereby enhancing the
degree to which the sculling motion is replicated. Using an instrumented boat, blade
force and oar angle were measured during on-water rowing; similarly, force and
power measures, derived from the work monitor unit, were recorded for the
ergometer and stroke length was determined from flywheel rotations. The pattern and
consistency of force application was then compared between conditions using force-
angle (on-water) and force-length (ergometer) curves that were normalised using a
scale of 0-100, where 100 represented peak values for force production and
angle/length. Average RowPerfect stroke length (1.36-1.40 m) and on-water stroke
angle (106-113º) did not alter significantly across the investigated stroke rates of 24-
28 strokes.min-1. However, average force production on the ergometer (390-401 N)
was considerably higher than that measured for the combined left and right hands on-
water (273-288 N). Nevertheless, when force-angle and force-length curves were
assessed for consistency across five sequential strokes, mean coefficients of multiple
determination were similar between the ergometer (R2=0.99) and on-water
conditions (R2=0.98), despite the environmental variations in the latter situation.
Additionally, anatomical markers placed on the rowers during each of the trials
allowed comparisons of joint angles between conditions using digitised video
footage. Analysis revealed that average body angles (trunk, thigh, knee and leg) were
not statistically different between the ergometer and on-water performance. Given
the apparent similarities between force curve patterns and body angles, Elliott et al.
(2002) concludes that the RowPerfect ergometer has a similar “rowing structure to
on-water sculling and is therefore suitable for rowing specific training and team
selection”. The RowPerfect ergometer may therefore provide a better simulation of
on-water rowing compared to the Gjessing (Martindale and Robertson 1984) and
Stanford (Lamb 1989) ergometers previously evaluated. However, based on handle
forces that were again 30-40% higher during ergometer rowing and significant
differences between handle velocities and acceleration profiles between the
ergometers and single sculling, Kleshnev (2005) suggests that the Rowperfect and
Concept2 ergometers are cross-training devices only. Additionally, standard error of
measurement (% SEM) results for mean power from repeated 2000-m time-trials are
reported to be more variable on the on the Rowperfect ergometer (3.3%) than the
Concept2 (1.3%; Soper and Hume 2004). So although the RowPerfect ergometer

Chapter 2 - Literature review: Rowing testing - laboratory and field protocols
36
may better simulate on-water rowing compared to the Concept2, performance
reliability appears to limit its potential a laboratory testing device. Concept2 have
also attempted to better simulate the inertial forces experienced during on-water
rowing by introducing ‘sliders’ that allow the entire ergometer to ‘float’ in a similar
manner to the RowPerfect footstretcher assembly. While there appears to be no
published literature comparing on-water rowing with the sliding Concept2, it is likely
that this apparatus may be subject to the same limitations as the RowPerfect
ergometer.
2.4.3 Rowing performance
While the above studies have investigated isolated aspects of rowing that contribute
to overall rowing performance, ergometer and on-water rowing have also been
compared according to performance outcomes. As a Spearman rank order correlation
between 2000-m rowing performance during repeated ergometer time-trials and pair-
oared rowing was strong (R=0.74), it suggests an association between factors
contributing to time-trial performance under either condition (Ryan-Tanner et al.
1999a). Similar comparisons have also been reported for single sculling with Pearson
correlation coefficients spanning R=0.72-0.90 (Jürimäe et al. 1999; Jürimäe et al.
2000; Barrett and Manning 2004).
2.4.4 Physiological responses
The conclusions from biomechanical studies have been somewhat equivocal, either
finding substantial differences between rowing modes (Martindale and Robertson
1984; Dawson et al. 1998; Kleshnev 2005), or supporting that ergometer rowing
provides a reasonable simulation of the on-water condition (Lamb 1989; Elliott et al.
2002); however, even one of the latter studies has noted some differences between
conditions (Lamb 1989). Also, given the variety of ergometer designs used,
comparisons between studies are difficult. Equipment has included the air-braked
RowPerfect (Elliott et al. 2002; Kleshnev 2005) and Concept2 (Kleshnev 2005)
designs, the mechanically braked Gjessing machine (Martindale and Robertson
1984) and sweep style Stanford ergometer (Lamb 1989). Furthermore, none of these
comparisons have included any physiological data.
Differences are also apparent when the physiological responses to rowing are
compared between ergometer and on-water environments. Payne et al. (1996)
Chapter 2 - Literature review: Rowing testing - laboratory and field protocols
37
conclude that the two conditions elicit different physiological responses which may
be the result of biomechanical variations between conditions. Of the variables
considered in the literature, HR and BLa have been most commonly addressed. HR is
generally reported to be higher during the on-water situation (Urhausen et al. 1993b;
Ryan-Tanner et al. 1999b), although Steinacker et al. (1987) suggest that ergometer
performance elicits a higher HR. Conversely, BLa is higher during ergometer rowing
(Urhausen et al. 1993b; Ryan-Tanner et al. 1999b), possibly by as much as 35%
(Ryan-Tanner et al. 1999b). Other measured variables include catecholamines
(Urhausen et al. 1993b), which are higher during ergometer performance, and
2OV& peak (Chènier and Leger 1991), which differs by -0.5% to +2.7% depending on
the design of the reference ergometer. Given the potential for biomechanical
differences between the two performance scenarios and the resulting variations in
physiological response, an element of on-water testing would be worthwhile to ‘fine-
tune’ training intensity recommendations from ergometer tests.

Chapter 2 - Literature review: Rowing testing - laboratory and field protocols
38
2.5 O�-WATER I�CREME�TAL ROWI�G PROTOCOLS
Very few scientific publications relate to formalised incremental exercise protocols
performed in the on-water environment. Those who have attempted field-based tests
of this nature have all developed different protocols for the mode of rowing, number
of stages, stage duration, workload to recovery ratio and method of progression.
Typically, assessments have been limited to pair-oared boats (Steinacker et al. 1987;
Payne et al. 1996; Coen et al. 2003), although Steinacker et al. (1987) also considers
single sculls. The number of stages performed and stage duration varies from 4 x 6-
min exercise bouts (Coen et al. 2003) to 8 x 3-min stages (Payne et al. 1996). Both
constant duration stages (Payne et al. 1996; Coen et al. 2003) and fixed distance
stages (Steinacker et al. 1987) have been used. The recovery between stages has also
varied and this is largely influenced by the time required to collect data and prepare
for the subsequent stage. Recovery intervals have therefore ranged from 1.5 min
(Payne et al. 1996) to ~9 min (Steinacker et al. 1987) depending on the time required
to realign the boat. Intensity and stage progression have been controlled by either
boat velocity (Coen et al. 2003) or stroke rate (Steinacker et al. 1987; Payne et al.
1996).
While all investigations have compared the results of an on-water protocol with an
ergometer-based incremental test and adopted an ergometer protocol that used
predetermined target power outputs and increments, only Payne et al. (1996)
matched the on-water version for stage duration, recovery and stroke rate. Steinacker
et al. (1987) and Coen et al. (2003) instead adopt what appears to be a standard
laboratory incremental test, although they did not attempt to match this with their on-
water protocol. These studies have generally found good agreement between
ergometer and on-water tests when comparing mean HR values at fixed BLa
concentrations of 4 mmol.L-1 (Steinacker et al. 1987; Payne et al. 1996) or IAT
(Coen et al. 2003), with mean HR values ranging 167-172 and 167-171 beats.min-1
for ergometer and on-water tests, respectively. However, when individual HR values
equivalent to 2 mmol.L-1 and 4 mmol.L-1 are compared between test modes (Payne et
al. 1996), linear regression displays moderate-strong correlations of R=0.72 and
R=0.66, but corresponds to SEE of 5 beats.min-1 (3.3 %) and 8 beats.min-1 (5.0 %),
respectively. Payne et al. (1996) then explains that this degree of imprecision in the
estimation of the on-water HR threshold would result in on-water BLa concentrations

Chapter 2 - Literature review: Rowing testing - laboratory and field protocols
39
ranging 1.4-3.2 mmol.L-1 and 2.8-5.9 mmol.L-1. Similarly, Steinacker et al. (1987)
also calculates HR values corresponding to 4 mmol.L-1 and reports a correlation of
R=0.84 between results from ergometer and on-water incremental tests. Although
when the prescribed HR intensity was applied to a 4 km steady-state rowing session,
half the rowers produced BLa concentrations below the 4 mmol.L-1 target (1.5-2.9
mmol.L-1), while the remaining rowers were above the predicted concentration (4.5-
5.2 mmol.L-1). Thus, on-water training intensities may not be adequately established
from ergometer testing (Steinacker et al. 1987; Payne et al. 1995, 1996). Payne et al.
(1995, 1996) therefore suggest that this might be better achieved from on-water
incremental tests controlled by stroke rate and perceived effort, or at least
supplement ergometer testing as a method for determining specific training intensity
guidelines (Steinacker et al. 1987; 1993b). Indeed, when Coen et al. (2003)
compared the BLa, HR and rowing velocity corresponding to the IAT derived from
an on-water incremental test, values were reflective of those observed during on-
water endurance training. Although, as the exercise intensity prescribed by the coach
during the reference training session was below IAT, a direct comparison was not
possible. However, the observed BLa, HR and velocity values were 70%, 91% and
95%, respectively, of those determined during the on-water test (Coen et al. 2003).
2.5.1 Methodological limitations
While stage progressions based on prescribed stroke rates or boat velocities will
ensure the desired progressive increase in intensity, they are susceptible to the
influence of environmental factors. Wind speed and direction relative to the boat, as
well as water conditions, have a profound effect on boat velocity and relative
intensity at a given stroke rate. This means that any field-based protocol relying on
these independent variables for the control of workload can only be reliably
performed in near perfect environmental conditions.
The dynamic, unpredictable nature of environmental conditions means that accurate
and reliable testing on-water is difficult, especially when attempting to standardise
testing within and between sessions (Steinacker et al. 1987; Coen et al. 2003).
Steinacker et al. (1987) caution that on-water step tests are practically demanding
and require fair weather conditions for optimal results. Factors such as wind speed
and direction can potentially change during an effort and have a significant impact on
boat velocity. So, although boat velocity is a key determinant of on-water

Chapter 2 - Literature review: Rowing testing - laboratory and field protocols
40
performance in a regatta situation, it is unsuitable as an independent variable to
monitor the responses to a given training workload. Also, substantial variation in
stroke rate (Smith et al. 1993) and HR (Urhausen et al. 1993b) between field and
laboratory environments means that these parameters are unreliable as independent
variables for controlling changes in intensity during on-water work. The only true
and independent measure of work is therefore the power output exerted by the rower
to propel the boat.
2.5.2 Measurement of on-water rowing power output
Ideally, an on-water test would use prescribed target power outputs to control
workload in the same manner as an ergometer test. However, as power output
measurements during on-water rowing require boats to be instrumented with
specialised biomechanics equipment to measure propulsive forces and the angular
velocity of the oars, there are very little data concerning direct measurements of
rowing power output in the field. One of the earliest investigations (Di Prampero et
al. 1971) instrumented the oarlock with strain gauges to measure force application,
although the angular velocity of the oar was not directly measured, but estimated
based on an assumed constant for handle displacement and the duration of the force
application. More recently, Smith et al. (1993, 1994) described a custom-designed
rowing biomechanics system where the strain on the oar was measured with a linear
proximity transducer that was calibrated by hanging a know mass (47.1 kg) from the
oar handle, and oar angle was measured with a potentiometer attached to the oar
pivot, which was calibrated at known points throughout the expected range of a
rowing stroke. Using the same system as Smith et al. (1994), Payne et al. (1996)
measured on-water power outputs during an on-water incremental rowing test,
although on-water workloads could not be prescribed using target power outputs as
the rowing biomechanics system did not provide instantaneous feedback. Instead,
workloads were controlled by a combination of target stroke rates and the rower
attempting to match blade (oar) force applications between the on-water test and an
earlier ergometer test. Average power outputs during each 3-min stage of the on-
water test ranged 132-304 W, although these were lower compared to directly
measured power outputs from the corresponding ergometer test by ~9-27 W during
submaximal exercise and ~64-94 W during maximal efforts. The discrepancy
between ergometer and on-water results was likely due to the additional force
applied to the footstretcher that was not included in the power output calculations,

Chapter 2 - Literature review: Rowing testing - laboratory and field protocols
41
which were based on force measurements from only the oar (Payne et al. 1996).
Similar power measurement systems have also been described for rowing evaluations
using rowing tanks (Di Prampero et al. 1971; Henry et al. 1995), with mean power
output from 30 s maximal tank rowing reported as 739 W, compared with 667 W
during a similar test on a Concept2 ergometer (Henry et al. 1995). While Henry et
al. (1995) validated power outputs during tank rowing against those from equivalent
performances on Concept2 (R=0.77) and Stanford (R=0.70) rowing ergometers, Di
Prampero et al. (1971) cautions that tank rowing is mechanically and physiologically
different compared to actual rowing. More recently, Kleshnev (2000) and Smith and
Loschner (2002) have described more advanced rowing biomechanics systems that
also include footstretcher forces, and have reported that power output is ~17% higher
when the additional force recorded by the footstretcher is included in the calculation
of power output. So although these systems provide a more complete indication of
the propulsive power output during rowing, it is unclear whether these devices would
allow instantaneous power output feedback during on-water rowing, or show similar
work-to-metabolic cost relationships to those measured on the ergometer.
While all publications detailing on-water power output measurements with rowing
biomechanics systems have used custom-designed devices, Aitchison and Grey
(2002) have described a instrumented rowing gate system that integrates load cells
and a potentiometer within the body of the rowing gate. Given the system’s compact
and portable design, Aitchison and Grey (2002) have suggested that this style of
system could be readily commercialised. Indeed, WEBA Sport (Wien, Austria) now
offers a commercially available rowing biomechanics system that uses an
instrumented rowing gate design, although power output measurements would likely
be underestimated as the system does not include propulsive forces from the
footstretcher (Kleshnev 2000). Despite some limitations regarding measurement of
all the forces contributing to boat propulsion and non-instantaneous power output
feedback, rowing biomechanics systems could feasibly be used to quantify power
output (or at least a proportion of the true power output) during on-water incremental
rowing tests. However, as the rowing biomechanics systems used to measure on-
water power output are expensive, the cost may limit their widespread use.
2.5.3 Measurement of metabolic load during on-water rowing
Another limitation of the previous studies that compared the physiological

Chapter 2 - Literature review: Rowing testing - laboratory and field protocols
42
differences between on-water rowing and ergometer performance is that none of the
comparisons have included 2OV& data as an indication of metabolic load. In fact,
very few researchers have attempted to directly measure the oxygen cost of rowing in
the field environment. Jackson and Secher (1976) and Chènier and Leger (1991)
have used the Douglas bag method to measure 2OV& during single and double
sculling and paired sweep rowing, although measurements were limited to maximal
intensities only (Chènier and Leger 1991) or used very short sample durations (45-60
s; Jackson and Secher 1976). Alternatively, Kawakami et al. (1992) used a Cosmed
K2 portable indirect calorimetry system to continuously measure 2OV& for a single
sculler during four incremental workloads. Interestingly, the resulting 2OV& -boat
velocity relationship was very similar to that reported by Di Prampero et al. (1971),
who calculated the oxygen cost of on-water rowing based on the HR- 2OV&
relationship established during tank rowing. Provided measurements from portable
metabolic systems are accurate and reliable compared to criterion indirect
calorimetry systems, this technology seems ideally suited for on-water assessments
of metabolic demand during rowing.
The accuracy of gas exchange measurements from portable metabolic devices has
typically been evaluated by comparing results with Douglas bag measurements
(McLaughlin et al. 2001; Larsson et al. 2004; Crouter et al. 2006) or other
laboratory-based metabolic systems (Eisenmann et al. 2003; Duffield et al. 2004;
Crouter et al. 2006). Accuracy and reliability data have been previously reported for
a variety of portable models, including: Cosmed (Rome, Italy) K4b2 (McLaughlin et
al. 2001; Eisenmann et al. 2003; Duffield et al. 2004), K4 (Hausswirth et al. 1997)
and K2 (Kawakami et al. 1992) models; the Medical Graphics (St. Paul, USA)
VO2000 (Kautza et al. 2004; Crouter et al. 2006), and the Cortex (Leipzig,
Germany) MetaMax I (Meyer et al. 2001) and II (Larsson et al. 2004). Accuracy
comparisons show that mean values for EV& (Crouter et al. 2006), 2OV& (Duffield et
al. 2004; Larsson et al. 2004; Crouter et al. 2006), carbon dioxide production
(VCO2; Duffield et al. 2004; Larsson et al. 2004; Crouter et al. 2006) and respiratory
exchange ratio (RER; McLaughlin et al. 2001) sometimes differ between systems.
However, because these differences have been isolated to only some of the measured
variables, and limited to a few of the evaluated workloads, most studies have
concluded that portable systems display adequate accuracy. While the accuracy of

Chapter 2 - Literature review: Rowing testing - laboratory and field protocols
43
portable systems has been widely addressed, the reproducibility of repeated
measurements is equally important (Atkinson et al. 2005) and has not been
extensively reported. Reliability assessments have been published for the Cosmed
K4b2 (Duffield et al. 2004) and K2 (Kawakami et al. 1992), the Medical Graphics
VO2000 (Crouter et al. 2006) and the Cortex MetMax I (Meyer et al. 2001). Of
these, the Cosmed and Cortex evaluations both concluded that reliability results were
satisfactory (Meyer et al. 2001; Duffield et al. 2004). Provided results from
laboratory-based validity studies directly translate to the field environment, it appears
that some designs of portable metabolic system meet the requirements to achieve
their intended purpose as field-based devices for the measurement of metabolic load.
2.5.4 Reliability
Although the reliability of rowing tests performed on rowing ergometers has been
reported for 500-m and 2000-m time-trials (Schabort et al. 1999; Soper and Hume
2004), the reproducibility of results from incremental tests has not been widely
reported. Similarly, only Payne et al. (1996) has considered the reproducibility of
results from repeated on-water tests. Pearson correlation coefficients for HR and
power output data corresponding to 4 mmol.L-1 BLa from repeated on-water and
laboratory tests were statistically significant (p<0.05) for both modes of rowing. HR
results from the on-water test displayed a between-test correlation of R=0.46, which
compared to R=0.85 for the ergometer method. However, the SEE for the on-water
result (8 beats.min-1) was much higher compared with the ergometer test (3
beats.min-1; Payne et al. 1996). However, for the power output at 4 mmol.L-1 BLa,
stronger correlations (on-water: R=0.89; ergometer: R=0.93) and lower SEEs (on-
water: 12 W; ergometer: 7 W) were obtained. Payne et al. (1996) also considered the
reliability of power outputs for each workload of the on-water and ergometer tests,
reporting statistically significant correlations (p<0.001) for the ergometer and on-
water conditions. However, as instantaneous power output feedback was only
available under ergometer conditions, a stronger correlation was observed for
repeated ergometer trials (R=0.84) compared with the on-water test (R=0.72). This
limitation means that results from on-water tests may be less reliable compared to
ergometer assessments.

Chapter 2 - Literature review: Rowing testing - laboratory and field protocols
44
2.6 CO�CLUSIO�S
Ergometer-based simulations of rowing have enabled thorough evaluations of the
demands of competitive rowing in a controlled environment, and have greatly
improved the specificity of test results compared to early investigations using non-
rowing exercise. Consequently, laboratory-based incremental tests performed on
rowing ergometers have become the standard method for assessing athletes’
physiological profiles, monitoring longitudinal fitness changes, and prescribing
individualised exercise intensities for rowing training. However, as kinematic,
biomechanical, and physiological differences exist between ergometer simulations
and on-water rowing, it appears that the external validity of ergometer rowing is
limited compared with the criterion of on-water performance. Given this limitation,
incremental rowing tests have been successfully replicated in the on-water
environment to improve the specificity of training intensity recommendations
compared with those from laboratory-based tests. While field-based rowing tests are
susceptible to the influence of unpredictable environmental conditions, on-water
workloads can be quantified by power output measurements from rowing
biomechanics systems, which should therefore offer greater control for
environmental influences. Ideally, on-water tests should also incorporate indirect
calorimetry measurements from a portable system to quantify the metabolic demands
of on-water rowing, and to provide a more complete comparison between the
physiological responses to ergometer and on-water rowing, which have previously
been based on BLa and HR data only. Beyond further comparisons between
laboratory and field tests to evaluate the validity of ergometer based simulations,
further research is required to quantify the reliability of on-water measurements. It is
also relevant to evaluate whether the results from on-water tests could be used to
monitor fitness changes, and if competitive performance can be better predicted
compared with ergometer tests.

Chapter 3 - Validation of the Concept2 Model D rowing ergometer
45
CHAPTER 3
VALIDATION OF THE CONCEPT2 MODEL D
ROWING ERGOMETER
3.1 I�TRODUCTIO�
Rowing ergometers are essential tools for physiological monitoring, training
prescription and scientific research. Comparisons have previously been made
between the physiological responses to exercise performed on different designs of
rowing ergometer. The friction-resisted Gjessing ergometer has been compared to the
fixed foot stretcher air-braked Concept2 Model C ergometer (Hahn et al. 1988;
Lormes et al. 1993) and the floating foot stretcher Rowperfect ergometer (Mahony et
al. 1999). Recently, Soper and Hume (2004) also compared the Concept2 Model C
and Rowperfect ergometers and found that performance in short and long distance
time-trials was more reliable on the Concept2; however, they measured no
physiological variables. To date, no investigation has determined if physiological
differences exist between different models of Concept2 ergometer: Model C (C2C;
Plate 3-1) and Model D (C2D; Plate 3-2).
The Concept2 air-braked rowing ergometer has been popular among researchers and
competitive rowers as a sport-specific testing device and indoor trainer. Results from
progressive incremental tests performed on Concept2 ergometers are commonly used
to interpret physiological adaptations to rowing training and to provide specific
training intensity recommendations (Hahn et al. 2000). The Australian Institute of
Sport (AIS) Physiology laboratory has conducted laboratory tests with the C2C
ergometer for approximately a decade. Indeed, many sport science laboratories and
training centres have data from physiological tests using the C2C ergometer.
However, the introduction of the C2D model means that test results will have to be
compared between ergometers where laboratories have upgraded to the C2D
ergometer or when rowers are tested at multiple locations using different Concept2
ergometers. The C2D rowing ergometer was introduced in 2003 to update and

Chapter 3 - Validation of the Concept2 Model D rowing ergometer
46
replace the C2C model. New features of the C2D ergometer are an updated work
monitor unit, altered flywheel enclosure and redesigned ergonomic handle. While the
latter changes reduce operational noise and improve the ‘feel’ of the ergometer,
flywheel enclosure modifications may alter damping characteristics and therefore
resistance, even though other resistance determinants such as flywheel moment of
inertia and chain gearing have remained the same. Although any variations in
resistance should be accounted for by the drag factor setting, physiological
differences may be apparent if the drag factors of the C2C and C2D ergometers are
different, or the new handle design alters rowing technique. Any such difference
would affect test results and confound comparisons between physiological data
obtained on the different Concept2 ergometer models. The aims of this study were
therefore to: a) determine whether the results from both ergometers are equivalent by
comparing the physiological responses to incremental rowing to exhaustion on the
C2C and C2D ergometers, and b) establish the reliability of rowing tests using the
C2D ergometer.

Chapter 3 - Validation of the Concept2 Model D rowing ergometer
47
Plate 3-1: The Concept2 Model C ergometer (C2C), including: A) PM2 work
monitor unit; B) flywheel enclosure, and C) straight-design handle.
Plate 3-2: The Concept2 Model D ergometer (C2D), including: A) PM3 work
monitor unit; B) updated flywheel enclosure, and C) new 10° bent-handle.
B
A
C
A
B
C

Chapter 3 - Validation of the Concept2 Model D rowing ergometer
48
3.2 METHODS
3.2.1 Subjects
Eight experienced rowers (males: n=6; females: n=2) participated in the study. All
had >5 yr training experience and were members of a national level training squad;
four had been members of the Australian National team. Each rower provided
informed consent to participate and the experimental protocol had previously been
approved by the AIS Ethics Committee.
3.2.2 Experimental protocol
Each participant completed three matching trials over 5-8 days; two trials using the
C2D and a single trial with the C2C. Trial 1 familiarised each rower with the C2D
ergometer and test protocol; results from this trial were also compared with the
subsequent C2D trial to assess the reproducibility of rowing tests using this
ergometer. While this clearly increased the potential for variation between the C2D
tests due to habituation effects, we decided that this approach would better
approximate normal routine testing practices where familiarisation trials are not
performed. However, familiarisation was not required for the C2C ergometer as all
rowers had considerable experience with this model from prior indoor training and
testing. A randomised cross-over design then ensured that half the rowers performed
Trial 2 on the C2D ergometer and half on the C2C ergometer, before swapping
ergometers for Trial 3. All sessions were separated by 48-72 h to allow complete
recovery between tests, which were scheduled for the same time of day to control for
diurnal variation. Subjects were instructed to eat similar meals and limit training to
light workloads during the 24 h prior to testing.
Incremental rowing protocol
The progressive incremental test protocol of Hahn et al. (2000) was modified to
comprise 5 x 4-min submaximal stages and a single 4-min maximal stage. The initial
workload and progression of intensity were prescribed according to rower category
(i.e. male or female, lightweight or heavyweight). Males started with an initial
workload of 150 W with stage progressions of 40 W and 30 W for heavyweights and
lightweights, respectively. Heavyweight women started at 125 W and progressed in
25 W increments. No lightweight women participated in this study. The submaximal
stages were separated by 1-min recovery periods, with a 5-min rest before the

Chapter 3 - Validation of the Concept2 Model D rowing ergometer
49
maximal stage. Subjects were then instructed to row as far as possible during the 4-
min maximal time-trial. Blood lactate concentration (BLa; Lactate Pro, Arkray Inc,
Shiga, Japan) was determined by analysis of capillary blood samples collected from
the ear lobe: prior to the test, during each recovery period, immediately post maximal
exercise and 4 min post maximal exercise. Submaximal BLa was used to ensure all
subjects presented to the maximal stage in a ‘similar’ physiological condition. If BLa
exceeded 4 mmol.L-1 before the fifth submaximal stage, then the remaining
submaximal stages were omitted and the 5-min recovery period prior to the maximal
stage began immediately. As a result of this condition, three of the eight subjects
completed only 4 x 4-min submaximal stages and the single 4-min maximal stage
during each of the trials.
Upon arrival at the laboratory, subjects were weighed in minimal clothing on a
calibrated digital scale (Teraoka Seiko Co, Tokyo, Japan). Once comfortably seated
on the ergometer, the drag factor was set to 130 for heavyweight men and 120 for
heavyweight women and lightweight men. During exercise, mixed expired air passed
through a Hans Rudolph R2700 valve (Kansas City, USA) into aluminised 200 L
Mylar® collection bags which were connected to a fully automated indirect
calorimetry system (AIS, Belconnen, ACT, Australia). This system has been
described elsewhere (Russell et al. 2002). The Ametek (Applied Electrochemistry,
Pittsburgh, PA, USA) O2 and CO2 analysers were calibrated before each test using
three precision grade gases (BOC Gases Australia Ltd, Sydney, Australia) that
spanned the physiological range of measurement. Both gas analysers were also
checked for drift after each test. Oxygen consumption ( 2OV& ) and carbon dioxide
production ( 2COV& ) were calculated at 30 s intervals throughout each stage. The
2OV& for each workload was defined as the highest O2 consumption attained during
two consecutive 30 s sampling periods. Average power output, stroke rate (SR), heart
rate (HR) and rating of perceived exertion (RPE) were recorded upon completion of
each workload. HR during each test was monitored using short-range telemetry
(S610i, Polar Electro OY, Kempele, Finland) while RPE was ascertained using the
15-point Borg scale (Borg 1973). Rowing economy was also calculated for each
stage by dividing mean 2OV& by the average power output.
Automated software (ADAPT Software, AIS, Belconnen, ACT, Australia)

Chapter 3 - Validation of the Concept2 Model D rowing ergometer
50
determined lactate thresholds from the power output-BLa relationship established
from each of the submaximal stages and the maximal stage using 3rd order
polynomial regression. Lactate threshold 1 (LT1; aerobic threshold) was defined as
the point at which BLa began to increase (≥ 0.4 mmol.L-1) above resting levels.
Lactate threshold 2 (LT2; anaerobic threshold, AT) was defined as the point on the
polynomial regression curve that yielded the maximum perpendicular distance to the
straight line formed by joining LT1 and peak BLa (modified D-max; Bishop et al.
1998). HR, power output and 2OV& at LT1 and LT2 were subsequently determined
using the ADAPT software.
3.2.3 Statistical analyses
Three subjects did not complete the required 5 x 4-min submaximal workloads
before displaying a BLa of ≥4 mmol.L-1 during all three trials. Consequently, data
from the first four submaximal stages were used for subsequent statistical analyses
for all subjects. Physiological responses and lactate threshold results were compared
between ergometer models (C2C vs. C2D) to validate the new model of Concept2
ergometer against the established laboratory-testing device. Additionally, the
repeated C2D trials were also examined to establish the reproducibility of repeated
measures using this ergometer. For both comparisons, submaximal data were
analysed using 2 (test) x 4 (stage) factorial ANOVAs with repeated measures on
both dimensions (STATISTICA for Windows, Tulsa, USA); maximal data and
lactate threshold results were compared using dependent t-tests. Statistical
significance was established at p<0.05 for all analyses. Furthermore, the effects of
ergometer model and repeated C2D trials were also analysed to determine the
likelihood that the true value of the observed Cohen effect statistic was trivial (<0.2),
or at least small (0.2), moderate (0.6) or large (1.2; Hopkins 2002; Hopkins et al.
2009). Briefly, a clear effect size (ES) was established when the likelihood ≥75%
that the true value of the effect statistic was greater than one of the above thresholds
(e.g. small or moderate). As the analysis also considers the likely direction of an
effect (either positive or negative), an ES was unclear when the likelihood was <75%
for a positive ES and >5% for a negative ES (Hopkins 2007; Hopkins et al. 2009), or
vice-versa. Magnitude-based differences are reported as the largest likely effect size
and associated percent probability (e.g. small, 85%). The reliability of measurements
from repeated C2D trials was also determined using typical error (TE; Hopkins
2000a).
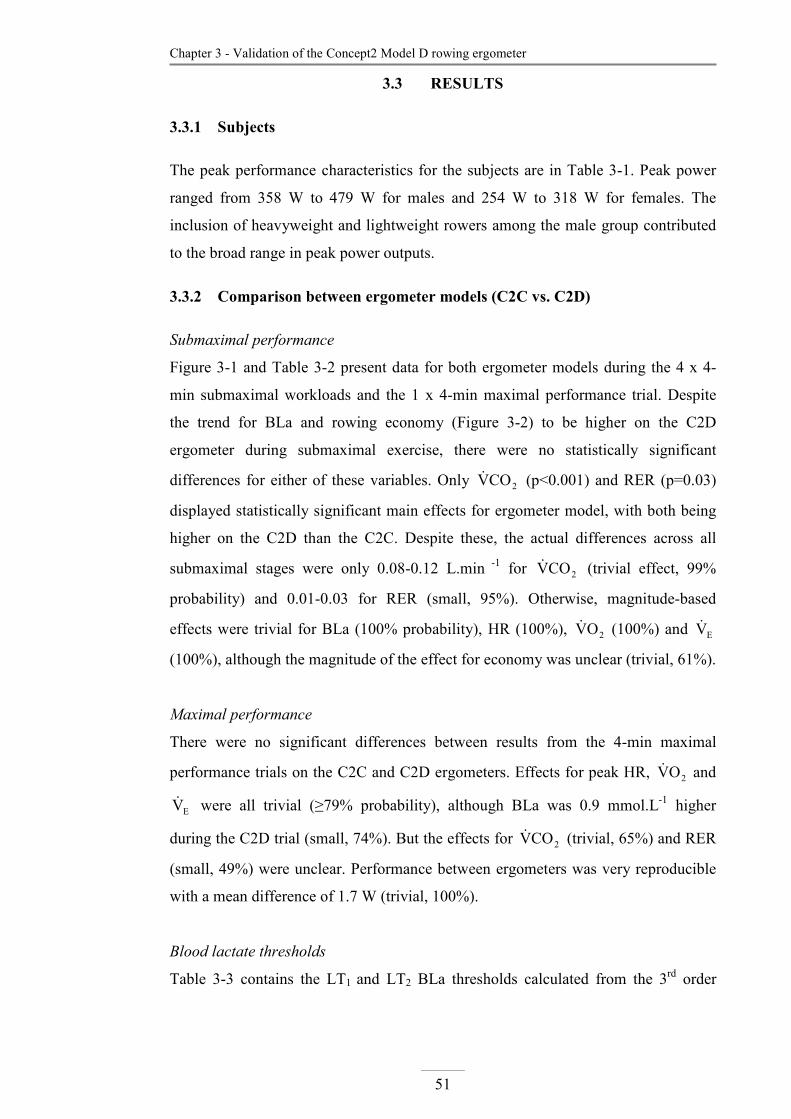
Chapter 3 - Validation of the Concept2 Model D rowing ergometer
51
3.3 RESULTS
3.3.1 Subjects
The peak performance characteristics for the subjects are in Table 3-1. Peak power
ranged from 358 W to 479 W for males and 254 W to 318 W for females. The
inclusion of heavyweight and lightweight rowers among the male group contributed
to the broad range in peak power outputs.
3.3.2 Comparison between ergometer models (C2C vs. C2D)
Submaximal performance
Figure 3-1 and Table 3-2 present data for both ergometer models during the 4 x 4-
min submaximal workloads and the 1 x 4-min maximal performance trial. Despite
the trend for BLa and rowing economy (Figure 3-2) to be higher on the C2D
ergometer during submaximal exercise, there were no statistically significant
differences for either of these variables. Only 2COV& (p<0.001) and RER (p=0.03)
displayed statistically significant main effects for ergometer model, with both being
higher on the C2D than the C2C. Despite these, the actual differences across all
submaximal stages were only 0.08-0.12 L.min -1 for 2COV& (trivial effect, 99%
probability) and 0.01-0.03 for RER (small, 95%). Otherwise, magnitude-based
effects were trivial for BLa (100% probability), HR (100%), 2OV& (100%) and EV&
(100%), although the magnitude of the effect for economy was unclear (trivial, 61%).
Maximal performance
There were no significant differences between results from the 4-min maximal
performance trials on the C2C and C2D ergometers. Effects for peak HR, 2OV& and
EV& were all trivial (≥79% probability), although BLa was 0.9 mmol.L-1 higher
during the C2D trial (small, 74%). But the effects for 2COV& (trivial, 65%) and RER
(small, 49%) were unclear. Performance between ergometers was very reproducible
with a mean difference of 1.7 W (trivial, 100%).
Blood lactate thresholds
Table 3-3 contains the LT1 and LT2 BLa thresholds calculated from the 3rd order

52
Chapter 3 - Validation of the Concept2 Model D rowing ergometer
Tab
le 3
-1:
Sub
ject
des
crip
tion
and
per
form
ance
cha
ract
eris
tics
dur
ing
4 m
in m
axim
al e
rgom
eter
row
ing
for
mal
es (n=6
) an
d fe
mal
es (n=2).
Dat
a ar
e pr
esen
ted
as m
ean
(SD
) fo
r m
ales
and
mea
n
(ran
ge)
for
fem
ales
.
M
ass
(k
g)
2O
V& p
ea
k (
L. m
in-1
) 2
OV&
pea
k (
mL
. kg
-1. m
in-1
) P
pea
k (
W)
Male
82
.3 (
11.3
) 5.
06 (
0.29
) 62
.3 (
6.6)
40
7 (4
3)
Fem
ale
80
.8 (
75.7
-86.
1)
4.17
(3.
70-4
.62)
51
.5 (
48.9
-54.
3)
287
(254
-318
)
2O
V&pe
ak =
pea
k ox
ygen
con
sum
ptio
n; P
pea
k =
ave
rage
pow
er d
urin
g th
e 4
min
max
imal
per
form
ance
tri
al

Chapter 3 - Validation of the Concept2 Model D rowing ergometer
53
polynomial of the BLa-power output relationship and the value of selected
physiological variables equivalent to LT1 and LT2. Apart from LT1 BLa (p=0.02;
small, 92%), there were no differences between results from the two ergometer
models. LT1 occurred at 65% of peak 2OV& ( 2OV& peak) and 79% of peak HR during
the maximal stage (HRpeak), whereas LT2 occurred at 86% of 2OV& peak and 92% of
HRpeak.
3.3.3 Reliability of test results using the C2D ergometer
Submaximal performance
Figure 3-3 shows results from the two trials using the C2D ergometer. There were no
significant differences between submaximal power outputs or 2OV& , 2COV& , RER
and EV& results, although HR (p=0.049) and BLa (p=0.04) showed statistically
significant main effects with both tending higher on Trial 1. The mean between-trial
differences for each of the workloads were 3-5 beats.min-1 for HR and 0.1-0.5
mmol.L-1 for BLa, although the magnitude of these effects were small (83%
probability) and unclear (trivial, 43%), respectively. Magnitude-based effects were
trivial for 2OV& (100% probability), 2COV& (100%), and EV& (100%), although RER
was unclear (trivial, 68%). TE results for submaximal intensities are displayed in
Table 3-4.
Maximal performance
Mean power outputs were within 7 W during the two C2D trials (p=0.10; trivial,
90%). However, 2OV& (p=0.04; unclear small, 71%), 2COV& (p=0.03; unclear small,
52%) and EV& (p=0.02; small, 80%) were all higher during the second of the repeated
trials. BLa also displayed a small between-trial effect (78% probability), although the
1.5 mmol.L-1 increase during Trial 2 was not statistically significant (p=0.13).
Despite these differences, relative TE results were generally within 3% (Table 3-4),
except for BLa measures and associated calculated thresholds, as well as for SR.
Blood lactate thresholds
There were no statistically significant differences between LT1 and LT2 threshold
results, and magnitude-based effects were no greater than small (LT2 BLa: small

Chapter 3 - Validation of the Concept2 Model D rowing ergometer
54
effect, 81%). TEs for LT1 and LT2 BLa and power output results are displayed in
Table 3-4 and range from 10.1-15.6% (0.2 and 0.4 mmol.L-1, respectively).

Chapter 3 - Validation of the Concept2 Model D rowing ergometer
55
Figure 3-1: (A) Blood lactate concentration and (B) heart rate during the incremental
rowing protocol performed on Concept2 Model C and Model D ergometers. Error
bars denote ± 1 SD.
100 150 200 250 300 350 400 4500.0
2.0
4.0
6.0
8.0
10.0
12.0
14.0
16.0A
BLa (mmol.L-1)
100 150 200 250 300 350 400 450120
130
140
150
160
170
180
190
200B
Model C Model D
Power output (W)
HR (beats.min-1)

56
Chapter 3 - Validation of the Concept2 Model D rowing ergometer
Tab
le 3
-2:
Pow
er o
utpu
t, s
trok
e ra
te a
nd s
elec
ted
phys
iolo
gica
l va
riab
les
duri
ng i
ncre
men
tal
row
ing
perf
orm
ed o
n C
once
pt2
Mod
el C
and
Mod
el D
ergo
met
ers.
Dat
a ar
e pr
esen
ted
as m
ean
(SD
).
P
ow
er (
W)
S
R (
stro
kes
. min
-1)
R
PE
(6
-20)
2
OV&
(L. m
in-1
)
2C
OV&
(L. m
in-1
)
RE
R
Work
load
C
2C
C
2D
C2C
C
2D
C2C
C
2D
C2C
C
2D
C2C
C
2D
C2C
C
2D
1
145
(12)
145
(12
)
17 (
2)
17 (
2)
7
(2)
7
(2)
2.
65 (
0.22
) 2.
65 (
0.31
) 2
.20
(0.2
1)
2.28
(0.
30)
0.8
3 (0
.06)
0.8
6 (0
.05)
2
177
(17)
176
(17
)
18 (
1)
18 (
2)
10
(3)
9 (
2)
3.08
(0.
30)
3.14
(0.
31)
2.7
4 (0
.32)
2.8
6 (0
.30)
0
.89
(0.0
5) 0
.91
(0.0
5)
3
209
(23)
208
(23
)
19 (
2)
19 (
1)
12
(2)
12 (
1)
3.54
(0.
35)
3.57
(0.
37)
3.2
9 (0
.41)
3.3
7 (0
.40)
0
.93
(0.0
6) 0
.94
(0.0
5)
4
241
(29)
242
(28
)
21 (
2)
21 (
2)
14
(2)
14 (
1)
3.94
(0.
40)
3.97
(0.
43)
3.7
8 (0
.52)
3.
87 (
0.45
) 0
.96
(0.0
6) 0
.98
(0.0
6)
MA
X
378
(71)
377
(68
)
35 (
4)
36 (
2)
20
(0)
20 (
0)
4.81
(0.
51)
4.87
(0.
57)
5.4
7 (0
.92)
5.
58 (
0.78
) 1
.13
(0.0
9) 1
.15
(0.0
8)
SR
= s
trok
e ra
te;
RP
E =
rat
ing
of p
erce
ived
exe
rtio
n;
2O
V& =
oxy
gen
cons
umpt
ion;
2
CO
V& =
car
bon
diox
ide
prod
ucti
on;
RE
R =
res
pira
tory
exc
hang
e ra
tio;
C2C
= C
once
pt2
Mod
el C
erg
omet
er;
C2D
= C
once
pt2
Mod
el D
erg
omet
er.
Chapter 3 - Validation of the Concept2 Model D rowing ergometer
57
Table 3-3: LT1 and LT2 thresholds calculated from blood lactate-power
output relationships during incremental rowing performed on Concept2
Model C and Model D ergometers.
C2C C2D
Threshold Variable Mean (SD) Mean (SD) p
LT1 Power (W) 176 (27) 180 (25) 0.32
BLa (mmol.L-1) 1.2 (0.4) 1.4 (0.4) 0.02
HR (beats.min-1) 151 (7) 151 (4) 0.65
2OV& (L.min-1) 3.10 (0.43) 3.22 (0.42) 0.12
LT2 Power (W) 273 (46) 268 (50) 0.41
BLa (mmol.L-1) 4.2 (0.7) 4.2 (0.9) 0.91
HR (beats.min-1) 176 (3) 174 (4) 0.17
2OV& (L.min-1) 4.14 (0.46) 4.13 (0.48) 0.75
C2C = Concept2 Model C ergometer; C2D = Concept2 Model D ergometer; SD =
standard deviation; HR = heart rate; BLa = blood lactate concentration; 2OV& = oxygen
consumption; p = probability resulting from a paired t-test between C2C and C2D data.
Figure 3-2: Oxygen economy during the incremental rowing protocol performed on
Concept2 Model C and Model D ergometers. Error bars denote ± 1 SD.
100 150 200 250 300 350 400 45011
12
13
14
15
16
17
18
19
20
21
Power output (W)
Model C Model DEconomy (ml O2.min-1.W
-1)

Chapter 3 - Validation of the Concept2 Model D rowing ergometer
58
Figure 3-3: (A) Blood lactate concentration, (B) heart rate and (C) oxygen
consumption during both incremental rowing protocols performed on the Concept2
Model D ergometer. Error bars denote ± 1 SD.
100 150 200 250 300 350 400 4500.0
2.0
4.0
6.0
8.0
10.0
12.0
14.0
16.0A
BLa (mmol.L-1)
100 150 200 250 300 350 400 450120
130
140
150
160
170
180
190
200B
HR (beats.min-1)
100 150 200 250 300 350 400 4502.0
2.5
3.0
3.5
4.0
4.5
5.0
5.5C
Trial 1 Trial 2
Power output (W)
VO2 (L.min-1)

Chapter 3 - Validation of the Concept2 Model D rowing ergometer
59
Table 3-4: Reliability (% TE) of repeated measurements during
the submaximal and maximal portions of the incremental rowing
tests performed on the Concept2 Model D rowing ergometer.
% TE (95% CL)
Variable Submaximal Maximal
Power output (W) 0.5 (0.4-0.7) 2.8 (1.9-5.2)
HR (beats.min-1) 2.4 (1.9-3.1) 1.6 (1.1-2.9)
BLa (mmol.L-1) 14.3 (12.3-20.4) 15.6 (11.3-32.9)
2OV& (L.min-1) 2.6 (2.1-3.4) 2.5 (1.8-4.7)
RPE (Borg 15-point scale) 8.4 (7.1-11.5) 1.3 (0.9-2.5)
SR (strokes.min-1) 4.6 (3.8-6.2) 9.8 (7.0-19.6)
Distance (m) 0.2 (0.2-0.3) 0.8 (0.5-1.5)
LT1 BLa (mmol.L-1) 15.6 (10.8-37.3)
LT1 power output (W) 4.5 (3.0-9.6)
LT2 BLa (mmol.L-1) 10.1 (6.9-22.7)
LT2 power output (W) 5.0 (3.4-10.7)
% TE = relative typical error (%); 95% CL = 95% confidence limits; HR =
heart rate; BLa = blood lactate concentration; 2OV& = oxygen consumption;
RPE = Borg’s rating of perceived exertion; SR = stroke rate; Distance =
distance covered during each stage.

Chapter 3 - Validation of the Concept2 Model D rowing ergometer
60
3.4 DISCUSSIO�
Our study is the first to show that the physiological responses to progressive exercise
on the C2C and C2D models of Concept2 rowing ergometer are essentially identical
despite the updated design of the C2D model. The current study evaluated the
physiological responses to an incremental submaximal rowing test and maximal
performance trial on C2C and C2D ergometers. The results indicate that there are
only minor differences between the models with greatest variation seen during
maximal performance, which is effort dependent. Test results also displayed a high
degree of reproducibility between repeated trials on the C2D ergometer. These
findings therefore provide reassurance that direct comparisons between the results
from the two ergometer models are valid.
3.4.1 Comparison between ergometer models (C2C vs. C2D)
Differences between C2C and C2D ergometers were less than or similar to those
reported in the literature between other ergometer designs. Comparisons between
Gjessing and early model Concept2 ergometers report mean power differences of
21.8 W (Hahn et al. 1988) and 39.0 W (Lormes et al. 1993) during simulated racing
and incremental tests, respectively. These compare with the 1.7 W difference (Table
3-2) during the maximal stage in the current investigation. Despite our small
discrepancy in average power, 2OV& peak differed by 0.06 L.min-1 between the
Concept2 models compared with 0.04 L.min-1 between ergometer designs (Hahn et
al. 1988). Response variables such as EV& , HR and BLa have also been compared
across Concept2, Gjessing and Rowperfect designs. Differences between these
designs span 3.1-5.0 L.min-1 for EV& , 0.1-0.6 mmol.L-1 for BLa and 0-4 bpm for HR
(Hahn et al. 1988; Lormes et al. 1993; Mahony et al. 1999). Furthermore, maximal
SR is reported to be one point higher on the Gjessing than the Concept2 (Hahn et al.
1988). Thus, with the exception of 2OV& , all variables in the current study displayed
greater agreement between the two Concept ergometer models (C2C and C2D) than
that between different ergometer designs. Despite our greater variation in 2OV&
between the two ergometer models than previously reported (Hahn et al. 1988), this
value was well within the TE established for this measurement using the repeated
C2D trials (0.13 L.min-1) and was therefore considered to be within the typical
between-test variation.

Chapter 3 - Validation of the Concept2 Model D rowing ergometer
61
3.4.2 Reliability of test results using the C2D ergometer
As fitness tests are usually conducted on a regular basis to monitor fitness changes
across the rowing season (Vermulst et al. 1991; Petibois et al. 2003), between-test
reliability is an important consideration as it determines a test’s sensitivity to
detecting change. While performance variations between repeated rowing ergometer
time-trials have previously been quantified (Schabort et al. 1999; Soper and Hume
2004), the reliability of physiological responses during repeated incremental rowing
tests has not been considered. Our findings showed that rowing tests using the C2D
ergometer generally provided results that were highly reproducible. TE for 2OV&
(2.5%) was less than that reported for previous evaluations of between-day biological
variation in 2OV& of 3-4% (Stuart et al. 1981; Armstrong and Costill 1985). BLa
showed larger variations between the repeated trials as reflected by the 10-16% TE
for the individual lactate thresholds (Table 3-4), although absolute TE was 0.2 and
0.4 mmol.L-1 for LT1 and LT2, respectively. However, the power output
corresponding to the LT1 and LT2 thresholds displayed TE results of ~5% and should
therefore be better suited to monitoring submaximal fitness changes. Otherwise,
relative TE results were generally within 3%, except for submaximal SR (4.6%) and
RPE (8.4%), although based on typical submaximal values, these TE results equate
to errors of approximately 1 stroke.min-1 or 1 RPE unit, respectively. While the
inclusion of data from the C2D familiarisation trial had the potential to negatively
affect our reliability results compared to a scenario where a separate familiarisation
was performed, the current approach was used to better approximate between-test
variation during routine testing, where familiarisation trials are not performed.
3.4.3 Practical applications
The present study attempted to replicate the conditions under which athletes present
for routine testing. They were therefore asked to refrain from strenuous exercise in
the preceding 24 h and consume a similar meal, high in carbohydrate, prior to each
test. In addition, all tests were undertaken at the same time of day and the order
effect for the final two ergometer trials was controlled by counterbalancing. Despite
these intended controls, some subjects may have presented to the laboratory in a
physiological state that was not consistent with previous trials. This may have
impacted on the integrity of our HR and BLa measurements. However, this is the
‘real world’ situation and we should therefore be prepared to expect this extent of

Chapter 3 - Validation of the Concept2 Model D rowing ergometer
62
variation for test-retest scenarios. Thus, the reliability estimates from this
investigation were designed to quantify the typical between-test variation from
routine rowing testing in our laboratory.
Other potential limitations to the investigation include the small sample size, and that
power output was recorded directly from the ergometer display units and not by
independent measurement of handle force and displacement. Directly measured
power outputs of C2C and C2D rowing ergometers demonstrate that their display
units underestimate power by 5.1% (Lormes et al. 1993) and 6.6% (Boyas et al.
2006), respectively. Although power output was not directly measured in our
investigation, both Concept2 ergometer models are reported to use the same
algorithm for calculating power (Boyas et al. 2006). Nevertheless, despite potential
inaccuracy in calculated power, there appeared to be very little between-trial
variation in the displayed power outputs during submaximal exercise and only
slightly greater variation in peak power outputs during the maximal performance
trial. Indeed, the variation between ergometer models during the maximal
performance trial was well within the TE of 2.8% for this equipment in our
laboratory and is therefore consistent with normal between-day variation in
performance. Additionally, as our investigation compared a C2C model with
previous operational experience to a brand new C2D model, chain tension and the
elasticity of the chain return mechanism may have differed between ergometers,
neither of which are accounted for in power output or drag factor calculations (Boyas
et al. 2006). While there was no way to directly compare or control for these
potential differences, both ergometers used throughout this investigation were well
maintained and the C2C model had experienced minimal operation because it had
only been used for laboratory testing. Furthermore, the reproducibility of the
measured physiological variables suggests that mechanical differences between
ergometers were negligible. Ideally, dynamic calibration of the Concept2 ergometer
would account for differences between true power and that displayed by the work
monitor unit, but such a calibration procedure would be exceedingly difficult for this
style of ergometer. Indeed, there does not appear to be reported anywhere in the
literature a first-principles calibration rig that can simulate the rowing stroke.
As the C2D ergometer incorporates an altered flywheel enclosure and modified
handle grip, resistance characteristics and rowing technique could potentially be

Chapter 3 - Validation of the Concept2 Model D rowing ergometer
63
changed. For example, as the leg drive along the slide and ultimate finish position are
limited by leg length and practical limits to hip/trunk extension, many rowers
(particularly heavyweight men) attempt to maximise stroke length at the front of the
slide by allowing the handle to retract within several centimetres of the ergometer’s
frame. As the C2D handle design positions the hands further from the chain-handle
interface, the same hand position at the catch results in less handle displacement and
therefore shorter stroke length compared to the C2C model. As such, close inspection
of the C2D model reveals that handle displacement would differ by a maximum of 4
cm when the handle was allowed to touch the ergometer frame. Rowers would
therefore be required to apply greater force at the same stroke rate, or a higher stroke
rate at the same handle force, to achieve the same power output on the C2D as on the
C2C model. We therefore anticipated that the design of the C2D ergometer may have
altered rowing stroke mechanics and economy (mL O2.min-1.W-1) thereby resulting
in an increased O2 cost. When rowing economy was calculated, there were subtle
differences between the two ergometer models in the anticipated direction (Figure 3-
2) but none of them was large enough to be statistically significant. Except for the
first submaximal stage, mean economy throughout all exercise intensities was better
on the C2C model with O2 costs during maximal exercise of 12.9 mL O2.min-1.W-1
on the C2C and 13.1 mL O2.min-1.W-1 on the C2D. SRs during the corresponding
submaximal and maximal workloads were also very similar (Table 3-2) thereby
reinforcing the reproducibility of physiological responses when completing exercise
on either ergometer model, and rejecting our assertion that the different handle
designs would alter stroke mechanics and O2 cost. The observed discrepancy in
rowing economy may therefore be the result of slight differences in intra-stroke work
output resulting from subtle between trial deviations in stroke rate.
Differences between ergometer models were greatest during the maximal stage of the
incremental test. This was largely due to the within-subject standardisation of
average power during the submaximal stages. However, unlike exercise tests
performed on a treadmill or cycle ergometer, fixed-constant power output cannot be
pre-determined on rowing ergometers; control of power output is therefore somewhat
dependent on the skill of the rower. Between ergometer differences at submaximal
workloads are therefore mainly due to the rower’s ability to hold a given pace. All
subjects were skilled rowers with previous testing experience, but the most
experienced athletes were better able to reproduce the target submaximal workloads.

Chapter 3 - Validation of the Concept2 Model D rowing ergometer
64
Rowers were not provided with target workloads during the maximal stage but were
instructed to complete as much work as possible during the 4-min stage. While most
rowers adopted a pacing strategy during the first half of the maximal trial, to ensure
they were able to complete the entire stage, the potential for differences due to poor
self-pacing was increased compared to the submaximal stages. So, although the
response to maximal exercise was more variable than during submaximal workloads,
it is likely that performance was more dependent on subject presentation and pacing
than the model of Concept2 ergometer.

Chapter 3 - Validation of the Concept2 Model D rowing ergometer
65
3.5 CO�CLUSIO�
Incremental exercise performed on the C2D ergometer elicits a physiological
response that is equivalent to that on the C2C model. Direct comparisons between
test results obtained on either model of Concept2 rowing ergometer are therefore
possible. As results from rowing tests using the C2D ergometer are also very
reproducible, the C2D rowing ergometer is valid laboratory testing device.
Chapter 4 - Validity of the MetaMax3B portable metabolic system
66
CHAPTER 4
VALIDITY OF THE METAMAX3B PORTABLE
METABOLIC SYSTEM
4.1 I�TRODUCTIO�
Metabolic variables including oxygen consumption ( 2OV& ), carbon dioxide
production ( 2COV& ), ventilation ( EV& ) and respiratory exchange ration (RER) are
commonly measured during exercise tests to assess athletes’ physiological profiles
and to monitor their training status. While indirect calorimetry techniques once relied
solely on the Douglas bag method (Douglas 1911) of collecting and measuring
expired gas fractions and EV& , automated electronic gas analysis systems have
almost entirely replaced the gold standard Douglas bag method. Although modern
electronic metabolic systems are compact relative to the equipment required for
measurements using Douglas bags, most are still designed for laboratory use only.
However, the development of portable metabolic devices has allowed gas exchange
measurements to be performed in a variety of field-based settings including running
(Kawakami et al. 1992; Crouter et al. 2001), cycling (MacRae et al. 2000; Millet et
al. 2002) and rowing (Kawakami et al. 1992). Given on-going interest in ways to
improve the specificity of physiological testing for elite athletes, portable metabolic
systems provide a means of assessing the metabolic demands of exercise in a sport-
specific field environment. However, for this to be a realistic outcome, it is essential
to validate the accuracy and reliability of measurements from portable metabolic
systems compared with the standard laboratory equipment.
The accuracy of gas exchange measurements from portable metabolic devices has
typically been evaluated by comparing results to those obtained from either Douglas
bag measurements (McLaughlin et al. 2001; Larsson et al. 2004; Crouter et al. 2006)
or other laboratory-based metabolic systems (Hausswirth et al. 1997; Schulz et al.
1997; Pinnington et al. 2001; Eisenmann et al. 2003; Duffield et al. 2004; Crouter et

Chapter 4 - Validity of the MetaMax3B portable metabolic system
67
al. 2006), although mechanical gas exchange simulators have also been described
(Gore et al. 1997; Prieur et al. 2003). Accuracy and reliability data have been
previously reported for a variety of portable models from several manufacturers,
including: Cosmed (Rome, Italy) K4b2 (McLaughlin et al. 2001; Pinnington et al.
2001; Eisenmann et al. 2003; Duffield et al. 2004), K4 (Hausswirth et al. 1997) and
K2 (Kawakami et al. 1992) models; the Medical Graphics (St. Paul, USA) VO2000
(Kautza et al. 2004; Crouter et al. 2006) and Cortex (Leipzig, Germany) MetaMax II
(Larsson et al. 2004), MetaMax I (Meyer et al. 2001) and X1 (Schulz et al. 1997)
designs. Comparisons between these portable devices and criterion systems have
usually involved duplicate tests on separate days (Hausswirth et al. 1997;
McLaughlin et al. 2001; Duffield et al. 2004; Larsson et al. 2004; Crouter et al.
2006), although several studies have attempted to remove between-test biological
variation by performing simultaneous measurements with both machines (Pinnington
et al. 2001; Duffield et al. 2004; Larsson et al. 2004; Crouter et al. 2006); however,
interference between the systems has been reported when using this approach
(Duffield et al. 2004; Crouter et al. 2006). Regardless of these variations in protocol,
accuracy comparisons show that mean values for EV& (Pinnington et al. 2001;
Crouter et al. 2006), 2OV& (McLaughlin et al. 2001; Eisenmann et al. 2003; Duffield
et al. 2004; Larsson et al. 2004; Crouter et al. 2006), 2COV& (McLaughlin et al. 2001;
Duffield et al. 2004; Larsson et al. 2004; Crouter et al. 2006) and RER (McLaughlin
et al. 2001) sometimes differ between measurement systems. Because these
differences have been isolated to only some of the measured variables, and limited to
a few of the evaluated workloads, most studies have concluded that portable systems
display adequate accuracy. Indeed, Meyer et al. (2005a) provides a detailed review
of validation studies and concludes that results from portable systems do not greatly
differ from laboratory metabolic carts; although they do acknowledge the potential
for publication of only favourable results, and criticise some publications for
inadequate methods of analyses. While the accuracy of portable systems has been
widely addressed, the reproducibility of repeated measurements is equally important
(Atkinson et al. 2005) and has not been as extensively reported. Reliability
assessments from duplicate tests performed on separate days have only been
published for the Cosmed K4b2 (Duffield et al. 2004) and K2 (Kawakami et al.
1992), the Medical Graphics VO2000 (Crouter et al. 2006) and the Cortex MetMax I
(Meyer et al. 2001). Of these, the studies evaluating the Cosmed and Cortex systems
both concluded that reliability results were satisfactory (Meyer et al. 2001; Duffield

Chapter 4 - Validity of the MetaMax3B portable metabolic system
68
et al. 2004). Provided results from laboratory-based validity studies directly translate
to the field environment, it appears that some designs of portable metabolic system
meet the requirements to achieve their intended purpose as field-based measurement
devices. Thus, once the accuracy and reliability of a portable metabolic device has
been thoroughly characterised, sport-specific evaluations of metabolic demand can
be performed in the field and the results interpreted with some confidence. Despite
extensive publication of studies considering the validity of portable metabolic
systems, no evaluation has been reported for the current Cortex breath-by-breath
model, the MetaMax 3B (MM3B). The purpose of the current investigation was
therefore to: 1) evaluate the accuracy of the MM3B compared with an automated
Douglas bag system during submaximal and maximal exercise; 2) establish the
reproducibility of MM3B measurements during duplicate trials; and 3) determine
whether the MM3B is a viable tool for assessing metabolic demands during on-water
rowing.
Chapter 4 - Validity of the MetaMax3B portable metabolic system
69
4.2 METHODS
4.2.1 Subjects
Eight rowers (6 males and 2 females) provided written informed consent to
participate in this investigation; all but one athlete were competing at a national level
in Under 23 rowing competition. The male and female groups both consisted of
heavyweight and lightweight rowers whose physical characteristics are described in
Table 4-1. All biological testing procedures were approved by the AIS Human Ethics
Committee.
4.2.2 Indirect calorimetry equipment
Portable metabolic system
The MM3B is a breath-by-breath indirect calorimetry system (total weight <850 g,
including battery) consisting of a face mask-volume turbine assembly and gas
analysis-data telemetry module (Plate 4-1), which is designed to permit field-based
cardiopulmonary exercise assessments. During exercise testing, the base module (gas
analysis and data telemetry) is fastened to the subject’s chest using a neoprene
harness, and attached to the facemask-volume turbine assembly via the gas-analysis
sample line and volume turbine cord. However, during the current study, the harness
was reversed so that the system was worn on the back, thereby preventing the
connections between the base module and volume turbine assembly from interfering
with the rowers’ hands at the finish position of the rowing stroke. According to the
manufacturer’s specifications, the volume turbine permits flow-transduced volume
measurements ranging 0.05-20.0 L.sec-1, while electro-chemical O2 and infra-red
CO2 analysers allow gas concentration measurements ranging 0-35% O2 and 0-13%
CO2 with a 90% response time of ≤100 ms. Expired gas is sampled from a face mask
(VmaskTM, Hans Rudolf Inc, Shawnee, USA; deadspace 40-49 ml) and ‘dried’ by a
60 cm length of Nafion® tubing on-route to the analysers. Metabolic data can then be
displayed in real-time via radio telemetry or logged by the on-board memory for
subsequent download and analysis. Rechargeable lithium ion batteries provide
approximately 2 h of continuous data collection.
Laboratory metabolic system
Criterion measurements were acquired with a customised laboratory-based system

Chapter 4 - Validity of the MetaMax3B portable metabolic system
70
Table 4-1: Physical characteristics of the subjects.
Males (n=6) Females (n=2)
Measure Mean (SD) Range Mean Range
Age (yr) 23.0 (5.3) 20.3–33.7 21.7 20.6-22.8
Height (m) 1.89 (0.06) 1.81-1.97 1.75 1.74-1.75
Mass (kg) 82.1 (5.2) 75.5-88.0 67.6 59.0-76.2
2OV& peak (L.min-1) 4.79 (0.52) 4.34-5.58 3.63 3.30-3.95
P max (W) 367 (34) 337-420 263 245-280
2OV& peak = peak oxygen consumption during the 4-min maximum performance trial; P max (W) =
average power output during the 4-min maximum performance trial.

Chapter 4 - Validity of the MetaMax3B portable metabolic system
71
Plate 4-1: The MetaMax3B portable indirect calorimetry system, including: A) gas
analysis-data telemetry module; B) telemetry receiver unit, and C) volume turbine
assembly.
B
A
B C

Chapter 4 - Validity of the MetaMax3B portable metabolic system
72
that used an automated Douglas bag design (MOUSe, AIS, Canberra, Australia;
where the acronym MOUSe is short for Maximum Oxygen Uptake System
electronic). This system uses first principles assessment of volume combined with
AEI Technologies (Naperville, USA) O2 (model S-3AI) and CO2 (model CD-3A) gas
analysis, and has been described elsewhere (Russell et al. 2002). The system is
shown in Plate 4-2. Based on previous reliability assessments of rowing tests using
the MOUSe system (Chapter 3), submaximal and maximal typical errors (TE) for
each of the metabolic variables are: 2OV& = 2.6 and 2.5%; 2COV& = 4.4 and 4.2%;
EV& = 5.5 and 5.2%; and RER= 3.2 and 4.1%, respectively.
Calibration of the metabolic systems
The MM3B and MOUSe systems were both calibrated according to normal
operational procedures. Prior to calibration and testing, the MM3B was switched-on
for at least 45 min before gas analysis commenced. The MM3B operational software
includes calibration routines for the gas analysers, volume turbine and pressure
sensor. Gas analyser calibration consisted of a semi-automated two-point procedure
whereby the MM3B sampled atmospheric air (assumed to be 20.93% O2 and 0.03%
CO2) until the calibration routine determined a stable measurement (typically 60-150
s), and this process was replicated using a precision grade (±0.03%) gas (16.05% O2
and 4.99% CO2; BOC Gases Australia Ltd, Sydney, Australia). Additionally, the
MM3B also performs an automatic atmospheric-air check prior to operation. The
volume turbine was calibrated using five strokes of a Hans Rudolph 3 L syringe at a
flow rate of ~60 L.min-1, the generated calibration factor was checked by a further
three strokes of the 3 L syringe at each of ~30, 60 and 180 L.min-1 to ensure that the
measured volumes were within 3% of the criterion across a wide range of flows. The
AEI O2 and CO2 analysers used by the MOUSe system were calibrated before each
test using a three-point procedure; precision gases (±0.03%, BOC Gases Australia
Ltd.) spanned the physiological range of measurement (14.48-17.98% O2 and 2.50-
5.94% CO2) and included a mid-range reference (16.62% O2 and 4.00% CO2) to
verify analyser linearity. Pre-test calibration of MOUSe volume measurements was
not necessary as these were obtained from the displacement of a fixed-diameter
piston, although volume measurements (50-240 L.min-1) were regularly checked with
a metabolic calibrator (details below). However, a pre-test volume initialisation
routine was performed to ensure that both Douglas bags had been evacuated of all air

Chapter 4 - Validity of the MetaMax3B portable metabolic system
73
A
B
C
D
E
Plate 4-2: The laboratory-based Maximum Oxygen Uptake System electronic
(MOUSe) indirect calorimetry system, including: A) volume piston; B) AEI
Technologies CD-3A CO2 gas analyser; C) AEI Technologies S-3AI O2 analyser; D)
computer interface, and E) Mylar Douglas bags.

Chapter 4 - Validity of the MetaMax3B portable metabolic system
74
and that the volume piston was functioning correctly. The gas analysers from both
systems were also checked for drift after each test.
Metabolic simulation system
Additionally, a metabolic calibrator (AIS, Canberra, Australia; Plate 4-3) was also
used to evaluate the accuracy and reliability of MM3B measurements by providing
mechanically generated ‘tidal volumes’ that consisted of known concentrations for
dry ‘expired’ gas fractions. The simulator comprises two fixed-diameter pistons; a
small piston delivers precise volumes of CO2 into a larger piston that regulates the
volume of air expelled each stroke and allows mixing with a known volume of
atmospheric air. Reference gas fractions were then calculated by the metabolic
calibrator based on the dilution of precise volumes of alpha gas (21.00% CO2; BOC
Gases Australia Ltd.) within known volumes of atmospheric air. By controlling the
stroke length of the small and large pistons, a range of expired gas fractions can be
generated to span the physiological range. Similarly, by controlling the speed of the
pistons, flow rates can also be varied to span the physiological range, thereby
allowing EV& and 2OV& simulations beyond 240 L.min-1 (BTPS) and 7.0 L.min-1
(STPD), respectively. As the gas fractions calculated by the metabolic calibrator are
accurate to within 0.10% (absolute) and EV& is accurate to within 1%, the values
predicted for 2OV& and 2COV& are accurate to ~4%, assuming both errors act
cumulatively (Withers et al. 2000). Further details about the principles of the
metabolic calibrator are described by Gore et al. (1997).
4.2.3 Experimental protocol
The accuracy and reliability of the MM3B was evaluated using two methods: 1)
simulation of gas exchange parameters using the metabolic calibrator, and 2)
comparing MM3B and MOUSe results during biological trials with athlete subjects.
During testing with the metabolic calibrator, piston configurations were adjusted to
provide five simulated metabolic outputs that varied between 50-240 L.min-1 EV&
(BTPS) and 1.92-5.75 L.min-1 2OV& (STPD); Table 4-2 shows the reference values
for EV& , 2OV& , 2COV& and RER for each of the settings. The MM3B was attached to
the calibrator by connecting the volume turbine assembly to the respiratory port of
the metabolic calibrator using an air tight rubber adaptor; barometric pressure and

Chapter 4 - Validity of the MetaMax3B portable metabolic system
75
Plate 4-3: The metabolic simulation system, including: A) computer interface; B)
respiratory port, and C) internal mechanics.
A
B
C
Chapter 4 - Validity of the MetaMax3B portable metabolic system
76
temperature readings were then matched between both devices to ensure that
conversions between gas volumes (ATP to STPD or BTPS) were consistent. Steady-
state measurements were performed for each of the five settings that were maintained
for 4 min, with mean results recorded from the final 60 s of each period.
Additionally, the reproducibility of MM3B measurements was evaluated by re-
calibrating the MM3B gas analysers and repeating the protocol for three of the
metabolic calibrator settings (Table 4-2). However, despite being able to address
measurement accuracy and reproducibility by this method, the metabolic calibrator
does not simulate the saturated expirate of human subjects, or evaluate the system
under ambulatory conditions. Thus, any evaluation of a portable metabolic system
must also include biological testing.
Biological testing required athletes to complete three matched rowing trials on the
same ergometer (Concept2 Model D, Morrisville, USA). Metabolic variables: 2OV& ,
2COV& , EV& and RER were measured continuously during all 3 trials with either the
MM3B or MOUSe. Gas exchange measurements were conducted with the MM3B
during two trials to establish the reproducibility of results obtained from the portable
device, while a single trial was completed using the MOUSe system, thereby
providing a criterion against which the accuracy of the MM3B could be compared.
All trials were completed in 3-10 d and the order of trials was counterbalanced so
that half the subjects completed their first trial with the MM3B and half with the
MOUSe. Subjects were instructed to eat similar meals and limit training to light
workloads during the 24 h prior to testing.
Incremental rowing protocol
The progressive incremental test comprised 4 x 4-min submaximal workloads using
fixed target power outputs, and a single 4-min maximal performance trial. The initial
workload and progression of intensity were prescribed on an individual basis
according to rower category (i.e. male or female, lightweight or heavyweight) and
recent 2000-m ergometer time-trial results. Thus, workloads were designed to elicit a
similar physiological intensity between subjects of approximately 60, 70, 80 and
90% of maximum 2000-m rowing power output. Submaximal stages were separated
by 1 min recovery periods, with a 5 min rest before the maximal stage. Subjects were
then instructed to complete as much distance as possible during the 4-min maximal
performance trial.

Chapter 4 - Validity of the MetaMax3B portable metabolic system
77
Prior to each test, flywheel resistance was standardised using the Concept2
ergometer drag factor, which was set to 130 for heavyweight men, 120 for
heavyweight women and lightweight men, and 110 for lightweight women. During
exercise, each of the metabolic variables was calculated at 30 s intervals throughout
each stage. As this was the default sample rate for the MOUSe system, breath-by-
breath measurements from the MM3B were averaged over the same 30 s duration
using the mean-time average function available in the MetaMax analysis software.
Thus, regardless of metabolic device, 2OV& , 2COV& , EV& and RER for each
workload was defined as the mean of the two 30 s samples obtained from the final
minute of each submaximal stage, and the highest two consecutive 30 s samples
during the maximal performance trial. Heart rate (HR; Polar Electro, Kempele,
Finland) was also measured continuously during each stage, with the steady-state HR
recorded during the final 30 s of each workload. Additionally, blood lactate
concentration (BLa; Lactate Pro, Arkray Inc, Shiga, Japan) was determined by
analysis of capillary blood samples collected from the ear lobe immediately
following each stage and 4 min after completion of the maximal workload. Average
power output, stroke rate (SR) and rating of perceived exertion (RPE, Borg 15-point
scale; Borg 1973) were also recorded upon completion of each workload.
4.2.4 Statistical analyses
Reliability
As the metabolic calibrator evaluation consisted of single measurements for each of
the simulated outputs, agreement between duplicate MM3B trials (Trial 1 vs. 2) was
described by percent differences between the respective means and Pearson
correlation coefficients from linear regression; standard error of the estimate (SEE)
from the linear regression provided an average estimate of the error.
Results from the matched MM3B trials during biological testing were examined
using 2 (trial) x 4 (stage) factorial ANOVAs with repeated measures on both
dimensions (SPSS 15.0 for Windows; SPSS, Chicago, Illinois, USA). Maximal data
were compared using dependent t-tests. Statistical significance was established at
p<0.05 for all analyses, with pairwise comparisons using Holm-Bonferoni adjusted
alpha levels (Holm 1979) in the event of significant ANOVA results. The magnitude
of the differences between MM3B trials was also analysed to determine the
probability that the true value of the effect (using 90% confidence intervals) was
Chapter 4 - Validity of the MetaMax3B portable metabolic system
78
greater than the threshold for smallest worthwhile change (SWC), which was based
on reliability data from the criterion MOUSe system (Hopkins 2002; Hopkins et al.
2009). These values (reported p. 72) were therefore set as the smallest worthwhile
effects for each of the metabolic variables. Between-trial effects that displayed a
likelihood ≥75% of being larger than the SWC (in either a positive or negative
direction) were defined as practically substantial, while effects that displayed ≥75%
likelihood for being within the range of the SWC were defined as trivial. An effect
was unclear when the likelihood was <75% for a practically substantial difference in
the positive direction and >5% for a substantial negative difference (Hopkins 2007;
Hopkins et al. 2009), or vice-versa. Magnitude-based differences are reported as the
most likely effect and associated percent probability (e.g. positive, 85%). The
reliability of repeated MM3B measurements was also established using TE (Hopkins
2000a).
Accuracy
The accuracy of the MM3B compared to the metabolic calibrator (MM3B vs.
metabolic calibrator) and the automated Douglas-bag system (MM3B vs. MOUSe)
was quantified using the same data analysis methods as described for Reliability.
Additionally, modified Bland-Altman plots (Bland and Altman 1986; Crouter et al.
2006) with 95 % limits of agreement were also used to permit comparisons between
our results and those from other validity studies.

Chapter 4 - Validity of the MetaMax3B portable metabolic system
79
4.3 RESULTS
4.3.1 Simulated metabolic outputs
Accuracy and reproducibility results from the evaluation with the metabolic
calibration system are shown in Table 4-2. Compared to the metabolic outputs
predicted by the calibration system, MM3B results were within 2.1-7.8% ( 2OV& ),
0.8-10.2% ( 2COV& ) and 2.5-4.0% ( EV& ). Absolute differences between measured
and target gas fractions were 0.21-1.03% (O2) and 0.36-1.08% (CO2); RER results
were within 0.01-0.06. While the magnitude of measured differences were
sometimes greater than that attributable to the precision of the metabolic simulations
(approximately 1%, 0.10% and 3-5% for EV& , gas fractions and 2OV& / 2COV& ,
respectively), correlations between MM3B and metabolic calibrator results were
greater than R=0.996 (p<0.001) for all measured variables. SEE results for these
linear regressions were 0.15, 0.10 and 0.27 L.min-1 for 2OV& , 2COV& and EV& ,
respectively. Differences between repeated MM3B trials using duplicate metabolic
calibrator settings ranged 1.7-4.2% ( 2OV& ), 0.3-2.0% ( 2COV& ) and 0.2-0.7% ( EV& ).
Absolute differences in FEO2 and FECO2 were 0.11-0.56% and 0.16-0.50%,
respectively, while variation in RER was 0.01-0.02. Correlations between Trial 1 and
Trial 2 results of the MM3B were very strong for all variables (R>0.997; p=0.002-
0.05) and SEE results for 2OV& , 2COV& and EV& were 0.10, 0.03 and 0.31 L.min-1,
respectively.
4.3.2 Power output during biological trials
Power output and HR results displayed good agreement between all trials. During the
two MM3B trials, mean power outputs differed by no more than 0.4 W for each of
the submaximal workloads (F 1,7 =1.58, p=0.25) and 1.4 W (p=0.71) during maximal
exercise; mean HRs differed by less than 4 beats.min-1 (F 1,7 =1.62, p=0.24) and 1
beat.min-1 (p=0.71) during submaximal and maximal intensities, respectively.
Similarly, mean power outputs and HRs during comparisons between MM3B and
MOUSe trials were within 0.5 W (F 1,7 =3.59, p=0.10) and 2 beats.min-1 (F 1,7 =0.59,
p=0.47) for the submaximal component of the test and 3.9 W (higher during the
MOUSe trial; p = 0.30) and 2 beats.min-1 (p=0.25) during maximal performance.

Chapter 4 - Validity of the MetaMax3B portable metabolic system
80
Table 4-2: Simulated metabolic outputs for five different settings using the
metabolic calibrator (italicised) and the corresponding mean results from either one
trial (MM3B) or duplicate trials (MM3B2) with the MM3B portable metabolic
system. Differences between MM3B results and the metabolic calibrator, and
between duplicate MM3B trials, are displayed as % error†.
Metabolic output results
Setting System EV& BTPS FEO2 FECO2 2OV&
STPD 2COV&
STPD
RER
% error (L.min-1
) % % (L.min-1
) (L.min-1
)
1 Calibrator 50.00 15.96 5.01 1.92 1.92 1.00
MM3B 51.99 14.93 6.09 2.07 2.12 1.02 MM3B 2 51.82 15.49 5.48 1.99 2.07 1.04 % error acc 4.0 -1.03 1.08 7.8 10.2 2.0 % error rel -0.3 0.56 -0.61 -4.2 -2.0 2.1
2 Calibrator 100.00 18.44 2.53 1.93 1.93 1.00
MM3B 103.42 18.11 3.05 1.97 2.09 1.06 % error acc 3.4 -0.33 0.52 2.1 8.3 6.0
3 Calibrator 100.00 15.97 4.99 3.83 3.83 1.00
MM3B 103.25 15.10 5.84 4.03 4.08 1.01 MM3B 2 103.09 15.47 5.57 3.92 4.07 1.04 % error acc 3.3 -0.87 0.85 5.1 6.5 1.0 % error rel -0.2 0.37 -0.27 -2.8 -0.3 2.6
4 Calibrator 180.00 18.52 2.45 3.36 3.36 1.00
MM3B 184.47 18.31 2.81 3.27 3.43 1.05 % error acc 2.5 -0.21 0.36 -2.8 1.9 5.0
5 Calibrator 240.00 17.83 3.14 5.75 5.75 1.00
MM3B 246.15 17.57 3.58 5.58 5.71 1.03 MM3B 2 244.52 17.46 3.73 5.67 5.78 1.02 % error acc 2.6 -0.26 0.44 -3.0 -0.8 3.0 % error rel -0.7 -0.11 0.15 1.7 1.4 -0.4
† Errors for EV& , 2OV& , 2COV& and RER are relative errors, whereas errors for FEO2 and FECO2 are
absolute errors since the units of the latter two are percent.
EV& = ventilation; FEO2 = fractional concentration of oxygen in expired air; FECO2 = fractional
concentration of carbon dioxide in expired air; 2OV& = oxygen consumption; 2COV& = carbon dioxide
production; RER = respiratory exchange ratio; % error acc = percent difference between MM3B and
metabolic calibrator results (MM3B-metabolic calibrator); % error rel = percent difference between
repeated MM3B trials (MM3B 2-MM3B) for the three metabolic outputs that were simulated on two
separate occasions.
Chapter 4 - Validity of the MetaMax3B portable metabolic system
81
4.3.3 Biological trials
The physiological responses measured during repeated MM3B trials are displayed in
Figure 4-1. Mean differences between each of the workloads were no more than 0.11
L.min-1 (2.5%) for 2OV& and 2COV& , 0.01 (0.9%) for RER and 3.39 L.min-1 (2.7%)
for EV& ; there were no statistically significant differences during the submaximal or
maximal stages (Table 4-3). Additionally, the magnitude of between-trial differences
was nearly always trivial based on probabilities of practically substantial effects. The
probability of a trivial difference between the two trials ranged 62-92% for 2OV&
during each of the submaximal workloads, although the difference was unclear
(trivial effect, 53% probability) during the maximal workload. Probability results for
2COV& (range: 85-99%), RER (93-96%) and EV& (94-98%) indicated trivial effects
across all test stages. Table 4-3 displays reliability results from the repeated MM3B
trials and shows that TE ranged 2.3% ( 2OV& ) to 3.6% ( EV& ) during submaximal
workloads and 2.0% ( 2OV& ) to 2.6% ( 2COV& , RER and EV& ) during maximal
exercise. Additionally, individual between-trial errors are displayed by Bland-
Altman plots (Figure 4-2) and show that mean bias and 95% limits of agreement for
each variable were: 0.07 ± 0.23 L.min-1 ( 2OV& ); 0.03 ± 0.30 L.min-1 ( 2COV& ); 0.01 ±
0.07 (RER) and 0.74 ± 8.12 L.min-1 ( EV& ).
Figure 4-1 shows the metabolic responses measured by the MM3B and MOUSe
during matched rowing tests. As the TE results from the reliability assessment
indicated that MM3B measurements were highly reproducible, and there were no
statistically significant or practically substantial differences between the repeated
MM3B trials, results from the two MM3B trials were averaged for subsequent
comparisons with the criterion MOUSe system. Differences between the results from
the MM3B and MOUSe are displayed in Table 4-4. 2OV& (Stage 2, p=0.005), RER
(Stage 3, p=0.012) and 2COV& (Stages 1-4, p=0.008 to p<0.001) all displayed
statistically significantly differences during submaximal workloads; however, only
2COV& (p=0.01) and RER (p=0.02) displayed significant differences during the
maximal stage (Table 4-4). Furthermore, probabilities of practically substantial
differences for each of the submaximal workloads ranged: 58-85% positive ( 2OV& );
91-100% positive ( 2COV& ) and 58-70% (unclear) positive (RER), but 54-85% trivial

Chapter 4 - Validity of the MetaMax3B portable metabolic system
82
for EV& . During the maximal stage, 2COV& results again displayed strong likelihoods
for substantial positive effects (94%), while the effect for EV& was very likely trivial
(91%); 2OV& and RER were unclear (51% positive and 73% positive, respectively).
Bland-Altman plots (Figure 4-3) show that individual 2OV& , 2COV& , RER and EV&
measurements were nearly always over-estimated by the MM3B. Mean bias and 95%
limits of agreement for each variable were: 0.12 ± 0.32 L.min-1 ( 2OV& ); 0.27 ± 0.39
L.min-1 ( 2COV& ); 0.04 ± 0.08 (RER) and 2.63 ± 10.95 L.min-1 ( EV& ).

Chapter 4 - Validity of the MetaMax3B portable metabolic system
83
150 200 250 300 350 4002.0
2.5
3.0
3.5
4.0
4.5
5.0
5.5
MM3B Trial 1
MM3B Trial 2
MOUSe
VO2 (L.min
-1)
150 200 250 300 350 4002.0
2.5
3.0
3.5
4.0
4.5
5.0
5.5
6.0
6.5
MM3B Trial 1
MM3B Trial 2
MOUSe
VCO2 (L.min
-1)
150 200 250 300 350 4000.80
0.85
0.90
0.95
1.00
1.05
1.10
1.15
1.20
1.25
MM3B Trial 1
MM3B Trial 2
MOUSe
Power (W)
RER
150 200 250 300 350 40040
60
80
100
120
140
160
MM3B Trial 1
MM3B Trial 2
MOUSe
Power (W)
VE STPD (L.min
-1)
Figure 4-1: Oxygen consumption ( 2OV& ), carbon dioxide production ( 2COV& ),
respiratory exchange ratio (RER) and ventilation ( EV& ) as measured by the criterion
MOUSe system during the incremental rowing test, and by the MM3B during Trial 1
and Trial 2 of duplicate rowing tests. Values are means and standard deviations.

Chapter 4 - Validity of the MetaMax3B portable metabolic system
84
Table 4-3: Differences between MM3B results during each stage of the duplicate
incremental rowing tests (trial 2 - trial 1).
Mean (90% CI)
Measure Δ Stage 1 Stage 2 Stage 3 Stage 4 Maximum
2OV& Absolute 0.05 0.05 0.06 0.09 0.11
(L.min-1) (-0.04-0.14) (0.01-0.09) (-0.01-0.12) (-0.01-0.19) (0.02-0.21)
% 1.6 1.4 1.5 2.2 2.5
(-1.3-4.6) (0.2-2.6) (-0.3-3.2) (-0.3-4.7) (0.4-4.6)
Main effect: F 1,7 = 4.28, p = 0.08 a p = 0.06 b
TE (%) 2.3 (1.9-3.0) 2.0 (1.4-3.9)
2COV& Absolute 0.04 0.01 0.00 0.04 0.08
(L.min-1) (-0.07-0.15) (-0.09-0.11) (-0.09-0.09) (-0.06-0.14) (-0.06-0.21)
% 1.6 0.3 0.0 1.0 1.4
(-2.5-5.6) (-2.7-3.2) (-2.5-2.5) (-1.4-3.4) (-1.1-3.8)
Main effect: F 1,7 = 0.31, p = 0.60 a p = 0.31 b
TE (%) 3.0 (2.5-3.8) 2.6 (1.8-5.0)
RER Absolute 0.00 -0.01 -0.01 -0.01 -0.01
(-0.02-0.02) (-0.03-0.01) (-0.03-0.01) (-0.03-0.01) (-0.04-0.02)
% 0.0 -0.6 -0.9 -0.8 -0.9
(-2.4-2.4) (-3.2-1.9) (-3.2-1.4) (-3.1-1.4) (-3.6-1.7)
Main effect: F 1,7 = 0.23, p = 0.65 a p = 0.51 b
TE (%) 2.4 (2.0-3.1) 2.6 (1.8-5.0)
EV& Absolute 0.12 0.05 -0.83 1.28 3.39
(L.min-1) (-1.79-2.04) (-2.24-2.34) (-3.44-1.75) (-1.75-4.30) (-0.23-7.00)
% 0.2 0.1 -1.0 1.4 2.7
(-3.2-3.6) (3.3-3.4) (-4.3-2.2) (-1.9-4.6) (-0.2-5.5)
Main effect: F 1,7 = 0.03, p = 0.88 a p = 0.12 b
TE (%) 3.6 (3.0-4.6) 2.6 (1.8-5.1)
2OV& = oxygen consumption; 2COV& = carbon dioxide production; RER = respiratory exchange ratio;
EV& = ventilation; Absolute = between-trial error in raw units (trial 2-trial 1); % = between-trial error
expressed as a percentage of the mean (trial 2-trial 1); TE (%) = percent typical error for the
submaximal and maximal components of the rowing test as determined from repeated trials; a = result
of repeated measure 2 x 4 factorial ANOVA for submaximal data; b = result of dependent t-test for
maximal data.

Chapter 4 - Validity of the MetaMax3B portable metabolic system
85
1.5 2.5 3.5 4.5 5.5 6.5-0.40
-0.30
-0.20
-0.10
-0.00
0.10
0.20
0.30
0.40
0.50
0.60Stage 1
Stage 2
Stage 3
Stage 4
Maximal
R=0.30, p=0.06
SEE=0.11A
Mean VO2 (L.min-1)
VO2: Trial 2 - Trial 1 (L.min
-1)
1.5 2.5 3.5 4.5 5.5 6.5-0.50
-0.40
-0.30
-0.20
-0.10
-0.00
0.10
0.20
0.30
0.40
0.50
0.60R=-0.10, p=0.53
SEE=0.15
Stage 1
Stage 2
Stage 3
Stage 4
Maximal
Mean VCO2 (L.min-1)
VCO2: Trial 2 - Trial 1 (L.min-1) B
0.8 0.9 1.0 1.1 1.2 1.3-0.20
-0.15
-0.10
-0.05
-0.00
0.05
0.10
0.15
0.20R=0.00, p=0.99
SEE=0.04
Stage 1
Stage 2
Stage 3
Stage 4
Maximal
Mean RER (L.min -1)
RER: Trial 2 - Trial 1 (L.min
-1) C
30 50 70 90 110 130 150 170-15.0
-10.0
-5.0
0.0
5.0
10.0
15.0
R=0.27, p=0.10
SEE=3.92
Stage 1
Stage 2
Stage 3
Stage 4
Maximal
Mean VE (L.min-1)
VE: Trial 2 - Trial 1 (L.min
-1)
D
Figure 4-2: Bland-Altman plots of individual errors from duplicate MM3B trials
(Trial 2 - Trial 1) during each workload of the incremental rowing test for oxygen
consumption ( 2OV& ), carbon dioxide production ( 2COV& ), respiratory exchange ratio
(RER) and ventilation ( EV& ). Solid lines represent mean bias (pooled across all
workloads); dashed lines represent 95% limits of agreement.

Chapter 4 - Validity of the MetaMax3B portable metabolic system
86
Table 4-4: Differences between metabolic measurements from the criterion MOUSe
system and mean results from the two MM3B trials during each stage of the
incremental rowing tests (MM3B - MOUSe).
Mean (90% CI)
Measure Δ Stage 1 Stage 2 Stage 3 Stage 4 Maximum
2OV& Absolute 0.10 0.12* 0.13 0.16 0.13
(L.min-1) (0.02-0.18) (0.06-0.18) (-0.01-0.27) (0.02-0.30) (0.02-0.24)
% 3.5 3.7 3.6 4.1 2.8
(0.7-6.3) (1.8-5.6) (-0.3-7.5) (0.5-7.7) (0.5-5.1)
Main effect: F 1,7 = 7.44, p = 0.03 a p = 0.12 b
2COV& Absolute 0.18* 0.24† 0.26* 0.31* 0.32
(L.min-1) (0.09-0.27) (0.19-0.28) (0.12-0.39) (0.19-0.43) (0.09-0.55)
% 7.1 7.7 7.4 7.7 6.1
(3.7-10.5) (6.3-9.1) (3.6-11.2) (4.7-10.7) (1.7-10.5)
Main effect: F 1,7 = 55.6, p < 0.001 a p = 0.01 b
RER Absolute 0.03 0.04 0.04* 0.03 0.04
(0.00-0.06) (0.01-0.07) (0.02-0.06) (0.01-0.05) (-0.01-0.09)
% 3.7 3.9 3.7 3.4 3.5
(0.0-7.4) (1.5-6.3) (1.6-5.8) (1.1-5.7) (-0.6-7.6)
Main effect: F 1,7 = 10.70 , p = 0.01 a p = 0.02 b
EV& Absolute 2.34 3.22 1.95 3.22 0.59
(L.min-1) (-1.90-5.68) (-0.18-6.62) (-1.49-5.39) (-0.30-6.74) (-4.77-5.95)
% 4.3 4.9 2.5 3.6 0.5
(-3.5-12.1) (-0.3-10.1) (-1.9-6.9) (-0.3-7.5) (-3.7-4.7)
Main effect: F 1,7 = 2.29 , p = 0.17 a p = 0.37 b
2OV& = oxygen consumption; 2COV& = carbon dioxide production; RER = respiratory exchange ratio;
EV& = ventilation; Absolute = error of MM3B measurements in raw units (MM3B-MOUSe); % =
error of MM3B measurements expressed as a percentage of the MOUSe result (MM3B-MOUSe); a =
result of repeated measure 2 x 4 factorial ANOVA for submaximal data; b = result of dependent t-test
for maximal data; * = post-hoc statistically significant difference (Holm-Bonferoni adjusted alpha
level; p≤0.01); † = post-hoc statistically significant difference (Holm-Bonferoni adjusted alpha level;
p≤0.001).

Chapter 4 - Validity of the MetaMax3B portable metabolic system
87
1.5 2.5 3.5 4.5 5.5 6.5-0.40
-0.30
-0.20
-0.10
-0.00
0.10
0.20
0.30
0.40
0.50
0.60Stage 1
Stage 2
Stage 3
Stage 4
Maximal
R=0.33, p=0.04
SEE=0.15A
MOUSe VO2 (L.min-1)
VO2: MM3B - MOUSe (L.min
-1)
1.5 2.5 3.5 4.5 5.5 6.5-0.20
-0.10
0.00
0.10
0.20
0.30
0.40
0.50
0.60
0.70
0.80R=0.46, p<0.01
SEE=0.17
Stage 1
Stage 2
Stage 3
Stage 4
Maximal
MOUSe VCO2 (L.min-1)
VCO2: MM3B - MOUSe (L.min-1) B
0.8 0.9 1.0 1.1 1.2 1.3-0.10
-0.05
0.00
0.05
0.10
0.15
0.20R=-0.17, p=0.31
SEE=0.04
Stage 1
Stage 2
Stage 3
Stage 4
Maximal
MOUSe RER (L.min -1)
RER: MM3B - MOUSe (L.min
-1) C
30 50 70 90 110 130 150 170-15.0
-10.0
-5.0
0.0
5.0
10.0
15.0
20.0R=-0.02, p=0.89
SEE=5.48
Stage 1
Stage 2
Stage 3
Stage 4
Maximal
MOUse VE (L.min-1)
VE: MM3B - MOUSe (L.min
-1)
D
Figure 4-3: Bland-Altman plots of individual errors (MM3B - MOUSe) from each
of the workloads during the incremental rowing test for oxygen consumption ( 2OV& ),
carbon dioxide production ( 2COV& ), respiratory exchange ratio (RER) and
ventilation ( EV& ). Solid lines represent mean bias (pooled across all workloads);
dashed lines represent 95% limits of agreement.
Chapter 4 - Validity of the MetaMax3B portable metabolic system
88
4.4 DISCUSSIO�
In the current study, the MM3B overestimated 2OV& , 2COV& and EV& by ~4%, 7%
and 4%, respectively, compared with the criterion of an automated Douglas bag
system, and therefore displayed similar accuracy to other current designs of portable
metabolic systems. While our accuracy and reliability evaluations using biological
trials would ideally have involved simultaneous measurements from the MM3B and
our criterion MOUSe system, previous investigations that have attempted this
approach have often reported that interference between the two test systems has
resulted in spurious measurements (Duffield et al. 2004; Crouter et al. 2006). We
therefore conducted biological testing using separate trials that were closely matched
for power output, and included duplicate comparisons using a metabolic calibrator to
eliminate the between-day biological variation that is inherent to human subjects. In
combination with error from technical sources, between-day biological variation has
previously been estimated to be 3-4% for 2OV& (Stuart et al. 1981; Armstrong and
Costill 1985; Vogler et al. 2007) and EV& (Armstrong and Costill 1985). While there
is also some known uncertainty regarding the precision of individual simulations
with the metabolic calibrator, deviations from the target values were estimated to be
smaller ( EV& ), or at the lower end of the range estimated for between-day variations
( 2OV& ). So although the metabolic calibrator removes the potential for between-trial
and between-system differences due to biological variation, both our evaluation
methods leave some uncertainty regarding the degree to which the observed
differences can be attributed to technical error from the MM3B alone. There was also
potential for differences to result from true between-trial variations in workload; but
these are likely to be minimal as subjects’ were able to reproduce their efforts to
within 1W during submaximal workloads and 4 W during the maximal performance
trials.
4.4.1 Reliability of repeated MM3B measurements
One of the main findings of this study is that the MM3B provides reliable
measurements for 2OV& , 2COV& , RER and EV& . The TE results displayed in Table 4-
3 for the MM3B are superior to those reported in the methods section for the
criterion MOUSe system. While the confidence limits were rather broad given our
small sample size (n=8), between-trial effects still displayed strong likelihoods for

Chapter 4 - Validity of the MetaMax3B portable metabolic system
89
trivial differences for almost every comparison when MOUSe reliability
characteristics were the reference for SWC. So although there is some uncertainty as
to whether TE results from the MM3B are actually superior to the MOUSe, our
‘trivial-difference’ findings indicate that the reliability of the MM3B is comparable
to that of the automated Douglas bag system that has been in use at the AIS for over
10 years. Additionally, mean between-trial differences from our evaluation using
simulated metabolic outputs were in close agreement with those from biological
testing when expressed as percent error, which also confirms the reproducibility of
MM3B measurements. While we have reported TE as our main indication of
reliability, other investigations have reported technical error of measurement
(Duffield et al. 2004), coefficient of variation (Crouter et al. 2006), intra-class
correlation coefficient (Kawakami et al. 1992; Meyer et al. 2001; Duffield et al.
2004) or mean bias ± 95% limits of agreement (Meyer et al. 2001; Duffield et al.
2004). On this latter basis, it is possible to compare our results for the MM3B
portable system with the Cosmed K4b2 (Duffield et al. 2004), Medical Graphics
VO2000 (Crouter et al. 2006) and MetaMax I (Meyer et al. 2001). Mean bias ± 95%
limits of agreement have been reported for the K4b2 during repeated treadmill
running tests, between-trial differences were 0.08 ± 0.82 L.min-1 ( 2OV& ), 0.06 ± 0.67
L.min-1 ( 2COV& ) and 1.27 ± 16.3 L.min-1 (VE; Duffield et al. 2004). Reliability
results for the same variables measured by the VO2000 system were 0.04 ± 0.37
L.min-1, 0.04 ± 0.38 L.min-1 and 1.22 ± 11.05 L.min-1 (Crouter et al. 2006). Mean
differences were similar for the MM3B (0.07, 0.03 and 0.74 L.min-1 for 2OV& ,
2COV& and EV& , respectively), although 95% confidence limits were tighter during
our evaluation (0.23, 0.30 and 8.12 L.min-1, respectively). Our results are also very
similar to those reported for the earlier MetaMax I model also manufactured by
Cortex. In this instance, Meyer et al. (2001) reports that 95% limits of agreement for
between-trial differences are within 0.30 L.min-1 for 2OV& and 2COV& , and 9 L.min-1
for EV& , which compares to 0.33 L.min-1 ( 2OV& and 2COV& ) and 8.86 L.min-1 ( EV& )
in the current study. The MM3B therefore displays good reliability compared with
other portable metabolic systems.
4.4.2 Accuracy of the MM3B compared with an automated Douglas bag
system (MOUSe)
Comparisons between measurements from the MM3B and predicted metabolic

Chapter 4 - Validity of the MetaMax3B portable metabolic system
90
outputs from the metabolic calibrator show that EV& measurements were within 4%
of the target value across the physiological range, although 2OV& and 2COV& were
more variable with differences ranging -3% to 8% and -1% to 10%, respectively.
While values within 4% of the target may be considered acceptable given some
uncertainty regarding the true value of metabolic simulations, some 2OV& and 2COV&
measurements were clearly outside this range. It is interesting to note that the
observed errors in gas fractions and EV& do not necessarily affect 2OV& and 2COV&
as may be expected according to estimations provided by Withers et al. (2000),
where 0.10% and 1% errors in gas fractions and EV& result in 3% and 1% errors for
2OV& and 2COV& , respectively. However, as the largest discrepancies between gas
fraction values occurred for simulations of the outer physiological range for O2
extraction and CO2 excretion (metabolic calibrator setting 1; Table 4-2), the accuracy
of MM3B gas fraction measurements may have been impaired as these gas
concentrations were at the limit of the range used during calibration of the MM3B’s
gas analysers (16.05% O2 and 4.99% CO2). Despite this, 2OV& measurements were
with within 4% of target values for three of the five evaluated metabolic outputs,
although 2COV& results fell within this range for only two of the simulations. As a
result of these variations, RER values also differed from the 1.00 target. The
substantial changes in 2OV& from 3% under to 8% over the target values more likely
reflects changes consequent to re-calibration of the MM3B, rather than true
fluctuations in the metabolic calibrator. The magnitude of such variations reinforces
the critical importance of careful and consistent MM3B calibration and the need to
check the gas analysers for drift immediately after testing.
While the accuracy of the MM3B seemed impaired when sampling gas fractions
from the outer physiological range during metabolic simulations, accuracy results
compared with the MOUSe were relatively consistent across the workloads tested
during biological trials (Table 4-4). Although FEO2 and FECO2 were not considered
during biological testing because 2OV& and 2COV& results were of more practical
interest, the consistency of 2OV& and 2COV& errors under these circumstances
(approximately 3-4% and 6-8%, respectively) suggests that changes in FEO2 and
FECO2 across increasing workloads had less impact during biological testing.
Excepting the trend for larger 2OV& and 2COV& errors from outer-limit O2 and CO2

Chapter 4 - Validity of the MetaMax3B portable metabolic system
91
expired gas fractions during simulated testing, biological trials and metabolic
simulations both confirmed that the MM3B measures higher values for EV& , 2OV& ,
2COV& and RER compared to both our criterion indirect calorimetry systems. During
biological testing, 2OV& was significantly higher during Stage 2, as was RER during
Stage 3 and the maximal performance trial; 2COV& was significantly higher during
all workloads. However, effect size analyses indicated that the between-system
differences in submaximal 2OV& were greater than those anticipated from normal
between-day variation as estimated by the reliability of the MOUSe system, and were
therefore likely to result from error in MM3B measurements. RER and 2COV& were
also substantially higher across the submaximal workloads and maximal performance
trial. It therefore follows that data derived with a MM3B system are likely to be
inaccurate compared with data from a carefully calibrated laboratory-based indirect
calorimetry system, and this result is not too surprising given the challenges inherent
in miniaturisation.
The differences observed in the present investigation are similar to those reported for
other portable metabolic systems that have been validated against the Douglas bag
method or another laboratory-based criterion system. McLaughlin et al. (2001)
examined the accuracy of the Cosmed K4b2 relative to Douglas bag measurements
during duplicate submaximal cycle ergometer tests (50-200 W) and reported mean
bias ± 95% limits of agreement (estimated from a Bland-Altman plot) were 0.10 ±
0.23 L.min-1 ( 2OV& ), 0.10 ± 0.34 L.min-1 ( 2COV& ) and 2.00 ± 7.50 L.min-1 ( EV& ).
Duffield et al. (2004) compared a Cosmed K4b2 with a custom-designed metabolic
cart and obtained considerably larger mean errors for 2OV& and 2COV& with
overestimations ranging 0.45-0.60 L.min-1 (criterion values: 2.80-4.09 L.min-1) and
0.32-0.57 L.min-1 (criterion values: 2.38-4.59 L.min-1). The accuracy of the Medical
Graphics VO2000 system has also been validated against the Douglas bag for
workloads between 50-250 W, for this device mean bias ± 95% limits of agreement
are -0.11 ± 0.43 L.min-1, -0.06 ± 0.38 L.min-1 and 1.54 ± 6.93 L.min-1 for 2OV& ,
2COV& and EV& , respectively (Crouter et al. 2006). Thus, the accuracy of our MM3B
2OV& measurements are similar to those from the VO2000 (Crouter et al. 2006) and
the K4b2 evaluation by McLaughlin et al. (2001). However, our mean error for
2COV& (0.27 L.min-1) was higher compared to these evaluations, although the

Chapter 4 - Validity of the MetaMax3B portable metabolic system
92
corresponding 95% confidence limits (± 0.39 L.min-1) were similar (Crouter et al.
2001; McLaughlin et al. 2001), thereby showing that errors were at least equally as
consistent. The magnitude of the 2COV& errors for the MM3B are in contrast to those
from the Cortex MetaMax II model, where mean bias and 95% limits of agreement
compared to Douglas bag results were -0.08 ± 0.33 L.min-1 (Larsson et al. 2004).
Indeed, 2OV& (0.04 ± 0.22 L.min-1) and EV& (1.90 ± 5.90 L.min-1) measurements
were also more accurate for the MetaMax II, although measurements for both
systems were successfully conducted simultaneously, which will eliminate biological
sources of variation compared to evaluations conducted on separate days. Mean error
results for MM3B EV& measurements were also similar to the other portable devices
although confidence limits (± 10.95 L.min-1) were higher. This may be partially
explained by our protocol, which included maximal intensity exercise, and by the
mode of exercise, given that rowing stroke can impact on EV& (Steinacker et al.
1993a).
Given the complexity of the movement patterns during the rowing stroke, the study
also considered the practical suitability of the MM3B for rowing applications. While
the connections between the base module and volume turbine assembly had the
potential to interfere with the rower’s hand movements during the stroke cycle when
the MM3B was worn in the standard configuration with the system harnessed to the
chest, the problem was easily overcome when the harness was reversed so the
MM3B was worn on the back. The only drawback to this approach was that the
connections between the volume turbine assembly and base module limited head
movement in one direction, which could potentially limit vision during on-water
rowing as athletes sometimes need to turn their head both ways in order to check
their course. Despite this, all subjects reported that the reverse-harness set-up did not
interfere with their rowing technique and that they would be confident to use the
system during on-water rowing. However, any capsize on-water would have
disastrous consequences for the electronics of the MM3B.

Chapter 4 - Validity of the MetaMax3B portable metabolic system
93
4.5 CO�CLUSIO�S
Overall, the MM3B overestimated 2OV& , 2COV& and EV& by approximately 4%, 7%
and 4%, respectively, compared with the criterion of an automated Douglas bag
system, although duplicate trials of the MM3B on an metabolic calibrator varied by
~±5%. These results suggest that MM3B measurements are not perfectly comparable
with our criterion system but, on average, the portable metabolic system provided a
satisfactory indication (~±5%) of the actual metabolic demands of an activity and
displayed a similar degree of accuracy to other current designs of portable metabolic
system. On the other hand, the MM3B yielded excellent reproducibility, with TE
results of 2-3% for 2OV& , 2COV& and EV& . Furthermore, as the current TE results are
similar to those previously determined for our automatic Douglas bag system, both
systems could conceivably monitor longitudinal aerobic fitness changes equally well.
Assuming these laboratory-based results translate directly to the field environment,
the MM3B has potential as a useful field testing device for rowing and other sport-
specific applications.

Chapter 5 - Comparison of ergometer and on-water incremental rowing tests
94 94
CHAPTER 5
COMPARISON OF ERGOMETER AND ON-
WATER INCREMENTAL ROWING TESTS
5.1 I�TRODUCTIO�
Laboratory-based ergometer testing has been used extensively by the rowing
community to measure training related changes in fitness traits and prescribe
submaximal training intensities that can be applied to training on and off the water.
Specifically, sport scientists use blood lactate (BLa)-power output and heart rate
(HR)-BLa relationships obtained from laboratory testing so that the HR
corresponding to the blood lactate threshold can be used to prescribe individualised
on-water training intensities (Urhausen et al. 1993b). In recent years, it appears that
the intended transfer of data from laboratory-based tests to the field environment has
not been used by many coaches because the relevance and specificity of the
ergometer based testing has been challenged with regard to on-water rowing
(unpublished personal observation).
A variety of methods have previously been used to evaluate the specificity of
ergometer rowing with respect to the criterion of on-water performance. Kinematic
analyses suggest that movement patterns differ between the two modes of rowing
(Martindale and Robertson 1984; Lamb 1989) and that the interaction between the
rower’s body mass and the rowing device (either ergometer or boat shell) contributes
to this (Martindale and Robertson 1984). Similarly, investigations addressing rowing
mechanics suggest that stroke timing and consistency also differ (Smith et al. 1993;
Dawson et al. 1998; Elliott et al. 2002). While these studies have investigated
isolated aspects of the rowing stroke, comparisons have also been made according to
performance outcomes. Spearman rank order correlations between 2000-m rowing
performance during ergometer time-trials and competitive rowing are strong and
suggest an association between factors contributing to time-trial performance under
either condition (Ryan-Tanner et al. 1999a). Thus, the conclusions from these studies

Chapter 5 - Comparison of ergometer and on-water incremental rowing tests
95 95
have been equivocal, either supporting that ergometer and on-water rowing are
equivalent (Martindale and Robertson 1984; Lamb 1989; Ryan-Tanner et al. 1999a),
or that the differences are substantial (Smith et al. 1993; Dawson et al. 1998; Elliott
et al. 2002). Physiological differences are also apparent when on-water and
ergometer rowing are compared. Payne et al. (1996) concluded that differences in
physiological responses between the two modalities may be the result of
biomechanical variations between the two conditions. Of the variables considered in
the literature, HR and BLa have been most commonly addressed. HR is generally
reported to be higher on-water (Urhausen et al. 1993b; Ryan-Tanner et al. 1999b),
although Steinacker et al. (1987) suggested that ergometer performance elicits a
higher HR. Conversely, maximal BLa is higher during ergometer rowing (Urhausen
et al. 1993b; Ryan-Tanner et al. 1999b), possibly by as much as 35% (Ryan-Tanner
et al. 1999b). Other measured variables include catecholamines (Urhausen et al.
1993b), which are higher during ergometer performance, and maximal oxygen
consumption ( 2OV& max), which was within 3% between ergometer and on-water tests
(Chènier and Leger 1991). Given the potential for biomechanical differences
between the two performance scenarios and the resulting variations in physiological
responses, ergometer-based rowing tests may not be adequately representative of on-
water rowing to accurately prescribe on-water training intensities. Thus, formalised
on-water tests may improve the specificity of physiological assessments for rowing
and improve the association between test results and the subsequent training
recommendations.
While on-water rowing tests have been successfully conducted (Steinacker et al.
1987; Payne et al. 1996; Coen et al. 2003), the dynamic nature of environmental
conditions means that accurate and reliable testing on-water is difficult when
attempting to standardise workloads within and between sessions (Steinacker et al.
1987; Coen et al. 2003). Factors such as wind direction and velocity can potentially
change during an effort and have a substantial impact on boat velocity. So, although
rowing velocity is a key determinant of on-water performance, environmental
influences mean it is virtually unusable as an independent variable for monitoring the
responses to a given training workload. Also, substantial variation in stroke rate (SR;
Smith et al. 1993) and HR (Urhausen et al. 1993b) between field and laboratory
conditions limits the effectiveness of these parameters as independent variables for
prescribing intensity during on-water work. The best independent measure of work is

Chapter 5 - Comparison of ergometer and on-water incremental rowing tests
96 96
therefore the power output exerted by the rower to propel the boat in a forward
direction. In Australia, a commercially available rowing biomechanics system
(WEBA Sport Rower Expert Light; Wien, Austria) is sometimes used to provide
routine feedback to coaches and athletes regarding biomechanical parameters that are
known to influence rowing performance. As the WEBA Sport system (WEBA; Plate
5-1) allows rowing power output to be measured, it is ideal to monitor workloads
during routine training or on-water testing. Furthermore, oxygen consumption
( 2OV& ) data from a portable indirect calorimetry system (Cortex MetaMax 3B;
MM3B, Leipzig, Germany) allows assessments of metabolic load to accompany
power measurements, thereby providing further information about the reproducibility
of on-water workloads and the relationship between on-water and ergometer
assessments.
The availability of new technology which has already been shown to be reliable (in
the case of the MM3B; Chapter 4) that can be directly applied to rowing means that
measurements that were previously only available in the laboratory are now possible
in the field, thereby allowing a standardised test protocol to be replicated on-water.
Thus, the aims of the current investigation were: a) to evaluate the feasibility of an
on-water rowing protocol based upon a standardised ergometer test; b) compare the
physiological responses between on-water and ergometer tests in order to determine
the validity of ergometer-based physiological assessments; and c) to establish the
reliability of measures obtained in the field compared with the laboratory.

Chapter 5 - Comparison of ergometer and on-water incremental rowing tests
97 97
Plate 5-1: The WEBA Sport biomechanics system, including a close-up of the
instrumented oarlock used to measure handle force and oar angle (inset). Adapted
from www.weba-sport.com/weba/rowx_outdoor.

Chapter 5 - Comparison of ergometer and on-water incremental rowing tests
98 98
5.2 METHODS
5.2.1 Subjects
Seven male heavyweight rowers provided written informed consent to participate in
this investigation; all athletes were competing at a national level in the Under 23 or
Open categories. The subjects’ physical characteristics are described in Table 5-1.
All biological testing procedures were approved by the AIS Human Ethics
Committee and the Flinders University Clinical Research Ethics Committee.
5.2.2 Experimental protocol
Each rower completed four sessions (2 x laboratory and 2 x on-water) during a 5-d
rowing camp. The two laboratory sessions were conducted at the AIS Physiology
Laboratory while the two on-water sessions were undertaken on Lake Burley Griffin
(Canberra, Australia), which is a still-water lake that features a buoyed 1800-m
rowing course. Plate 5-2 displays a rower during an on-water testing session. As data
were collected during two separate camps, data sets from both occasions have been
included in the analyses for one subject who attended both camps, thereby increasing
the total number of experimental observations to n=8. Testing was conducted under
fair weather conditions during late autumn and early spring; mean (SD) temperatures
were 20.1 (1.3) °C and 16.4 (4.6) °C during the laboratory and on-water sessions,
respectively.
Two laboratory tests completed on a Concept 2D ergometer (ERG) were conducted
to permit 2OV& measurements with both the standard laboratory metabolic cart
(MOUSe; AIS, Canberra, Australia; Vogler et al. 2007) and the MetaMax portable
metabolic system (MM3B) described previously (Chapter 4). The MM3B was also
used for duplicate on-water tests (OW). The order of the ERG trials was
counterbalanced so that half the participants completed their first trial using the
MOUSe for 2OV& measurements, and half using the MM3B. But as an ERG test
needed to be completed first in order to determine specific workloads for the
subsequent OW tests, this aspect of the experimental protocol was not
counterbalanced.
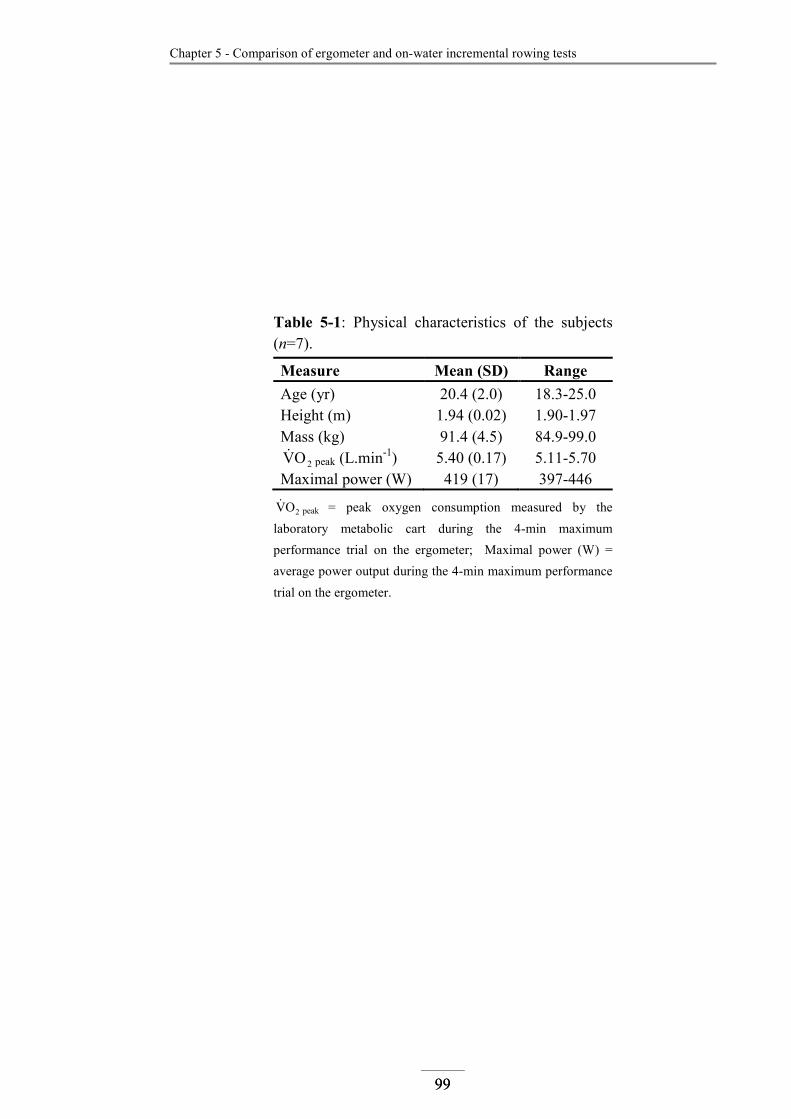
Chapter 5 - Comparison of ergometer and on-water incremental rowing tests
99 99
Table 5-1: Physical characteristics of the subjects
(n=7).
Measure Mean (SD) Range
Age (yr) 20.4 (2.0) 18.3-25.0
Height (m) 1.94 (0.02) 1.90-1.97
Mass (kg) 91.4 (4.5) 84.9-99.0
2OV& peak (L.min-1) 5.40 (0.17) 5.11-5.70
Maximal power (W) 419 (17) 397-446
2OV& peak = peak oxygen consumption measured by the
laboratory metabolic cart during the 4-min maximum
performance trial on the ergometer; Maximal power (W) =
average power output during the 4-min maximum performance
trial on the ergometer.

Chapter 5 - Comparison of ergometer and on-water incremental rowing tests
100 100
Plate 5-2: A rower undertaking an on-water test on the Lake Burley Griffin rowing
course.
Chapter 5 - Comparison of ergometer and on-water incremental rowing tests
101 101
Laboratory test protocol
The laboratory step-test protocol was an abbreviated version of the standard 7-stage
protocol currently used for testing Australian rowers. Subjects presented to the
laboratory well rested and having refrained from intense exercise for the previous
24h. Upon arrival, subjects weighed-in wearing a rowing suit only and were fitted
with a Polar HR monitor (Polar S810i, Kempele, Finland). Prior to the test, a resting
BLa measurement (Lactate Pro, Arkray, Japan) was obtained from a capillary blood
sample drawn from an earlobe. The incremental exercise protocol consisted of five
submaximal workloads and one maximal effort on a Concept2 Model D rowing
ergometer (Concept2, Morrisville, USA); each workload was 4-min in duration. As
all rowers were heavyweight males, the Concept2 drag factor was standardised at
130. Submaximal workloads were controlled by target power outputs and increased
35 W each stage from 140 W to 280 W. Recovery periods were provided between
workloads and were extended from the standard 1-min interval to 2-min intervals in
order to match the time required during the OW protocol to collect bloods and
manoeuvre the rower’s boat. At the completion of the fifth workload a 5-min
recovery was provided before the final 4-min maximal stage. 2OV& (MOUSe or
MM3B) and HR were monitored throughout each test. For all tests, mean 2OV&
results were recorded from steady-state conditions achieved during the final 2-min of
each ERG and OW workload. BLa was sampled at the completion of each
submaximal stage, immediately following the maximal stage and 4-min after the
finish of the maximal stage. Average SR, average power output and distance
completed were also obtained from the ergometer monitor unit during the 2-min
recovery period. A rating of perceived exertion (RPE, Borg 15-point scale; Borg
1973) for the previous workload was also ascertained at this time.
On-water test protocol
The on-water rowing step test protocol was designed to replicate the laboratory
protocol as closely as possible and therefore also comprised 5 x 4-min submaximal
stages and 1 x 4-min maximal performance trial. Prior to testing, a single scull
(Sykes Racing, Geelong, Australia) was instrumented with a WEBA rowing
biomechanics system to determine the power output achieved during each
incremental stage of the OW protocol. The WEBA system was installed in
accordance with the set-up shown in Plate 5-1 (p. 97). Force sensors were calibrated
by the manufacturer, while the gate angle sensors were calibrated at known points

Chapter 5 - Comparison of ergometer and on-water incremental rowing tests
102 102
throughout the expected range of a rowing stroke prior to each test. As rowing power
output could not be displayed in ‘real-time’, SR and RPE were used to control the
workload progression. Rowers were therefore instructed to increase SR by 2
strokes.min-1 each stage across a range of 14-24 strokes.min-1; additionally, a RPE
intensity was also prescribed for each stage that corresponded to the value obtained
for the equivalent stage during the ERG laboratory test. Average SR and distance
covered were obtained using a MiniMaxX (Catapult Innovations, Scoresby,
Australia) GPS/accelerometer data acquisition system. Workloads were separated by
2-min recovery periods, during which a BLa sample was obtained from the finger-tip
(which was more readily accessible compared with the earlobe) and the rower turned
the boat 180º in readiness for the start of the next stage. 2OV& was measured
continuously by the MM3B throughout the protocol; the MM3B also logged HR data
from the Polar HR monitor. RPE for the previous increment was also obtained during
the 2-min recovery to determine whether the target value was achieved. Similar to
the laboratory test, rowers were provided with a 5-min recovery prior to the 4-min
maximal stage and were instructed to row as far as possible, and to ensure they
provided a maximal effort for the entire duration.
As one ERG trial used the MM3B for 2OV& assessments, the 2OV& data from this trial
were compared directly with the MM3B results measured during the OW test;
comparisons between ERG and OW tests therefore always used data from the ERG
trial conducted with the MM3B. Thus, when ERG Trial 1 used the MM3B, between-
location comparisons paired all data from this trial with OW Trial 1; similarly, when
ERG Trial 2 used the MM3B, ERG data were paired with OW Trial 2.
Blood lactate thresholds
Automated software (ADAPT; AIS, Canberra, Australia) determined lactate
thresholds from the BLa-power output relationship established during the ERG and
OW tests using third order polynomial regression. Lactate threshold 1 (LT1; aerobic
threshold) was defined as the point at which BLa began to increase (0.2 mmol.L-1)
above resting levels. An increase of 0.2 mmol.L-1 was used as this corresponds to the
typical error (TE) of BLa measurements in the range of 1.0-2.0 mmol.L-1, which is
based on a TE of 14.3% for submaximal BLa measurements (Table 3-4, p. 59) and
the typical range of BLa at LT1 (Table 3-3, p. 57). Lactate threshold 2 (LT2;
anaerobic threshold, AT) was defined as the point on the polynomial regression

Chapter 5 - Comparison of ergometer and on-water incremental rowing tests
103 103
curve that yielded the maximum perpendicular distance to the straight line formed by
joining LT1 and peak BLa (modified Dmax; Bishop et al. 1998). HR, power output
and 2OV& at LT1 and LT2 were subsequently determined using ADAPT.
5.2.3 Data treatment
The mean power outputs during each stage of the ERG and OW tests were not
identical (Figure 5-1) because the OW submaximal workloads were controlled by the
athlete attempting to match target SR and RPE values. Consequently, the resulting
OW power outputs were different from the fixed target power outputs of the ERG
test, and hence, the submaximal response variables (e.g. BLa, HR and 2OV& ; Figure
5-2) could not be directly compared between each stage of the ERG and OW tests.
However, as each of the response variables were strongly related to power output
during the ERG and OW tests (Table 5-2), regression analyses were used to
normalise the data so that comparisons between each stage of the ERG and OW tests
both used similar power outputs. The normalised power outputs were selected to
correspond to the target power outputs of the ERG tests: 140, 175, 210, 245 and 280
W; these five power outputs were designated as ‘standard power outputs’.
Relationships between power output and selected physiological variables (i.e HR,
Bla) were established for each of the rowers based on individual submaximal results,
and regression analyses used to calculate values for each of the measured variables at
intensities corresponding to the five standard power outputs. This normalisation
procedure was applied to the submaximal data from both the ERG and OW tests, in
order to compare the effect of test modality at power outputs that were assumed to be
equivalent. The procedure was also used for both OW trials so that the between-OW
trial reproducibility could be determined for each of the response variables based on
equivalent power outputs.
Given the potential for differences between power output measurements from the
Concept2 ergometer and the WEBA, the assumption of equivalent power output
measurements from these two devices – which is central to the power normalisation
treatment - was also assessed. Concept2 and WEBA power outputs were therefore
normalised using the power output- 2OV& relationship established from group results
using raw submaximal data, thereby allowing power outputs to be compared between
devices at equivalent 2OV& intensities. Thus, linear regression was used to calculate

Chapter 5 - Comparison of ergometer and on-water incremental rowing tests
104 104
1 2 3 4 5 Max0
50
100
150
200
250
300
350
400
450 ERG
OW
Test stage
Power output (W)
Figure 5-1: Mean power output during submaximal and maximal workloads for the
ergometer (ERG) and on-water (OW) incremental tests. Error bars denote ± 1 SD.

Chapter 5 - Comparison of ergometer and on-water incremental rowing tests
105 105
100 150 200 250 300 350 400 4500.0
2.0
4.0
6.0
8.0
10.0
12.0
14.0
16.0A
BLa (mmol.L-1)
100 150 200 250 300 350 400 450100
120
140
160
180
200
220B
HR (beats.min-1)
100 150 200 250 300 350 400 4502.5
3.0
3.5
4.0
4.5
5.0
5.5
6.0
6.5C
ERG OW
Power output (W)
VO2 (L.min-1)
Figure 5-2: Mean results for A) blood lactate (BLa), B) heart rate (HR) and C)
oxygen consumption ( 2OV& ) using untreated data that does not account for the
differences in submaximal workloads between ergometer (ERG) and on-water (OW)
incremental rowing tests. Error bars denote ± 1 SD.
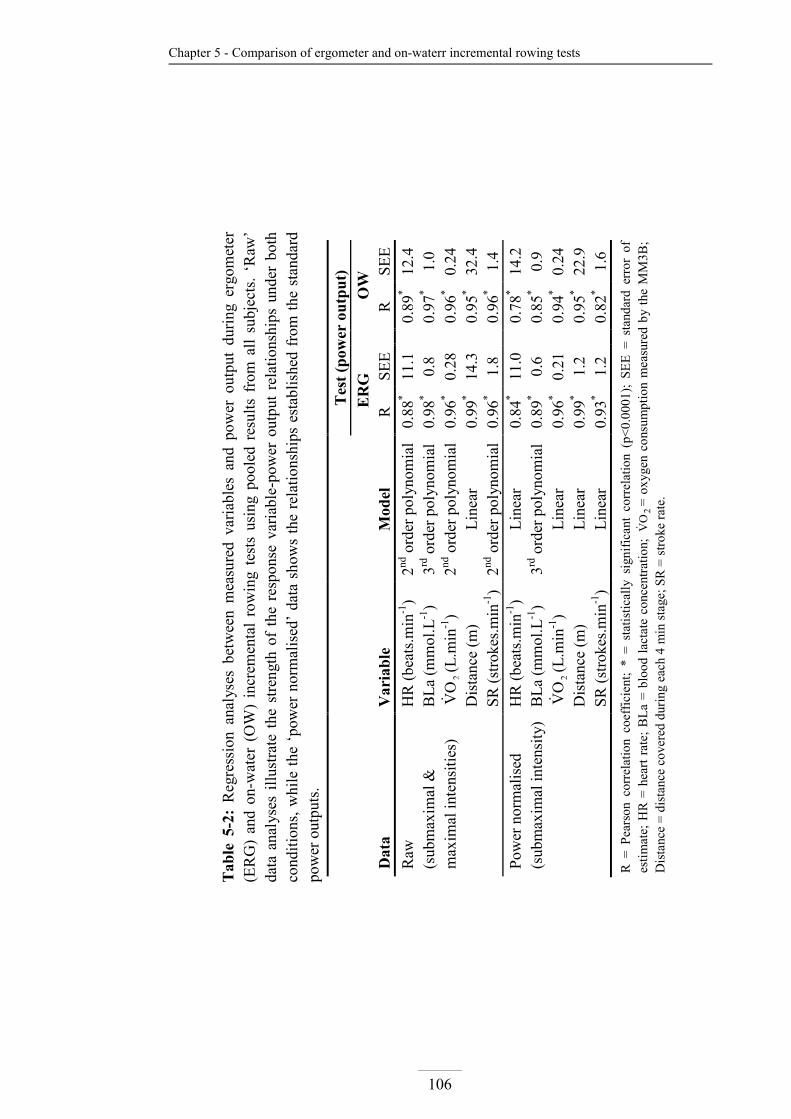
Chapter 5 - Comparison of ergometer and on-waterr incremental rowing tests
106
Tab
le 5
-2:
Reg
ress
ion
anal
yses
bet
wee
n m
easu
red
vari
able
s an
d po
wer
out
put
duri
ng e
rgom
eter
(ER
G)
and
on-w
ater
(O
W)
incr
emen
tal
row
ing
test
s us
ing
pool
ed r
esul
ts f
rom
all
sub
ject
s. ‘
Raw
’
data
ana
lyse
s il
lust
rate
the
str
engt
h of
the
res
pons
e va
riab
le-p
ower
out
put
rela
tion
ship
s un
der
both
cond
itio
ns,
whi
le t
he ‘
pow
er n
orm
alis
ed’
data
sho
ws
the
rela
tion
ship
s es
tabl
ishe
d fr
om t
he s
tand
ard
pow
er o
utpu
ts.
Tes
t (p
ow
er o
utp
ut)
E
RG
OW
Data
V
ari
ab
le
Mod
el
R
SE
E
R
S
EE
Raw
H
R (
beat
s.m
in-1
) 2nd
ord
er p
olyn
omia
l 0.
88*
11.1
0.89
* 12
.4
(sub
max
imal
&
BL
a (m
mol
.L-1
) 3rd
ord
er p
olyn
omia
l 0.
98*
0.8
0.
97*
1.0
max
imal
int
ensi
ties
) 2
OV&
(L.m
in-1
) 2nd
ord
er p
olyn
omia
l 0.
96*
0.28
0.96
* 0.
24
D
ista
nce
(m)
Lin
ear
0.99
* 14
.3
0.
95*
32.4
S
R (
stro
kes.
min
-1)
2nd o
rder
pol
ynom
ial
0.96
* 1.
8
0.96
* 1.
4
Pow
er n
orm
alis
ed
HR
(be
ats.
min
-1)
Lin
ear
0.84
* 11
.0
0.
78*
14.2
(sub
max
imal
int
ensi
ty)
BL
a (m
mol
.L-1
) 3rd
ord
er p
olyn
omia
l 0.
89*
0.6
0.
85*
0.9
2
OV&
(L.m
in-1
) L
inea
r 0.
96*
0.21
0.94
* 0.
24
D
ista
nce
(m)
Lin
ear
0.99
* 1.
2
0.95
* 22
.9
S
R (
stro
kes.
min
-1)
Lin
ear
0.93
* 1.
2
0.82
* 1.
6
R =
Pea
rson
cor
rela
tion
coe
ffic
ient
; *
= s
tati
stic
ally
sig
nifi
cant
cor
rela
tion
(p<
0.00
01);
SE
E =
sta
ndar
d er
ror
of
esti
mat
e; H
R =
hea
rt r
ate;
BL
a =
blo
od l
acta
te c
once
ntra
tion
; 2
OV&
= o
xyge
n co
nsum
ptio
n m
easu
red
by t
he M
M3B
; D
ista
nce
= d
ista
nce
cove
red
duri
ng e
ach
4 m
in s
tage
; S
R =
str
oke
rate
.

Chapter 5 - Comparison of ergometer and on-water incremental rowing tests
107
Concept2 and WEBA power outputs corresponding to five 2OV& intensities that
evenly spanned the observed submaximal range: 2.75, 3.25, 3.75, 4.25 and 4.75
L.min-1. While HR and BLa were also measured during both tests and could
therefore have been used as the basis of our normalisation treatment, 2OV& data were
the least variable. As the calculation of Concept2 and WEBA power outputs at
equivalent 2OV& intensities was dependent on the reproducibility of the 2OV&
measurements, it was critical that between-test 2OV& variation was minimal. Thus,
2OV& measurements were obtained using the MM3B system under ERG and OW
conditions, and our previous evaluation of the MM3B had shown that
themeasurements from this system were reliable; TE for submaximal 2OV& = 2.3%,
90% confidence interval=1.9-3.0%; Chapter 4.
5.2.4 Statistical analyses
To validate the laboratory test against the criterion of on-water performance, lactate
thresholds and normalised physiological responses to the progressive incremental
tests at the standard power outputs were compared according to test modality (ERG
vs. OW). Additionally, between-trial results (Trial 1 vs. Trial 2) from the OW tests
were examined to establish the reproducibility of duplicate OW measures. For both
comparisons, submaximal data were analysed using 2 (test) x 5 (stage) factorial
ANOVAs with repeated measures on both dimensions (SPSS 15.0 for Windows;
SPSS, Chicago, Illinois, USA). Maximal data and lactate threshold results (ERG vs.
OW comparison only) were compared using dependent t-tests. Statistical
significance was established at p<0.05 for all analyses. The effects of test modality
and OW between-trial reproducibility were also analysed to determine the likelihood
that the true value of the observed Cohen effect statistic was small (0.2), moderate
(0.6) large (1.2), or very large (2.0; Hopkins 2003; Hopkins et al. 2009). Briefly, a
clear effect size (ES) was established when the likelihood ≥75% that the true value of
the effect statistic was greater than one of the above thresholds (e.g. small or
moderate). As the analysis also considers the likely direction of an effect (either
positive or negative), an ES was unclear when the likelihood was <75% for a positive
ES and >5% for a negative ES (Hopkins 2007; Hopkins et al. 2009), or vice-versa.
Magnitude-based differences are reported as the largest likely effect size (ES) and
associated percent probability (e.g. small, 85%). Furthermore, the reliability of
repeated OW measurements was also determined using TE (Hopkins 2000a), and the

Chapter 5 - Comparison of ergometer and on-water incremental rowing tests
108
OW reliability results compared with the corresponding data from our previous
reliability assessment of the laboratory-based protocol (Chapter 3). Reliability
comparisons were based on the ratio between OW and ERG relative TE using the
90% confidence limits. When the ratio between OW and ERG TE confidence limits
was <0.9 or >1.1 differences were considered to be substantial. A TE result would
therefore be: greater than another if the ratios calculated from the upper and lower
confidence intervals (CI ratios) were both >1.1, or less than another if the CI ratios
were both <0.9; a difference would be trivial if the CI ratios were within 0.9-1.1; and
the difference would be unclear if the CI ratios overlapped 0.9 and 1.1 (Gore et al.
2005).

Chapter 5 - Comparison of ergometer and on-water incremental rowing tests
109
5.3 RESULTS
5.3.1 Comparison between test modalities (laboratory vs. on water)
Power output measurements
When Concept2 and WEBA power measurements were compared across the five
reference submaximal 2OV& intensities, the resulting power outputs ranged 139-268
W (Concept2) and 136-263 W (WEBA). Thus, power output measurements from
both devices were within 1.8% during the submaximal portion of the ERG and OW
tests. During maximal exercise, OW power output was 7.9% lower (p=0.04) than
during the ERG test (Table 5-3).
Submaximal performance
Results from the data treatment procedure using the five standard power outputs are
displayed in Figure 5-3 (left panel). The power normalised data showed strong
correlations between both the ERG and OW testing modes for HR (R=0.93,
p<0.001), BLa (R=0.84, p<0.001), 2OV& (R=0.91, p<0.001) and distance completed
(R=0.95, p<0.001). Despite OW trends for a lower HR (Figure 5-3A) and higher BLa
(Figure 5-3B) and 2OV& values (Figure 5-3C), relative to the ERG test, there were no
statistically significant differences between test modalities, except for distance
completed (p<0.0001, Figure 5-3D), where OW results were 170-200 m lower for all
submaximal workloads compared with the ERG test. However, the magnitude of the
between-modality differences as effect sizes were very large (100% probability) for
distance completed, small (93%) for BLa, and trivial for 2OV& (80%); HR was
unclear (trivial effect, 71% probability). Furthermore, comparisons between
individual results from the ERG and OW test showed that there was considerable
variation in the magnitude, direction and slope of the between-test differences in
physiological response, most notably for BLa (Figure 5-3B, right panel).
Maximal performance
Power output, HR, distance completed and SR were all significantly lower during the
OW maximal stage compared with the ERG trial (Table 5-3). Magnitude-based
differences were: very large effect size (100% probability) for distance, large (79%)
for power output, moderate (80%) for SR and small (89%) for HR; results were
unclear for BLa (small, 48%) and 2OV& (trivial, 52%).

Chapter 5 - Comparison of ergometer and on-water incremental rowing tests
110
6 7 8 9 10 11 126
7
8
9
10
11
12
Subject 1
Subject 3
Subject 6
Subject 8
ERG Distance (x100 m)
OW Distance (x100 m)
125 150 175 200 225 250 275 300100
120
140
160
180
200
220
AHR (beats.min-1)
100 120 140 160 180 200 220100
120
140
160
180
200
220
Subject 2
Subject 1
Subject 5
Subject 7
ERG HR (beats.min-1)
OW HR (beats.min-1)
125 150 175 200 225 250 275 3000.0
1.0
2.0
3.0
4.0
5.0
6.0
7.0
8.0
B
BLa (mmol.L-1)
0 1 2 3 4 5 6 7 80
1
2
3
4
5
6
7
8
Subject 7
Subject 4
Subject 3
Subject 2
ERG BLa (mmol.L-1)
OW BLa (mmol.L-1)
125 150 175 200 225 250 275 3002.5
3.0
3.5
4.0
4.5
5.0
5.5
C
VO2 (L.min-1)
2.5 3.5 4.5 5.52.5
3.5
4.5
5.5
Subject 5
Subject 6
Subject 8
Subject 2
ERG VO2 (L.min-1)
OW VO2 (L.min-1)
125 150 175 200 225 250 275 300600
700
800
900
1000
1100
1200
D
OWERG
Power output (W)
Distance (m)
Figure 5-3: Mean submaximal results for A) heart rate (HR), B) blood lactate (BLa),
C) oxygen consumption ( 2OV& ) and D) distance completed during ergometer (ERG)
and on-water (OW) tests based on power normalised data using the standard power
outputs. Error bars denote ± 1 SD. Left-hand panels display mean results for the
entire group, while the right-hand panels show individual comparisons between ERG
and OW results that are representative of the variation observed between individuals.

Chapter 5 - Comparison of ergometer and on-water incremental rowing tests
111
Table 5-3: Mean (SD) performance characteristics during the maximal stage of the
ergometer (ERG) and on-water (OW) tests.
Variable ERG OW p
Power output (W) 412.8 (18.9) 379.7 (20.9) 0.04
HR (beats.min-1) 192 (11) 188 (9) 0.02
BLa (mmol.L-1) 13.2 (1.5) 12.9 (1.0) 0.69
2OV& (L.min-1) 5.61 (0.47) 5.54 (0.22) 0.53
RPE (Borg 15-point scale) 19.8 (0.5) 19.6 (0.5) 0.44
SR (strokes.min-1) 33.1 (2.9) 30.6 (1.2) 0.04
Distance (m) 1267 (20) 1040 (22) <0.0001
HR = heart rate; BLa = blood lactate concentration; 2OV& = oxygen consumption measured by MM3B; RPE = Borg’s rating of perceived exertion; SR = stroke rate; Distance = distance covered during the 4 min-maximal stage; p = probability resulting from a paired t-test between ERG and OW data.
Table 5-4: LT1 (aerobic) and LT2 (anaerobic) thresholds calculated from
blood lactate-power output relationships using untreated data from the
ergometer (ERG) and on-water (OW) tests.
ERG OW
Threshold Variable Mean (SD) Mean (SD) p
LT1 Power (W) 180.4 (28.4) 190.3 (20.4) 0.24
HR (beats.min-1) 145 (12.2) 145 (16.3) 0.43
BLa (mmol.L-1) 1.2 (0.1) 1.7 (0.6) 0.04
2OV& (L.min-1) 3.45 (0.31) 3.71 (0.38) 0.03
LT2 Power (W) 282.1 (26.1) 279.4 (24.9) 0.42
HR (beats.min-1) 177 (9.6) 176 (9.5) 0.20
BLa (mmol.L-1) 4.4 (0.5) 4.8 (0.6) 0.10
2OV& (L.min-1) 4.77 (0.23) 4.76 (0.33) 0.49
SD = standard deviation; HR = heart rate; BLa = blood lactate concentration; 2OV& =
oxygen consumption measured by the MM3B; p = probability resulting from a paired t-test between raw ERG and OW data.
Chapter 5 - Comparison of ergometer and on-water incremental rowing tests
112
Blood lactate thresholds
As data treatment procedures were not necessary for the determination of blood
lactate thresholds, raw data were used for all calculations related to blood lactate
thresholds. Differences between the ERG and OW BLa-power output relationships
(Figure 5-3, left panel) resulted in mean LT1 and LT2 BLa thresholds that differed by
0.5 mmol.L-1 (p=0.04; large effect size, 84% probability) and 0.4 mmol.L-1 (p=0.10;
small, 86%), respectively. However, despite the higher LT1 and LT2 BLa results
from the OW test, the corresponding mean HR results from the ERG and OW tests
were within 1 beat.min-1 (Table 5-4). Pearson correlations (R) and SEE between
ERG and OW results for the HR at LT1 and LT2 were R=0.69 (p=0.06), SEE=12.9
beat.min-1 and R=0.86 (p=0.01), SEE=5.3 beat.min-1, respectively.
5.3.2 Reliability of measures on water
Submaximal performance
HR, BLa and 2OV& were all lower during Trial 2 than Trial 1 (Figure 5-4). However,
only BLa was significantly lower (p=0.04) during Trial 2, although the difference
was a small effect (96% probability). The between-trial differences for 2OV& and HR
were small (75%) and trivial (87%), respectively.
Maximal performance
Mean OW power output was higher (p=0.03; moderate effect, 89% probability) in
Trial 2 than Trial 1 [398.2 (25.1) W vs. 378.9 (12.7) W, respectively], but there were
no other statistically significant between-trial differences during maximal exercise.
Magnitude-based differences between the repeated OW trials were unclear, although
the effects were most likely small for BLa (40%) and 2OV& (60%), and trivial for HR
(64%) and distance completed (50%).
Typical error results
The reliability of ERG and OW results as indicated by TE are shown in Table 5-5.
Despite the stability of between-trial results for most variables, CI ratios between TE
results from the OW and ERG tests showed that the reliability of measurements
usually differed between tests. During maximal workloads, power output, distance
completed and RPE were less reliable OW than during the ERG test (CI ratios: 1.3-
2.0), while BLa displayed superior reliability OW compared to the corresponding

Chapter 5 - Comparison of ergometer and on-water incremental rowing tests
113
ERG TE data (CI ratio = 0.5). Between-test TE results were similar for HRmax (CI
ratios: 1.1) and 2OV& peak (CI ratios: 0.9 and 1.1). Submaximal power output, BLa,
2OV& and distance completed were all less reproducible (CI ratios: 1.8-16.0) than the
corresponding ERG results. Only submaximal HR displayed similar reliability
between OW and ERG tests, although this was not conclusive as the CI ratios were
0.8 and 1.2. However, during submaximal workloads, and despite the potential for
differences due to environmental conditions during the OW test, the reproducibility
of HR, 2OV& and distance completed were all <5%; whereas the corresponding
reliabilities were 3% or less in the laboratory (Table 5-5).

Chapter 5 - Comparison of ergometer and on-water incremental rowing tests
114
100 120 140 160 180 200 220100
120
140
160
180
200
220R = 0.98TE = 3.5p < 0.0001
A) HR (beats.min-1)
Trial 1
Trial 2
0 2 4 6 8 10 12 14 16 180
2
4
6
8
10
12
14
16
18R = 0.98TE = 0.6p < 0.0001
B) BLa (mmol.L-1)
Trial 1
Trial 2
2.5 3.0 3.5 4.0 4.5 5.0 5.5 6.02.5
3.0
3.5
4.0
4.5
5.0
5.5
6.0R = 0.97TE = 0.16p < 0.0001
C) (L.min-1)
2OV&
Trial 1
Trial 2
6 7 8 9 10 11 126
7
8
9
10
11
12R = 0.98TE = 15.6p < 0.0001
D) Distance (x100 m)
Trial 1
Trial 2
Figure 5-4: Trial 1 (x axis) vs. Trial 2 (y axis) scatter plots and linear regression
trendlines for A) heart rate (HR), B) blood lactate concentration (BLa), C) oxygen
consumption ( 2OV& ) and D) distance completed during repeated on-water (OW)
incremental rowing tests. Submaximal results are based on power normalised data
using the standard power outputs (140-280 W).

115
Chapter 5 - Comparison of ergometer and on-waterr incremental rowing tests
Tab
le
5-5
: R
elia
bili
ty
of
repe
ated
m
easu
rem
ents
du
ring
su
bmax
imal
an
d m
axim
al
perf
orm
ance
of
on-w
ater
(O
W)
and
ergo
met
er (
ER
G)
incr
emen
tal
row
ing
test
s as
ind
icat
ed
by r
elat
ive
typi
cal
erro
r (%
TE
) an
d 90
% c
onfi
denc
e li
mit
s (9
0% C
L).
O
W %
TE
(90%
CL
)
ER
G T
E (
90%
CL
)
Vari
ab
le
Su
bm
axim
al
Maxim
al
S
ub
maxim
al
Maxim
al
Pow
er o
utpu
t (W
)
5.2
(4.4
-7.0
)a 4
.2 (
2.8-
9.0)
a
0.4
(0.3
-0.5
) 2.
9 (1
.9-6
.1)
HR
(be
ats.
min
-1)
2.5
(2.1
-3.3
) 1.
3 (0
.9-2
.7)
3.
0 (2
.5-4
.0)
1.2
(0.8
-2.5
)
BL
a (m
mol
.L-1
) 19
.2 (
17.1
-28.
0)
6.8
(4.6
-14.
8)
11
.0 (
9.4-
15.2
) 12
.5 (
8.6-
29.0
)
2O
V&(L
.min
-1)
4.6
(3.8
-6.1
) 2.
5 (1
.7-5
.2)
2
.6 (
2.1-
3.4)
b 2
.5 (
1.8-
4.7)
b
Dis
tanc
e (m
) 1.
9 (1
.6-2
.5)
1.7
(1.2
-3.6
)
0.1
(0.1
-0.2
) 1.
0 (0
.6-2
.0)
HR
=
he
art
rate
; B
La
=
bloo
d la
ctat
e co
ncen
trat
ion;
2
OV&
=
oxyg
en
cons
umpt
ion
(OW
=M
M3B
; E
RG
=M
OU
Se)
; R
PE
= B
org’
s ra
ting
of
perc
eive
d ex
erti
on;
SR
= s
trok
e ra
te;
Dis
tanc
e =
dis
tanc
e co
vere
d
duri
ng t
he 4
min
-max
imal
sta
ge.
a Raw
pow
er o
utpu
t re
sult
ing
from
SR
and
RP
E i
nstr
ucti
ons
(i.e
. no
t ba
sed
on t
reat
ed d
ata
usin
g re
fere
nce
pow
er o
utpu
ts).
b R
elia
bili
ty a
sses
smen
t of
2
OV&
mea
sure
men
ts f
rom
MO
US
e (C
hapt
er 3
).
Chapter 5 - Comparison of ergometer and on-water incremental rowing tests
116
5.4 DISCUSSIO�
This investigation compared the physiological responses between ergometer rowing
and on-water sculling, with the aim of establishing the validity of laboratory-based
rowing testing against the criterion of on-water performance. Our results confirmed
the potential for physiological responses to be substantially different between
ergometer and on-water rowing, and that these differences can display considerable
between-athlete variation. Additionally, the reliability of the on-water test was
established from duplicate on-water trials.
To date, few scientific publications have attempted a formalised incremental rowing
protocol that is performed in the on-water environment. Those that have attempted
field-based tests have adopted different protocols with respect to number of stages,
stage duration, workload to recovery ratio and method of progression. Typically,
assessments have been limited to pair-oared boats (Steinacker et al. 1987; Payne et
al. 1996; Coen et al. 2003), although Steinacker et al. (1987) also considered single
sculls. The number of stages performed and stage duration has varied from 4 x 6 min
exercise bouts (Coen et al. 2003) to 8 x 3 min stages (Payne et al. 1996) with both
constant duration stages (Payne et al. 1996; Coen et al. 2003) and fixed distance
stages (Steinacker et al. 1987) being attempted. The recovery between stages has
also varied from 1.5 min (Payne et al. 1996) to ~9 min (Steinacker et al. 1987) and
has largely been influenced by the time required to collect data and prepare for the
subsequent stage. Intensity and stage progression have been controlled by either boat
velocity (Coen et al. 2003) or SR (Steinacker et al. 1987; Payne et al. 1996). While
these methods of progression ensure the desired increments in intensity, they are
susceptible to the influence of environmental factors; for instance, given that the test
duration can be up to ~50 min, changes in wind direction, wind speed, or both, can
often occur. This environmental effect is likely reflected in our reliability results for
the distance completed during each stage (Table 5-5), although relative TE was <2%
during all workloads, this still corresponds to ~20 m differences between trials. Wind
speed and direction relative to the boat, as well as water conditions therefore have a
profound effect on boat velocity and relative intensity at a given SR. This
theoretically means that any field-based protocol relying on these independent
variables for the control of workload should only be performed in environmental
conditions that do not differ either within or between trials. However, the current
Chapter 5 - Comparison of ergometer and on-water incremental rowing tests
117
investigation used a combination of SR and RPE to prescribe workloads during the
OW test and the resulting power outputs were then quantified for each workload
using the WEBA biomechanics system. Although weather and water conditions were
generally good, environmental conditions did change within OW tests and between
separate trials. Nevertheless, Figure 5-1 shows that our method of workload
prescription resulted in power output increments that were similar to the ERG test.
While the workloads resulting from SR and RPE instructions did not permit direct
comparisons between ERG and OW tests or repeated OW trials, OW power
measurements allowed response variables to be compared at fixed power outputs.
Response variable-power output relationships (Figure 5-3) could therefore be reliably
compared at matched OW workloads (Table 5-5), and allowed comparisons between
ERG and OW results at power outputs that were within ~2%, given the small
difference between Concept2 and WEBA power measurements. Furthermore, the
progressive increase in workload achieved by our method allowed lactate thresholds
to be successfully calculated from the OW test. Thus, all measurements that are
obtained from our standard laboratory-based rowing test can also be undertaken in
the sport-specific rowing environment.
5.4.1 Comparison between test modalities (laboratory vs. on water)
Although based on a small sample size, our results showed small variations to the
physiological responses between ergometer and on-water rowing. Compared to the
OW test, mean HR was higher and BLa lower during the ERG test, which is opposite
to the differences most commonly reported in previous comparisons (Urhausen et al.
1993b; Ryan-Tanner et al. 1999b). Only Steinacker et al. (1987) have reported
higher mean HR results during ergometer performance, and have suggested that this
may be due to the relatively greater movement of the rower’s body mass during
ergometer rowing compared to sculling. This factor has also been highlighted during
movement pattern comparisons between the two modes of rowing (Martindale and
Robertson 1984; Lamb 1989). But given the potential for between-individual
variations in HR and BLa responses to ergometer rowing and sculling (Figure 5-3,
right panel), comparisons between mean results from a sample of rowers may not
adequately reflect the magnitude and direction of physiological differences as there
does not appear to be a typical response. While the reasons for the apparent
uncoupling between ergometer and on-water physiological responses are unclear, the
individual nature of these differences suggests that between-athlete variation in

Chapter 5 - Comparison of ergometer and on-water incremental rowing tests
118
sculling technique may be equally as influential on physiological response variations
as the differences reported between the movement patterns of ergometer rowing and
sculling (Smith et al. 1993; Dawson et al. 1998; Elliott et al. 2002). It is also likely
that the ergometer flywheel does not exactly replicate the resistance characteristics of
on-water rowing and that this may contribute to the observed physiological
differences between ergometer and on-water conditions. While a previous
investigation comparing physiological responses between ergometer tests using
different resistance settings did not find any statistically significant differences (Kane
et al. 2008), divergence between the resistance characteristics of on-water rowing
and ergometer simulations is likely to be greater compared to the ergometer tests
using different resistance settings. Differences between movement patterns,
resistance characteristics and between-individual variations in sculling technique
may result in muscle coordination and recruitment differences between the
conditions which mediate the observed variations in physiological responses.
However, conclusions regarding the actual mechanisms responsible for the
physiological differences are beyond the scope of this investigation.
The present study also provides a more thorough assessment of the oxygen cost of
on-water rowing. Previous investigations use either Douglas Bags (Jackson and
Secher 1976; Chènier and Leger 1991) or a Cosmed K2 portable metabolic system
(Kawakami et al. 1992) to measure on-water 2OV& , although results are from only
one or two athletes (Jackson and Secher 1976; Kawakami et al. 1992), or are limited
to maximal intensity exercise (Jackson and Secher 1976; Chènier and Leger 1991).
Mean 2OV& max has ranged 4.04-6.40 L.min-1 depending on the calibre of the rowers
tested and is reported to be comparable to the values attained on a rowing ergometer
(Chènier and Leger 1991). This is supported by the current results, where ERG and
OW 2OV& peak values were virtually identical (Table 5-3). Submaximal 2OV& was
also measured, and showed that although the mean 2OV& -power output relationships
were very similar during ERG and OW tests, there was potential for individual
variation between the relationships established from the ERG and OW tests (Figure
5-3, right panel). Although the between-individual variation detracts from the
validity of the mean group results representing the typical response, the mean 2OV& -
power output relationship was still the only approach by which the Concept2 and
WEBA power outputs could be compared. Based on our power normalisation

Chapter 5 - Comparison of ergometer and on-water incremental rowing tests
119
procedure using the five reference 2OV& intensities, power measurements from the
WEBA were ~2% lower than those from Concept2 during submaximal workloads.
During maximal intensity exercise, physiological differences between the ERG and
OW tests were classified as small effects. However, as maximal data were not
normalised for power output, the physiological responses during the OW test were
likely lower than the corresponding ERG results because mean OW power output
was ~8% lower during the maximal stage. Payne et al. (1996) is the only other
investigation that has included on-water power output measurements, reporting mean
values ranging approximately 140-310 W during their incremental protocol to
exhaustion. This is similar to the 150-380 W mean power output range for our
rowers, although maximal power output was likely higher during our test as it
involved fewer workloads and provided more recovery prior to the maximal stage.
Payne et al. (1996) also showed that on-water power outputs were lower compared to
ergometer rowing, and the difference was relatively greater during maximal
performance compared with light workloads (~20% vs. ~5-10%, respectively). They
explained that their rowing biomechanics system did not include the force applied to
the footstretcher, and that this was responsible for the power output differences
between ergometer and on-water conditions. When footstretcher forces are also
included in power calculations, the resulting on-water power output measurements
are ~17% higher than the same measurements using only the handle force (Kleshnev
2000). As the WEBA system used in our study did not include footstretcher forces
(only the forces at the gates), this is likely to account for our discrepancy between
ergometer and on-water power outputs. While this may also have contributed to the
relatively greater difference between ERG and OW power outputs during maximal
exercise compared with submaximal workloads (~8% vs. ~2%, respectively), the
relatively greater technical complexity of on-water sculling compared with ergometer
rowing may have made it more difficult for subjects to display their true maximum
during the OW test. This was also reflected by lower HR, BLa and SR results during
the OW test. But despite the relatively small power output differences between the
Concept2 ergometer and WEBA biomechanics system, large differences were found
between the distance measurements of the Concept2 display unit and the MinimaxX
GPS-derived distances measured during the OW test (Figure 5-3 and Table 5-3).
While there was a strong correlation between ERG and OW distance results
(R=0.98), compared to the distances estimated by the Concept2 display unit, OW
Chapter 5 - Comparison of ergometer and on-water incremental rowing tests
120
distances were 170-200 m lower across each of the five reference power outputs and
228 m lower during maximal exercise (although power outputs were not matched for
the maximal data). Strong agreement between race times measured by the MinimaxX
and official race results (R=0.99, SEE=0.45 s) suggest a displacement error of 2-3 m
over the 2000-m race distance, and confirm the accuracy of MinimaxX distance
measurements (Vogler et al. 2008). Thus, the Concept2 ergometer display unit over
estimates rowing distance. This is not an entirely new finding as time-trial
performances are faster on Concept2 ergometers compared with single sculls. For
example, a heavyweight male will complete a 2000-m race in a single scull in ~6:58
(min:s; Table 1-1, p.4), which compares to ~5:50 (min:s) on a Concept2. Thus,
performance time is ~1.2 times faster on the Concept2, just as the ergometer over-
represents distance by a factor of ~1.2 (Table 5-3, p.111).
The mean BLa concentrations at the LT1 and LT2 blood lactate thresholds showed
large and small effect size differences, respectively, between the ERG and OW tests.
However, the corresponding mean HR results were very similar (Table 5-4).
Previous studies have also found good agreement between HRs at blood lactate
thresholds determined from ergometer and on-water tests, with mean HR results
differing by no more than 2 beats.min-1 (Steinacker et al. 1987; Coen et al. 2003).
But comparisons based only on mean data assume that any physiological differences
between ergometer and on-water rowing are uniform and consistent, and do not
consider the potential for larger between-modality differences in individual results.
Hence, when on-water rowing has been performed at the HR intensity prescribed by
an ergometer test, actual on-water BLa concentrations have sometimes been different
to the blood lactate threshold predicted by the ergometer test (Steinacker et al. 1987;
Payne et al. 1996). Pearson correlations between HRs at blood lactate thresholds
from ergometer and on-water tests provide a better indication of the agreement
between individual results, and have ranged R=0.70-0.84 (Steinacker et al. 1987;
Payne et al. 1996). However, Payne et al. (1996) reported that their correlation of
R=0.63 was associated with an SEE of 6.4 beats.min-1 and that the HR predicted by
the ergometer test would therefore result in an on-water BLa concentration of 2.8-5.9
mmol.L-1. Based on our SEE of 5 beats.min-1 for LT2 HR and using our mean results,
the ERG-derived HR at LT2 would result in an actual on-water BLa of 4.3-5.6
mmol.L-1. So although mean lactate threshold results seem to suggest that on-water
training can be accurately prescribed from the ERG test, individual variation in BLa-

Chapter 5 - Comparison of ergometer and on-water incremental rowing tests
121
power output and HR-power output relationships (Figure 5-3, right panel) suggests
that on-water intensities may in fact be over- or under-predicted when using LT1 and
LT2 HRs to prescribe on-water training intensity for individual athletes. Compared
with the criterion of the OW test, laboratory testing under-represented LT1 HR for 3
of the 8 comparisons as a result of lower LT1 BLa thresholds being determined from
the ERG test. LT2 HRs were generally similar between tests, although one subject
displayed a lower threshold HR during the ERG test. Thus, for these individuals, the
LT1 and LT2 HRs prescribed by the ERG test would result in on-water training
intensities that were too low compared with those provided by the OW test.
Differences between the LT1 and LT2 BLa thresholds determined during ergometer
rowing and on-water sculling, and decoupling of the HR-BLa relationship, therefore
mean that HR intensity recommendations derived from laboratory tests are not
applicable to on-water training for all athletes. Table 5-6 shows that divergence
between LT1 and LT2 HR results from the ERG and OW tests may translate into HR
differences of 5-17 beats.min-1 for the corresponding training zones, and compared to
the criterion of the on-water test, the HRs prescribed by the ergometer test may be
too low or too high. Differences of these magnitudes are likely to be of practical
significance for elite athletes, as it is essential for high calibre athletes to maximise
the quality of their training. However, individual lactate threshold results from most
participants showed good agreement between ERG and OW tests. For these
individuals, training intensity prescriptions will be virtually identical regardless of
whether the test is performed in the laboratory or on-water. Laboratory tests on
Concept2 ergometers therefore provide valid results for most athletes; they are also
more expedient and less labour intensive than the OW test, and remain a suitable
primary evaluation method. But as the OW test ensures accurate training intensity
recommendations for all athletes, the OW test should supplement laboratory testing
on a regular basis to fine tune exercise prescriptions for on-water training.
5.4.2 Reliability of measures on water
Despite the improved specificity of measurements obtained from our OW test,
previous investigations have alluded to difficulties standardising tests within and
between sessions, given the dynamic nature of weather and water conditions
(Steinacker et al. 1987; Coen et al. 2003). Only Payne et al. (1996) has considered
the reliability of on-water measurements, reporting Pearson correlations and SEE for
HRs corresponding to BLa concentrations of 2 mmol.L-1 (R=0.76; SEE=6.2

Chapter 5 - Comparison of ergometer and on-waterr incremental rowing tests
122
Tab
le 5
-6:
Hea
rt r
ate
base
d tr
aini
ng z
ones
for
tw
o at
hlet
es d
ispl
ayin
g di
verg
ence
bet
wee
n L
T1
and
LT
2 he
art
rate
res
ults
fro
m t
he e
rgom
eter
and
on-
wat
er r
owin
g te
sts.
The
hea
rt r
ates
pres
crib
ed b
y th
e er
gom
eter
tes
t m
ay b
e to
o lo
w (
Ath
lete
1)
or t
oo h
igh
(Ath
lete
2)
com
pare
d to
the
crit
erio
n of
the
on-
wat
er t
est.
A
thle
te 1
(H
R t
oo l
ow
)
Ath
lete
2 (
HR
too H
igh
)
Tra
inin
g z
on
e E
rgom
eter
On
-wate
r
Erg
om
eter
On
-wate
r
T5:
Max
imal
aer
obic
>
177
>18
2
>18
0 >
168
T4:
Thr
esho
ld
173
– 17
6 17
8 –
181
17
6 –
179
164
– 16
7
T3:
Hea
vy a
erob
ic
158
– 17
2 16
4 –
177
16
2 –
175
148
– 16
3
T2:
Mod
erat
e ae
robi
c 14
1 –
157
149
– 16
3
147
– 16
1 13
0 –
147
T1:
Lig
ht a
erob
ic
<14
0 <
148
<
146
<12
9
HR
= h
eart
rat
e.

Chapter 5 - Comparison of ergometer and on-water incremental rowing tests
123
beats.min-1) and 4 mmol.L-1 (R=0.67; SEE=5.9 beats.min-1). It was therefore
essential to establish the reliability of our OW incremental protocol to determine
whether measured variables were sufficiently reproducible to allow longitudinal
monitoring of athletes using this method. In the current investigation, TE was
primarily used to evaluate the reproducibility of repeated measurements, although
correlations between Trial 1 and Trial 2 results for HR, BLa and 2OV& were all very
high (R>0.97; Figure 5-4). Despite these strong correlations, ERG results were
sometimes more reliable than the corresponding OW data (Table 5-5). While the
presented power output data for the OW test does not display the same reliability, TE
values could only be calculated for the raw power outputs resulting from the SR and
RPE guidelines used to control OW workloads, and despite no other intensity
feedback during the OW scenario, this method still produced satisfactorily
reproducible results. While there are multiple sources of error that would negatively
affect the reliability of OW data (including biological and environmental variation),
technical error from power output measurements could also contribute. But the
reproducibility of WEBA power output measurements was implied given the
observed reliability of the physiological response variables, all of which were based
on their relationship to power output. Should the reproducibility of WEBA power
measurements have been poor, this would have been reflected in the reliability of our
HR, BLa and 2OV& results. Based on the TE results for submaximal 2OV& (Table 5-
5), the additional error observed on-water (OW TE - ERG TE) could result from
between-trial power output variation of ~2%; however, one may speculate that
environmental influences must also contribute. Of the physiological variables, BLa
and 2OV& measured during the submaximal workloads of the OW test showed
reliability results that were inferior to the corresponding ERG test (both CI ratios:
1.8). Despite the subject group consisting of experienced rowers with prior testing
experience, and having been thoroughly familiarised with the equipment required for
OW testing, submaximal HR, BLa and 2OV& were all lower during Trial 2 compared
to Trial 1 (Figure 5-4), which may be indicative a familiarisation effect. But based on
the OW submaximal reliability results being poorer than the corresponding results
from the ERG test, except for HR, the OW test is less suitable as a means for
monitoring longitudinal submaximal fitness, as it is less sensitive to detecting
change. However, the OW and ERG tests should be equally sensitive to tracking
change in maximal fitness adaptations as reliability results from maximal exercise

Chapter 5 - Comparison of ergometer and on-water incremental rowing tests
124
were generally similar between both test methods. Despite the OW test’s potential
reduction in sensitivity to submaximal fitness changes compared with the ERG test,
the enhanced specificity of the OW method could conceivably allow the field test to
detect relevant fitness adaptations that may not be identified by the ERG test. Further
research evaluating the efficacy of longitudinal fitness monitoring using the OW test
is therefore warranted to find out whether potential benefits from improved
specificity outweigh the OW tests diminished sensitivity to longitudinal fitness
changes.

Chapter 5 - Comparison of ergometer and on-water incremental rowing tests
125
5.5 CO�CLUSIO�
The specificity of rowing testing can be improved with an on-water incremental
protocol that uses commercially available equipment to enable field-based
assessments that satisfactorily replicate laboratory-based ergometer tests. But results
from laboratory tests are generally more reliable than those from our OW protocol,
although both modes of testing display adequate reproducibility. Individual lactate
thresholds usually show good agreement between ERG and OW tests, but between-
individual variation in physiological response differences between ergometer rowing
and on-water sculling means that training intensity recommendations from the ERG
test will not be directly applicable to on-water training for some athletes. As rowing
tests performed on Concept2 ergometers provide valid training prescriptions for most
athletes, and are more convenient than the on-water alternative, laboratory-based
rowing tests are a suitable primary evaluation method. However, as the OW test
ensures accurate training intensity recommendations for all athletes, the field test
could be used as regular supplement to laboratory tests.
Chapter 6 - Monitoring fitness and performance with ergometer and on-water incremental rowing tests
126
CHAPTER 6
MONITORING FITNESS AND PERFORMANCE
WITH ERGOMETER AND ON-WATER
INCREMENTAL ROWING TESTS
6.1 I�TRODUCTIO�
The external validity of laboratory-based rowing testing has been questioned as the
movement patterns (Martindale and Robertson 1984; Lamb 1989), stroke mechanics
(Smith et al. 1993; Dawson et al. 1998; Elliott et al. 2002; Kleshnev 2005) and
physiological responses (Steinacker et al. 1987; Chènier and Leger 1991; Urhausen
et al. 1993b; Payne et al. 1996; Ryan-Tanner et al. 1999b) from simulated rowing on
an ergometer differ compared with the criterion of on-water performance. So
although ergometer tests aim to monitor fitness adaptations and prescribe exercise
intensities for rowing training, some rowing coaches have developed reservations
about applying these recommendations to on-water training. Given the perceived
practical limitations of ergometer-derived training prescriptions, the primary role of
laboratory testing has become to track the progress of fitness adaptations and provide
insights into the effectiveness of preceding training blocks. However, as formalised
incremental rowing tests can be performed in the on-water environment to improve
the specificity of training prescriptions from rowing tests, longitudinal fitness
changes could also potentially be monitored using this method.
The on-water incremental rowing protocol described in Chapter 5 successfully
replicated a laboratory-based rowing test and quantified the reliability of the on-
water method, but an effective test must also track changes in physiological
conditioning and ideally provide a reflection of an athlete’s readiness to perform in a
competitive setting. Previous investigations using rowing ergometry to assess
seasonal variations in fitness and rowing performance reported improvements across
the season of ~18% for maximal oxygen consumption (VO2max; Hagerman and
Staron 1983; Mahler et al. 1985), 8-10% for power output at a blood lactate
threshold of 4.0 mmol.L-1 (Vermulst et al. 1991) and 10-14% for average power

Chapter 6 - Monitoring fitness and performance with ergometer and on-water incremental rowing tests
127
output during a sustained maximal effort (~90 s-6 min duration; Hagerman and
Staron 1983; Mahler et al. 1985; Vermulst et al. 1991). However, when the pattern
of fitness adaptations were investigated using three serial rowing tests conducted at
~12 wk intervals, 50% of the 0.40 L.min-1 increase in 2OV& max and 15% of the 40 W
maximal power output improvement occurred between the final two tests (Mahler et
al. 1985). This demonstrates the principle of diminishing returns with longitudinal
training and reflects the pattern of fitness adaptation typically experienced by elite
athletes. Beyond this phase, improvements in variables such as 2OV& max are likely to
be small, and although changes in BLa-performance kinetics may reflect increased
high intensity work in the training program, rowing performance often continues to
improve after physiological measures have displayed a plateau (unpublished personal
communication, Prof Allan Hahn). Furthermore, on-water rowing performance
appears to improve disproportionately more than ergometer rowing performance
during the latter phases of preparation and may contribute to the modest shared
variation (R2=0.52–0.81) between ergometer time-trial results and competitive on-
water scenarios (Jürimäe et al. 1999; Ryan-Tanner et al. 1999a; Jürimäe et al. 2000;
Barrett and Manning 2004). Observations such as these could be due to improved on-
water technique, different physiological responses between ergometer and on-water
rowing, or a combination of both. However, no previous investigation has attempted
to measure training-induced fitness adaptations using an on-water test or considered
the efficacy of formalised on-water assessments as a method of performance
monitoring.
While fitness monitoring forms an integral part of preparations for the competitive
rowing season by tracking an athlete’s progression in response to training, rowing
tests would also ideally provide an effective indication of an athlete’s readiness to
perform in a competitive setting. However, predicting performance from the
variables measured during routine monitoring has had only limited success.
Physiological and anthropometric measures have been used in regression analyses to
predict 2000-m rowing performance (Jürimäe et al. 1999; Jürimäe et al. 2000;
Ingham et al. 2002b; Yoshiga and Higuchi 2003; Bourdin et al. 2004), but have
displayed mixed results in predicting 2000-m rowing time or average velocity for
ergometers and single sculls. When 2000-m performance times were the criterion,
complex models using multiple variables derived from ergometer rowing displayed
correlations ranging R=0.71-0.99 (SEE=10.6-1.42 s; Jürimäe et al. 1999; Yoshiga
Chapter 6 - Monitoring fitness and performance with ergometer and on-water incremental rowing tests
128
and Higuchi 2003). In contrast, prediction of on-water performance was generally
less successful (R=0.81-0.94, SEE=11.3-6.3 s; Jürimäe et al. 2000), which is not
unexpected given the confounding affect of environmental factors. Although some of
these investigations considered the relationship between selected variables and on-
water time-trials, all independent variables in these models were derived from
ergometer-based assessments; no publications utilised variables measured during on-
water rowing. Given the potential for biomechanical (Martindale and Robertson
1984; Lamb 1989; Smith et al. 1993; Dawson et al. 1998; Elliott et al. 2002;
Kleshnev 2005) and physiological (Steinacker et al. 1987; Chènier and Leger 1991;
Urhausen et al. 1993b; Payne et al. 1996; Ryan-Tanner et al. 1999b) differences
between ergometer and on-water rowing, it may be that performance inferences from
the results of ergometer and on-water rowing assessments are specific to the
performance modality used (either ergometer or on-water time-trials). Thus, the
results from on-water rowing tests may provide a better indication of an athlete’s
performance potential for on-water racing.
The aims of this study were therefore to: 1) evaluate the feasibility of an on-water
rowing test as a means of monitoring fitness adaptations; 2) establish whether the
magnitude of fitness changes are the same for both ergometer and on-water tests, and
3) determine if the results from the on-water test provide a better indication of time-
trial performance potential.

Chapter 6 - Monitoring fitness and performance with ergometer and on-water incremental rowing tests
129
6.2 METHODS
6.2.1 Subjects
Seven rowers (6 males and 1 female) provided written informed consent to
participate in this investigation; all athletes were competing at a national level in
Under 23 rowing competition. The group consisted of two heavyweight rowers and
five lightweight athletes, although the lightweight rowers were not under any weight
restrictions at the time of the investigation. The subjects’ physical characteristics are
described in Table 6-1. All biological testing procedures were approved by the AIS
Human Ethics Committee.
6.2.2 Experimental protocol
Each rower completed three exercise trials during two testing blocks that were
separated by a 6-wk training period in which the athletes continued their regular
training under the guidance of their coach. Standardised training programs were not
possible as the participants came from two seperate training squads, and the coaches
from both groups wished to retain control over the athletes’ training. All training
completed during this time was logged in self-reported training diaries. The baseline
and post-training testing blocks both consisted of ergometer and on-water
incremental rowing tests, as well as a 2000-m ergometer time-trial to assess rowing
performance. While the rowing performance test would ideally have been conducted
on-water in single sculls, individual time-trials could not be conducted this way due
to the dynamic nature of weather and water conditions, and the effect these would
have on performance times between subjects and across testing blocks. Although an
on-water performance test in which all subjects raced simultaneously would have
minimised between subject differences due to environmental conditions and allowed
rank-order comparisons between baseline and post-testing blocks, this was not
possible for logistical reasons relating to the availability of the required number of
boats. So despite all the compelling reasons, a time-trial was not done on-water,
instead the time-trial performance capabilities of each rower were assessed on an
ergometer.
The 2000-m ergometer time-trial (TT) and ergometer incremental rowing test (ERG)
were conducted at the AIS Physiology Laboratory, while the on-water incremental
rowing test (OW) was at Lake Burley Griffin (Canberra, Australia). Trial order was

Chapter 6 - Monitoring fitness and performance with ergometer and on-water incremental rowing tests
130
Table 6-1: Physical characteristics of the 7 subjects
(6 male and 1 female).
Measure Mean (SD) Range
Age (yr) 20.3 (0.7) 18.8-21.1
Height (m) 1.86 (0.08) 1.74-2.01
Mass (kg) 80.9 (7.0) 72.7-95.4
2OV& peak (L.min-1) 4.78 (0.54) 3.82-5.53
Maximal power (W) 327 (37) 264-372
2OV& peak = peak oxygen consumption during the 4-min
maximum performance trial on the ergometer; Maximal power
(W) = average power output during the 4-min maximum
performance trial on the ergometer.
Chapter 6 - Monitoring fitness and performance with ergometer and on-water incremental rowing tests
131
the same for baseline and post-testing: the TT was conducted first, with the ERG and
OW tests approximately counterbalanced so that the ERG test was the second trial
for 3 of the subjects, and the OW test second for 4 participants; trial 3 then consisted
of the remaining ERG or OW test. During both testing blocks all trials were
completed within 3-5 d with at least 24 h between tests.
2000-m ergometer time-trial
Rowers completed baseline and post-training performance tests using the same
Concept2 rowing ergometer (Concept2, Morrisville, USA). A combination of Model
C and Model D ergometers were used so that there were enough machines to allow
simultaneous time-trials to be completed under competitive conditions. Participants
always undertook each test with the same group of two to four athletes, and wherever
possible, athletes used the same ergometer for all aspects of TT and ERG testing. It
has previously been shown that physiological responses and performance do not
differ between these model of Concept2 ergometer (Vogler et al. 2007). The
Concept2 drag factor was standardised at 120 for the lightweight males and
heavyweight female, although 130 was used for the heavyweight male, which is
consistent with our standard testing practice. Subjects undertook a self-selected 10-
min warm-up, which was followed by 3-min rest. The same warm-up was repeated
before each TT. During the rest period, the ergometer work monitor unit was
programmed for a distance of 2000-m; the TT then commenced immediately
following the rest. During the TT, instantaneous heart rate (HR; Polar S810i,
Kempele, Finland) and stroke rate (SR) were recorded to coincide with the
completion of each 500 m; verbal encouragement was provided throughout the
duration of the test. Following the test, performance times were recorded from the
ergometer work monitor. Blood lactate concentration (BLa; Lactate Pro, Arkray,
Shiga, Japan) was measured immediately after completion of the TT and again 4 min
later, and in combination with the HR data, was used to confirm that TT
performances were maximal on both occasions.
Laboratory test
The laboratory step-test protocol was consistent with the standard 7-stage protocol
currently used for testing Australian rowers. Prior to the test, a resting BLa
measurement was obtained from a capillary blood sample drawn from an earlobe.
The incremental exercise protocol consisted of 6 submaximal workloads and 1

Chapter 6 - Monitoring fitness and performance with ergometer and on-water incremental rowing tests
132
maximal stage on a Concept2 Model D rowing ergometer; each workload was 4 min
in duration. The Concept2 drag factor was standardised using the same settings as the
TT. Submaximal workloads were controlled by target power outputs, with the initial
workload and between-stage increments determined according to the results of the
baseline TT. Starting workloads therefore ranged 125-150 W with power outputs
progressing 20-30 W each stage. Each workload was separated by a 1-min recovery
period. Oxygen consumption ( 2OV& ) was measured continuously throughout the test
using a custom-designed metabolic cart (MOUSe; AIS, Canberra, Australia); mean
2OV& results were recorded every 30 s from steady-state conditions during the final 1
min of each workload. 2OV& peak during the maximal stage of the test was recorded as
the highest 1 min average. HR (Polar S810i, Kempele, Finland) was also monitored
throughout the duration of each test, with the steady-state value recorded during the
final 30 s of each stage. BLa (Lactate Pro, Arkray, Shiga, Japan) was sampled during
each recovery period, immediately following the maximal stage and 4 min after the
finish of the maximal stage. Average SR, average power output and distance
completed were also obtained from the ergometer work monitor unit during the 1-
min recovery period. A rating of perceived exertion (RPE, Borg 15-point scale; Borg
1973) for the previous workload was also ascertained at this time.
On-water incremental test
The on-water incremental rowing test protocol was the same as that described in
Chapter 5 and therefore comprised 5 x 4-min submaximal stages and 1 x 4-min
maximal stage. Rowers were instructed to increase SR by 2 strokes.min-1 each stage
across a range of 14-24 strokes.min-1, although on this occasion RPE intensity targets
were not matched to the ERG test, but instead increased 2-points for each stage from
7 to 15 on the Borg 15-point scale (Borg 1973). Prior to testing, a single scull (Sykes
Racing, Geelong, Australia) was instrumented with a biomechanics system (Row X
Outdoor, WEBA Sport, Wien, Austria) to determine the power output resulting from
the SR and RPE targets for each stage of the OW protocol. Average SR and distance
covered were obtained using a MiniMaxX (Catapult Innovations, Scoresby,
Australia) GPS/accelerometer data acquisition system. Submaximal workloads were
separated by 2-min recovery periods, during which a BLa sample was obtained from
the finger-tip and the rower turned the boat 180º in readiness for the start of the next
stage. 2OV& was measured continuously by a portable metabolic system (MM3B,
Chapter 6 - Monitoring fitness and performance with ergometer and on-water incremental rowing tests
133
Cortex Biophysiks, Leipzig, Germany); breath-by-breath measurements were
averaged for every 30 s and mean steady-state results recorded from the final 2 min
of each workload. 2OV& peak was recorded as the highest 1 min average from the
maximal stage. The MM3B also logged continuous HR data from the Polar HR
monitor; mean HR from the final 30 s of each workload was recorded to represent
steady-state conditions. RPE for the previous increment was also obtained during the
2-min recovery to determine whether the target value was achieved. Following the
final submaximal workload, rowers were provided with a 5-min recovery in
preparation for the 4-min maximal stage. Instructions for the maximal stage were to
attempt to maintain a maximal effort for the entire duration and row as far as
possible.
Blood lactate thresholds
Automated software (ADAPT; AIS, Canberra, Australia) determined lactate
thresholds from the BLa-power output relationship established during the ERG and
OW tests using third order polynomial regression. Lactate threshold 1 (LT1; aerobic
threshold) was defined as the point at which BLa began to increase (0.2 mmol.L-1)
above resting levels. Lactate threshold 2 (LT2; anaerobic threshold, AT) was defined
as the point on the polynomial regression curve that yielded the maximum
perpendicular distance to the straight line formed by joining LT1 and peak BLa
(modified Dmax; Bishop et al. 1998). HR, power output and 2OV& at LT1 and LT2
were subsequently determined using ADAPT.
6.2.3 Data treatment
The mean power outputs during each stage of the ERG and OW tests were not
identical because the ERG test used individualised workloads based on TT results,
and the OW submaximal workloads were controlled by the athlete attempting to
match target SR and RPE values. Consequently, the resulting OW power outputs
were different from the individualised target power outputs of the ERG test, and
hence, the submaximal response variables (e.g. BLa, HR and 2OV& ) could not be
directly compared between each stage of the ERG and OW tests, or between the
baseline and post-training OW tests (Figure 6-1). But because each of the response
variables were strongly related to power output during all the ERG and OW tests
(Table 6-2), regression analyses were used to normalise the data so that comparisons

Chapter 6 - Monitoring fitness and performance with ergometer and on-water incremental rowing tests
134
between each stage of all ERG and OW tests used the same power outputs. The
normalised power outputs were: 140, 175, 210, 245 and 280 W; these five power
outputs were designated as the ‘standard power outputs’. Response variable-power
output relationships were therefore established for each of the rowers based on
individual submaximal results, and regression analyses used to calculate values for
each of the measured variables at intensities corresponding to the five standard
power outputs. This normalisation procedure was applied to the submaximal data
from all the ERG and OW tests, in order to compare baseline and post-training test
results between the ERG and OW tests, and to evaluate the effect of the 6-wk
training block according to both modes of testing. However, as the highest two
standard power outputs were too high to be reflective of the actual submaximal
workloads achieved by one of the subjects during their tests, only data from the
lowest three standard power outputs were included in the analyses for this athlete.
6.2.4 Statistical analyses
Classification of magnitude-based differences
The physiological responses at the standard power outputs and lactate thresholds
from the ERG and OW tests were compared between the baseline and post-training
testing blocks (i.e. ERG baseline vs. ERG post-training) to evaluate the effect of the
6-wk training period according to both tests. Additionally, ERG and OW results were
compared within testing blocks (i.e. ERG baseline vs. OW baseline) to establish
whether the results differed between the two modes of testing. The magnitude of
these differences were analysed to determine the likelihood that the true value of the
observed Cohen effect statistic was trivial (<0.2), or at least small (0.2), moderate
(0.6), large (1.2) or very large (2.0; Hopkins 2003; Hopkins et al. 2009). Briefly, a
clear effect size (ES) was established when the likelihood was ≥75% that the true
value of the effect statistic was greater than one of the above thresholds (e.g. small or
moderate). As the analysis also considers the likely direction of an effect (either
positive or negative), an ES was unclear when the likelihood was <75% for a positive
ES and >5% for a negative ES (Hopkins 2007; Hopkins et al. 2009), or vice-versa.
Magnitude-based differences are reported as the largest likely effect size and
associated percent probability (e.g. small, 85%).
Additionally, a conventional statistical approach was used. The submaximal data
were also analysed using 2 (test) x 5 (stage) factorial ANOVAs with repeated

Chapter 6 - Monitoring fitness and performance with ergometer and on-water incremental rowing tests
135
measures on both dimensions (SPSS 15.0 for Windows; SPSS, Chicago, Illinois,
USA). Maximal data and lactate threshold results were compared using dependent t-
tests. Statistical significance was established at p<0.05 for all analyses.
Practically substantial differences based on the smallest worthwhile change
Practical inferences regarding the fitness and performance outcomes of the 6-wk
training period were considered by determining likelihoods for practically substantial
effects based on the SWC (Hopkins 2002, 2003; Hopkins et al. 2009). Values for the
SWC were based on the reliability results for ergometer and on-water incremental
rowing tests reported in Chapters 3 and 5, respectively. The analysis provides the
likelihood that the true value of the observed training effect is larger than the TE
(Hopkins 2000a) for repeated ergometer and on-water rowing tests, and that the
change is therefore not merely an artefact of measurement error. Results are
presented as the percent likelihood that the change is real or trivial (within the TE of
the measurement).
Prediction of rowing time-trial performance
The relationship between rowing performance (TT time or OW maximal power
output) and selected physiological results from ERG and OW tests were also
considered using Pearson correlation coefficients and SEE. To interpret the
magnitude of these correlations, coefficients were defined as: nearly perfect (>0.9),
very strong (0.7-0.9), strong (0.5-0.7), moderate (0.3-0.5), and small (0.1-0.3;
Hopkins 2000b).

Chapter 6 - Monitoring fitness and performance with ergometer and on-water incremental rowing tests
136
100 150 200 250 300 350120
140
160
180
200
220A) Baseline HR: ERG vs. OW
ERG OW
HR (beats.min-1)
100 150 200 250 300 350120
140
160
180
200
220B) OW HR: baseline vs. post-training
Post-trainingBaseline
Power output (W)
HR (beats.min-1)
Figure 6-1: Mean results for heart rate (HR) using untreated data that does not
account for the differences in submaximal workloads between A) the ergometer
(ERG) and on-water (OW) incremental rowing tests, and B) the baseline and post-
training tests using the OW protocol. Error bars denote ± 1 SD.

Chapter 6 - Monitoting fitness and performance with ergometer and on-water incremental rowing tests
137
Tab
le 6
-2:
Reg
ress
ion
anal
yses
bet
wee
n m
easu
red
vari
able
s an
d po
wer
out
put
duri
ng e
rgom
eter
(ER
G)
and
on-w
ater
(O
W)
incr
emen
tal
row
ing
test
s us
ing
pool
ed r
esul
ts f
rom
all
sub
ject
s. ‘
Raw
’
data
ana
lyse
s il
lust
rate
the
str
engt
h of
the
res
pons
e va
riab
le-p
ower
out
put
rela
tion
ship
s un
der
both
cond
itio
ns,
whi
le t
he ‘
pow
er n
orm
alis
ed’
data
sho
ws
the
rela
tion
ship
s es
tabl
ishe
d fr
om t
he s
tand
ard
pow
er o
utpu
ts.
The
dis
play
ed c
orre
lati
on c
oeff
icie
nts
are
the lowest
of t
hose
cal
cula
ted
from
the
base
line
and
pos
t-tr
aini
ng d
ata.
T
est
(pow
er o
utp
ut)
E
RG
OW
Data
V
ari
ab
le
Mod
el
R
SE
E
R
S
EE
Raw
H
R (
beat
s.m
in-1
) 2nd
ord
er p
olyn
omia
l 0.
91*
8.3
0.
93*
7.6
(sub
max
imal
&
BL
a (m
mol
.L-1
) 3rd
ord
er p
olyn
omia
l 0.
87*
1.7
0.
89*
1.8
max
imal
int
ensi
ties
) 2
OV&
(L.m
in-1
) 2nd
ord
er p
olyn
omia
l 0.
97*
0.18
0.88
* 0.
43
D
ista
nce
(m)
Lin
ear
0.99
* 9.
5
0.89
* 47
.7
S
R (
stro
kes.
min
-1)
2nd o
rder
pol
ynom
ial
0.86
* 2.
9
0.91
* 2.
2
Pow
er n
orm
alis
ed
HR
(be
ats.
min
-1)
Lin
ear
0.93
* 6.
9
0.92
* 7.
9
(sub
max
imal
int
ensi
ty)
BL
a (m
mol
.L-1
) 3rd
ord
er p
olyn
omia
l 0.
83*
1.3
0.
84*
1.3
2
OV&
(L.m
in-1
) L
inea
r 0.
98*
0.14
0.88
* 0.
40
D
ista
nce
(m)
Lin
ear
0.99
* 3.
5
0.93
* 29
.4
S
R (
stro
kes.
min
-1)
Lin
ear
0.76
* 2.
3
0.85
* 2.
1
HR
= h
eart
rat
e; B
La
= b
lood
lac
tate
con
cent
rati
on;
2O
V&=
oxy
gen
cons
umpt
ion;
Dis
tanc
e =
dis
tanc
e co
vere
d du
ring
each
4-m
in s
tage
; S
R =
str
oke
rate
; R
= P
ears
on c
orre
lati
on c
oeff
icie
nt;
SE
E =
sta
ndar
d er
ror
of e
stim
ate;
* =
stat
isti
call
y si
gnif
ican
t co
rrel
atio
n (p
<0.
0001
).

Chapter 6 - Monitoring fitness and performance with ergometer and on-water incremental rowing tests
138
6.3 RESULTS
6.3.1 Training logs
Six of the participants returned the self-reported training diary for the 6-wk period
between tests. Results from these training logs are summarised in Table 6-3
according to the average intensity, frequency and duration of weekly training.
6.3.2 2000-m ergometer time-trial (TT)
Table 6-4 shows mean performance characteristics from the baseline and post-
training TT. Mean performance time during the post-training test was 0.4 s slower
than baseline testing, which corresponded to a mean power output decrease of less
than 1 W. HR and BLa were also similar during the baseline and post-training tests
(Table 6-4); HRpeak during both tests was greater than 92% of the age predicted
maximum for all participants, thereby supporting the observation that athletes
provided maximal efforts on both occasions. However, Figure 6-2 shows that
individual performance results were variable, with 3 participants improving their
post-training TT performance relative to baseline testing, while 3 athletes displayed a
decline in performance. One athlete was unable to complete the post-training TT,
thereby decreasing TT results to n=6; all other aspects of the testing procedure were
successfully completed by this individual.
6.3.3 Ergometer and on-water incremental rowing tests
Magnitude-based differences between baseline and post-training results
Figure 6-3 displays the normalised submaximal results from the ERG and OW tests
at the five standard power outputs. For the ERG trial, there were no substantial
differences between the baseline and post-training results for submaximal BLa
(trivial effect size, 98% probability; p=0.96), HR (trivial, 99%; p=0.06) or 2OV&
(trivial, 100%; p=0.41). However, the OW test showed post-training decreases for
submaximal 2OV& (small, 94%; main effect: p=0.01) and BLa (unclear small, 65%;
interaction: p=0.04), but there was no substantial HR change (unclear trivial, 64%;
p=0.15).
Table 6-5 shows that maximal power output during the OW test increased by 18 W
following training (small, 91%), whereas the change during the ERG test was trivial

Chapter 6 - Monitoring fitness and performance with ergometer and on-water incremental rowing tests
139
(78% probability). Baseline to post-training changes in 2OV& peak were unclear, but
were most likely trivial (66%) for both the ERG and OW tests. LT2 power output
from the ERG test was unchanged after training (unclear trivial, 67%; p=0.80), while
the OW test showed a possible improvement (unclear small, 67%; p=0.43).
Practical interpretation of the baseline to post-training changes
In contrast to the magnitude-based differences using Cohen’s effect size units (as
presented in the previous section), submaximal 2OV& during the OW test was the
only variable to display a practically substantial difference (94% probability)
following the 6-wk training period, when 2OV& was lower. Otherwise, the baseline to
post-training changes from the OW test were trivial for submaximal HR (87%) and
LT2 power output (92%), but were unclear for submaximal BLa (trivial, 62%). There
were no practically substantial differences between baseline and post-training results
from the ERG test as the changes in BLa (99%), HR (100%), 2OV& (100%) and LT2
power output (80%) were all trivial.
It was unclear whether the post-training increase in OW maximal power output was
practically substantial, although this was the most likely outcome (67% probability).
However, maximal power output during the ERG test did not change following
training (trivial, 90%). The baseline to post-training changes in 2OV& peak from the
ERG and OW tests were most likely trivial in both instances (71% and 54%,
respectively), although the effects were unclear.
Comparison of physiological responses to ergometer and on-water rowing
During baseline testing, BLa (small 82%; main effect: p=0.04), 2OV& (small, 96%;
p=0.06), SR (moderate, 99%; main effect: p=0.02) and distance completed (large,
100%; main effect: p<0.001) displayed differences between the ERG and OW tests
during submaximal workloads. At maximal intensities these differences were: BLa
(small, 87%; p=0.13), HR (unclear small, 73%; p=0.07), 2OV& (small, 81%; p=0.15),
SR (moderate, 95%; p=0.01) and distance completed (very large, 100%; p<0.001).
The direction of the between-test differences were the same at all exercise intensities;
BLa and 2OV& were higher OW, whereas HR, SR and distance completed were
higher during ERG performance.

Chapter 6 - Monitoring fitness and performance with ergometer and on-water incremental rowing tests
140
Following the 6-wk training period, SR (moderate, 81%; p=0.09) and distance
completed (very large, 100%; main effect: p<0.001) again displayed differences
between the ERG and OW tests during submaximal stages, as did HR (small, 77%;
p=0.18). Between-test differences were more common during maximal exercise as
BLa (small, 81%; p=0.22), HR (small, 89%; p=0.11), SR (moderate, 80%; p=0.03)
and distance completed (very large, 100%; p<0.001) all displayed effects. The
direction of the differences was the same as during baseline testing.

141
Chapter 6 - Monitoting fitness and performance with ergometer and on-water incremental rowing tests
Tab
le 6
-3:
Sum
mar
y of
the
tra
inin
g co
mpl
eted
dur
ing
the
6-w
k tr
aini
ng p
erio
d ba
sed
on s
elf-
repo
rted
trai
ning
log
s.
F
req
uen
cy (
sess
ion
s/w
k)
W
eek
ly D
ura
tion
(m
in)
In
ten
sity
(R
PE
)
Tra
inin
g
Mea
n (
SD
) R
an
ge
M
ean
(S
D)
Ran
ge
M
ean
(S
D)
Ran
ge
On-
wat
er
3.0
(1.5
) 1.
3-4.
3
220.
2 (7
6.5)
13
0.0-
286.
7
15.5
(1.
3)
13.4
-17.
6
Erg
omet
er
1.0
(0.2
) 0.
6-1.
3
40.4
(10
.2)
31.0
-60.
0
15.4
(3.
9)
9.3-
19.7
X-t
rain
ing
1.0
(0.9
) 0.
5-2.
8
55.3
(59
.6)
30.0
-177
.0
15
.5 (
2.4)
13
.0-1
9.0
Gym
1.
7 (0
.4)
1.0-
2.0
13
8.8
(54.
1)
60.0
-185
.0
16
.6 (
1.7)
13
.7-1
8.5
Aer
obic
5.
0 (1
.2)
3.3-
5.8
31
5.9
(80.
2)
206.
7-40
4.0
15
.5 (
1.9)
12
.7-1
8.5
TO
TA
L
6.7
(0.9
) 4.
7-7.
8
454.
8 (1
17.0
) 28
5.0-
583.
3
15.7
(1.
5)
13.0
-17.
7
On-
wat
er =
row
ing
trai
ning
per
form
ed o
n-w
ater
; E
rgom
eter
= r
owin
g tr
aini
ng p
erfo
rmed
on
a ro
win
g er
gom
eter
; X
-
trai
ning
= a
erob
ic t
rain
ing
acti
viti
es o
ther
tha
n ro
win
g; G
ym =
res
ista
nce
trai
ning
; A
erob
ic =
tot
al o
f al
l ae
robi
c tr
aini
ng
sess
ions
(i.
e. o
n-w
ater
, er
gom
eter
and
x-t
rain
ing)
; T
OT
AL
= t
otal
of all
tra
inin
g se
ssio
ns (
incl
udin
g gy
m);
Fre
quen
cy =
num
ber
of t
rain
ing
sess
ions
com
plet
ed p
er w
eek;
Dur
atio
n =
min
utes
of
trai
ning
per
wee
k; I
nten
sity
= a
vera
ge r
atin
g of
perc
eive
d ex
erti
on (
RP
E, B
org
15-p
oint
sca
le;
Bor
g 19
73)
for
wee
kly
trai
ning
ses
sion
s.

Chapter 6 - Monitoring fitness and performance with ergometer and on-water incremental rowing tests
142
-40
-30
-20
-10
0
10
20
30
40
Baseline Post-training
∆∆ ∆∆ power output (W)
Table 6-4: Mean (SD) performance characteristics during the 2000-m ergometer
time-trial (TT).
Variable Baseline Post-training ES p
Time (s) 412.8 (15.5) 413.2 (21.0) Trivial, 57% (unclear) 0.89
Power output (W) 321 (34) 321 (47) Trivial, 62% (unclear) 0.98
HR (beats.min-1) 193 (7) 191 (5) Trivial (76%) 0.43
BLa (mmol.L-1) 10.9 (2.2) 11.6 (1.9) Trivial, 47% (unclear) 0.49
HR = heart rate; BLa = blood lactate concentration; ES = magnitude-based effect-size (using
Cohen units) and associated likelihood (%) for the change in TT performance; p = probability
resulting from a paired t-test between baseline and post-training results.
Figure 6-2: Average change in power output for individual athletes during the
baseline and post-training 2000-m ergometer time-trials (TT). One athlete was
unable to complete the post-training TT reducing the sample size to 6. Gray dotted
lines represent the expected range of between-test performance variation based on
the reliability of repeated 2000-m ergometer time-trials.

Chapter 6 - Monitoring fitness and performance with ergometer and on-water incremental rowing tests
143
100 150 200 250 3000.0
2.0
4.0
6.0
8.0
10.0
12.0A
ERG BLa (mmol.L-1)
100 150 200 250 3000.0
2.0
4.0
6.0
8.0
10.0
12.0A
OW BLa (mmol.L-1)
100 150 200 250 3002.0
2.5
3.0
3.5
4.0
4.5
5.0C
Baseline Post-training
Power output (W)
OW VO2 (L.min-1)
100 150 200 250 300120
140
160
180
200B
ERG HR (beats.min-1)
100 150 200 250 300120
140
160
180
200B
OW HR (beats.min-1)
100 150 200 250 3002.0
2.5
3.0
3.5
4.0
4.5
5.0C
Baseline Post-training
Power output (W)
ERG VO2 (L.min-1)
Ergometer test On-water test
Figure 6-3: Mean results using normalised submaximal data based on the standard
power outputs for A) blood lactate (BLa), B) heart rate (HR) and C) oxygen
consumption ( 2OV& ) during the baseline and post-training ergometer (ERG; left) and
on-water (OW; right) incremental rowing tests. Error bars denote ± 1 SD.

144
Chapter 6 - Monitoting fitness and performance with ergometer and on-water incremental rowing tests
Tab
le 6
-5:
Lac
tate
thr
esho
ld r
esul
ts a
nd p
erfo
rman
ce c
hara
cter
isti
cs f
rom
the
max
imal
sta
ges
of t
he e
rgom
eter
(E
RG
) an
d on
-wat
er (
OW
)
incr
emen
tal
row
ing
test
s du
ring
bas
elin
e an
d po
st-t
rain
ing
test
ing.
Dat
a ar
e m
ean
(SD
).
Vari
ab
le
ER
G 1
E
RG
2
ES
p
OW
1
OW
2
ES
p
LT
2 B
La
(mm
ol.L
-1)
4.4
(0.8
) 4.
3 (0
.6)
Tri
vial
, 55%
(un
clea
r)
0.56
5.1
(1.1
) 4.
4 (1
.0)
Sm
all,
85%
0.
15
LT
2 po
wer
out
put
(W)
248
(29)
24
7 (3
4)
Tri
vial
, 67%
(un
clea
r)
0.80
250
(17)
25
8 (2
5)
Sm
all,
67%
(un
clea
r)
0.43
Pow
er o
utpu
t (W
) 32
1 (3
3)
322
(38)
T
rivi
al, 7
8%
0.89
320
(24)
33
8 (3
0)
Sm
all,
91%
0.
07
HR
(be
ats.
min
-1)
196
(6)
194
(6)
Sm
all,
59%
(un
clea
r)
0.50
185
(7)
189
(8)
Sm
all,
80%
0.
19
BL
a (m
mol
.L-1
) 10
.8 (
2.3)
11
.2 (
1.4)
S
mal
l, 5
3% (
uncl
ear)
0.
42
12
.4 (
2.7)
12
.1 (
1.9)
T
rivi
al, 5
9% (
uncl
ear)
0.
60
2O
V&(L
.min
-1)
4.66
(0.
48)
4.74
(0.
54)
Tri
vial
, 66%
(un
clea
r)
0.31
4.88
(0.
73)
4.77
(0.
73)
Tri
vial
, 66%
(un
clea
r)
0.22
Dis
tanc
e (m
) 11
65 (
41)
1165
(47
) T
rivi
al, 7
9%
0.95
984
(48)
98
2 (9
0)
Sm
all,
44%
(un
clea
r)
0.96
LT
2 B
La
= L
T2
(ana
erob
ic t
hres
hold
) bl
ood
lact
ate
conc
entr
atio
n; L
T2
pow
er o
utpu
t =
pow
er o
utpu
t co
rres
pond
ing
to L
T2;
HR
= h
eart
rat
e; B
La
= b
lood
lac
tate
conc
entr
atio
n;
2O
V&=
oxy
gen
cons
umpt
ion
mea
sure
d by
MO
US
e du
ring
ER
G t
ests
and
Met
aMax
dur
ing
OW
tes
ts;
Dis
tanc
e =
dis
tanc
e co
vere
d du
ring
the
4-m
in m
axim
al
stag
e; E
RG
1 =
bas
elin
e er
gom
eter
tes
t; E
RG
2 =
pos
t-tr
aini
ng e
rgom
eter
tes
t; E
S =
mag
nitu
de-b
ased
eff
ect-
size
(us
ing
Coh
en u
nits
) an
d as
soci
ated
lik
elih
ood
(%)
for
betw
een-
test
cha
nges
; p
= p
roba
bili
ty r
esul
ting
fro
m a
pai
red t-
test
bet
wee
n ba
seli
ne a
nd p
ost-
trai
ning
res
ults
; O
W 1
= b
asel
ine
on-w
ater
tes
t; O
W 2
= p
ost-
trai
ning
on-
wat
er t
est.

Chapter 6 - Monitoring fitness and performance with ergometer and on-water incremental rowing tests
145
6.3.4 Relationship between incremental rowing test results and performance
Table 6-6 shows correlations between selected results from the ERG and OW tests
and rowing performance. Correlations between ERG results and TT performance
time were nearly perfect; OW results generally displayed lower correlations,
although relationships were still very strong, except for LT2 power which was small
to moderate. When the average power output from the maximal stage of the OW tests
was the performance criterion, ERG results displayed strong to very strong
correlations (Table 6-6). The OW test showed nearly perfect correlations between
2OV& peak and OW performance, although the relationship for LT2 power was lower,
but strong.
Change in TT performance time (post-training minus baseline) displayed moderate to
strong relationships with the corresponding changes in maximal power output (R=-
0.55, p=0.26), 2OV& peak (R=-0.40, p=0.43) and LT2 power output (R=-0.49, p=0.32)
from the ERG test. The same results from the OW test showed correlations of R=
-0.28 (p=0.60), R=0.22 (p=0.68) and R=0.58 (p=0.23), respectively. Relationships
between the change in OW performance (maximal power output) and the changes in
OW 2OV& peak and LT2 power output were R=0.62 (p=0.19) and R=-0.24 (p=0.64),
respectively.

146
Chapter 6 - Monitoting fitness and performance with ergometer and on-water incremental rowing tests
Tab
le 6
-6:
Lin
ear
regr
essi
on a
naly
ses
betw
een
sele
cted
res
ults
fro
m t
he e
rgom
eter
(E
RG
)
and
on-w
ater
(O
W)
incr
emen
tal
row
ing
test
s an
d ro
win
g pe
rfor
man
ce (
2000
-m e
rgom
eter
tim
e-tr
ial
tim
e an
d m
axim
al p
ower
out
put
from
the
on-
wat
er t
est)
dur
ing
the
base
line
and
post
-tra
inin
g te
st b
lock
s.
Perf
orm
an
ce c
rite
rion
2000-m
tim
e-t
rial
(s)
O
W m
axim
al
pow
er (
W)
Tes
t V
ari
ab
le
R (
SE
E)
R
(S
EE
)
ER
G
Max
imal
pow
er (
W)
-0.9
2# to
-0.9
6# (6.
7-6.
9)
0.
64 t
o 0.
89* (
12.7
-27.
9)
2
OV&
pea
k (L
.min
-1)
-0.9
4# to
-0.9
5# (5.
7-7.
6)
0.
79 t
o 0.
92# (
11.2
-22.
2)
L
T2
pow
er (
W)
-0.9
4# to
-0.9
7# (5.
9-6.
1)
0.
76 t
o 0.
87* (
14.1
-23.
7)
OW
M
axim
al p
ower
(W
) -0
.71
to -
0.94
# (5.
9-16
.5)
-
2
OV&
pea
k (L
.min
-1)
-0.8
4* to
-0.8
9* (9.
3-10
.6)
0.
91* t
o 0.
92# (
11.9
-14.
5)
L
T2
pow
er (
W)
-0.1
9 to
-0.
39 (
16.0
-23.
1)
0.
52 t
o 0.
60 (
22.7
-31.
1)
Max
imal
pow
er =
ave
rage
pow
er o
utpu
t du
ring
the
4-m
in m
axim
al s
tage
; 2
OV&
peak
= a
vera
ge o
xyge
n
cons
umpt
ion
duri
ng t
he 4
-min
max
imal
sta
ge;
LT
2 po
wer
= p
ower
out
put
equi
vale
nt t
o th
e L
T2
(ana
erob
ic)
bloo
d la
ctat
e th
resh
old;
R =
Pea
rson
cor
rela
tion
coe
ffic
ient
s fr
om b
asel
ine
and
post
-tra
inin
g te
stin
g; S
EE
=
stan
dard
err
or o
f th
e es
tim
ate
for
base
line
and
pos
t-tr
aini
ng r
esul
ts;
* = s
tati
stic
ally
sig
nifi
cant
cor
rela
tion
(p<
0.05
); # =
sta
tist
ical
ly s
igni
fica
nt c
orre
lati
on (
p<0.
01).

Chapter 6 - Monitoring fitness and performance with ergometer and on-water incremental rowing tests
147
6.4 DISCUSSIO�
This investigation demonstrated that the response to 6-wks of rowing training was
different between ergometer and on-water tests. Additionally, the relationship
between changes in fitness test results and rowing performance showed that the
ergometer results provided a better predictor of rowing time-trial performance.
The training conducted during the 6-wk period between baseline and post-training
testing had mixed results in terms of changes to ergometer time-trial performance.
Mean performance time declined (was worse) by 0.4 s over the course of the
investigation; three athletes displayed substantially slower TT results and the other
three participants that completed both time-trials improved their performance (i.e.
faster TT results) after the training block. However, for one of the latter three
athletes, the observed change was within the range normal for between-test variation
(2% coefficient of variation for power output and 0.6% for performance time;
Schabort et al. 1999). Mean results from the self-reported training diaries suggested
that the volume of training should have been at least sufficient to maintain fitness
and performance, but unfortunately, the investigation was undertaken during the
rowing off-season, so training loads had typically been reduced compared to in-
season practices. Additionally, discussion with the athletes revealed that the focus of
training was quite varied between individuals and that fitness maintenance or
resistance training was sometimes the primary goal rather than development of
aerobic fitness. So although performance changes were small, and sometimes
included negative results, the 6-wk duration of the training period was sufficiently
long to observe changes in ergometer time-trial performance.
6.4.1 Magnitude-based differences between baseline and post-training results
Given the training completed by the athletes during this investigation was not
necessarily aimed at improving aerobic fitness, and the duration of the 6-wk training
period was less than that of previous studies investigating seasonal fitness changes in
rowers (Hagerman and Staron 1983; Mahler et al. 1985; Vermulst et al. 1991), it was
not surprising that fitness adaptations were comparatively modest during the current
study. However, the main aim of our study was to compare the magnitude of fitness
changes measured by incremental exercise tests performed on a rowing ergometer or
on-water in a single scull, in order to establish whether longitudinal fitness changes

Chapter 6 - Monitoring fitness and performance with ergometer and on-water incremental rowing tests
148
could be effectively monitored by the on-water test. According to the ERG test, there
were no substantial fitness changes between the baseline and post-testing occasions.
While the modest training volume completed between testing occasions (Table 6-3)
tends to support the conclusion from the ERG test, we can't preclude the possibility
that ERG and OW tests produce different results, and that on-water training (which
was ~70% of the total aerobic training) was sufficient to elicit a training response
that was only detected by the OW test. Indeed, the OW test showed small post-
training decreases for BLa at fixed submaximal workloads (Figure 6-3) and a small
improvement in maximal power output, thereby suggesting that fitness improved.
However, interpretations regarding the post-training decrease in submaximal 2OV&
during the OW test are less clear, as our experience with laboratory-based rowing
tests suggests that submaximal 2OV& usually changes in parallel with 2OV& max, such
that submaximal 2OV& as a proportion of 2OV& max remains quite stable (personal
communication, Prof Allan Hahn). But given the magnitude of the training responses
for maximal power output and submaximal BLa measured by the ERG and OW tests
were different (trivial vs. small, respectively), the improved specificity of the OW
test may facilitate detection of training adaptations that are only evident during on-
water performance. Stronger evidence for this conclusion would have been provided
if the ERG and OW tests had both shown definitive post-training fitness
improvements, such as decreased BLa for a given submaximal workload, higher
2OV& max, and higher maximal power output. Had the ERG and OW tests indicated
small and moderate improvements, respectively, there would be little doubt that
fitness had actually improved and that the OW test showed larger baseline to post-
training changes. But as the fitness outcomes from the OW test contradicted those
from the established ERG test, it is not clear whether this is actually the case.
Additionally, due to the small sample size, many of the magnitude-based inferences
about the training effects were unclear (particularly for maximal results), further
confounding comparisons between the training outcomes of the ERG and OW tests.
Moreover, the observed changes during the OW test could equally be an artefact of
the increased potential for measurement variation due to environmental influences
(Chapter 5), or from possible changes in sculling technique between the baseline and
post-training OW tests. However, the actual reason for the observed differences
between the fitness outcomes from the ERG and OW tests is not clear.

Chapter 6 - Monitoring fitness and performance with ergometer and on-water incremental rowing tests
149
Practical interpretation of the baseline to post-training changes
Although magnitude-based classifications of the training responses measured by the
ERG and OW tests were quantified as trivial and small, respectively, it is our normal
practice to interpret physiological and performance changes between serial rowing
tests based on the reliability established for the test protocol. A change of greater
than 1 x TE has a likelihood of just 52% for being ‘real’ (Woolford and Gore 2004),
which is an acceptable degree of imprecision for coaches who are looking for small
improvements of 0.4-0.7% that can be the difference between winning a medal or not
(Hopkins et al. 1999). The reliability of the OW method has been reported to be
poorer compared to the ergometer protocol (Chapter 5), meaning that the OW test
will be less sensitive to detecting practically substantial fitness changes. So although
the training effects from the OW test were classified as being larger than those
recorded from the ERG test, the baseline to post-training changes during the OW test
may not be sufficient to be accepted as practically meaningful. When the response to
the 6-wk training period was interpreted relative to the TE results reported for the
OW test (Chapter 5), only submaximal 2OV& displayed a clear practically substantial
change (lower post-training). The training responses from the ERG test were
confirmed as trivial based on practical interpretations of the baseline to post-training
changes using reliability results for ergometer tests (Chapter 3). However, if the TE
for ergometer-based tests were applied to interpret the observed OW changes, the
shift in submaximal BLa during the OW tests would be practically meaningful,
thereby demonstrating that the inferior reliability of the OW method diminished the
test’s sensitivity to longitudinal fitness changes relative to ergometer assessments.
But in practice, this procedure is not methodologically sound when interpreting
changes measured by a test, as the TE data from the ERG and OW tests are specific
to the tests from which they are derived. Nevertheless, the above example shows that
although the magnitude of the training responses from the OW test were classified as
being greater than those from the ERG test, the relatively poorer reliability of the
OW method confounded practical interpretations of the observed training effects.
6.4.2 Comparison of ergometer and on-water physiological responses
The ERG and OW tests often displayed small differences in BLa, HR and 2OV& .
While submaximal differences were not entirely consistent between the baseline and
post-testing occasions, the differences resulting from maximal exercise were similar

Chapter 6 - Monitoring fitness and performance with ergometer and on-water incremental rowing tests
150
despite the possible influence of training effects from the 6 wks between tests. But as
submaximal BLa and 2OV& displayed differences during baseline testing only,
whereas submaximal HR and LT2 power output only showed differences post-
training, the physiological response differences between ergometer and on-water
rowing may be somewhat influenced by training and fitness status. However, the
direction of the physiological differences between the ERG and OW tests were
always the same and matched those reported in Chapter 5. SR and the distance
completed during each workload also differed between the ERG and OW tests. Mean
SR during each of the workloads (using the standard power outputs to normalise
submaximal results) was between 2 and 4 strokes.min-1 higher during the ERG test
and may therefore have contributed to the observed physiological response
differences. The distance completed during each of the workloads (using normalised
submaximal results) was 150-210 m higher according to the ERG test, thereby
confirming that the Concept 2 rowing ergometer over-represents distance estimates
compared to on-water distance measurements using the MiniMax system (Chapter
5).
6.4.3 Relationship between incremental rowing test results and performance
Since this investigation confirmed that laboratory-based rowing tests can be
replicated on-water, but showed that the training responses measured by ERG and
OW tests may be different, it was important to critically evaluate the relationship
between OW test results and rowing performance. Because average power output
from a sustained maximal effort (R=-0.88 and 0.92; Jürimäe et al. 2002a; Bourdin et
al. 2004), absolute 2OV& max (R=-0.76 to 0.88; Jürimäe et al. 1999; Jürimäe et al.
2000; Ingham et al. 2002b; Bourdin et al. 2004) and power output corresponding to
AT (fixed BLa of 4 mmol.L-1; R=0.92 to -0.96; Jürimäe et al. 1999; Jürimäe et al.
2000; Ingham et al. 2002b) have displayed strong relationships with ergometer time-
trial performance (either elapsed time or average power output), the equivalent
variables from the current study were used in linear regression analyses with TT
performance time. Results from the ERG test displayed correlation coefficients that
were very similar to those previously reported (Table 6-6), although the predictive
potential of these single-variable models for individuals are limited as SEE results
ranged 6-8 s. The correlations between OW test results and TT performance times
were nearly always lower than the corresponding correlations for the ERG test
Chapter 6 - Monitoring fitness and performance with ergometer and on-water incremental rowing tests
151
results; consequently, for the former, SEE results were higher. However, the
relationship between maximal power output during an ergometer incremental rowing
test and 2000-m rowing performance has been shown to vary depending on whether
an ergometer time-trial (R=-0.97) or on-water single sculling time-trial (R=-0.70)
was the performance criterion (Jürimäe et al. 2000). It was therefore anticipated that
the relationships between test results and rowing performance may be stronger when
the same mode of rowing (either ergometer or sculling) was used under both
conditions. Because 2000-m on-water time-trials were deliberately not used during
the present investigation to avoid the confounding effects of changes in
environmental conditions, maximal power output during the OW tests was used as a
surrogate indication of on-water performance potential. Correlations between OW
test results and performance were higher when maximal OW power output was the
criterion, just as ERG test results showed the strongest relationships with TT
performance. However, the simple linear regression models using results from the
OW test did not improve correlations with maximal OW power output relative to the
ERG results. In fact, the correlations resulting from OW LT2 power output (R≤0.60)
were lower compared to the corresponding result from the ERG tests (R≤0.87; Table
6-6). Furthermore, although the relationship between the change in ERG LT2 power
output and the change in TT time displayed only a moderate correlation (R=-0.49),
the correlation for the corresponding OW results was poor (R=-0.24), and in the
opposite direction to that which was anticipated, given power output was the
criterion. Alternatively, changes in 2OV& peak from both test methods correlated
moderately with the changes in TT time and OW maximal power output (ERG: R=-
0.40 and OW: R=0.62). However, our findings regarding OW LT2 power output and
its modest relationship to rowing performance challenges our assumption that the
association between incremental test results and rowing performance would be
improved when the mode of rowing was matched between performance-trial and test.
But as the on-water performance test adopted by this study was not a stand-alone
2000-m on-water sculling time-trial, it is not clear whether our results translate to
this criterion of on-water rowing performance.
Chapter 6 - Monitoring fitness and performance with ergometer and on-water incremental rowing tests
152
6.5 CO�CLUSIO�S
The performance changes resulting from the 6-wk training period between baseline
and post-training tests had mixed results; some athletes showed improvements, while
others displayed detraining effects. However, the training effect was secondary to the
main aim of this study, which was to establish the efficacy of on-water testing to
track changes in fitness compared with tests conducted in the laboratory on a rowing
ergometer. Compared with the standard ERG test, post-training fitness improvements
were recorded only by the OW test; although it was not clear whether these
differences were actually the result of genuine training adaptations that were evident
only during the on-water performance, or were possibly an artefact of changes in
environmental conditions during on-water performance. While the baseline to post-
training changes from the OW test were classified as being larger than those from the
ERG test, the inferior reliability of the on-water method diminished the test’s
sensitivity to detecting longitudinal fitness changes relative to ergometer
assessments. Thus, practical interpretations regarding the outcomes of the 6-wk
training period were similar between the ERG and OW tests. Similarly, results from
the OW test did not improve the association with rowing time-trial performance
relative to those from the ERG test. Although correlations between OW test results
and rowing performance were higher when OW power output was the performance
criterion, and ERG test results showed the strongest relationships with ergometer
time-trial performance, ERG results consistently provided the highest correlations
with rowing performance. So although physiological response differences between
laboratory and on-water rowing tests suggest that on-water tests should improve the
specificity of fitness test results, the practical reality is that formalised on-water
rowing tests provide no obvious benefits as a means of monitoring longitudinal
fitness changes or performance compared to laboratory-based rowing tests.

Chapter 7 – Summary, conclusions and recommendations
153
CHAPTER 7
SUMMARY, CONCLUSIONS AND
RECOMMENDATIONS
7.1 SUMMARY
This thesis evaluated the Concept2 Model D rowing ergometer against the previous
criterion of the Concept2 Model C, thereby validating the Model D ergometer to be
used as the standard testing device for subsequent laboratory tests comparing
ergometer rowing with on-water single-sculling. Additionally, the accuracy and
reliability of the Cortex MetaMax3B indirect calorimetry system was established
with respect to our automated Douglas bag system, in order to evaluate the metabolic
load of rowing in the on-water environment. Because both the Concept2 Model D
ergometer and the MetaMax3B proved to be valid testing tools, matching laboratory
and on-water incremental rowing tests were performed, which confirmed that
physiological responses differed between simulated rowing on an ergometer and on-
water single-sculling. Thus, the on-water test improved the specificity of training
intensity prescriptions relative to the laboratory test, although the reliability (Typical
error; TE) of the on-water test was generally poorer compared with that for
laboratory tests. While the improved specificity of the on-water test may have
contributed to the field test detecting larger fitness changes following 6 weeks of
training compared with the standard laboratory test, the inferior reliability of on-
water tests meant that these results were inconclusive. Hence, when the magnitude of
the fitness changes measured by the laboratory and on-water tests were interpreted
relative to the TE of the respective tests, longitudinal training monitoring was no
more effective using the on-water method. Given that on-water incremental rowing
tests are logistically difficult and provide few additional benefits compared to
standard laboratory tests, it is concluded that formalised on-water rowing tests have
limited application.
Despite the updated design of the Concept2 Model D ergometer and the potential for

Chapter 7 – Summary, conclusions and recommendations
154
altered resistance characteristics and rowing technique compared to the Concept2
Model C, the physiological responses to incremental exercise were virtually identical
between the two ergometer models. Although 2COV& and RER displayed statistically
significant differences during submaximal exercise, the actual differences across all
exercise intensities were less than 0.06 L.min-1 for 2OV& , 0.12 L.min-1 for 2COV&
and 0.03 for RER. The uniformity of the physiological responses was due to strong
agreement between power outputs from both models of ergometer, which differed by
less than 2 W during maximal exercise. Lactate thresholds (LT1 and LT2) were also
similar between the Concept2 C and D models, threshold BLa and HR results were
within 0.2 mmol.L-1 and 2 beats.min-1, respectively. Power outputs at the lactate
thresholds also showed excellent agreement between ergometer models as the
difference was always less than 5 W. Given the absolute differences between test
results using these models of Concept2 ergometer were always minimal, the new
design features of the Concept2 Model D rowing ergometer do not substantially alter
the physiological response to rowing compared to the previous model. Hence, results
from rowing tests using the Concept2 Model D ergometer are valid compared to the
Model C and can be directly compared between these models. As equivalent results
were obtained from both ergometer models, the Concept2 Model D was accepted as
the reference ergometer for all subsequent laboratory tests. Additionally, results from
duplicate incremental tests on the Model D ergometer were used to evaluate the TE
of laboratory-based rowing tests, thereby quantifying the reliability of this protocol
and providing the standard against which the on-water incremental rowing tests
would be compared. TE results were ~3% for power output, 2OV& and HR; BLa and
threshold results were less reproducible (TE ~15%), although the power output at
LT1 and LT2 was better (TE ~5%). As these results were an indication of the
combined biological and technical error of the various laboratory measurements, any
change larger than the TE was likely to be ‘real’ rather than an artefact of
measurement error. These TE results were therefore used as the SWC for inferences
regarding practically important magnitude-based differences during subsequent
laboratory tests.
A major limitation of previous investigations comparing ergometer and on-water
rowing is that no metabolic data have been included; in fact, there are very little data
concerning direct measurements of the oxygen cost for on-water rowing. One

Chapter 7 – Summary, conclusions and recommendations
155
possible reason for this oversight may be on-going concern regarding the validity of
measurements from portable indirect calorimetry systems (Meyer et al. 2005a),
which would be ideally suited for on-water evaluations. However, compared to a
laboratory-based automated Douglas bag system, the Cortex MetaMax3B portable
indirect calorimetry system provided reliable results, and although measurements
from the two systems were not directly comparable, the MetaMax3B estimated
metabolic demand with a satisfactory degree of accuracy. During incremental
ergometer rowing tests to exhaustion, MetaMax 2OV& , 2COV& and EV& were higher
by approximately 4%, 7% and 4%, respectively. However, as differences were larger
than what would be anticipated for repeated measurements with the laboratory
metabolic system (based on the TE established in Study 1 using the same system),
between-system differences for 2OV& , 2COV& and RER were almost always
practically substantial. Conversely, TE results from repeated MetaMax
measurements were very similar to those from the automated Douglas bag system
(established in Study 1), MetaMax TEs ranged 2.0% ( 2OV& ) to 3.6% ( EV& ). Overall,
MetaMax accuracy was comparable to other portable metabolic devices (McLaughlin
et al. 2001; Crouter et al. 2006) and the reliability was often better (Duffield et al.
2004; Crouter et al. 2006). Based on these results, the MetaMax portable system was
used for all subsequent on-water tests (Chapters 5 and 6). However, some uncertainty
remains as to whether accuracy and reliability results from a laboratory-based
validity study are directly transferable to the on-water environment, especially given
the potential for the additional humidity of on-water environment to interfere with
the ‘drying’ of expirate and influence gas analysis results. Unfortunately, uncertainty
regarding the transfer of results between the laboratory and field environments is an
inherent limitation of validation studies for portable indirect calorimetry systems.
Recent developments in sport monitoring technology allow rowing tests that were
once only possible under laboratory conditions to be successfully replicated in the
sport-specific on-water environment. Compact and unobtrusive rowing biomechanics
systems allow boats to be instrumented for power output measurements, and portable
indirect calorimetry systems permit direct measurements of metabolic demand during
field-based activities. Thus, all measurements from laboratory-based rowing tests can
now also be obtained in the field with acceptable accuracy. Matching laboratory and
on-water tests showed that the physiological responses to simulated ergometer

Chapter 7 – Summary, conclusions and recommendations
156
rowing and on-water sculling were different, but the magnitude and even the
direction of the differences were highly individual. Mean results for BLa and 2OV&
were higher, and HR was lower during on-water performance at submaximal
intensities, although the differences were not statistically significant. However, the
magnitude of the mean difference of BLa, using Cohen’s effect size units, was
classified as small. But during maximal exercise, HR and power output were lower
during the on-water test compared with laboratory conditions, suggesting that it may
be more difficult to express a truly maximal effort during on-water rowing, possibly
because of the greater technical complexity of sculling compared with ergometer
rowing. However, as the physiological response differences varied considerably
between individuals, there does not appear to be a ‘typical’ difference between
rowing performed on the ergometer or on-water. It therefore seems likely that the
physiological responses to rowing are also influenced by rowing technique, which in
combination with disparity between movement patterns and resistance
characteristics, may result in differences in muscle recruitment between ergometer
and on-water conditions that mediate the variations in physiological responses.
Hence, there is scope for future investigations to elucidate the mechanism
responsible for the physiological response differences between ergometer and on-
water rowing. Comparisons between training intensity prescriptions based on lactate
threshold results from the laboratory and on-water tests also confirmed that
laboratory test results were not always applicable to on-water training scenarios.
Lactate thresholds results for LT1 BLa and 2OV& were significantly higher during on-
water performance, although there were no significant differences at LT2. But
compared to the criterion of the on-water test, laboratory testing under-represented
LT1 HR in 3 out of 8 cases because lower LT1 BLa thresholds were determined from
the laboratory test. LT2 HRs were generally similar between tests, although the
laboratory test again underestimated threshold HR for one subject and produced
lower LT2 BLa values in two cases. Thus, differences between the BLa thresholds
determined during laboratory and on-water tests, and decoupling of the HR-BLa
relationship, may mean that HR-based intensity prescriptions from laboratory tests
are not applicable to on-water training for all athletes. While the on-water test
improves the specificity of intensity prescriptions for on-water rowing training, field-
based activities are subject to variable environmental conditions which can
negatively affect the reproducibility of results. Indeed, measurements from repeated
on-water tests displayed similar or lesser reliability (TE=1.9-19.2%) compared to the
Chapter 7 – Summary, conclusions and recommendations
157
TE established for the laboratory test during Study 1 (TE=0.1-11.0%), but still
showed a good degree of reproducibility given the potential for the confounding
influence of environmental conditions.
While the improved specificity of the on-water protocol increases the likelihood that
test results will better reflect an athlete’s fitness status and performance potential,
inferior reliability compared to the laboratory test reduces the field test’s sensitivity
to fitness changes and may limit its effectiveness as a means of longitudinally
monitoring fitness status. Following a 6 wk training block, the magnitude of the BLa
and 2OV& changes recorded by the on-water test were greater (small Cohen’s effect
size) compared with the laboratory test (trivial effect). However, the on-water and
laboratory tests both indicated that training responses were negligible in relation to
the TE established for the on-water and laboratory protocols. So although there was
some evidence that the improved specificity of the on-water method facilitated the
detection of training adaptations that were only evident during on-water
performance, it was not possible to eliminate the prospect that these effects were
merely artefacts of measurement error. Thus, the on-water test did not provide any
additional benefits for monitoring training compared with the standard laboratory-
based test. The on-water test also failed to improve the relationship between
incremental test results and rowing time-trial performance. Correlations between test
results and rowing performance were largest when the mode of rowing was matched
between the incremental test and the performance criterion (either 2000-m ergometer
time-trial or on-water maximal power output). However, the correlations were
highest between laboratory test results and 2000-m ergometer time-trials (R= -0.92 to
-0.97) compared with on-water physiological results and the maximal power output
during the on-water tests (R=0.52 to 0.92). Given that the on-water test provided no
clear benefits for monitoring longitudinal fitness changes or performance compared
with the laboratory test, and was also more time consuming and logistically
challenging, the sole application for the field-based method lies in the prescription of
specific training intensity zones for on-water rowing training.

Chapter 7 – Summary, conclusions and recommendations
158
7.2 PRACTICAL APPLICATIO�S
Findings from this project that are directly applicable to fitness testing and training
monitoring for rowing include:
• Results from rowing tests using the Concept2 Model C or Model D ergometer can
be directly compared.
• Physiological and performance changes between serial laboratory tests can be
interpreted relative to the normal between-test variation estimated by the typical
error for the laboratory protocol.
• The Cortex MetaMax3B portable indirect calorimetry system provides highly
reliable results with a satisfactory degree of accuracy and is therefore suitable for
on-water rowing applications.
• The physiological responses to simulated rowing on an ergometer and on-water
single sculling are different, but the actual differences vary substantially between
individuals.
• On-water incremental tests performed in single sculls provide exercise intensity
prescriptions that are specific to on-water rowing training, assuming that the
environmental conditions during testing are similar to those during training.
• Results from on-water incremental rowing tests are less reliable than those from
laboratory-based rowing tests.
• On-water incremental rowing tests can be used to monitor fitness changes, but are
no more effective than laboratory based tests.
• Results from laboratory-based rowing tests provide a better indication of
potential 2000-m ergometer time-trial performance compared with those from the
on-water test.
Chapter 7 – Summary, conclusions and recommendations
159
7.3 FUTURE DIRECTIO�S
This thesis has demonstrated that the physiological responses to simulated rowing on
an ergometer are different to those from the criterion of on-water performance and
that an on-water incremental rowing test can improve the specificity of exercise
prescriptions for on-water training. However, the underlying mechanisms responsible
for the physiological differences between ergometer rowing and on-water sculling
were not established. Despite the improved specificity of the on-water protocol, the
corresponding test results are subject to larger between-test variations compared with
the laboratory method, thereby reducing the on-water test’s sensitivity to detect
longitudinal fitness changes. An alternative way to improve the transfer of results
between laboratory tests and on-water training scenarios, without compromising the
reliability of the test, may involve refining ergometer based rowing simulations to
better replicate the on-water conditions, such as increasing the skill requirements to
perform on an ergometer.
Future studies may therefore attempt to isolate the mechanisms responsible for the
physiological response differences between ergometer rowing and on-water
performance. Given previous investigations comparing the biomechanics of
ergometer and on-water rowing have reported that movement patterns (Martindale
and Robertson 1984; Kleshnev 2005), force production (Elliott et al. 2002; Kleshnev
2005) and drive-to-recovery proportion (Dawson et al. 1998) all differ depending on
the mode of rowing, these factors would conceivably impact on the force-velocity
relationship of muscular contractions and the pattern of motor unit recruitment.
Investigations examining muscle activity and recruitment during rowing could
potentially identify whether differences exist between ergometer and on-water
performances, and whether individual variations might be responsible for the
observed diversity in the physiological response differences between the ergometer
rowing and on-water sculling. Additionally, as the submaximal workloads of
incremental rowing tests are controlled by pre-determined target power outputs (or
stroke rates and RPEs during our on-water test), it is possible that force production
and power-output for a given stroke rate are artificially lowered during the
incremental test, thereby altering the stroke rate-power-output relationship compared
to on-water training and performance. Thus, the actual incremental protocol could
potentially be exacerbating the physiological differences between ergometer and on-
Chapter 7 – Summary, conclusions and recommendations
160
water rowing beyond those resulting from biomechanical and movement pattern
variations. Stroke rate-power output relationships and physiological responses should
therefore be compared between situations where rowing workloads are prescribed
using submaximal power outputs and by target stroke rates only (whereby power
output is self-selected), to establish if the results are consistent between conditions.
Future research may also evaluate ways to better replicate on-water rowing in the
controlled laboratory environment. It has previously been suggested that the ‘floating
foot-stretcher’ Rowperfect ergometer (Elliott et al. 2002), or an ergometer placed on
rollers (Martindale and Robertson 1984), better replicates the movement patterns of
on-water sculling. However, Kleshnev (2005) cautions that there are still
biomechanical differences between rowing performed on the Rowperfect ergometer
and in single sculls. Nevertheless, further work to better match the gearing and
resistance characteristics of the ergometer flywheel to the actual on-water condition
may improve rowing simulations provided by the Rowperfect ergometer, or the
Concept2 when used with slides that permit the entire ergometer to move. This could
possibly be achieved by simultaneously examining physiological responses and
biomechanical factors across a range of ergometer resistance settings, and attempting
to find the setting that best reproduces the biomechanics and physiology of the on-
water criterion. In the case of the Concept2 ergometer, resistance characteristics can
be adjusted by modulating the degree of flywheel damping, which can be controlled
using the ‘drag factor’. It may therefore be possible to improve rowing simulations
on the Concept2 by adopting a more suitable drag factor setting during laboratory
tests. Moreover, as the ‘gearing’ and resistance characteristics of on-water rowing
will differ between boat classes (i.e. single scull and coxed eight), Concept2
dragfactor settings could possibly be adjusted to simulate any of these classes. Thus,
further research that critically evaluates laboratory-based rowing tests, and that
attempts to improve ergometer-based rowing simulations, may eventually enable
valid on-water training recommendations to be prescribed from laboratory-based
rowing tests. Such an outcome would also avoid the logistical difficulties and
limitations associated with conducting incremental rowing tests in the field.

References
161
REFERE�CES
1. Affeld, K., Schichl, K. and Ziemann, A. (1993). "Assessment of rowing efficiency." International Journal of Sports Medicine, 14 (Suppl 1): S39-41.
2. Aitchison, D. and Grey, A. (2002). A rowing gate based force sensor for the
accurate assessment of propulsive force development. International Conference on the Engineering of Sport, Kyoto, Japan, Blackwell Publishing.
3. Altenburg, D. (1992). "Planning and organizing general fitness training for
rowers." FISA Coach, 3 (1): 5-8. 4. Armstrong, L. and Costill, D. (1985). "Variability of respiration and
metabolism: responses to submaximal cycling and running." Research Quarterly for Exercise and Sport, 56: 93-96.
5. Åstrand, P.-O., Rodahl, K., Dahl, H. and Strømme, S. (2003). Textbook of
Work Physiology: Physiological Bases of Exercise. 4th edition. Human Kinetics, Champaign.
6. Atkinson, G., Davison, R. and Nevill, A. (2005). "Performance characteristics
of gas analysis systems: what we know and what we need to know." International Journal of Sports Medicine, 26 (Suppl 1): S2-10.
7. Barrett, R. and Manning, J. (2004). "Relationships between rigging set-up,
anthropometry, physical capacity, rowing kinematics and rowing performance." Sports Biomechanics, 3 (2): 221-235.
8. Batterham, A. and Hopkins, W. (2006). "Making meaningful inferences about
magnitudes." International Journal of Sports Physiology and Performance, 1: 50-57.
9. Beneke, R. (1995). "Anaerobic threshold, individual anaerobic threshold, and
maximal lactate steady state in rowing." Medicine and Science in Sports and Exercise, 27 (6): 863-867.
10. Bishop, D., Jenkins, D. and Mackinnon, L. (1998). "The relationship between
plasma lactate parameters, Wpeak and 1-h cycling performance in women." Medicine and Science in Sports and Exercise, 30 (8): 1270-1275.
11. Bland, J. and Altman, D. (1986). "Statistical methods for assessing agreement
between two methods of clinical measurment." Lancet, 1: 307-310. 12. Bloomfield, J. and Roberts, A. (1972). "A correlational and trend analysis of
strength and aerobic power scores in prediction of rowing performance." Australian Journal of Sports Medicine, 4: 25-36.
13. Bompa, T. (1980). "Technique and muscle force." Canadian Journal of
Applied Sport Sciences, 5 (4): 245-249.

References
162
14. Bompa, T., Hebbelinck, M. and Van Gheluwe, B. (1985). "Force analysis of the rowing stroke employing two differing oar grips." Canadian Journal of Applied Sport Sciences, 10 (2): 64-67.
15. Borg, G. (1973). "Perceived exertion: a note on "history" and methods."
Medicine and Science in Sports and Exercise, 5: 90-93. 16. Bourdin, M., Messonnier, L., Hager, J. and Lacour, J. (2004). "Peak power
output predicts rowing ergometer performance in elite male rowers." International Journal of Sports Medicine, 25: 368-373.
17. Bourdon, P. (2000). "Blood lactate transition thresholds: concepts and
controversies." In Physiological tests for elite athletes. Edited by C. Gore. Human Kinetics, Champaign, IL.
18. Bourdon, P., David, A. and Buckley, J. (2009). "A single exercise test for
assessing physiological and performance parameters in elite rowers: the 2-in-1 test." Journal of Science and Medicine in Sport, 12: 205-211.
19. Boyas, S., Nordez, A., Cornu, C. and Guevel, A. (2006). "Power responses of
a rowing ergometer: mechanical sensors vs. Concept2 measurement system." International Journal of Sports Medicine, 27 (10): 830-833.
20. Brooks, G. (1985). "Anaerobic threshold: review of the concept and
directions for future research." Medicine and Science in Sports and Exercise, 17 (1): 22-34.
21. Bruce, C., Anderson, M., Fraser, S., Stepto, N., Klein, R., Hopkins, W. and
Hawley, J. (2000). "Enhancement of 2000-m rowing performance after caffeine ingestion." Medicine and Science in Sports and Exercise, 32 (11): 1958-1963.
22. Buckley, J., Bourdon, P. and Woolford, S. (2003). "Effect of measuring blood
lactate concentrations using different automated lactate analysers on blood lactate transition thresholds." Journal of Science and Medicine in Sport, 6 (4): 408-421.
23. Bunc, V., Heller, J., Moravec, P. and Sprynarova, S. (1989). "Ventilatory
threshold and mechanical efficiency in endurance runners." European Journal of Applied Physiology, 58: 693-698.
24. Celentano, F., Cortili, G., Di Prampero, P. and Cerretelli, P. (1974).
"Mechanical aspects of rowing." Journal of Applied Physiology, 36 (6): 642-647.
25. Chènier, D. and Leger, L. (1991). "Measurement of VO2max with two rowing
ergometers on the water in a skiff." Canadian Journal of Applied Sport Sciences, 16 (4): 258-263.
26. Chirtel, S., Barbee, R. and Stainsby, W. (1984). "Net O2, CO2, lactate, and
acid exchange by muscle during progressive working contractions." Journal of Applied Physiology, 56 (1): 161-165.

References
163
27. Clausen, J. (1976). "Circulatory adjustments to dynamic exercise and effect of physical training in normal subjects and in patients with coronary artery disease." Progress in Cardiovascular Diseases, 18 (6): 459-495.
28. Clifford, P., Hanel, B. and Secher, N. (1994). "Arterial blood pressure
response to rowing." Medicine and Science in Sports and Exercise, 26 (6): 715-719.
29. Coen, B., Urhausen, A. and Kindermann, W. (2003). "Sport specific
performance diagnosis in rowing: an incremental graded exercise test in coxless pairs." International Journal of Sports Medicine, 24 (6): 428-432.
30. Cohen, J. (1988). Statistical power analysis for the behavioral sciences. 2nd
edition. Laurence Erlbaum Associates, New Jersey: 567. 31. Cohen, J. (1990). "Things I have learned (so far)." American Psychologist, 45
(12): 1304-1312. 32. Connett, R., Gayeski, T. and Honig, C. (1984). "Lactate accumulation in fully
aerobic, working, dog gracilis muscle." American Journal of Physiology, 246 (1): H120-128.
33. Cosgrove, M., Wilson, J., Watt, D. and Grant, S. (1999). "The relationship
between selected physiological variables of rowers and rowing performance as determined by a 2000 m ergometer test." Journal Sports Sciences, 17 (11): 845-852.
34. Coyle, E., Martin, W., Ehsani, A., Hagberg, J., Bloomfield, S., Sinacore, D.
and Holloszy, J. (1983). "Blood lactate threshold in some well-trained ischemic heart disease patients." Journal of Applied Physiology, 54 (1): 18-23.
35. Crouter, S., Antczak, A., Hudak, J., DellaValle, D. and Haas, J. (2006).
"Accuracy and reliability of the ParvoMedics TrueOne 2400 and MedGraphics VO2000 metabolic systems." European Journal of Applied Physiology, 98 (2): 139-151.
36. Crouter, S., Foster, C., Esten, P., Brice, G. and Porcari, J. (2001).
"Comparison of incremental treadmill exercise and free range running." Medicine and Science in Sports and Exercise, 33: 644-647.
37. Davis, J. (1985). "Anaerobic threshold: review of the concept and directions
for future research." Medicine and Science in Sports and Exercise, 17 (1): 6-21.
38. Dawson, R., Lockwood, R., Wilson, J. and Freeman, G. (1998). "The rowing
cycle: sources of variance and invariance in ergometer and on-the-water performance." Journal of Motor Behaviour, 30 (1): 33-43.
39. Di Prampero, P., Cortili, G., Celentano, F. and Cerretelli, P. (1971).
"Physiological aspects of rowing." Journal of Applied Physiology, 31 (6): 853-857.

References
164
40. Donovan, C. and Brooks, G. (1983). "Endurance training affects lactate clearance, not lactate production." American Journal of Physiology, 244 (1): E83-92.
41. Douglas, C. (1911). "A method for determing the total respiratory exchange
in man." Journal of Physiology, 42: 17-18. 42. Driller, M., Fell, J., Gregory, J., Shing, C. and Williams, A. (2009). "The
effects of high-intensity interval training in well-trained rowers." International Journal of Sports Physiology and Performance, 4 (1): 110-121.
43. Droghetti, P., Jensen, K. and Nilsen, T. (1991). "The total estimated
metabolic cost of rowing." FISA coach, 2 (2): 1-4. 44. Duffield, R., Dawson, B., Pinnington, H. and Wong, P. (2004). "Accuracy
and reliability of a Cosmed K4b2 portable gas analysis system." Journal of Science and Medicine in Sport, 7 (1): 11-22.
45. Eisenmann, J., Brisko, N., Shadrick, D. and Welsh, S. (2003). "Comparative
analysis of the Cosmed Quark b2 and K4b2 gas analysis systems during submaximal exercise." Journal of Sports Medicine and Physical Fitness, 43: 150-155.
46. Elliott, B., Lyttle, A. and Birkett, O. (2002). "The RowPerfect ergometer: a
training aid for on-water single scull rowing." Sports Biomechanics, 1 (2): 123-134.
47. Forsyth, J. and Reilly, T. (2003). "Reliability of lactate threshold assessment
during rowing." Journal Sports Sciences, 21 (4): 272. 48. Fukunaga, T., Matsuo, A., Yamamoto, K. and Asami, T. (1986). "Mechanical
efficiency in rowing." European Journal of Applied Physiology and Occupational Physiology, 55 (5): 471-475.
49. Godfrey, R. and Whyte, G. (2006). "Life at the top: how are elite rowers
tested and monitored?" Peak Performance, 240: 5-8. 50. Gore, C., Catcheside, P., French, S., Bennett, J. and Laforgia, J. (1997).
"Automated VO2max calibrator for open-circuit indirect calorimetry systems." Medicine and Science in Sports and Exercise, 29 (8): 1095-1103.
51. Gore, C., Hopkins, W. and Burge, C. (2005). "Errors of measurement for
blood volume parameters: a meta-analysis." Journal of Applied Physiology, 99 (Novemeber): 1745–1758.
52. Green, H., Hughson, R., Orr, G. and Ranney, D. (1983). "Anaerobic
threshold, blood lactate, and muscle metabolites in progressive exercise." Journal of Applied Physiology, 54 (4): 1032-1038.
53. Gullstrand, L. (1996). "Physiological responses to short-duration high-
intensity intermittent rowing." Canadian Journal of Applied Physiology, 21 (3): 197-208.

References
165
54. Hagberg, J. (1984). "Physiological implications of the lactate threshold." International Journal of Sports Medicine, 5 (Suppl 1): S106-109.
55. Hagberg, J. and Coyle, E. (1983). "Physiological determinants of endurance
performance as studied in competitive racewalkers." Medicine and Science in Sports and Exercise, 15 (4): 287-289.
56. Hagberg, J., Coyle, E., Carroll, J., Miller, J., Martin, W. and Brooke, M.
(1982). "Exercise hyperventilation in patients with McArdle's disease." Journal of Applied Physiology, 52 (4): 991-994.
57. Hagerman, F. (1984). "Applied physiology of rowing." Sports Medicine, 1:
303-326. 58. Hagerman, F. (2000). "Physiology of competitive rowing". In Exercise and
Sport Science. Edited by W. E. J. Garrett and D. T. Kirkendall. Lippincott Williams & Wilkins, Philadelphia, PA: 843-873.
59. Hagerman, F., Addington, W. and Gaensler, E. (1972). "A comparison of
selected physiological variables among outstanding competitive oarsmen." Journal of Sports Medicine and Physical Fitness, 12 (1): 12-22.
60. Hagerman, F., Connors, M., Gault, J., Hagerman, G. and Polinski, W. (1978).
"Energy expenditure during simulated rowing." Journal of Applied
Physiology, 45 (1): 87-93. 61. Hagerman, F., Hagerman, G. and Mickelson, T. (1979). "Physiological
profiles of elite rowers." Physician and Sportsmedicine, 7 (7): 74-77. 62. Hagerman, F. and Lee, W. (1971). "Measurement of oxygen consumption,
heart rate, and work output during rowing." Medicine and Science in Sports, 3 (4): 155-160.
63. Hagerman, F. and Staron, R. (1983). "Seasonal variation among physiological
variables in elite oarsmen." Canadian Journal of Applied Sport Sciences, 8 (3): 143-148.
64. Hahn, A. (1990). "Identification and selection of talent in Australian rowing."
Excel, 6 (3): 5-11. 65. Hahn, A., Bourdon, P. and Tanner, R. (2000). "Protocols for the
physiological assessment of rowers". In Physiological tests for elite athletes. Edited by C. Gore. Human Kinetics, Champaign, IL: 311-326.
66. Hahn, A., Tumilty, D., Shakespear, P., Rowe, P. and Telford, R. (1988).
"Physiological testing of oarswomen on Gjessing and Concept II rowing ergometers." Excel, 5 (1): 19-22.
67. Hartmann, U., Mader, A., Wasser, K. and Klauer, I. (1993). "Peak force,
velocity, and power during five and ten maximal rowing ergometer strokes by world class female and male rowers." International Journal of Sports Medicine, 14 (Suppl 1): S42-45.
References
166
68. Hausswirth, C., Bigard, A. and Le Chevalier, J. (1997). "The Cosmed K4 telemetry system as an accurate device for oxygen uptake measurments during exercise." International Journal of Sports Medicine, 18: 449-453.
69. Heck, H., Mader, A., Hess, G., Mucke, S., Muller, R. and Hollmann, W.
(1985). "Justification of the 4-mmol/l lactate threshold." International Journal of Sports Medicine, 6 (3): 117-130.
70. Henry, J., Clark, R., McCabe, R. and Vanderby, R., Jr. (1995). "An
evaluation of instrumented tank rowing for objective assessment of rowing performance." Journal Sports Sciences, 13 (3): 199-206.
71. Holm, S. (1979). "A simple sequentially rejective multiple test procedure."
Scandinavian Journal of Statistics, 6: 65-70. 72. Hopkins, W. (2000a). "Measures of reliability in sports medicine and
science." Sports Medicine, 30: 1-15. 73. Hopkins, W. (2000b) "A new view of statistics." Internet Society for Sport
Science: http://www.sportsci.org/resource/stats/. 74. Hopkins, W. (2002) "Probabilities of clinical or practical significance."
Sportscience, 6. 75. Hopkins, W. (2003) "A spreadsheet for analysis of straightforward controlled
trials." Sportscience, 7. 76. Hopkins, W. (2007) "A spreadsheet for deriving a confidence interval,
mechanistic inference and clinical inference from a P value." Sportscience, 11.
77. Hopkins, W., Hawley, J. and Burke, L. (1999). "Design and analysis of
research on sport performance enhancement." Medicine and Science in Sports and Exercise, 31 (3): 472-485.
78. Hopkins, W., Marshall, S., Batterham, A. and Hanin, J. (2009). "Progressive
statistics for studies in sports medicine and exercise science." Medicine and Science in Sports and Exercise, 41 (1): 3-13.
79. Hughes, E., Turner, S. and Brooks, G. (1982). "Effects of glycogen depletion
and pedaling speed on "anaerobic threshold"." Journal of Applied Physiology, 52 (6): 1598-1607.
80. Ingham, S., Carter, H. and Doust, J. (2002a). "Methods of determining
oxygen uptake kinetics during heavy exercise in rowing." Journal of Sports Sciences, 20 (1): 51-52.
81. Ingham, S., Whyte, G., Jones, K. and Nevill, A. (2002b). "Determinants of
2,000 m rowing ergometer performance in elite rowers." European Journal of Applied Physiology, 88 (3): 243-246.

References
167
82. Jackson, R. and Secher, N. (1976). "The aerobic demands of rowing in two Olympic rowers." Medicine and Science in Sports, 8 (3): 168-170.
83. Jacobs, I. (1986). "Blood lactate, implications for training and sports
performance." Sports Medicine, 3: 10-25. 84. Jürimäe, J. and Jürimäe, T. (2001). "Responses of blood hormones to the
maximal rowing ergometer test in college rowers." Journal of Sports Medicine and Physical Fitness, 41 (1): 73-77.
85. Jürimäe, J., Mäestu, J. and Jürimäe, T. (2002a). "The relationship between
different physiological variables of rowers and rowing performance as determined by a maximal rowing ergometer test." Journal of Human Movement Studies, 42 (5): 367-382.
86. Jürimäe, J., Mäestu, J., Jürimäe, T. and Pihl, E. (1999). "Relationship
between rowing performance and different metabolic parameters in male rowers." Medicina Dello Sport, 52 (2): 119-126.
87. Jürimäe, J., Mäestu, J., Jürimäe, T. and Pihl, E. (2000). "Prediction of rowing
performance on single sculls from metabolic and anthropometric variables." Journal of Human Movement Studies, 38: 123-136.
88. Jürimäe, J., Purge, P., Mäestu, J. and Jürimäe, T. (2002b). "Physiological
responses to successive days of intense training in competitive rowers." Hungarian Review of Sports Medicine, 43 (1): 11-19.
89. Kane, D., Jensen, R., Williams, S. and Watts, P. (2008). "Effects of drag
factor on physiological aspects of rowing." International Journal of Sports Medicine, 29 (5): 390-394.
90. Katch, V., Weltman, A., Sady, S. and Freedson, P. (1978). "Validity of the
relative percent concept for equating training intensity." European Journal of Applied Physiology, 39: 219-227.
91. Kautza, B., Kastello, G. and Sothmann, M. (2004). "Validation of
MedGraphics' VO2000 portable metabolic analyzer and a modified pneumotachometer." Medicine and Science in Sports and Exercise, 36 (5): s222.
92. Kawakami, Y., Nozaki, D., Matsuo, A. and Fukunaga, T. (1992). "Reliability
of measurement of oxygen uptake by a portable telemetric system." European Journal of Applied Physiology and Occupational Physiology, 65 (5): 409-414.
93. Kindermann, W., Simon, G. and Keul, J. (1979). "The significance of the
aerobic-anaerobic transition for the determination of work load intensities during endurance training." European Journal of Applied Physiology and Occupational Physiology, 42 (1): 25-34.

References
168
94. Kleshnev, V. (2000). Power in rowing. 18th International Symposium on Biomechanics in Sport, Hong Kong, China, International Society of Biomechanics in Sports.
95. Kleshnev, V. (2005). Comparison of on-water rowing with its simulation on
Concept2 and Rowperfect machines. 23rd International Symposium on Biomechanics in Sport, Beijing, China, International Society of Biomechanics in Sports.
96. Klusiewicz, A., Faff, J. and Zdanowicz, R. (1999). "Diagnostic value of
indices derived from specific laboratory tests for rowers." Biology of Sport, 16 (1): 39-50.
97. Klusiewicz, A., Sitkowski, D., Bienko, A., Furdal, S. and Skwarczynski, T.
(1991). "Optimizing the selection of indices for assessing the work capacity of rowers." Biology of Sport, 8 (4): 167-175.
98. Koutedakis, Y. (1989). "The role of physiological assessment in team
selection with special reference to rowing." British Journal of Sports Medicine, 23 (1): 51-52.
99. Kramer, J., Leger, A., Paterson, D. and Morrow, A. (1994). "Rowing
performance and selected descriptive, field, and laboratory variables." Canadian Journal of Applied Physiology, 19 (2): 174-184.
100. LaFontaine, T., Londeree, B. and Spath, W. (1981). "The maximal steady
state versus selected running events." Medicine and Science in Sports and Exercise, 13 (3): 190-193.
101. Lamb, D. H. (1989). "A kinematic comparison of ergometer and on-water
rowing." American Journal of Sports Medicine, 17 (3): 367-373. 102. Larsson, L. and Forsberg, A. (1980). "Morphological muscle characteristics
in rowers." Canadian Journal of Applied Sport Sciences, 5 (4): 239-244. 103. Larsson, P., Wadell, K., Jakobsson, E., Burlin, L. and Henriksson-Larsén, K.
(2004). "Validation of the MetaMax II portable metabolic measurement system." International Journal of Sports Medicine, 25: 115-123.
104. Lormes, W., Buckwitz, R., Rehbein, H. and Steinacker, J. (1993).
"Performance and blood lactate on Gjessing and Concept II rowing ergometers." International Journal of Sports Medicine, 14 (Suppl 1): S29-31.
105. Lucía, A., Hoyos, J., Carvajal, A. and Chicharro, J. (1999). "Heart rate
responses to professional road cycling: The Tour de France." International Journal of Sports Medicine, 20: 167-172.
106. Lucía, A., Hoyos, J., Perez, M. and Chicharro, J. (2000). "Heart rate and
performance parameters in elite cyclists: a longitudinal study." Medicine and Science in Sports and Exercise, 32: 1777-1782.

References
169
107. Lucía, A., Pardo, J., Durantez, A., Hoyos, J. and Chicharro, J. (1998). "Physiological differences between professional and elite road cyclists." International Journal of Sports Medicine, 19: 342-348.
108. MacRae, H., Hise, K. and Allen, P. (2000). "Effects of front and dual
suspension mountain bike systems on uphill cycling performance." Medicine and Science in Sports and Exercise, 32 (7): 1276-1280.
109. Mäestu, J. and Jürimäe, J. (2000). "Anthropometrical and physiological
factors of rowing performance: a review." Acta Kinesiologiae Universitatis Tartuensis, 5: 130-150.
110. Mäestu, J., Jürimäe, J. and Jürimäe, T. (2000). "Prediction of rowing
performance from selected physiological variables." Medicina Dello Sport, 53 (3): 247-254.
111. Mahler, D., Nelson, W. and Hagerman, F. (1984). "Mechanical and
physiological evaluation of exercise performance in elite national rowers." Journal of the American Medical Association, 252 (4): 496-499.
112. Mahler, D., Parker, H. and Andresen, D. (1985). "Physiologic changes in
rowing performance associated with training in collegiate women rowers." International Journal of Sports Medicine, 6 (4): 229-233.
113. Mahony, N., Donne, B. and O'Brien, M. (1999). "A comparison of
physiological responses to rowing on friction-loaded and air-braked ergometers." Journal of Sports Sciences, 17 (2): 143-149.
114. Martin, T. and Bernfield, J. (1980). "Effect of stroke rate on velocity of a
rowing shell." Medicine and Science in Sports and Exercise, 12 (4): 250-256. 115. Martindale, W. and Robertson, D. (1984). "Mechanical energy in sculling and
in rowing an ergometer." Canadian Journal of Applied Sport Sciences, 9 (3): 153-163.
116. McKenzie, D. and Rhodes, E. (1982). "Cardiorespiratory and metabolic
responses to exercise on a rowing ergometer." Australian Journal of Sports Medicine, 14 (1): 21-23.
117. McLaughlin, J., King, G., Howley, E., Bassett, D. J. and Ainsworth, B.
(2001). "Validation of the COSMED K4 b2 portable metabolic system." International Journal of Sports Medicine, 22: 280-284.
118. McLellan, T. and Jacobs, I. (1993). "Reliability, reproducibility and validity
of the individual anaerobic threshold." European Journal of Applied Physiology and Occupational Physiology, 67 (2): 125-131.
119. McLellan, T. and Skinner, J. (1981). "The use of the aerobic threshold as a
basis for training." Canadian Journal of Applied Sport Sciences, 6 (4): 197-201.

References
170
120. Meyer, T., Davidson, R. and Kindermann, W. (2005a). "Ambulatory gas exchange measurements - current status and future options." International Journal of Sports Medicine, 26 (Suppl 1): S19-27.
121. Meyer, T., Gabriel, H. and Kindermann, W. (1999). "Is determination of
exercise intensities as percentages of VO2max or HRmax adequate?" Medicine and Science in Sports and Exercise, 31 (9): 1342-1345.
122. Meyer, T., Georg, T., Becker, C. and Kindermann, W. (2001). "Reliability of
gas exchange measurements from two different spiroergometry systems." International Journal of Sports Medicine, 22: 593-597.
123. Meyer, T., Lucia, A., Earnest, C. and Kindermann, W. (2005b). "A
conceptual framework for performance diagnosis and training prescription from submaximal gas exchange parameters - theory and application." International Journal of Sports Medicine, 26 (Suppl 1): S38-48.
124. Mickelson, T. and Hagerman, F. (1982). "Anaerobic threshold measurements
of elite oarsmen." Medicine and Science in Sports and Exercise, 14 (6): 440-444.
125. Mikulić, P., Ruzić, L. and G., O. (2007). "What distinguishes the Olympic
level heavyweight rowers from other internationally successful rowers?" Collegium Antropologicum, 31 (3): 811-816.
126. Millet, G., Tronche, C., Fuster, N. and Candau, R. (2002). "Level ground and
uphill cycling efficiency in seated and standing positions." Medicine and Science in Sports and Exercise, 34 (10): 1645-1652.
127. Payne, W., Smith, R., Galloway, M. and Hull, T. (1995). How valid is
ergometer testing for measuring blood lactate profiles: summary report. National Sports Research Centre, Belconnen, A.C.T.
128. Payne, W., Smith, R., Galloway, M. and Hull, T. (1996). The validity of
ergometer testing in rowing. National Sports Research Centre, Australian Sports Commission, Belconnen, A.C.T.
129. Petibois, C., Cazorla, G. and Deleris, G. (2003). "The biological and
metabolic adaptations to 12 months training in elite rowers." International Journal of Sports Medicine, 24 (1): 36-42.
130. Pinnington, H., Wong, P., Tay, J., Green, D. and Dawson, B. (2001). "The
level of accuracy and agreement in measures of FEO2, FECO2 and VE between the Cosmed K4b2 portable, respiratory gas analysis system and a metabolic cart." Journal of Science and Medicine in Sport, 4 (3): 324-335.
131. Prieur, F., Castells, J. and Denis, C. (2003). "A methodology to assess the
accuracy of a portable metabolic system (VmaxSTTM)." Medicine and Science in Sports and Exercise, 35 (5): 879-885.

References
171
132. Pripstein, L., Rhodes, E., McKenzie, D. and Coutts, K. (1999). "Aerobic and anaerobic energy during a 2-km race simulation in female rowers." European Journal of Applied Physiology and Occupational Physiology, 79 (6): 491-494.
133. Robertson, E., Pyne, D., Hopkins, W. and Anson, J. (2009). "Analysis of lap
times in international swimming competitions." Journal of Sports Sciences, 27 (4): 387-395.
134. Romer, L., Davies, P., Godfrey, R., Humphrey, S., McCarthy, P. and
Ramsay, R. (1999). "Anaerobic and aerobic contributions to intense exercise in elite rowers: effects of sex and weight category." Journal of Sports Sciences, 17: 43-44.
135. Roth, W., Schwanitz, P., Pas, P. and Bauer, P. (1993). "Force-time
characteristics of the rowing stroke and corresponding physiological muscle adaptations." International Journal of Sports Medicine, 14 (Suppl 1): S32-34.
136. Russell, A., le Rossignol, P. and Sparrow, W. (1998). "Prediction of elite
schoolboy 2000 m rowing ergometer performance from metabolic, anthropometric and strength variables." Journal of Sports Sciences, 16: 749-754.
137. Russell, G., Gore, C., Ashenden, M., Parisotto, R. and Hahn, A. (2002).
"Effects of prolonged low doses of recombinant human erythropoietin during submaximal and maximal exercise." European Journal of Applied
Physiology, 86 (5): 442-449. 138. Ryan-Tanner, R., Hahn, A., Lawton, E., Bellenger, S. and Kearns, A.
(1999a). A comparison of "performance" during on-water racing and ergometer rowing. Fifth IOC World Congress on Sport Sciences; Australian Conference of Science and Medicine in Sport Sydney, Sports Medicine Australia, Canberra.
139. Ryan-Tanner, R., Hahn, A., Lawton, E., Bellenger, S. and Kearns, A.
(1999b). A comparison of physiological responses to ergometer and on-water rowing. Fifth IOC World Congress on Sport Sciences; Australian Conference of Science and Medicine in Sport Sydney, Sports Medicine Australia, Canberra.
140. Saltin, B. and Astrand, P. (1967). "Maximal oxygen uptake in athletes."
Journal of Applied Physiology, 23 (3): 353-358. 141. Sanderson, B. and Martindale, W. (1986). "Towards optimizing rowing
technique." Medicine and Science in Sports and Exercise, 18 (4): 454-468. 142. Schabort, E., Hawley, J., Hopkins, W. and Blum, H. (1999). "High reliability
of performance of well-trained rowers on a rowing ergometer." Journal of Sports Sciences, 17 (8): 627-632.

References
172
143. Schulz, H., Helle, S. and Heck, H. (1997). "The validity of the telemetric system CORTEX X1 in the ventilatory and gas exchange measurment during exercise." International Journal of Sports Medicine, 18: 454-457.
144. Secher, N. (1983). "The physiology of rowing." Journal of Sports Sciences, 1
(1): 23-53. 145. Secher, N. (1990). "Rowing". In Physiology of Sports. Edited by T. Reilly. E.
& F. N. Spon, London: 259-285. 146. Secher, N. (1993). "Physiological and biomechanical aspects of rowing.
Implications for training." Sports Medicine, 15 (1): 24-42. 147. Secher, N., Espersen, M., Binkhorst, R., Andersen, P. and Rube, N. (1982a).
"Aerobic power at the onset of maximal exercise." Scandinavian Journal of Sports Sciences, 4 (1): 12-16.
148. Secher, N., Ruberg-Larsen, N., Binkhorst, R. and Bonde-Petersen, F. (1974).
"Maximal oxygen uptake during arm cranking and combined arm plus leg exercise." Journal of Applied Physiology, 36 (5): 515-518.
149. Secher, N. and Vaage, O. (1983). "Rowing performance, a mathematical
model based on analysis of body dimensions as exemplified by body weight." European Journal of Applied Physiology and Occupational Physiology, 52 (1): 88-93.
150. Secher, N., Vaage, O. and Jackson, R. (1982b). "Rowing performance and
maximal aerobic power of oarsmen." Scandinavian Journal of Sports Sciences, 4 (1): 9-11.
151. Secher, N., Vaage, O., Jensen, K. and Jackson, R. (1983). "Maximal aerobic
power in oarsmen." European Journal of Applied Physiology and
Occupational Physiology, 51 (2): 155-162. 152. Shephard, R. (1998). "Science and medicine of rowing: a review " Journal of
Sports Sciences, 16 (7): 603-620. 153. Sjodin, B., Jacobs, I. and Svedenhag, J. (1982). "Changes in onset of blood
lactate accumulation (OBLA) and muscle enzymes after training at OBLA." European Journal of Applied Physiology and Occupational Physiology, 49 (1): 45-57.
154. Skinner, J. and McLellan, T. (1980). "The transition from aerobic to
anaerobic metabolism." Research Quarterly for Exercise and Sport, 51 (1): 234-248.
155. Smith, R., Galloway, M., Patton, R. and Spinks, W. (1993). "Ergometer based
prediction of on-water rowing performance." Sports Coach, 16 (2): 24-26. 156. Smith, R., Galloway, M., Patton, R. and Spinks, W. (1994). "Analysing on-
water rowing performance." Sports Coach, 17: 37-40.

References
173
157. Smith, R. and Loschner, C. (2002). "Biomechanics feedback for rowing." Journal of Sports Sciences, 20: 783-791.
158. Soper, C. and Hume, P. (2004). "Reliability of power output during rowing
changes with ergometer type and race distance." Sports Biomechanics, 3 (2): 237-248.
159. Stegmann, H. and Kindermann, W. (1982). "Comparison of prolonged
exercise tests at the individual anaerobic threshold and the fixed anaerobic threshold of 4 mmol.l-1 lactate." International Journal of Sports Medicine, 3 (2): 105-110.
160. Steinacker, J. (1993). "Physiological aspects of training in rowing."
International Journal of Sports Medicine, 14 (Suppl 1): S3-10. 161. Steinacker, J., Both, M. and Whipp, B. (1993a). "Pulmonary mechanics and
entrainment of respiration and stroke rate during rowing." International Journal of Sports Medicine, 14 (Suppl 1): S15-19.
162. Steinacker, J., Laske, R., Hetzel, W., Lormes, W., Liu, Y. and Stauch, M.
(1993b). "Metabolic and hormonal reactions during training in junior oarsmen." International Journal of Sports Medicine, 14 (Suppl 1): S24-28.
163. Steinacker, J., Marx, T. and Theil, U. (1982). A rowing ergometer test with
stepwise increased workloads. World Congress of Sports Medicine, Vienna, Urban and Schwarzenberg.
164. Steinacker, J., Michalsky, R., Grünert-Fuchs, M. and Lormes, W. (1987).
"Field tests in rowing (English translation of Feldtests im rudern)." Deutsche Zeitschrift Für Sportmedizin, 38: 19-26.
165. Sterne, J. and Davey Smith, G. (2001). "Sifting the evidence-what's wrong
with significance tests?" British Medical Journal, 322: 226-231. 166. Stuart, M., Howley, E., Gladden, L. and Cox, R. (1981). "Efficiency of
trained subjects differing in maximal oxygen uptake and type of training." Journal of Applied Physiology, 50: 444-449.
167. Urhausen, A., Coen, B., Weiler, B. and Kindermann, W. (1993a). "Individual
anaerobic threshold and maximum lactate steady state." International Journal of Sports Medicine, 14 (3): 134-139.
168. Urhausen, A., Weiler, B. and Kindermann, W. (1993b). "Heart rate, blood
lactate, and catecholamines during ergometer and on water rowing." International Journal of Sports Medicine, 14 (Suppl 1): S20-23.
169. Vaage, O. (1977). "Table 16-2". In Textbook of Work Physiology. 2nd
edition. Edited by P.-O. Åstrand and K. Rodahl. McGraw-Hill, New York. 170. Vermulst, L., Vervoorn, C., Boelens-Quist, A., Koppeschaar, H., Erich, W.,
Thijssen, J. and de Vries, W. (1991). "Analysis of seasonal training volume and working capacity in elite female rowers." International Journal of Sports Medicine, 12 (6): 567-572.
References
174
171. Vogler, A., Lindh, A. and Rice, A. (2008). Accuracy and reliability of MinimaxX GPS technology in rowing (Abstract). 13th Annual Congress of the European College of Sport Science. Editorial do Ministério da Educação, Estoril, Portugal: 693-694.
172. Vogler, A., Rice, A. and Withers, R. (2007). "Physiological responses to
exercise on different models of Concept II rowing ergometer." International Journal of Sports Physiology and Performance, 2 (December): 360-370.
173. Wasserman, K. and McIlroy, M. (1964). "Detecting the threshold of
anaerobic metabolism in cardiac patients during exercise." American Journal of Cardiology, 14: 844-852.
174. Withers, R., Gore, C., Gass, G. and Hahn, A. (2000). "Determination of
maximal oxygen consumption (VO2 max) or maximal aerobic power". In Physiological Tests For Elite Athletes. Edited by C. Gore. Human Kinetics, Champaign, IL: 114-127.
175. Womack, C., Davis, S., Wood, C., Sauer, K., Alvarez, J., Weltman, A. and
Gaesser, G. (1996). "Effects of training on physiological correlates of rowing ergometry performance." Journal of Strength and Conditioning Research, 10 (4): 234-238.
176. Woolford, S. and Gore, C. J. (2004). " Interpreting skinfold sums. Use of
absolute or relative typical error?" American Journal of Human Biology, 16 (1): 87-90.
177. Yoshiga, C. and Higuchi, M. (2003). "Rowing performance of female and
male rowers." Scandinavian Journal of Medicine and Science in Sports, 13 (5): 317-321.

Appendix: Physiological responses to exercise on different models of Concept II rowing ergometer
175
APPENDIX
PUBLICATIONS
CHAPTER 3: VALIDATIO� OF THE CO�CEPT2 MODEL D
ROWI�G ERGOMETER
Vogler, A., Rice, A. and Withers, R. (2007). "Physiological responses to exercise on
different models of the Concept II rowing ergometer." International Journal of
Sports Physiology and Performance, 2 (4): 360-370.
Appendix: Physiological responses to exercise on different models of Concept II rowing ergometer
176
Physiological responses to exercise on different models of Concept II
rowing ergometer
Original Investigation
Andrew J. Vogler 1,2
, Anthony J. Rice 1 and Robert T. Withers
2
1 Department of Physiology, Australian Institute of Sport, Canberra, ACT, Australia
2616 2 Exercise Physiology Laboratory, Flinders University, Bedford Park, SA, Australia
5042
Purpose: The Concept II Model C (IIC) rowing ergometer was replaced by the
Concept II Model D (IID), but the design modifications of the updated ergometer
may alter resistance characteristics and rowing technique thereby potentially
influencing ergometer test results. This study evaluated the physiological response to
rowing on the IIC and IID ergometers during a sub-maximal progressive incremental
test and maximal performance time trial. Methods: Eight national level rowers
completed sub-maximal and maximal tests on the IIC and IID ergometers separated
by 48-72 h. Physiological responses and calculated blood lactate thresholds (LT1 and
LT2) were compared between ergometer models (IIC vs. IID) using standardised
drag factor settings. Results: Power output, oxygen consumption, rowing economy
(mLO2.min-1.W-1), heart rate, blood lactate concentration, stroke rate and rating of
perceived exertion all displayed similar responses regardless of ergometer model.
Calculated physiological values equivalent to LT1 and LT2 were also similar between
models, except for blood lactate concentration at LT1 which displayed a small but
statistically significant difference (P=0.02) of 0.2 mmol.L-1. Conclusions: The
physiological response when rowing on IIC and IID ergometers is nearly identical
and testing may therefore be carried out on either ergometer and the results directly
compared.
Key Words: rowing, ergometer, oxygen consumption, blood lactate, rowing economy

Appendix: Validity and reliability of the Cortex MetaMax3B portable metabolic system
177
CHAPTER 4: VALIDITY OF THE METAMAX3B PORTABLE
METABOLIC SYSTEM
Vogler, A., Rice, A. and Gore, C. (2010). "Validity and reliability of the Cortex
MetaMax3B portable metabolic system." Accepted in Journal of Sports Sciences.

Appendix: Validity and reliability of the Cortex MetaMax3B portable metabolic system
178
Validity and reliability of the Cortex MetaMax3B portable
metabolic system
Original Investigation
ANDREW J. VOGLER1,2, ANTHONY J. RICE1 & CHRISTOPHER J. GORE1,2
1Department of Physiology, Australian Institute of Sport, Canberra, ACT, Australia
2616, 2 Exercise Physiology Laboratory, Flinders University, Bedford Park, SA,
Australia 5042
Abstract
Portable indirect calorimetry systems offer the advantage of field-based
measurements, but manufacturers rarely provide data about either validity or
reliability. This investigation evaluated the validity and reliability of the Cortex
MetaMax3B portable metabolic system. Validity was determined by comparing
MetaMax3B results against those from a first-principles metabolic calibrator and an
automated Douglas bag system. Reliability was obtained from duplicate exercise
tests completed by eight athletes. Participants completed three identical incremental
rowing tests on a Concept2 ergometer; two tests used the MetaMax3B and one test
used the Douglas bag system. Compared to the metabolic calibrator, MetaMax3B
results were within 0.20 L.min-1 (7.8%) and 6.15 L.min-1 (4.0%) for for 2OV& and
EV& , respectively. During exercise, MetaMax3B results were within 0.16 L.min-1
(4.1%; 2OV& ), 0.32 L.min-1 (7.7%; 2COV& ) and 3.22 L.min-1 (4.9%; EV& ) compared
to the Douglas bag system. MetaMax3B results were significantly higher for
submaximal 2OV& (p=0.03) and 2COV& (p<0.001). Typical error from duplicate
exercise tests using the MetaMax3B ranged from 2.0% ( 2OV& ) to 3.6% ( EV& ). Our
results show that the MetaMax3B provides reliable measurements of metabolic
demand with adequate validity for field-based measurements.
Keywords: Indirect calorimetry, oxygen consumption, carbon dioxide production,
Douglas bag
Appendix: Physiological responses to ergometer and on-water incremental rowing tests
179
CHAPTER 5: COMPARISO� OF ERGOMETER A�D O�-
WATER I�CREME�TAL ROWI�G TESTS
Vogler, A., Rice, A. and Gore, C. (2010). "Physiological responses to ergometer and
on-water incremental rowing tests." Accepted in International Journal of Sports
Physiology and Performance.

Appendix: Physiological responses to ergometer and on-water incremental rowing tests
180
Physiological responses to ergometer and on-water incremental
rowing tests
Original Investigation
Andrew J. Vogler1,2
, Anthony J. Rice1 and Christopher J. Gore
1,2
1 Department of Physiology, Australian Institute of Sport, Canberra, ACT, Australia
2616 2 Exercise Physiology Laboratory, Flinders University, Bedford Park, SA, Australia
5042
Purpose: This study evaluated the validity of ergometer tests against the criterion of
on-water rowing and determined the reliability of field measurements by comparing
results between ergometer (ERG) and on-water (OW) tests. Methods: Seven male
rowers completed incremental tests on a Concept2 rowing ergometer and in a single
scull. Average power output, oxygen consumption ( 2OV& ), heart rate (HR), blood
lactate concentration (BLa) and distance completed were measured during each ERG
and OW workload. Data treatment: Linear regression between power output and HR,
BLaand distance allowed submaximal results to be compared between ERG and OW
tests at equivalent intensities based on five standard power outputs. Submaximal
results were analyzed using repeated measure factorial ANOVAs and maximal data
used dependent t-tests (P<0.05), the magnitude of differences were also classified
using effect size analyses. The reliability of repeated measurements was established
using Typical Error. Results: Differences between ERG and OW submaximal results
were not statistically significant for power output HR, BLa, and 2OV& , but distance
completed (P<0.001) was higher during the ERG test. However, the magnitude of
physiological response differences between the ERG and OW tests varied between
individuals. Mean HR at anaerobic threshold showed good agreement between both
tests (r=0.81), but the standard error of the estimate was 9 beat.min-1. Conclusions:
Individual variation in physiological response differences between ERG and OW
tests meant that training intensity recommendations from the ERG test were not
applicable to on-water training for some rowers, but provided appropriate
prescriptions for most athletes.
Key Words: Oxygen consumption, heart rate, blood lactate threshold, training
prescription, Concept2