static.ptv.vic.gov.au docs/customer... · web viewthe initial ‘top of mind’ measure of overall...
TRANSCRIPT

PUBLIC TRANSPORTCUSTOMER SATISFACTIONMONITORSummary Report of All Modes
April to June 2017Wallis Market and Social Research

Table of Contents
Key Results Summary 1
How the Monitor is Conducted 5Measures of Satisfaction 7
Statistical Analyses 8
Metropolitan Services Overall 9Metropolitan Train Services 8
Metropolitan Tram Services 26
Metropolitan Bus Services 44
V/Line Services Overall 61V/Line Train Services 62
V/Line Coach Services 81
Appendix A: Customer Satisfaction Indices by Financial Year
Appendix B: Detailed Methodology and Technical Notes
Appendix C: Survey Questionnaires

Key Results Summary
Key points to note this quarter:
Metropolitan Services OverallThere was no significant change in overall satisfaction for Metropolitan Transport Services Overall in the 2016/17 Financial Year (FY) returning a score of 68.1 (68.4 in 2015/16), stabilising after three consecutive years of significant gains.
Metropolitan Trains
Financial Year 2016/17The 2016/17 Financial Year has seen the overall satisfaction with Metropolitan Trains stabilise after three years of improvements on both the 6-pt and 0-10 scales.
On the initial 6-point satisfaction measure, and after conversion to a score out of 100, the result was 70.7 (70.3 in 2016/16FY). While not a significant improvement, this is the highest FY score on record.
Similarly, on the more considered 0-to-10 scale, the mean score was 72.6, a small increase from 72.3 in 2015/16. This continues the overall upward trend observed over the past five years and is the highest score on record since this measure was introduced in 2009/10.
April-June Quarter 2017On the initial 6-point ‘top of mind’ satisfaction measure a score of 71.0 was achieved, slightly lower but not significantly different to 71.3 last quarter. On the more considered 0-to-10 scale overall satisfaction remains stable at 72.7 in Apr-Jun17 (73.5 in the previous quarter).
Metropolitan Trams
Financial Year 2016/17Using the initial ‘top-of-mind’ measure, tram services achieved an overall satisfaction score of 73.4 for the 2016/17 financial year (FY). This is lower than 2015/16 (74.0), although not significantly so. It nevertheless marks the first time in at least five years that the FY score has not either marginally or significantly increased from the previous year.
Measured on the 0-to-10 scale (multiplied by ten to get a score out of 100), satisfaction with overall tram services was 76.0 which is identical to the 2015/16 FY result. Again, this is the first time in seven years that this score did not at least marginally increase, potentially showing that marginal gains are going to be harder to achieve off this much higher base.
Public Transport CSM Report April - June 2017 Page 3
April-June Quarter 2017The initial ‘top of mind’ measure of overall satisfaction indicated that 90% of tram travellers were ‘totally’, ‘very’ or ‘somewhat’ satisfied with the tram services. Converted to a score of 100, the result for Apr-Jun17 was 72.4, not significantly different to the Jan-Mar17 result of 73.8.
Overall satisfaction on the more considered 0-to-10 scale, converted to a score out of 100, remained stable at 76.4 (compared to 76.2 in Jan-Mar17).
Metropolitan BusesFinancial Year 2016/17
On the initial ‘top of mind’ measure, bus services scored an overall satisfaction rating of 70.3 for the 2016/17 FY, significantly lower than the 2015/16 FY result of 72.2.
Overall satisfaction on the 0-to-10 scale (multiplied by ten to get a score out of 100) remained stable at 76.3 in 2016/17 FY (76.7 in 2015/16 FY).
April-June Quarter 2017
On the initial ‘top of mind’ satisfaction measure 86% of respondents indicated they were ‘totally’, ‘very’, or ‘somewhat’ satisfied with bus services this quarter. When converted to a score out of 100, the result was 70.2, not significantly different to the Jan-Mar17 result of 69.6.
On the more considered 0-to-10 scale (multiplied by ten to get a score out of 100), satisfaction with bus services for Apr-Jun17 was 75.9, statistically unchanged from last quarter (76.7).
V/Line Services OverallThe financial year (FY) result for this measure remained statistically stable. Overall satisfaction with V/Line services for the 2016/17 FY was 67.1, not significantly different to the rating of 67.5 in 2015/16.
V/Line Trains
Financial Year 2016/17On the initial ‘top of mind’ 6-point scale, V/Line train services achieved an overall satisfaction score of 68.1 for the 2016/17 FY, similar to the previous financial year (68.2).
Overall satisfaction on the 0-to-10 scale (multiplied by ten to get a score out of 100) remained stable with a score of 75.5 this financial year (75.9 in 2015/16FY).
April-June Quarter 2017In Apr-Jun17, on the initial ‘top-of-mind’ satisfaction measure, 80% of respondents said they were satisfied (i.e. ‘somewhat’, ‘very’ or ‘totally’ satisfied) with V/Line train services. When converted to a score out of 100, the result was 65.8, not significantly different to the Jan-Mar17 score of 68.6.
On the more considered 0-to-10 scale, satisfaction with V/Line train services was 74.3, significantly lower than the Jan-Mar17 score of 77.1.
V/Line Coaches
Public Transport CSM Report April - June 2017 Page 4

Financial Year 2016/17
Using the initial ‘top of mind’ 6-point scale, V/Line train services achieved an overall satisfaction score of 72.7 for the 2016/17 FY, significantly lower than the previous financial year (77.2).
However, the more considered 0-10 scale remained stable with a score of 81.5 (82.3 last financial year) and there were no significant changes across any of the service aspects.
April-June Quarter 2017
Satisfaction with V/Line coach services remains relatively stable again this quarter, with no changes observed among the key service aspects.
In response to the initial ‘top-of-mind’ question, 85% of users said they were ‘somewhat’, ‘very’ or ‘totally’ satisfied with the services, not significantly different to last quarter (87%). Converted to a score out of 100, the result was 73.5 (71.3 in Jan-Mar17).
Using the more considered, 0-to-10 scale, overall satisfaction was 82.8 (compared to 82.9 in Jan-Mar17), again a non-significant difference.
Public Transport CSM Report April - June 2017 Page 5

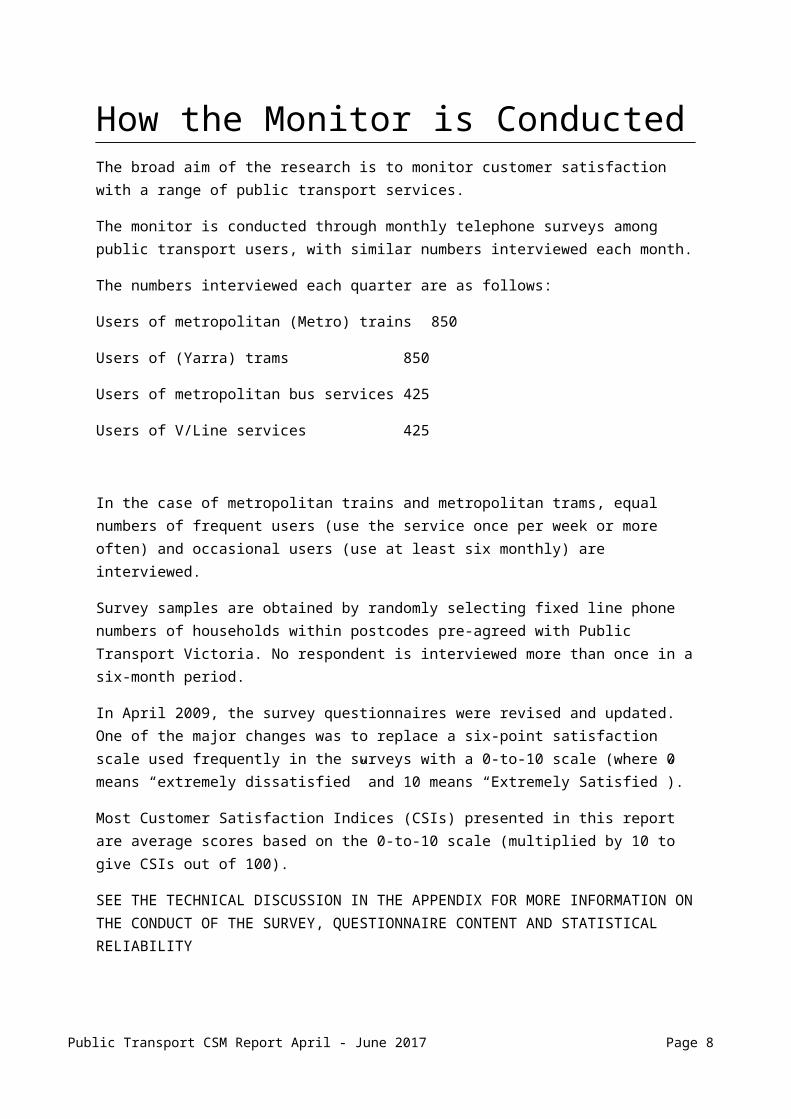
How the Monitor is ConductedThe broad aim of the research is to monitor customer satisfaction with a range of public transport services.
The monitor is conducted through monthly telephone surveys among public transport users, with similar numbers interviewed each month.
The numbers interviewed each quarter are as follows:
Users of metropolitan (Metro) trains 850
Users of (Yarra) trams 850
Users of metropolitan bus services 425
Users of V/Line services 425
In the case of metropolitan trains and metropolitan trams, equal numbers of frequent users (use the service once per week or more often) and occasional users (use at least six monthly) are interviewed.
Survey samples are obtained by randomly selecting fixed line phone numbers of households within postcodes pre-agreed with Public Transport Victoria. No respondent is interviewed more than once in a six-month period.
In April 2009, the survey questionnaires were revised and updated. One of the major changes was to replace a six-point satisfaction scale used frequently in the surveys with a 0-to-10 scale (where 0 means “extremely dissatisfied” and 10 means “Extremely Satisfied”).
Most Customer Satisfaction Indices (CSIs) presented in this report are average scores based on the 0-to-10 scale (multiplied by 10 to give CSIs out of 100).
SEE THE TECHNICAL DISCUSSION IN THE APPENDIX FOR MORE INFORMATION ON THE CONDUCT OF THE SURVEY, QUESTIONNAIRE CONTENT AND STATISTICAL RELIABILITY
Public Transport CSM Report April - June 2017 Page 6

Measures of SatisfactionIn April 2009, the survey questionnaires were revised and updated. One of the major changes was to replace a six-point satisfaction scale used frequently in the surveys with a 0-to-10 scale (where 0 means “extremely dissatisfied” and 10 means “extremely satisfied”).
Customer satisfaction is therefore measured and reported in these surveys in three different ways, as follows.
Early in the questionnaires respondents rate their satisfaction with metropolitan services overall, and with one mode of travel (train, tram, or bus) using a six-point satisfaction scale, as follows:
Totally satisfied 100Very satisfied 80Somewhat satisfied 60Somewhat dissatisfied 40Very dissatisfied 20Totally dissatisfied 0
Respondents are counted as “satisfied” with the service if they give a rating of totally satisfied, very satisfied or somewhat satisfied.
The ratings given on the six-point scale are turned into a Customer Satisfaction Index by giving the scores shown above (0, 20, 40, 60, 80, 100) for each response recorded and taking the average across all respondents.
The great majority of satisfaction questions in the questionnaires use the 0-to-10 scale (where 0 means “extremely dissatisfied” and 10 means “extremely satisfied”). Responses are averaged across all respondents and multiplied by 10 to give a score out of 100.
The six-point scale measure was the original scale used in the questionnaires, and for those few questions where it is used, there is more historical data available. The 0-to-10 scale is more precise, and is generally easier for respondents to use, but has been in use only since April 2009.
Public Transport CSM Report April - June 2017 Page 7
Statistical Analyses
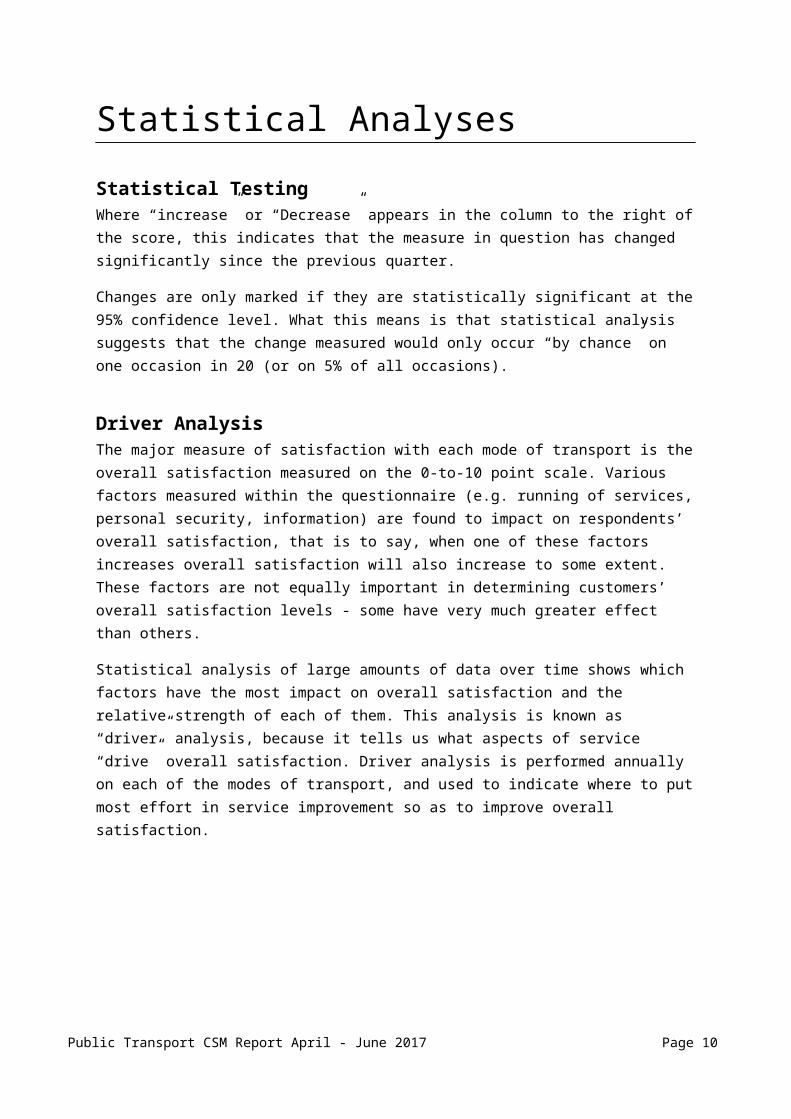
Statistical TestingWhere “increase” or “Decrease” appears in the column to the right of the score, this indicates that the measure in question has changed significantly since the previous quarter.
Changes are only marked if they are statistically significant at the 95% confidence level. What this means is that statistical analysis suggests that the change measured would only occur “by chance” on one occasion in 20 (or on 5% of all occasions).
Driver AnalysisThe major measure of satisfaction with each mode of transport is the overall satisfaction measured on the 0-to-10 point scale. Various factors measured within the questionnaire (e.g. running of services, personal security, information) are found to impact on respondents’ overall satisfaction, that is to say, when one of these factors increases overall satisfaction will also increase to some extent. These factors are not equally important in determining customers’ overall satisfaction levels - some have very much greater effect than others.
Statistical analysis of large amounts of data over time shows which factors have the most impact on overall satisfaction and the relative strength of each of them. This analysis is known as “driver” analysis, because it tells us what aspects of service “drive” overall satisfaction. Driver analysis is performed annually on each of the modes of transport, and used to indicate where to put most effort in service improvement so as to improve overall satisfaction.
Public Transport CSM Report April - June 2017 Page 8

Metropolitan Services OverallEarly in the survey, all metropolitan public transport users are asked how satisfied they are with the metropolitan services in general. The table below tracks over time the proportion of transport users who were totally, very, or somewhat satisfied with the services
Q. Overall, are you satisfied or dissatisfied with the metropolitan train, tram, and bus services provided? Is that totally, very, or somewhat (satisfied/dissatisfied)?"
From the same question, responses are translated into a Customer Satisfaction Index (refer to the How the Monitor is Conducted section for more details).
Proportion of Satisfied Users and Customer Satisfaction Index of Metropolitan Services by QuarterIncrease / Decrease signifies a significant increase or Decrease from the previous quarter
PeriodSatisfied
(%)Increase / Decrease
Apr-Jun'12 75.6
Jul-Sep'12 79.2 Increase
Oct-Dec '12 79.1
Jan-Mar '13 76.1 Decrease
Apr-Jun'13 77.5
Jul-Sep'13 81.2 Increase
Oct-Dec '13 81.6
Jan-Mar '14 81.6
Apr-Jun'14 83.1
Jul-Sep'14 83.6
Oct-Dec'14 82.8
Jan-Mar'15 85.3 Increase
Apr-Jun'15 84.7
Jul-Sep '15 85.1
Oct-Dec '15 87.2 Increase
Jan-Mar '16 87.1
Apr-Jun '16 84.9 Decrease
Jul-Sep '16 86.6
Oct-Dec'16 85.7
Jan-Mar '17 86.3
Apr-Jun '17 84.3
Period CSIIncrease / Decrease
Apr-Jun'12 61.4 Decrease
Jul-Sep'12 63.6 Increase
Oct-Dec '12 63.0
Jan-Mar '13 61.7
Apr-Jun'13 62.5
Jul-Sep'13 64.3 Increase
Oct-Dec '13 65.0
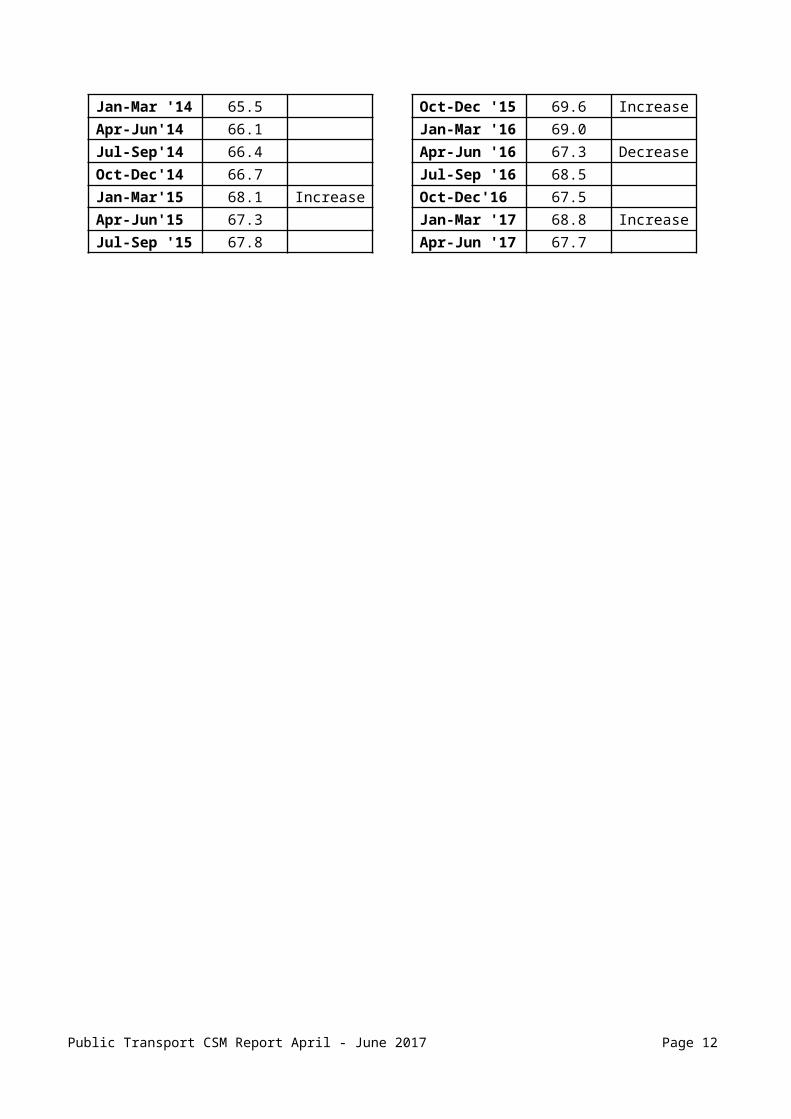
Jan-Mar '14 65.5
Apr-Jun'14 66.1
Jul-Sep'14 66.4
Oct-Dec'14 66.7
Jan-Mar'15 68.1 Increase
Apr-Jun'15 67.3
Jul-Sep '15 67.8
Oct-Dec '15 69.6 Increase
Jan-Mar '16 69.0
Apr-Jun '16 67.3 Decrease
Jul-Sep '16 68.5
Oct-Dec'16 67.5
Jan-Mar '17 68.8 Increase
Apr-Jun '17 67.7
Public Transport CSM Report April - June 2017 Page 9
Metropolitan Train Services
Summary of FindingsFinancial Year 2016/17
This quarter completes the surveys for the 2016/17 Financial Year (FY) providing an opportunity to review outcomes and progress over the full year. The 2016/17 Financial Year has seen the overall satisfaction with Metropolitan Trains stabilise after three years of improvements on both the 6-pt and 0-10 scales.
On the initial 6-point satisfaction measure, and after conversion to a score out of 100, the result was 70.7 (70.3 in 2016/16FY). While not a significant improvement, this is the highest FY score on record.
Similarly, on the more considered 0-to-10 scale, the mean score was 72.6, a small increase from 72.3 in 2015/16. This continues the overall upward trend observed over the past five years and is the highest score on record since this measure was introduced in 2009/10.
Satisfaction with ‘running of services’, the primary driver of overall satisfaction, scored 73.6 for 2016/17, significantly higher than the 2015/16 score of 72.7. Reflecting the overall improvement, this is the seventh straight FY for which this measure has increased significantly.
Satisfaction with secondary driver ‘personal security’ remained stable this FY at 69.5 (70.4 in 2015/16).
Satisfaction with ‘design, space and comfort’ of trains, another secondary driver, stood at 69.3 this FY which is higher than last FY’s score of 69.1, but not to a statistically significant level.
A significant gain was also seen for ‘information’, a tertiary driver of overall satisfaction, with a score of 74.4 this FY (73.6 in 2015/16), the fourth consecutive FY gain for this measure.
Satisfaction with ‘price’ has significantly dropped this from 70.7 in 2015/16 to 69.2 this FY.
April to June Quarter 2017
Results for Metropolitan Train services have remained relatively stable this quarter, with few significant changes observed across the key service areas.
On the initial ‘top of mind’ satisfaction measure 87% of respondents indicated they were ‘totally’, ‘very’, or ‘somewhat’ satisfied with train services this quarter. Converted to a score of 100, the result was 71.0, not statistically different to last quarter’s score (71.3).
On the more considered 0-to-10 scale (converted to a score out of 100) overall satisfaction remains stable at 72.7 in Apr-Jun17 (73.5 in the previous quarter).
Satisfaction with ‘running of services’, the primary driver of overall satisfaction, was statistically unchanged this quarter at 74.0 (74.1 in the previous quarter). Satisfaction with one service aspect relating to ‘running of services’ did improve this quarter – ‘frequency on weekends’ rose significantly to 72.2 from 68.8 in Jan-Mar17.
Public Transport CSM Report April - June 2017 Page 10

Metropolitan Train Services
Summary of findings continued… While overall satisfaction with ‘personal security’, a secondary driver of overall satisfaction, was statistically unchanged with a score of 70.0 (71.0 in Jan-Mar17) there was a significant change in one related aspect. Satisfaction with ‘security on trains during the day’ fell to 77.1 from 79.0 in Jan-Mar17.
Satisfaction with ‘design, space and comfort’ of trains, also secondary driver of overall satisfaction, was stable overall (69.0 compared to 70.1 in Jan-Mar17). However, there was a significant decline in satisfaction with ‘carriage temperature in winter’; (74.1 down from 76.9 in Jan-Mar17 (effectively reversing last quarters gains). A significant decrease was also observed in satisfaction with ‘level of crowding’ which dropped from 66.3 in Jan-Mar17 to 63.7 this quarter.
Overall satisfaction with ‘train stations’, a tertiary driver of overall satisfaction, remains stable (70.4, compared to 70.5 in the previous quarter) However, one related aspect showed significant drop - satisfaction with ‘level of lighting’ fell to 75.6 from 78.0 in the previous quarter.
The mean likelihood of recommending train services to others remained stable at 74.4. The resulting Net Promoter Score (proportion of Promoters, those giving ratings of 9-10, minus proportion of Detractors, those giving ratings of 0-6) currently sits at 5.
Public Transport CSM Report April - June 2017 Page 11
Metropolitan Train ServicesPublic transport users selected to answer questions about metropolitan train services are asked: "Overall, are you satisfied or dissatisfied with the train service on your line? Is that totally, very or somewhat?”
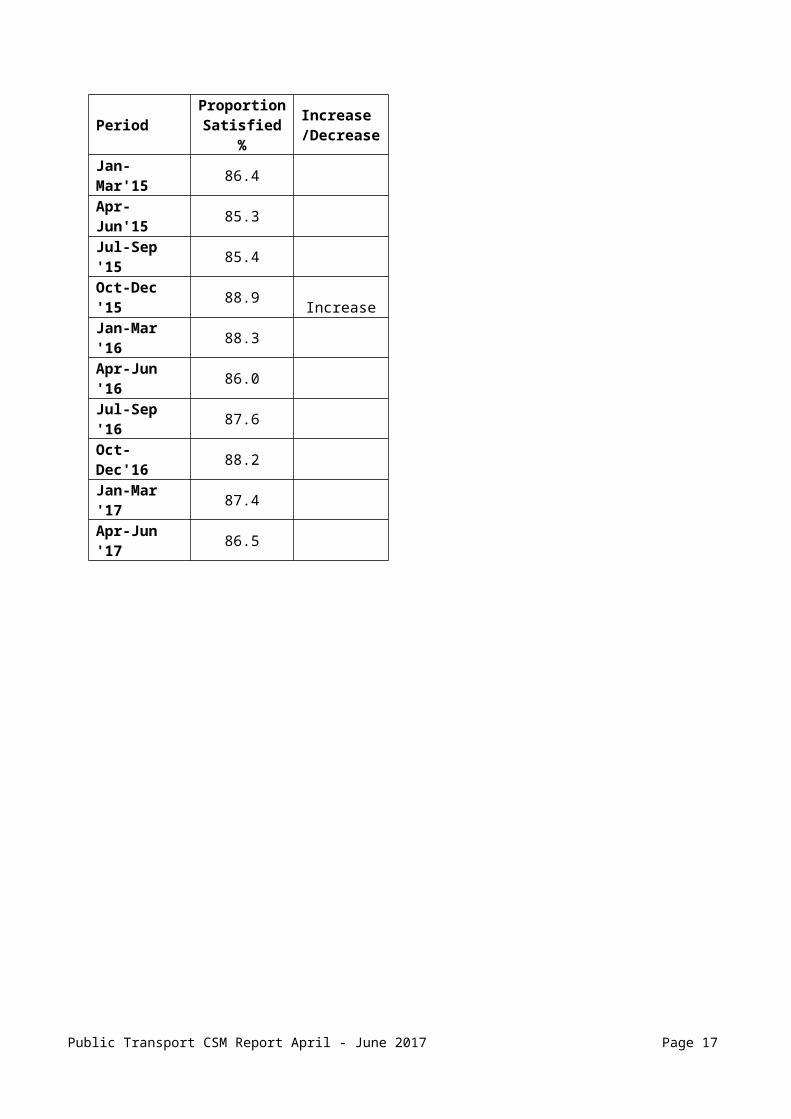
Asked near the beginning of the survey (before evaluating specific aspects of the service), this question captures the top-of-mind perception of train services. The table below illustrates the proportion of metropolitan train users who were totally, very, or somewhat satisfied with the services.
Proportion of Satisfied Users of Metropolitan Train Services by QuarterBase: Train travellersIncrease / Decrease signifies a significant increase or Decrease from the previous quarter
PeriodProportion Satisfied %
Increase /Decrease
Apr-Jun'12 74.6
Jul-Sep'12 84.4 Increase
Oct-Dec '12 81.4
Jan-Mar '13 75.6 Decrease
Apr-Jun'13 78.3
Jul-Sep'13 82.5 Increase
Oct-Dec '13 84.0
Jan-Mar '14 83.1
Apr-Jun'14 84.6
Jul-Sep'14 85.4
Oct-Dec'14 86.5
Jan-Mar'15 86.4
Apr-Jun'15 85.3
Jul-Sep '15 85.4
Oct-Dec '15 88.9 Increase
Jan-Mar '16 88.3
Apr-Jun '16 86.0
Jul-Sep '16 87.6
Oct-Dec'16 88.2
Jan-Mar '17 87.4
Apr-Jun '17 86.5
Public Transport CSM Report April - June 2017 Page 12

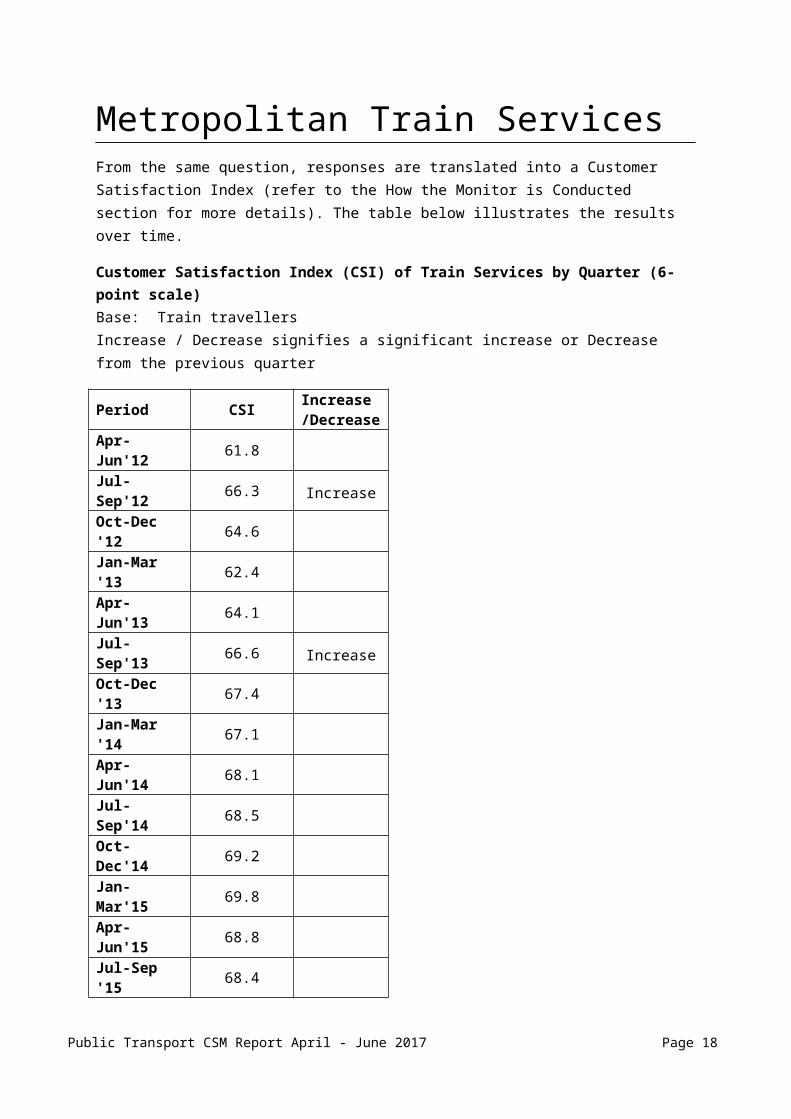
Metropolitan Train ServicesFrom the same question, responses are translated into a Customer Satisfaction Index (refer to the How the Monitor is Conducted section for more details). The table below illustrates the results over time.
Customer Satisfaction Index (CSI) of Train Services by Quarter (6-point scale)Base: Train travellersIncrease / Decrease signifies a significant increase or Decrease from the previous quarter
Period CSI Increase /Decrease
Apr-Jun'12 61.8
Jul-Sep'12 66.3 Increase
Oct-Dec '12 64.6
Jan-Mar '13 62.4
Apr-Jun'13 64.1
Jul-Sep'13 66.6 Increase
Oct-Dec '13 67.4
Jan-Mar '14 67.1
Apr-Jun'14 68.1
Jul-Sep'14 68.5
Oct-Dec'14 69.2
Jan-Mar'15 69.8
Apr-Jun'15 68.8
Jul-Sep '15 68.4
Oct-Dec '15 72.2 Increase
Jan-Mar '16 70.8
Apr-Jun '16 69.8
Jul-Sep '16 70.0
Oct-Dec'16 70.4
Jan-Mar '17 71.3
Public Transport CSM Report April - June 2017 Page 13

Period CSI Increase /Decrease
Apr-Jun '17 71.0
Metropolitan Train ServicesNear the end of the survey (after evaluating all aspects of the service), train users are asked the same question, this time using a 0-to-10 scale, where 0 means 'extremely dissatisfied' and 10 means 'extremely satisfied'. The scores are then multiplied by 10 to obtain a Customer Satisfaction Index (CSI) out of 100. The average scores over time are illustrated in the table below. This can be regarded as the 'considered' view of overall satisfaction with the services.
Customer Satisfaction Index of Train Services by Quarter (0-to-10 scale)Base: Train travellersIncrease / Decrease signifies a significant increase or Decrease from the previous quarter
Period CSI Increase /Decrease
Apr-Jun'12 65.7 Decrease
Jul-Sep'12 68.0 Increase
Oct-Dec '12 66.6
Jan-Mar '13 65.9
Apr-Jun'13 67.5
Jul-Sep'13 68.7
Oct-Dec '13 70.0
Jan-Mar '14 69.5
Apr-Jun'14 70.4
Jul-Sep'14 71.4
Oct-Dec'14 71.5
Jan-Mar'15 71.9
Apr-Jun'15 71.2
Jul-Sep '15 71.4
Oct-Dec '15 73.5 Increase
Jan-Mar '16 73.5
Apr-Jun '16 70.9 Decrease
Jul-Sep '16 71.7
Oct-Dec'16 72.6
Public Transport CSM Report April - June 2017 Page 14

Period CSI Increase /Decrease
Jan-Mar '17 73.5
Apr-Jun '17 72.7
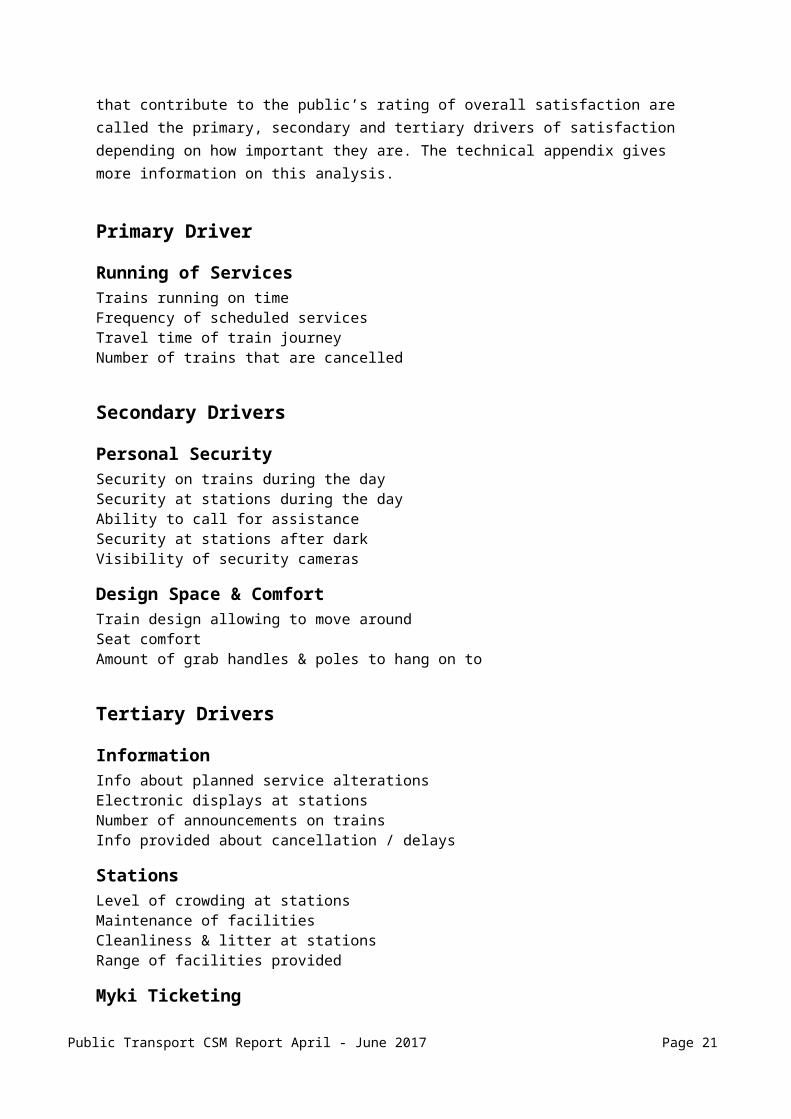
Drivers of Satisfaction with Metropolitan Train ServicesAnalysis of survey results over a long time period, and using statistical methods, allows us to determine which aspects of service have the most effect on overall satisfaction. The various aspects that contribute to the public’s rating of overall satisfaction are called the primary, secondary and tertiary drivers of satisfaction depending on how important they are. The technical appendix gives more information on this analysis.
Primary Driver
Running of ServicesTrains running on timeFrequency of scheduled servicesTravel time of train journeyNumber of trains that are cancelled
Secondary Drivers
Personal SecuritySecurity on trains during the daySecurity at stations during the dayAbility to call for assistance Security at stations after darkVisibility of security cameras
Design Space & ComfortTrain design allowing to move around Seat comfortAmount of grab handles & poles to hang on to
Tertiary Drivers
InformationInfo about planned service alterationsElectronic displays at stationsNumber of announcements on trainsInfo provided about cancellation / delays
Stations
Public Transport CSM Report April - June 2017 Page 15

Level of crowding at stationsMaintenance of facilitiesCleanliness & litter at stationsRange of facilities provided
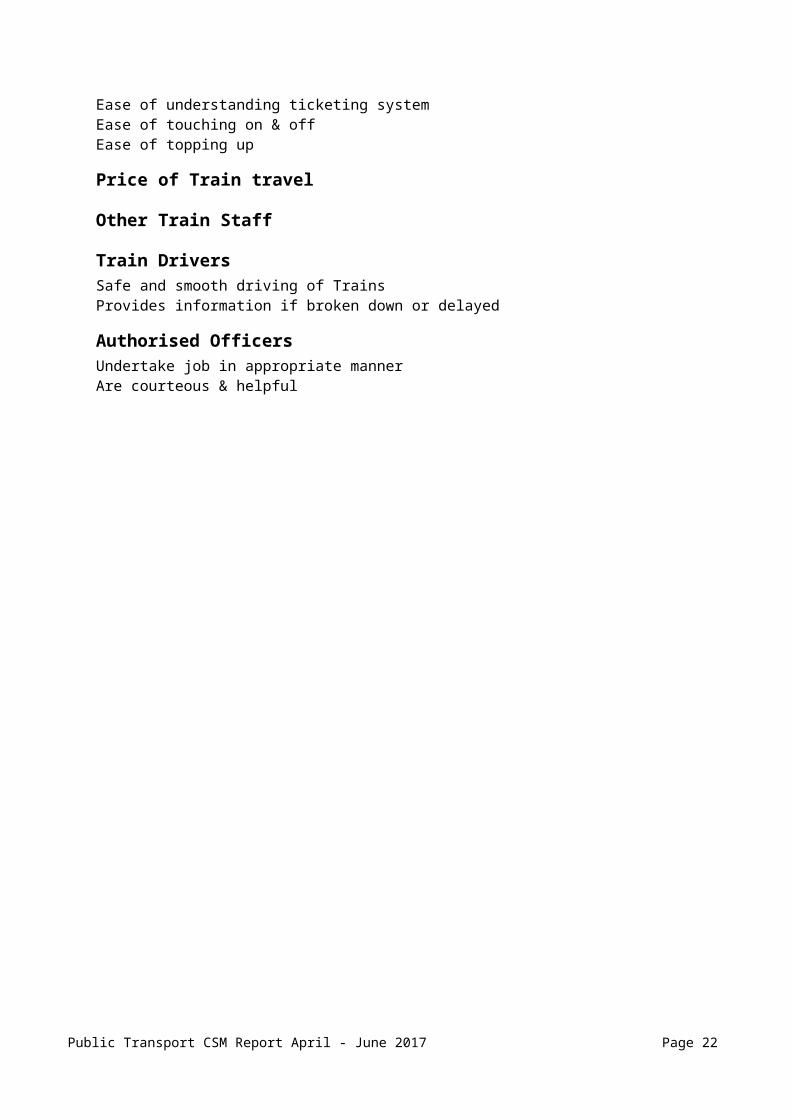
Myki TicketingEase of understanding ticketing systemEase of touching on & offEase of topping up
Price of Train travel
Other Train Staff
Train DriversSafe and smooth driving of TrainsProvides information if broken down or delayed
Authorised OfficersUndertake job in appropriate mannerAre courteous & helpful
Public Transport CSM Report April - June 2017 Page 16
Satisfaction with Aspects of Metropolitan Train ServicesThis section contains the quarterly results of satisfaction scores for various aspects of metropolitan train services. These scores are based on the 0-to-10 satisfaction scale, which has been used since April 2009, replacing the previously used 6-point satisfaction scale.
Public Transport CSM Report April - June 2017 Page 17
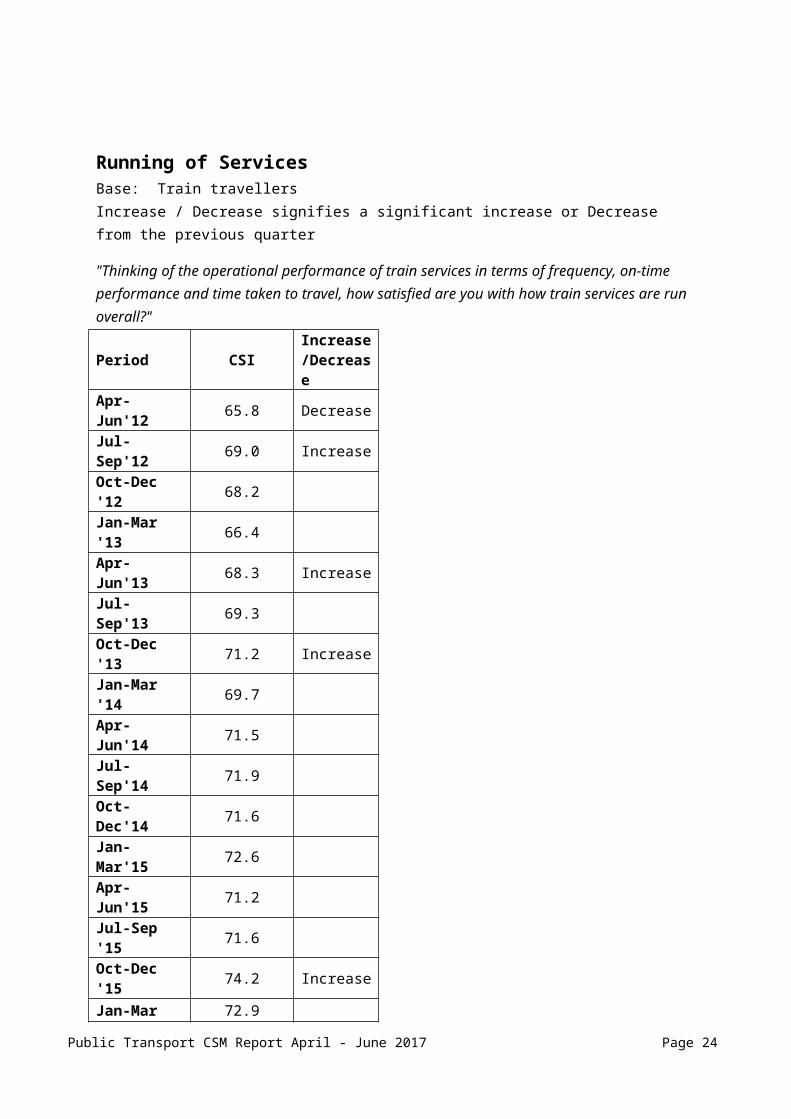
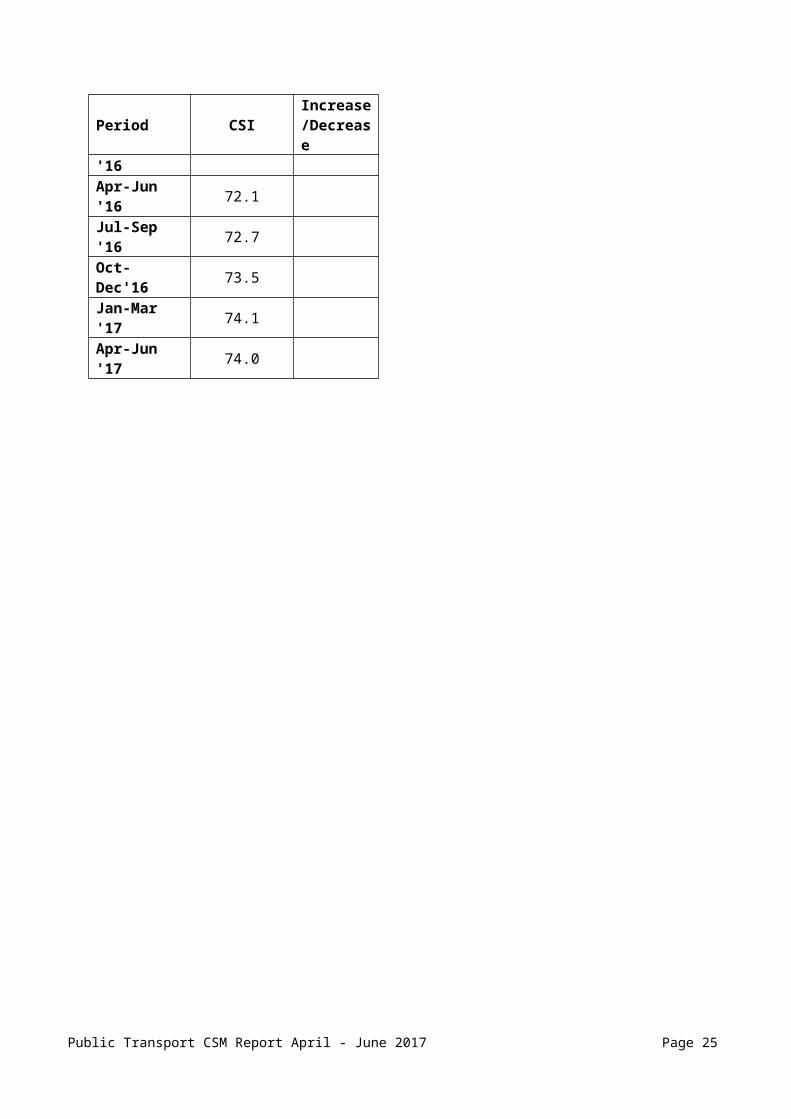
Running of ServicesBase: Train travellersIncrease / Decrease signifies a significant increase or Decrease from the previous quarter
"Thinking of the operational performance of train services in terms of frequency, on-time performance and time taken to travel, how satisfied are you with how train services are run overall?"
Period CSIIncrease /Decrease
Apr-Jun'12 65.8 Decrease
Jul-Sep'12 69.0 Increase
Oct-Dec '12 68.2
Jan-Mar '13 66.4
Apr-Jun'13 68.3 Increase
Jul-Sep'13 69.3
Oct-Dec '13 71.2 Increase
Jan-Mar '14 69.7
Apr-Jun'14 71.5
Jul-Sep'14 71.9
Oct-Dec'14 71.6
Jan-Mar'15 72.6
Apr-Jun'15 71.2
Jul-Sep '15 71.6
Oct-Dec '15 74.2 Increase
Jan-Mar '16 72.9
Apr-Jun '16 72.1
Jul-Sep '16 72.7
Oct-Dec'16 73.5
Jan-Mar '17 74.1
Apr-Jun '17 74.0
Public Transport CSM Report April - June 2017 Page 18

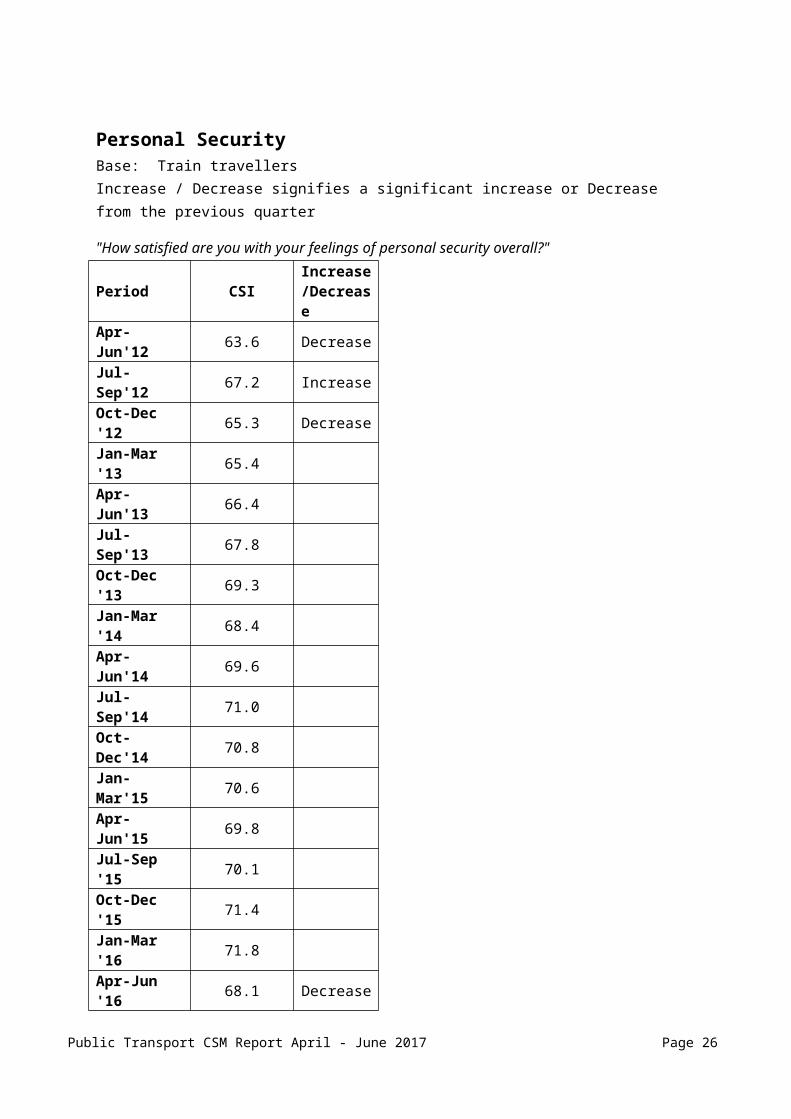
Personal SecurityBase: Train travellersIncrease / Decrease signifies a significant increase or Decrease from the previous quarter
"How satisfied are you with your feelings of personal security overall?"
Period CSIIncrease /Decrease
Apr-Jun'12 63.6 Decrease
Jul-Sep'12 67.2 Increase
Oct-Dec '12 65.3 Decrease
Jan-Mar '13 65.4
Apr-Jun'13 66.4
Jul-Sep'13 67.8
Oct-Dec '13 69.3
Jan-Mar '14 68.4
Apr-Jun'14 69.6
Jul-Sep'14 71.0
Oct-Dec'14 70.8
Jan-Mar'15 70.6
Apr-Jun'15 69.8
Jul-Sep '15 70.1
Oct-Dec '15 71.4
Jan-Mar '16 71.8
Apr-Jun '16 68.1 Decrease
Jul-Sep '16 68.2
Oct-Dec'16 69.0
Jan-Mar '17 71.0 Increase
Apr-Jun '17 70.0
Public Transport CSM Report April - June 2017 Page 19

InformationBase: Train travellersIncrease / Decrease signifies a significant increase or Decrease from the previous quarter
"How satisfied are you with the information provided about train services overall?"
Period CSIIncrease /Decrease
Apr-Jun'12 68.0
Jul-Sep'12 69.8 Increase
Oct-Dec '12 68.5
Jan-Mar '13 67.3
Apr-Jun'13 68.0
Jul-Sep'13 69.3
Oct-Dec '13 70.7
Jan-Mar '14 71.2
Apr-Jun'14 72.0
Jul-Sep'14 72.2
Oct-Dec'14 71.6
Jan-Mar'15 73.2
Apr-Jun'15 72.6
Jul-Sep '15 73.3
Oct-Dec '15 74.3
Jan-Mar '16 73.7
Apr-Jun '16 72.9
Jul-Sep '16 73.5
Oct-Dec'16 74.3
Jan-Mar '17 74.4
Apr-Jun '17 75.5
Public Transport CSM Report April - June 2017 Page 20
Design, Space, and Comfort OnboardBase: Train travellersIncrease / Decrease signifies a significant increase or Decrease from the previous quarter
"How satisfied are you with the design, space and comfort of Melbourne’s trains overall?"
Period CSIIncrease /Decrease
Apr-Jun'12 65.1 Decrease
Jul-Sep'12 66.8
Oct-Dec '12 65.9
Jan-Mar '13 66.0
Apr-Jun'13 66.5
Jul-Sep'13 67.2
Oct-Dec '13 68.2
Jan-Mar '14 68.6
Apr-Jun'14 68.2
Jul-Sep'14 69.7
Oct-Dec'14 67.8 Decrease
Jan-Mar'15 68.7
Apr-Jun'15 68.0
Jul-Sep '15 68.5
Oct-Dec '15 70.7 Increase
Jan-Mar '16 69.5
Apr-Jun '16 67.6 Decrease
Jul-Sep '16 68.6
Oct-Dec'16 69.6
Jan-Mar '17 70.1
Apr-Jun '17 69.0
Public Transport CSM Report April - June 2017 Page 21
Train StationsBase: Train travellersIncrease / Decrease signifies a significant increase or Decrease from the previous quarter
"How satisfied are you with the train stations overall?"
Period CSIIncrease /Decrease
Apr-Jun'12 63.4
Jul-Sep'12 66.6 Increase
Oct-Dec '12 65.3
Jan-Mar '13 66.0
Apr-Jun'13 65.0
Jul-Sep'13 65.7
Oct-Dec '13 67.3
Jan-Mar '14 67.2
Apr-Jun'14 69.4 Increase
Jul-Sep'14 70.1
Oct-Dec'14 68.7
Jan-Mar'15 69.2
Apr-Jun'15 69.1
Jul-Sep '15 70.1
Oct-Dec '15 72.1 Increase
Jan-Mar '16 70.6
Apr-Jun '16 69.4
Jul-Sep '16 68.6
Oct-Dec'16 70.3 Increase
Jan-Mar '17 70.5
Apr-Jun '17 70.4
Public Transport CSM Report April - June 2017 Page 22

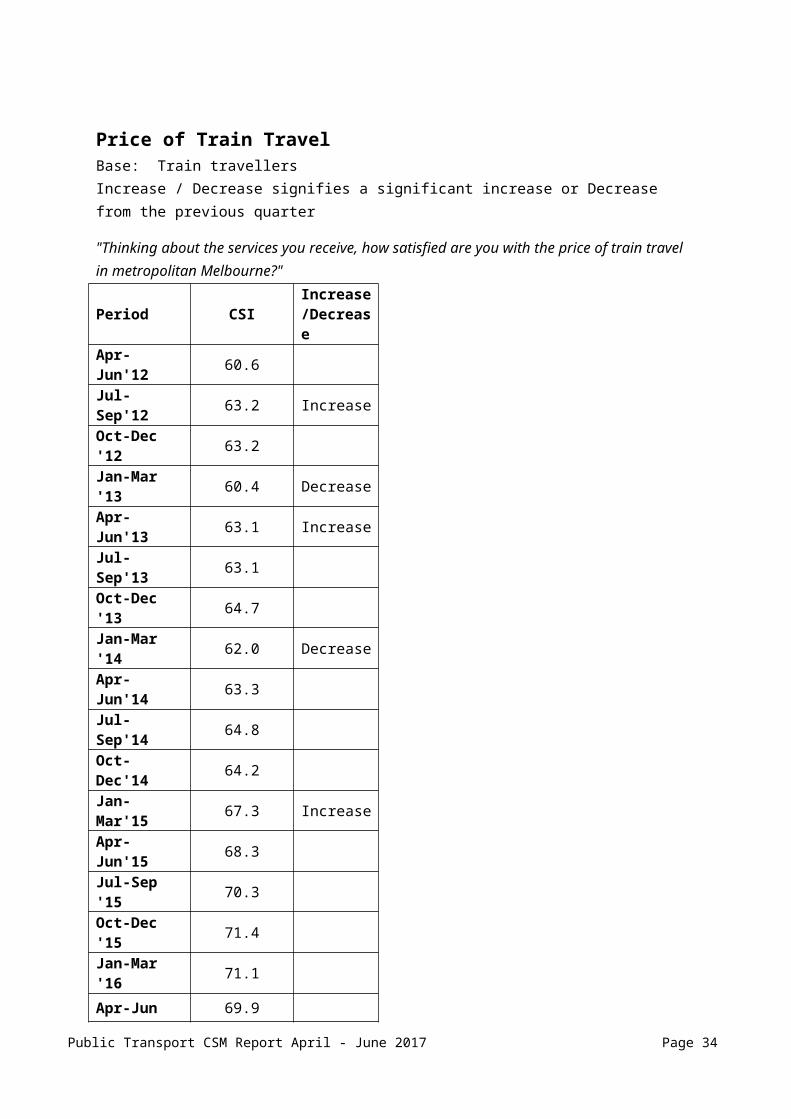
Price of Train TravelBase: Train travellersIncrease / Decrease signifies a significant increase or Decrease from the previous quarter
"Thinking about the services you receive, how satisfied are you with the price of train travel in metropolitan Melbourne?"
Period CSIIncrease /Decrease
Apr-Jun'12 60.6
Jul-Sep'12 63.2 Increase
Oct-Dec '12 63.2
Jan-Mar '13 60.4 Decrease
Apr-Jun'13 63.1 Increase
Jul-Sep'13 63.1
Oct-Dec '13 64.7
Jan-Mar '14 62.0 Decrease
Apr-Jun'14 63.3
Jul-Sep'14 64.8
Oct-Dec'14 64.2
Jan-Mar'15 67.3 Increase
Apr-Jun'15 68.3
Jul-Sep '15 70.3
Oct-Dec '15 71.4
Jan-Mar '16 71.1
Apr-Jun '16 69.9
Jul-Sep '16 70.2
Oct-Dec'16 68.9
Jan-Mar '17 68.5
Apr-Jun '17 69.4
Public Transport CSM Report April - June 2017 Page 23
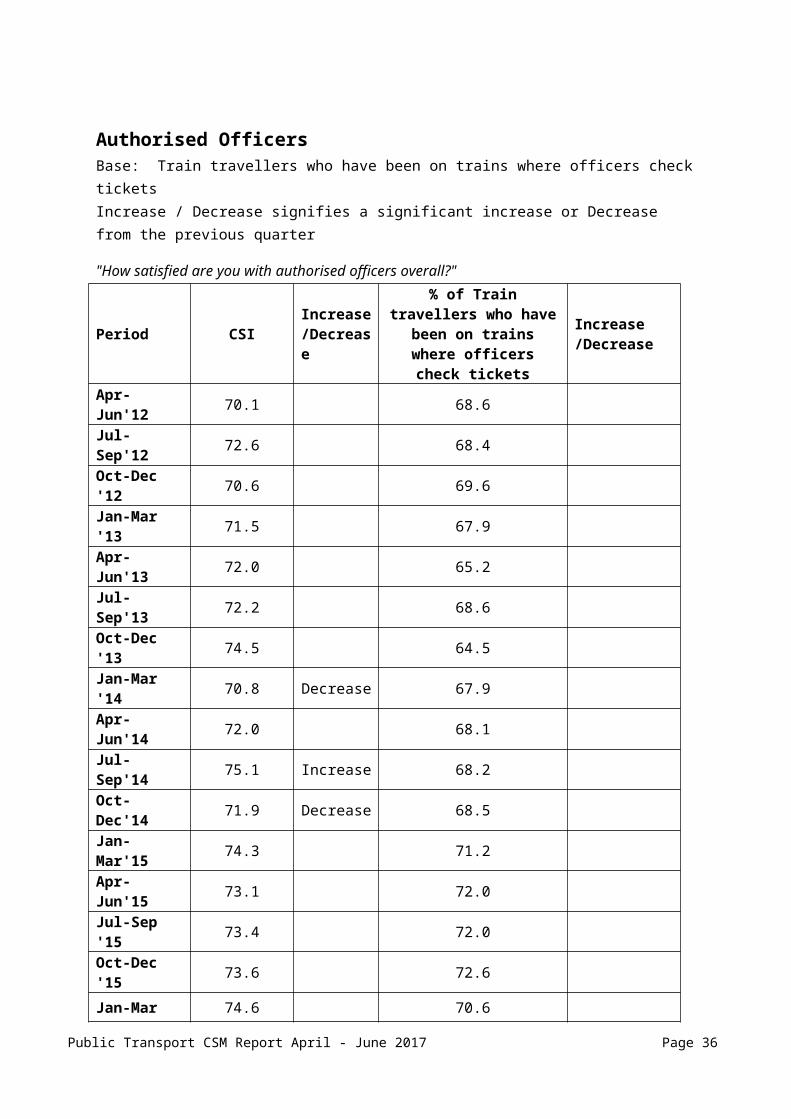
Authorised OfficersBase: Train travellers who have been on trains where officers check ticketsIncrease / Decrease signifies a significant increase or Decrease from the previous quarter
"How satisfied are you with authorised officers overall?"
Period CSIIncrease /Decrease
% of Train travellers who have been on trains where officers check
tickets
Increase /Decrease
Apr-Jun'12 70.1 68.6
Jul-Sep'12 72.6 68.4
Oct-Dec '12 70.6 69.6
Jan-Mar '13 71.5 67.9
Apr-Jun'13 72.0 65.2
Jul-Sep'13 72.2 68.6
Oct-Dec '13 74.5 64.5
Jan-Mar '14 70.8 Decrease 67.9
Apr-Jun'14 72.0 68.1
Jul-Sep'14 75.1 Increase 68.2
Oct-Dec'14 71.9 Decrease 68.5
Jan-Mar'15 74.3 71.2
Apr-Jun'15 73.1 72.0
Jul-Sep '15 73.4 72.0
Oct-Dec '15 73.6 72.6
Jan-Mar '16 74.6 70.6
Apr-Jun '16 72.8 69.1
Jul-Sep '16 73.1 69.6
Oct-Dec'16 74.4 68.7
Jan-Mar '17 75.2 70.6
Apr-Jun '17 74.3 66.5
Public Transport CSM Report April - June 2017 Page 24
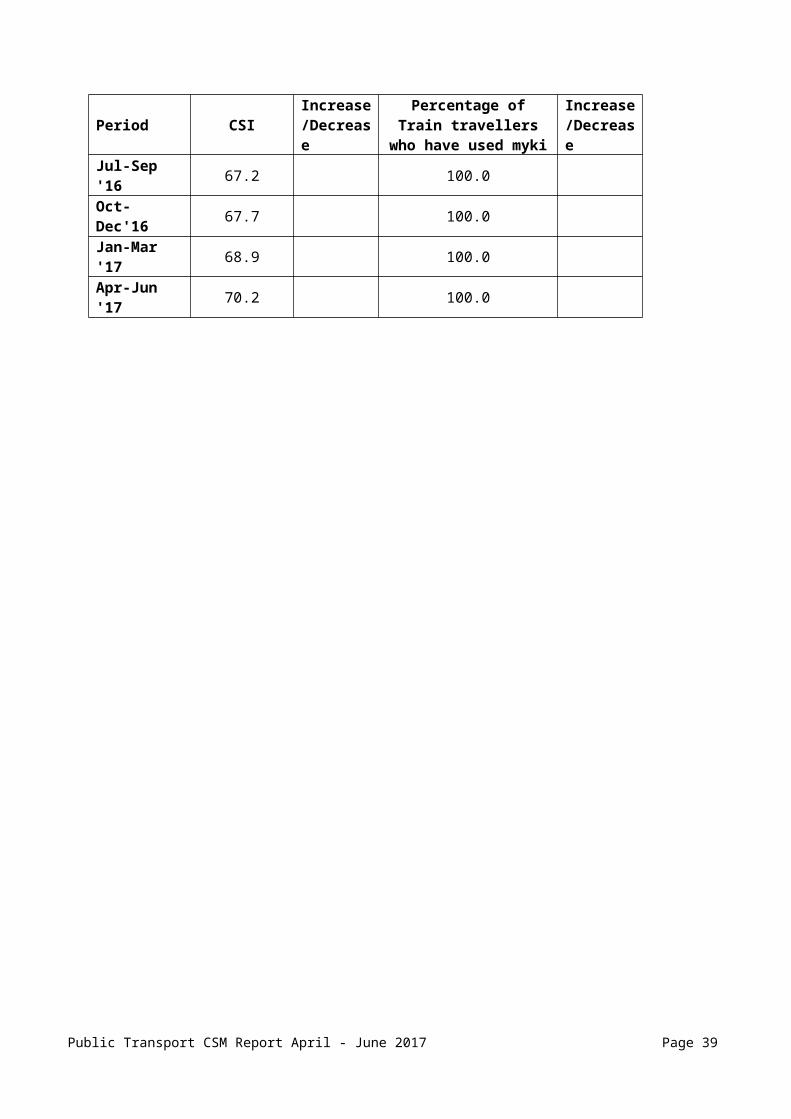
myki TicketingBase: Train travellers who have used mykiIncrease / Decrease signifies a significant increase or Decrease from the previous quarter
"How satisfied are you with the myki ticketing system overall?"
Period CSI Increase /Decrease
Percentage of Train travellers who have
used myki
Increase /Decrease
Apr-Jun'12 61.7 Decrease 64.6 Increase
Jul-Sep'12 63.2 81.4 Increase
Oct-Dec '12 61.0 88.8 Increase
Jan-Mar '13 59.1 94.6 Increase
Apr-Jun'13 60.3 97.4 Increase
Jul-Sep'13 62.8 Increase 100.0 Increase
Oct-Dec '13 63.6 100.0
Jan-Mar '14 59.1 Decrease 100.0
Apr-Jun'14 64.2 Increase 100.0
Jul-Sep'14 65.9 100.0
Oct-Dec'14 64.4 100.0
Jan-Mar'15 64.3 100.0
Apr-Jun'15 66.2 100.0
Jul-Sep '15 66.3 100.0
Oct-Dec '15 66.8 100.0
Jan-Mar '16 67.9 100.0
Apr-Jun '16 65.2 Decrease 100.0
Jul-Sep '16 67.2 100.0
Oct-Dec'16 67.7 100.0
Jan-Mar '17 68.9 100.0
Apr-Jun '17 70.2 100.0
Public Transport CSM Report April - June 2017 Page 25
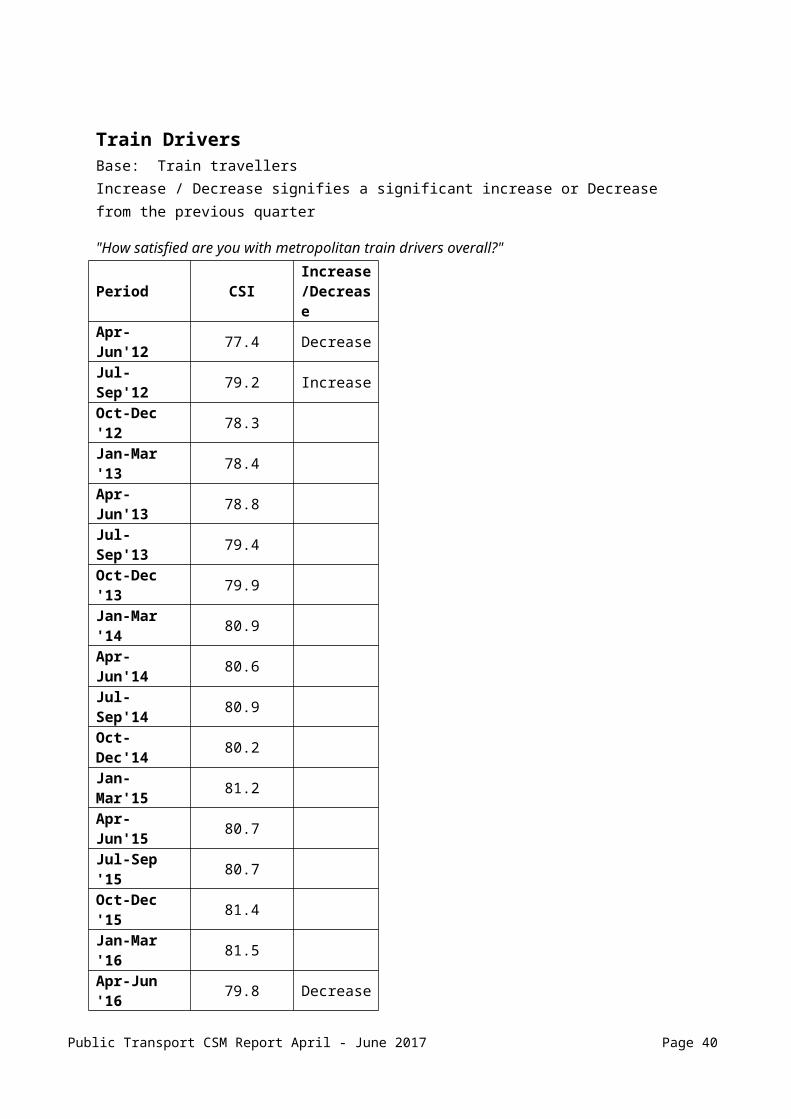
Train DriversBase: Train travellersIncrease / Decrease signifies a significant increase or Decrease from the previous quarter
"How satisfied are you with metropolitan train drivers overall?"
Period CSIIncrease /Decrease
Apr-Jun'12 77.4 Decrease
Jul-Sep'12 79.2 Increase
Oct-Dec '12 78.3
Jan-Mar '13 78.4
Apr-Jun'13 78.8
Jul-Sep'13 79.4
Oct-Dec '13 79.9
Jan-Mar '14 80.9
Apr-Jun'14 80.6
Jul-Sep'14 80.9
Oct-Dec'14 80.2
Jan-Mar'15 81.2
Apr-Jun'15 80.7
Jul-Sep '15 80.7
Oct-Dec '15 81.4
Jan-Mar '16 81.5
Apr-Jun '16 79.8 Decrease
Jul-Sep '16 80.9
Oct-Dec'16 81.3
Jan-Mar '17 81.7
Apr-Jun '17 81.7
Public Transport CSM Report April - June 2017 Page 26

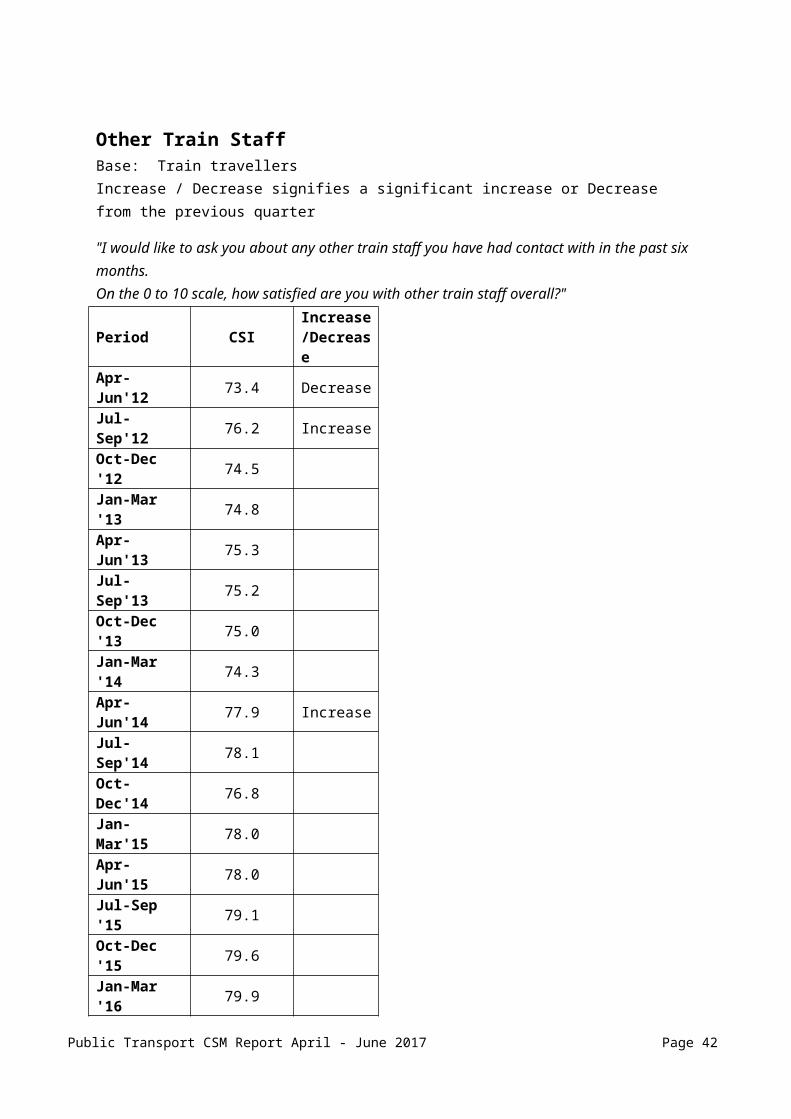
Other Train StaffBase: Train travellersIncrease / Decrease signifies a significant increase or Decrease from the previous quarter
"I would like to ask you about any other train staff you have had contact with in the past six months. On the 0 to 10 scale, how satisfied are you with other train staff overall?"
Period CSIIncrease /Decrease
Apr-Jun'12 73.4 Decrease
Jul-Sep'12 76.2 Increase
Oct-Dec '12 74.5
Jan-Mar '13 74.8
Apr-Jun'13 75.3
Jul-Sep'13 75.2
Oct-Dec '13 75.0
Jan-Mar '14 74.3
Apr-Jun'14 77.9 Increase
Jul-Sep'14 78.1
Oct-Dec'14 76.8
Jan-Mar'15 78.0
Apr-Jun'15 78.0
Jul-Sep '15 79.1
Oct-Dec '15 79.6
Jan-Mar '16 79.9
Apr-Jun '16 78.6
Jul-Sep '16 77.9
Oct-Dec'16 78.6
Jan-Mar '17 80.3 Increase
Apr-Jun '17 79.9
Public Transport CSM Report April - June 2017 Page 27

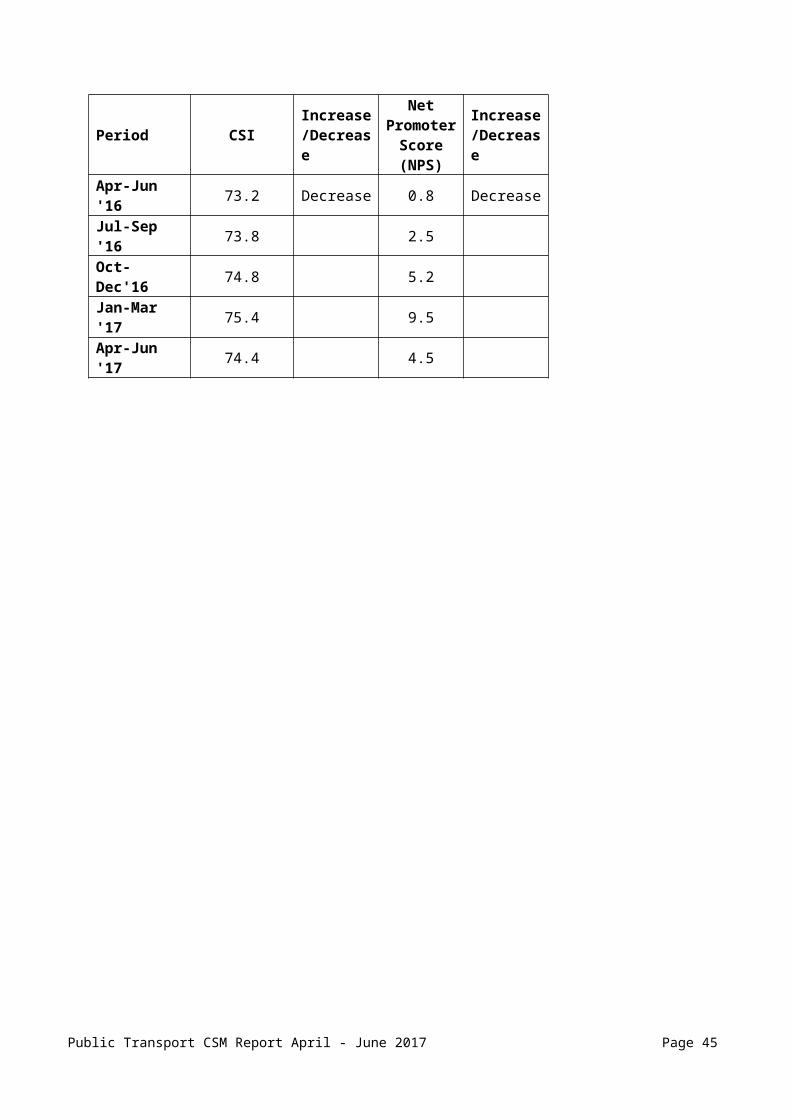
Likelihood to Recommend Metropolitan Train ServicesBase: Train travellers Increase / Decrease signifies a significant increase or Decrease from the previous quarter
"On a scale of 0 to 10, where 0 is no likelihood and 10 is extremely likely, how likely would you be to recommend Melbourne’s train services to someone else?"
Period CSIIncrease /Decrease
Net Promoter
Score (NPS)
Increase /Decrease
Apr-Jun'12 66.5 Decrease -20.7 Decrease
Jul-Sep'12 68.5 -14.4
Oct-Dec '12 67.7 -15.9
Jan-Mar '13 65.8 -21.1
Apr-Jun'13 67.4 -15.0
Jul-Sep'13 68.6 -13.2
Oct-Dec '13 71.1 Increase -4.6 Increase
Jan-Mar '14 69.2 -11.1
Apr-Jun'14 71.2 -7.2
Jul-Sep'14 71.7 -4.9
Oct-Dec'14 72.5 -2.4
Jan-Mar'15 73.2 1.3
Apr-Jun'15 72.4 -3.6
Jul-Sep '15 72.6 -0.7
Oct-Dec '15 76.3 Increase 12.0 Increase
Jan-Mar '16 76.0 11.1
Apr-Jun '16 73.2 Decrease 0.8 Decrease
Jul-Sep '16 73.8 2.5
Oct-Dec'16 74.8 5.2
Jan-Mar '17 75.4 9.5
Apr-Jun '17 74.4 4.5
Public Transport CSM Report April - June 2017 Page 28

Metropolitan Tram Services
Summary of FindingsFinancial Year 2016/17
Using the initial ‘top-of-mind’ measure, tram services achieved an overall satisfaction score of 73.4 for the 2016/17 financial year (FY). This is lower than 2015/16 (74.0), although not significantly so. It nevertheless marks the first time in at least five years that the FY score has not either marginally or significantly increased from the previous year.
Measured on the 0-to-10 scale (multiplied by ten to get a score out of 100), satisfaction with overall tram services was 76.0 which is identical to the 2015/16 FY result. Again, this is the first time in seven years that this score did not at least marginally increase, potentially showing that marginal gains are going to be harder to achieve off this much higher base.
In terms of drivers of satisfaction, the only change to the model is that satisfaction with ‘tram drivers’ has moved from being a secondary driver of overall satisfaction to being only a tertiary driver.
Satisfaction with key service areas has been somewhat mixed for the 2016/17 FY in comparison with the previous year.
The primary driver of overall satisfaction with tram services, ‘personal security’ decreased significantly in the 2016/17 FY, scoring 74.5, compared to 75.3 in the 2015/16 FY.
‘Running of services’, another primary driver of overall satisfaction with tram services, was unchanged at 75.5 for both 2016/17 FY and the previous year.
Satisfaction with the secondary driver, ‘design, space and comfort’ was 70.7 (not significantly different to 71.2 in 2015/16 FY).
Significant gains were also made in two of the tertiary drivers of satisfaction since last FY, including satisfaction with ‘myki ticketing’ (65.4, up from 64.0) and ‘information’ (75.2, up from 74.4). This was the second consecutive year of significant improvements for ‘information’.
The tertiary driver of ‘price’ significantly decreased since last FY (69.3, down from 70.5).
April to June Quarter 2017
The initial ‘top of mind’ measure of overall satisfaction indicated that 90% of tram travellers were ‘totally’, ‘very’ or ‘somewhat’ satisfied with the tram services. Converted to a score of 100, the result for Apr-Jun17 was 72.4, not significantly different to the Jan-Mar17 result of 73.8.
Overall satisfaction on the more considered 0-to-10 scale, converted to a score out of 100, remained stable at 76.4 (compared to 76.2 in Jan-Mar17).
Overall satisfaction with primary driver ‘personal security’ was 74.8 this quarter, effectively unchanged from Jan-Mar17 (74.5). There were no significant movements in any of the related service aspects.
Public Transport CSM Report April - June 2017 Page 29

Metropolitan Tram Services
Summary of Findings continued…‘Running of services’, also a primary driver of satisfaction was also effectively unchanged this quarter, achieving a satisfaction rating of 75.2 (75.8 in Jan-Mar17). However, one related service aspect, ‘frequency during weekday peak hours’ was down significantly to 70.1 (from 73.7 in Jan-Mar17).
Overall satisfaction with ‘design, space and comfort’, a secondary driver, remained stable this quarter, at 71.1 (70.8 in Jan-Mar17). However, two of the individual service aspects showed a significant change. Satisfaction with ‘level of crowding’ fell to 64.6 (from 67.2 in the previous quarter). Curiously, despite the field period being in autumn, satisfaction with ‘temperature of trams in summer’ rose to 69.8 (from 67.0).
Public Transport CSM Report April - June 2017 Page 30

Metropolitan Tram ServicesPublic transport users selected to answer questions about metropolitan tram services are asked: "Overall, are you satisfied or dissatisfied with the service on your tram route? Is that totally, very or somewhat?”
Asked near the beginning of the survey (before evaluating specific aspects of the service), this question captures the top-of-mind perception of train services. The table below illustrates the proportion of metropolitan tram users who were totally, very, or somewhat satisfied with the services.
Proportion of Satisfied Users of Metropolitan Tram Services by QuarterBase: Tram travellersIncrease / Decrease signifies a significant increase or Decrease from the previous quarter
PeriodProportion Satisfied %
Increase /Decrease
Apr-Jun'12 90.5 Increase
Jul-Sep'12 89.8
Oct-Dec '12 91.1
Jan-Mar '13 91.9
Apr-Jun'13 88.5 Decrease
Jul-Sep'13 91.1
Oct-Dec '13 89.9
Jan-Mar '14 91.6
Apr-Jun'14 90.8
Jul-Sep'14 90.8
Oct-Dec'14 91.2
Jan-Mar'15 92.3
Apr-Jun'15 91.1
Jul-Sep '15 93.4
Oct-Dec '15 92.6
Jan-Mar '16 91.7
Apr-Jun '16 90.5
Jul-Sep '16 92.4
Oct-Dec'16 92.6
Jan-Mar '17 91.9
Apr-Jun '17 90.3
Public Transport CSM Report April - June 2017 Page 31

Metropolitan Tram ServicesFrom the same question, responses are translated into a Customer Satisfaction Index (refer to the How the Monitor is Conducted section for more details). The table below shows the results over time.
Customer Satisfaction Index (CSI) of Tram Services by Quarter (6-point scale)Base: Tram travellersIncrease / Decrease signifies a significant increase or Decrease from the previous quarter
Period CSI Increase /Decrease
Apr-Jun'12 70.0
Jul-Sep'12 71.1
Oct-Dec '12 70.9
Jan-Mar '13 72.7
Apr-Jun'13 70.9
Jul-Sep'13 70.9
Oct-Dec '13 70.8
Jan-Mar '14 73.7 Increase
Apr-Jun'14 72.8
Jul-Sep'14 72.5
Oct-Dec'14 72.7
Jan-Mar'15 73.6
Apr-Jun'15 72.7
Jul-Sep '15 74.3
Oct-Dec '15 75.1
Jan-Mar '16 74.0
Apr-Jun '16 72.8
Jul-Sep '16 73.9
Oct-Dec'16 73.7
Jan-Mar '17 73.8
Apr-Jun '17 72.4
Public Transport CSM Report April - June 2017 Page 32

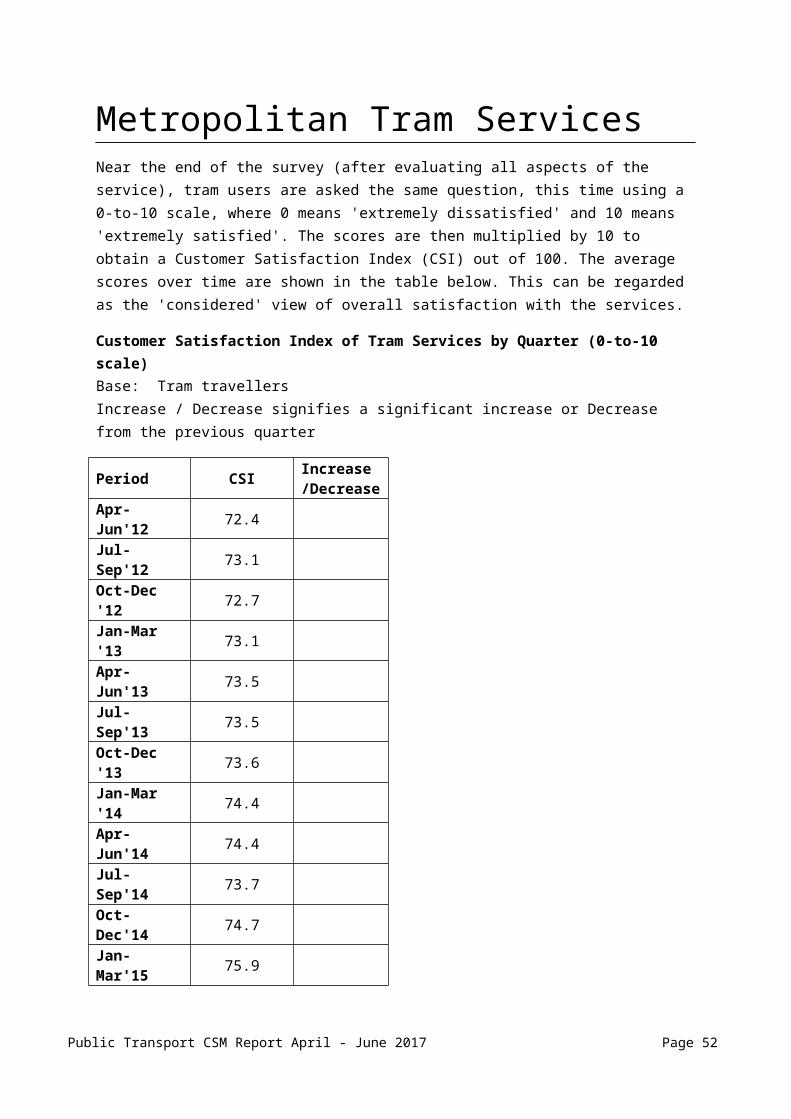
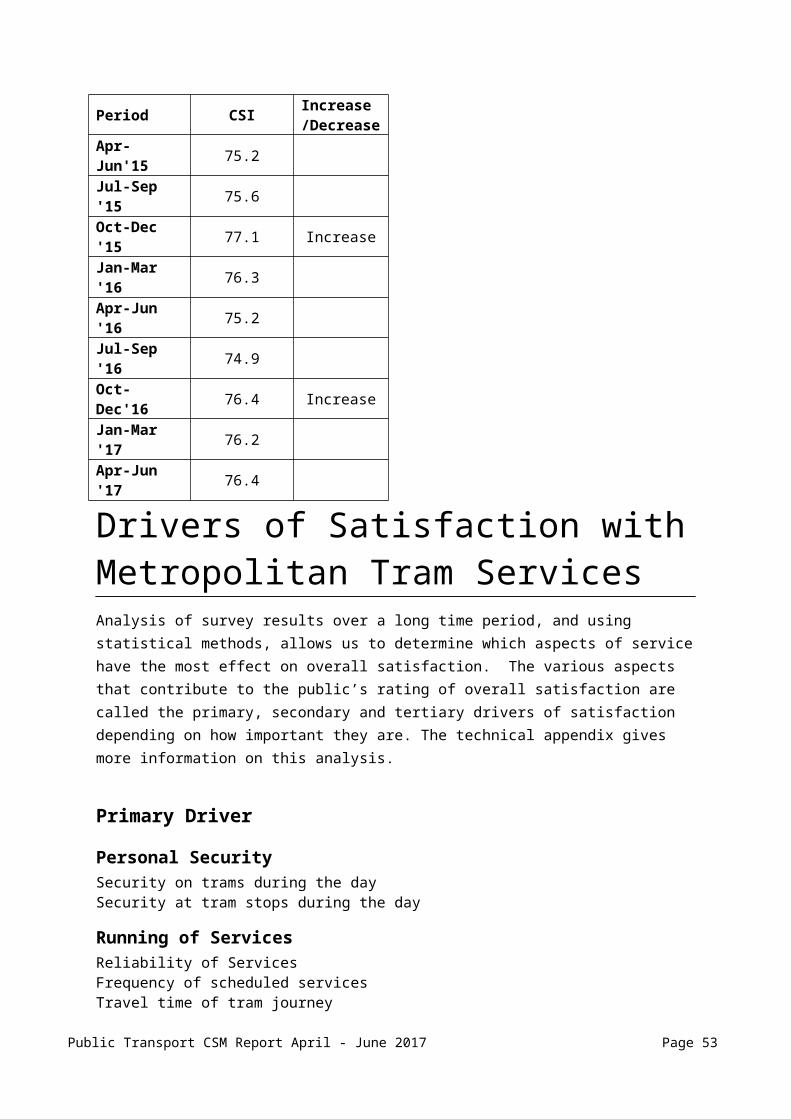
Metropolitan Tram ServicesNear the end of the survey (after evaluating all aspects of the service), tram users are asked the same question, this time using a 0-to-10 scale, where 0 means 'extremely dissatisfied' and 10 means 'extremely satisfied'. The scores are then multiplied by 10 to obtain a Customer Satisfaction Index (CSI) out of 100. The average scores over time are shown in the table below. This can be regarded as the 'considered' view of overall satisfaction with the services.
Customer Satisfaction Index of Tram Services by Quarter (0-to-10 scale)Base: Tram travellersIncrease / Decrease signifies a significant increase or Decrease from the previous quarter
Period CSI Increase /Decrease
Apr-Jun'12 72.4
Jul-Sep'12 73.1
Oct-Dec '12 72.7
Jan-Mar '13 73.1
Apr-Jun'13 73.5
Jul-Sep'13 73.5
Oct-Dec '13 73.6
Jan-Mar '14 74.4
Apr-Jun'14 74.4
Jul-Sep'14 73.7
Oct-Dec'14 74.7
Jan-Mar'15 75.9
Apr-Jun'15 75.2
Jul-Sep '15 75.6
Oct-Dec '15 77.1 Increase
Jan-Mar '16 76.3
Apr-Jun '16 75.2
Jul-Sep '16 74.9
Oct-Dec'16 76.4 Increase
Jan-Mar '17 76.2
Apr-Jun '17 76.4
Public Transport CSM Report April - June 2017 Page 33
Drivers of Satisfaction with Metropolitan Tram ServicesAnalysis of survey results over a long time period, and using statistical methods, allows us to determine which aspects of service have the most effect on overall satisfaction. The various aspects that contribute to the public’s rating of overall satisfaction are called the primary, secondary and tertiary drivers of satisfaction depending on how important they are. The technical appendix gives more information on this analysis.
Primary Driver
Personal SecuritySecurity on trams during the daySecurity at tram stops during the day
Running of ServicesReliability of ServicesFrequency of scheduled servicesTravel time of tram journey
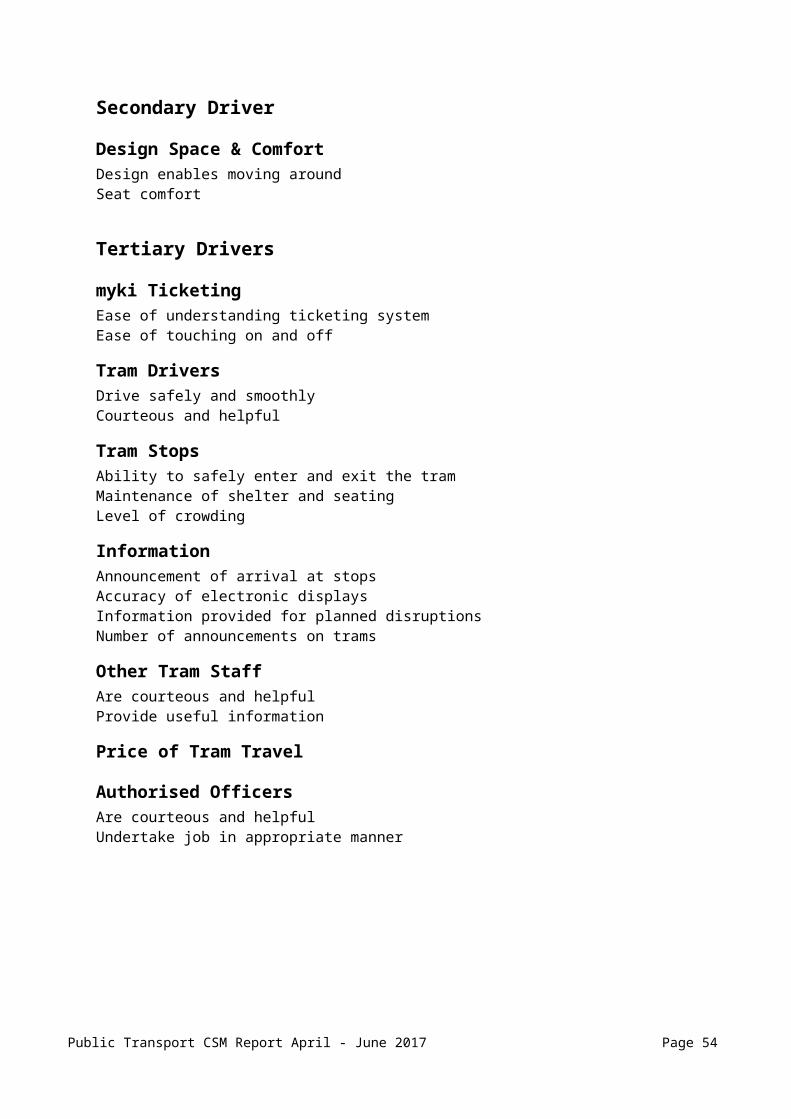
Secondary Driver
Design Space & ComfortDesign enables moving aroundSeat comfort
Tertiary Drivers
myki TicketingEase of understanding ticketing systemEase of touching on and off
Tram DriversDrive safely and smoothlyCourteous and helpful
Tram StopsAbility to safely enter and exit the tramMaintenance of shelter and seatingLevel of crowding
InformationAnnouncement of arrival at stopsAccuracy of electronic displaysInformation provided for planned disruptions
Public Transport CSM Report April - June 2017 Page 34

Number of announcements on trams
Other Tram StaffAre courteous and helpfulProvide useful information
Price of Tram Travel
Authorised OfficersAre courteous and helpfulUndertake job in appropriate manner
Public Transport CSM Report April - June 2017 Page 35
Satisfaction with Aspects of Metropolitan Tram ServicesThis section contains the quarterly results of satisfaction scores for various aspects of metropolitan tram services. These scores are based on the 0-to-10 satisfaction scale, which has been used since April 2009, replacing the previously used 6-point satisfaction scale.
Public Transport CSM Report April - June 2017 Page 36

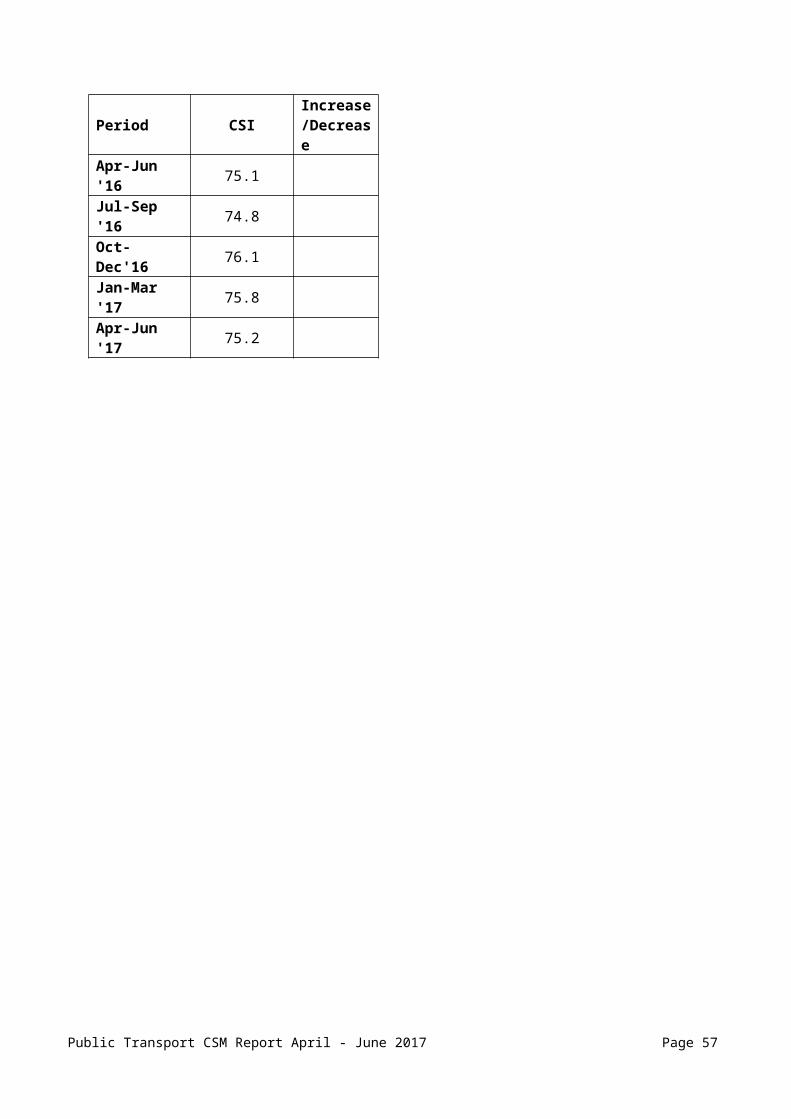
Running of ServicesBase: Tram travellersIncrease / Decrease signifies a significant increase or Decrease from the previous quarter
"Thinking of the operational performance of tram services in terms of frequency, on-time performance and time taken to travel, how satisfied are you with how tram services are run overall?"
Period CSIIncrease /Decrease
Apr-Jun'12 72.7
Jul-Sep'12 72.5
Oct-Dec '12 73.3
Jan-Mar '13 74.1
Apr-Jun'13 73.5
Jul-Sep'13 73.3
Oct-Dec '13 73.7
Jan-Mar '14 74.4
Apr-Jun'14 73.9
Jul-Sep'14 73.7
Oct-Dec'14 74.1
Jan-Mar'15 75.3
Apr-Jun'15 74.7
Jul-Sep '15 75.2
Oct-Dec '15 76.3
Jan-Mar '16 75.3
Apr-Jun '16 75.1
Jul-Sep '16 74.8
Oct-Dec'16 76.1
Jan-Mar '17 75.8
Apr-Jun '17 75.2
Public Transport CSM Report April - June 2017 Page 37

Personal SecurityBase: Tram travellersIncrease / Decrease signifies a significant increase or Decrease from the previous quarter
"How satisfied are you with your feelings of personal security overall?"
Period CSIIncrease /Decrease
Apr-Jun'12 73.1
Jul-Sep'12 73.4
Oct-Dec '12 71.9
Jan-Mar '13 72.3
Apr-Jun'13 72.6
Jul-Sep'13 72.7
Oct-Dec '13 73.7
Jan-Mar '14 74.6
Apr-Jun'14 74.1
Jul-Sep'14 73.4
Oct-Dec'14 74.8
Jan-Mar'15 75.6
Apr-Jun'15 73.9 Decrease
Jul-Sep '15 74.8
Oct-Dec '15 76.2
Jan-Mar '16 76.1
Apr-Jun '16 74.1 Decrease
Jul-Sep '16 73.5
Oct-Dec'16 75.0
Jan-Mar '17 74.5
Apr-Jun '17 74.8
Public Transport CSM Report April - June 2017 Page 38
Design, Space and Comfort OnboardBase: Tram travellersIncrease / Decrease signifies a significant increase or Decrease from the previous quarter
“How satisfied are you with the design, space and comfort of Melbourne’s trams overall?"
Period CSIIncrease /Decrease
Apr-Jun'12 68.2
Jul-Sep'12 68.6
Oct-Dec '12 68.5
Jan-Mar '13 68.6
Apr-Jun'13 69.4
Jul-Sep'13 68.7
Oct-Dec '13 69.3
Jan-Mar '14 69.4
Apr-Jun'14 69.3
Jul-Sep'14 69.8
Oct-Dec'14 70.1
Jan-Mar'15 71.0
Apr-Jun'15 70.0
Jul-Sep '15 71.4
Oct-Dec '15 72.5
Jan-Mar '16 70.6 Decrease
Apr-Jun '16 70.4
Jul-Sep '16 69.9
Oct-Dec'16 71.0
Jan-Mar '17 70.8
Apr-Jun '17 71.1
Public Transport CSM Report April - June 2017 Page 39
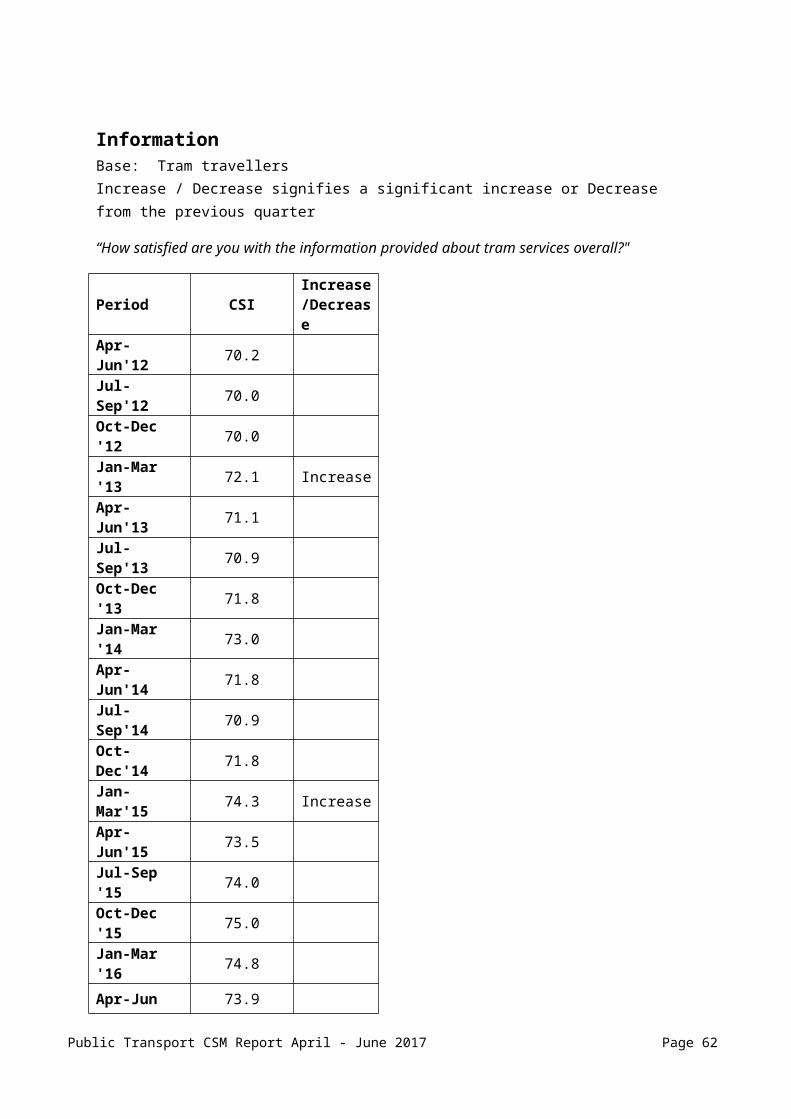
InformationBase: Tram travellersIncrease / Decrease signifies a significant increase or Decrease from the previous quarter
“How satisfied are you with the information provided about tram services overall?"
Period CSIIncrease /Decrease
Apr-Jun'12 70.2
Jul-Sep'12 70.0
Oct-Dec '12 70.0
Jan-Mar '13 72.1 Increase
Apr-Jun'13 71.1
Jul-Sep'13 70.9
Oct-Dec '13 71.8
Jan-Mar '14 73.0
Apr-Jun'14 71.8
Jul-Sep'14 70.9
Oct-Dec'14 71.8
Jan-Mar'15 74.3 Increase
Apr-Jun'15 73.5
Jul-Sep '15 74.0
Oct-Dec '15 75.0
Jan-Mar '16 74.8
Apr-Jun '16 73.9
Jul-Sep '16 74.1
Oct-Dec'16 75.7 Increase
Jan-Mar '17 75.5
Apr-Jun '17 75.5
Public Transport CSM Report April - June 2017 Page 40

Tram StopsBase: Tram travellersIncrease / Decrease signifies a significant increase or Decrease from the previous quarter
“How satisfied are you with the tram stops overall?"
Period CSIIncrease /Decrease
Apr-Jun'12 72.0
Jul-Sep'12 72.6
Oct-Dec '12 72.9
Jan-Mar '13 74.0
Apr-Jun'13 73.9
Jul-Sep'13 72.3 Decrease
Oct-Dec '13 73.8
Jan-Mar '14 74.7
Apr-Jun'14 73.3
Jul-Sep'14 74.0
Oct-Dec'14 74.9
Jan-Mar'15 75.4
Apr-Jun'15 74.0
Jul-Sep '15 75.4
Oct-Dec '15 76.7
Jan-Mar '16 76.2
Apr-Jun '16 74.8
Jul-Sep '16 74.3
Oct-Dec'16 75.5
Jan-Mar '17 75.8
Apr-Jun '17 75.2
Public Transport CSM Report April - June 2017 Page 41
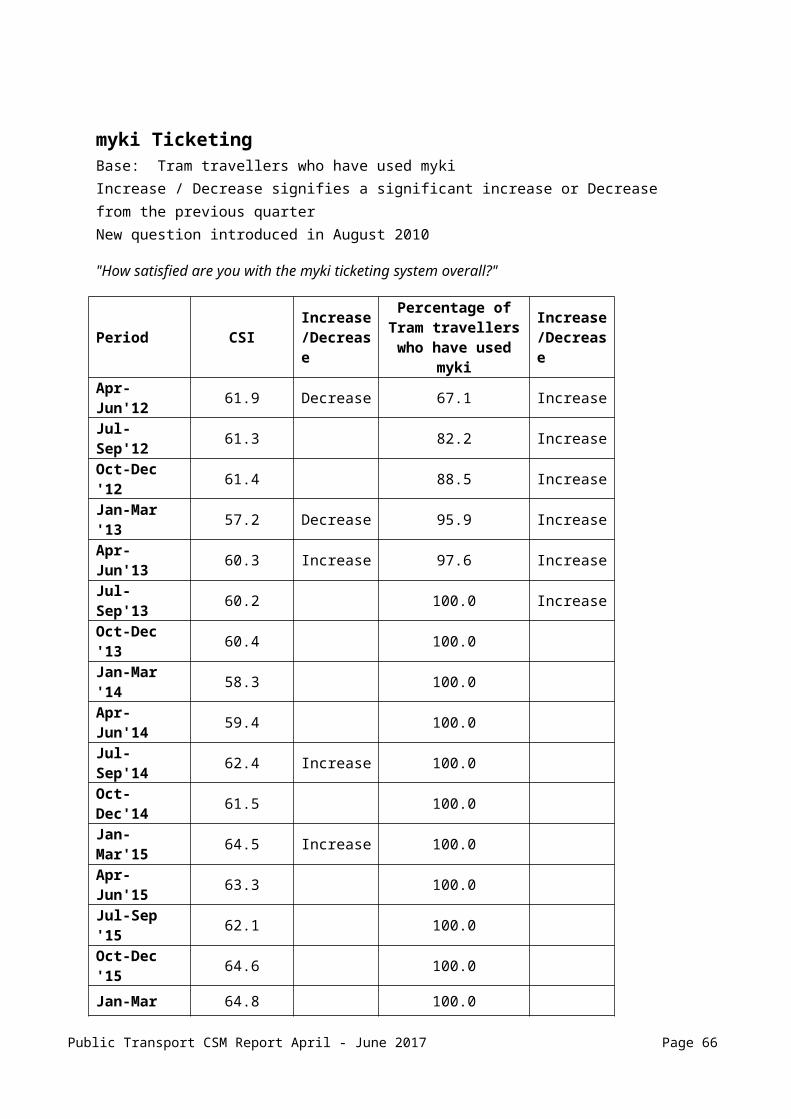
myki TicketingBase: Tram travellers who have used mykiIncrease / Decrease signifies a significant increase or Decrease from the previous quarterNew question introduced in August 2010
"How satisfied are you with the myki ticketing system overall?"
Period CSI Increase /Decrease
Percentage of Tram travellers who have
used myki
Increase /Decrease
Apr-Jun'12 61.9 Decrease 67.1 Increase
Jul-Sep'12 61.3 82.2 Increase
Oct-Dec '12 61.4 88.5 Increase
Jan-Mar '13 57.2 Decrease 95.9 Increase
Apr-Jun'13 60.3 Increase 97.6 Increase
Jul-Sep'13 60.2 100.0 Increase
Oct-Dec '13 60.4 100.0
Jan-Mar '14 58.3 100.0
Apr-Jun'14 59.4 100.0
Jul-Sep'14 62.4 Increase 100.0
Oct-Dec'14 61.5 100.0
Jan-Mar'15 64.5 Increase 100.0
Apr-Jun'15 63.3 100.0
Jul-Sep '15 62.1 100.0
Oct-Dec '15 64.6 100.0
Jan-Mar '16 64.8 100.0
Apr-Jun '16 64.5 100.0
Jul-Sep '16 62.6 100.0
Oct-Dec'16 65.5 Increase 100.0
Jan-Mar '17 66.7 100.0
Apr-Jun '17 66.7 100.0
Public Transport CSM Report April - June 2017 Page 42

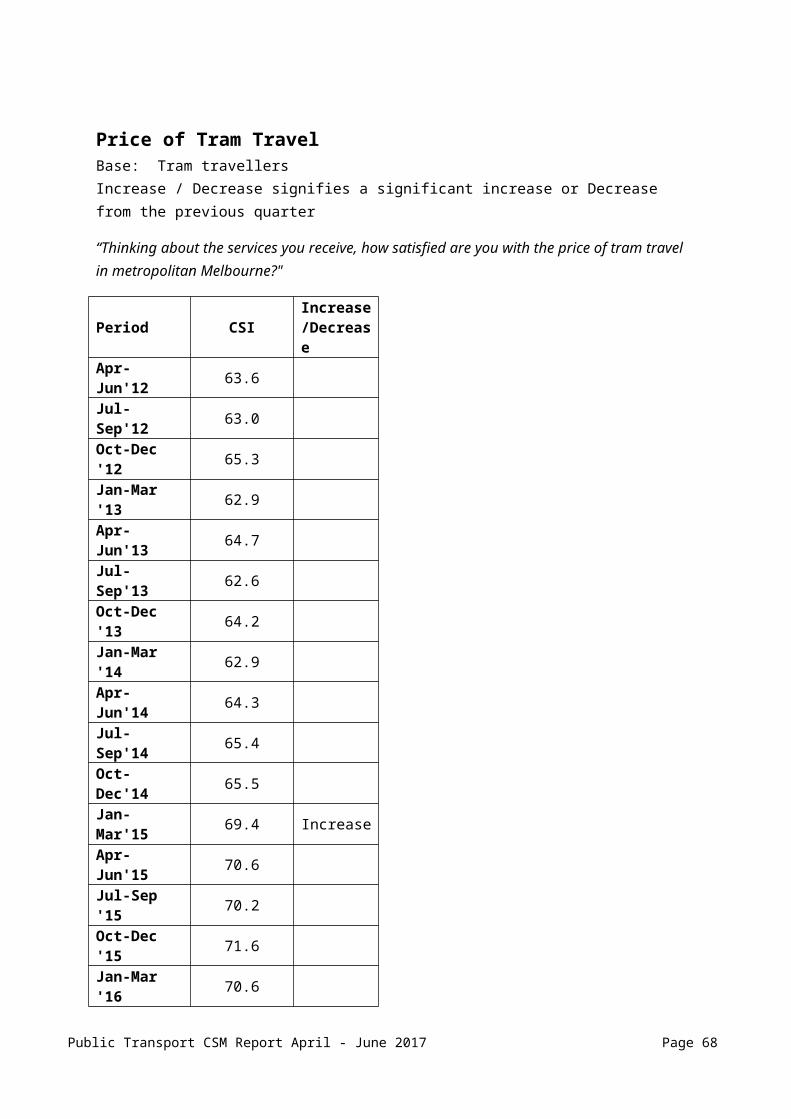
Price of Tram TravelBase: Tram travellersIncrease / Decrease signifies a significant increase or Decrease from the previous quarter
“Thinking about the services you receive, how satisfied are you with the price of tram travel in metropolitan Melbourne?"
Period CSIIncrease /Decrease
Apr-Jun'12 63.6
Jul-Sep'12 63.0
Oct-Dec '12 65.3
Jan-Mar '13 62.9
Apr-Jun'13 64.7
Jul-Sep'13 62.6
Oct-Dec '13 64.2
Jan-Mar '14 62.9
Apr-Jun'14 64.3
Jul-Sep'14 65.4
Oct-Dec'14 65.5
Jan-Mar'15 69.4 Increase
Apr-Jun'15 70.6
Jul-Sep '15 70.2
Oct-Dec '15 71.6
Jan-Mar '16 70.6
Apr-Jun '16 69.5
Jul-Sep '16 69.9
Oct-Dec'16 69.6
Jan-Mar '17 68.6
Apr-Jun '17 69.1
Public Transport CSM Report April - June 2017 Page 43

Authorised OfficersBase: Tram travellers who have been on trams where officers check ticketsIncrease / Decrease signifies a significant increase or Decrease from the previous quarter
“How satisfied are you with authorised officers overall?"
Period CSI Increase /Decrease
% of Tram travellers been on
trams where officers check
tickets
Increase /Decrease
Apr-Jun'12 67.1 56.5
Jul-Sep'12 68.8 53.3
Oct-Dec '12 67.7 53.2
Jan-Mar '13 69.2 51.9
Apr-Jun'13 68.2 51.5
Jul-Sep'13 69.8 54.7
Oct-Dec '13 68.7 51.5
Jan-Mar '14 69.0 50.4
Apr-Jun'14 70.5 51.6
Jul-Sep'14 69.0 50.5
Oct-Dec'14 68.9 55.9 Increase
Jan-Mar'15 71.2 58.5
Apr-Jun'15 69.8 56.0
Jul-Sep '15 69.7 58.1
Oct-Dec '15 72.3 55.6
Jan-Mar '16 70.2 59.5
Apr-Jun '16 69.2 55.8
Jul-Sep '16 68.2 52.7
Oct-Dec'16 70.3 56.0
Jan-Mar '17 71.0 56.8
Apr-Jun '17 71.4 54.9
Public Transport CSM Report April - June 2017 Page 44
Tram DriversBase: Tram travellersIncrease / Decrease signifies a significant increase or Decrease from the previous quarter
“How satisfied are you with metropolitan tram drivers overall?"
Period CSIIncrease /Decrease
Apr-Jun'12 74.0
Jul-Sep'12 74.7
Oct-Dec '12 73.4
Jan-Mar '13 73.9
Apr-Jun'13 74.9
Jul-Sep'13 73.8
Oct-Dec '13 75.5 Increase
Jan-Mar '14 75.1
Apr-Jun'14 75.3
Jul-Sep'14 75.1
Oct-Dec'14 75.2
Jan-Mar'15 76.5
Apr-Jun'15 76.1
Jul-Sep '15 76.4
Oct-Dec '15 77.2
Jan-Mar '16 77.0
Apr-Jun '16 75.8
Jul-Sep '16 75.8
Oct-Dec'16 76.6
Jan-Mar '17 77.0
Apr-Jun '17 77.4
Public Transport CSM Report April - June 2017 Page 45

Other Tram StaffBase: Tram travellers who had face-to-face interaction with other tram staffIncrease / Decrease signifies a significant increase or Decrease from the previous quarter
“I would like to ask you about any other tram staff you have had contact with in the past six months. On the 0 to 10 scale, how satisfied are you with other tram staff overall?"
Period CSIIncrease /Decrease
Percentage of Tram travellers who had face-to-face interaction with
other tram staff
Increase /Decrease
Apr-Jun'12 76.4 13.3
Jul-Sep'12 80.3 14.5
Oct-Dec '12 77.7 16.5
Jan-Mar '13 79.2 15.4
Apr-Jun'13 79.7 17.3
Jul-Sep'13 80.7 13.5 Decrease
Oct-Dec '13 77.9 14.0
Jan-Mar '14 79.3 16.4
Apr-Jun'14 78.6 16.6
Jul-Sep'14 80.2 15.1
Oct-Dec'14 78.6 15.4
Jan-Mar'15 83.5 Increase 16.9
Apr-Jun'15 82.2 15.2
Jul-Sep '15 78.8 14.6
Oct-Dec '15 78.9 17.2
Jan-Mar '16 82.0 18.2
Apr-Jun '16 80.7 16.2
Jul-Sep '16 80.3 16.9
Oct-Dec'16 80.5 17.5
Jan-Mar '17 83.1 14.7
Apr-Jun '17 83.9 14.4
Public Transport CSM Report April - June 2017 Page 46

Likelihood to Recommend Metropolitan Tram ServicesBase: Tram travellers Increase / Decrease signifies a significant increase or Decrease from the previous quarter
"On a scale of 0 to 10, where 0 is no likelihood and 10 is extremely likely, how likely would you be to recommend Melbourne’s tram services to someone else?"
Period CSIIncrease /Decrease
Net Promoter
Score (NPS)
Increase /Decrease
Apr-Jun'12 74.9 Decrease 6.9
Jul-Sep'12 75.8 10.7
Oct-Dec '12 76.3 12.4
Jan-Mar '13 76.3 11.5
Apr-Jun'13 75.4 8.3
Jul-Sep'13 77.1 12.8
Oct-Dec '13 77.2 15.9
Jan-Mar '14 76.8 13.1
Apr-Jun'14 77.9 16.9
Jul-Sep'14 76.9 12.9
Oct-Dec'14 77.3 15.6
Jan-Mar'15 79.4 Increase 23.7 Increase
Apr-Jun'15 78.1 18.8
Jul-Sep '15 78.4 20.9
Oct-Dec '15 80.2 28.2 Increase
Jan-Mar '16 81.1 29.8
Apr-Jun '16 79.2 Decrease 22.3 Decrease
Jul-Sep '16 78.4 19.8
Oct-Dec'16 79.4 25.0
Jan-Mar '17 80.8 29.1
Apr-Jun '17 79.9 24.7
Public Transport CSM Report April - June 2017 Page 47

Metropolitan Bus Services
Summary of Findings
Financial Year 2016 / 17On the initial ‘top of mind’ measure, bus services scored an overall satisfaction rating of 70.3 for the 2016/17 FY, significantly lower than the 2015/16 FY result of 72.2.
Overall satisfaction on the 0-to-10 scale (multiplied by ten to get a score out of 100) remained stable at 76.3 in 2016/17 FY (76.7 in 2015/16 FY).
There was a significant change to the primary driver of satisfaction this financial year; ‘running of services’ fell significantly to 73.1 from 74.4 in 2015/16 FY. Secondary driver of overall satisfaction ‘personal security’ remained stable returning a score of 77.7 (78.1 last FY).
Satisfaction with tertiary driver ‘myki ticketing’ made significant gains for the third year running (71.4, compared to 69.5 in 2015/16 FY).
April to June Quarter 2017On the initial ‘top of mind’ satisfaction measure 86% of respondents indicated they were ‘totally’, ‘very’, or ‘somewhat’ satisfied with bus services this quarter. When converted to a score out of 100, the result was 70.2, not significantly different to the Jan-Mar17 result of 69.6.
On the more considered 0-to-10 scale (multiplied by ten to get a score out of 100), satisfaction with bus services for Apr-Jun17 was 75.9, statistically unchanged from last quarter (76.7).
Almost a third (31%) of bus users said they believed that bus services were ‘much’ or ‘a little better’ now than 12 months ago, while 6% believe they were either ‘much’ or ‘a little’ worse.
The primary driver of overall satisfaction with bus services, ‘running of services’ remained stable this quarter, achieving a score of 72.9 (73.3 in Jan-Mar17). There were no significant movements among any of the service aspects relating to ‘running of services’.
The secondary driver of overall satisfaction with bus services, ‘personal security’ achieved a rating of 77.6 this quarter, not significantly different to 78.0 achieved in Jan-Mar17. Likewise, no significant movements were seen among any of the service aspects relating to ‘personal security’.
There were no significant movements across any of the remaining service areas or their related service aspects.
The mean likelihood of recommending bus services to others remained unchanged at 76.4. The resulting Net Promoter Score (proportion of Promoters, those giving ratings of 9-10, minus proportion of Detractors, those giving ratings of 0-6) currently sits at 8.
Public Transport CSM Report April - June 2017 Page 48

Metropolitan Bus ServicesPublic transport users selected to answer questions about metropolitan bus services are asked: "Overall, are you satisfied or dissatisfied with the service on your bus route? Is that totally, very or somewhat?”
Asked near the beginning of the survey (before evaluating specific aspects of the service), this question captures the top-of-mind perception of bus services. The table below illustrates the proportion of metropolitan bus users who were totally, very, or somewhat satisfied with the services.
Proportion of Satisfied Users of Metropolitan Bus Services by QuarterBase: Bus travellersIncrease / Decrease signifies a significant increase or Decrease from the previous quarter
PeriodProportion Satisfied %
Increase /Decrease
Apr-Jun'12 87.5
Jul-Sep'12 87.0
Oct-Dec '12 87.2
Jan-Mar '13 86.3
Apr-Jun'13 87.0
Jul-Sep'13 87.7
Oct-Dec '13 87.2
Jan-Mar '14 87.4
Apr-Jun'14 85.6
Jul-Sep'14 87.5
Oct-Dec'14 83.8
Jan-Mar'15 87.6
Apr-Jun'15 87.3
Jul-Sep '15 89.6
Oct-Dec '15 86.5
Jan-Mar '16 87.7
Apr-Jun '16 87.9
Jul-Sep '16 87.7
Oct-Dec'16 85.1
Jan-Mar '17 85.9
Apr-Jun '17 86.0
Public Transport CSM Report April - June 2017 Page 49

Metropolitan Bus ServicesFrom the same question, responses are translated into a Customer Satisfaction Index (refer to the How the Monitor is Conducted section for more details). The table below illustrates the results over time.
Customer Satisfaction Index (CSI) of Bus Services by Quarter (6-point scale)Base: Bus travellersIncrease / Decrease signifies a significant increase or Decrease from the previous quarter
Period CSI Increase /Decrease
Apr-Jun'12 70.4
Jul-Sep'12 71.1
Oct-Dec '12 71.3
Jan-Mar '13 69.3
Apr-Jun'13 71.9
Jul-Sep'13 70.9
Oct-Dec '13 70.4
Jan-Mar '14 72.7
Apr-Jun'14 70.2
Jul-Sep'14 70.5
Oct-Dec'14 70.5
Jan-Mar'15 72.8
Apr-Jun'15 70.9
Jul-Sep '15 73.2
Oct-Dec '15 71.4
Jan-Mar '16 73.3
Apr-Jun '16 70.8
Jul-Sep '16 72.2
Oct-Dec'16 69.1
Jan-Mar '17 69.6
Apr-Jun '17 70.2
Public Transport CSM Report April - June 2017 Page 50

Metropolitan Bus ServicesNear the end of the survey (after evaluating all aspects of the service), bus users are asked the same question, this time using a 0-to-10 scale, where 0 means 'extremely dissatisfied' and 10 means 'extremely satisfied'. The scores are then multiplied by 10 to obtain a Customer Satisfaction Index (CSI) out of 100.The average scores over time are illustrated in the table below. This can be regarded as the 'considered' view of overall satisfaction with the services.
Customer Satisfaction Index of Bus Services by Quarter (0-to-10 scale)Base: Bus travellersIncrease / Decrease signifies a significant increase or Decrease from the previous quarter
Period CSI Increase /Decrease
Apr-Jun'12 74.7
Jul-Sep'12 75.4
Oct-Dec '12 74.9
Jan-Mar '13 75.2
Apr-Jun'13 76.5
Jul-Sep'13 75.9
Oct-Dec '13 76.3
Jan-Mar '14 76.3
Apr-Jun'14 76.2
Jul-Sep'14 76.2
Oct-Dec'14 75.2
Jan-Mar'15 76.5
Apr-Jun'15 76.6
Jul-Sep '15 76.9
Oct-Dec '15 76.1
Jan-Mar '16 77.7
Apr-Jun '16 76.0
Jul-Sep '16 76.6
Oct-Dec'16 76.1
Jan-Mar '17 76.7
Apr-Jun '17 75.9
Public Transport CSM Report April - June 2017 Page 51
Drivers of Satisfaction with Metropolitan Bus ServicesAnalysis of survey results over a long time period, and using statistical methods, allows us to determine which aspects of service have the most effect on overall satisfaction. The various aspects that contribute to the public’s rating of overall satisfaction are called the primary, secondary and tertiary drivers of satisfaction depending on how important they are. The technical appendix gives more information on this analysis.
Primary Driver
Running of ServicesFrequency of scheduled servicesBuses not arriving lateTravel time of bus journey
Secondary Driver
Personal SecuritySecurity on buses during the daySecurity at bus stops during the day
Tertiary Drivers
Bus DriversCourteous and helpfulDrive safely and smoothly
Design Space & ComfortSeat comfortSmoothness of the ride
myki TicketingEase of understanding ticketing systemEase of touching on and offEase of topping-up myki
Price
Bus StopsDesign allows safe entry and exitProvision of shelter and seating
InformationPrinted timetable information at stops
Public Transport CSM Report April - June 2017 Page 52
Information provided for planned disruptionsEase of reading printed timetables
The remaining service area, “authorised officers”, has low contribution to overall satisfaction with bus services.
Public Transport CSM Report April - June 2017 Page 53
Satisfaction with Aspects of Metropolitan Bus ServicesThis section contains the quarterly results of satisfaction scores for various aspects of metropolitan bus services. These scores are based on the 0-to-10 satisfaction scale, which has been used since April 2009, replacing the previously used 6-point satisfaction scale.
Public Transport CSM Report April - June 2017 Page 54

Running of ServicesBase: Bus travellersIncrease / Decrease signifies a significant increase or Decrease from the previous quarter
“Thinking of the operational performance of bus services in terms of frequency, on-time performance and time taken to travel, how satisfied are you with how bus services are run overall?"
Period CSIIncrease /Decrease
Apr-Jun'12 72.6
Jul-Sep'12 72.7
Oct-Dec '12 72.7
Jan-Mar '13 72.5
Apr-Jun'13 73.8
Jul-Sep'13 72.6
Oct-Dec '13 73.4
Jan-Mar '14 73.2
Apr-Jun'14 74.1
Jul-Sep'14 73.2
Oct-Dec'14 73.2
Jan-Mar'15 74.6
Apr-Jun'15 73.7
Jul-Sep '15 74.4
Oct-Dec '15 73.6
Jan-Mar '16 76.1 Increase
Apr-Jun '16 73.3 Decrease
Jul-Sep '16 74.0
Oct-Dec'16 72.2
Jan-Mar '17 73.3
Apr-Jun '17 72.9
Public Transport CSM Report April - June 2017 Page 55

Personal SecurityBase: Bus travellersIncrease / Decrease signifies a significant increase or Decrease from the previous quarter
“How satisfied are you with your feelings of personal security overall?"
Period CSIIncrease /Decrease
Apr-Jun'12 76.3 Decrease
Jul-Sep'12 77.3
Oct-Dec '12 76.4
Jan-Mar '13 77.2
Apr-Jun'13 78.3
Jul-Sep'13 78.2
Oct-Dec '13 77.6
Jan-Mar '14 77.8
Apr-Jun'14 78.1
Jul-Sep'14 78.0
Oct-Dec'14 77.7
Jan-Mar'15 78.3
Apr-Jun'15 76.9
Jul-Sep '15 77.9
Oct-Dec '15 77.8
Jan-Mar '16 79.1
Apr-Jun '16 77.7
Jul-Sep '16 77.1
Oct-Dec'16 78.1
Jan-Mar '17 78.0
Apr-Jun '17 77.6
Public Transport CSM Report April - June 2017 Page 56
InformationBase: Bus travellersIncrease / Decrease signifies a significant increase or Decrease from the previous quarter
“How satisfied are you with the information provided about bus services overall?"
Period CSIIncrease /Decrease
Apr-Jun'12 72.9
Jul-Sep'12 71.1
Oct-Dec '12 72.8
Jan-Mar '13 72.5
Apr-Jun'13 72.9
Jul-Sep'13 71.2
Oct-Dec '13 72.8
Jan-Mar '14 72.1
Apr-Jun'14 72.7
Jul-Sep'14 72.6
Oct-Dec'14 72.0
Jan-Mar'15 72.8
Apr-Jun'15 72.7
Jul-Sep '15 73.2
Oct-Dec '15 72.4
Jan-Mar '16 75.0 Increase
Apr-Jun '16 72.9
Jul-Sep '16 72.3
Oct-Dec'16 72.7
Jan-Mar '17 73.7
Apr-Jun '17 72.2
Public Transport CSM Report April - June 2017 Page 57

Bus DriversBase: Bus travellersIncrease / Decrease signifies a significant increase or Decrease from the previous quarter
“How satisfied are you with metropolitan bus drivers overall?"
Period CSIIncrease /Decrease
Apr-Jun'12 79.2
Jul-Sep'12 79.9
Oct-Dec '12 79.6
Jan-Mar '13 80.4
Apr-Jun'13 79.6
Jul-Sep'13 80.4
Oct-Dec '13 79.7
Jan-Mar '14 80.1
Apr-Jun'14 79.2
Jul-Sep'14 79.9
Oct-Dec'14 80.8
Jan-Mar'15 80.1
Apr-Jun'15 80.5
Jul-Sep '15 80.5
Oct-Dec '15 80.4
Jan-Mar '16 81.5
Apr-Jun '16 79.7
Jul-Sep '16 80.9
Oct-Dec'16 80.5
Jan-Mar '17 81.2
Apr-Jun '17 81.8
Public Transport CSM Report April - June 2017 Page 58

Design, Space and Comfort OnboardBase: Bus travellersIncrease / Decrease signifies a significant increase or Decrease from the previous quarter
“How satisfied are you with the design, space and comfort of Melbourne’s buses overall?"
Period CSIIncrease /Decrease
Apr-Jun'12 77.9
Jul-Sep'12 78.3
Oct-Dec '12 77.2
Jan-Mar '13 78.5
Apr-Jun'13 77.8
Jul-Sep'13 78.0
Oct-Dec '13 77.7
Jan-Mar '14 77.5
Apr-Jun'14 78.0
Jul-Sep'14 78.2
Oct-Dec'14 77.8
Jan-Mar'15 78.1
Apr-Jun'15 77.2
Jul-Sep '15 78.9
Oct-Dec '15 76.9
Jan-Mar '16 78.0
Apr-Jun '16 77.2
Jul-Sep '16 78.3
Oct-Dec'16 77.4
Jan-Mar '17 77.3
Apr-Jun '17 77.2
Public Transport CSM Report April - June 2017 Page 59

Price of Bus TravelBase: Bus travellersIncrease / Decrease signifies a significant increase or Decrease from the previous quarter
“Thinking about the services you receive, how satisfied are you with the price of bus travel in metropolitan Melbourne?"
Period CSIIncrease /Decrease
Apr-Jun'12 67.5
Jul-Sep'12 67.9
Oct-Dec '12 67.9
Jan-Mar '13 66.2
Apr-Jun'13 69.8 Increase
Jul-Sep'13 68.1
Oct-Dec '13 68.4
Jan-Mar '14 68.2
Apr-Jun'14 67.0
Jul-Sep'14 68.3
Oct-Dec'14 68.2
Jan-Mar'15 71.2
Apr-Jun'15 72.2
Jul-Sep '15 74.3
Oct-Dec '15 72.3
Jan-Mar '16 74.0
Apr-Jun '16 73.2
Jul-Sep '16 71.6
Oct-Dec'16 72.5
Jan-Mar '17 73.4
Apr-Jun '17 73.4
Public Transport CSM Report April - June 2017 Page 60

Bus StopsBase: Bus travellersIncrease / Decrease signifies a significant increase or Decrease from the previous quarter
“How satisfied are you with the bus stops overall?"
Period CSIIncrease /Decrease
Apr-Jun'12 72.1
Jul-Sep'12 72.0
Oct-Dec '12 73.4
Jan-Mar '13 73.4
Apr-Jun'13 73.6
Jul-Sep'13 74.5
Oct-Dec '13 74.4
Jan-Mar '14 74.4
Apr-Jun'14 73.2
Jul-Sep'14 74.8
Oct-Dec'14 74.4
Jan-Mar'15 75.9
Apr-Jun'15 73.8
Jul-Sep '15 75.1
Oct-Dec '15 73.3
Jan-Mar '16 76.1 Increase
Apr-Jun '16 74.9
Jul-Sep '16 74.3
Oct-Dec'16 74.4
Jan-Mar '17 74.5
Apr-Jun '17 74.1
Public Transport CSM Report April - June 2017 Page 61
myki TicketingBase: Bus travellers who have used mykiIncrease / Decrease signifies a significant increase or Decrease from the previous quarterNew question introduced in August 2010
“How satisfied are you with the myki ticketing system overall?"
Period CSI Increase /Decrease
% of Bus travellers
using myki
Increase /Decrease
Apr-Jun'12 64.3 Decrease 61.2 Increase
Jul-Sep'12 64.2 78.6 Increase
Oct-Dec '12 62.4 84.2 Increase
Jan-Mar '13 61.5 95.3 Increase
Apr-Jun'13 62.8 95.8
Jul-Sep'13 59.8 100.0 Increase
Oct-Dec '13 63.5 98.1
Jan-Mar '14 64.4 98.1
Apr-Jun'14 65.2 97.2
Jul-Sep'14 66.2 98.1
Oct-Dec'14 64.6 98.8
Jan-Mar'15 68.4 Increase 98.1
Apr-Jun'15 68.5 98.1
Jul-Sep '15 69.0 100.0
Oct-Dec '15 67.0 100.0
Jan-Mar '16 70.9 Increase 100.0
Apr-Jun '16 71.1 100.0
Jul-Sep '16 70.3 100.0
Oct-Dec'16 70.6 100.0
Jan-Mar '17 73.2 100.0
Apr-Jun '17 71.8 100.0
Public Transport CSM Report April - June 2017 Page 62

Authorised OfficersBase: Bus travellers who have been on buses where officers check ticketsIncrease / Decrease signifies a significant increase or Decrease from the previous quarter
“How satisfied are you with authorised officers overall?"
Period CSI Increase /Decrease
% of Bus travellers been on buses where officers
check tickets
Increase /Decrease
Apr-Jun'12 78.0 19.1
Jul-Sep'12 73.9 18.4
Oct-Dec '12 71.4 16.7
Jan-Mar '13 74.9 16.7
Apr-Jun'13 75.6 22.8 Increase
Jul-Sep'13 77.4 22.8
Oct-Dec '13 74.8 16.9 Decrease
Jan-Mar '14 75.2 20.2
Apr-Jun'14 72.5 20.9
Jul-Sep'14 79.2 Increase 20.9
Oct-Dec'14 76.3 20.7
Jan-Mar'15 76.7 25.9
Apr-Jun'15 74.5 23.2
Jul-Sep '15 78.6 23.3
Oct-Dec '15 75.0 25.2
Jan-Mar '16 73.3 24.5
Apr-Jun '16 76.7 25.2
Jul-Sep '16 73.5 22.4
Oct-Dec'16 78.6 25.9
Jan-Mar '17 79.5 24.2
Apr-Jun '17 81.3 23.1
Public Transport CSM Report April - June 2017 Page 63

Likelihood to Recommend Metropolitan Bus ServicesBase: Bus travellers Increase / Decrease signifies a significant increase or Decrease from the previous quarter
"On a scale of 0 to 10, where 0 is no likelihood and 10 is extremely likely, how likely would you be to recommend Melbourne’s tram services to someone else?"
Period CSIIncrease /Decrease
Net Promoter
Score (NPS)
Increase /Decrease
Apr-Jun'12 74.3 6.2
Jul-Sep'12 74.1 8.1
Oct-Dec '12 73.1 1.0
Jan-Mar '13 73.6 4.8
Apr-Jun'13 75.2 12.6
Jul-Sep'13 74.2 5.5
Oct-Dec '13 75.1 7.4
Jan-Mar '14 74.6 8.6
Apr-Jun'14 74.3 4.6
Jul-Sep'14 75.1 6.0
Oct-Dec'14 73.9 2.4
Jan-Mar'15 74.6 5.0
Apr-Jun'15 74.5 4.5
Jul-Sep '15 75.3 7.9
Oct-Dec '15 75.2 8.9
Jan-Mar '16 77.9 18.4
Apr-Jun '16 75.6 9.0
Jul-Sep '16 75.3 9.8
Oct-Dec'16 75.5 7.7
Jan-Mar '17 76.4 14.1
Apr-Jun '17 76.4 8.2
Public Transport CSM Report April - June 2017 Page 64

Public Transport CSM Report April - June 2017 Page 65
V/Line Services OverallEarly in the survey, all V/Line users are asked how satisfied they are with V/Line (train and coach) services in general. The table below tracks over time the proportion of transport users who were totally, very, or somewhat satisfied with the services
Q. Overall, are you satisfied or dissatisfied with V/Line (train and coach) services provided? Is that totally, very, or somewhat (satisfied/dissatisfied)?"
From the same question, responses are translated into a Customer Satisfaction Index (refer to the How the Monitor is Conducted section for more details).
Proportion of Satisfied Users and Customer Satisfaction Index of V/Line Services by QuarterBase: V/Line train and coach travellersIncrease / Decrease signifies a significant increase or Decrease from the previous quarter
PeriodSatisfied
(%)Increase / Decrease
Apr-Jun'12 79.9 Decrease
Jul-Sep'12 86.1 Increase
Oct-Dec'12 81.5
Jan-Mar'13 84.0
Apr-Jun'13 83.6
Jul-Sep'13 84.2
Oct-Dec'13 82.6
Jan-Mar'14 85.1
Apr-Jun'14 82.2
Jul-Sep'14 87.5 Increase
Oct-Dec'14 82.9
Jan-Mar'15 85.9
Apr-Jun'15 85.8
Jul-Sep '15 83.3
Oct-Dec '15 86.6
Jan-Mar '16 76.0 Decrease
Apr-Jun '16 75.1
Jul-Sep '16 82.1 Increase
Oct-Dec '16 80.2
Jan-Mar '17 81.6
Apr-Jun '17 78.6
Period CSIIncrease / Decrease
Apr-Jun'12 67.8 Decrease
Jul-Sep'12 70.2
Oct-Dec'12 68.4
Jan-Mar'13 68.8
Apr-Jun'13 68.6
Jul-Sep'13 70.8
Oct-Dec'13 69.3
Jan-Mar'14 70.1
Apr-Jun'14 68.5
Jul-Sep'14 71.7
Oct-Dec'14 69.8
Jan-Mar'15 71.5
Apr-Jun'15 72.0
Jul-Sep '15 69.8
Oct-Dec '15 71.3
Jan-Mar '16 64.3 Decrease
Apr-Jun '16 64.6
Jul-Sep '16 68.9 Increase
Oct-Dec '16 66.1
Jan-Mar '17 67.3
Apr-Jun '17 66.0
V/Line Train ServicesPublic Transport CSM Report April - June 2017 Page 66

Summary of Findings
Financial Year 2016/17On the initial ‘top of mind’ 6-point scale, V/Line train services achieved an overall satisfaction score of 68.1 for the 2016/17 FY, similar to the previous financial year (68.2).
Overall satisfaction on the 0-to-10 scale (multiplied by ten to get a score out of 100) remained stable with a score of 75.5 this financial year (75.9 in 2015/16FY).
The primary driver of satisfaction with V/Line train services overall, ‘running of services’ was steady in 2016/17FY, scoring 72.6 (73.2 during the 2015/16 FY).
Satisfaction with secondary driver of overall satisfaction ‘personal security’, scored 77.9 for 2016/17, significantly lower than the 2015/16 score of 79.1.
Satisfaction with ‘myki ticketing’, a tertiary driver of overall satisfaction, made further gains this year achieving a score of 73.9 this financial year, significantly higher than the 2015/16 score of 71.6, and up from 67.7 in 2014/15.
April to June Quarter 2017In Apr-Jun17, on the initial ‘top-of-mind’ satisfaction measure, 80% of respondents said they were satisfied (i.e. ‘somewhat’, ‘very’ or ‘totally’ satisfied) with V/Line train services. When converted to a score out of 100, the result was 65.8, not significantly different to the Jan-Mar17 score of 68.6.
On the more considered 0-to-10 scale, satisfaction with V/Line train services was 74.3, significantly lower than the Jan-Mar17 score of 77.1.
One third of V/Line train users thought that services were ‘much’ (11%) or ‘a little’ better (22%) than 12 months ago, while 15% thought they were either ‘a little’ or ‘much’ worse.
The result for ‘running of services’, primary driver of overall satisfaction with V/Line train services, remained stable this quarter scoring 71.8 (also 71.8 last quarter), however there was movement in one related service aspect. Satisfaction with ‘ability to get on first arriving train’ fell significantly, from 83.9 in Jan-Mar17, to 80.8 this quarter.
Satisfaction with overall ‘design and comfort’, a secondary driver of overall satisfaction, fell significantly this quarter (73.1, compared to 76.2 in Jan-Mar17). Contributing to this fall were significantly lower scores for almost half of the related service aspects:
• ‘Smoothness of the ride’ 76.2 (78.8 in Jan-Mar17)
• ‘Space for standing’ 54.5 (59.3 in Jan-Mar17)
• ‘Amount of grab handles and poles to hang on to’ 55.6 (60.5 in Jan-Mar17)
• ‘Space for bicycle and other large items’ 62.9 (67.0 in Jan-Mar17)
V/Line Train Services
Public Transport CSM Report April - June 2017 Page 67
Summary of Findings continued…• ‘Level of crowding’ 64.5 (68.5 in Jan-Mar17).
Satisfaction with ‘personal security’, another secondary driver of overall satisfaction, remained stable this quarter (77.7, compared to 79.7 in Jan-Mar17), as did all related service aspects.
Satisfaction with ‘information’, a tertiary driver, significantly decreased to 75.7 from 78.5 in the previous quarter. There was a four-point drop in satisfaction for related service aspect ‘availability of information for planned alterations’, which returned a score of 68.1 (72.1 in Jan-Mar17).
While ‘paper ticketing’, also a tertiary driver of overall satisfaction, was statistically stable overall this quarter (79.5, compared to 83.5 in Jan-Mar17) significant movements were seen in three related service aspects, two of which effectively reversed last quarter’s gains:
• ‘Ease of understanding ticket system’ 81.5 (86.5 in Jan-Mar17)
• ‘Range of ticket selling locations 74.8 (81.9 in Jan-Mar17)
• ‘Frequency of ticket checks’ 83.5 (87.8 in Jan-Mar17)
Overall satisfaction with ‘myki Ticketing’ was stable (72.5, compared to 75.4 last quarter) although satisfaction with related aspect ‘accuracy of transaction/travel records’ fell significantly to 79.3 (87.3 in Jan-Mar17).
This quarter’s score for ‘train stations’ (75.6) was significantly lower than in Jan-Mar17 (78.1). While there was a general downward trend in satisfaction across all service aspects relating to ‘train stations’ this quarter, only one aspect saw a significant decrease - ‘amount of seating and shelter’ (68.4, 73.5 last quarter).
The mean likelihood of recommending V/Line train services stands at 78.3 (80.8 last quarter). The resulting Net Promoter Score (proportion of Promoters, those giving ratings of 9-10, minus proportion of Detractors, those giving ratings of 0-6) currently sits at 20, significantly lower than in Jan-Mar17 (32).
Public Transport CSM Report April - June 2017 Page 68

V/Line Train ServicesV/Line users selected to answer questions about V/Line train services are asked: "Overall, are you satisfied or dissatisfied with V/Line train services? Is that totally, very or somewhat?”
Asked near the beginning of the survey (before evaluating specific aspects of the service), this question captures the top-of-mind perception of train services. The table below illustrates the proportion of V/Line train users who were totally, very, or somewhat satisfied with the services.
Proportion of Satisfied Users of V/Line Train Services by QuarterBase: V/Line Train travellersIncrease / Decrease signifies a significant increase or Decrease from the previous quarter
PeriodProportion Satisfied %
Increase /Decrease
Apr-Jun'12 81.3 Decrease
Jul-Sep'12 88.5 Increase
Oct-Dec'12 81.6 Decrease
Jan-Mar'13 84.1
Apr-Jun'13 84.2
Jul-Sep'13 84.3
Oct-Dec'13 85.8
Jan-Mar'14 85.8
Apr-Jun'14 82.3
Jul-Sep'14 89.8 Increase
Oct-Dec'14 84.7 Decrease
Jan-Mar'15 85.7
Apr-Jun'15 88.6
Jul-Sep '15 86.4
Oct-Dec '15 87.2
Jan-Mar '16 78.2 Decrease
Apr-Jun '16 79.2
Jul-Sep '16 82.9
Oct-Dec '16 81.9
Jan-Mar '17 82.5
Apr-Jun '17 79.7
Public Transport CSM Report April - June 2017 Page 69

V/Line Train ServicesFrom the same question, responses are translated into a Customer Satisfaction Index (refer to the How the Monitor is Conducted section for more details). The table below illustrates the results over time.
Customer Satisfaction Index (CSI) of V/Line Train Services by Quarter (6-point scale)Base: V/Line Train travellersIncrease / Decrease signifies a significant increase or Decrease from the previous quarter
Period CSI Increase /Decrease
Apr-Jun'12 68.0 Decrease
Jul-Sep'12 72.0 Increase
Oct-Dec'12 68.0 Decrease
Jan-Mar'13 69.6
Apr-Jun'13 69.5
Jul-Sep'13 70.7
Oct-Dec'13 71.3
Jan-Mar'14 70.5
Apr-Jun'14 69.3
Jul-Sep'14 72.4
Oct-Dec'14 70.5
Jan-Mar'15 71.5
Apr-Jun'15 73.3
Jul-Sep '15 71.5
Oct-Dec '15 71.1
Jan-Mar '16 64.2 Decrease
Apr-Jun '16 65.9
Jul-Sep '16 70.8 Increase
Oct-Dec '16 67.4
Jan-Mar '17 68.6
Public Transport CSM Report April - June 2017 Page 70

Period CSI Increase /Decrease
Apr-Jun '17 65.8
V/Line Train ServicesNear the end of the survey (after evaluating all aspects of the service), V/Line train users are asked the same question, this time using a 0-to-10 scale, where 0 means 'extremely dissatisfied' and 10 means 'extremely satisfied'. The scores are then multiplied by 10 to obtain a Customer Satisfaction Index (CSI) out of 100.The average scores over time are illustrated in the table below. This can be regarded as the 'considered' view of overall satisfaction with the services.
Customer Satisfaction Index of V/Line Train Services by Quarter (0-to-10 scale)Base: V/Line Train travellersIncrease / Decrease signifies a significant increase or Decrease from the previous quarter
Period CSI Increase /Decrease
Apr-Jun'12 74.6 Decrease
Jul-Sep'12 76.7
Oct-Dec'12 75.7
Jan-Mar'13 76.4
Apr-Jun'13 74.2
Jul-Sep'13 76.0
Oct-Dec'13 77.0
Jan-Mar'14 75.7
Apr-Jun'14 75.8
Jul-Sep'14 77.3
Oct-Dec'14 75.4
Jan-Mar'15 75.7
Apr-Jun'15 76.9
Jul-Sep '15 76.2
Oct-Dec '15 78.8 Increase
Jan-Mar '16 73.8 Decrease
Apr-Jun '16 74.5
Jul-Sep '16 75.8
Oct-Dec '16 75.0
Public Transport CSM Report April - June 2017 Page 71

Period CSI Increase /Decrease
Jan-Mar '17 77.1
Apr-Jun '17 74.3 Decrease
Drivers of Satisfaction with V/Line Train ServicesAnalysis of survey results over a long time period, and using statistical methods, allows us to determine which aspects of service have the most effect on overall satisfaction. The various aspects that contribute to the public’s rating of overall satisfaction are called the primary, secondary and tertiary drivers of satisfaction depending on how important they are. The technical appendix gives more information on this analysis.
Primary Driver
Running of ServicesTravel time of train journeyFrequency of scheduled servicesV/Line trains running on time
Secondary Drivers
Design & ComfortSmoothness of the rideSeat comfortMaintenance and cleanliness of carriagesLevel of crowding
Personal SecuritySecurity on trains during the daySecurity at stations during the day
Tertiary Drivers
InformationInfo about planned service alterationsAmount of information when delayedEase of understanding info
Seat Reservation Service
TicketingEase of being able to purchase a ticket when neededSufficient places to purchase ticket
Public Transport CSM Report April - June 2017 Page 72

The remaining five service areas “price”, “stations”, “refreshments”, “station staff”, and “conductors” have low contribution to overall satisfaction with V/Line train services.
Satisfaction with Aspects of V/Line Train ServicesThis section contains the quarterly results of satisfaction scores for various aspects of V/Line train services. These scores are based on the 0-to-10 satisfaction scale, which has been used since April 2009, replacing the previously used 6-point satisfaction scale.
Public Transport CSM Report April - June 2017 Page 73

Running of ServicesBase: V/Line Train travellersIncrease / Decrease signifies a significant increase or Decrease from the previous quarter
"Thinking of the operational performance of V/Line train services in terms of frequency, on-time performance and time taken to travel, how satisfied are you with how V/Line train services are run overall?"
Period CSIIncrease /Decrease
Apr-Jun'12 72.3
Jul-Sep'12 74.8
Oct-Dec'12 72.1
Jan-Mar'13 73.6
Apr-Jun'13 72.1
Jul-Sep'13 73.4
Oct-Dec'13 74.2
Jan-Mar'14 72.4
Apr-Jun'14 73.5
Jul-Sep'14 75.6
Oct-Dec'14 72.7 Decrease
Jan-Mar'15 73.8
Apr-Jun'15 74.5
Jul-Sep '15 73.9
Oct-Dec '15 75.8
Jan-Mar '16 71.0 Decrease
Apr-Jun '16 71.8
Jul-Sep '16 74.0
Oct-Dec '16 73.0
Jan-Mar '17 71.8
Apr-Jun '17 71.8
Public Transport CSM Report April - June 2017 Page 74

Personal SecurityBase: V/Line Train travellersIncrease / Decrease signifies a significant increase or Decrease from the previous quarter
"How satisfied are you with your feelings of personal security overall?"
Period CSIIncrease /Decrease
Apr-Jun'12 76.9
Jul-Sep'12 77.6
Oct-Dec'12 77.3
Jan-Mar'13 79.0
Apr-Jun'13 75.8 Decrease
Jul-Sep'13 77.6
Oct-Dec'13 79.0
Jan-Mar'14 78.0
Apr-Jun'14 77.5
Jul-Sep'14 79.6
Oct-Dec'14 77.8
Jan-Mar'15 78.1
Apr-Jun'15 79.6
Jul-Sep '15 78.7
Oct-Dec '15 81.1 Increase
Jan-Mar '16 79.3
Apr-Jun '16 77.4
Jul-Sep '16 76.8
Oct-Dec '16 77.4
Jan-Mar '17 79.7
Apr-Jun '17 77.7
Public Transport CSM Report April - June 2017 Page 75

Design and Comfort OnboardBase: V/Line Train travellersIncrease / Decrease signifies a significant increase or Decrease from the previous quarter
"How satisfied are you with the design and comfort of V/Line trains overall?"
Period CSIIncrease /Decrease
Apr-Jun'12 74.0 Decrease
Jul-Sep'12 74.9
Oct-Dec'12 75.6
Jan-Mar'13 75.9
Apr-Jun'13 74.5
Jul-Sep'13 75.3
Oct-Dec'13 76.4
Jan-Mar'14 75.9
Apr-Jun'14 75.4
Jul-Sep'14 77.2
Oct-Dec'14 75.1
Jan-Mar'15 74.4
Apr-Jun'15 76.2
Jul-Sep '15 76.4
Oct-Dec '15 76.6
Jan-Mar '16 75.1
Apr-Jun '16 73.4
Jul-Sep '16 76.1
Oct-Dec '16 74.0
Jan-Mar '17 76.2
Apr-Jun '17 73.1 Decrease
Public Transport CSM Report April - June 2017 Page 76

InformationBase: V/Line Train travellersIncrease / Decrease signifies a significant increase or Decrease from the previous quarter
"How satisfied are you with the information provided about V/Line train services overall?"
Period CSIIncrease /Decrease
Apr-Jun'12 75.8
Jul-Sep'12 75.9
Oct-Dec'12 76.8
Jan-Mar'13 76.4
Apr-Jun'13 75.5
Jul-Sep'13 76.1
Oct-Dec'13 78.0
Jan-Mar'14 77.3
Apr-Jun'14 75.8
Jul-Sep'14 77.9
Oct-Dec'14 76.0
Jan-Mar'15 77.0
Apr-Jun'15 78.9
Jul-Sep '15 76.6
Oct-Dec '15 78.9
Jan-Mar '16 75.8 Decrease
Apr-Jun '16 76.3
Jul-Sep '16 76.3
Oct-Dec '16 77.3
Jan-Mar '17 78.5
Apr-Jun '17 75.7 Decrease
Public Transport CSM Report April - June 2017 Page 77
Paper TicketingBase: V/Line train travellers not using mykiIncrease / Decrease signifies a significant increase or Decrease from the previous quarter
"How satisfied are you with V/Line ticketing overall?"
Period CSI Increase /Decrease
% of V/Line train travellers not
using myki
Increase /Decrease
Apr-Jun'12 79.3
Jul-Sep'12 80.3
Oct-Dec'12 80.2
Jan-Mar'13 80.9
Apr-Jun'13 79.8
Jul-Sep'13 83.3 Increase
Oct-Dec'13 82.2
Jan-Mar'14 84.4
Apr-Jun'14 83.0
Jul-Sep'14 84.4
Oct-Dec'14 80.7
Jan-Mar'15 84.8 Increase
Apr-Jun'15 81.6
Jul-Sep '15 82.0
Oct-Dec '15 82.7
Jan-Mar '16 81.8
Apr-Jun '16 81.0
Jul-Sep '16 83.2
Oct-Dec '16 78.3 Decrease
Jan-Mar '17 83.5 Increase
Apr-Jun '17 79.5
Public Transport CSM Report April - June 2017 Page 78

myki TicketingBase: V/Line train travellers using mykiIncrease / Decrease signifies a significant increase or Decrease from the previous quarterNew question introduced in July 2013
"How satisfied are you with the myki ticketing system overall?"
Period CSI Increase /Decrease
% of V/Line train travellers using
myki
Increase /Decrease
Apr-Jun'12
Jul-Sep'12
Oct-Dec'12
Jan-Mar'13
Apr-Jun'13
Jul-Sep'13 67.7
Oct-Dec'13 65.4
Jan-Mar'14 65.2
Apr-Jun'14 66.2
Jul-Sep'14 69.6
Oct-Dec'14 65.1
Jan-Mar'15 69.1
Apr-Jun'15 67.3
Jul-Sep '15 71.6
Oct-Dec '15 70.6
Jan-Mar '16 70.9
Apr-Jun '16 73.3
Jul-Sep '16 73.1
Oct-Dec '16 74.6
Jan-Mar '17 75.4
Apr-Jun '17 72.5
Public Transport CSM Report April - June 2017 Page 79
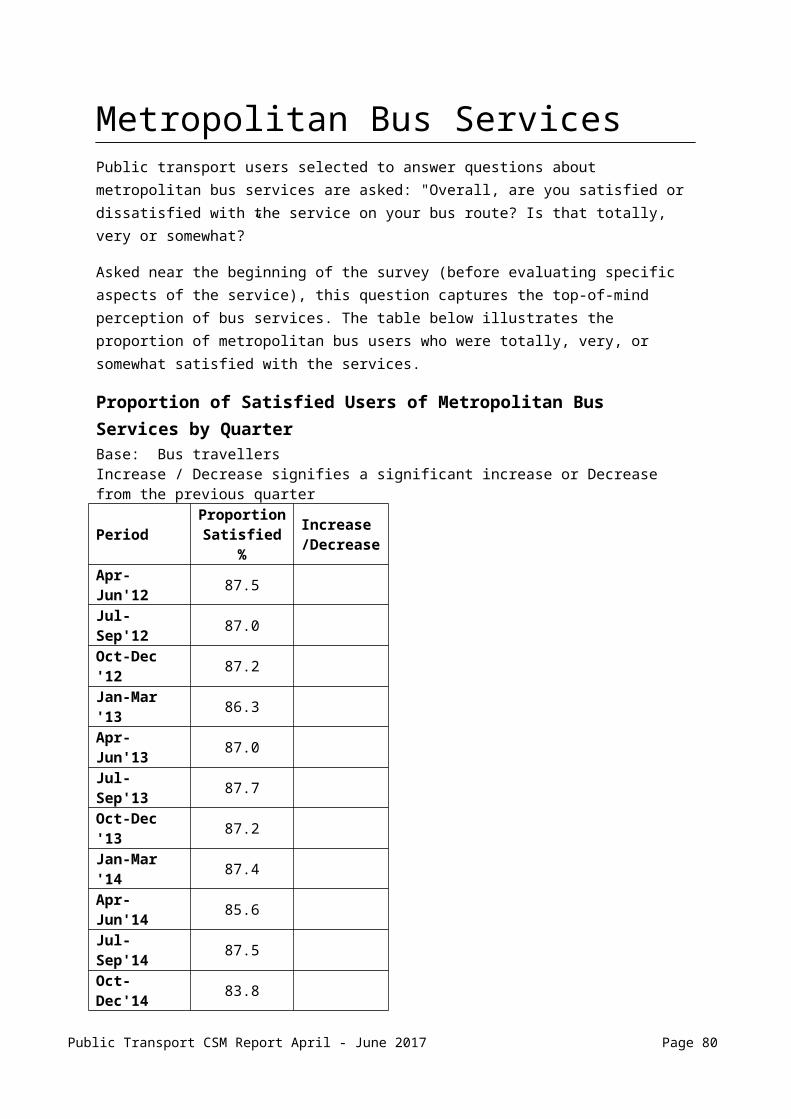
RefreshmentsBase: V/Line train travellers who have been on a service with refreshmentsIncrease / Decrease signifies a significant increase or Decrease from the previous quarter
"How satisfied are you with the refreshments available when travelling by V/Line overall?"
Period CSIIncrease /Decrease
% V/Line train travellers been on a
service with refreshments
Increase /Decrease
Apr-Jun'12 66.4 34.2
Jul-Sep'12 69.2 36.4
Oct-Dec'12 67.9 35.3
Jan-Mar'13 71.9 38.5
Apr-Jun'13 70.6 30.8 Decrease
Jul-Sep'13 69.0 34.9
Oct-Dec'13 69.7 27.0 Decrease
Jan-Mar'14 71.6 38.3 Increase
Apr-Jun'14 68.2 32.8
Jul-Sep'14 73.8 Increase 31.8
Oct-Dec'14 67.0 Decrease 37.8
Jan-Mar'15 69.9 38.2
Apr-Jun'15 68.1 34.1
Jul-Sep '15 73.4 30.3
Oct-Dec '15 66.1 Decrease 34.5
Jan-Mar '16 70.2 37.1
Apr-Jun '16 70.3 33.5
Jul-Sep '16 69.1 29.6
Oct-Dec '16 68.5 34.3
Jan-Mar '17 68.8 32.1
Apr-Jun '17 72.4 33.6
Public Transport CSM Report April - June 2017 Page 80
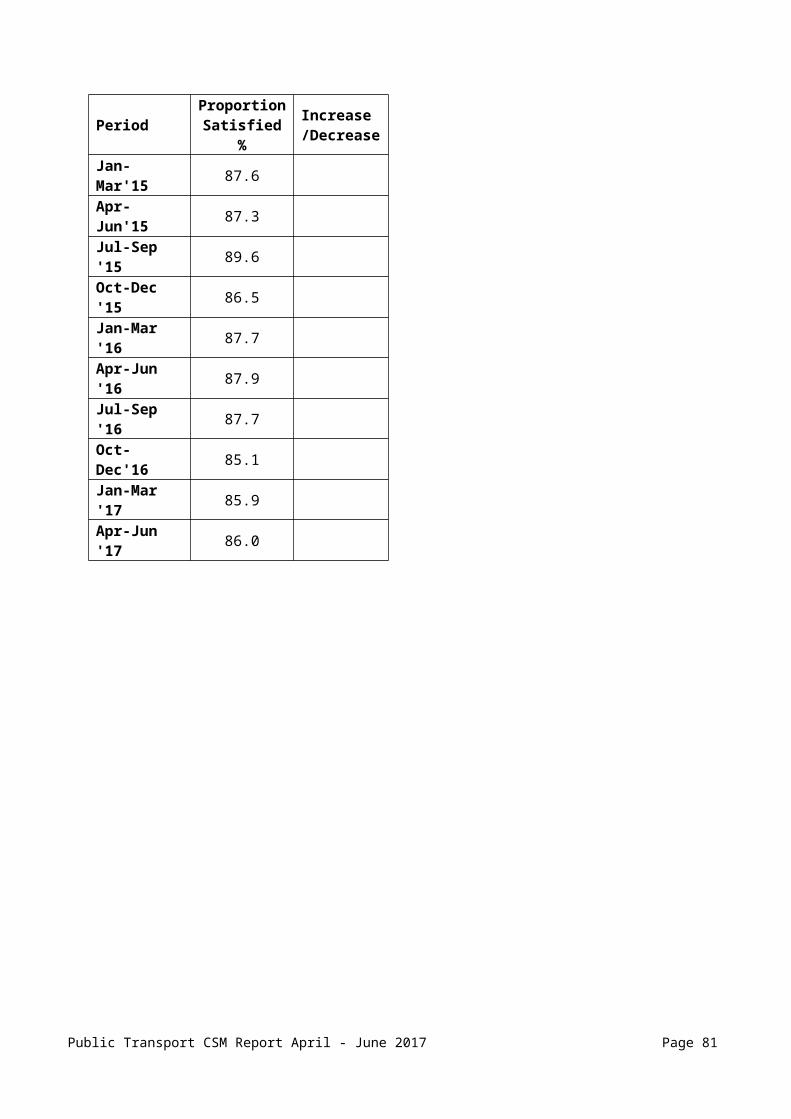
Train StationsBase: V/Line Train travellersIncrease / Decrease signifies a significant increase or Decrease from the previous quarter
"How satisfied are you with V/Line train stations overall?"
Period CSIIncrease /Decrease
Apr-Jun'12 75.3
Jul-Sep'12 77.1
Oct-Dec'12 76.2
Jan-Mar'13 77.3
Apr-Jun'13 75.8
Jul-Sep'13 76.2
Oct-Dec'13 76.7
Jan-Mar'14 77.2
Apr-Jun'14 75.9
Jul-Sep'14 77.8
Oct-Dec'14 76.2
Jan-Mar'15 76.6
Apr-Jun'15 75.5
Jul-Sep '15 76.9
Oct-Dec '15 77.8
Jan-Mar '16 79.1
Apr-Jun '16 76.1 Decrease
Jul-Sep '16 76.8
Oct-Dec '16 76.4
Jan-Mar '17 78.1
Apr-Jun '17 75.6 Decrease
Public Transport CSM Report April - June 2017 Page 81

Price of Train TravelBase: V/Line Train travellersIncrease / Decrease signifies a significant increase or Decrease from the previous quarter
"Thinking just about the price you pay for V/Line train tickets, how satisfied are you with the price of train travel using V/Line?"
Period CSIIncrease /Decrease
Apr-Jun'12 78.3
Jul-Sep'12 79.7
Oct-Dec'12 78.7
Jan-Mar'13 79.6
Apr-Jun'13 77.5
Jul-Sep'13 77.5
Oct-Dec'13 79.8
Jan-Mar'14 77.3
Apr-Jun'14 76.6
Jul-Sep'14 78.1
Oct-Dec'14 76.3
Jan-Mar'15 78.9
Apr-Jun'15 76.8
Jul-Sep '15 78.0
Oct-Dec '15 79.8
Jan-Mar '16 79.0
Apr-Jun '16 77.4
Jul-Sep '16 77.2
Oct-Dec '16 76.0
Jan-Mar '17 77.6
Apr-Jun '17 77.5
Public Transport CSM Report April - June 2017 Page 82
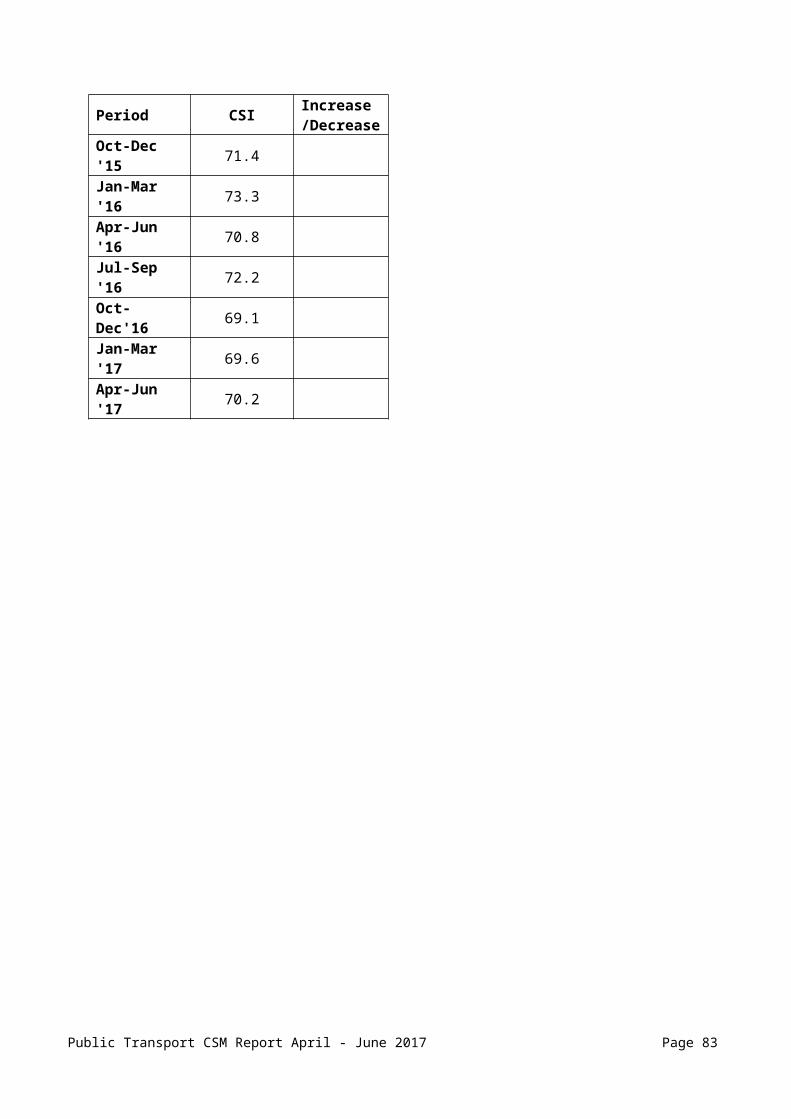
Seat ReservationBase: V/Line train travellers using seat reservation serviceIncrease / Decrease signifies a significant increase or Decrease from the previous quarter
"How satisfied are you with the seat reservation service overall?"
Period CSI Increase /Decrease
% V/Line train travellers using seat reservation service
Increase /Decrease
Apr-Jun'12 83.9 30.7
Jul-Sep'12 85.1 35.6
Oct-Dec'12 85.8 34.5
Jan-Mar'13 86.0 35.5
Apr-Jun'13 83.4 29.7
Jul-Sep'13 78.8 27.0
Oct-Dec'13 82.2 27.9
Jan-Mar'14 83.4 35.4 Increase
Apr-Jun'14 83.1 29.5
Jul-Sep'14 83.5 31.5
Oct-Dec'14 83.7 32.4
Jan-Mar'15 83.6 35.9
Apr-Jun'15 84.7 29.4
Jul-Sep '15 86.1 25.5
Oct-Dec '15 87.6 27.4
Jan-Mar '16 84.8 32.0
Apr-Jun '16 83.0 34.1
Jul-Sep '16 82.6 27.1 Decrease
Oct-Dec '16 83.6 28.7
Jan-Mar '17 84.9 29.6
Apr-Jun '17 84.1 31.4
Public Transport CSM Report April - June 2017 Page 83

V/Line Train StaffBase: V/Line Train travellersIncrease / Decrease signifies a significant increase or Decrease from the previous quarter
"Thinking about the V/Line staff you have had contact with in the past six months, on the 0 to 10 scale, how satisfied are you with V/Line train staff overall?"
Period CSIIncrease /Decrease
Apr-Jun'12 84.7
Jul-Sep'12 85.6
Oct-Dec'12 86.7
Jan-Mar'13 87.3
Apr-Jun'13 85.0
Jul-Sep'13 85.9
Oct-Dec'13 85.7
Jan-Mar'14 85.9
Apr-Jun'14 86.6
Jul-Sep'14 86.3
Oct-Dec'14 85.5
Jan-Mar'15 85.7
Apr-Jun'15 85.0
Jul-Sep '15 86.4
Oct-Dec '15 87.3
Jan-Mar '16 87.2
Apr-Jun '16 86.2
Jul-Sep '16 86.5
Oct-Dec '16 85.6
Jan-Mar '17 88.2 Increase
Apr-Jun '17 86.5
Public Transport CSM Report April - June 2017 Page 84

Train ConductorsBase: V/Line Train travellersIncrease / Decrease signifies a significant increase or Decrease from the previous quarter
"How satisfied are you with V/Line conductors overall?"
Period CSIIncrease /Decrease
Apr-Jun'12 84.4
Jul-Sep'12 85.0
Oct-Dec'12 85.2
Jan-Mar'13 86.2
Apr-Jun'13 84.4
Jul-Sep'13 85.6
Oct-Dec'13 86.4
Jan-Mar'14 86.6
Apr-Jun'14 86.0
Jul-Sep'14 85.7
Oct-Dec'14 85.6
Jan-Mar'15 85.4
Apr-Jun'15 85.9
Jul-Sep '15 86.6
Oct-Dec '15 86.6
Jan-Mar '16 87.2
Apr-Jun '16 86.2
Jul-Sep '16 85.9
Oct-Dec '16 86.3
Jan-Mar '17 86.5
Apr-Jun '17 86.1
Public Transport CSM Report April - June 2017 Page 85

Likelihood to Recommend Train ServicesBase: V/Line Train travellersIncrease / Decrease signifies a significant increase or Decrease from the previous quarter
"On a scale of 0 to 10, where 0 is no likelihood and 10 is extremely likely, how likely would you be to recommend V/Line’s train services to someone else?"
Period CSI Increase /Decrease
Net Promoter
Score (NPS)
Increase /Decrease
Apr-Jun'12 79.8 22.7 Decrease
Jul-Sep'12 81.1 30.4 Increase
Oct-Dec'12 78.5 21.3 Decrease
Jan-Mar'13 80.3 27.4
Apr-Jun'13 78.6 21.0
Jul-Sep'13 79.9 27.7
Oct-Dec'13 82.0 37.4
Jan-Mar'14 80.2 30.1
Apr-Jun'14 79.1 24.9
Jul-Sep'14 82.2 Increase 34.3
Oct-Dec'14 79.1 Decrease 24.5
Jan-Mar'15 80.7 30.2
Apr-Jun'15 82.1 35.0
Jul-Sep '15 79.6 28.1
Oct-Dec '15 82.9 Increase 35.1
Jan-Mar '16 76.6 Decrease 19.9 Decrease
Apr-Jun '16 77.0 17.9
Jul-Sep '16 80.6 Increase 30.1 Increase
Oct-Dec '16 79.7 24.9
Jan-Mar '17 80.8 32.3
Apr-Jun '17 78.3 19.9 Decrease
Public Transport CSM Report April - June 2017 Page 86

V/Line Coach Services
Summary of Findings
Financial Year 2016/17Using the initial ‘top of mind’ 6-point scale, V/Line train services achieved an overall satisfaction score of 72.7 for the 2016/17 FY, significantly lower than the previous financial year (77.2).
However, the more considered 0-10 scale remained stable with a score of 81.5 (82.3 last financial year) and there were no significant changes across any of the service aspects.
In the past 12 months, Ballarat (81.8) was the highest rated coach corridor, while Traralgon (80.5) is rated the lowest. The highest rated coach region was Northern (86.2), while Eastern (80.9) is the lowest rated coach region.
April to June Quarter 2017Satisfaction with V/Line coach services remains relatively stable again this quarter, with no changes observed among the key service aspects.
In response to the initial ‘top-of-mind’ question, 85% of users said they were ‘somewhat’, ‘very’ or ‘totally’ satisfied with the services, not significantly different to last quarter (87%). Converted to a score out of 100, the result was 73.5 (71.3 in Jan-Mar17).
Using the more considered, 0-to-10 scale, overall satisfaction was 82.8 (compared to 82.9 in Jan-Mar17), again a non-significant difference.
This quarter, 15% of users thought that V/Line coach services were ‘a little’ or ‘much’ better than a year ago, while 6% thought the opposite.
There was no effective change in the primary driver of overall satisfaction, ‘running of services’ this quarter, which scored 81.8 (79.4 in Jan-Mar17). Likewise for all service aspects relating to ‘running of services’ which have all remained stable since last quarter.
This quarter the drivers of satisfaction model was updated using data from the 2016/17 financial year, which introduced ‘coach stops’ as a secondary driver of satisfaction.
There were no significant movements in overall satisfaction for either of the secondary drivers this quarter. ‘Personal security’ (84.2, compared to 85.6 in Jan-Mar17) and ‘coach stops’ (76.6, compared to 79.1 in Jan-Mar17) both remained statistically stable, as did all service aspects relating to these drivers.
The mean likelihood of recommending V/Line coach services is currently 82.0. The resulting Net Promoter Score (proportion of Promoters, those giving ratings of 9-10, minus proportion of Detractors, those giving ratings of 0-6) currently sits at 34, similar to 38 in Jan-Mar17.
Public Transport CSM Report April - June 2017 Page 87

V/Line Coach ServicesV/Line users selected to answer questions about V/Line coach services are asked: "Overall, are you satisfied or dissatisfied with V/Line coach services? Is that totally, very or somewhat?”
Asked near the beginning of the survey (before evaluating specific aspects of the service), this question captures the top-of-mind perception of coach services. The table below illustrates the proportion of V/Line coach users who were totally, very, or somewhat satisfied with the services.
Proportion of Satisfied Users of V/Line Coach Services by QuarterBase: V/Line coach travellersIncrease / Decrease signifies a significant increase or Decrease from the previous quarter
PeriodProportion Satisfied %
Increase /Decrease
Apr-Jun'12 89.5
Jul-Sep'12 88.3
Oct-Dec'12 93.4
Jan-Mar'13 82.1 Decrease
Apr-Jun'13 94.5 Increase
Jul-Sep'13 90.4
Oct-Dec'13 86.4
Jan-Mar'14 88.5
Apr-Jun'14 81.4
Jul-Sep'14 91.4
Oct-Dec'14 90.6
Jan-Mar'15 91.5
Apr-Jun'15 98.4
Jul-Sep '15 94.4
Oct-Dec '15 98.6
Jan-Mar '16 94.7
Apr-Jun '16 88.6
Jul-Sep '16 87.8
Oct-Dec '16 90.5
Jan-Mar '17 87.0
Apr-Jun '17 84.6
Public Transport CSM Report April - June 2017 Page 88
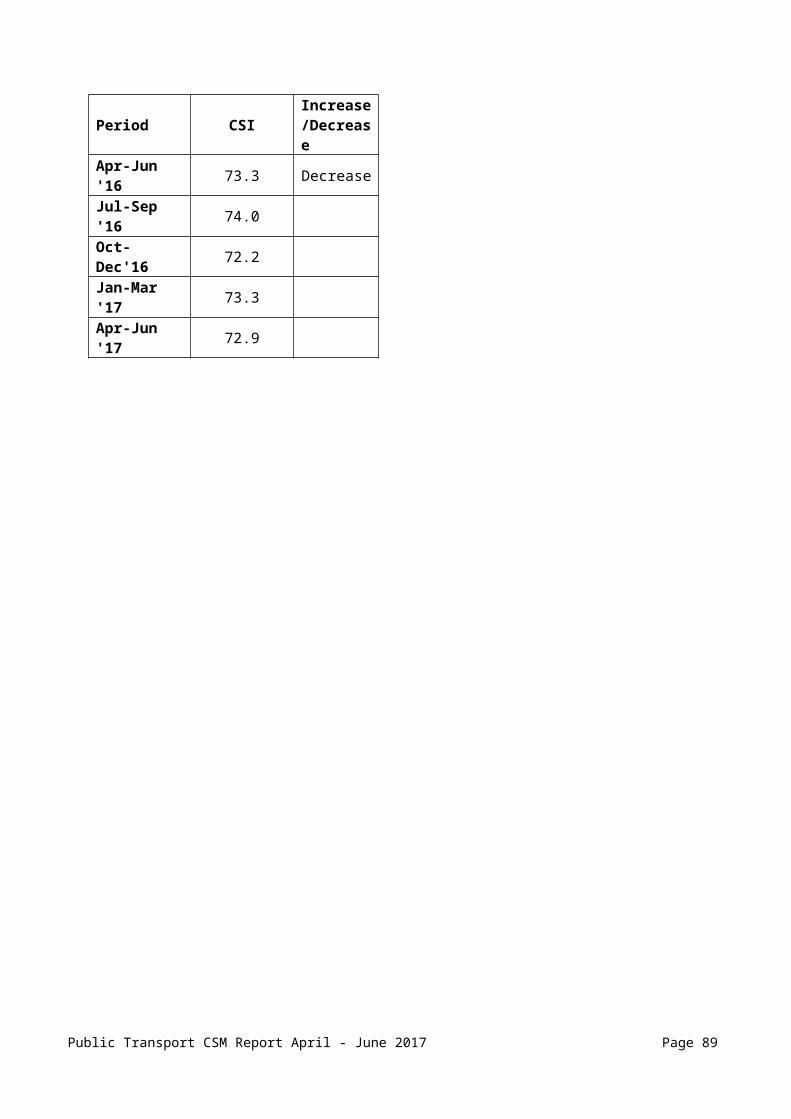
V/Line Coach ServicesFrom the same question, responses are translated into a Customer Satisfaction Index (refer to the How the Monitor is Conducted section for more details). The table below illustrates the results over time.
Customer Satisfaction Index (CSI) of V/Line Coach Services by Quarter (6-point scale)Base: V/Line coach travellersIncrease / Decrease signifies a significant increase or Decrease from the previous quarter
Period CSI Increase /Decrease
Apr-Jun'12 74.2
Jul-Sep'12 72.0
Oct-Dec'12 77.1
Jan-Mar'13 72.5
Apr-Jun'13 76.4
Jul-Sep'13 78.9
Oct-Dec'13 73.3
Jan-Mar'14 73.8
Apr-Jun'14 71.5
Jul-Sep'14 74.6
Oct-Dec'14 77.0
Jan-Mar'15 77.6
Apr-Jun'15 79.0
Jul-Sep '15 77.5
Oct-Dec '15 82.5
Jan-Mar '16 79.2
Apr-Jun '16 70.9 Decrease
Jul-Sep '16 72.2
Oct-Dec '16 74.0
Jan-Mar '17 71.3
Apr-Jun '17 73.5
Public Transport CSM Report April - June 2017 Page 89

V/Line Coach ServicesNear the end of the survey (after evaluating all aspects of the service), coach users are asked the same question, this time using a 0-to-10 scale, where 0 means 'extremely dissatisfied' and 10 means 'extremely satisfied'. The scores are then multiplied by 10 to obtain a Customer Satisfaction Index (CSI) out of 100. The average scores over time are illustrated in the table below. This can be regarded as the 'considered' view of overall satisfaction with the services.
Customer Satisfaction Index of V/Line Coach Services by Quarter (0-to-10 scale)Base: V/Line coach travellersIncrease / Decrease signifies a significant increase or Decrease from the previous quarter
Period CSI Increase /Decrease
Apr-Jun'12 80.3
Jul-Sep'12 81.0
Oct-Dec'12 85.3
Jan-Mar'13 80.8
Apr-Jun'13 81.4
Jul-Sep'13 83.6
Oct-Dec'13 80.7
Jan-Mar'14 82.8
Apr-Jun'14 81.4
Jul-Sep'14 80.3
Oct-Dec'14 80.8
Jan-Mar'15 84.6
Apr-Jun'15 85.7
Jul-Sep '15 83.9
Oct-Dec '15 86.1
Jan-Mar '16 81.6
Apr-Jun '16 78.4
Jul-Sep '16 80.8
Oct-Dec '16 79.5
Jan-Mar '17 82.9
Apr-Jun '17 82.8
Public Transport CSM Report April - June 2017 Page 90

Drivers of Satisfaction with V/Line Coach ServicesAnalysis of survey results over a long time period, and using statistical methods, allows us to determine which aspects of service have the most effect on overall satisfaction. The various aspects that contribute to the public’s rating of overall satisfaction are called the primary, secondary and tertiary drivers of satisfaction depending on how important they are. The technical appendix gives more information on this analysis.
Primary Driver
Running of ServicesHours of operationRunning on timeTime of journey
Secondary Drivers
Personal SecuritySecurity on coaches during the daySecurity at coach stops after darkSecurity at coach stops during the day
Coach StopsMaintenance of facilitiesCleanliness of toiletsGeneral cleanliness
Tertiary Drivers
Design & ComfortSeat comfortEase getting off coach
TicketingEase of purchasing ticketsEase of understanding ticket systemRange of ticket selling locations
Coach DriversSafe and smooth drivingCourtesy and helpfulness of drivers
InformationInformation for planned alterations
Public Transport CSM Report April - June 2017 Page 91

Ease of understanding timetable informationAvailability of timetable information
The remaining two service areas “price” and “seat reservation” have low contribution to overall satisfaction with V/Line coach services.
Public Transport CSM Report April - June 2017 Page 92

Satisfaction with Aspects of V/Line Coach ServicesThis section contains the quarterly results of satisfaction scores for various aspects of V/Line coach services. These scores are based on the 0-to-10 satisfaction scale, which has been used since April 2009, replacing the previously used 6-point satisfaction scale.
Public Transport CSM Report April - June 2017 Page 93

Running of ServicesBase: V/Line coach travellersIncrease / Decrease signifies a significant increase or Decrease from the previous quarter
"Thinking of the operational performance of V/Line coach services in terms of frequency, on-time performance and time taken to travel, how satisfied are you with how V/Line coach services are run overall?"
Period CSIIncrease /Decrease
Apr-Jun'12 77.2
Jul-Sep'12 76.8
Oct-Dec'12 82.2
Jan-Mar'13 78.3
Apr-Jun'13 77.5
Jul-Sep'13 80.1
Oct-Dec'13 77.0
Jan-Mar'14 77.6
Apr-Jun'14 79.8
Jul-Sep'14 76.9
Oct-Dec'14 79.1
Jan-Mar'15 83.3
Apr-Jun'15 81.1
Jul-Sep '15 78.9
Oct-Dec '15 81.0
Jan-Mar '16 77.8
Apr-Jun '16 74.5
Jul-Sep '16 75.5
Oct-Dec '16 75.5
Jan-Mar '17 79.4
Apr-Jun '17 81.8
Public Transport CSM Report April - June 2017 Page 94

Coach DriversBase: V/Line coach travellersIncrease / Decrease signifies a significant increase or Decrease from the previous quarter
"How satisfied are you with V/Line coach drivers overall?"
Period CSIIncrease /Decrease
Apr-Jun'12 86.4
Jul-Sep'12 86.7
Oct-Dec'12 89.4
Jan-Mar'13 89.3
Apr-Jun'13 88.2
Jul-Sep'13 90.1
Oct-Dec'13 87.2
Jan-Mar'14 88.3
Apr-Jun'14 89.2
Jul-Sep'14 87.5
Oct-Dec'14 89.1
Jan-Mar'15 89.1
Apr-Jun'15 90.3
Jul-Sep '15 90.3
Oct-Dec '15 89.9
Jan-Mar '16 90.3
Apr-Jun '16 86.0 Decrease
Jul-Sep '16 88.9
Oct-Dec '16 88.9
Jan-Mar '17 89.4
Apr-Jun '17 89.8
Public Transport CSM Report April - June 2017 Page 95

Personal SecurityBase: V/Line coach travellersIncrease / Decrease signifies a significant increase or Decrease from the previous quarter
"How satisfied are you with your feelings of personal security overall?"
Period CSIIncrease /Decrease
Apr-Jun'12 84.1
Jul-Sep'12 83.7
Oct-Dec'12 85.6
Jan-Mar'13 85.1
Apr-Jun'13 83.7
Jul-Sep'13 86.0
Oct-Dec'13 82.3
Jan-Mar'14 83.5
Apr-Jun'14 86.2
Jul-Sep'14 81.1
Oct-Dec'14 83.2
Jan-Mar'15 84.9
Apr-Jun'15 88.4
Jul-Sep '15 86.4
Oct-Dec '15 87.6
Jan-Mar '16 83.6
Apr-Jun '16 82.5
Jul-Sep '16 81.1
Oct-Dec '16 82.4
Jan-Mar '17 85.6
Apr-Jun '17 84.2
Public Transport CSM Report April - June 2017 Page 96

Coach StopsBase: V/Line coach travellersIncrease / Decrease signifies a significant increase or Decrease from the previous quarter
"How satisfied are you with V/Line coach stops overall?"
Period CSIIncrease /Decrease
Apr-Jun'12 78.4
Jul-Sep'12 76.3
Oct-Dec'12 78.0
Jan-Mar'13 73.1
Apr-Jun'13 73.7
Jul-Sep'13 78.8
Oct-Dec'13 79.1
Jan-Mar'14 77.1
Apr-Jun'14 78.3
Jul-Sep'14 77.2
Oct-Dec'14 78.5
Jan-Mar'15 79.4
Apr-Jun'15 79.2
Jul-Sep '15 78.1
Oct-Dec '15 79.0
Jan-Mar '16 77.1
Apr-Jun '16 70.5 Decrease
Jul-Sep '16 77.7 Increase
Oct-Dec '16 74.9
Jan-Mar '17 79.1
Apr-Jun '17 76.6
Public Transport CSM Report April - June 2017 Page 97

Design and Comfort OnboardBase: V/Line coach travellersIncrease / Decrease signifies a significant increase or Decrease from the previous quarter
"How satisfied are you with the design and comfort of V/Line coaches overall?"
Period CSIIncrease /Decrease
Apr-Jun'12 81.3
Jul-Sep'12 79.3
Oct-Dec'12 84.0 Increase
Jan-Mar'13 80.7
Apr-Jun'13 81.2
Jul-Sep'13 81.9
Oct-Dec'13 81.1
Jan-Mar'14 80.0
Apr-Jun'14 81.7
Jul-Sep'14 82.6
Oct-Dec'14 79.6
Jan-Mar'15 83.2
Apr-Jun'15 82.3
Jul-Sep '15 84.2
Oct-Dec '15 83.5
Jan-Mar '16 81.3
Apr-Jun '16 78.3
Jul-Sep '16 80.3
Oct-Dec '16 78.4
Jan-Mar '17 81.6
Apr-Jun '17 81.5
Public Transport CSM Report April - June 2017 Page 98
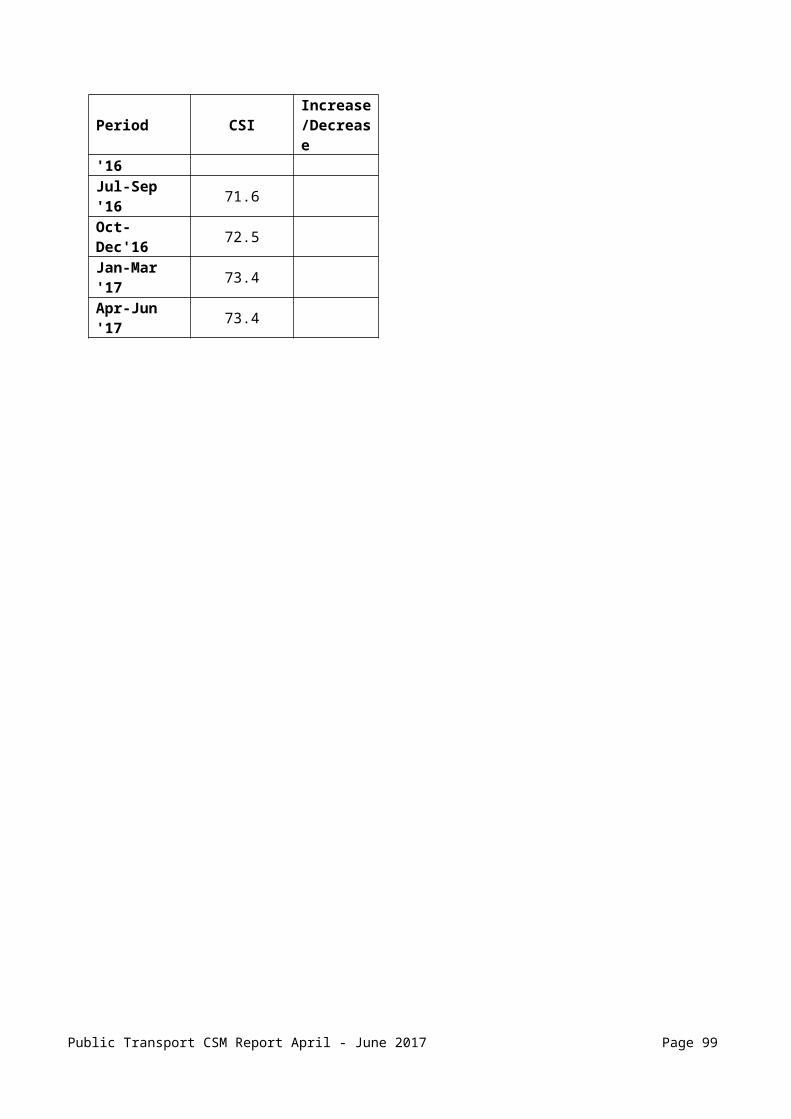
TicketingBase: V/Line coach travellersIncrease / Decrease signifies a significant increase or Decrease from the previous quarter
"How satisfied are you with V/Line ticketing overall?"
Period CSIIncrease /Decrease
Apr-Jun'12 80.5
Jul-Sep'12 74.2
Oct-Dec'12 81.6 Increase
Jan-Mar'13 77.0
Apr-Jun'13 77.1
Jul-Sep'13 78.9
Oct-Dec'13 79.1
Jan-Mar'14 78.4
Apr-Jun'14 80.7
Jul-Sep'14 77.9
Oct-Dec'14 78.7
Jan-Mar'15 77.3
Apr-Jun'15 83.2
Jul-Sep '15 78.5
Oct-Dec '15 80.1
Jan-Mar '16 80.4
Apr-Jun '16 75.5
Jul-Sep '16 78.8
Oct-Dec '16 75.0
Jan-Mar '17 81.9 Increase
Apr-Jun '17 79.2
Public Transport CSM Report April - June 2017 Page 99

Ticket PriceBase: V/Line coach travellersIncrease / Decrease signifies a significant increase or Decrease from the previous quarter
"Thinking just about the price you pay for V/Line coach tickets, how satisfied are you with the price of coach travel using V/Line?"
Period CSIIncrease /Decrease
Apr-Jun'12 84.3
Jul-Sep'12 77.9
Oct-Dec'12 87.3 Increase
Jan-Mar'13 80.5 Decrease
Apr-Jun'13 81.4
Jul-Sep'13 84.6
Oct-Dec'13 82.6
Jan-Mar'14 83.2
Apr-Jun'14 78.5
Jul-Sep'14 85.8 Increase
Oct-Dec'14 85.4
Jan-Mar'15 82.0
Apr-Jun'15 85.3
Jul-Sep '15 83.2
Oct-Dec '15 85.3
Jan-Mar '16 86.6
Apr-Jun '16 78.1 Decrease
Jul-Sep '16 84.0
Oct-Dec '16 84.0
Jan-Mar '17 86.5
Apr-Jun '17 83.8
Public Transport CSM Report April - June 2017 Page 100

InformationBase: V/Line coach travellersIncrease / Decrease signifies a significant increase or Decrease from the previous quarter
"How satisfied are you with the information provided about V/Line coach services overall?"
Period CSIIncrease /Decrease
Apr-Jun'12 79.1
Jul-Sep'12 78.7
Oct-Dec'12 82.2
Jan-Mar'13 77.0
Apr-Jun'13 82.2
Jul-Sep'13 79.4
Oct-Dec'13 79.5
Jan-Mar'14 80.5
Apr-Jun'14 81.1
Jul-Sep'14 76.9
Oct-Dec'14 81.5
Jan-Mar'15 81.1
Apr-Jun'15 81.0
Jul-Sep '15 78.5
Oct-Dec '15 83.9
Jan-Mar '16 81.6
Apr-Jun '16 75.4 Decrease
Jul-Sep '16 77.6
Oct-Dec '16 80.2
Jan-Mar '17 81.3
Apr-Jun '17 81.9
Public Transport CSM Report April - June 2017 Page 101

Seat ReservationBase: V/Line coach travellers using seat reservation serviceIncrease / Decrease signifies a significant increase or Decrease from the previous quarter
"How satisfied are you with the seat reservation service overall?"
Period CSI Increase /Decrease
% V/Line coach travellers using seat reservation service
Increase /Decrease
Apr-Jun'12 82.2 46.5
Jul-Sep'12 83.5 33.3
Oct-Dec'12 84.6 36.4
Jan-Mar'13 85.5 38.8
Apr-Jun'13 86.0 41.1
Jul-Sep'13 85.9 26.0
Oct-Dec'13 82.6 37.0
Jan-Mar'14 82.5 33.3
Apr-Jun'14 81.6 37.3
Jul-Sep'14 81.2 31.4
Oct-Dec'14 84.3 34.0
Jan-Mar'15 84.1 30.5
Apr-Jun'15 86.0 29.5
Jul-Sep '15 85.5 32.1
Oct-Dec '15 86.2 31.1
Jan-Mar '16 87.2 29.7
Apr-Jun '16 86.4 29.4
Jul-Sep '16 86.3 28.6
Oct-Dec '16 83.5 30.3
Jan-Mar '17 84.0 29.8
Apr-Jun '17 83.2 32.0
Public Transport CSM Report April - June 2017 Page 102
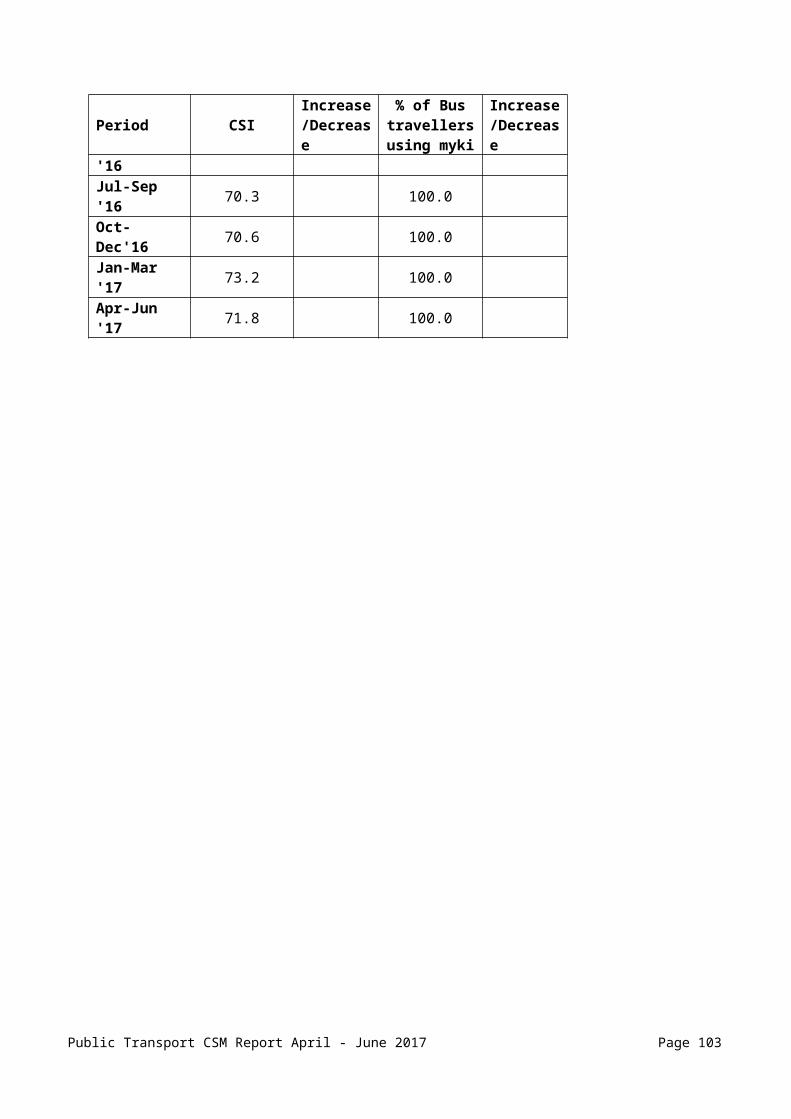
Likelihood to Recommend V/Line Coach ServicesBase: V/Line coach travellersIncrease / Decrease signifies a significant increase or Decrease from the previous quarter
"On a scale of 0 to 10, where 0 is no likelihood and 10 is extremely likely, how likely would you be to recommend V/Line’s coach services to someone else?"
Period CSIIncrease /Decrease
Net Promoter Score (NPS)
Increase /Decrease
Apr-Jun'12 81.7 27.9
Jul-Sep'12 84.7 41.7
Oct-Dec'12 85.7 49.4
Jan-Mar'13 80.8 31.3 Decrease
Apr-Jun'13 81.9 29.2
Jul-Sep'13 85.9 50.7
Oct-Dec'13 81.9 35.9
Jan-Mar'14 82.4 33.3
Apr-Jun'14 82.7 30.5
Jul-Sep'14 83.9 47.1
Oct-Dec'14 84.0 36.5
Jan-Mar'15 85.1 53.7
Apr-Jun'15 90.0 60.7
Jul-Sep '15 83.0 Decrease 37.7
Oct-Dec '15 85.8 46.5
Jan-Mar '16 82.3 33.8
Apr-Jun '16 79.7 22.1
Jul-Sep '16 80.9 32.4
Oct-Dec '16 80.6 30.6
Jan-Mar '17 83.9 37.7
Apr-Jun '17 82.0 34.4
Public Transport CSM Report April - June 2017 Page 103

APPENDIX ACustomer Satisfaction Indices by Financial Year
Public Transport CSM Report April - June 2017 Page 104

Metropolitan ServicesNOTE: Increase / decrease signifies a significant increase or decrease from the previous financial year
Overall Satisfaction with Metropolitan Services by Financial Year6-pt scale
Year 2012/13 2013/14 2014/15
2015/16 2016/17
Overall Metro Services 62.7 65.2 67.1 68.4 68.1Increase / decrease Increase Increase Increase
Train ServicesNOTE: Increase / decrease signifies a significant increase or decrease from the previous financial year
Overall Satisfaction with Train Services by Financial Year6-pt scale
Year 2012/13 2013/14 2014/15
2015/16 2016/17
Overall Train Services 64.4 67.3 69.1 70.3 70.7Increase / decrease Increase Increase Increase Increase
Overall Satisfaction with Train Services by Financial Year0-10 scale
Year 2012/13 2013/14 2014/15
2015/16 2016/17
Overall Train Services 67.0 69.7 71.5 72.3 72.6Increase / decrease Increase Increase Increase
Overall Satisfaction with Information by Financial Year0-10 scale
Year 2012/13 2013/14 2014/15
2015/16 2016/17
Information 68.4 70.8 72.4 73.6 74.4Increase / decrease Increase Increase Increase Increase
Public Transport CSM Report April - June 2017 Page 105

Overall Satisfaction with Train Stations by Financial Year0-10 scale
Year 2012/13 2013/14 2014/15
2015/16 2016/17
Train Stations 65.7 67.4 69.3 70.6 69.9Increase / decrease Increase Increase Increase Increase
Overall Satisfaction with myki Ticketing by Financial Year0-10 scale
Year 2012/13 2013/14 2014/15
2015/16 2016/17
myki Ticketing 60.8 62.4 65.2 66.6 68.5Increase / decrease Decrease Increase Increase Increase Increase
Overall Satisfaction with Price of Train Travel by Financial Year0-10 scale
Year 2012/13 2013/14
2014/15 2015/16
2016/17
Price 62.5 63.3 66.2 70.7 69.2Increase / decrease Increase Increase Decrease
Overall Satisfaction with Running of Services by Financial Year0-10 scale
Year 2012/13 2013/14 2014/15
2015/16 2016/17
Running of Services 68.0 70.4 71.8 72.7 73.6Increase / decrease Increase Increase Increase Increase Increase
Overall Satisfaction with Design, Space & Comfort by Financial Year0-10 scale
Year 2012/13 2013/14 2014/15
2015/16 2016/17
Design, Space & Comfort 66.3 68.0 68.6 69.1 69.3Increase / decrease Increase
Overall Satisfaction with Train Drivers by Financial Year0-10 scale
Year 2012/13 2013/14 2014/15
2015/16 2016/17
Train Drivers 78.7 80.2 80.7 80.8 81.4Increase / decrease Increase
Public Transport CSM Report April - June 2017 Page 106

Overall Satisfaction with Other Train Staff by Financial Year0-10 scale
Year 2012/13 2013/14 2014/15
2015/16 2016/17
Other Train Staff 75.2 75.6 77.8 79.3 79.2Increase / decrease Increase Increase
Overall Satisfaction with Authorised Officers by Financial Year0-10 scale
Year 2012/13 2013/14 2014/15
2015/16 2016/17
Authorised Officers 71.7 72.3 73.6 73.6 74.3Increase / decrease
Overall Satisfaction with Personal Security by Financial Year0-10 scale
Year 2012/13 2013/14 2014/15
2015/16 2016/17
Personal Security 66.1 68.8 70.5 70.4 69.5Increase / decrease Increase Increase Increase
Public Transport CSM Report April - June 2017 Page 107
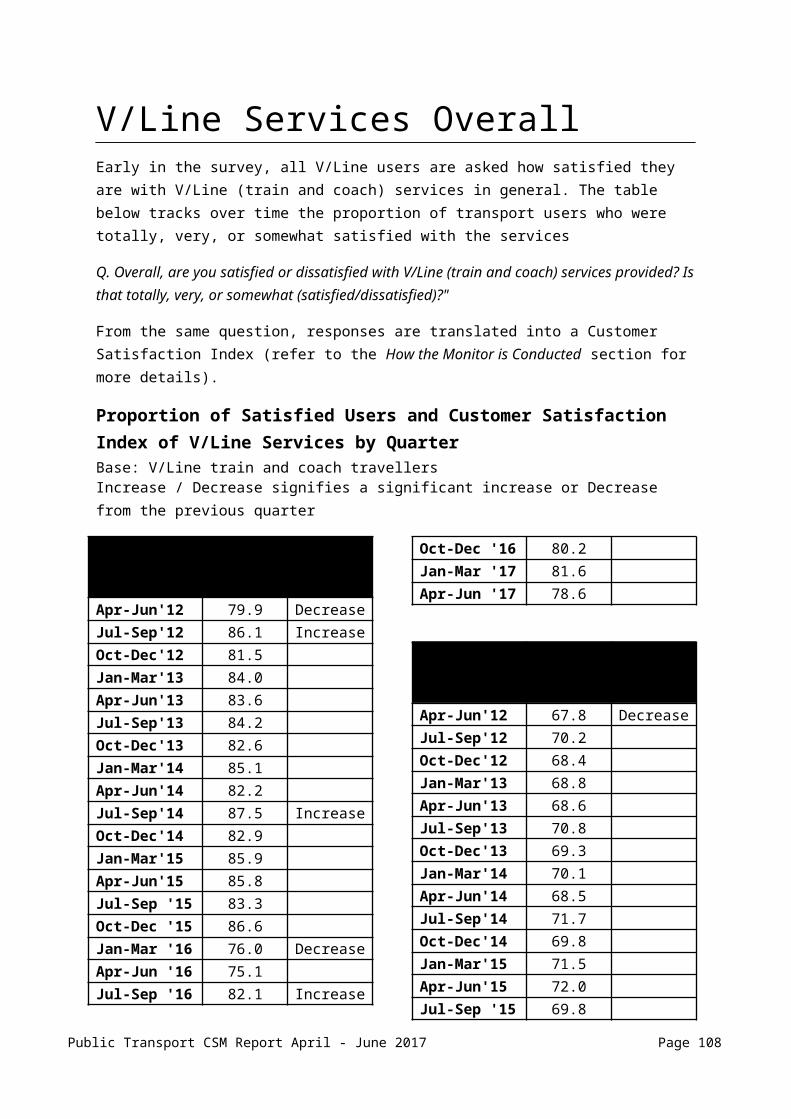
Tram ServicesNOTE: Increase / decrease signifies a significant increase or decrease from the previous financial year
Overall Satisfaction with Tram Services by Financial Year6-pt scale
Year 2012/13 2013/14 2014/15
2015/16 2016/17
Overall Tram Services 71.4 72.0 72.9 74.0 73.4Increase / decrease Increase Increase
Overall Satisfaction with Tram Services by Financial Year0-10 scale
Year 2012/13 2013/14 2014/15
2015/16 2016/17
Overall Tram Services 73.1 74.0 74.9 76.0 76.0Increase / decrease Increase Increase Increase
Overall Satisfaction with Information by Financial Year0-10 scale
Year 2012/13 2013/14 2014/15
2015/16 2016/17
Information 70.8 71.9 72.6 74.4 75.2Increase / decrease Increase Increase Increase
Overall Satisfaction with Tram Stops by Financial Year0-10 scale
Year 2012/13 2013/14 2014/15
2015/16 2016/17
Tram Stops 73.4 73.5 74.6 75.8 75.2Increase / decrease Increase Increase Increase
Overall Satisfaction with myki Ticketing by Financial Year0-10 scale
Year 2012/13 2013/14 2014/15
2015/16 2016/17
myki Ticketing 60.0 59.6 62.9 64.0 65.4Increase / decrease Decrease Increase Increase
Public Transport CSM Report April - June 2017 Page 108

Overall Satisfaction with Price of Tram Travel by Financial Year0-10 scale
Year 2012/13 2013/14
2014/15 2015/16
2015/16
Price 64.0 63.5 67.7 70.5 69.3Increase / decrease Increase Increase Decrease
Overall Satisfaction with Running of Services by Financial Year0-10 scale
Year 2012/13 2013/14 2014/15
2015/16 2016/17
Running of Services 73.3 73.8 74.4 75.5 75.5Increase / decrease Increase
Overall Satisfaction with Design, Space & Comfort by Financial Year0-10 scale
Year 2012/13 2013/14 2014/15
2015/16 2016/17
Design, Space & Comfort 68.8 69.2 70.3 71.2 70.7Increase / decrease Increase Increase
Overall Satisfaction with Tram Drivers by Financial Year0-10 scale
Year 2012/13 2013/14 2014/15 2015/16 2016/17
Tram Drivers 74.2 74.9 75.7 76.6 76.7Increase / decrease Increase Increase
Overall Satisfaction with Other Tram Staff by Financial Year0-10 scale
Year 2012/13 2013/14 2014/15 2015/16 2016/17
Other Tram Staff 79.2 79.1 81.2 80.2 81.8Increase / decrease Increase
Overall Satisfaction with Authorised Officers by Financial Year0-10 scale
Year 2012/13 2013/14 2014/15
2015/16 2016/17
Authorised Officers 68.5 69.5 69.8 70.4 70.2Increase / decrease
Public Transport CSM Report April - June 2017 Page 109

Overall Satisfaction with Personal Security by Financial Year0-10 scale
Year 2012/13
2013/14 2014/15 2015/16 2016/17
Personal Security 72.5 73.8 74.4 75.3 74.5Increase / decrease Increase Increase Decrease
Public Transport CSM Report April - June 2017 Page 110

Bus ServicesNOTE: Increase / decrease signifies a significant increase or decrease from the previous financial year
Overall Satisfaction with Bus Services by Financial Year6-pt scale
Year 2012/13 2013/14
2014/15 2015/16
2016/17
Overall Bus Services 70.9 71.1 71.2 72.2 70.3Increase / decrease Decrease
Overall Satisfaction with Bus Services by Financial Year0-10 scale
Year 2012/13 2013/14 2014/15
2015/16 2016/17
Overall Bus Services 75.5 76.2 76.1 76.7 76.3Increase / decrease
Overall Satisfaction with Information by Financial Year0-10 scale
Year 2012/13 2013/14 2014/15
2015/16 2016/17
Information 72.3 72.2 72.5 73.4 72.7Increase / decrease
Overall Satisfaction with Bus Stops by Financial Year0-10 scale
Year 2012/13 2013/14 2014/15
2015/16 2016/17
Bus Stops 73.1 74.1 74.7 74.8 74.3Increase / decrease
Overall Satisfaction with myki Ticketing by Financial Year0-10 scale
Year 2012/13 2013/14 2014/15
2015/16 2016/17
myki Ticketing 62.7 63.2 66.9 69.5 71.4Increase / decrease Decrease Increase Increase Increase
Public Transport CSM Report April - June 2017 Page 111

Overall Satisfaction with Price of Bus Travel by Financial Year0-10 scale
Year 2012/13 2013/14 2014/15 2015/16 2016/17
Price 68 67.9 69.9 73.4 72.7Increase / decrease Decrease Increase Increase
Overall Satisfaction with Running of Services by Financial Year0-10 scale
Year 2012/13 2013/14
2014/15 2015/16
2016/17
Running of Services 72.9 73.3 73.7 74.4 73.1Increase / decrease Decrease
Overall Satisfaction with Design, Space & Comfort by Financial Year0-10 scale
Year 2012/13 2013/14 2014/15
2015/16 2016/17
Design, Space & Comfort
77.9 77.8 77.8 77.8 77.5
Increase / decrease
Overall Satisfaction with Bus Drivers by Financial Year0-10 scale
Year 2012/13 2013/14 2014/15
2015/16 2016/17
Bus Drivers 79.9 79.8 80.3 80.5 81.1Increase / decrease
Overall Satisfaction with Authorised Officers by Financial Year0-10 scale
Year 2012/13 2013/14 2014/15
2015/16 2016/17
Authorised Officers 74.1 75.0 76.6 75.8 78.3Increase / decrease Decrease
Overall Satisfaction with Personal Security by Financial Year0-10 scale
Year 2012/13 2013/14 2014/15
2015/16 2016/17
Personal Security 77.3 77.9 77.7 78.1 77.7Increase / decrease
Public Transport CSM Report April - June 2017 Page 112

V/Line ServicesNOTE: Increase / decrease signifies a significant increase or decrease from the previous financial year
Overall Satisfaction with V/Line Services by Financial Year6-pt scale
Year 2012/13 2013/14 2014/15 2015/16 2016/17
Overall V/Line Services 69.0 69.7 71.2 67.5 67.1Increase / decrease Decrease Decrease
V/Line Train ServicesNOTE: Increase / decrease signifies a significant increase or decrease from the previous financial year
Overall Satisfaction with V/Line Train Services by Financial Year6-pt scale
Year 2012/13 2013/14
2014/15 2015/16 2016/17
Overall V/Line Train Services 69.8 70.4 71.9 68.2 68.1Increase / decrease Decrease
Overall Satisfaction with V/Line Train Services by Financial Year0-10 scale
Year 2012/13 2013/14 2014/15
2015/16 2016/17
Overall V/Line Train Services 75.8 76.1 76.3 75.9 75.5Increase / decrease
Overall Satisfaction with Information by Financial Year0-10 scale
Year 2012/13 2013/14 2014/15
2015/16 2016/17
Information 76.1 76.8 77.4 76.9 76.9Increase / decrease
Public Transport CSM Report April - June 2017 Page 113
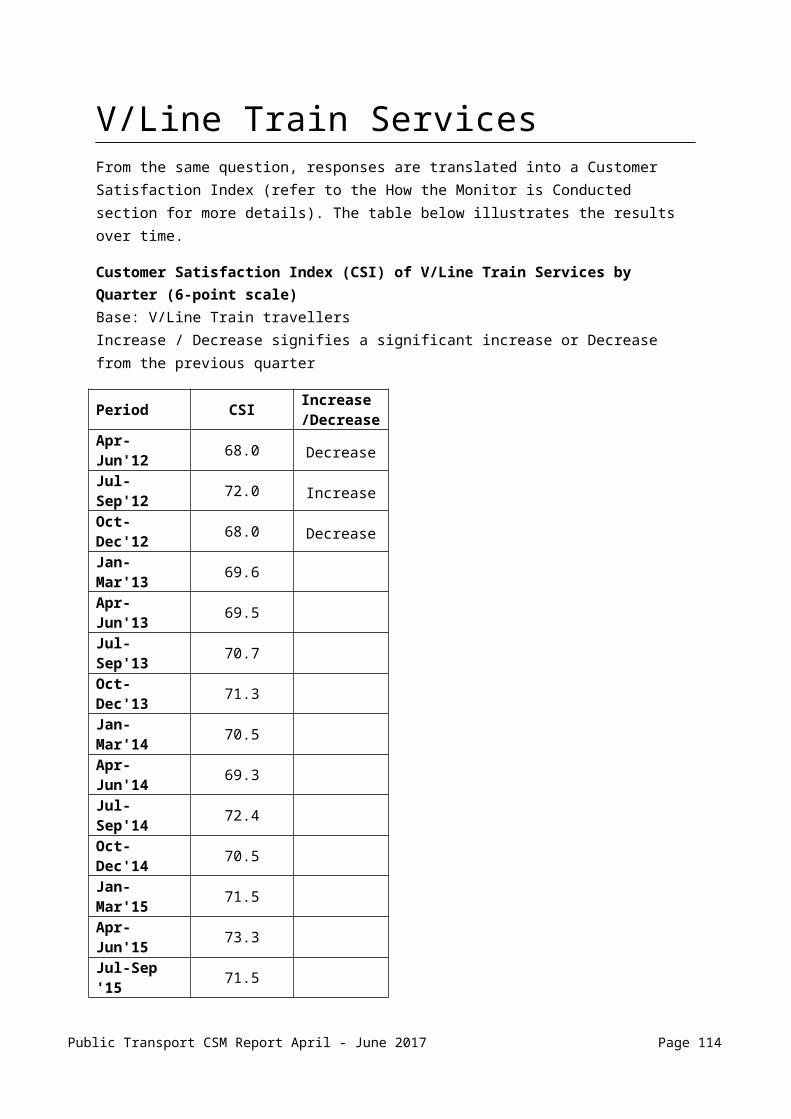
Overall Satisfaction with Paper Ticketing by Financial Year0-10 scale
Year 2012/13 2013/14 2014/15
2015/16 2016/17
Paper Ticketing 80.3 83.2 82.8 81.9 81.2Increase / decrease
Overall Satisfaction with myki Ticketing by Financial Year0-10 scale. New question introduced in July 2013
Year 2012/13 2013/14
2014/15 2015/16 2016/17
myki Ticketing Data not available 66.0 67.7 71.6 73.9
Increase / decrease Data not available Increase Increase
Overall Satisfaction with Price of V/Line Train Travel by Financial Year0-10 scale
Year 2012/13 2013/14 2014/15
2015/16 2016/17
Price 78.9 77.8 77.5 78.6 77.1Increase / decrease Decrease
Overall Satisfaction with Seat Reservation Service by Financial Year0-10 scale
Year 2012/13 2013/14 2014/15
2015/16 2016/17
Seat Reservation Service 85.1 82.0 83.8 85.3 83.8Increase / decrease Increase
Overall Satisfaction with V/Line Train Stations by Financial Year0-10 scale
Year 2012/13 2013/14 2014/15
2015/16 2016/17
V/Line Train Stations 76.6 76.5 76.5 77.5 76.7Increase / decrease
Overall Satisfaction with Running of Services by Financial Year0-10 scale
Public Transport CSM Report April - June 2017 Page 114

Year 2012/13 2013/14 2014/15
2015/16 2016/17
Running of Services 73.2 73.4 74.2 73.2 72.6Increase / decrease
Overall Satisfaction with Design & Comfort by Financial Year0-10 scale
Year 2012/13 2013/14 2014/15
2015/16 2016/17
Design & Comfort 75.2 75.7 75.7 75.4 74.8Increase / decrease
Overall Satisfaction with Refreshments by Financial Year0-10 scale
Year 2012/13 2013/14 2014/15
2015/16 2016/17
Refreshments 69.9 69.7 69.6 69.8 69.7Increase / decrease Increase
Overall Satisfaction with V/Line Train Station Staff by Financial Year0-10 scale
Year 2012/13 2013/14 2014/15
2015/16 2016/17
V/Line Train Station Staff 86.2 86.0 85.6 86.8 86.7Increase / decrease Increase
Overall Satisfaction with V/Line Train Conductors by Financial Year0-10 scale
Year 2012/13 2013/14 2014/15
2015/16 2016/17
V/Line Train Conductors 85.2 86.2 85.6 86.7 86.2Increase / decrease Increase
Overall Satisfaction with Personal Security by Financial Year0-10 scale
Year 2012/13 2013/14
2014/15 2015/16
2016/17
Personal Security 77.4 78.0 78.8 79.1 77.9Increase / decrease Decrease
Public Transport CSM Report April - June 2017 Page 115

V/Line Coach ServicesNOTE: Increase / decrease signifies a significant increase or decrease from the previous financial year
Overall Satisfaction with V/Line Coach Services by Financial Year6-pt scale
Year 2012/13 2013/14
2014/15 2015/16
2016/17
Overall V/Line Coach Services 74.7 74.5 77.0 77.2 72.7Increase / decrease Decrease
Overall Satisfaction with V/Line Coach Services by Financial Year0-10 scale
Year 2012/13 2013/14 2014/15
2015/16 2016/17
Overall V/Line Coach Services 82.2 82.1 83.0 82.3 81.5Increase / decrease
Overall Satisfaction with Information by Financial Year0-10 scale
Year 2012/13 2013/14 2014/15
2015/16 2016/17
Overall V/Line Coach Services 80.1 80.1 80.0 79.6 80.1Increase / decrease
Overall Satisfaction with Ticketing by Financial Year0-10 scale
Year 2012/13 2013/14 2014/15
2015/16 2016/17
Ticketing 77.7 79.2 79.1 78.5 78.8Increase / decrease
Overall Satisfaction with Price of V/Line Coach Travel by Financial Year0-10 scale
Year 2012/13 2013/14 2014/15
2015/16 2016/17
Price 82.1 82.5 84.5 83.1 84.6Increase / decrease Decrease
Public Transport CSM Report April - June 2017 Page 116
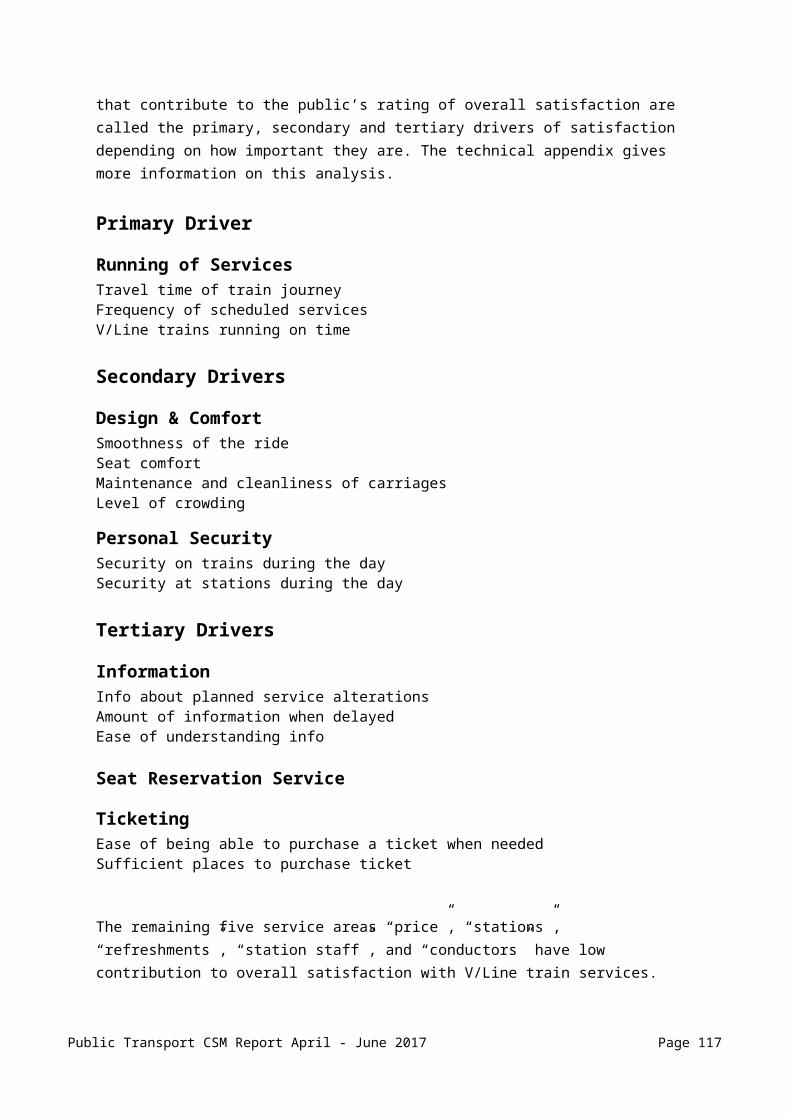
Overall Satisfaction with Seat Reservation Service by Financial Year0-10 scale
Year 2012/13 2013/14 2014/15
2015/16 2016/17
Seat Reservation Service 86.0 81.6 86.0 86.4 83.2Increase / decrease
Overall Satisfaction with V/Line Coach Stops by Financial Year0-10 scale
Year 2012/13 2013/14 2014/15
2015/16 2016/17
V/Line Coach Stops 75.3 78.3 78.6 75.9 77.1Increase / decrease
Overall Satisfaction with Running of Services by Financial Year0-10 scale
Year 2012/13 2013/14 2014/15
2015/16 2016/17
Running of Services 78.9 78.5 80.3 77.9 78.0Increase / decrease
Overall Satisfaction with Design & Comfort by Financial Year0-10 scale
Year 2012/13 2013/14 2014/15
2015/16 2016/17
Design & Comfort 81.5 81.1 82.1 81.6 80.5Increase / decrease
Overall Satisfaction with V/Line Coach Drivers by Financial Year0-10 scale
Year 2012/13 2013/14 2014/15
2015/16 2016/17
V/Line Coach Drivers 88.4 88.6 89.0 89.0 89.3Increase / decrease
Overall Satisfaction with Personal Security by Financial Year0-10 scale
Year 2012/13 2013/14 2014/15
2015/16 2016/17
Personal Security 84.5 84.3 84.4 84.9 83.3Increase / decrease
Public Transport CSM Report April - June 2017 Page 117

APPENDIX B
Detailed Methodology & Technical Notes
Public Transport CSM Report April - June 2017 Page 118

Background & Objectives
BackgroundIn the lead up to privatisation of Victoria’s public transport system, customer service benchmarks were obtained via a series of monthly surveys amongst train and tram users. The monitoring process commenced in July 1997 and has continued to provide customer service measures for the franchised public transport businesses. The survey was then extended to monitor V/Line train and coach services in May 1998, and Metropolitan bus services in October 1999.
Research ObjectivesThe broad aim of the research is to monitor customer satisfaction with a wide range of service delivery aspects of:
Metropolitan trains, trams, and buses; V/Line trains and coaches.
The specific research objectives are to:
1. Establish types of public transport users;2. Establish region(s) in which services are used;3. Determine satisfaction with specific aspects of services;4. Derive importance of specific aspects of service by mode;5. Measure perceptions of change in public transport services in the last 12 months;6. Gauge user intentions for future use and recommendations;7. Establish demographics of the sample.
Public Transport CSM Report April - June 2017 Page 119

Research MethodologyThe research methodology involves the following.
•The primary data collection methodology is telephone interviewing using Computer Assisted Telephone Interviewing (CATI).
•The research is split into two surveys with quarterly quotas set as follows:
Metropolitan Trains, Trams, and Buses
Quarterly QuotaRegular Train Users 425Occasional Train Users 425Regular Tram Users 425Occasional Tram Users 425Bus Users 425
V/Line Train and Coaches
Quarterly QuotaV/Line Users 425
These quotas were set at the commencement of the survey program. Based on a series of screening questions and the quotas, respondents are randomly selected to complete relevant sections of the survey. Due to this selection process, data collected cannot be used to determine usage patterns or changes in patterns in the population. No respondent answers questions relating to more than one mode.
Regular users are those who travel with a particular mode at least once a week whereas occasional users are those who travel at least once in six months (but less often than once a week).
The Metropolitan bus quota includes 69 bus users who reside in outer metropolitan areas / postcodes.
Approximately one-third of the quarterly quotas are completed every month.
Interviewing typically commences on the second Tuesday of every month and finishes ten days later. Interviewing times are between 4.30-8.30pm on weeknights and 10am-5pm on weekends.
All interviewers working on the study undergo a minimum one hour briefing about the survey and are monitored regularly during the fieldwork at a rate determined by the ISO-20252 standards, which is the standard required from members of the Association of Market and Social Research Society (AMSRS).
Public Transport CSM Report April - June 2017 Page 120

In February 2009, qualitative research involving multiple focus group discussions with public transport users was conducted to update and refine the questionnaires. Changes to the questionnaires were then implemented in April 2009. One of the major changes included replacing the 6-point satisfaction scale with the 0-to-10 scale.
The questionnaires are outlined on the following pages whereas the full questionnaires can be viewed in Appendix C. Interview lengths vary but the average is approximately 20 minutes.
Results are reported quarterly with separate reports provided for:
Metropolitan trains Metropolitan trams Metropolitan buses V/Line
Public Transport CSM Report April - June 2017 Page 121

Questionnaire – Metropolitan Trains, Trams and BusesThe Metropolitan Trains, Trams and Buses questionnaire is outlined below.
1. Introduction & Screener
2. Assign to the following modes based on travel behaviour:
o Train Users (425 Regular, 425 Occasional)o Trams Users (425 Regular, 425 Occasional)o Bus Users (425)
3. Satisfaction with Overall Metropolitan Services (6-point scale)
4. Mode Travel Behaviour
5. Overall Satisfaction with Mode Services (6-point scale)
6. Satisfaction with Mode Service Areas (0-10 scale)o Informationo Stations / Stopso myki Ticketingo Priceo Running of Serviceso Design, Space & Comforto Driverso Authorised Officerso Other Staff (Train & Tram only)o Personal Security
7. Overall Satisfaction with Mode Services (0-10 scale)
8. Likelihood to Recommend Mode Services to Others (0-10 scale)
9. Demographics and Closing
Public Transport CSM Report April - June 2017 Page 122

Questionnaire Flowchart – V/Line Trains and CoachesThe V/Line Trains and Coaches questionnaire is outlined below.
1. Introduction & Screener
2. Satisfaction with Overall V/Line Services (6-point scale)
3. General V/Line travel behaviour
4. Assign to either V/Line Trains or Coaches based on travel behaviour
5. Mode Travel Behaviour
6. Overall Satisfaction with Mode Services (6-point scale)
7. Satisfaction with Mode Service Areas (0-10 scale)o Informationo Paper Ticketing o myki Ticketing (Train only)o Priceo Seat Reservationo Stations / Stopso Running of Serviceso Design, Space & Comforto Refreshments (Train only)o Station Staff (Train only)o Conductors / Driverso Personal Security
8. Overall Satisfaction with Mode Services (0-10 scale)
9. Likelihood to Recommend Mode Services to Others (0-10 scale)
10. Demographics and Closing
Public Transport CSM Report April - June 2017 Page 123
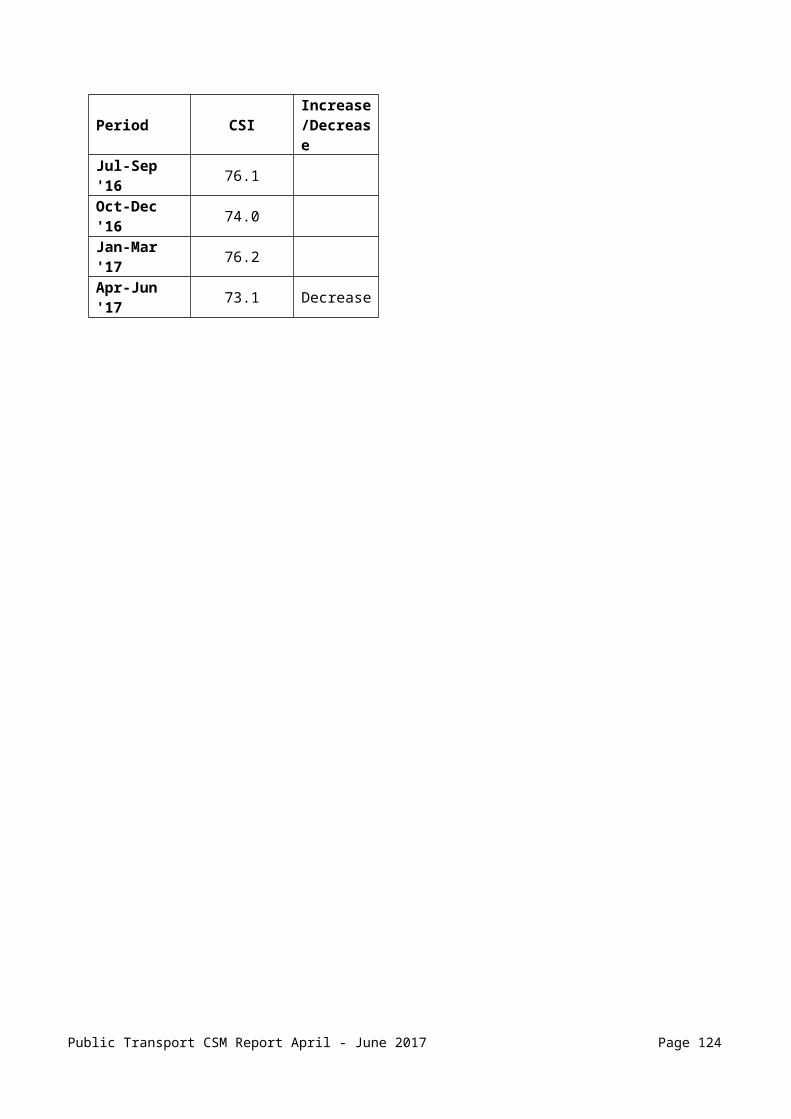
Technical NotesCalculation of Customer Satisfaction Index (CSI)Throughout this survey respondents are asked to indicate their satisfaction with particular aspects with a 0 to 10 scale (where 0 means “Extremely Dissatisfied” and 10 means “Extremely Satisfied”). In order to gain insight into the performance of these aspects, the scores are then multiplied by 10 to obtain a Customer Satisfaction Index (CSI) out of 100.
Some satisfaction questions still use a 6-point scale. For such questions, the (CSI) is calculated by transforming the scales into numbers as indicated below.
Totally satisfied = 100Very satisfied = 80Somewhat satisfied = 60Somewhat dissatisfied = 40Very dissatisfied = 20Totally dissatisfied = 0
Satisfied = 51 to 100Dissatisfied = 0 to 50
For example, if a person is ‘Totally Satisfied’ they receive a score of 100 and if a person is ‘Totally Dissatisfied’ they receive a score of 0. The CSI represents an average of these scores, taking into account all responses to the question, i.e. both satisfied and dissatisfied
Interpreting a Significant DifferenceA significance test shows how likely it is that any difference observed between two means (or proportions) reflects a real difference in the population and not just a chance difference in the sampling.
When a mean is said to be statistically significantly different at the 0.05 level of significance, it means there is only a 5% chance that the observed discrepancy is a spurious occurrence rather than a genuine difference. In other words, to say that a difference is statistically significant or statistically detectable is to say that the observed result cannot reasonably be attributed to random variation alone. Also, a difference has been established fairly conclusively but no judgement has been made as to the practical importance of the declared difference.
Maximum Error MarginThe precision of survey estimates correlates with the size of the survey sample. The larger the sample, the more precise survey estimates are. The maximum error margin of survey estimates (at 95% level of confidence) on various sample sizes is shown in the table below
n= 30 75 100 125 300 425 500 1350 1700 3400Maximum Error Margin
± 17.89%
± 11.32%
± 9.80%
± 8.77%
± 5.66%
± 4.75%
± 4.38%
± 2.67%
± 2.38%
± 1.68%
Public Transport CSM Report April - June 2017 Page 124

SamplingSurvey samples for the Metropolitan surveys are obtained by randomly selecting fixed line phone numbers within postcodes from the Melbourne/Metropolitan areas served by public transport. The sample for the buses survey also includes outer suburban areas that only have bus services.
Sample for the V/Line surveys are selected at random from households with a fixed line in postcodes that include, or are close to, V/Line train routes across the state.
No respondent is interviewed more than once in a six-month period.
Adhering to the set quotas, the number of interviews achieved in the past quarters is tabled below:
n= Apr-Jun15
Jul-Sep15
Oct-Dec15
Jan-Mar 16
Apr-Jun16
Jul-Sep16
Oct-Dec 16
Jan-Mar 17
Apr-Jun 17
Regular Train Users
425 425 425 425 425 425 425 425 425
Occasional Train Users
425 425 425 425 425 425 425 425 425
Regular Tram Users
425 425 425 425 425 425 425 425 425
Occasional Tram Users
425 425 425 425 425 425 425 425 425
Bus Users 425 425 425 425 425 425 425 425 425V/Line Train Users
364 353 354 350 337 351 362 355 360
V/Line Coach Users
61 72 71 75 88 74 63 70 65
The total number of competed interviews by financial year is tabled below:
n= 2012/13
2013/14 2014/15 2015/16 2016/17
Regular Train Users 1700 1700 1700 1700 1700Occasional Train Users
1700 1700 1700 1700 1700
Regular Tram Users 1700 1700 1700 1700 1700Occasional Tram Users
1700 1700 1700 1700 1700
Bus Users 1700 1700 1700 1700 1700V/Line Train Users 1425 1414 1435 1394 1428V/Line Coach Users 277 291 266 306 272
Public Transport CSM Report April - June 2017 Page 125

APPENDIX CSurvey Questionnaires
Public Transport CSM Report April - June 2017 Page 126
PUBLIC TRANSPORT VICTORIAMETROPOLITAN PUBLIC TRANSPORT CUSTOMER SATISFACTION MONITORQUESTIONNAIREAPRIL - JUNE 2017
INTRODUCTIONGood (...) my name is (...) from Wallis Market & Social Research, calling on behalf of Public Transport Victoria and the Public Transport Companies. They want to know how satisfied customers are with the specific aspects of services they offer to help them improve the services. We’d like to speak to a person over the age of 16 who normally resides in your household, and uses public transport. Would that be you?
IF NO: Is there anyone in the household aged 16 or over who uses public transport?
IF NECESSARY: The survey will take about fifteen minutes and your views will be used in the continuous improvement of public transport services. Your answers will be held in the strictest confidence.
IF QUERIED ABOUT PHONE NUMBER ADD: Your telephone number was chosen at random from numbers generated by samplepages.com.au so that we contact a broad spectrum of the Australian Public
MONITORING QUESTION
M1 This call will be recorded and may be monitored for quality control purposes. If you do not want this call to be monitored, please say so now.
DO NOT READ OUT
01 Monitoring allowed02 Monitoring NOT allowed
SCREENING
S1 Firstly, do you or does anyone else in your household work for Public Transport Victoria, the Department of Transport, V-Line or a private train, tram or bus company?
PROMPT IF NECESSARY
01 Yes CLOSE102 No
Public Transport CSM Report April - June 2017 Page 127

CLOSE 1: Thank you for your time today. Unfortunately family members of those who are affiliated with public transport companies are ineligible to take part in this survey.
S2 Do you travel on metropolitan trains, trams or buses at least a few days a year?
PROMPT IF NECESSARY
01 Yes02 No CLOSE2
CLOSE 2: Thank you for your time today. Unfortunately this survey is only for users of public transport.
S5 How often do you travel on metropolitan TRAINS in Melbourne?
PROMPT IF NECESSARY
01 6 or 7 days a week 02 5 days a week 03 3 or 4 days a week 04 1 or 2 days a week 05 Between 1 and 3 times per month06 Once every 2 to 3 months07 Once every 4 to 6 months08 Once a year 09 Less than once a year10 Never
S6 How often do you travel on TRAMS?
PROMPT IF NECESSARY
01 6 or 7 days a week 02 5 days a week 03 3 or 4 days a week 04 1 or 2 days a week 05 Between 1 and 3 times per month06 Once every 2 to 3 months07 Once every 4 to 6 months08 Once a year 09 Less than once a year10 Never
S7 How often do you travel on metropolitan BUSES? Please note this DOES NOT include train replacement bus services.
IF NECESSARY: Private bus companies in the metropolitan area or Met Buses, not chartered or school buses
PROMPT IF NECESSARY
01 6 or 7 days a week 02 5 days a week 03 3 or 4 days a week 04 1 or 2 days a week 05 Between 1 and 3 times per month06 Once every 2 to 3 months07 Once every 4 to 6 months
Public Transport CSM Report April - June 2017 Page 128
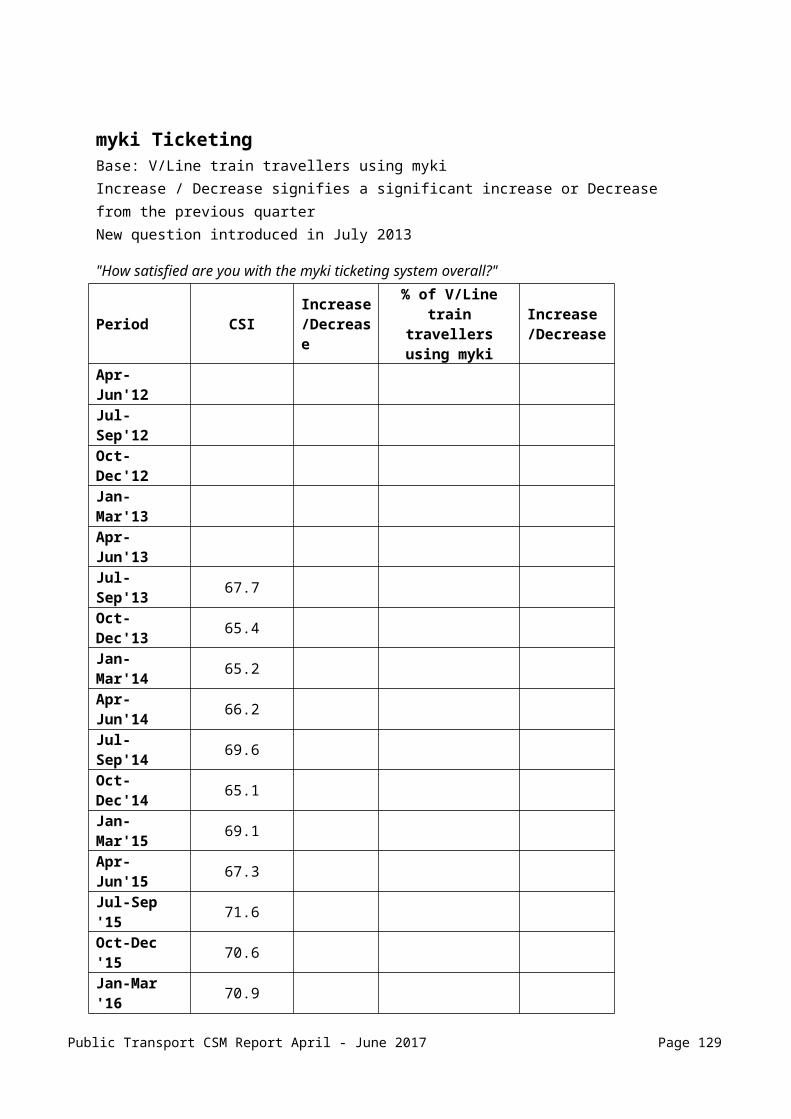
08 Once a year 09 Less than once a year10 Never
IF 2 OR 3 OF (S5, S6 AND S7) = 1-4, ASK S10, ELSE GO TO S8.
S10 Do you regularly undertake a journey that uses two or more of these types of transport as part of the same journey?
IF NECESSARY:For example, a bus then a train, or a train then a tram.
INTERVIEWER NOTE: regularly = once a week or more often
PROMPT IF NECESSARY
01 Yes02 No99 (DO NOT READ) Don’t know / Can’t say
S8 RECORD GENDER
01 Male02 Female
IF (S5=8-10) AND (S6=8-10) AND (S7=8-10), CLOSE3
CLOSE 3: Thank you for your time today. Unfortunately this survey is only for those who use a mode of public transport more often than once a year.
S9 Overall are you satisfied or dissatisfied with the metropolitan train, tram and bus services provided?
WAIT FOR RESPONSE: Is that totally, very or somewhat?
DO NOT READ OUT
01 Totally satisfied02 Very satisfied03 Somewhat satisfied04 Somewhat dissatisfied05 Very dissatisfied06 Totally dissatisfied99 (DO NOT READ) Don’t know
QUOTA SELECTION
RESPONDENT USES ONE MODE – CHECK QUOTA – GO TO RELEVANT SECTION
RESPONDENT USES TWO MODES – CHECK QUOTA IF BOTH UNFILLED – SELECT AT RANDOM – GO TO RELEVANT SECTIONRESPONDENT USES ALL THREE MODES – SELECT ONE AT RANDOM FROM UNFILLED QUOTAS IF RELEVANT QUOTAS ARE FULL, CLOSE4
Public Transport CSM Report April - June 2017 Page 129
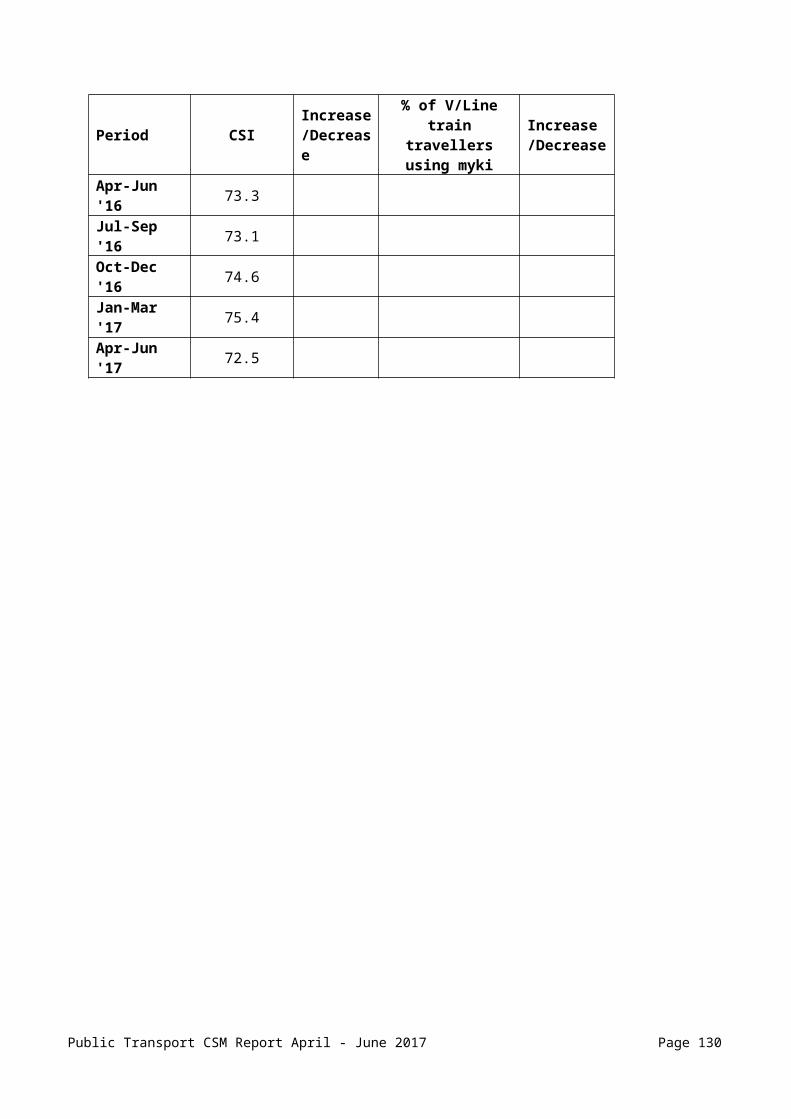
CLOSE 4: Thank you for your time today. Unfortunately we have interviewed enough users of public transport mode you use.
Public Transport CSM Report April - June 2017 Page 130

TRAINS SECTION
I am now going to ask you about your experiences as a TRAIN user in Melbourne over the past six months…
TR1a When travelling from home, at which station do you most frequently board the train?
MULTICODE01 Type in name of station (SPECIFY)99 (DO NOT READ) Don’t know
TR1b And for your most typical journey from home, at which station do you most often get off?
MULTICODE01 Type in name of station (SPECIFY)99 (DO NOT READ) Don’t know
TR2a What times of day do you generally travel by train?
INTERVIEWER NOTE: TIMES REFER TO JOURNEY START TIMES
PROMPT IF NECESSARY
MULTICODE01 Weekdays before 7am? (Weekdays 4:00 AM to 7:00 AM)02 Weekdays between 7 – 9.30am? (Weekday morning peaks)03 Weekdays between 9.30am – 4.30pm? (Morning and afternoon off-peaks)04 Weekdays between 4.30 – 7pm? (Weekday afternoon peaks)05 Weekdays between 7pm – 2am? (Weekday evenings) 06 Weekends during day time?07 Weekends during night time?08 (DO NOT READ) It varies99 (DO NOT READ) Can’t say
TR2b
IF CODE 1-7 AT TR2A And what other days and times do you travel by train?
IF CODE 8 OR 99 AT TR2A Have you ever travelled by train on…?
INTERVIEWER NOTE: TIMES REFER TO JOURNEY START TIMES
PROMPT IF NECESSARY
MULTICODE01 Weekdays before 7am? (Weekdays 4:00 AM to 7:00 AM)02 Weekdays between 7 – 9.30am? (Weekday morning peaks)03 Weekdays between 9.30am – 4.30pm? (Morning and afternoon off-peaks)04 Weekdays between 4.30 – 7pm? (Weekday afternoon peaks)05 Weekdays between 7pm – 2am? (Weekday evenings) 06 Weekends during day time?07 Weekends during night time?08 (DO NOT READ) It varies97 None – no other times
Public Transport CSM Report April - June 2017 Page 131
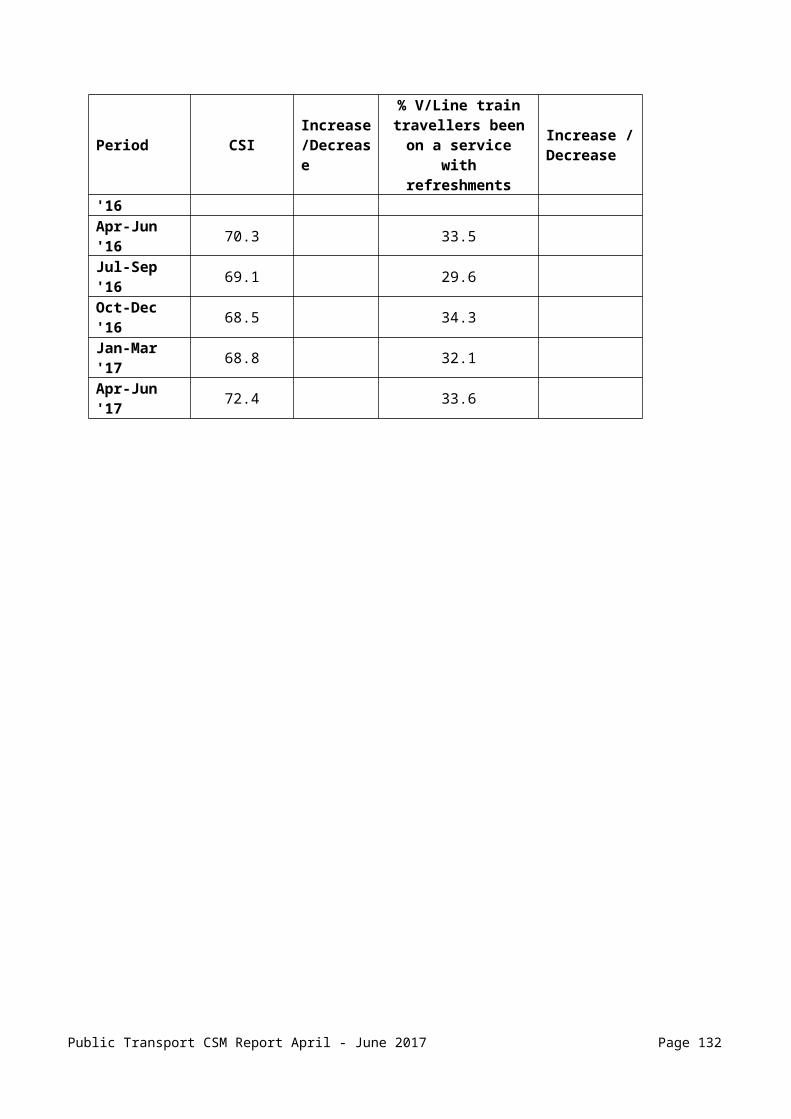
99 (DO NOT READ) Can’t say
TR3 How do you usually get to the train station to begin your journey?
DO NOT READ OUT
MULTICODE01 Walk02 Drive car and park03 Get a lift with someone else04 Cycle05 Bus06 Tram07 Taxi08 V/ Line train or coach95 Other (SPECIFY)97 It varies – no usual method
IF TR2A OR TR2B=07 ASK TR2BI, ELSE GO TO TR3TR2Bi Have you caught a ‘Night Network’ train service since they began on the first of
January?
INTERVIEWER NOTE: Night Network services are the late night weekend services running roughly between midnight and 5am on Friday and Saturday nights (or technically Saturday and Sunday mornings).
PROMPT IF NECESSARY
01 Yes02 No
TR4 Have you caught a metropolitan train to or from a special event, such as concert, festival or sporting event in the past six months?
PROMPT IF NECESSARY
01 Yes02 No99 (DO NOT READ) Don’t know
TR0 Overall are you satisfied or dissatisfied with the TRAIN SERVICE on your line?
WAIT FOR RESPONSE: Is that totally, very or somewhat?
DO NOT READ OUT
01 Totally satisfied02 Very satisfied03 Somewhat satisfied04 Somewhat dissatisfied05 Very dissatisfied06 Totally dissatisfied99 (DO NOT READ) Don’t know
TR5a In the past six months, have you significantly increased or decreased your use of metropolitan trains?
Public Transport CSM Report April - June 2017 Page 132

PROMPT IF NECESSARY
01 Significantly increased 02 Significantly decreased03 Stayed about the same04 Only started to use trains in last 6 months99 (DO NOT READ) Don’t know / Hard to say
TR5b In the next six months, would you expect your use of metropolitan trains to…?
READ OUT
01 Significantly increase 02 Significantly decrease03 Stay about the same99 (DO NOT READ) Don’t know / Hard to say
SATISFACTION QUESTIONS
Information
TR6a Where do you USUALLY access train timetables or other information to plan journeys?
PROMPT: Anywhere else?
DO NOT READ OUT
MULTICODE01 At train stations02 Printed booklets from stations03 PTV Call Centre (PT info line)04 Internet (computer) - PTV website05 Internet (computer) - Metrotrains website06 SMS updates07 Smartphone application - PTV08 Smartphone application - third party09 Smartphone application - web browser95 Other (SPECIFY)97 Don't use timetables99 (DO NOT READ) Don’t know
TR7 Now I am going to ask you to rate various aspects of train service using a 0 to 10 scale. 0 means Extremely Dissatisfied and 10 means Extremely Satisfied. If a question is not relevant to you, please say so.
Firstly, I would like you to rate your level of satisfaction with aspects of the INFORMATION provided about train services. Using the 0 to 10 scale, how satisfied are you with:
PROMPT IF NECESSARY
ROTATE GROUPSa The availability of up-to-date printed timetable information at train stations?b The information provided on electronic displays at train stations about arrival times?
c The number of announcements on trains?
Public Transport CSM Report April - June 2017 Page 133

d The clarity of announcements on trains? e The number of automated announcements on stations?
fThe amount of information provided when trains are cancelled or delayed?g The availability of information provided when there is a planned alteration to train
services, such as for track works?
h [IF TR6a = 3] The quality of information from the PTV call centre? i [IF TR6a = 4] The quality of information from the PTV website? j [IF TR6a = 5] The quality of information from the Metrotrains website?j [IF TR6a = 7] The quality of information from the PTV App?k [IF TR6a = 6] The SMS update service?
z So, thinking of all these aspects, how satisfied are you with the INFORMATION provided about train services overall?
Train Stations
TR8 Now, I would like you to rate your level of satisfaction with aspects of the TRAIN STATIONS you have used in the past six months. On the 0 to 10 scale, how satisfied are you with…
PROMPT IF NECESSARYROTATE GROUPSa The level of lighting provided?
b The range of facilities provided at trains stations?c The maintenance of facilities provided, such as shelter and seating?d The general cleanliness and amount of litter at train stations? e The level of graffiti at train stations?
f The amount of car parking provided?g [IF TR3= 4] The bicycle storage facilities? h [IF TR3 = 5] The bus interchange facilities?
iThe level of crowding (at stations) at the times you travel?
z So, thinking of all these aspects, how satisfied are you with the TRAIN STATIONS overall?
TicketingNow, I would like you to ask you about the TICKETING on train services in Melbourne.
TR9a When you last travelled, was it on a full fare or a concession fare?
PROMPT IF NECESSARY
01 Full fare 02 Concession fare 03 (DO NOT READ) Free pass 99 (DO NOT READ) Don’t know
IF TR9A= 3 GO TO TR12
[MYKI USERS - ALL]
Public Transport CSM Report April - June 2017 Page 134
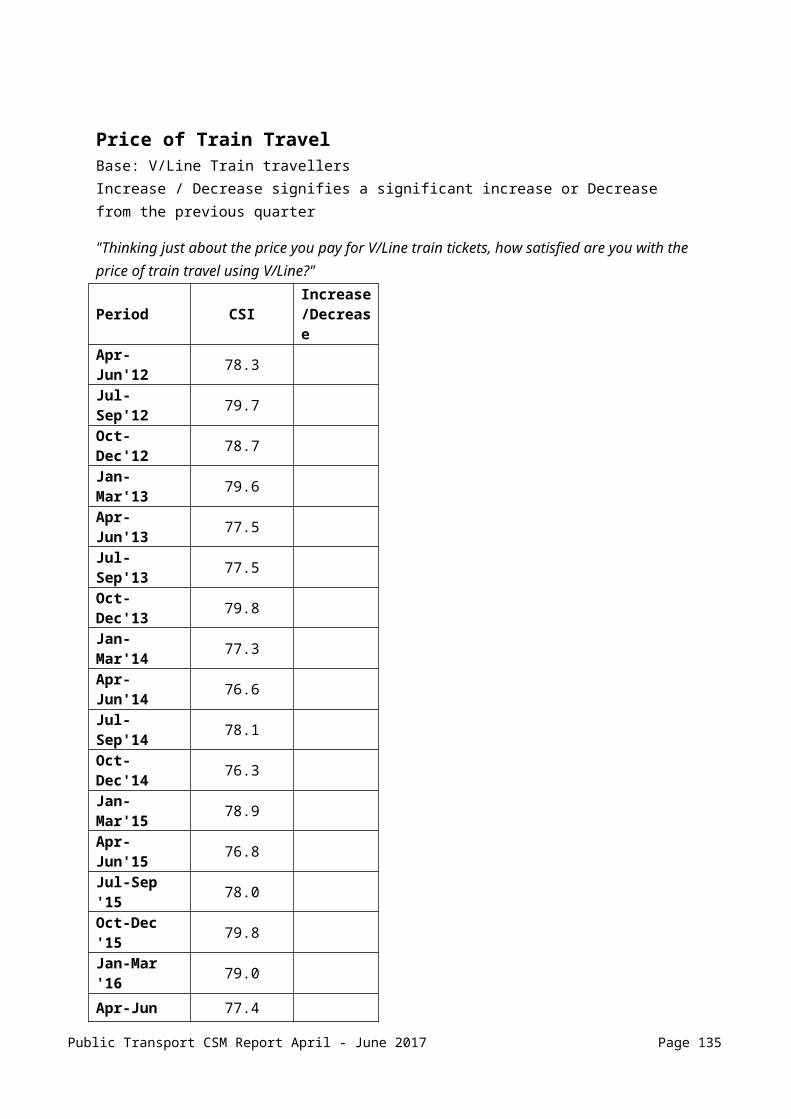
TR25a Thinking about the myki smartcard you are currently using, where do you normally top-up your myki?
DO NOT READ OUT
MULTICODE01 Train station - ticket office02 Train station - myki vending machine03 On the internet / PTV website (ptv.vic.gov.au)04 Newsagent05 Auto top-up / direct debit06 7-Eleven 07 On board bus08 Tram stop - myki vending machine09 PTV Call Centre (1800 800 007)10 Chemist / pharmacy11 Milk bar12 PTV Hub (at Southern Cross Station)13 PTV Hub (at 750 Collins St Docklands)14 On board tram15 Bus stop / interchange - myki vending machine16 V/Line station17 On board V/Line trains / coaches18 V/Line ticket agent19 Commuter Club (annual pass) / top-up through work / salary package scheme95 Other (SPECIFY)99 Don't know
TR25b Are you using myki money or myki pass for your public transport travel?
INTERVIEWER NOTE: If respondent asks for clarification please provide the following explanation and code accordingly: myki money is a ‘pay as you go’ system. You load a credit on to the card and use that progressively whenever you travel. myki pass is for a continuous block of travel days e.g. one week, month or year for regular travellers.
PROMPT IF NECESSARY
01 Myki money02 Myki pass03 Both99 (DO NOT READ) Don’t know
TR25c Have you registered your myki card which links your name and address to your individual card?
IF YES, ASK: Where did you register your myki card?
PROMPT IF NECESSARY
01 Yes – on the internet / PTV website (ptv.vic.gov.au)02 Yes – PTV Call Centre (1800 800 007)03 Yes – mailed a myki Registration Form04 Yes – registered at metropolitan retail outlets (e.g. Southern Cross PTV Hub / 7-
Eleven)05 Yes – pre-registered myki card sent to pensioners06 Yes – pre registered through Commuter Club / work / salary package scheme07 No GO TO PRE TR25E
Public Transport CSM Report April - June 2017 Page 135

99 (DO NOT READ) Don’t know GO TO PRE TR25E
TR25d Have you ever accessed your myki transaction records or travel details?
IF YES, ASK: where did you access them?
PROMPT IF NECESSARY
MULTICODE01 Yes – on the internet / PTV website (ptv.vic.gov.au)02 Yes – myki vending machine03 Yes – myki check machine (small blue-coloured device)04 No99 (DO NOT READ) Don’t know
PRE TR25E IF TR25A=3 OR CODE 1 AT TR25C / TR25D, AUTOCODE TR25E WITH CODE 1 THEN GO TO TR26. ELSE, CONTINUE
TR25e Have you ever used the PTV website (ptv.vic.gov.au)?
PROMPT IF NECESSARY
01 Yes 02 No99 (DO NOT READ) Don’t know
TR26 Now, I would like you to ask about your satisfaction with the myki ticketing system. On the 0 to 10 scale, how satisfied are you with...
PROMPT IF NECESSARYROTATE GROUPSa The amount of ticketing information provided at stations about myki?b The ease of understanding the myki ticketing system?
c The ease of being able to top-up your myki when you need to?d There being sufficient places where you can top-up your myki?
e The accuracy of the fares that myki automatically calculates based on your travel?f[IF TR25D = 1, 2, OR 3] The accuracy of your transaction records or travel details?
g The ease of touching on and touching off using myki?
z So, thinking of all these aspects, how satisfied are you with the myki TICKETING system overall?
Price
TR12 Now, thinking about the services you receive, how satisfied are you with the PRICE of train travel in metropolitan Melbourne?
Public Transport CSM Report April - June 2017 Page 136

How services are run
TR13 _____Now, I would like you to rate your level of satisfaction with the OPERATIONAL running of the train services that you have experienced in the past six months provided on your line. Using the 0 to 10 scale, how satisfied are you with:
INTERVIEWER NOTE:
Peak times are considered to be 7am to 9:30am and 4:30pm to 7pm on weekdays]
Off peak times are considered to be during the week before 7am, 9:30am to 4:30pm and after 7pm – and all times on weekends and public holidays]
PROMPT IF NECESSARYROTATE GROUPSa [IF TR2a OR TR2b1 OR TR2b2= 2 OR 4] The frequency of scheduled weekday peak
services? b [IF TR2a OR TR2b1 OR TR2b2 = 1, 3 OR 5] The frequency of scheduled weekday
off-peak services? c [IF TR2a OR TR2b1 OR TR2b2= 6 OR 7] The frequency of scheduled weekend
services? d [IF TR4 = 1] The frequency of train services to and from special events?
e That you are generally able to get on your first train that arrives?
fThe trains running on time?
g The time your train journeys generally take once you are on? h The number of trains that are cancelled?
z So, thinking of the operational performance of train services in terms of frequency, on-time performance and time taken to travel, how satisfied are you with HOW TRAIN SERVICES ARE RUN overall?
Experience of travelling on trains
TR14 Now, I would like you to rate your level of satisfaction with your experience when on board trains, including train design, in the past six months. On the 0 to 10 scale, how satisfied are you with…
PROMPT IF NECESSARYROTATE GROUPSa The level of crowding on the train at the times you need to travel? b The amount of space allocated for standing in trains?c The train design allowing you to move around the train once you are on?
d There being enough accessible grab handles and poles for you to hang on to?
e The comfort of the seats?
f The level of graffiti in trains?g The general cleanliness and amount of litter in trains?
h The level of damage to seats, fittings and windows (including scratching)? i That it is easy for you to get off trains?
j The temperature in the carriages in summer?k The temperature in the carriages in winter?
Public Transport CSM Report April - June 2017 Page 137
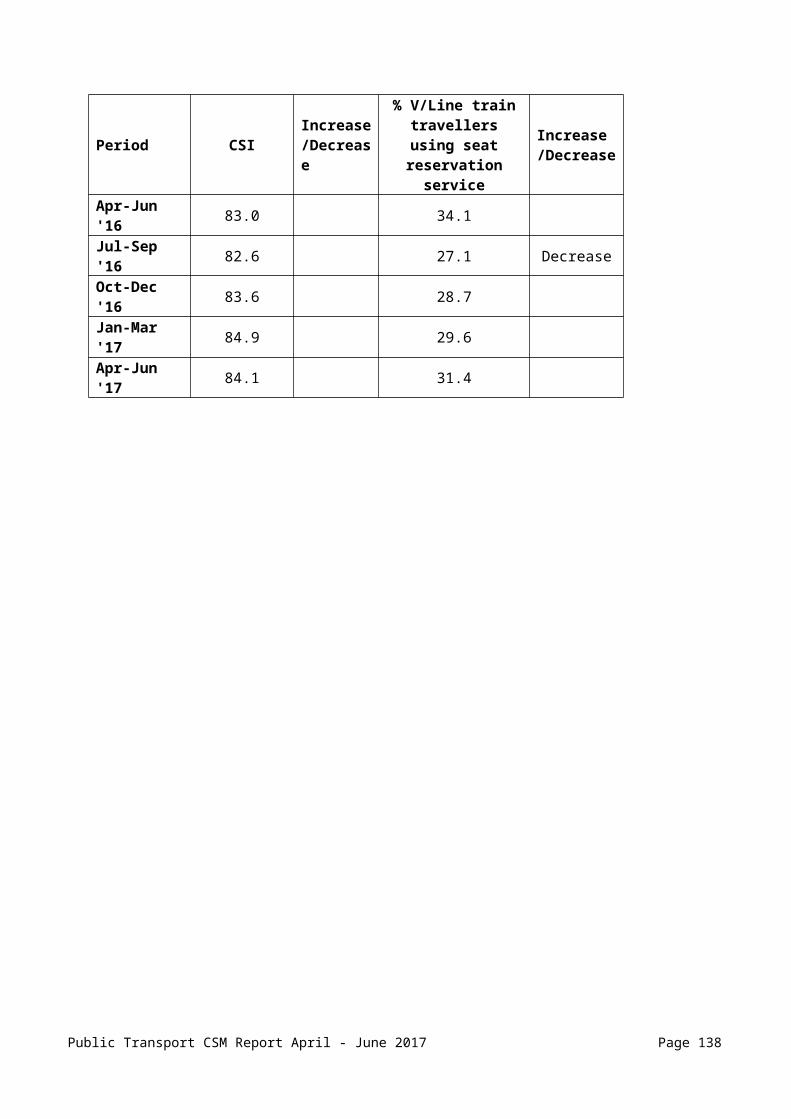
z So, thinking of all these aspects, how satisfied are you with the design, space and comfort of Melbourne’s trains overall?
Train Staff
TR15 Now, I would like you to rate your level of satisfaction with the train STAFF you may have interacted with in the past six months. First of all train drivers, using the same 0 to 10 scale again how satisfied are you with…
PROMPT IF NECESSARYROTATEa With the safe and smooth driving of trains?b That drivers provide you with useful information if a train breaks down or is delayed?z So, how satisfied are you with metropolitan train drivers overall?
TR16 Have you been on a train where Authorised Officers have been checking passenger tickets in the last six months?
INTERVIEWER NOTE: Authorised Officers are employed by public transport operators to check tickets, improve customer safety, provide customer information and assist during special events.
PROMPT IF NECESSARY
01 Yes02 No GO TO TR1999 (DO NOT READ) Don’t know GO TO TR19
TR17 I’d like you to rate your level of satisfaction with the Train Authorised Officers you have seen in the past six months. On the 0 to 10 scale, how satisfied are you that…
PROMPT IF NECESSARYROTATEa Authorised officers are courteous and helpful?b Authorised officers undertake their job in an appropriate manner?
z And how satisfied are you with AUTHORISED OFFICERS overall?
ASK ALL TRAIN QUOTATR19 Now, I would like to ask you about any other train staff you have had contact with in
the past six months. On the 0 to 10 scale, how satisfied are you with OTHER TRAIN STAFF overall?
Public Transport CSM Report April - June 2017 Page 138

Personal Security
TR20 Now, I’d like you to rate your level of satisfaction with your feelings of PERSONAL SECURITY when you travel by train.
On the 0 to 10 scale, how satisfied are you with…
PROMPT IF NECESSARY
ROTATEa Your feelings of personal security when travelling on trains during the day? b Your feelings of personal security when travelling on trains after dark? c Your feelings of personal security at train stations during the day?d Your feelings of personal security at train stations after dark?e Your feelings of personal security at train station car parks during the day?fYour feelings of personal security at train station car parks after dark?
g The presence and visibility of security cameras on trains and train stations?h The presence and visibility of train staff other than the train driver on trains?i The ability to call for assistance when needed?
z So, thinking of all these aspects, how satisfied are you with your feelings of PERSONAL SECURITY overall?
Overall
TR21 Using the same scale again, and taking into consideration all the aspects of the service we have discussed, and any others of importance to you, how satisfied are you with Melbourne’s metropolitan TRAIN SERVICES OVERALL in the past six months?
IF TR2BI=01 CONTINUE, ELSE GO TO TR22TR21a Thinking just about your experience with ‘Night Network’, how satisfied are you with
‘Night Network’ overall?
TR22 I’d like you to think about any changes that may have occurred in the last 12 months with Melbourne’s TRAIN service. Would you say that the TRAIN service is now…?
READ OUT
01 Much better (than 12 months ago)02 A little better (than 12 months ago) 03 The same04 A little worse (than 12 months ago)05 Much worse (than 12 months ago)06 (DO NOT READ) Did not use it 12 months ago99 (DO NOT READ) Don’t know
IF CODE 1 OR 5 AT TR22, ASK
TR22XWhy do you say that?
PROBE FULLY/RECORD VERBATIM
Public Transport CSM Report April - June 2017 Page 139

ASK ALLTR23 In the past six months, have you seriously considered reducing your use of trains in
favour of other means of transport?
PROMPT IF NECESSARY
01 Yes02 No99 (DO NOT READ) Don’t know
TR24 On a scale of 0 to 10, where 0 is no likelihood and 10 is extremely likely, how likely would you be to recommend Melbourne’s train services to someone else?
GO TO DEMOGRAPHICS SECTION
Public Transport CSM Report April - June 2017 Page 140
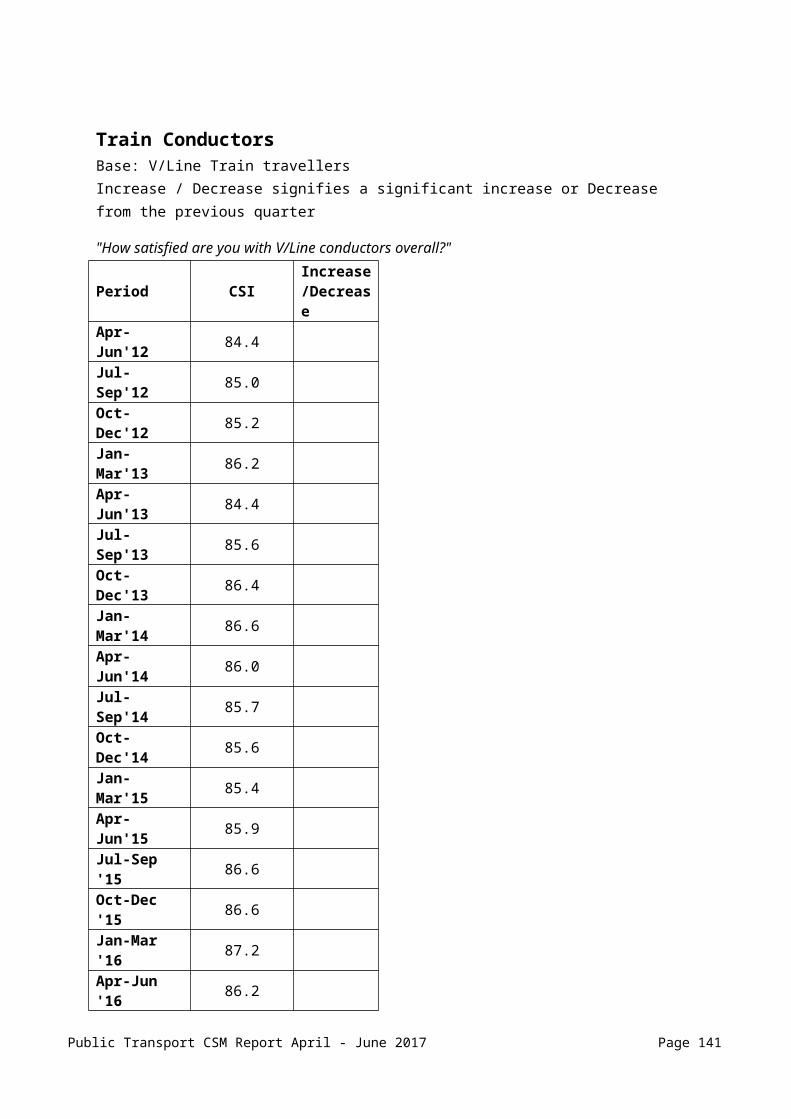
TRAMS SECTION
I am now going to ask you about your experiences as a TRAM user in Melbourne over the past six months…
TM1a Which tram route have you caught most often in the past six months?
PROMPT FOR ROUTE NUMBER
MULTICODE
114 CBD/City Trams (streets e.g. Bourke, Collins, Elizabeth, Flinders, Latrobe, Spencer, Spring, Swanston, William)
115 St Kilda Road (any route)119 Trams to Melbourne University along Swanston St (no route given)001 (No.1) East Coburg – South Melbourne Beach003 (No. 3/3a) Melbourne University - East Malvern005 (No. 5) Melbourne University – Malvern006 (No. 6) Melbourne University - Glen Iris008 (No. 8) Moreland - Toorak011 (No. 11) Docklands - West Preston012 (No. 12) St Kilda – Victoria Gardens016 (No. 16) Melbourne University - Kew via St Kilda Beach019 (No. 19) North Coburg - City Elizabeth St030 (No. 30) St Vincent’s Plaza - Etihad Stadium Docklands035 (No. 35) City Circle048 (No. 48) North Balwyn - Victoria Harbour Docklands055 (No. 55) West Coburg - Domain Interchange057 (No. 57) West Maribyrnong - City Elizabeth St059 (No. 59) Airport West - City Elizabeth St064 (No. 64) Melbourne University - East Brighton067 (No. 67) Melbourne University - Carnegie070 (No. 70) Waterfront City Docklands - Wattle Park072 (No. 72) Melbourne University - Camberwell075 (No. 75) Central Pier Docklands - Vermont South078 (No. 78/79) North Richmond - Prahran082 (No. 82) Moonee Ponds - Footscray086 (No. 86) Bundoora RMIT - Waterfront City Docklands096 (No. 96) East Brunswick - St Kilda Beach109 (No. 109) Box Hill - Port Melbourne995 Other999 Don’t know
Public Transport CSM Report April - June 2017 Page 141

IF CODE 114 IN TM1A ASK TM1C, ELSE GO TO TM2A
TM1c What streets in the city have you particularly travelled by tram in last six months?
READ OUT
01 Bourke Street02 Collins Street03 Elizabeth Street04 Flinders Street05 La Trobe Street06 Spencer Street07 Spring Street08 Swanston Street09 William Street95 Other (SPECIFY)99 (DO NOT READ) Don’t know / not sure
TM2a What times of day do you generally travel by tram?
INTERVIEWER NOTE: TIMES REFER TO JOURNEY START TIMES
READ OUT
MULTICODE01 Weekdays before 7am? (Weekdays 4:00 AM to 7:00 AM)02 Weekdays between 7 – 9.30am? (Weekday morning peaks)03 Weekdays between 9.30am – 4.30pm? (Morning and afternoon off-peaks)04 Weekdays between 4.30 – 7pm? (Weekday afternoon peaks)05 Weekdays between 7pm – 2am? (Weekday evenings) 06 Weekends during day time?07 Weekends during night time?08 (DO NOT READ) It varies99 (DO NOT READ) Can’t say
TM2b1
IF CODE 1-7 AT TM2A And what other days and times do you travel by tram?
IF CODE 8 OR 99 AT TM2A Have you ever travelled by tram on…?
INTERVIEWER NOTE: TIMES REFER TO JOURNEY START TIMES
PROMPT IF NECESSARY
MULTICODE01 Weekdays before 7am? (Weekdays 4:00 AM to 7:00 AM)02 Weekdays between 7 – 9.30am? (Weekday morning peaks)03 Weekdays between 9.30am – 4.30pm? (Morning and afternoon off-peaks)04 Weekdays between 4.30 – 7pm? (Weekday afternoon peaks)05 Weekdays between 7pm – 2am? (Weekday evenings) 06 Weekends during day time?07 Weekends during night time?08 (DO NOT READ) It varies97 None – no other times99 (DO NOT READ) Can’t say
Public Transport CSM Report April - June 2017 Page 142

IF TM2A OR TM2B=07 ASK TM2BI, ELSE GO TO TM3TM2Bi Have you caught a ‘Night Network’ tram service since they began on the first of
January?
INTERVIEWER NOTE: Night Network services are the late night weekend services running roughly between midnight and 5am on Friday and Saturday nights (or technically Saturday and Sunday mornings).
PROMPT IF NECESSARY
01 Yes02 No
TM3 How do you usually get to the tram stop to begin your journey?
DO NOT READ OUT
01 Walk02 Drive car and park03 Get a lift with someone else04 Cycle05 Bus06 Train07 Taxi08 V/Line train or coach95 Other97 It varies – no usual method99 Can’t say
TM4 Have you caught a tram to or from a special event, such as concert, festival or sporting event in the past six months?
PROMPT IF NECESSARY
01 Yes02 No99 (DO NOT READ) Don’t know
TM0 Overall are you satisfied or dissatisfied with the SERVICE on your tram route?
WAIT FOR RESPONSE: Is that totally, very or somewhat?
DO NOT READ OUT
01 Totally satisfied02 Very satisfied03 Somewhat satisfied04 Somewhat dissatisfied05 Very dissatisfied06 Totally dissatisfied99 (DO NOT READ) Don’t know
TM5a In the past six months, have you significantly increased or decreased your use of metropolitan trams?
PROMPT IF NECESSARY
01 Significantly increased 02 Significantly decreased03 Stayed about the same
Public Transport CSM Report April - June 2017 Page 143

04 Only started to use trams in last 6 months99 (DO NOT READ) Don’t know / Can’t say
TM5b In the next six months, would you expect your use of metropolitan trams to…?
READ OUT
01 Significantly increase 02 Significantly decrease03 Stay about the same99 (DO NOT READ) Don’t know / Hard to say
SATISFACTION QUESTIONS
Information
TM6a Where do you usually access tram timetables or other information to plan tram journeys?PROMPT: Anywhere else?
DO NOT READ OUT
MULTICODE01 At tram stops (printed timetables)02 At tram stops (electronic screens)03 On trams (printed booklets)04 PTV Call Centre (PT info line)05 Internet (computer) - Yarra Trams website06 Internet (computer) – PTV website07 TramTRACKER - by iPhone / iPad ‘app’08 TramTRACKER - by android smartphone/tablet ‘app’09 TramTRACKER - by web browser (computer, smartphone, tablet)10 TramTRACKER - other (e.g. SMS, phone call)11 PTV smartphone/tablet ‘app’12 Third party smartphone/tablet ‘app’95 Other (SPECIFY)97 Don't use timetables99 (DO NOT READ) Don't know
IF TM6A NOT CODED 7-10TM6b Are you aware of the tramTRACKER information service?
INTERVIEWER NOTE: if necessary, explain that tramTRACKER provides real time tram arrival information via smart phone apps, internet, SMS or phone
PROMPT IF NECESSARY
01 Yes02 No GO TO TM799 (DO NOT READ) Don't know / Can't Say GO TO TM7
IF TM6B=01TM6c Have you ever used the tramTRACKER service?
Public Transport CSM Report April - June 2017 Page 144
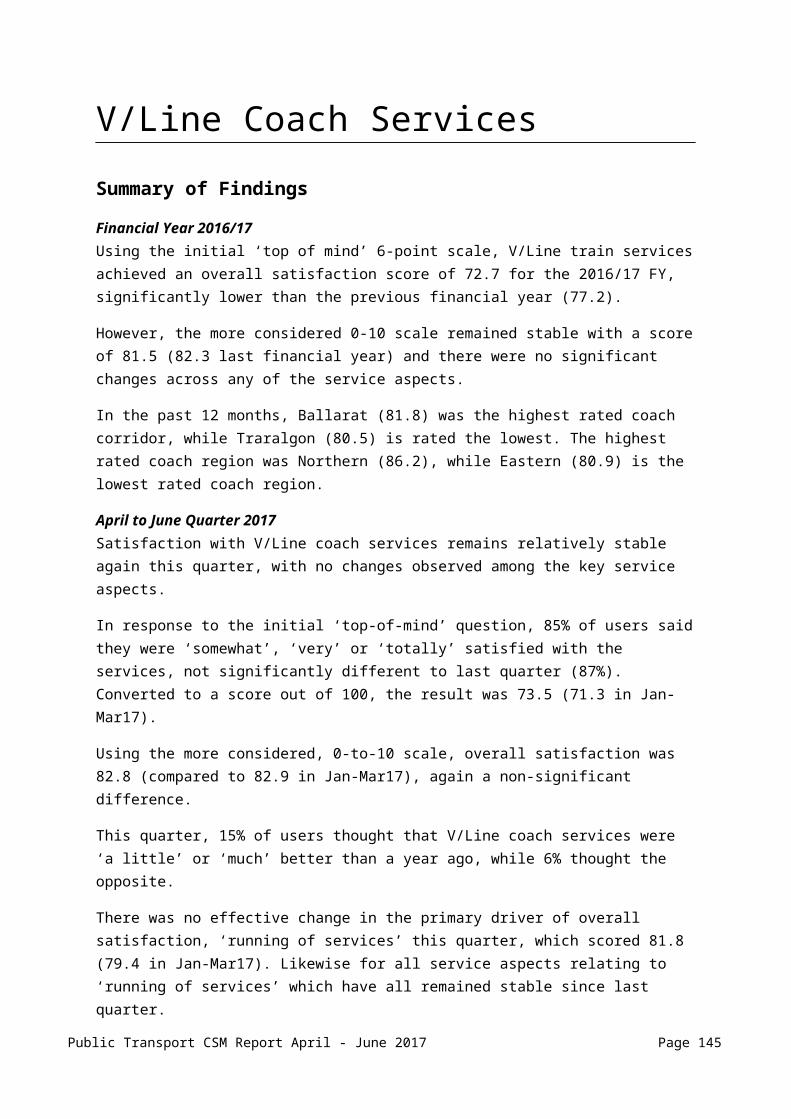
PROMPT IF NECESSARY
MULTICODE01 Yes – by iPhone / iPad ‘app’ 02 Yes- by android smartphone/tablet ‘app’03 Yes – by web browser (e.g. computer, smartphone, tablet) 04 Yes - by other (e.g. SMS, telephone call) 05 No 99 (DO NOT READ) Don't know / Can't Say
TM7 Now I am going to ask you to rate various aspects of tram service using a 0 to 10 scale. 0 means Extremely Dissatisfied and 10 means Extremely Satisfied. If a question is not relevant to you, please say so.
Firstly, I would like you to rate your level of satisfaction with aspects of the INFORMATION provided about tram services. Using the 0 to 10 scale, how satisfied are you with:
PROMPT IF NECESSARY
ROTATE GROUPSa The availability of up-to-date printed timetable information at tram stops?b The ease of reading and understanding printed timetables at tram stops?c The information provided on the electronic displays at some tram stops about tram
arrival times?
d The accuracy of the information provided on the electronic displays?
e The clarity of announcements on trams? f The number of announcements on trams?g That there is sufficient announcement or signage to inform you that you have arrived
at your tram stop?
h The availability of information provided when there is a planned disruption to tram services, (such as tram works or a major event)?
I The availability of information provided when there is an unplanned disruption to tram services, (such as a car accident or tram breakdown)?
j [IF TM6A = 7-10 OR TM6C = 1, 2, 3, 4] The tramTRACKER information you have received?
k [IF TM6A = 6] The quality of information from the PTV website?l [IF TM6A = 5] The quality of information from the Yarra Trams website?m [IF TM6A = 4] The quality of information from the PTV call centre?n [IF TM6a = 11] The quality of information from the PTV App?
z So, thinking of all these aspects, how satisfied are you with the INFORMATION provided about tram services overall?
Tram Stops
TM8 Now, I would like you to rate your level of satisfaction with aspects of the TRAM STOPS you have used in the past six months. On the 0 to 10 scale, how satisfied are you with:
PROMPT IF NECESSARYROTATE GROUPSa The level of lighting provided?
Public Transport CSM Report April - June 2017 Page 145
b The general cleanliness and amount of litter at tram stops? c The level of graffiti at tram stops?
d That shelter and seating is provided at tram stops?e The maintenance of shelters and seating?
fBeing able to safely enter and exit the tram at the tram stops you use?
g The level of crowding (at tram stops) at the times you travel?
z So, thinking of all these aspects, how satisfied are you with TRAM STOPS overall?
IF TM8Z= 0-5 CONTINUE ELSE GO TO TM9A
TM27aWhat tram stop or stops in particular are you most dissatisfied with?
RECORD
TM27bIs that a platform stop, stop with barriers, or kerbside stop?
DO NOT READ OUT
MULTICODE01 Platform stop02 Stop with barriers03 Kerbside stop99 Don’t know
Ticketing
Now, I would like you to ask you about the TICKETING on tram services in Melbourne.
TM9a When you last travelled, was it on full fare or concession fare?
PROMPT IF NECESSARY
01 Full fare02 Concession fare03 (DO NOT READ) Free pass 99 (DO NOT READ) Don’t know
IF TM9A= 3 GO TO TM12
Public Transport CSM Report April - June 2017 Page 146
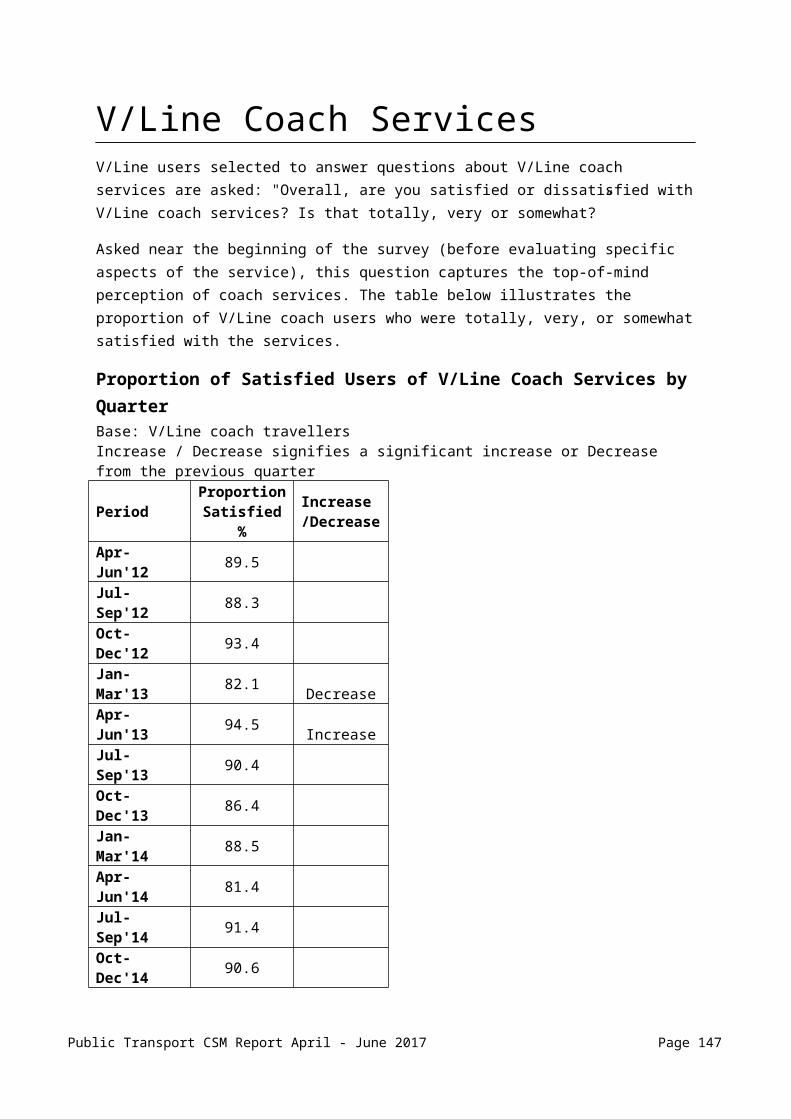
MYKI USERS- ALLTM25aThinking about the myki smartcard you are currently using, where do you normally
top-up your myki?
DO NOT READ OUT
MULTICODE01 Train station - ticket office02 Train station - myki vending machine03 On the internet / PTV website (ptv.vic.gov.au)04 Tram stop - myki vending machine05 Newsagent06 Auto top-up / direct debit07 7-Eleven 08 Chemist / pharmacy 09 Milk bar10 On board bus11 Commuter Club (annual pass) / top-up through work / salary package scheme12 PTV Hub (at Southern Cross Station)13 PTV Hub (at 750 Collins St Docklands)14 On board tram15 Bus stop / interchange - myki vending machine16 PTV Call Centre (1800 800 007)17 V/Line station18 On board V/Line trains / coaches19 V/Line ticket agent95 Other (SPECIFY)99 Don't know
TM25bAre you using myki money or myki pass for your public transport travel?
INTERVIEWER NOTE: If respondent asks for clarification please provide the following explanation and code accordingly):
myki money is a ‘pay as you go’ system. You load a credit on to the card and use that progressively whenever you travel.
myki pass is for a continuous block of travel days e.g. one week, month or year for regular travellers.
PROMPT IF NECESSARY
01 Myki money02 Myki pass03 Both99 (DO NOT READ) Don’t know
Public Transport CSM Report April - June 2017 Page 147

TM25c Have you registered your myki card which links your name and address to your individual card?
IF YES, ASK: Where did you register your myki card?
PROMPT IF NECESSARY
01 Yes – on the internet / PTV website (ptv.vic.gov.au)02 Yes – PTV Call Centre (1800 800 007)03 Yes – mailed a myki Registration Form04 Yes – registered at metropolitan retail outlets (e.g. Southern Cross PTV Hub/ 7-
Eleven)05 Yes – pre-registered myki card sent to pensioners06 Yes- preregistered through Commuter Club / work / salary package scheme07 No GO TO PRE TM25e99 (DO NOT READ) Don’t know GO TO PRE TM25e
TM25dHave you ever accessed your myki transaction records or travel details?
IF YES, ASK: Where did you access them?
PROMPT IF NECESSARY
MULTICODE01 Yes – on the internet / PTV website (ptv.vic.gov.au)02 Yes – myki vending machine03 Yes – myki check machine (small blue-coloured device)04 No99 (DO NOT READ) Don’t know
PRE TM25E IF TM25A=3 OR CODE 1 AT TM25C / TM25D, AUTOCODE TM25E WITH CODE 1 THEN GO TO TM26. ELSE, CONTINUE
TM25eHave you ever used the PTV website (ptv.vic.gov.au)?
PROMPT IF NECESSARY
01 Yes 02 No99 (DO NOT READ) Don’t know
TM26 Now, I would like you to ask about your satisfaction with the myki ticketing system. On the 0 to 10 scale, how satisfied are you with...
PROMPT IF NECESSARYROTATE GROUPSa The amount of ticketing information provided on trams about myki?b The ease of understanding the myki ticketing system?
c The ease of being able to top-up your myki when you need to?d There being sufficient places where you can top-up your myki?
e The accuracy of the fares that myki automatically calculates based on your travel?f[IF TM25d = 1, 2, OR 3] The accuracy of your transaction records or travel details?
g The ease of touching on (and touching off) using myki?
z So, thinking of all these aspects, how satisfied are you with the myki TICKETING system overall?
Public Transport CSM Report April - June 2017 Page 148

Price
TM12 Now, thinking about the services you receive, how satisfied are you with the PRICE of tram travel in Melbourne?
How services are run
TM13 Now, I would like you to rate your level of satisfaction with the OPERATIONAL running of the tram services that you have experienced in the past six months provided on your route. Using the 0 to 10 scale, how satisfied are you with:
INTERVIEWER NOTE:Peak times are considered to be 7am to 9:30am and 4:30pm to 7pm on weekdays
Off peak times are considered to be during the week before 7am, 9:30am to 4:30pm and after 7pm – and all times on weekends and public holidays
PROMPT IF NECESSARYROTATE GROUPSa [IF TM2A OR TM2B1 OR TM2B2 = 2 OR 4] The frequency of tram services
at peak times? b [IF TM2A OR TM2B1 OR TM2B2 = 1, 3 OR 5] The frequency of tram services in off
peak times on weekdays? c [IF TM2A OR TM2B1 OR TM2B2 = 6 OR 7] The frequency of tram services at the
weekend? d [IF TM4 = 1] The frequency of tram services to and from special events? e The frequency of tram services at night?
f That you are generally able to get on your first tram that arrives?
g The hours of operation of tram services? h The reliability of tram services? i Extent of delays compared to the timetable?
j The time your tram journeys generally take once you are on board?
z So, thinking of the operational performance of tram services in terms of frequency, on-time performance and time taken to travel, how satisfied are you with HOW TRAM SERVICES ARE RUN overall?
Public Transport CSM Report April - June 2017 Page 149

Experience of travelling on trams
TM14 I would like you to rate your level of satisfaction with your experience when on board a tram, including the tram design, in the past six months. On the 0 to 10 scale, how satisfied are you with:
PROMPT IF NECESSARYROTATE GROUPS
a The level of crowding on the tram at the times you need to travel?b The tram design allowing you to move around the tram once you are on?
c There being enough accessible straps and rails for you to hang on to?
d The smoothness of the tram ride? e The comfort of the seats? f The comfort of the ride when you can’t be seated?
g The level of graffiti in trams?h The general cleanliness and amount of litter in trams?I The level of damage to seats, fittings and windows (including scratching)?
j The temperature of trams in summer?k The temperature of trams in winter?
l That it is easy for you to get off trams?
z So, thinking of all these aspects, how satisfied are you with the design, space and comfort of Melbourne’s trams overall?
Tram Staff
TM15 Now, I would like you to rate your level of satisfaction with the tram STAFF you may have interacted with in the past six months. How satisfied are you that…
PROMPT IF NECESSARY
ROTATETram drivers… a are courteous and helpful? b drive safely and smoothly?c provide you with useful information if a tram breaks down or cannot run?d request passengers move well inside the trams when they are crowded?
z So, thinking of all these aspects, how satisfied are you with TRAM DRIVERS overall?
TM16 Have you been on a tram where authorised officers have been checking passenger tickets in the last six months?
INTERVIEWER NOTE: Authorised Officers are employed by public transport operators to check tickets, improve customer safety, provide customer information and assist during special events.
PROMPT IF NECESSARY
01 Yes
Public Transport CSM Report April - June 2017 Page 150

02 No GO TO TM1899 (DO NOT READ) Don’t know GO TO TM18
TM17 I would like you to rate your level of satisfaction with the Tram Authorised Officers you have seen in the past six months. On the 0 to 10 scale, how satisfied are you that…
PROMPT IF NECESSARYROTATE
a Authorised officers are courteous and helpful?b Authorised officers undertake their job in an appropriate manner?z So how satisfied are you with AUTHORISED OFFICERS overall?
TM18 Have you had face-to-face interaction with any other tram staff member in the last six months?
PROMPT IF NECESSARY
01 Yes02 No GO TO TM2099 (DO NOT READ) Don’t know / Can't say GO TO TM20
TM19 I would like you to rate your level of satisfaction with any other tram staff you have had face-to-face contact with in the past six months. On the 0 to 10 scale, how satisfied are you that…
PROMPT IF NECESSARYROTATEa Yarra trams staff are courteous and helpful?b Yarra trams staff provide useful information, if asked?z So how satisfied are you with YARRA TRAM STAFF, (other than authorised officers)
overall?
Personal Security
TM20 Now, I’d like you to rate your level of satisfaction with your feelings of PERSONAL SECURITY when you travel by tram. On the 0 to 10 scale, how satisfied are you with:
PROMPT IF NECESSARYROTATE ALL
a Your feelings of personal security when travelling on trams during the day b Your feelings of personal security when travelling on trams after dark?c Your feelings of personal security at tram stops during the day?d Your feelings of personal security at tram stops after dark?e The presence and visibility of security cameras on trams?f The presence and visibility of staff other than the tram driver on trams?g The ability to call for assistance when needed?
z So, thinking of all these aspects, how satisfied are you with your feelings of PERSONAL SECURITY overall?
Overall
TM21 Using the same scale again, and taking into consideration ALL aspects of the service we have discussed, and any others of importance to you, how satisfied are
Public Transport CSM Report April - June 2017 Page 151

you with Melbourne’s metropolitan TRAM SERVICES OVERALL in the past six months?
IF TM2BI=01 CONTINUE, ELSE GO TO TM22TM21aThinking just about your experience with ‘Night Network’, how satisfied are you with
‘Night Network’ overall?
TM22 I’d like you to think about any changes that may have occurred in the last 12 months with Melbourne’s TRAM service. Would you say that the TRAM service is now…?
READ OUT
01 Much better (than 12 months ago)02 A little better (than 12 months ago)03 The same04 A little worse (than 12 months ago)05 Much worse (than 12 months ago)06 (DO NOT READ) Did not use it 12 months ago99 (DO NOT READ) Don’t know
IF CODE 1 OR 5 AT TM22, ASK
TM22XWhy do you say that?
PROBE FULLY/RECORD VERBATIM
TM23 In the past six months, have you seriously considered reducing your use of trams in favour of other means of transport?
PROMPT IF NECESSARY
01 Yes02 No99 (DO NOT READ) Don’t know
TM24 On a scale of 0 to 10, where 0 is no likelihood and 10 is extremely likely, how likely would you be to recommend Melbourne’s tram services to someone else?
GO TO DEMOGRAPHICS SECTION
Public Transport CSM Report April - June 2017 Page 152

BUSES SECTION
I am now going to ask you about your experiences as a BUS user in Melbourne over the past six months….Please answer based on your experience with regular scheduled bus services, NOT any train replacement bus services you may have been on.
BU1a Which bus have you caught most often in the past six months?
PROMPT FOR ROUTE NUMBER
MULTICODE01 ROUTE NUMBER - record number95 Other (SPECIFY)99 (DO NOT READ) Don't know / Can't Say
BU2a What times of day do you generally travel by bus?
INTERVIEWER NOTE: TIMES REFER TO JOURNEY START TIMES
READ OUT
MULTICODE01 Weekdays before 7am? (Weekdays 4:00 AM to 7:00 AM)02 Weekdays between 7 – 9.30am? (Weekday morning peaks)03 Weekdays between 9.30am – 3.30pm? (Morning and afternoon off-peaks)04 Weekdays between 3.30 – 7pm? (Weekday afternoon peaks)05 Weekdays between 7pm – 2am? (Weekday evenings) 06 Weekends during day time?07 Weekends during night time?08 (DO NOT READ) It varies99 (DO NOT READ) Can’t say
BU2b
IF CODE 1-7 AT BU2A And what other days and times do you travel by bus?
IF CODE 8 OR 99 AT BU25A Have you ever travelled by bus on…?
INTERVIEWER NOTE: TIMES REFER TO JOURNEY START TIMES
PROMPT IF NECESSARY
MULTICODE01 Weekdays before 7am? (Weekdays 4:00 AM to 7:00 AM)02 Weekdays between 7 – 9.30am? (Weekday morning peaks)03 Weekdays between 9.30am – 3.30pm? (Morning and afternoon off-peaks)04 Weekdays between 3.30 – 7pm? (Weekday afternoon peaks)05 Weekdays between 7pm – 2am? (Weekday evenings) 06 Weekends during day time?07 Weekends during night time?08 (DO NOT READ) It varies97 None – no other times99 (DO NOT READ) Can’t say
Public Transport CSM Report April - June 2017 Page 153
BU2c Have you caught a SmartBus service in the past six months?
INTERVIEWER NOTE: SmartBus is a premium bus service that has been designed to complement Melbourne's radial train and tram network, by providing 'cross-town' connections. SmartBus numbers are 703, 900, 901, 902, 903, 905, 906, 907, and 908
PROMPT IF NECESSARY
01 Yes02 No
IF BU2A OR BU2B=07 ASK BU2BI, ELSE GO TO BU3BU2Bi Have you caught a ‘Night Network’ bus service since they began on the first of
January?
INTERVIEWER NOTE: Night Network services are the late night weekend services running roughly between midnight and 5am on Friday and Saturday nights (or technically Saturday and Sunday mornings).
PROMPT IF NECESSARY
01 Yes02 No
BU3 How do you usually get to the bus stop to begin your journey?
DO NOT READ OUT
MULTICODE 01 Walk02 Drive car and park03 Get a lift with someone else04 Cycle05 Tram06 Train07 Taxi08 V/Line train or coach95 Other (SPECIFY)97 It varies – no usual method99 Can’t say
BU4 Have you caught a bus to or from a special event, such as concert, festival or sporting event in the past six months?
PROMPT IF NECESSARY
01 Yes02 No99 (DO NOT READ) Don’t know
BU0 Overall are you satisfied or dissatisfied with the SERVICE on your bus route?
WAIT FOR RESPONSE: Is that totally, very or somewhat?
DO NOT READ OUT
01 Totally satisfied02 Very satisfied03 Somewhat satisfied
Public Transport CSM Report April - June 2017 Page 154
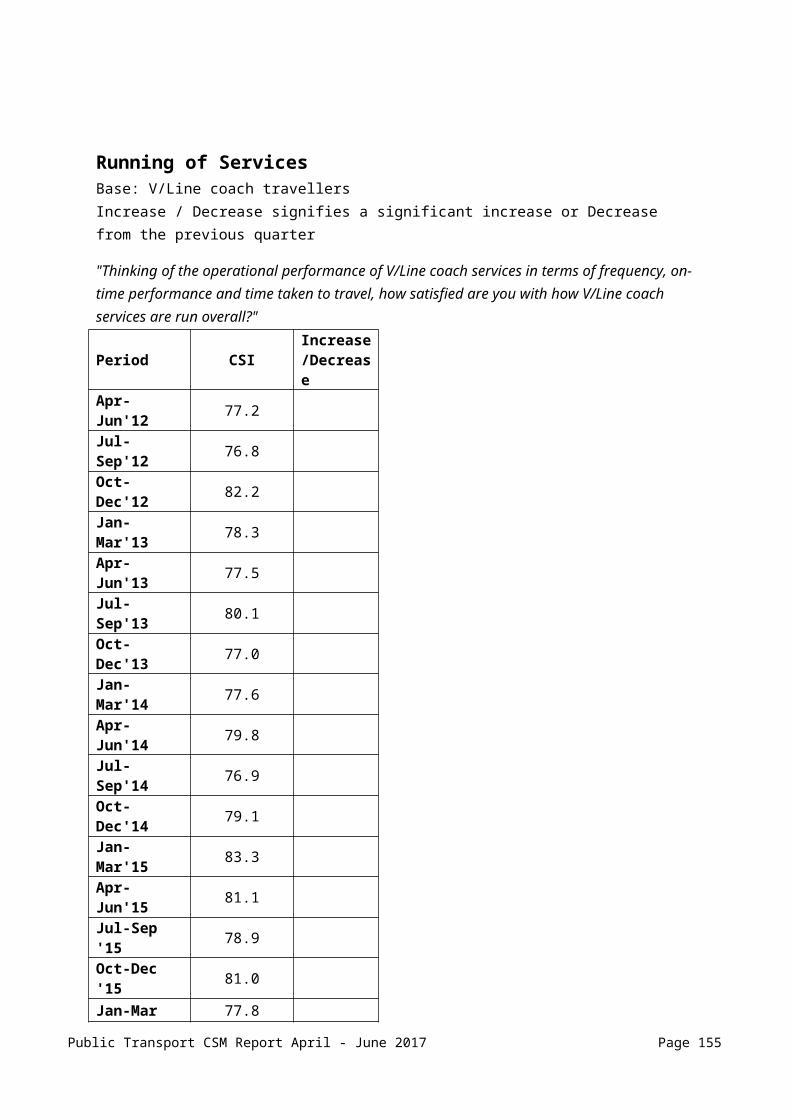
04 Somewhat dissatisfied05 Very dissatisfied06 Totally dissatisfied99 (DO NOT READ) Don’t know
BU5a In the past six months, have you significantly increased or decreased your use of metropolitan Buses?
PROMPT IF NECESSARY
01 Significantly increased 02 Significantly decreased03 Stayed about the same04 Only started to use buses in last 6 months99 (DO NOT READ) Don’t know / can’t say
BU5b In the next six months, would you expect your use of metropolitan buses to…?
READ OUT
01 Significantly increase 02 Significantly decrease03 Stay about the same99 (DO NOT READ) Don’t know / Hard to say
SATISFACTION QUESTIONS
Information
BU6a Where do you USUALLY access bus timetables or other information to plan bus journeys?
PROMPT: Anywhere else?
DO NOT READ OUT
MULTICODE 01 Use timetables at bus stops02 Get timetable from bus driver / on bus / from depot03 Ring call centre to send a timetable by post04 Phone PTV Call Centre (PT info line) for information05 Internet (computer) - Bus company websites06 Internet (computer) - PTV website07 SMS updates09 Smartphone application- PTV10 Smartphone application- third party11 Smartphone- web browser12 Printed timetables from train stations95 Other (SPECIFY)97 Don't use timetables99 Don't know
Public Transport CSM Report April - June 2017 Page 155

BU7 Now I am going to ask you to rate various aspects of bus service using a 0 to 10 scale. 0 means Extremely Dissatisfied and 10 means Extremely Satisfied. If a question is not relevant to you, please say so.
Firstly, I would like you to rate your level of satisfaction with aspects of the INFORMATION provided about bus services. Using the 0 to 10 scale, how satisfied are you with:
PROMPT IF NECESSARYROTATE GROUPS
a The availability of up-to-date printed timetable information at bus stops?b The ease of reading and understanding timetable information at bus stops?c The availability of printed timetables that you can carry around with you?d The information provided on the electronic displays at some bus stops about bus
arrival times?
e The availability of information provided when there is a planned disruption to bus services, such as road works or a major event?
f The availability of information provided when there is an unplanned disruption to bus services, such as a bus breakdown?
g [IF BU6A = 4] The quality of information from the PTV call centre?h [IF BU6A = 5] The quality of information from the Bus Company websites?i [IF BU6A = 6] The quality of information from the PTV website?j [IF BU6A = 09] The quality of information from the PTV App?
z So, thinking of all these aspects, how satisfied are you with the INFORMATION provided about bus services overall?
Bus Stops
BU8 Now, I would like you to rate your level of satisfaction with aspects of the BUS STOPS you have used in the past six months. On the 0 to 10 scale, how satisfied are you with:
PROMPT IF NECESSARYROTATE GROUPSa The level of lighting provided?
b The general cleanliness and amount of litter at bus stops? c The level of graffiti at bus stops?
d The shelter and seating provided at bus stops?e The maintenance of shelters and seating?
f The design of bus stops allowing you to safely enter and exit the bus?
g The level of crowding (at bus stops) at the times you travel?
z So, thinking of all these aspects, how satisfied are you with BUS STOPS overall?
IF BU8Z IS 5 OR LESS
BU25 What bus stop or stops in particular are you most dissatisfied with?
RECORD DETAILS
Public Transport CSM Report April - June 2017 Page 156

Ticketing
Now, I would like you to ask you about the TICKETING on bus services in Melbourne.BU9a When you last travelled, was it on full fare or concession fare?
PROMPT IF NECESSARY
01 Full fare02 Concession fare03 Free pass99 (DO NOT READ) Don’t know
IF BU9A=3 GO TO BU12MYKI USERS- ALL
BU18a Thinking about the myki smartcard you are currently using, where do you normally top-up your myki?
DO NOT READ OUT
MULTICODE01 Train station – ticket vending machine02 Train station – ticket office03 On board bus04 Newsagent 05 On the internet / PTV website (ptv.vic.gov.au)06 Auto top-up / direct debit07 7-Eleven 08 Chemist / pharmacy 09 Milk bar10 Bus stop / interchange – ticket vending machine11 Tram stop – ticket vending machine12 Commuter Club (annual pass) / top-up through work / salary package scheme13 PTV Hub (at Southern Cross Station)14 PTV Hub (at 750 Collins St Docklands)15 On board tram16 V/Line station17 PTV Call Centre (1800 800 007)18 On board V/Line trains / coaches19 V/Line ticket agent95 Other (SPECIFY)99 Don’t know
Public Transport CSM Report April - June 2017 Page 157

BU18b Are you using myki money or myki pass for your public transport travel?(INTERVIEWER NOTE: If respondent asks for clarification please provide the following explanation and code accordingly):
myki money is a ‘pay as you go’ system. You load a credit on to the card and use that progressively whenever you travel.
myki pass is for a continuous block of travel days e.g. one week, month or year for regular travellers.
PROMPT IF NECESSARY
01 Myki money02 Myki pass03 Both99 (DO NOT READ) Don’t know
BU18c Have you registered your myki card which links your name and address to your individual card? IF YES, ASK: Where did you register your myki card?
PROMPT IF NECESSARY
01 Yes – on the internet / PTV website (ptv.vic.gov.au)02 Yes – PTV Call Centre (1800 800 007)03 Yes – mailed a myki Registration Form04 Yes – registered at metropolitan retail outlets (e.g. Southern Cross PTV Hub / 7-Eleven) 05 Yes – pre-registered myki card sent to pensioners 06 Yes- preregistered through Commuter Club / work / salary package scheme07 No GO TO PRE
BU18e99 (DO NOT READ) Don’t know GO TO PRE
BU18e
BU18d Have you ever accessed your myki transaction records or travel details? IF YES, ASK: Where did you access them?
PROMPT IF NECESSARY
MULTICODE01 Yes – on the internet / PTV website (ptv.vic.gov.au)02 Yes – myki vending machine03 Yes – myki check machine (small blue-coloured device)04 No99 (DO NOT READ) Don’t know
PRE BU18E IF BU18A=3 OR CODE 1 AT BU18C / BU18D, AUTOCODE BU18E WITH CODE 1 THEN GO TO BU19. ELSE, CONTINUE
BU18e Have you ever used the PTV website (ptv.vic.gov.au)? PROMPT IF NECESSARY
01 Yes 02 No99 (DO NOT READ) Don’t know
Public Transport CSM Report April - June 2017 Page 158
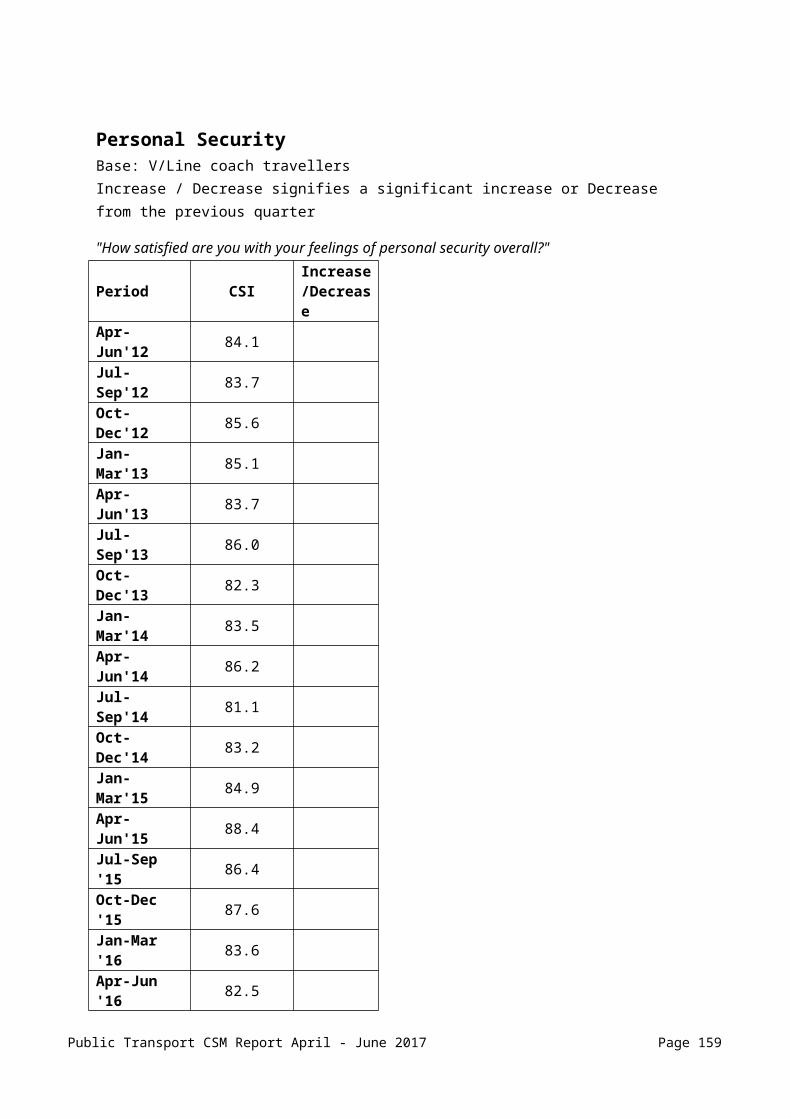
BU19 Now, I would like you to ask about your satisfaction with the myki ticketing system. On the 0 to 10 scale, how satisfied are you with...PROMPT IF NECESSARY
ROTATE GROUPSa The amount of ticketing information provided on buses about myki?b The ease of understanding the myki ticketing system?
c The ease of being able to top-up your myki when you need to?d There being sufficient places where you can top-up your myki?
e The accuracy of the fares that myki automatically calculates based on your travel?f [IF BU18d = 1, 2, OR 3] The accuracy of your transaction records or travel details?
g The ease of touching on and touching off using myki?
z So, thinking of all these aspects, how satisfied are you with the myki TICKETING system overall?
Price
BU12 Now, thinking about the services you receive, how satisfied are you with the PRICE of bus travel in metropolitan Melbourne?
Public Transport CSM Report April - June 2017 Page 159

How services are run
BU13 Now, I would like you to rate your level of satisfaction with the OPERATIONAL running of the bus services that you have experienced in the past six months provided on your route. Using the 0 to 10 scale, how satisfied are you with:INTERVIEWER NOTE: Peak times are considered to be 7am to 9:30am and 3:30pm to 7pm on weekdays
Off peak times are considered to be during the week before 7am, 9:30am to 3:30pm and after 7pm – and all times on weekends and public holidays
PROMPT IF NECESSARYROTATE GROUPSa [IF BU2A OR BU2B1 OR BU2B2 = 2 OR 4] The frequency of bus services at
weekday peak times?b [IF BU2A OR BU2B1 OR BU2B2 = 1, 3, 5] The frequency of bus services in
weekday off peak times?c [IF BU2A OR BU2B1 OR BU2B2 = 6 OR 7] The frequency of bus services at the
weekend?
d That you are generally able to get on your first bus that arrives?
e Buses not leaving too early (compared to the scheduled time)?f Buses not arriving late?g The hours of operation of bus services?
h That you are able to make connections with other public transport services?
iThe time your bus journeys generally take once you are on board?
z So, thinking of the operational performance of bus services in terms of frequency, on-time performance and time taken to travel, how satisfied are you with HOW BUS SERVICES ARE RUN overall?
Public Transport CSM Report April - June 2017 Page 160
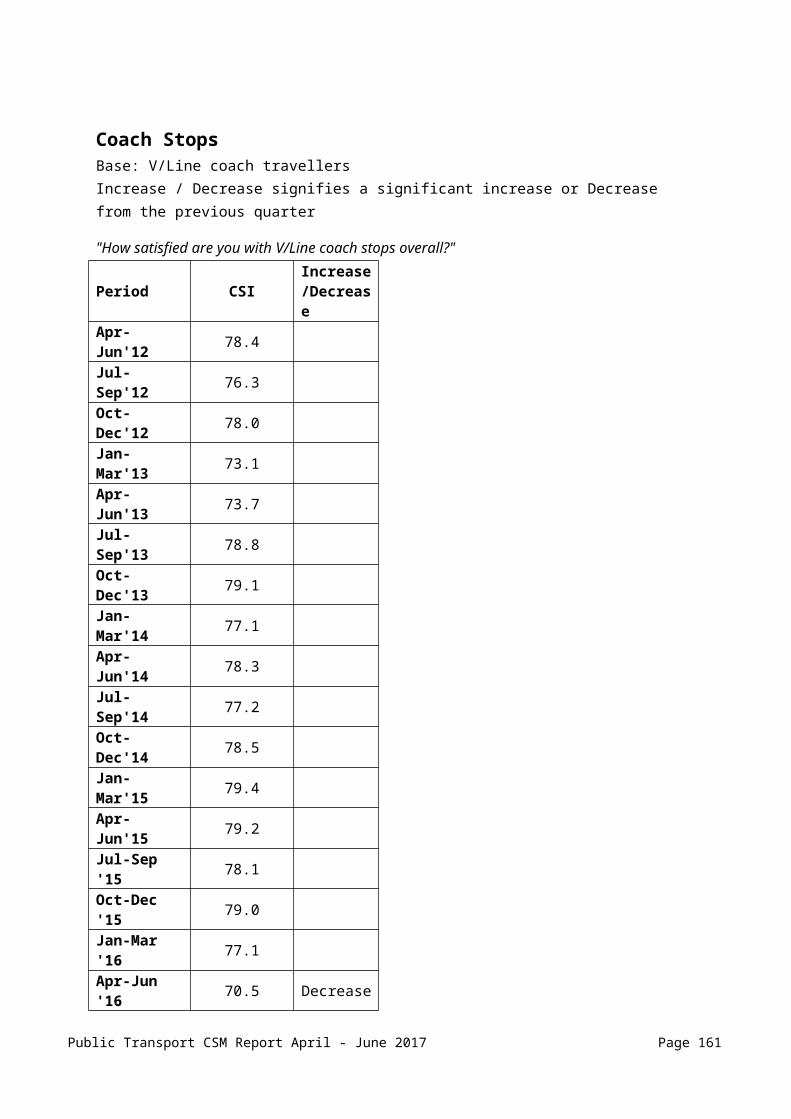
Experience of travelling on Buses
BU14 Now, I would like you to rate your level of satisfaction with your experience when on board a bus, including the bus design, in the past six months. On the 0 to 10 scale, how satisfied are you with:
PROMPT IF NECESSARY
ROTATE GROUPSa The aisles being kept clear of bags and other items?
b The level of crowding on the bus at the times you need to travel?
c The smoothness of the bus ride?
d The comfort of the seats?
e The level of graffiti in buses?f The general cleanliness and amount of litter in buses?g The level of damage to seats, fittings and windows (including scratching)?
h The temperature inside buses in winter? i The temperature inside buses in summer?
j The quality and level of lighting on buses?
k That it is easy for you to get off buses
z So, thinking of all these aspects, how satisfied are you with the design, space and comfort of Melbourne’s BUSES overall?
Bus Staff
BU15 Now, I would like you to rate your level of satisfaction with the bus STAFF you may have interacted with in the past six months. First of all, the BUS DRIVER. On the 0 to 10 scale, how satisfied are you that…
PROMPT IF NECESSARY
ROTATEBus drivers…
a are courteous and helpful? b are well-presented and well groomed?c drive safely and smoothly?d provide you with useful information regarding travel, if requested?e are easy to understand, if you are speaking with them?
z So, thinking of all these aspects, how satisfied are you with BUS DRIVERS overall?
Public Transport CSM Report April - June 2017 Page 161
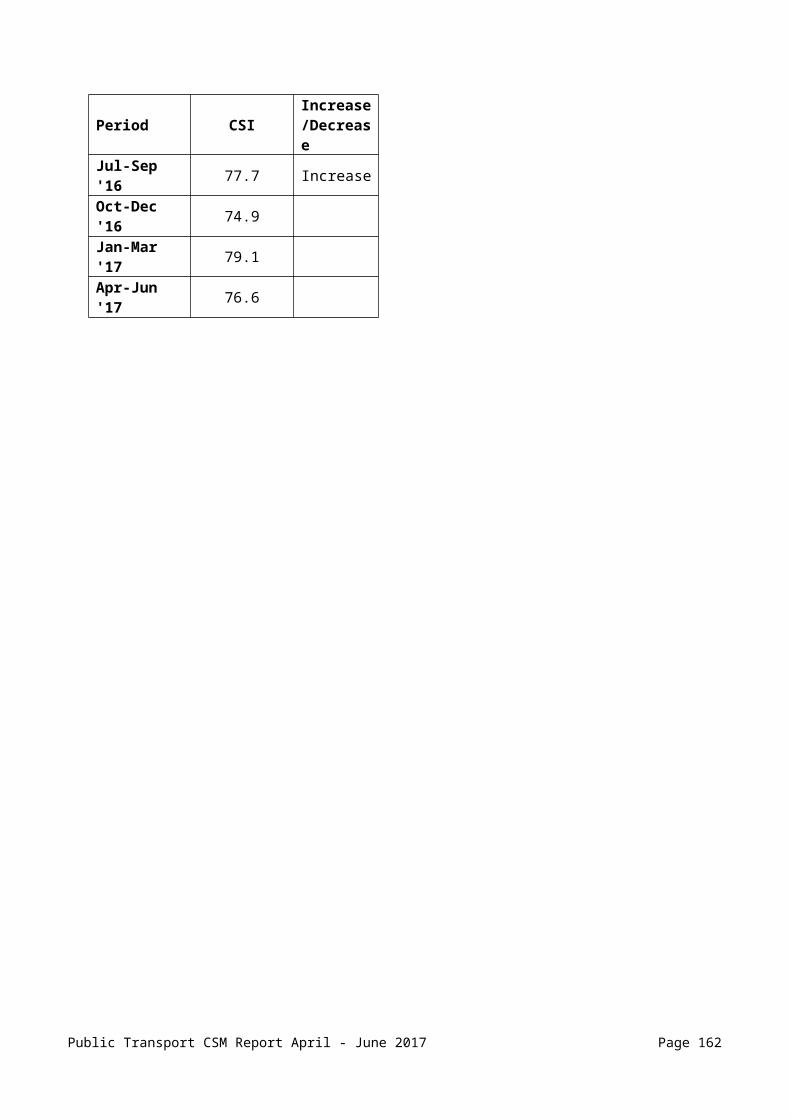
BU16 Have you been on a bus where bus Authorised Officers have been checking passenger tickets in the last six months?INTERVIEWER NOTE: Authorised Officers are employed by public transport operators to check tickets, improve customer safety, provide customer information and assist during special events.
PROMPT IF NECESSARY
01 Yes02 No GO TO BU2099 (DO NOT READ) Don't know/Can't Say) GO TO BU20
BU17 Now, I would like you to rate your level of satisfaction with the Bus Authorised Officers you have seen in the past six months. On the 0 to 10 scale, how satisfied are you that…PROMPT IF NECESSARY
ROTATEa Authorised officers are courteous and helpful?b Authorised officers undertake their job in an appropriate manner?
z And how satisfied are you with AUTHORISED OFFICERS overall?
Personal Security
BU20 Now, I’d like you to rate your level of satisfaction with your feelings of PERSONAL SECURITY when you travel by Bus. On the 0 to 10 scale, how satisfied are you with…
PROMPT IF NECESSARY
ROTATE ALLa Your feelings of personal security when travelling on buses during the day? b Your feelings of personal security when travelling on buses after dark? c Your feelings of personal security at bus stops during the day?d Your feelings of personal security at bus stops after dark?e The presence and visibility of security cameras on buses?f The presence and visibility of bus staff other than the bus driver on buses?g The ability to call for assistance when needed?
z So, thinking of all these aspects, how satisfied are you with your feelings of PERSONAL SECURITY overall?
Public Transport CSM Report April - June 2017 Page 162
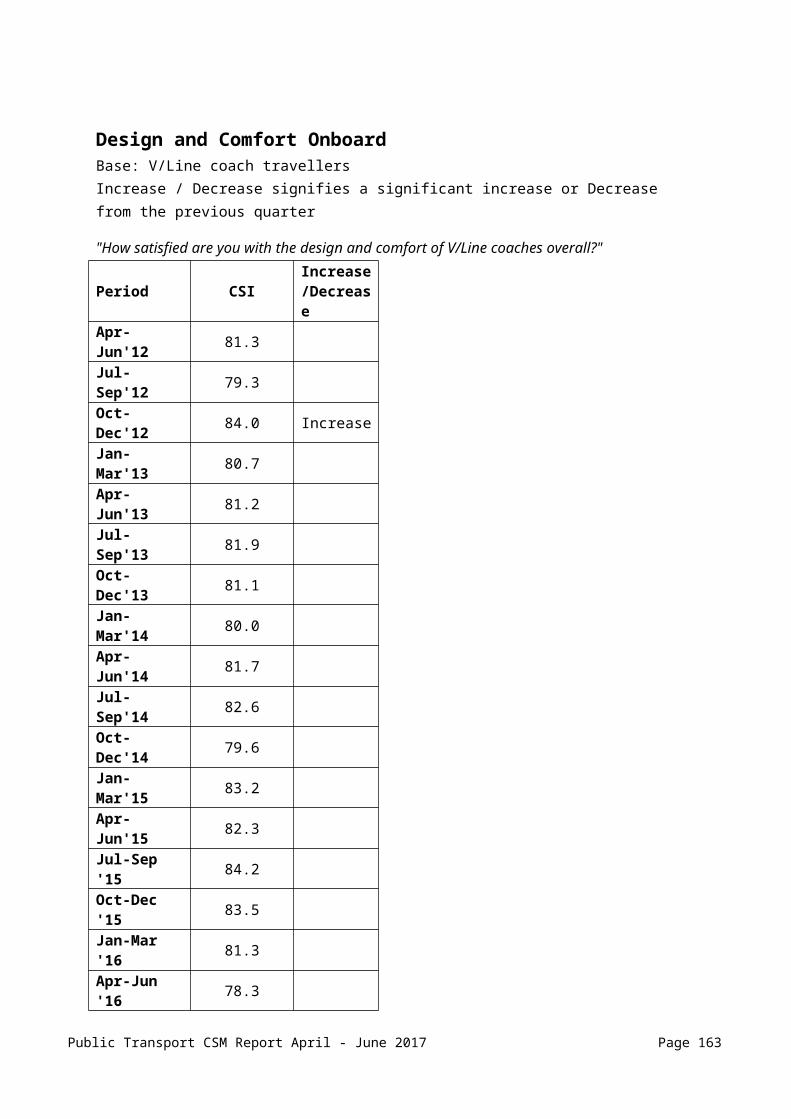
Overall
BU21a Using the same scale again, and taking into consideration all the aspects of the service we have discussed, and any others of importance to you, how satisfied are you with Melbourne’s metropolitan bus services overall in the past six months?
IF BU2C =1 ASK B21B, ELSE GO TO PRE BU21C
BU21b Thinking just about your experience on SmartBuses, how satisfied are you with your experience on SmartBuses overall in the past six months?
IF BU2BI=01 CONTINUE, ELSE GO TO BU22BU21d Thinking just about your experience with ‘Night Network’, how satisfied are you with
‘Night Network’ overall?
BU22 I’d like you to think about any changes that may have occurred in the last 12 months with Melbourne’s BUS services. Would you say that the BUS service is now…?READ OUT
01 Much better (than 12 months ago)02 A little better (than 12 months ago)03 The same04 A little worse (than 12 months ago)05 Much worse (than 12 months ago)06 (DO NOT READ) Did not use it 12 months ago99 (DO NOT READ) Don’t know
BU23 In the past six months, have you seriously considered reducing your use of buses in favour of other means of transport?PROMPT IF NECESSARY
01 Yes02 No99 (DO NOT READ) Don’t know
BU24 On a scale of 0 to 10, where 0 is no likelihood and 10 is extremely likely, how likely would you be to recommend Melbourne’s bus services to someone else?
Public Transport CSM Report April - June 2017 Page 163

DEMOGRAPHICS SECTION
ASK A2 – A3 IN APR-JUN 2017 A2 The public transport industry has an independent body to deal with unresolved
customer complaints involving public transport. Do you know what the body is called?
01 Yes – Public Transport Ombudsman GO TO D1 95 Yes – other (SPECIFY) 02 No 99 (DO NOT READ) Don’t know
A3 Have you heard of the Public Transport Ombudsman?
01 Yes 02 No 99 (DO NOT READ) Don’t know
ASK ALLD1 Now we have just a few questions to help us analyse the survey answers. Firstly,
which of the following best describes the composition of your household?
READ OUT
01 Family or single parent with children under the age of 502 Family or single parent with school age children at home03 Family with older children at home04 Couple whose children have now left home05 Married couple or couple in de facto relationship with no children06 A single person living alone07 Shared household of unattached people95 Other (SPECIFY)98 (DO NOT READ) Refused/Can’t say
D2 And in which year were you born?RECORD FOUR-DIGIT YEAR; 1900 - 1995
[ANALYST: CREATE A CONSTRUCTION FOR AGE VARIABLE BASED ON THIS]
D3 What was your main activity in the last week?READ OUT
01 Full time work (30+ hours per week)02 Part time work (8-29 hours per week)03 Retired GO TO D504 Home duties GO TO D505 Student attending formal education GO TO D506 Unemployed, looking for work GO TO D507 Have a job but away for vacation, illness, strike etc. GO TO D508 Permanent invalid, not seeking work GO TO D595 Other (SPECIFY) GO TO D598 Refused GO TO D5
Public Transport CSM Report April - June 2017 Page 164
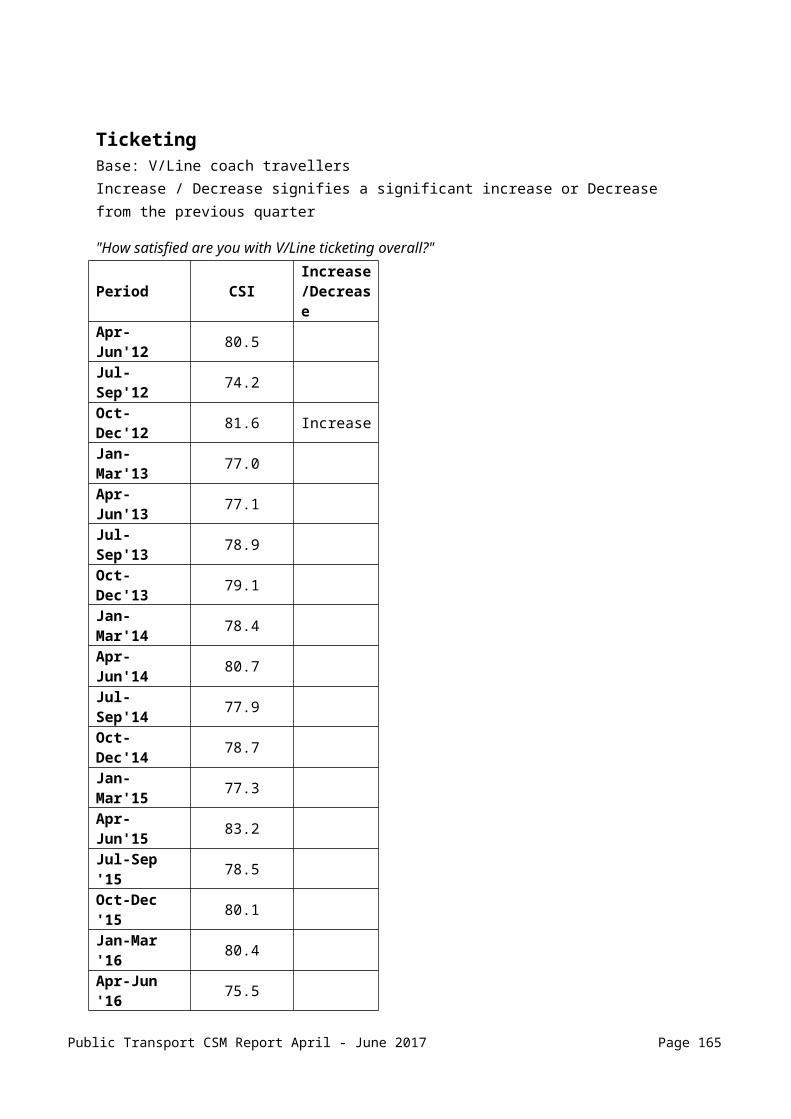
D4 What is your occupation?
RECORD FULL DETAILS
D5 Do you have access to a car for your own personal use when needed?PROMPT IF NECESSARY
01 Yes02 No03 Other response99 (DO NOT READ) Don’t know
D5i Would you be interested in participating in further research regarding public transport in the future?
01 Yes GO TO Q5II02 No GO TO CLOSE
D5ii Can I confirm your phone number, email address and name?01 Name:02 Phone Number:03 Email Address:
D6 Finally, do you have any further comments you wish to make about public transport that we have not covered today?RECORD VERBATIM
CONFIRM POSTCODE
CLOSEThat was my final question. On behalf of Public Transport Victoria, the Public Transport Companies, and Wallis Market & Social Research, thanks for your help. Your views count and we’re glad you made them known to us. Just in case you missed it, my name is (INTERVIEWER STATE NAME), and I am from Wallis. If you have any questions about this survey you may contact the Australian Market and Social Research Society on 1300 364 830. If you’d like to see a copy of our Privacy Policy you can find it on our website at www.wallisgroup.com.au /privacy
QUALITY CONTROL SECTION
Q1 INTERVIEWER CODE: Please rate the level of the respondent’s interest in this survey. How involved did the respondent appear to be?
01 High02 Average03 Low
Q2 INTERVIEWER CODE: Please rate the quality of communication with the respondent (i.e. How well did the respondent appear to understand the questions?)
01 High
Public Transport CSM Report April - June 2017 Page 165

02 Medium03 Low
Public Transport CSM Report April - June 2017 Page 166

PUBLIC TRANSPORT VICTORIAV/LINE CUSTOMER SATISFACTION MONITORQUESTIONNAIREAPRIL - JUNE 2017
INTRODUCTIONGood (...) my name is (...) from Wallis Market & Social Research, calling on behalf of
Public Transport Victoria and V/Line. Public Transport Victoria is the new body responsible for public transport in Victoria. They want to know how satisfied customers are with the non-metropolitan public transport services. We’d like to speak to a person over the age of 16 who normally resides in your household, and uses V/Line. Would that be you?
IF NO: Is there anyone in the household aged 16 or over who uses V/Line?
IF NECESSARY: The survey will take about fifteen minutes and your views will be used in the continuous improvement of V/Line services. Your answers will be held in the strictest confidence
IF QUERIED ABOUT PHONE NUMBER ADD:
Your telephone number was chosen at random from numbers generated by samplepages.com.au so that we contact a broad spectrum of the Australian Public
MONITORING QUESTIONM1 This call will be recorded and may be monitored for quality control purposes. If you
do not want this call to be monitored, please say so now.
DO NOT READ OUT
01 Monitoring allowed02 Monitoring NOT allowed
SCREENING
S1 Firstly, do you or does anyone else in your household work for Public Transport Victoria, the Department of Transport, V-Line or a private train, tram or bus company?
PROMPT IF NECESSARY
01 Yes CLOSE102 No
CLOSE 1: Thank you for your time today. Unfortunately family members of those who are affiliated with public transport companies are ineligible to take part in this survey.
Public Transport CSM Report April - June 2017 Page 167

S2 Do you travel on a V/Line train or a V/Line coach at least a few days a year?
PROMPT IF NECESSARY
01 Yes GO TO S502 No CLOSE2
CLOSE 2: Thank you for your time today. Unfortunately this survey is only for users of V/Line.
S3 How often do you travel on V/Line TRAINS?
PROMPT IF NECESSARY
01 6 or 7 days a week 02 5 days a week 03 3 or 4 days a week 04 1 or 2 days a week 05 Between 1 and 3 times per month06 Once every 2-3 months (4 – 6 times a year)07 Once every 4 to 6 months (2 – 3 times a year)08 Once a year 09 Less than once a year10 Never
S4 How often do you travel on V/Line COACHES? This does not include any replacement coach service you may have experienced
IF NECESSARY: for example, trains were replaced by coaches due to track works.
PROMPT IF NECESSARY
01 6 or 7 days a week 02 5 days a week 03 3 or 4 days a week 04 1 or 2 days a week 05 Between 1 and 3 times per month06 Once every 2-3 months (4 – 6 times a year)07 Once every 4 to 6 months (2 – 3 times a year)08 Once a year 09 Less than once a year10 Never
S8 RECORD GENDER
01 Male02 Female
IF CODE 8-10 AT S3 AND S4, CLOSE3
CLOSE 3: Thank you for your time today. Unfortunately this survey is only for those who use V/Line Trains or Coaches more often than once a year.
Public Transport CSM Report April - June 2017 Page 168

SECTION 1: GENERAL TRAVEL BEHAVIOUR
V0 Overall, are you satisfied or dissatisfied with V/Line (train and coach) services?
WAIT FOR RESPONSE: Is that totally, very, or somewhat?
DO NOT READ OUT
01 Totally satisfied02 Very satisfied03 Somewhat satisfied04 Somewhat dissatisfied05 Very dissatisfied06 Totally dissatisfied99 (DO NOT READ) Don’t know
V1 For what reasons do you usually travel by V/Line train or coach?
DO NOT READ OUT
MULTICODE01 To go to or from work02 Work related but not commuting03 Leisure (i.e. shopping, day trip)04 Education/ study05 Visiting friends/ relatives06 Tourism/ Holiday07 Personal business (i.e. doctors)08 Special events (i.e. sporting/cultural)95 Other (SPECIFY)99 (DO NOT READ) Can't remember
V2 And what type of fare do you NORMALLY purchase?
INTERVIEWER NOTE: if respondent answers more than one type, probe for the one MOST FREQUENTLY purchased
If respondent says ‘myki’, probe to determine what type of journey is most common
READ OUT
01 Peak single 02 Off peak single03 Peak daily return04 Off peak daily return05 Period ticket such as weekly, monthly, or date to date [including ‘myki pass’ periodical
tickets]06 Family Traveller 07 Seniors AUTOCODE V3 WITH CODE 02 AND GO TO INSTRUCTION BEFORE
V4a08 Free pass GO TO QUOTA SELECTION09 (DO NOT READ) Uses myki money for a variety of journey types 95 Other99 (DO NOT READ) Don’t know GO TO QUOTA SELECTION
Public Transport CSM Report April - June 2017 Page 169

V3 And is that...?
INTERVIEWER NOTE: if respondent answers more than one type, probe for the one MOST FREQUENTLY purchased
READ OUT
01 Full fare02 or Concession99 (DO NOT READ) Don’t know
IF S5=01 – 07, ASK V4 ELSE GO TO QUOTA SELECTIONV4 And when you purchase a TRAIN ticket do you NORMALLY purchase a ...?
INTERVIEWER NOTE: if respondent answers more than one type, probe for the one MOST FREQUENTLY purchased; if respondent says “there is no first class ticket on my train”, code as ‘economy’
READ OUT
01 First class ticket 02 or Economy ticket 03 (DO NOT READ) Uses myki money for both first class and economy travel99 (DO NOT READ) Don’t know
QUOTA SELECTION:IF CODE 1-7 AT S5, QUALIFY AS TRAIN USERSIF CODE 1-7 AT S6, QUALIFY AS COACH USERSIF QUALIFY TO BOTH TRAIN AND COACH, SELECT RANDOMLY(IF SELECTED FOR COACH GO TO VC2)
Public Transport CSM Report April - June 2017 Page 170

SECTION 2: TRAINSVT2 How do you identify or describe a V/Line train?
INTERVIEWER NOTE: refer to photos - but do not prompt
DO NOT READ OUT
PROBE FULLY
MULTICODE01 V/Line name on side - written on side GO TO VT4A02 Red/burgundy with blue GO TO VT4A03 Mostly silver with red & blue GO TO VT4A04 Mostly sliver with red & purple GO TO VT4A05 Purple and Green GO TO VT4A06 Name on the ticket GO TO VT4A07 Name on staff uniforms GO TO VT4A08 V/Line seat on Great Southern Railway (GSR) or CountryLink XPT (NSW) GO TO
VT4A95 Other - CORRECT response (SPECIFY) GO TO VT4A96 INCORRECT response (SPECIFY)99 (DO NOT READ) Don’t know (FIRST RESPONSE ONLY)
VT3 For this survey, we need to talk to people who have used V/Line trains.
Is there anything about the V/Line trains that you can describe? DO NOT AID OR PROMPT
01 Yes - Correct description02 Yes - Incorrect description CLOSE499 No - still don't know CLOSE4
CLOSE 4: Thank you for your time today. Unfortunately, to distinguish users of V/Line with other regional transport services, this survey is only for those who can correctly identify V/Line Trains.
VT4a When travelling from home, at which V/Line station do you most frequently board the train?
INTERVIEWER NOTE: if more than one, record all
PROMPT IF NECESSARY
MULTICODE01 Southern Cross (Spencer Street)02 Flinders Street03 North Melbourne04 Richmond05 Footscray06 Sunshine07 Dandenong95 Type in name of station (SPECIFY)99 (DO NOT READ) Don't know/Can't Say
Public Transport CSM Report April - June 2017 Page 171
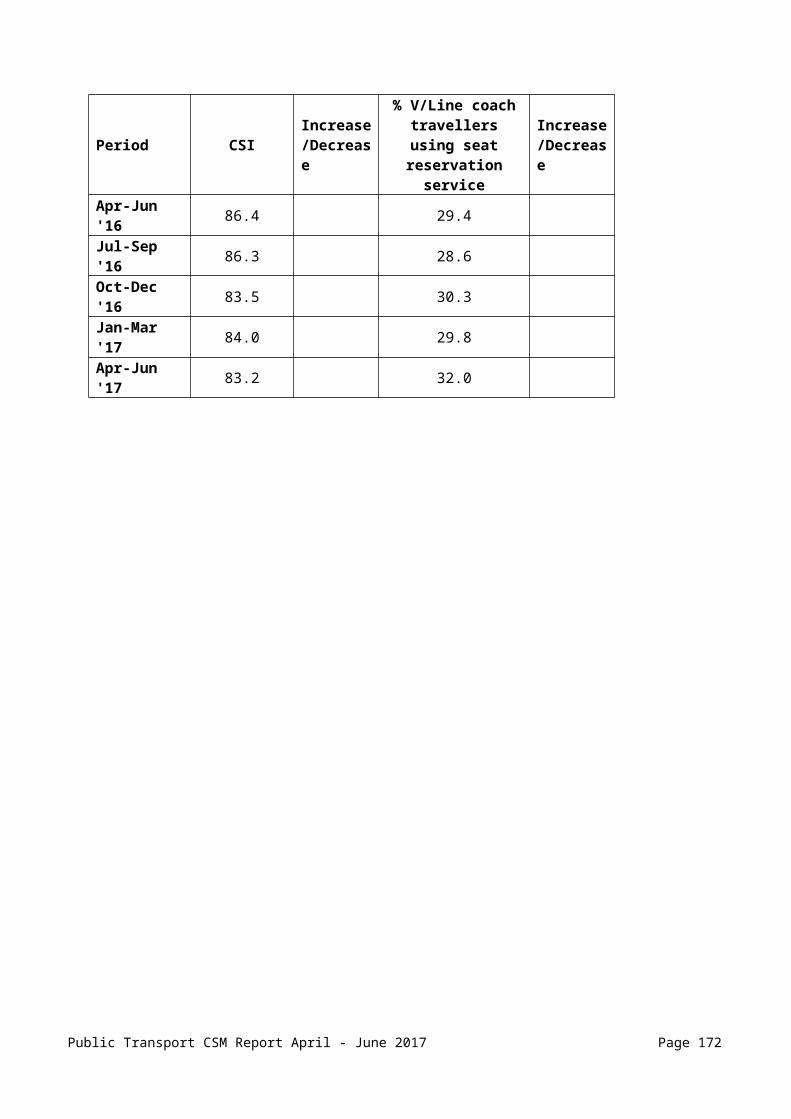
VT4b And for your most typical journey from home, at which V/Line station do you most often get off?
INTERVIEWER NOTE: if more than one, record all
PROMPT IF NECESSARY
MULTICODE01 Southern Cross (Spencer Street)95 Type in name of station (SPECIFY)99 (DO NOT READ) Don't know/Can't Say
VT5a What times of day do you mostly travel by train? Do you mostly travel….?
INTERVIEWER NOTE: TIMES REFER TO JOURNEY START TIMES
READ OUT
MULTICODE01 Weekdays before 7am? (Weekdays 4:00 AM to 7:00 AM)02 Weekdays between 7 – 9am? (Weekday morning peaks)03 Weekdays between 9am – 4.00pm? (Morning and afternoon off-peaks)04 Weekdays between 4 – 6pm? (Weekday afternoon peaks)05 Weekdays between 6pm – 2am? (Weekday evenings) 06 Weekends during day time07 Weekends during night time08 (DO NOT READ) It varies 99 (DO NOT READ) Can’t say
VT5b IF CODE 1-7 AT VT5A And what other days and times do you travel by train?
IF CODE 8 OR 99 AT VT5A Have you ever travelled by V/Line train on…?
INTERVIEWER NOTE: TIMES REFER TO JOURNEY START TIMES
READ OUT
MULTIPLE RESPONSE01 Weekdays before 7am? (Weekdays 4:00 AM to 7:00 AM)02 Weekdays between 7 – 9am? (Weekday morning peaks)03 Weekdays between 9am – 4.00pm? (Morning and afternoon off-peaks)04 Weekdays between 4 – 6pm? (Weekday afternoon peaks)05 Weekdays between 6pm – 2am? (Weekday evenings) 06 Weekends during day time07 Weekends during night time08 (DO NOT READ) It varies 97 (DO NOT READ) None – no other times 99 (DO NOT READ) Can’t say
Public Transport CSM Report April - June 2017 Page 172

VT6 How do you usually get to the V/Line train station to begin your journey?
DO NOT READ OUT
PROBE FULLY
MULTICODE01 Walk02 Drive car and park03 Get a lift with someone else04 Cycle05 Bus06 Tram07 Taxi08 V/ Line train or coach95 Other (SPECIFY)97 It varies – no usual method
VT7 Have you caught a V/Line train to or from a special event, such as concert, festival or sporting event in the past six months?
PROMPT IF NECESSARY
01 Yes02 No99 (DO NOT READ) Don’t know
VT0 Overall, are you satisfied or dissatisfied with V/Line TRAIN services?
WAIT FOR RESPONSE: Is that totally, very, or somewhat?
DO NOT READ OUT
01 Totally satisfied02 Very satisfied03 Somewhat satisfied04 Somewhat dissatisfied05 Very dissatisfied06 Totally dissatisfied99 (DO NOT READ) Don’t know
VT8a In the past six months, have you significantly increased or decreased your use of V/Line trains?
PROMPT IF NECESSARY
01 Significantly increased 02 Significantly decreased03 Stayed about the same04 Only started to use trains in last 6 months99 (DO NOT READ) Don’t know / Hard to say
Public Transport CSM Report April - June 2017 Page 173

VT8b In the next six months, would you expect your use of V/Line trains to…?
READ OUT
01 Significantly increase 02 Significantly decrease03 Stay about the same99 (DO NOT READ) Don’t know / Hard to say
SATISFACTION QUESTIONS
Information
VT10a Where do you USUALLY access train timetable or other journey information?
PROMPT: Anywhere else?
DO NOT READ OUT
MULTICODE01 At train stations – station timetable posters02 At train stations – V/Line staff03 At train stations – LED screens04 Printed timetables from stations05 V/Line Call Centre (136 169 Info Line)06 Internet (computer) – V/Line website07 Internet (computer) –PTV website08 SMS updates / INFORM SERVICE09 Smartphone application- PTV10 Smartphone application- third party11 Smartphone- web browser95 Other (SPECIFY)97 Don’t use timetables99 (DO NOT READ) Don’t know
IF VT10A NOT CODED 08VT10b Are you aware of V/Line’s update service called INFORM?
INTERVIEWER NOTE: if necessary, explain that this service provides information about train cancellations via mobile text message and email
PROMPT IF NECESSARY
01 Yes02 No GO TO VT1199 (DO NOT READ) Don’t know / Can’t say GO TO VT11
VT10c Have you ever used V/Line’s INFORM service?
PROMPT IF NECESSARY
01 Yes02 No99 (DO NOT READ) Don’t know / Can’t say
Public Transport CSM Report April - June 2017 Page 174
VT11 Now I am going to ask you to rate various aspects of V/Line train service using a 0 to 10 scale. 0 means Extremely Dissatisfied and 10 means Extremely Satisfied. If a question is not relevant to you, please say so.
Firstly, I would like you to rate your level of satisfaction with aspects of the INFORMATION provided about V/Line train services. On the 0 to 10 scale, how satisfied are you with:
READ OUT
ROTATE GROUPSa Ease of understanding timetable information? b The availability of up-to-date printed timetable information at train stations?
c The number of announcements at stations and on trains?d The clarity of announcements at stations and on trains?
e The amount of information provided when V/Line trains are cancelled or delayed?f The availability of information provided when there is a planned alteration to V/Line train services, such as for track works?
g [IF VT10A = 5] The quality of information from the V/Line call centre? h [IF VT10A = 6] The quality of information from the V/Line website? i [IF VT10A = 7] The quality of information from the / PTV website?
j [IF VT10A = 8 OR VT10C = 1] The V/Line INFORM update service?k [IF VT10A = 09] The quality of information from the PTV app?
z So, thinking of all these aspects, how satisfied are you with the INFORMATION provided about V/Line train services overall?
TicketingVT34 The myki ticketing system, which operates in Melbourne, has been introduced for
V/Line services on some train lines. Are you currently using the paper ticketing system for your V/Line train travel, or the myki ticketing system?
INTERVIEWER NOTE: myki is a ticketing system that allows public transport users to use a pre-paid reusable plastic smartcard, instead of the old paper tickets. It is the only ticketing system for metropolitan public transport, and was introduced for V/Line trains in June-July 2013.
Further info can be found on the V/line website.
PROMPT IF NECESSARY
MULTICODE01 Paper ticket02 myki smartcard 95 Other (SPECIFY)99 (DO NOT READ) Don’t know
IF CODE 2 AT VT34 CONTINUE, ELSE GO TO VT14
Public Transport CSM Report April - June 2017 Page 175
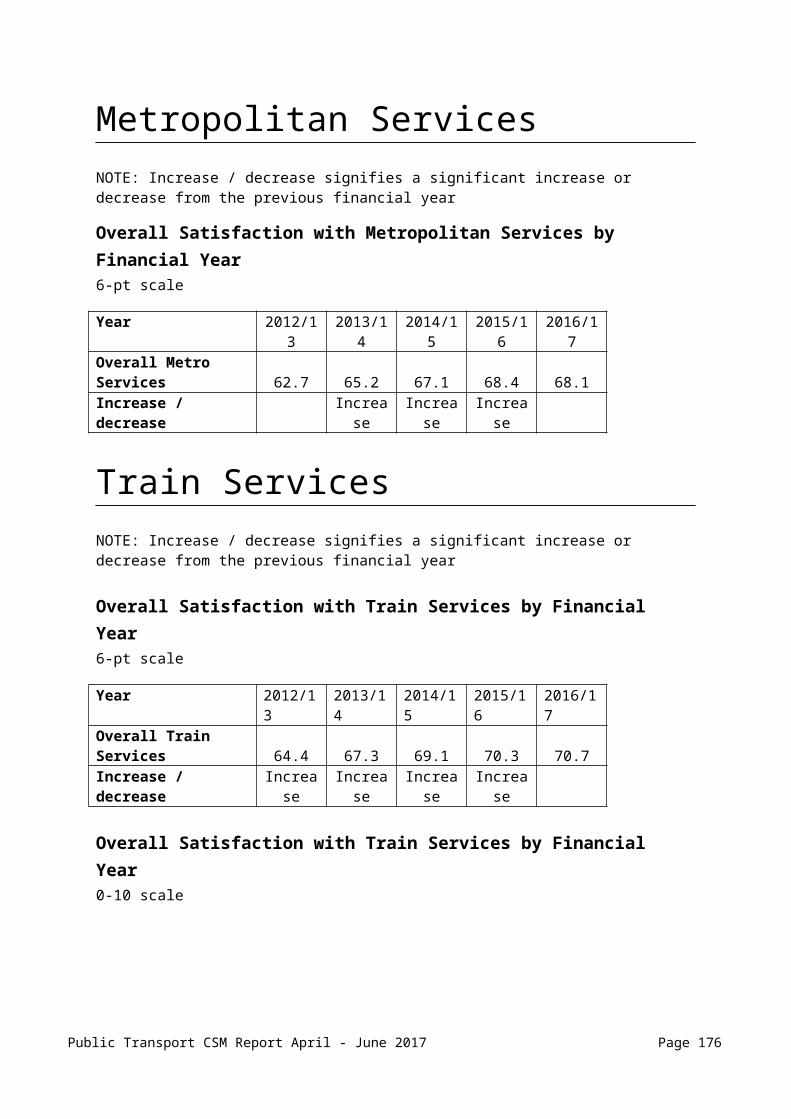
VT36a Thinking about the myki smartcard you are currently using, where do you normally top-up your myki? DO NOT READ OUT
MULTICODE01 Train station - ticket office02 Train station - myki vending machine03 On the internet / PTV website (ptv.vic.gov.au)04 Newsagent05 V/Line station06 On board bus07 Auto top-up / direct debit08 7-Eleven 09 PTV Call Centre (1800 800 007)10 Chemist / pharmacy11 PTV Hub (at Southern Cross Station)12 PTV Hub(at 750 Collins St Docklands)13 Tram stop - myki vending machine14 On board tram15 Milk bar16 Bus stop / interchange - myki vending machine17 On board V/Line trains / coaches18 V/Line ticket agent19 Commuter Club (annual pass) / top-up through work / salary package scheme95 Other (SPECIFY)99 Don't know
VT36b Are you using myki money or myki pass for your public transport travel?
INTERVIEWER NOTE: If respondent asks for clarification please provide the following explanation and code accordingly): myki money is a ‘pay as you go’ system. You load a credit on to the card and use that progressively whenever you travel. myki pass is for a continuous block of travel days e.g. one week, month or year for regular travellers.
PROMPT IF NECESSARY
01 Myki money02 Myki pass03 Both99 (DO NOT READ) Don’t know
VT36c Have you registered your myki card which links your name and address to your individual card?
IF YES, ASK: Where did you register your myki card?
PROMPT IF NECESSARY
01 Yes – on the internet / PTV website (ptv.vic.gov.au)02 Yes – PTV Call Centre (1800 800 007)03 Yes – mailed a myki Registration Form04 Yes – registered at metropolitan retail outlets (e.g. Southern Cross PTV Hub / 7-
Eleven)05 Yes – pre-registered myki card sent to pensioners06 Yes- pre registered through Commuter Club / work / salary package scheme07 No GO TO PRE
VT36e
Public Transport CSM Report April - June 2017 Page 176
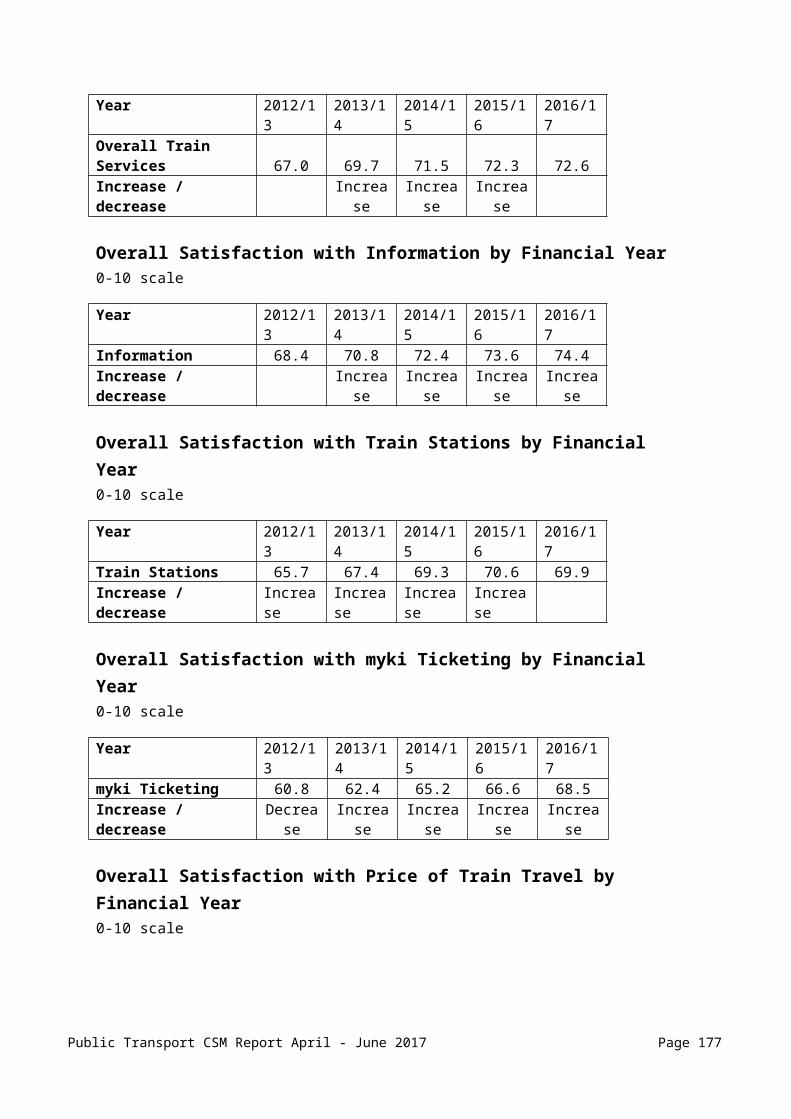
99 (DO NOT READ) Don’t know GO TO PRE VT36e
VT36d Have you ever accessed your myki transaction records or travel details?
IF YES, ASK: Where did you access them?
PROMPT IF NECESSARY
MULTICODE01 Yes – on the internet / PTV website (ptv.vic.gov.au)02 Yes – myki vending machine03 Yes – myki check machine (small blue-coloured device)04 No99 (DO NOT READ) Don’t know
PRE VT36E IF VT36A=3 OR CODE 1 AT VT36C / VT36D, AUTOCODE VT36E WITH CODE 1 THEN GO TO VT37. ELSE, CONTINUE
VT36e Have you ever used the PTV website (ptv.vic.gov.au)?
PROMPT IF NECESSARY
01 Yes 02 No99 (DO NOT READ) Don’t know
VT37 Now, I would like you to ask about your satisfaction with the V/Line myki ticketing system. On the 0 to 10 scale, how satisfied are you with...
PROMPT IF NECESSARY
ROTATE GROUPSa The amount of ticketing information provided at stations about myki?b The ease of understanding the myki ticketing system?
c The ease of being able to top-up your myki when you need to?d There being sufficient places where you can top-up your myki?
e The accuracy of the fares that myki automatically calculates based on your travel?f[IF VT36d = 1, 2, OR 3] The accuracy of your transaction records or travel details?
g The ease of touching on and touching off using myki?
z So, thinking of all these aspects, how satisfied are you with the myki TICKETING system overall?
MYKI USERS GO TO VT15
Public Transport CSM Report April - June 2017 Page 177

VT14 Now, I would like you to ask about your satisfaction with the V/Line PAPER TICKETING system. On the 0 to 10 scale, how satisfied are you with...
PROMPT IF NECESSARY
ROTATE GROUPSa The ease of understanding the current V/Line ticketing system?b The range of ticket types available?
c The ease of being able to purchase a ticket when you need to? d There being sufficient places where you can purchase tickets?
e The frequency with which tickets are checked on board?
z So, thinking of all these aspects, how satisfied are you with V/LINE TICKETING overall?
Price
VTI5 Now, thinking just about the price you pay for V/Line trains, how satisfied are you with the PRICE of train travel using V/Line?
Seat Reservation
VT16a In the past six months, have you used the seat reservation service for any of your V/Line train services?
PROMPT IF NECESSARY
01 Yes02 No GO TO VT1899 (DO NOT READ) Don’t know GO TO VT18
VT16b How did you reserve your seat? Was it…
READ OUT
MULTICODE01 In person at a V/Line train station02 In person at a Melbourne train station03 Via V/Line call centre 04 Via V/Line on-line booking 05 Via local V/Line 95 (DO NOT READ) Other (SPECIFY)99 (DO NOT READ) Don’t know
VT17 Thinking of all aspects of the reservation service, including the reservation staff you dealt with and that you were able to sit in your allocated seat, how satisfied are you with the SEAT RESERVATION SERVICE overall?
Public Transport CSM Report April - June 2017 Page 178

Train Stations
VT18 Now, I would like you to rate your level of satisfaction with aspects of the V/LINE TRAIN STATIONS you have used in the past six months. On the 0 to 10 scale, how satisfied are you with…
PROMPT IF NECESSARY
ROTATE GROUPSa The level of lighting provided?
b The amount of seating and shelter at stations?c The maintenance of facilities provided, such as shelter and seating?
d The general cleanliness and amount of litter at V/Line train stations? e The cleanliness of toilets at V/Line stations?fThe level of graffiti at train stations?
g The amount of car parking provided?h [IF VT6= 4] The bicycle storage facilities? i[IF VT6 = 5] The bus-interchange facilities?
z So, thinking of all these aspects, how satisfied are you with V/LINE TRAIN STATIONS overall?
Public Transport CSM Report April - June 2017 Page 179
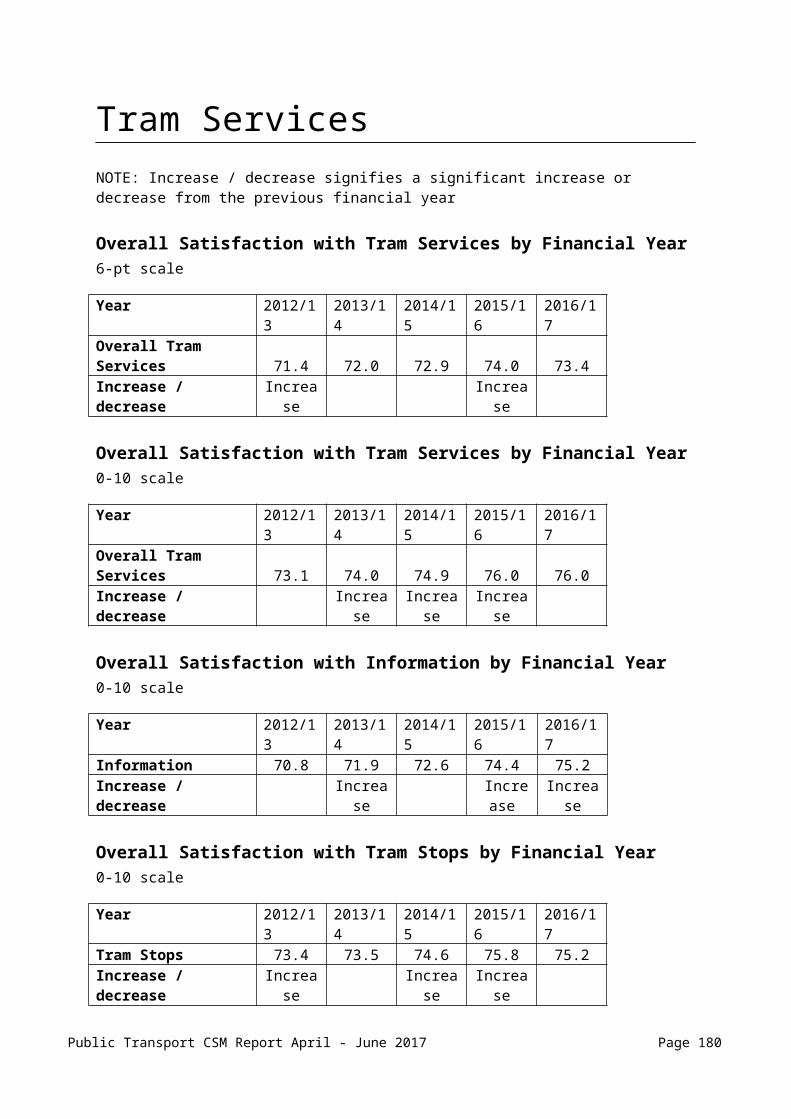
How Train Services are Run
VT19 Now, I would like you to rate your level of satisfaction with the OPERATIONAL running of the V/Line train services that you have experienced in the past six months. Using the 0 to 10 scale, how satisfied are you with…
INTERVIEWER NOTE:
Peak times are considered to be 7am to 9.00 am and 4.00 pm to 6pm weekdays
Off peak times are considered to be during the week after 9am to 4pm and after 6pm – and all times on weekends and public holidays
PROMPT IF NECESSARY
ROTATE GROUPSa The trains running on time?b The hours of operation of train services?
c The time your train journeys generally take once you are on board
d [IF VT5A OR VT5B= 2 OR 4] The frequency of scheduled weekday peak services?
e [IF VT5A OR VT5B = 1, 3 OR 5] The frequency of scheduled weekday off-peak services?
f[IF VT5A OR VT5B = 6 OR 7] The frequency of scheduled weekend services?g The frequency of late night services? h [IF VT7 = 1] The frequency of train services to and from special events?
iThe reliability of connections to other V/Line rail services?
jThat you are generally able to get on to your first train that arrives
k The number of trains that are cancelled?
z So, thinking of the operational performance of train services in terms of frequency, on-time performance and time taken to travel, how satisfied are you with HOW V/LINE TRAIN SERVICES ARE RUN overall?
Public Transport CSM Report April - June 2017 Page 180

Experience of travelling on trains
VT21 Now, I would like you to rate your level of satisfaction with your experience when on board trains in the past six months. On the 0 to 10 scale, how satisfied are you with:
PROMPT IF NECESSARY
ROTATE GROUPSa The temperature of the carriages?
[IF VT21A<6 THENa2 Is it too hot or too cold?
DO NOT READ OUT01 Too hot02 Too cold03 Other99 Don’t know]
b The maintenance and cleanliness of the interior of carriages? c The cleanliness of the toilets on board V/Line trains?
d The smoothness of the ride?
e The comfort of the seats?
fThe comfort of the train if you have to stand?g The amount of space allocated for standing in trains?h There being enough accessible grab handles and poles for you to hang on to?
iThe facilities for storing personal items?jThere being sufficient space for bicycle and other larger items on trains?
k The level of crowding on the train at the times you travel?
lThat it is easy for you to get off the train?
z So, thinking of all these aspects, how satisfied are you with the DESIGN AND COMFORT of V/Line’s trains overall?
Refreshments
VT23a Have you been on a long haul service with refreshments in the past six months?
PROMPT IF NECESARY
01 Yes02 No GO TO VT2499 (DO NOT READ) Don’t know / can’t remember GO TO VT24
VT23b On the 0 to 10 scale, how satisfied are you with the REFRESHMENTS available when travelling by V/Line overall?
Public Transport CSM Report April - June 2017 Page 181

Train Staff
IF VT10A=2 OR VT16B=1, AUTOCODE VT24 WITH CODE 1 AND GO TO VT25
VT24 Have you had contact with V/Line staff at stations in the past six months?
PROMPT IF NECESSARY
01 Yes02 No GO TO VT2699 (DO NOT READ) Don’t know / can’t say GO TO VT26
VT25 Thinking about the V/Line staff at stations you have had contact with in the past six months, on the 0 to 10 scale, how satisfied are you with V/Line STATION STAFF overall?
ASK ALL TRAIN QUOTAVT26 Now about any V/Line conductors you have had contact with in the past six months.
On the 0 to 10 scale, how satisfied are you with V/Line CONDUCTORS overall?
Personal Security
VT29 Now, I’d like you to rate your level of satisfaction with your feelings of PERSONAL SECURITY when you travel by train.
On the 0 to 10 scale, how satisfied are you with...
PROMPT IF NECESSARY
ROTATE GROUPS a Your feelings of personal security when travelling on V/Line trains during the day? b Your feelings of personal security when travelling on V/Line trains after dark?
c Your feelings of personal security at V/Line train stations during the day?d Your feelings of personal security at V/Line train stations after dark?
e The presence and visibility of security cameras on trains and at stations?fThe steps taken to control unruly passengers when on board the train?
z So, thinking of all these aspects, how satisfied are you with your feelings of PERSONAL SECURITY on V/Line overall?
Overall
VT30 So, using the same scale again, and taking into consideration all the aspects of the service we have discussed, and any others of importance to you, how satisfied are you with V/Line train services overall?
Public Transport CSM Report April - June 2017 Page 182

VT31 I’d like you to think about any changes that may have occurred in the last 12 months with V/Line’s TRAIN service. Would you say that the TRAIN service is now…
READ OUT
01 Much better (than twelve months ago)02 A little better (than twelve months ago)03 The same04 A little worse (than twelve months ago)05 Much worse (than twelve months ago)06 (DO NOT READ) Did not use it twelve months ago99 (DO NOT READ) Don’t know
VT32 In the past six months, have you seriously considered reducing your use of trains in favour of other means of transport?
PROMPT IF NECESSARY
01 Yes02 No99 (DO NOT READ) Don’t know
VT33 On a scale of 0 to 10, where 0 is no likelihood and 10 is extremely likely, how likely would you be to recommend V/Line’s train services to someone else?
GO TO DEMOGRAPHICS SECTION
Public Transport CSM Report April - June 2017 Page 183
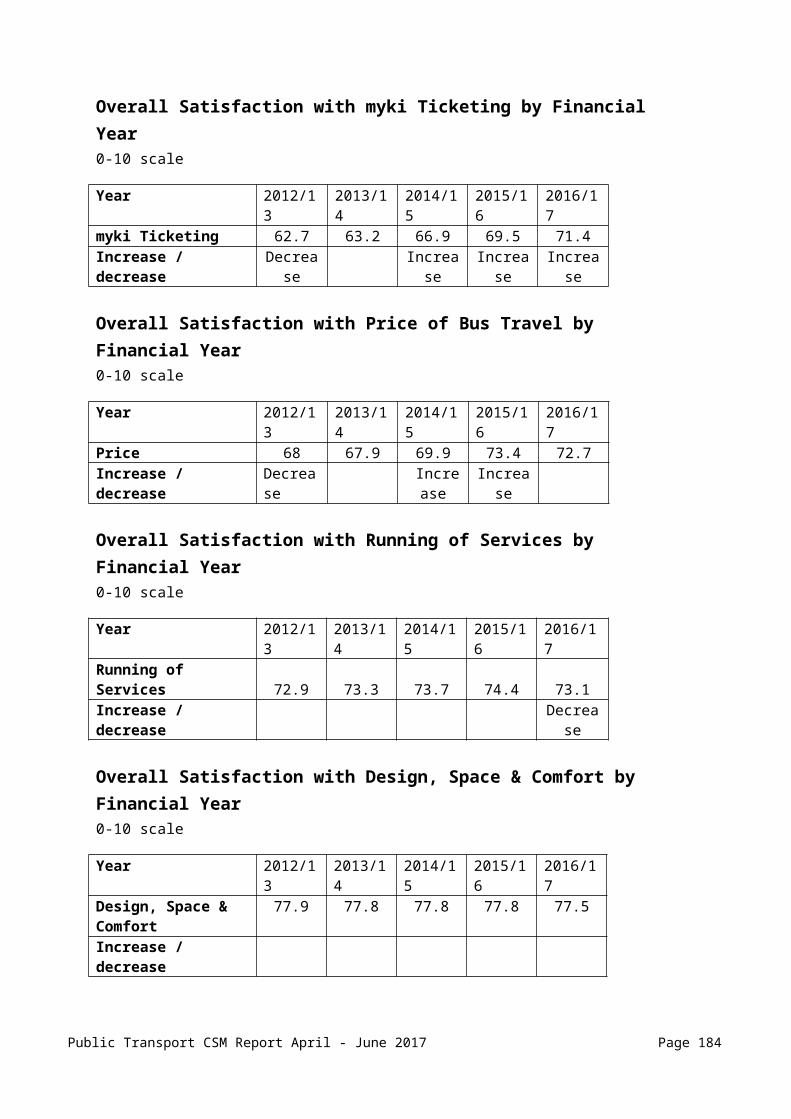
COACHES SECTION
VC2 How do you identify or describe a V/Line Coach?
DO NOT READ OUT
PROBE FULLY
INTERVIEWER NOTE: refer to photos - but do not prompt
MULTICODE01 V/Line name on side - written on side GO TO VC4A02 The V symbol GO TO VC4A03 Mostly White with Red/burgundy & blue GO TO VC4A04 Mostly White with red & purple GO TO VC4A05 Name on the ticket GO TO VC4A06 Name on staff uniforms GO TO VC4A95 Other - CORRECT response (SPECIFY) GO TO VC4A96 INCORRECT response (SPECIFY)99 (DO NOT READ) Don’t know FIRST RESPONSE ONLY
VC3 For this survey we need to talk to people who have used V/Line coaches. Is there anything about V/Line coaches that you can describe?
DO NOT READ OUT
01 Yes - Correct description02 Yes - Incorrect description CLOSE599 No - still don't know CLOSE5
CLOSE 5: Thank you for your time today. Unfortunately, to distinguish users of V/Line with other regional transport services, this survey is only for those who can correctly identify V/Line Coaches.
VC4a When travelling from home, at which town do you most frequently board the coach?
PROBE FULLY
MULTICODE01 Type in name of TOWN (SPECIFY)99 (DO NOT READ) Don’t know / Can't Say
VC4b And for your most typical journey from home, at which town do you most often get off?
MULTICODE01 Type in name of TOWN (SPECIFY)99 (DO NOT READ) Don’t know / Can't Say
Public Transport CSM Report April - June 2017 Page 184

VC5a What times of day do you generally travel by coach? Do you mostly travel…?
INTERVIEWER NOTE: TIMES REFER TO JOURNEY START TIMES
READ OUT
MULTICODE01 Weekdays before 7am? (Weekdays 4:00 AM to 7:00 AM)02 Weekdays between 7 – 9am? (Weekday morning peaks)03 Weekdays between 9am – 4.00pm? (Morning and afternoon off-peaks)04 Weekdays between 4 – 6pm? (Weekday afternoon peaks)05 Weekdays between 6pm – 2am? (Weekday evenings) 06 Weekends during day time07 Weekends during night time08 (DO NOT READ) It varies99 (DO NOT READ) Can’t say
VC5b IF CODE 1-7 AT VC5A And what other days and times do you travel by coach?
IF CODE 8 OR 99 AT VC5A Have you ever travelled by V/Line coach on…?
INTERVIEWER NOTE: TIMES REFER TO JOURNEY START TIMES
READ OUT
MULTICODE01 Weekdays before 7am? (Weekdays 4:00 AM to 7:00 AM)02 Weekdays between 7 – 9am? (Weekday morning peaks)03 Weekdays between 9am – 4.00pm? (Morning and afternoon off-peaks)04 Weekdays between 4 – 6pm? (Weekday afternoon peaks)05 Weekdays between 6pm – 2am? (Weekday evenings) 06 Weekends during day time07 Weekends during night time08 (DO NOT READ) It varies97 (DO NOT READ) None – no other times99 (DO NOT READ) Can’t say
IF VC5A OR VC5B=07 ASK VC5BI, ELSE GO TO VC6VC5Bi Have you caught a ‘Night Network’ coach service since they began on the first of
January?
INTERVIEWER NOTE: ‘Night Network’ coaches depart from Southern Cross Station around 2am, bound for Bendigo, Ballarat, Traralgon and Geelong.
PROMPT IF NECESSARY
01 Yes02 No
VC6 How do you usually get to the V/Line coach stop to begin your journey?
DO NOT READ OUT
PROBE FULLY
MULTICODE01 Walk02 Drive car and park03 Get a lift with someone else04 Cycle
Public Transport CSM Report April - June 2017 Page 185

05 Bus06 Tram07 Taxi08 V/ Line train95 Other (SPECIFY)97 It varies – no usual method
VC7 Have you caught a V/Line coach to or from a special event, such as concert, festival or sporting event in the past six months?
PROMPT IF NECESSARY
01 Yes02 No99 (DO NOT READ) Don’t know
VC0 Overall, are you satisfied or dissatisfied with V/Line COACH services?
WAIT FOR RESPONSE: Is that totally, very, or somewhat?
DO NOT READ OUT
01 Totally satisfied02 Very satisfied03 Somewhat satisfied04 Somewhat dissatisfied05 Very dissatisfied06 Totally dissatisfied99 (DO NOT READ) Don’t know
VC8a In the past six months, have you significantly increased or decreased your use of V/Line coaches?
PROMPT IF NECESSARY
01 Significantly increased 02 Significantly decreased03 Stayed about the same04 Only started to use coaches in last 6 months99 (DO NOT READ) Don’t know / Hard to say
VC8b In the next six months, would you expect your use of V/Line coaches to…?
READ OUT
01 Significantly increase 02 Significantly decrease03 Stay about the same99 (DO NOT READ) Don’t know / Hard to say
Public Transport CSM Report April - June 2017 Page 186
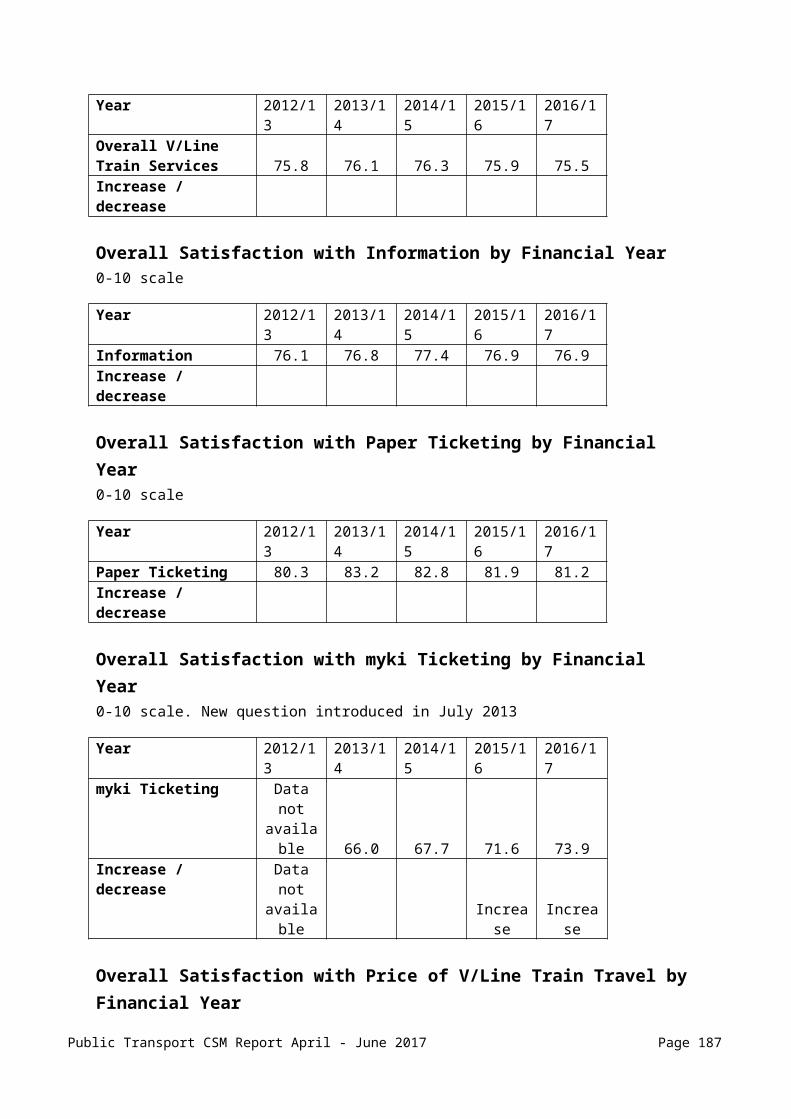
SATISFACTION QUESTIONS
Information
VC9 Where do you USUALLY access coach timetable or journey information?
PROMPT: Anywhere else?
DO NOT READ OUT
MULTICODE01 At coach stops02 Printed timetables from coach stops03 V/Line Call Centre (136 169)04 V/Line website 05 Internet (computer) –/ PTV website06 SMS updates07 Smartphone application –PTV08 Smartphone application – third party09 Smartphone application – web browser10 At train stations11 Newsagent / post office / milk bar12 Local newspapers13 Tourist information centre14 Coach driver95 Other (SPECIFY)97 Don’t use timetables99 (DO NOT READ) Don’t know
VC10 Now I am going to ask you to rate various aspects of V/Line coach service using a 0 to 10 scale. 0 means Extremely Dissatisfied and 10 means Extremely Satisfied. If a question is not relevant to you, please say so
Firstly, I would like you to rate your level of satisfaction with aspects of the INFORMATION provided about V/Line coach services. On the 0 to 10 scale, how satisfied are you with:
PROMPT IF NECESSARY
ROTATE GROUPSa Ease of understanding timetable information? b The availability of up-to-date printed timetable information at coach stops?
c The number of announcements at stops and on coaches?d The clarity of announcements at stops and on coaches?
e The amount of information provided when V/Line coaches are cancelled or delayed?f The availability of information provided when there is a planned alteration to V/Line coach services, such as for road works?
g [IF VC9A = 3] The quality of information from the V/Line call centre? h [IF VC9A= 4] The quality of information from the V/Line website? i [IF VC9A = 5] The quality of information from the / PTV website? j [IF VC9 = 07] The quality of information from the PTV app?
Public Transport CSM Report April - June 2017 Page 187

z So, thinking of all these aspects, how satisfied are you with the INFORMATION provided about V/Line coach services overall?
Ticketing
VC12 Now, I would like you to ask about your satisfaction with the current V/Line TICKETING system. On the 0 to 10 scale, how satisfied are you with...
PROMPT IF NECESSARY
ROTATE GROUPSa The ease of understanding the current V/Line ticketing system?b The range of ticket types?
c The ease of being able to purchase a ticket when you need to? d There being sufficient places where you can purchase tickets?
z So, thinking of all these aspects, how satisfied are you with V/LINE TICKETING overall?
Price
VC13 Now, thinking just about the price you pay for V/Line coach tickets, how satisfied are you with the PRICE of coach travel using V/Line?
Seat Reservation
VC14a In the past six months, have you used the seat reservation service for any of your V/Line coach services?
PROMPT IF NECESSARY
01 Yes02 No GO TO VC1699 (DO NOT READ) Don’t know GO TO VC16
VC14b How did you reserve your seat? Was it…
READ OUT
MULTICODE01 In person at a V/Line coach stop02 In person at a Melbourne train station03 Via V/Line call centre 04 Via V/Line on-line booking 05 Via local V/Line 95 (DO NOT READ) Other SPECIFY99 (DO NOT READ) Don’t know
VC15 Thinking of all aspects of the reservation service, including the reservation staff you dealt with and that you were able to sit in your allocated seat, how satisfied are you with the SEAT RESERVATION SERVICE overall?
Public Transport CSM Report April - June 2017 Page 188
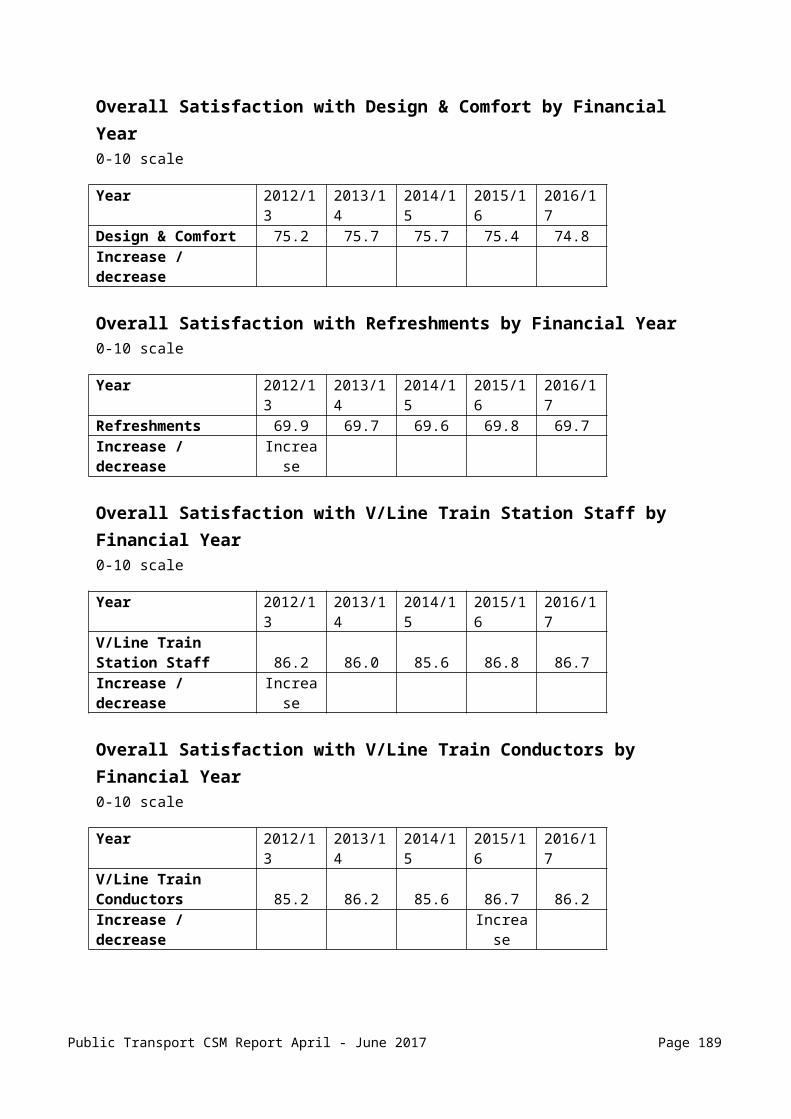
Coach Stops
VC16 I would like you to rate your level of satisfaction with aspects of the COACH STOPS you have used in the past six months. On the 0 to 10 scale, how satisfied are you with…
PROMPT IF NECESSARY
ROTATE GROUPSa The level of lighting provided?
b The amount of seating and shelter at stops?c The maintenance of facilities provided, such as shelter and seating?
d The general cleanliness and amount of litter at coach stops? e The cleanliness of toilets at V/Line coach stops? fThe level of graffiti at coach stops?
g The amount of car parking provided?
z So, thinking of all these aspects, how satisfied are you with V/LINE COACH STOPS overall?
How Coach Services are Run
VC18 Now, I would like you to rate your level of satisfaction with the OPERATIONAL running of the V/Line coach services that you have experienced in the past six months. Using the 0 to 10 scale, how satisfied are you with… INTERVIEWER NOTE:
Peak times are considered to be 7am to 9.00 am and 4.00 pm to 6pm weekdays
Off peak times are considered to be during the week after 9am to 4pm and after 6pm – and all times on weekends and public holidays
PROMPT IF NECESSARY
ROTATE GROUPSa That coaches are scheduled to depart when it suits you?b The coaches running on time?c The hours of operation of coach services?
d The time your coach journeys generally take once you are on board?
e The number of coaches that are cancelled?
f[IF VC5A OR VC5B= 2 OR 4] The frequency of scheduled weekday peak services?
g [VC5A OR VC5B = 1, 3 OR 5]The frequency of scheduled weekday off-peak services?
h [VC5A OR VC5B = 6 OR 7]The frequency of scheduled weekend services? iThe frequency of late night services?j[IF VC7 = 1]The frequency of coach services to and from special events?
k The ease of making connections to V/Line train services?
Public Transport CSM Report April - June 2017 Page 189
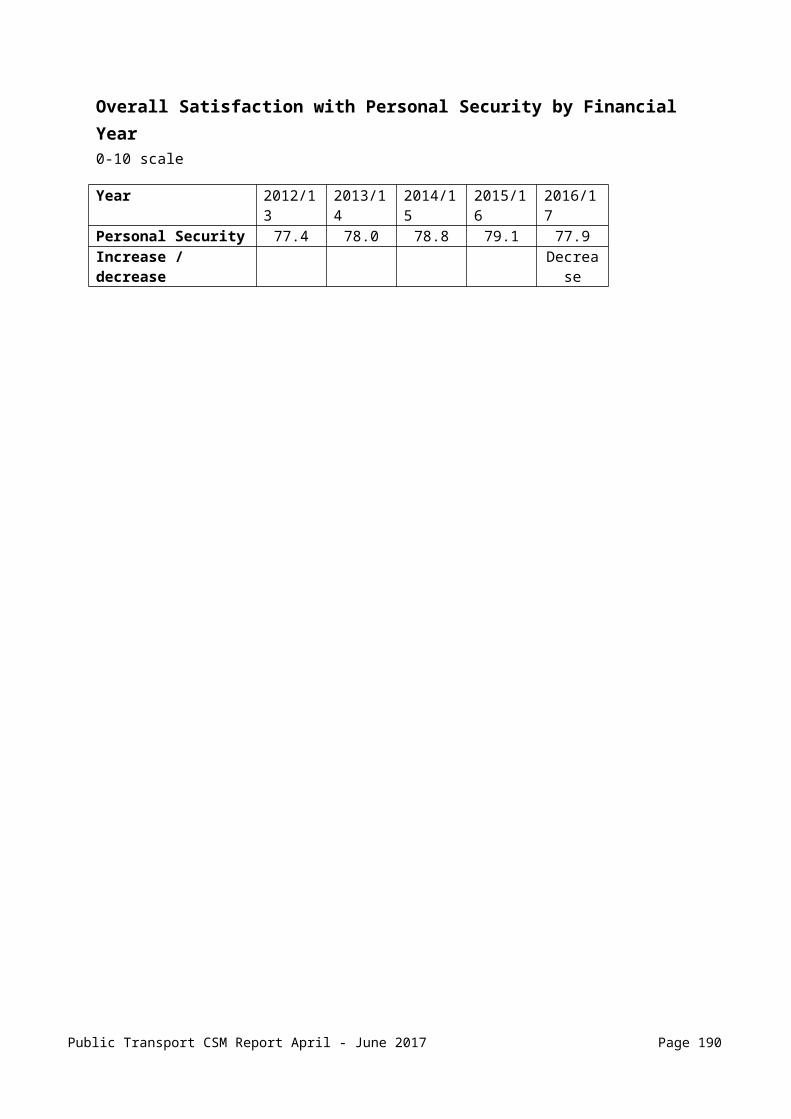
z So, thinking of the operational performance of coach services in terms of frequency, on-time performance and time taken to travel, how satisfied are you with HOW V/LINE COACH SERVICES ARE RUN overall?
Experience of travelling on coaches
VC19 Now, I would like you to rate your level of satisfaction with your experience when on board coaches in the past six months. On the 0 to 10 scale, how satisfied are you with…
PROMPT IF NECESSARY
ROTATE GROUPSa The maintenance and cleanliness of the interior of coaches? b The cleanliness of the toilets on board V/Line coaches?
c The smoothness of the ride?
d The comfort of the seats?
e There being enough accessible grab handles and poles for you to hang on to?
fThe facilities for storing personal items?g There being sufficient space for larger items inside coaches?
h The level of crowding on the coach at the times you travel?
iThat it is easy for you to get off the coach?
z So, thinking of all these aspects, how satisfied are you with THE DESIGN AND COMFORT OF COACHES overall?
Public Transport CSM Report April - June 2017 Page 190

ASK ALL COACH QUOTAVC21 Now, I would like you to rate your level of satisfaction with any V/Line coach drivers
you have had contact with in the past six months. On the 0 to 10 scale, how satisfied are you…
PROMPT IF NECESSARY
ROTATEa With the courtesy and helpfulness of V/Line coach drivers?b With the appearance of V/Line coach drivers
c That coach drivers are able to provide appropriate service, timetable and ticketing information if asked?
d That V/Line coach drivers drive coaches safely and smoothly?e That coach drivers check tickets in an appropriate manner?
f That coach drivers maintain comfortable temperature inside the coaches? [IF VC21F<6 THEN f2 Is that too hot or too cold?
DO NOT READ OUT01 Too hot02 Too cold03 Other99 Don’t know]
z And how satisfied are you with V/LINE COACH DRIVERS overall?
Personal Security
VC24 Now, I’d like you to rate your level of satisfaction with your feelings of PERSONAL SECURITY when you travel by coach.
On the 0 to 10 scale, how satisfied are you with…
PROMPT IF NECESSARY
ROTATE GROUPSa Your feelings of personal security when travelling on V/Line coaches during the day? b Your feelings of personal security when travelling on V/Line coaches after dark?
c Your feelings of personal security at V/Line coach stops during the day?d Your feelings of personal security at V/Line coach stops after dark?
e The presence and visibility of security cameras on coaches and at coach stops? fThe steps taken to control unruly or antisocial passengers when on board the coach?
z So, thinking of all these aspects, how satisfied are you with your feelings of PERSONAL SECURITY on V/Line overall?
Overall
VC25 Using the same scale again, and taking into consideration all the aspects of the service we have discussed, and any others of importance to you, how satisfied are you with V/Line coach services overall?
Public Transport CSM Report April - June 2017 Page 191
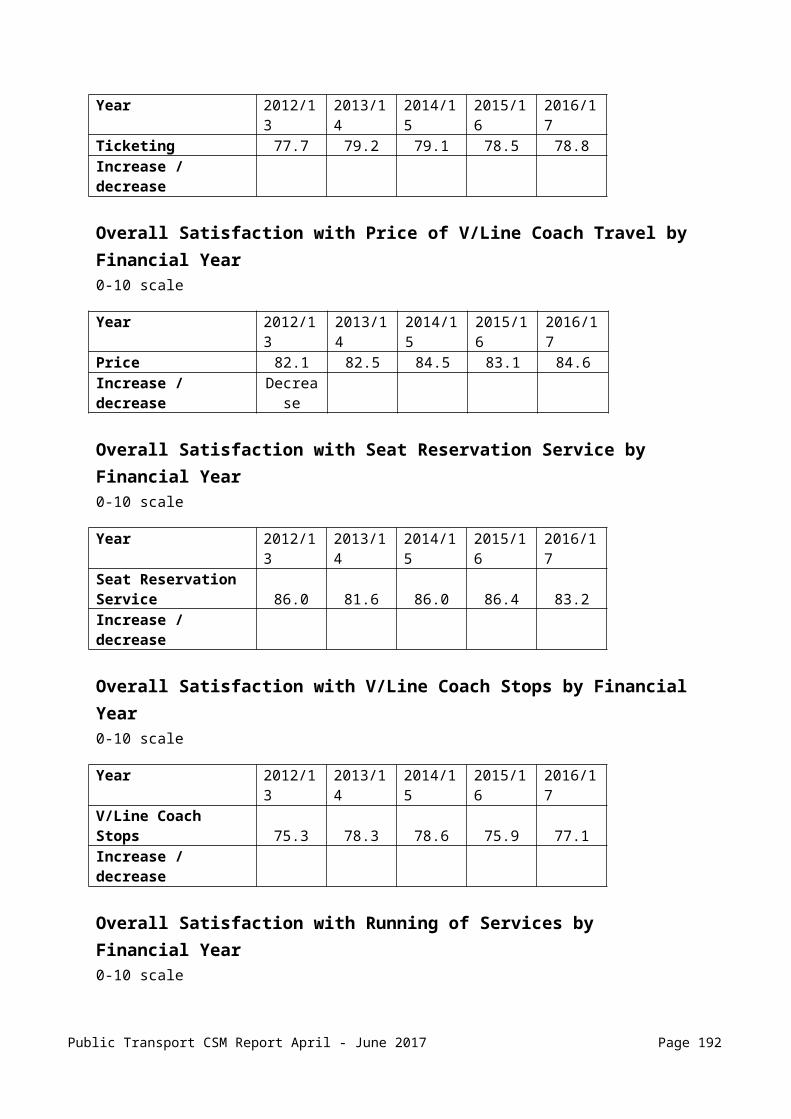
IF VC5BI=01 CONTINUE, ELSE GO TO VC26VC25a Thinking just about your experience with ‘Night Network’, how satisfied are you with
‘Night Network’ overall?
VC26 I’d like you to think about any changes that may have occurred in the last 12 months with V/Line’s COACH service. Would you say that the COACH service is now…
READ OUT
01 Much better (than twelve months ago)02 A little better (than twelve months ago)03 The same04 A little worse (than twelve months ago)05 Much worse (than twelve months ago)06 (DO NOT READ) Did not use it twelve months ago99 (DO NOT READ) Don’t know
VC27 In the past six months, have you seriously considered reducing your use of coaches in favour of other means of transport?
PROMPT IF NECESSARY
01 Yes02 No99 (DO NOT READ) Don’t know
VC28 On a scale of 0 to 10, where 0 is no likelihood and 10 is extremely likely, how likely would you be to recommend V/Line’s coach services to someone else?
DEMOGRAPHICS SECTION
ASK A2 – A3 IN APR-JUN 2017 A2 The public transport industry has an independent body to deal with unresolved
customer complaints involving public transport. Do you know what the body is called?
01 Yes – Public Transport Ombudsman GO TO D1 95 Yes – other (SPECIFY) 02 No 99 (DO NOT READ) Don’t know
A3 Have you heard of the Public Transport Ombudsman?
01 Yes 02 No 99 (DO NOT READ) Don’t know
ASK ALL
D1 Now we have just a few questions to help us analyse the survey answers. Firstly, which of the following best describes the composition of your household?
READ OUT
01 Family or single parent with children under the age of 5
Public Transport CSM Report April - June 2017 Page 192

02 Family or single parent with school age children at home03 Family with older children at home04 Couple whose children have now left home05 Married couple or couple in de facto relationship with no children06 A single person living alone07 Shared household of unattached people95 Other (SPECIFY)98 (DO NOT READ) Refused/Can’t say
D2 And in which year were you born?
RECORD FOUR-DIGIT YEAR; 1900-1999
[ANALYST: CREATE A CONSTRUCTION FOR AGE VARIABLE BASED ON THIS]
D3 What was your main activity in the last week?
READ OUT
01 Full time work (30+ hours per week)02 Part time work (8-29 hours per week)03 Retired GO TO D504 Home duties GO TO D505 Student attending formal education GO TO D506 Unemployed, looking for work GO TO D507 Have a job but away for vacation, illness, strike etc GO TO D508 Permanent invalid, not seeking work GO TO D595 Other (SPECIFY) GO TO D598 (DO NOT READ) Refused GO TO D5
D4 What is your occupation?
RECORD FULL DETAILS
D5 Do you have access to a car for your own personal use when needed?
PROMPT IF NECESSARY
01 Yes02 No03 Other response99 (DO NOT READ) Don’t know
D5i Would you be interested in participating in further research regarding public transport in the future?
PROMPT IF NECESSARY
01 Yes GO TO Q5II02 No GO TO CLOSE
D5ii Can I confirm your phone number, email address and name?
PROMPT IF NECESSARY
01 Name:02 Phone Number:
Public Transport CSM Report April - June 2017 Page 193

03 Email Address:
CONFIRM POSTCODE
CLOSE: That was my final question. On behalf of Public Transport Victoria, V/Line, and Wallis Market & Social Research, thanks for your help. Your views count and we’re glad you made them known to us. Just in case you missed it, my name is (INTERVIEWER STATE NAME), and I am from Wallis. If you have any questions about this survey you may contact the Australian Market and Social Research Society on 1300 364 830. If you’d like to see a copy of our Privacy Policy you can find it on our website at www.wallisgroup.com.au /privacy
Public Transport CSM Report April - June 2017 Page 194

QUALITY CONTROL SECTION
Q1 INTERVIEWER CODE: Please rate the level of the respondent’s interest in this survey. How involved did the respondent appear to be?
01 High02 Average03 Low
Q2 INTERVIEWER CODE: Please rate the quality of communication with the respondent (i.e. How well did the respondent appear to understand the questions?)
01 High02 Medium03 Low
Public Transport CSM Report April - June 2017 Page 195