miin · web viewintroduction to probability & data analysis what you’ll learn......
TRANSCRIPT

Math Unit 7
Introduction to Probability & Data Analysis
+ I understand what this is and can do it very well√ I understand and can do most of this
− I have some trouble with this× I have a big problem with this
What You’ll Learn...• Graph relationships and analyze surveys, charts and tables.• Find mean, median, mode and range of a set of data.• Determine the effect of an outlier on mean, median and mode.• Determine the most appropriate average for report findings.• Express ratios, fractions and percents.• Identify the sample space for an experiment involving two
independent events.• To use tables and diagrams to organize outcomes• To compare experimental and theoretical probability• To predict the probability of events• To connect probability operations to the real world.
Why is it important?• You see data and their interpretations in the media. You need to
understand how to interpret this data.• When you enter a contest, especially MacDonald’s Monopoly, you
want to know how a 1:2,304,344 chance of winning an iPhone will affect you.
• You need to be able to make sense of comments in the media relating to probability.
• When you are asked to conduct a survey, you will understand its purely theoretical nature, as well as the significance of outliers.

Math Unit 7
Pre-quiz
check in
Lesson Key WordsPractice
Questions/ Projects
HW Check
Post-quiz
check in
7.1 Graphs and Data Bar graphs Double bar graph Line graphs Tallies and frequencies Circle graphs Bias in a sample of census Designing, displaying and
analyzing a survey
SpreadsheetBar graphTalliesLine graphCircle graphCensusBiassurvey
14-15
19
23
7.2 Mean, median and Mode
Surveys The measure of central
tendency Spreadsheets Making predictions Data sets Reading tables
ModeCentral tendencyAverageMeanMedianRangeRodsProbability
31
43-44
7.4 Types of Probability Represent probability Determine probability Organize outcomes Tree diagram Independent events Application
Impossible eventsCertain eventsFavourable outcomesPossible outcomesTree diagramSamples spaceIndependent events
49
Project
Review Conduct Experiments Create a spreadsheet in
Excel Crack the Code
Unit 7 Quiz
2

Math Unit 7
7.1 Graphs, Tables and Data analysisInvestigate (textbook. 374-75) What are all the ways we represent data?
Inquiry Project: http://nces.ed.gov/nceskids/createagraph/
1. Log on the Learning With NCES website.2. Explore “Create a Graph Classic”.
a. Answer the questions on the following page3. Explore “Create a Graph Tutorial” and “Examples”.4. Create a PowerPoint presentation that teaches someone how to
create ONE of the graph examples provided (area, bar, line, pie)a. Design a graph to present in your PowerPoint. You will need:
i. a driving questionii. to conduct a survey to collect data
5. Present your PowerPoint to the class
Name as many ways of representing data as possible:
3

Math Unit 7
Create a Graph Classic1. What is the purpose of each type of graph (what does it show):
a. Pie graph: ____________________________________________________________________________________________________________________________________________________________
b. Line graph: ____________________________________________________________________________________________________________________________________________________________
c. Bar graph: ____________________________________________________________________________________________________________________________________________________________
d. Area graph: ____________________________________________________________________________________________________________________________________________________________
2. Describe the pattern on a:a. Pie graph:
____________________________________________________________________________________________________________________________________________________________
b. Line graph: ____________________________________________________________________________________________________________________________________________________________
c. Bar graph: ____________________________________________________________________________________________________________________________________________________________
d. Area graph: ____________________________________________________________________________________________________________________________________________________________
3. Provide an example of the information each type of graph represents:a. Pie graph:
____________________________________________________________________________________________________________________________________________________________
b. Line graph: _________________________________________________________________
4

Math Unit 7
___________________________________________________________________________________________
c. Bar graph: ____________________________________________________________________________________________________________________________________________________________
d. Area graph: ____________________________________________________________________________________________________________________________________________________________
4. What are the steps needed to create each type of graph:a. Pie graph:
b. Line graph:
c. Bar graph:
d. Area graph:
5
Math Unit 7
Bar GraphsExplore
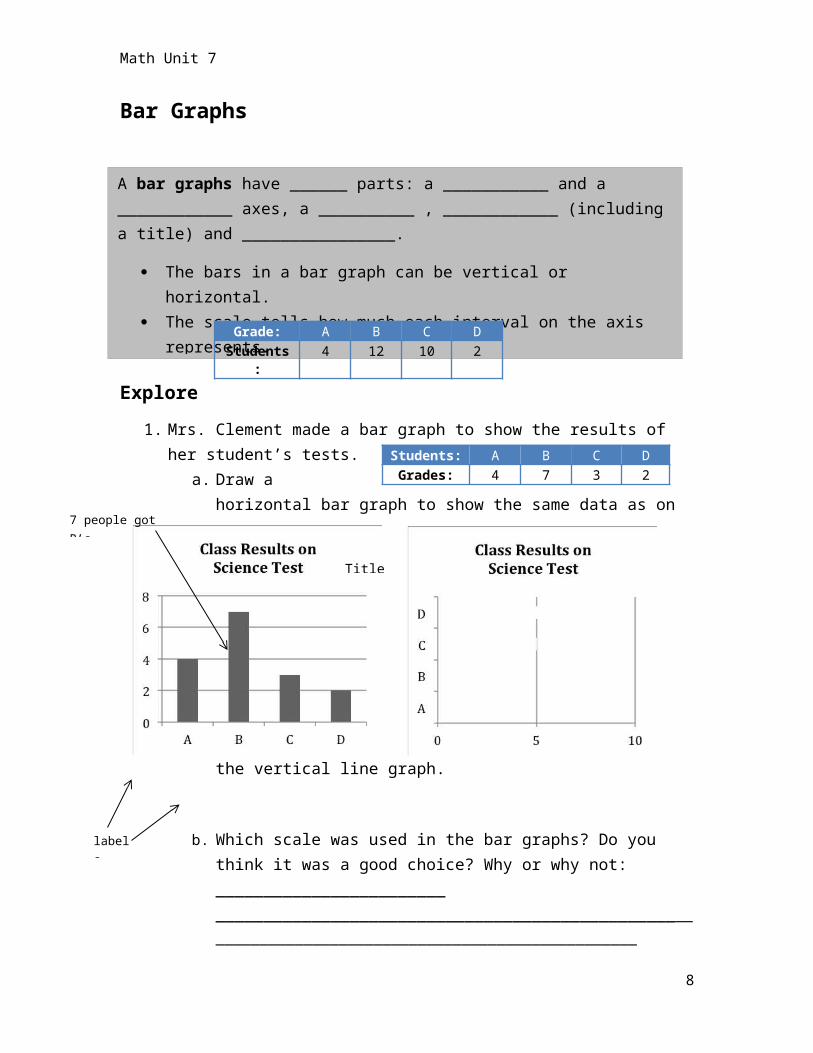
1. Mrs. Clement made a bar graph to show the results of her student’s tests.
a. Dra w
a
horizontal bar graph to show the same data as on the vertical line graph.
b. Which scale was used in the bar graphs? Do you think it was a good choice? Why or why not: ________________________ __________________________________________________________________________________________________
A bar graphs have ______ parts: a ___________ and a ____________ axes, a __________ , ____________ (including a title) and ________________.
The bars in a bar graph can be vertical or horizontal. The scale tells how much each interval on the axis represents. The labels indicate what the data in the bars its.
7 people got B’s
labels
6
Grade: A B C DStudents: 4 12 10 2
Students: A B C DGrades: 4 7 3 2
Math Unit 7
2. Draw a bar graph for each frequency table listed below. For each chart you will need to decide the scale (ex. 2, 4, 6, 8… or 0, 5, 10, 15…)
a. Scale: __1’s__b. Scale: ____c. Scale: ____d. Scale: ____
3. Create a bar graph for the data represented in Question 2.
4. A
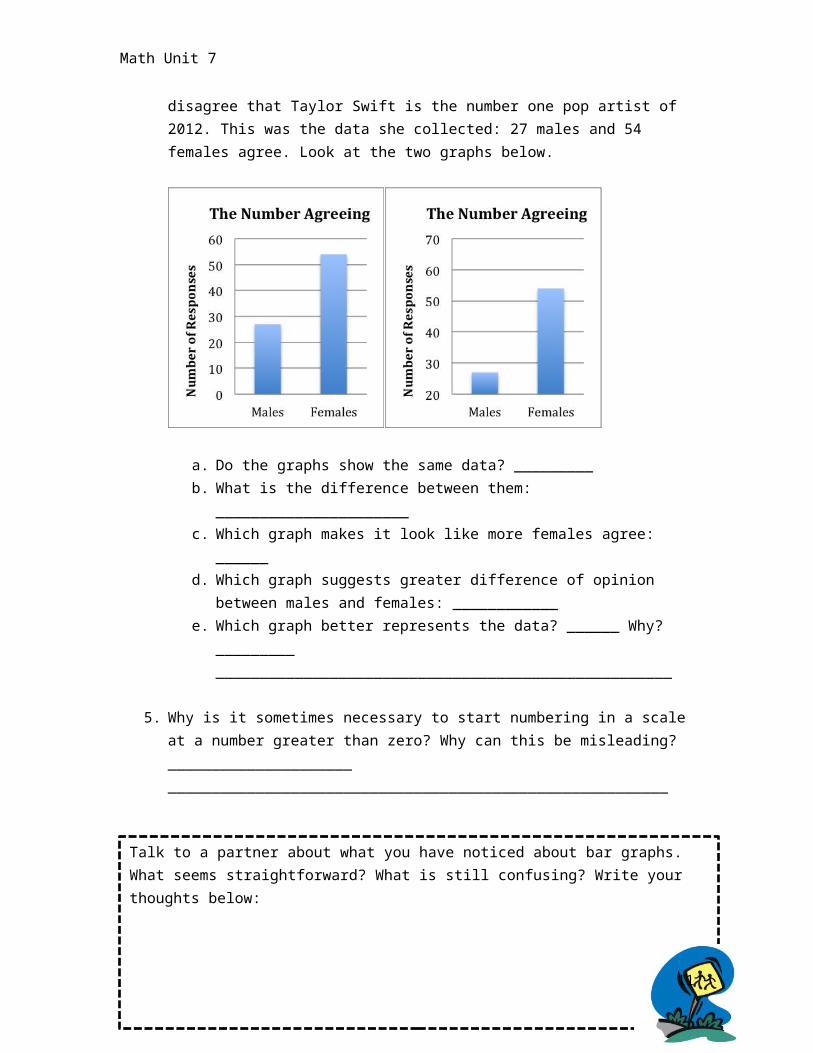
student asks 100 females and 100 males whether they agree or disagree that Taylor Swift is the number one pop artist of 2012. This was the data she collected: 27 males and 54 females agree. Look at the two graphs below.
7
Math Unit 7
a. Do the graphs show the same data? _________b. What is the difference between them: ______________________c. Which graph makes it look like more females agree: ______d. Which graph suggests greater difference of opinion between
males and females: ____________e. Which graph better represents the data? ______ Why? _________
____________________________________________________
5. Why is it sometimes necessary to start numbering in a scale at a number greater than zero? Why can this be misleading? _____________________ _________________________________________________________
Double Bar Graph
Talk to a partner about what you have noticed about bar graphs. What seems straightforward? What is still confusing? Write your thoughts below:
8

Math Unit 7
1. Two sporting goods companies graphed their sales for January through June.
a. When you glance at the graphs quickly, which company
appears to have higher monthly sales? ______ Why? _______________________________________________.
b. When you look closely at the scales, which company actually has higher sales? __________
c. Why are most of the bars on the graph for company B so short? _______________________________________________
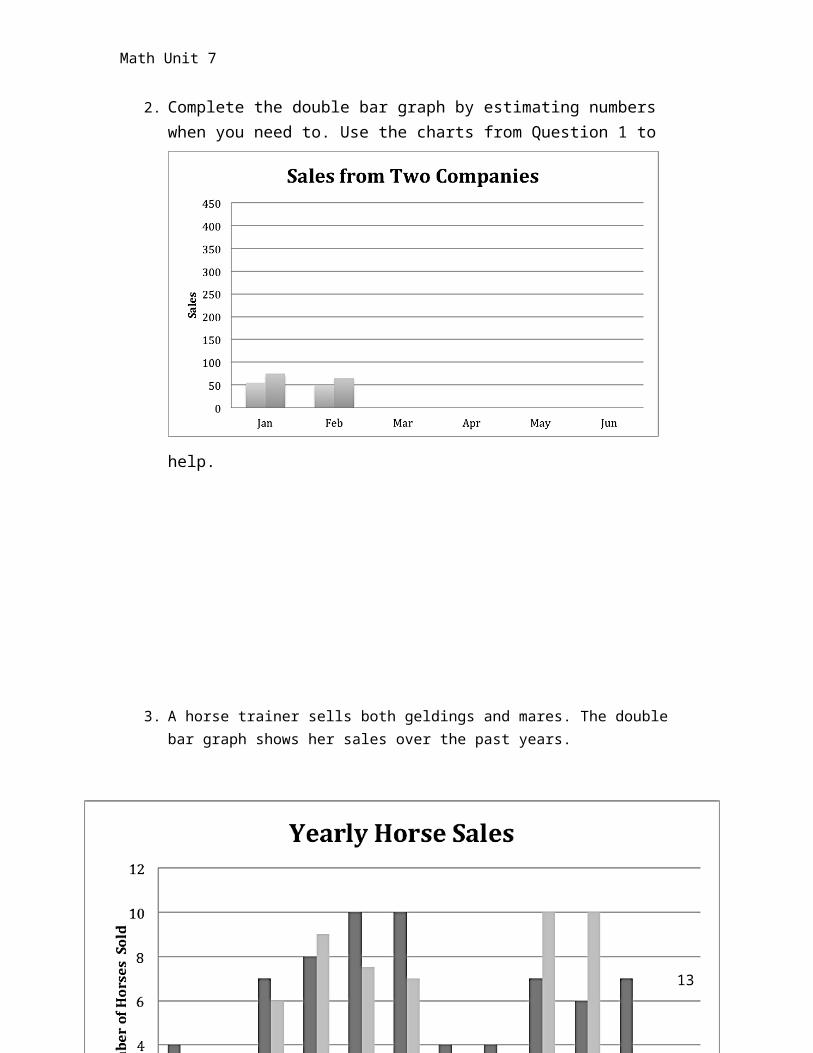
2. Complete the double bar graph by estimating numbers when you need to. Use the charts from Question 1 to help.
3. A
horse trainer sells both geldings and mares. The double bar graph shows her sales over the past years.
9

Math Unit 7
a. Complete the key. Colour the two lines 2 different shades. Fill in the boxes below and write the correct names (hint: one is mare, one is gelding)
b. Next year, the trainer wants to go on vacation for a month. In which month do you recommend she take her holiday? _______ Why? ____________________________________________________
4.
10
Math Unit 7
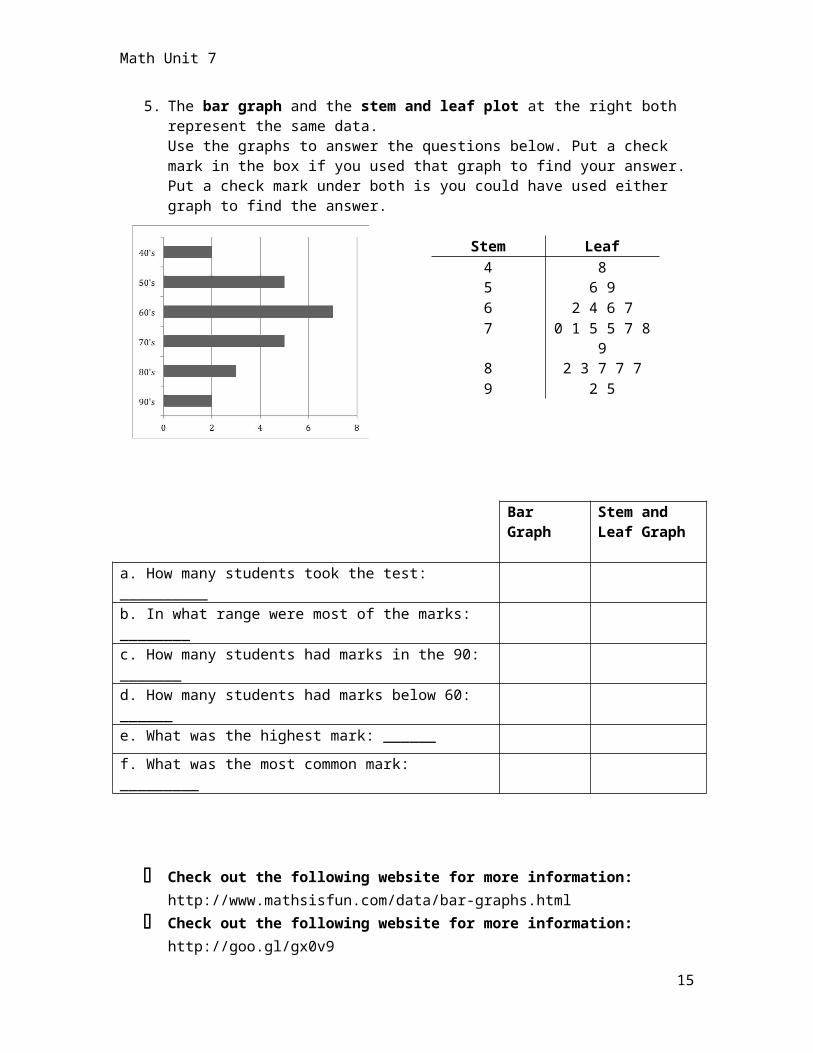
5. The bar graph and the stem and leaf plot at the right both represent the same data. Use the graphs to answer the questions below. Put a check mark in the box if you used that graph to find your answer. Put a check mark under both is you could have used either graph to find the answer.
Bar Graph
Stem and Leaf Graph
a. How many students took the test: __________b. In what range were most of the marks: ________c. How many students had marks in the 90: _______d. How many students had marks below 60: ______e. What was the highest mark: ______f. What was the most common mark: _________
Check out the following website for more information: http://www.mathsisfun.com/data/bar-graphs.html
Check out the following website for more information: http://goo.gl/gx0v9
11
Stem Leaf4 85 6 96 2 4 6 77 0 1 5 5 7 8 98 2 3 7 7 79 2 5

Math Unit 7
Line graphs1. The data below shows minimum wage increases in Ontario.
Year 1995 2004 2005 2006 2007Wage 6.85 7.15 7.45 7.75 8.0
12
Math Unit 7
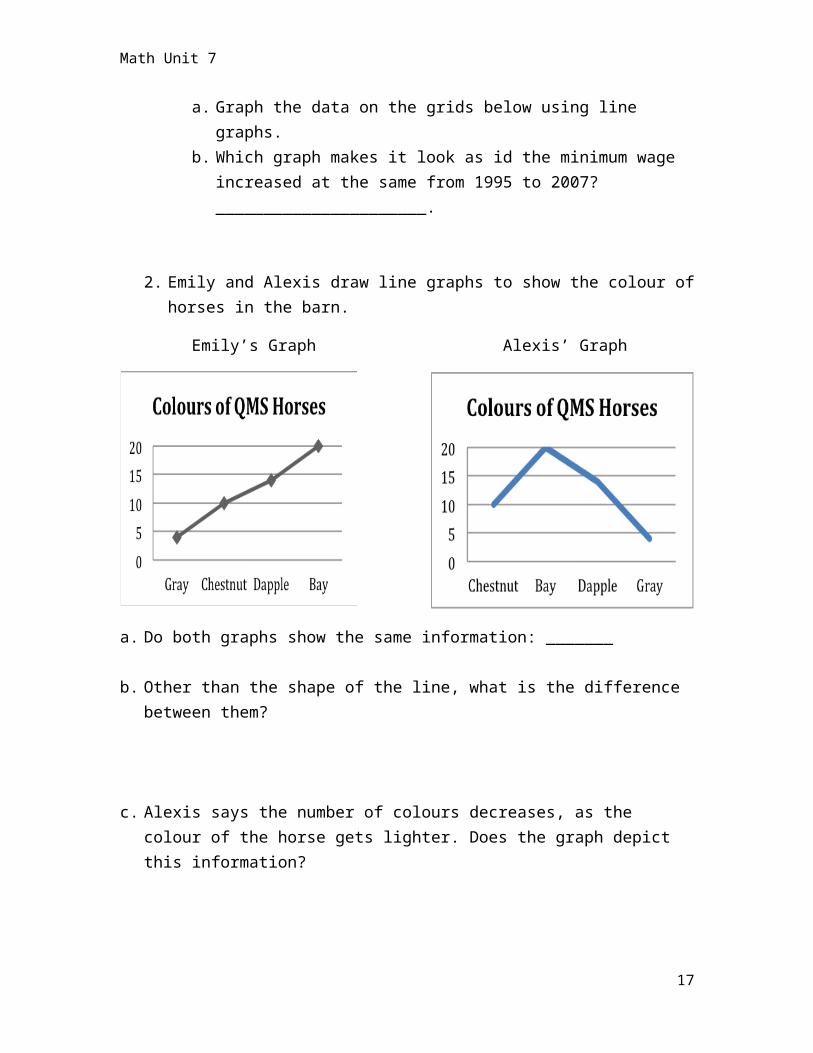
a. Graph the data on the grids below using line graphs.b. Which graph makes it look as id the minimum wage
increased at the same from 1995 to 2007? ______________________.
2. Emily and Alexis draw line graphs to show the colour of horses in the barn.
Emily’s Graph Alexis’ Graph
a. Do both graphs show the same information: _______
b. Other than the shape of the line, what is the difference between them?
c. Alexis says the number of colours decreases, as the colour of the horse gets lighter. Does the graph depict this information?
d. What type of graph would have been a better choice for this data? Why?
13

Math Unit 7
Talk to a partner about what you have noticed about line graphs. What seems straightforward? What is still confusing? Write your thoughts below:
14
Math Unit 7
Due Date:______________
Show You Know
1. The graph shows how many people visited a new web site each day.
a. Imagine the pattern continues. Make a table of values for the first 7 values of d, starting at d=1.
15

Math Unit 7
b. Describe the pattern:
______________________________________________________________________________________________
c. If the pattern continues, how many people will visit the website on the 12th day? __________
2. A school’s theatre has 16 seats in the first row, 20 seats in the second row, 24 seats in the third row and so on.
a. Make a table of values to show the number of seats in the first 6 rows.
b. Draw a graph showing the data from the table of values.
c. What is the relationship between the number of seats in a row and the row number?
d. How many seats are in the fifteenth row? Explain two ways to find the answer.
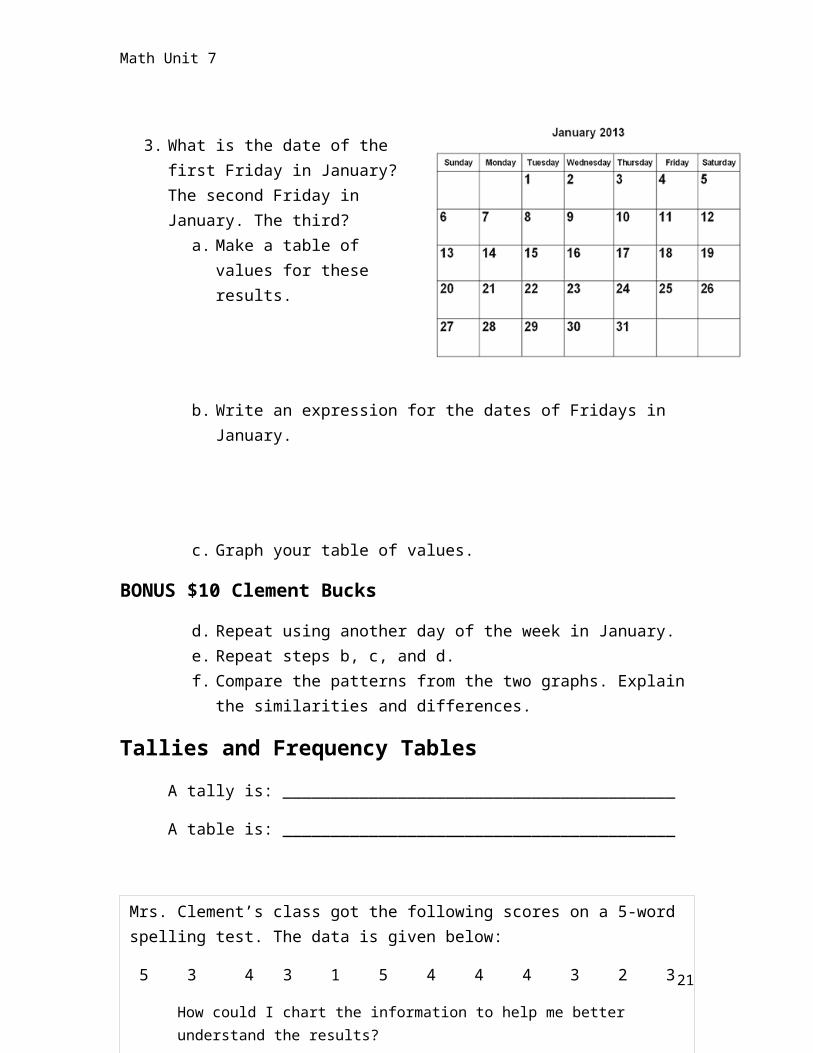
3. What is the date of the first Friday in January? The second Friday in January. The third?
a. Make a table of values for these results.
16
Math Unit 7
b. Write an expression for the dates of Fridays in January.
c. Graph your table of values.
BONUS $10 Clement Bucksd. Repeat using another day of the week in January. e. Repeat steps b, c, and d.f. Compare the patterns from the two graphs. Explain the
similarities and differences.
Tallies and Frequency TablesA tally is: _________________________________________
A table is: _________________________________________
Create a Survey:1. Frame a question you would like to ask 12 other people.2. Come up with at least 5 possible answers for the question in
your survey.
Mrs. Clement’s class got the following scores on a 5-word spelling test. The data is given below:
5 3 4 3 1 5 4 4 4 3 2 3How could I chart the information to help me better understand the results?
17
Math Unit 7
Not so hot Question: What is your favourite animal? Dog, cat, bird, horse, monkey, turtle.Good Question: Which animal do you think makes a good pet: dog, cat, bird, horse, monkey, turtle.Better Question: Which animal do you think would make a good pet for my grandma? Dog, cat, bird, horse, monkey,
turtle.3. Create a table. The first column should list the possible
choices. The second column is left blank- this is where you tally peoples answers.
4. Once you have collected the results, create a frequency table.
Explore1. Hannah surveyed 35 students about their favourite subject.
Unfortunately, she spilled water on her paper and smeared the French tally. Can you help her complete the chart?
a. List the subjects from most favourtie to least favourite. ______________________________________________
b. There are 100 students in Hannah’s grade (in all of Cowichan Valley, of course…). Using the results of her survey, predict the number of students in her grade who have socials as their favourtie subject._______________________________________________
2. Mr. Smith records the class results from the boys science tests. When he tallies a mark, he crosses it of his list so that he knows it’s been counted.
A B D C B B A A B C C B
18
Animal Math Science Socials French GymTally l l l l l l

Math Unit 7
a. Did he miss any A’s?______________. Fill in any A’s he missed and correct his frequency total. Complete the tally and frequency columns.
b. How many students wrote the test altogether?___________.
c. How many got D’s __________.
d. What fraction of the students got D’s? ___________
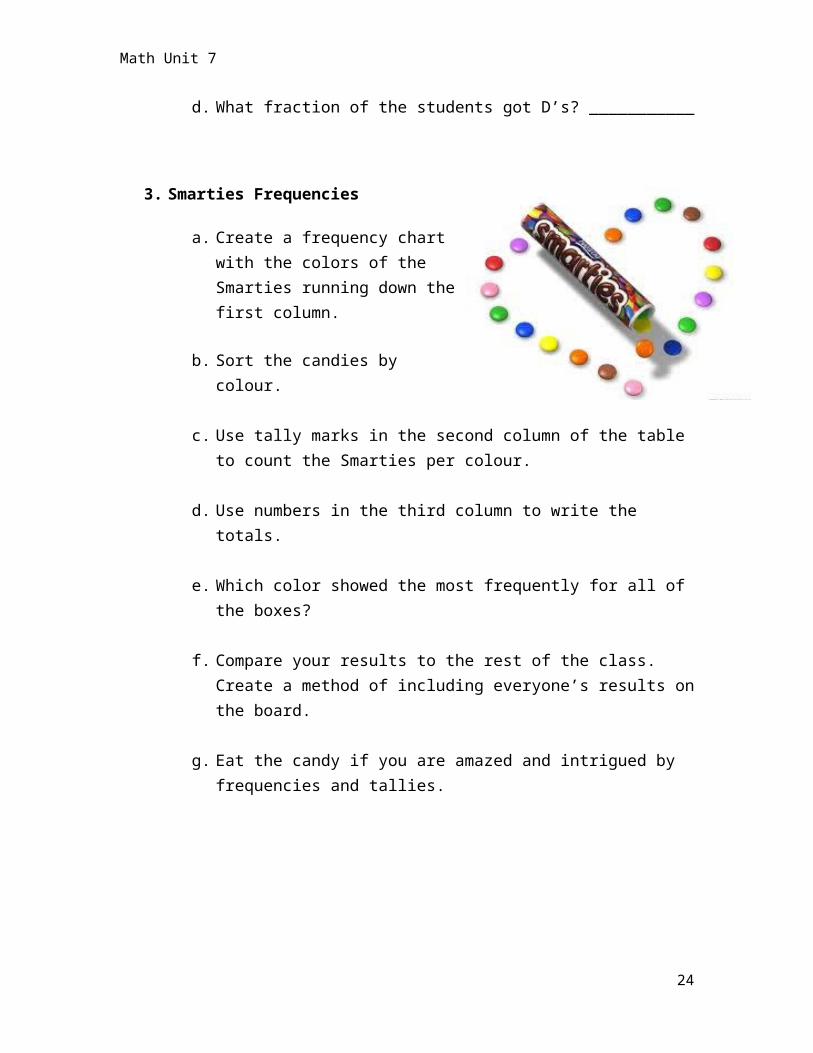
3. Smarties Frequencies
a. Create a frequency chart with the colors of the Smarties running down the first column.
b. Sort the candies by colour.
c. Use tally marks in the second column of the table to count the Smarties per colour.
d. Use numbers in the third column to write the totals.
e. Which color showed the most frequently for all of the boxes?
19
Mark Tally Frequency Fraction of Students
A l l
B l l l l
C
D

Math Unit 7
f. Compare your results to the rest of the class. Create a method of including everyone’s results on the board.
g. Eat the candy if you are amazed and intrigued by frequencies and tallies.
20
Math Unit 7
Due Date:______________
Show You Know
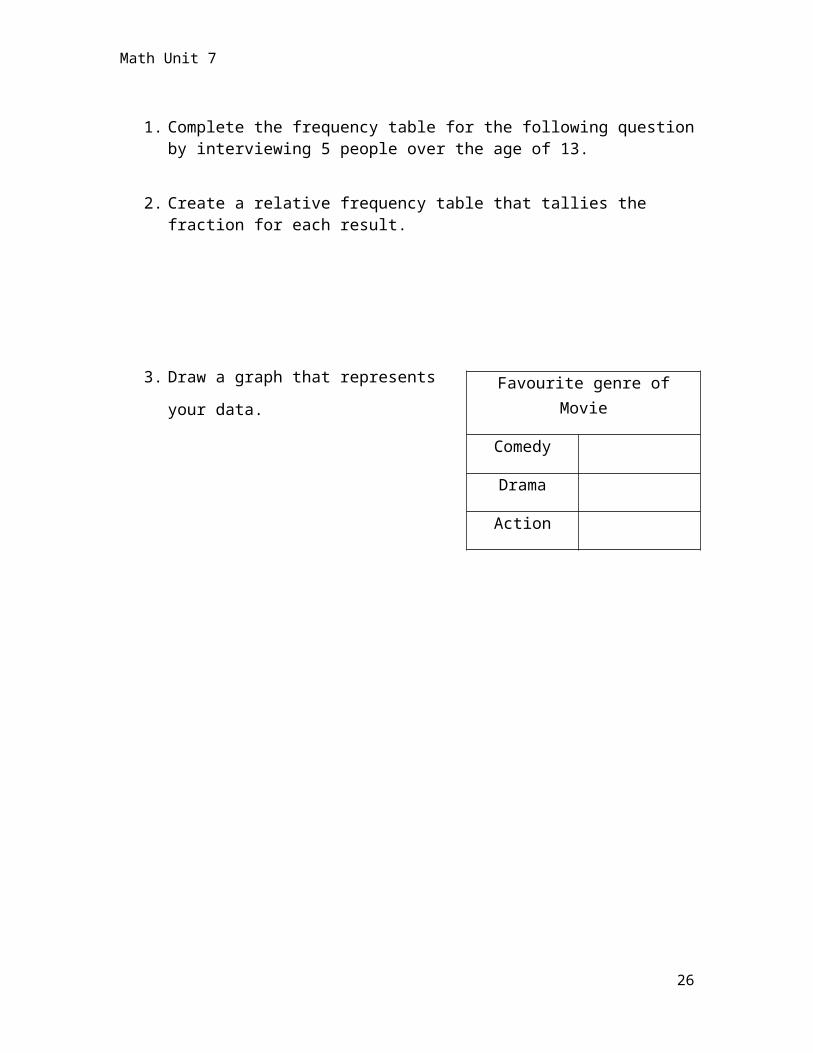
1. Complete the frequency table for the following question by interviewing 5 people over the age of 13.
2. Create a relative frequency table that tallies the fraction for each result.
3. Draw a graph that represents your data.
A frequency table shows how many times a data value occurs in a set. A relative frequency table shows the fraction of time each data value occurs.
21
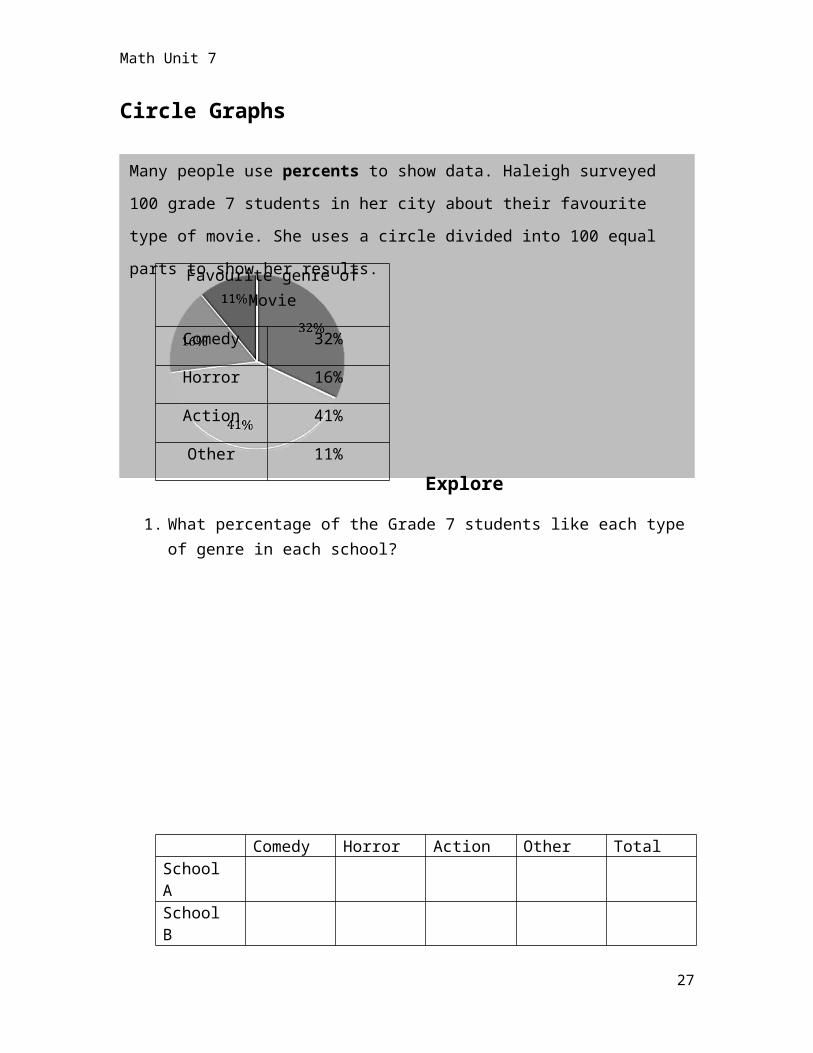
Favourite genre of Movie
Comedy
Drama
Action

Many people use percents to show data. Haleigh surveyed 100 grade 7 students in her city about their favourite type of movie. She uses a circle divided into 100 equal parts to show her results.
Math Unit 7
Circle Graphs
Explore1. What percentage of the Grade 7 students like each type of genre
in each school?
2. Allie copied down the following percents from a circle graph she saw on the Internet. How can you tell she made a mistake?
22
Favourite genre of Movie
Comedy 32%
Horror 16%
Action 41%
Other 11%
Comedy Horror Action Other TotalSchool ASchool B

Math Unit 7
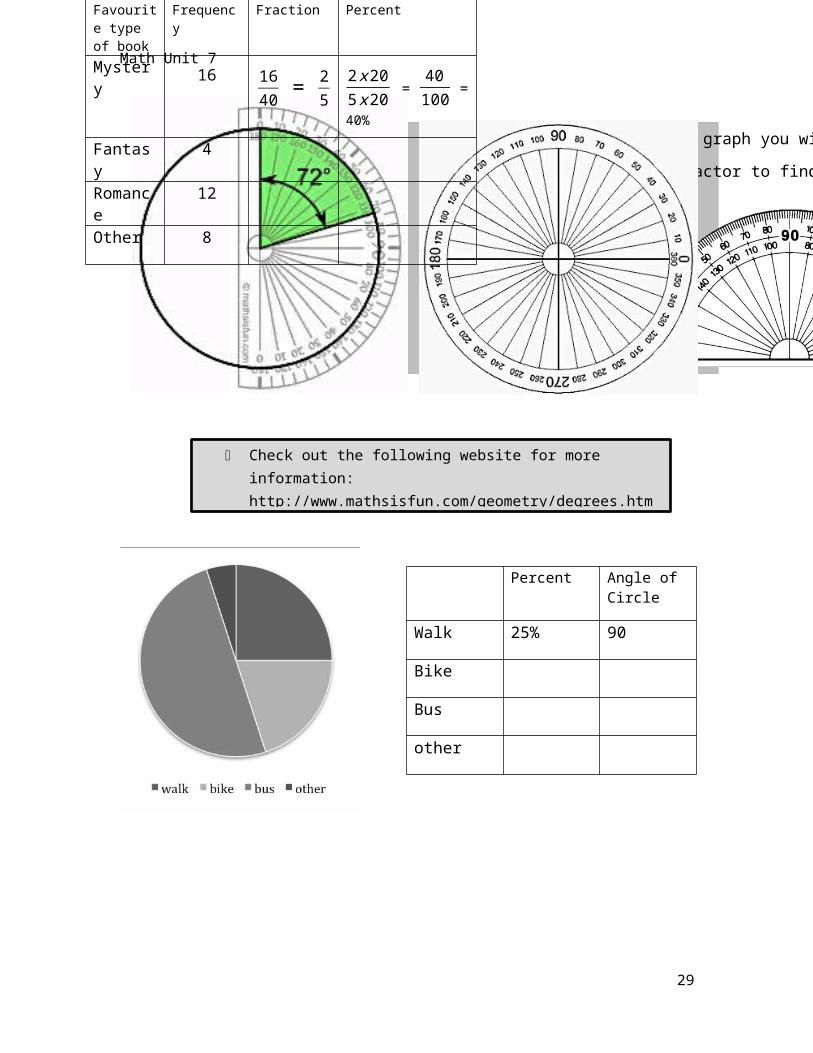
3. Complete the relative frequency table, then draw a circle graph.
To create your own circle graph you will need a protractor. Use the protractor to find the angle for each section of the circle.
23
Favourite Type of MovieComedy Horror Action Other Total48% 21% 26% 9%
Favourite type of book
Frequency
Fraction Percent
Mystery 16 1640 = 2
52x 205x 20 = 40
100 = 40%
Fantasy 4
Romance
12
Other 8
Math Unit 7
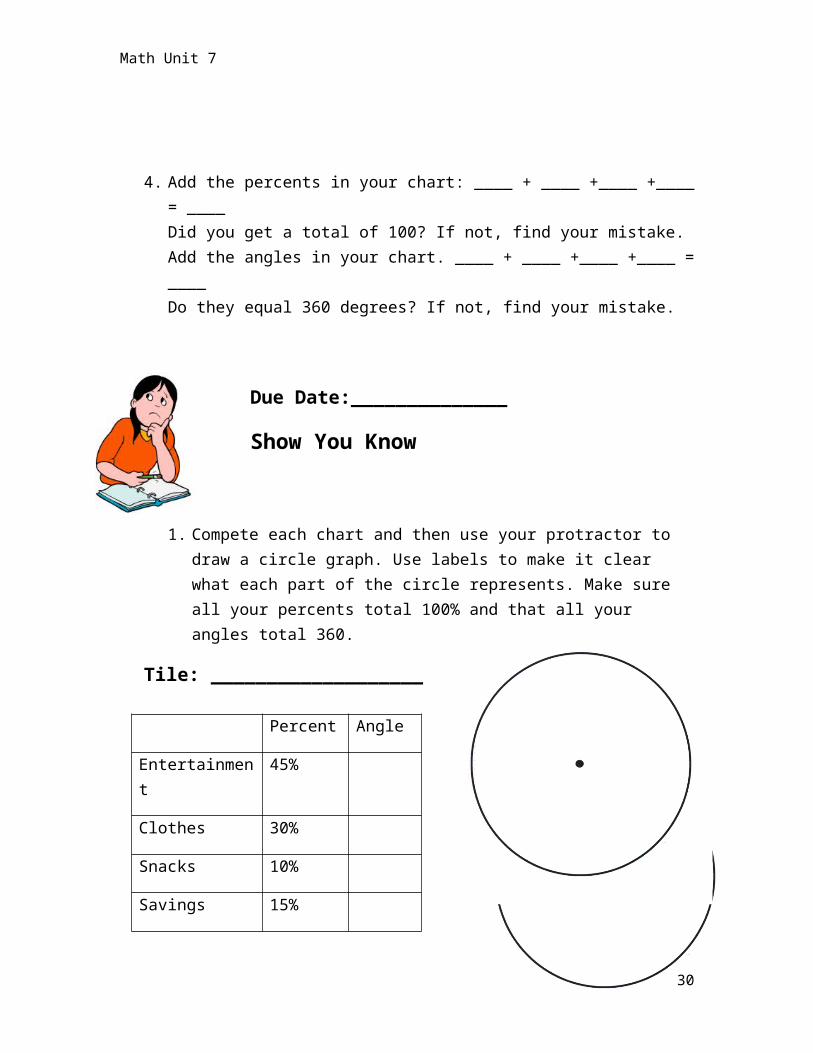
4. Add the percents in your chart: ____ + ____ +____ +____ = ____ Did you get a total of 100? If not, find your mistake.Add the angles in your chart. ____ + ____ +____ +____ = ____Do they equal 360 degrees? If not, find your mistake.
Due Date:______________
Show You Know
1. Compete each chart and then use your protractor to draw a circle graph. Use labels to make it clear what each part of the circle represents. Make sure all your percents total 100% and that all your angles total 360.
Tile: ___________________
Tile: ___________________
24
Percent Angle of Circle
Walk 25% 90
Bike
Bus
other
Percent Angle
Entertainment 45%
Clothes 30%
Snacks 10%
Savings 15%
Math Unit 7
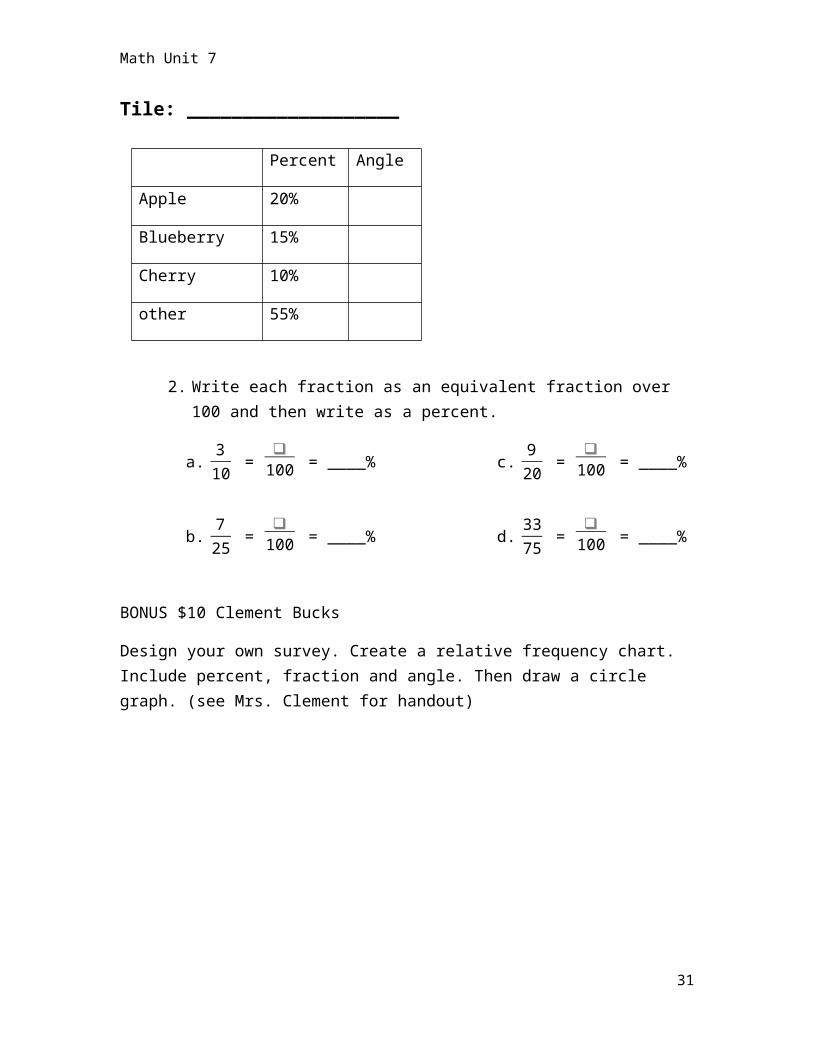
2. Write each fraction as an equivalent fraction over 100 and then write as a percent.
a. 310 = ❑
100 = ____%
b. 725 = ❑
100 = ____%
c. 920 = ❑
100 = ____%
d. 3375 = ❑
100 = ____%
BONUS $10 Clement Bucks
Design your own survey. Create a relative frequency chart. Include percent, fraction and angle. Then draw a circle graph. (see Mrs. Clement for handout)
25
Percent Angle
Apple 20%
Blueberry 15%
Cherry 10%
other 55%
Math Unit 7
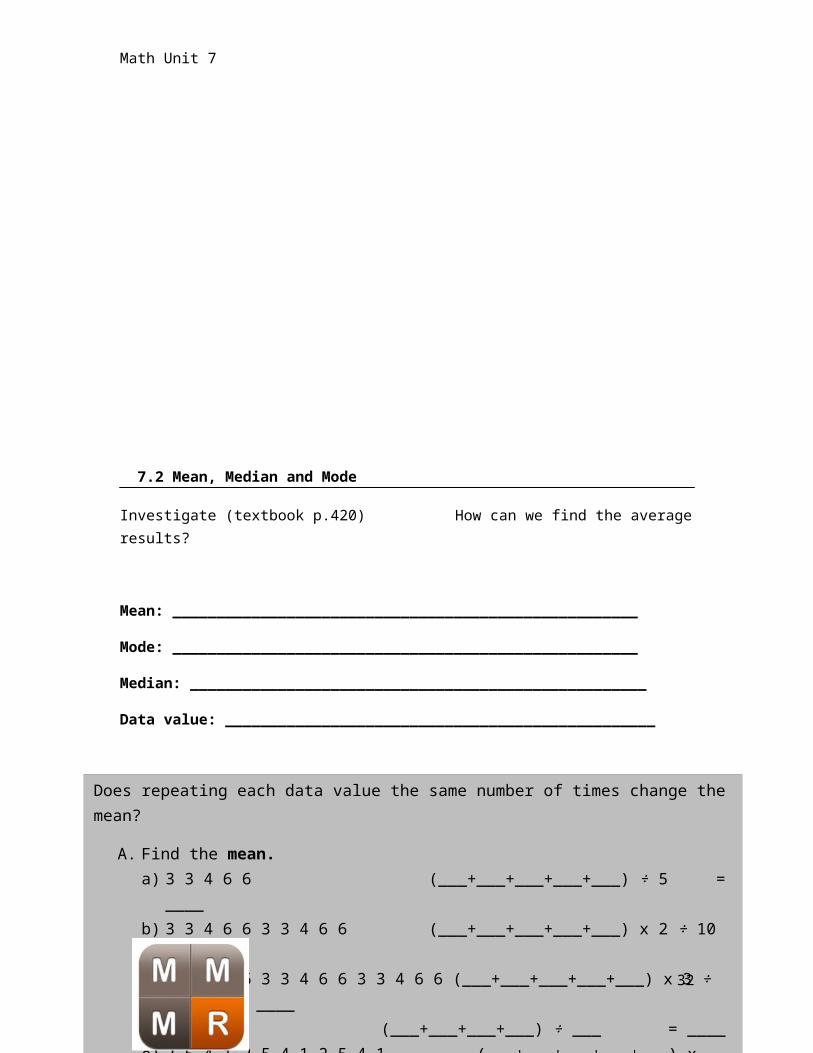
7.2 Mean, Median and Mode
Investigate (textbook p.420) How can we find the average results?
Mean: _____________________________________________________
Mode: _____________________________________________________
Median: ____________________________________________________
Data value: _________________________________________________
Does repeating each data value the same number of times change the mean?
A. Find the mean.a) 3 3 4 6 6 (___+___+___+___+___) ÷ 5 = ____b) 3 3 4 6 6 3 3 4 6 6 (___+___+___+___+___) x 2 ÷ 10 = ____c) 3 3 4 6 6 3 3 4 6 6 3 3 4 6 6 (___+___+___+___+___) x 3 ÷ 15 = ____d) 2 5 4 1 (___+___+___+___) ÷ ___ = ____e) 2 5 4 1 2 5 4 1 2 5 4 1 (___+___+___+___+___) x __ ÷ __ =
____
B. Does repeating each data value the same number of times change the mean?
C. Investigate what happens to the mode and the median when data values are repeated. Do the mode and the median change? Make up your own data to check.
Mean, median and mode (and range) calculator App
Pie Chart 3D Free allows you to create pie chart wherever you are.
26
Math Unit 7
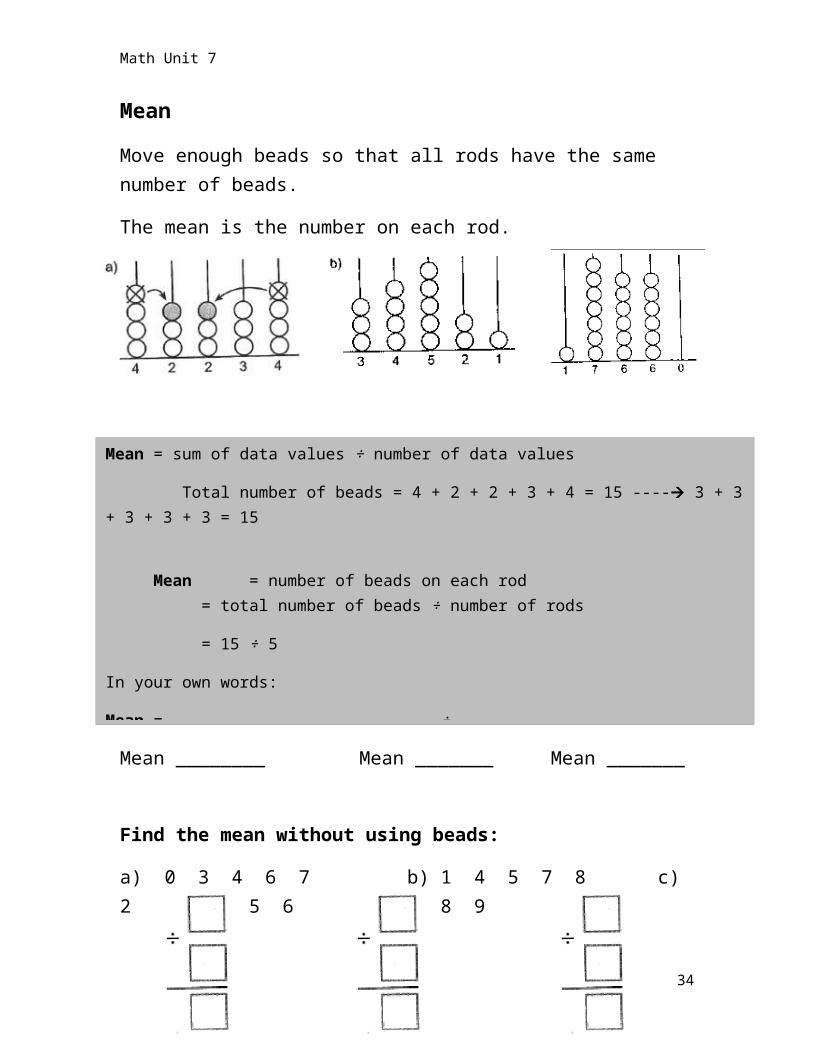
MeanMove enough beads so that all rods have the same number of beads. The mean is the number on each rod.
Mean ________ Mean _______ Mean _______
Find the mean without using beads:
a) 0 3 4 6 7 b) 1 4 5 7 8 c) 2 5 6 8 9
Mean = sum of data values ÷ number of data values
Total number of beads = 4 + 2 + 2 + 3 + 4 = 15 ---- 3 + 3 + 3 + 3 + 3 = 15
Mean = number of beads on each rod= total number of beads ÷ number of rods
= 15 ÷ 5
In your own words:
Mean = ___________________________ ÷ ________________________
27

Math Unit 7
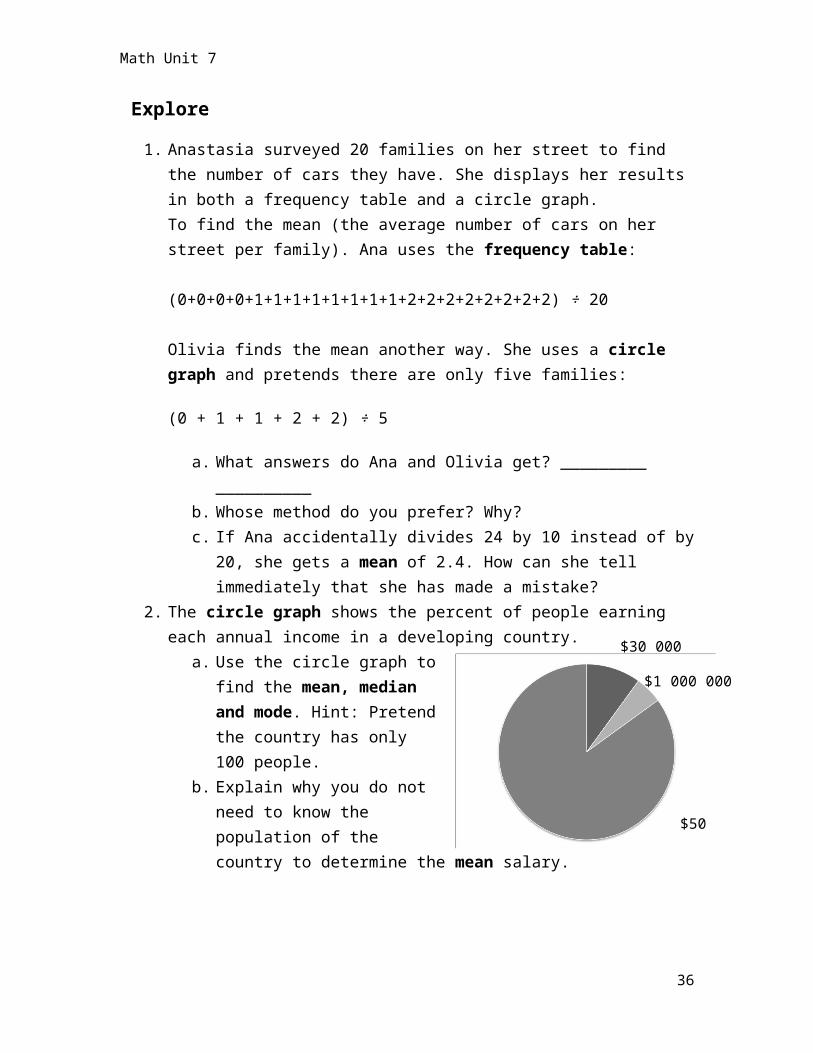
Explore1. Anastasia surveyed 20 families on her street to find the number
of cars they have. She displays her results in both a frequency table and a circle graph.To find the mean (the average number of cars on her street per family). Ana uses the frequency table:
(0+0+0+0+1+1+1+1+1+1+1+1+2+2+2+2+2+2+2+2) ÷ 20
Olivia finds the mean another way. She uses a circle graph and pretends there are only five families:
(0 + 1 + 1 + 2 + 2) ÷ 5
a. What answers do Ana and Olivia get? _________ __________b. Whose method do you prefer? Why?c. If Ana accidentally divides 24 by 10 instead of by 20, she
gets a mean of 2.4. How can she tell immediately that she has made a mistake?
2. The circle graph shows the percent of people earning each annual income in a developing country.
a. Use the circle graph to find the mean, median and mode. Hint: Pretend the country has only 100 people.
b. Explain why you do not need to know the population of the country to determine the mean salary.
$30 000
$1 000 000 000
$50
28
Math Unit 7
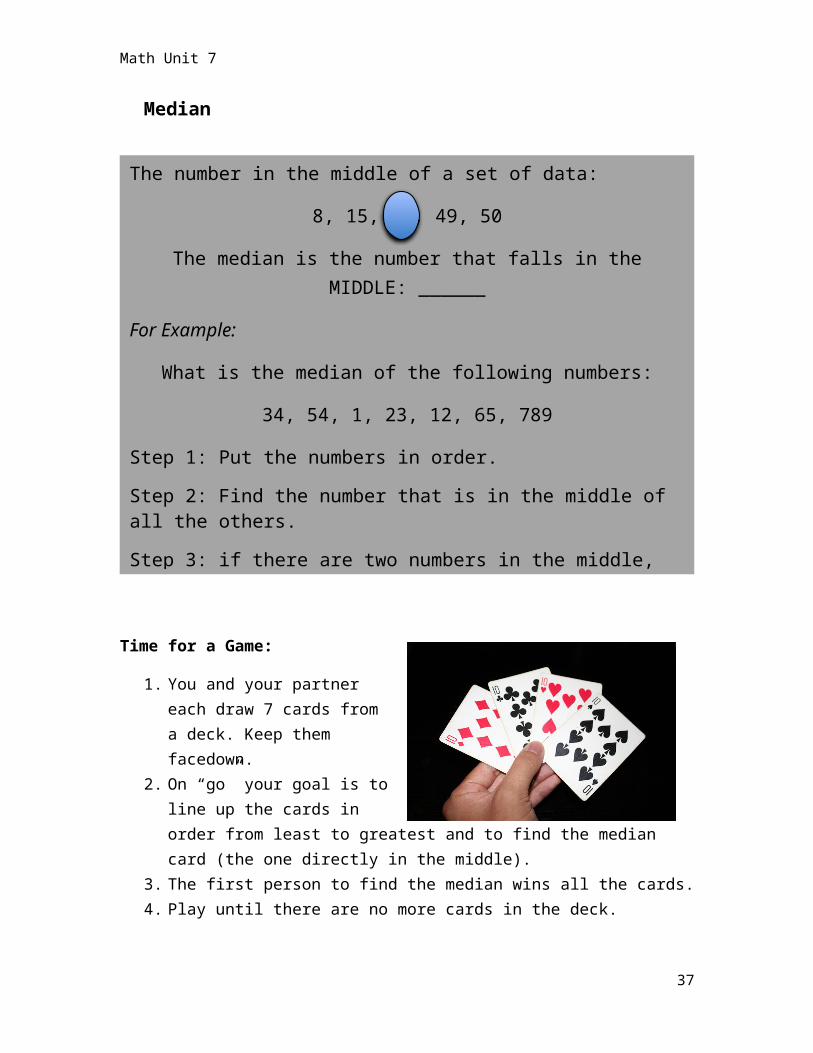
Median
Time for a Game:
1. You and your partner each draw 7 cards from a deck. Keep them facedown.
2. On “go” your goal is to line up the cards in order from least to greatest and to find the median card (the one directly in the middle).
3. The first person to find the median wins all the cards. 4. Play until there are no more cards in the deck.
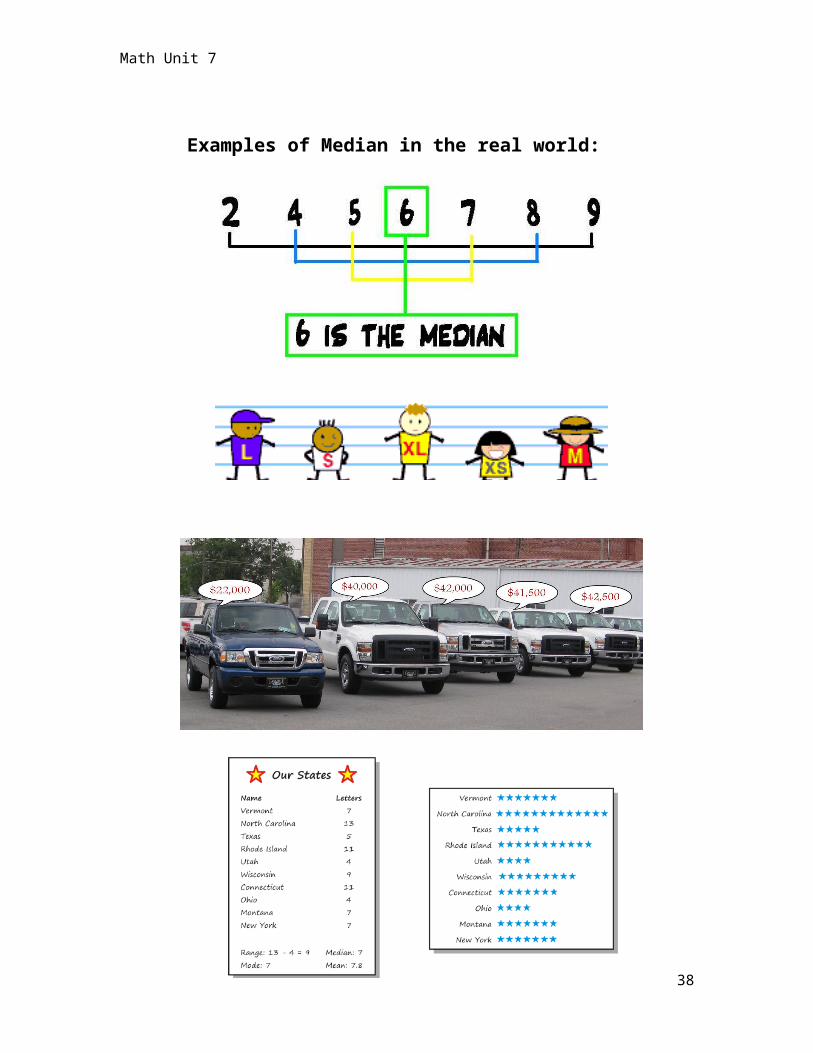
Examples of Median in the real world:
The number in the middle of a set of data:8, 15, 24, 49, 50
The median is the number that falls in the MIDDLE: ______For Example:
What is the median of the following numbers:34, 54, 1, 23, 12, 65, 789
Step 1: Put the numbers in order.Step 2: Find the number that is in the middle of all the others.Step 3: if there are two numbers in the middle, the median becomes the decimal between them.
29
Math Unit 7
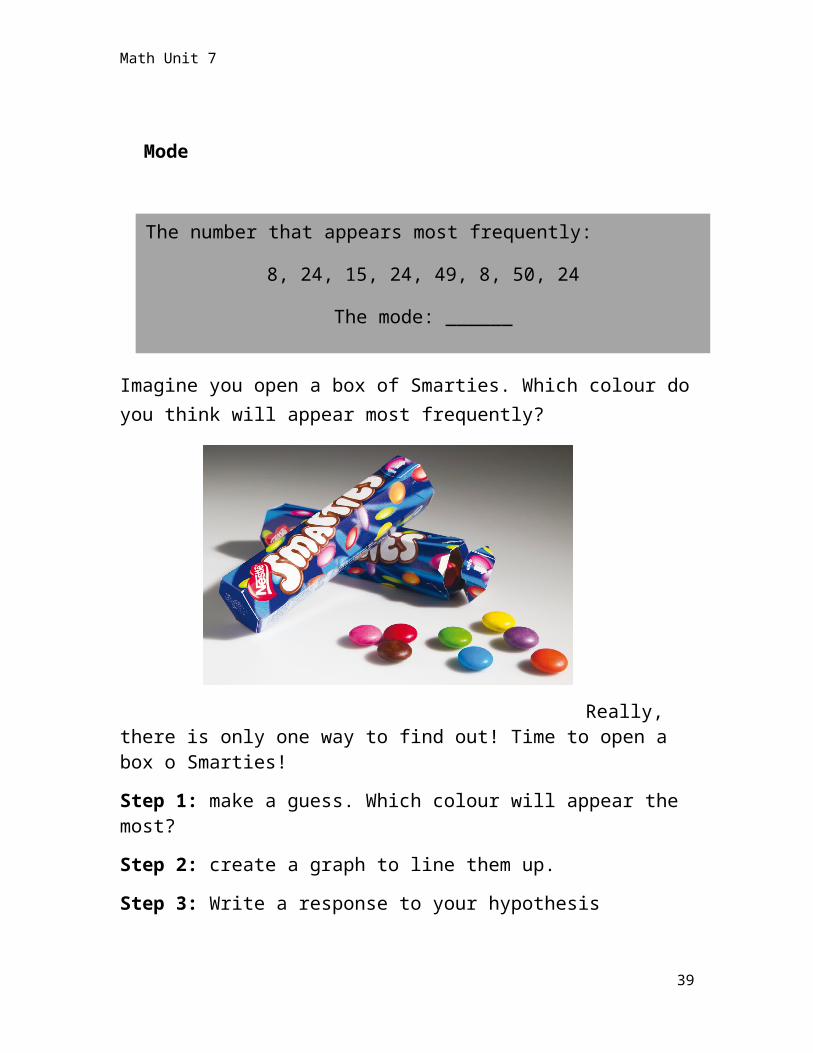
Mode
The number that appears most frequently:8, 24, 15, 24, 49, 8, 50, 24
The mode: ______30
Math Unit 7
Imagine you open a box of Smarties. Which colour do you think will appear most frequently?
Really, there is only one way to find out! Time to open a box o Smarties!Step 1: make a guess. Which colour will appear the most?Step 2: create a graph to line them up.Step 3: Write a response to your hypothesisStep 4: Eat the green Smarties. They make you smart…
31
Math Unit 7
Due Date:______________
Show You Know 1. Calculate the mean, median and mode for the following questions:
Good website:
http://www.mathgoodies.com/lessons/toc_vol8.html
32
Math Unit 7
7.4 Intro to ProbabilityInvestigate (textbook p.156) How can we know the outcomes of events?
Try some
Websites:
http://www.bbc.co.uk/bitesize/ks2/maths/data/ probability/play/
33
Math Unit 7
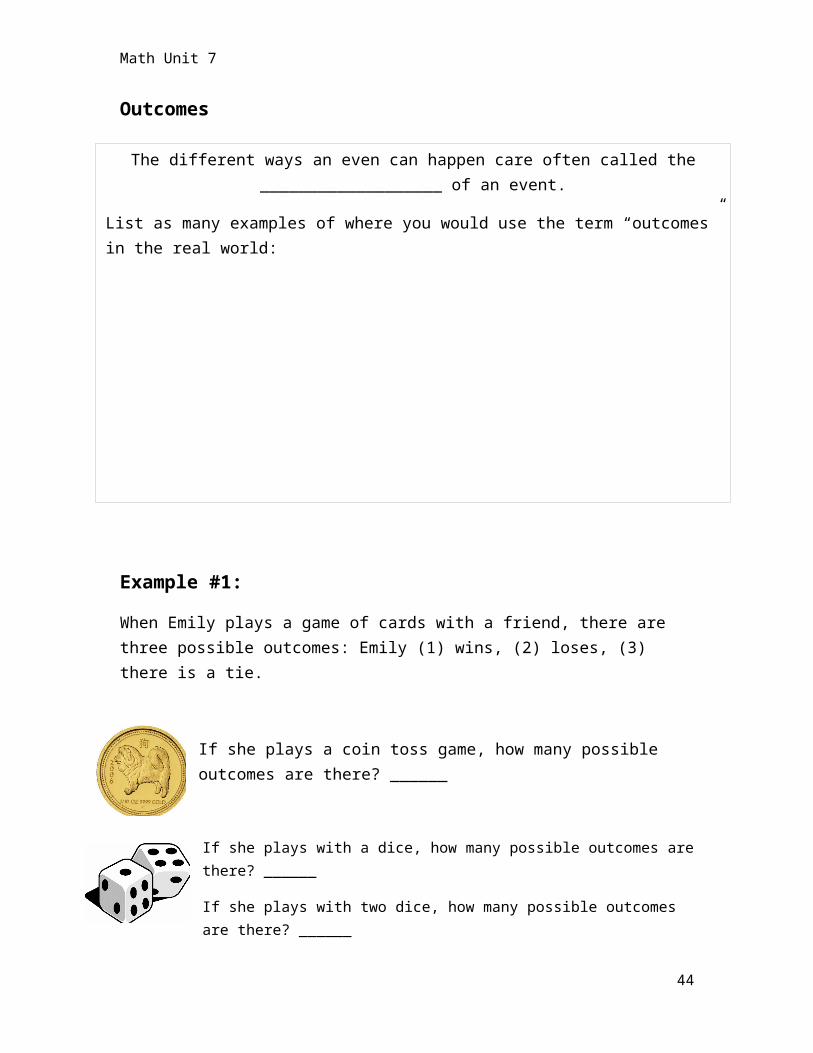
Outcomes
Example #1:When Emily plays a game of cards with a friend, there are three possible outcomes: Emily (1) wins, (2) loses, (3) there is a tie.
If she plays a coin toss game, how many possible outcomes are there? ______
If she plays with a dice, how many possible outcomes are there? ______
If she plays with two dice, how many possible outcomes are there? ______
34
The different ways an even can happen care often called the ___________________ of an event.
List as many examples of where you would use the term “outcomes” in the real world:

Math Unit 7
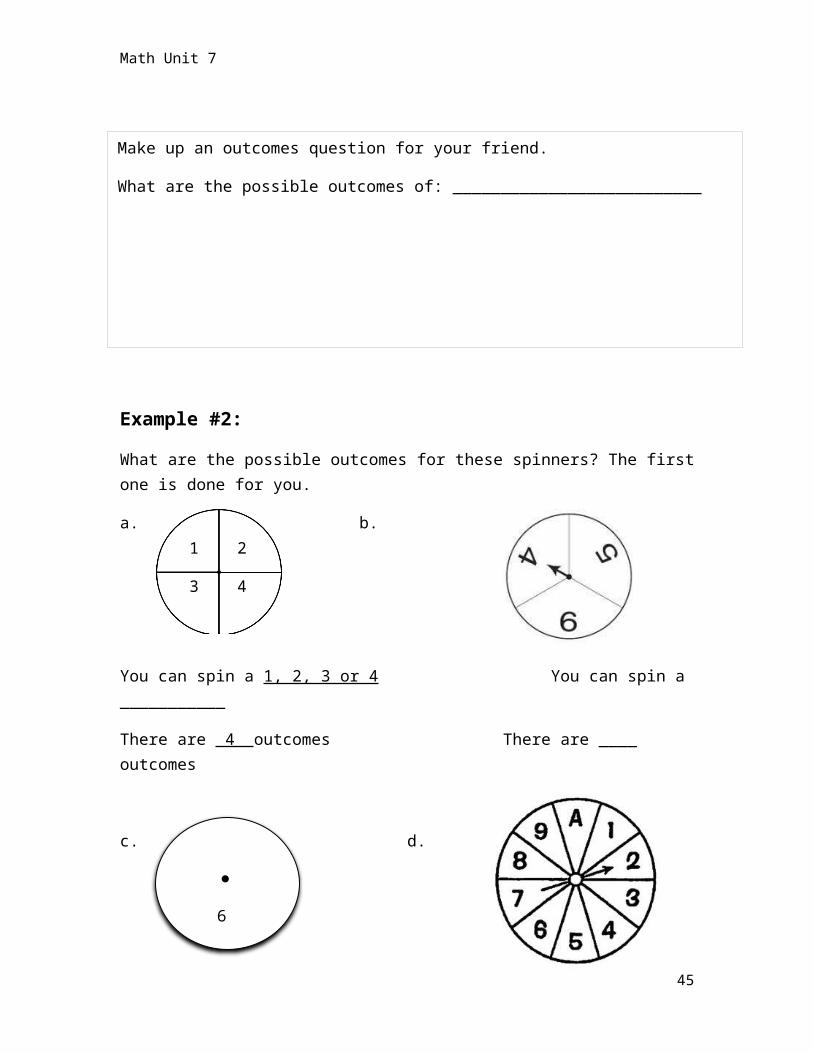
Example #2:What are the possible outcomes for these spinners? The first one is done for you.
a. b.
You can spin a 1, 2, 3 or 4 You can spin a ___________
There are 4 outcomes There are ____ outcomes
c. d.
You can spin a __________ You can spin a ___________
There are _____ outcomes There are ____ outcomes
35
Make up an outcomes question for your friend.
What are the possible outcomes of: __________________________
1 2
3 4
6
Math Unit 7
Probability
1. For each of the following situations, how many ways are there of…
a. drawing a stripped marble: ___________b. drawing a white marble: _____________c. drawing a black marble: _____________d. drawing a marble of any colour: _______
e. spinning blue: _______________f. spinning any colour: ___________g. spinning white: ______________h. spinning green: ______________
36
Fractions can be used to describe probability.
¼ of the spinner is red, so the probability of spinning a red is 1 in 4.
There are four colours in total. I could get any of them with each spin.
What would happen to the outcomes if ¾ of the spinner were red?
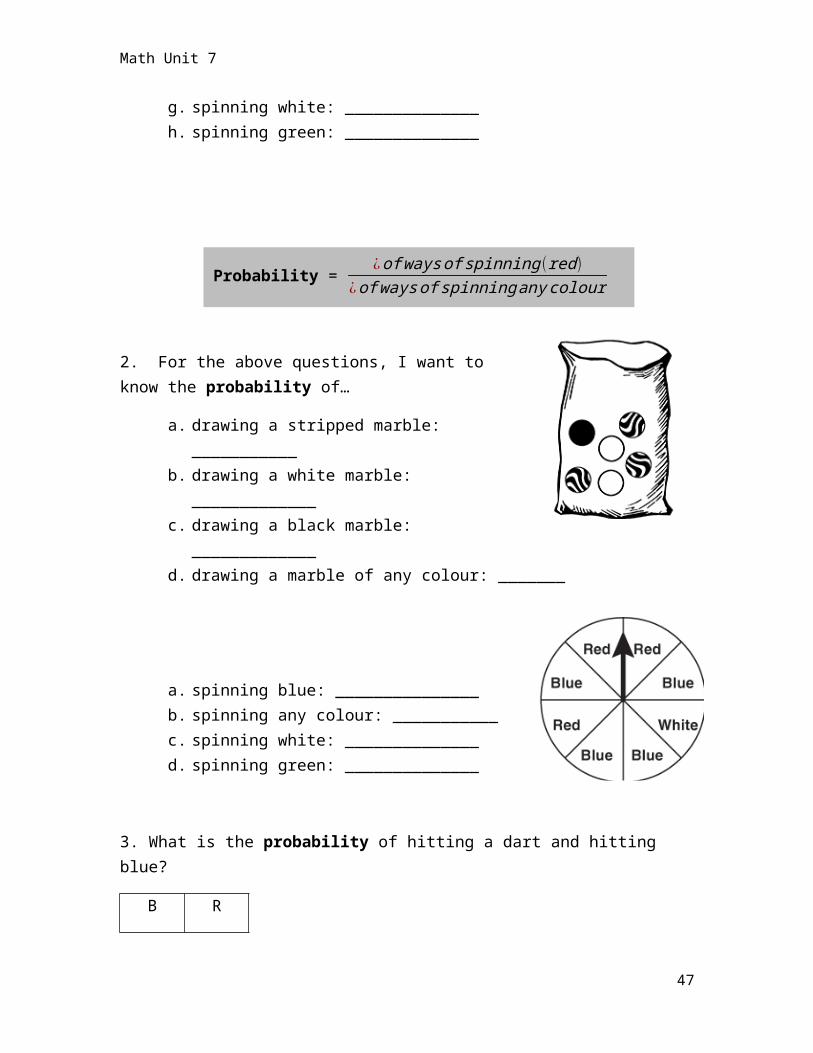
Probability = ¿of waysof spinning (red)¿of waysof spinning anycolour
Math Unit 7
2. For the above questions, I want to know the probability of…
a. drawing a stripped marble: ___________b. drawing a white marble: _____________c. drawing a black marble: _____________d. drawing a marble of any colour: _______
a. spinning blue: _______________b. spinning any colour: ___________c. spinning white: ______________d. spinning green: ______________
37
Math Unit 7
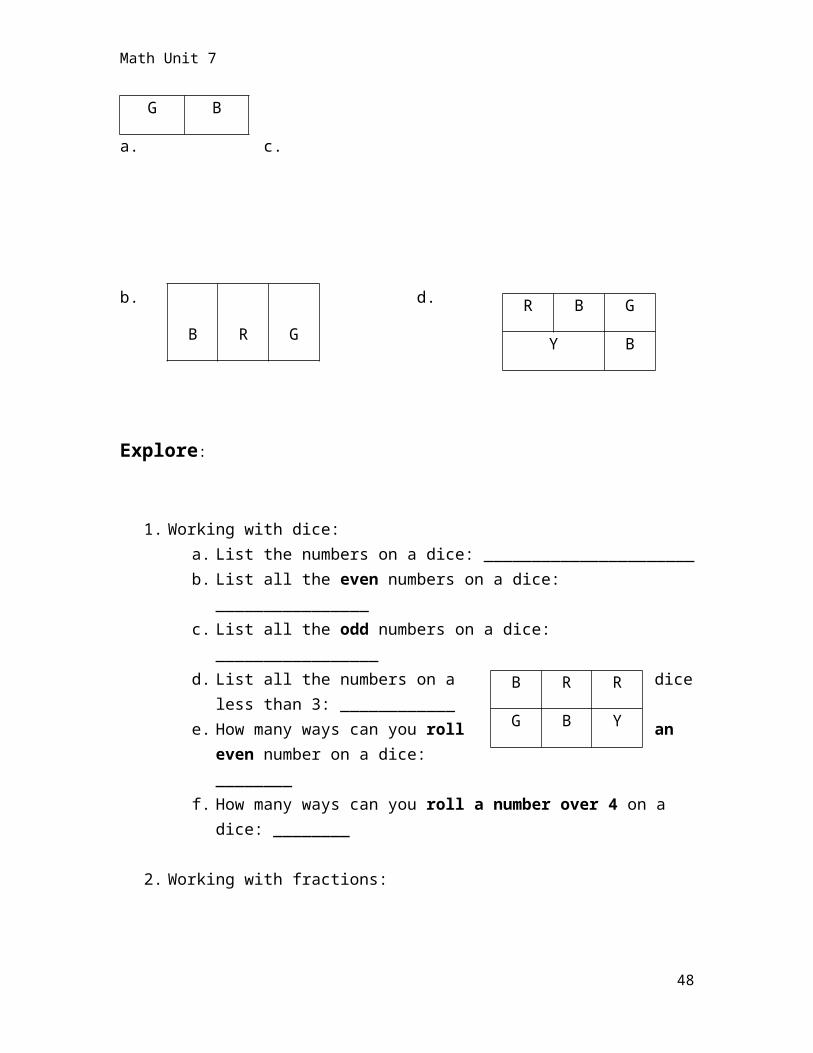
3. What is the probability of hitting a dart and hitting blue?
B R
G B
a. c.
b. d.
Explore:
1. Working with dice:a. List the numbers on a dice: ______________________b. List all the even numbers on a dice: ________________c. List all the odd numbers on a dice: _________________d. List all the numbers on a dice less than 3: ____________e. How many ways can you roll an
even number on a dice: ________
f. How many ways can you roll a number over 4 on a dice: ________
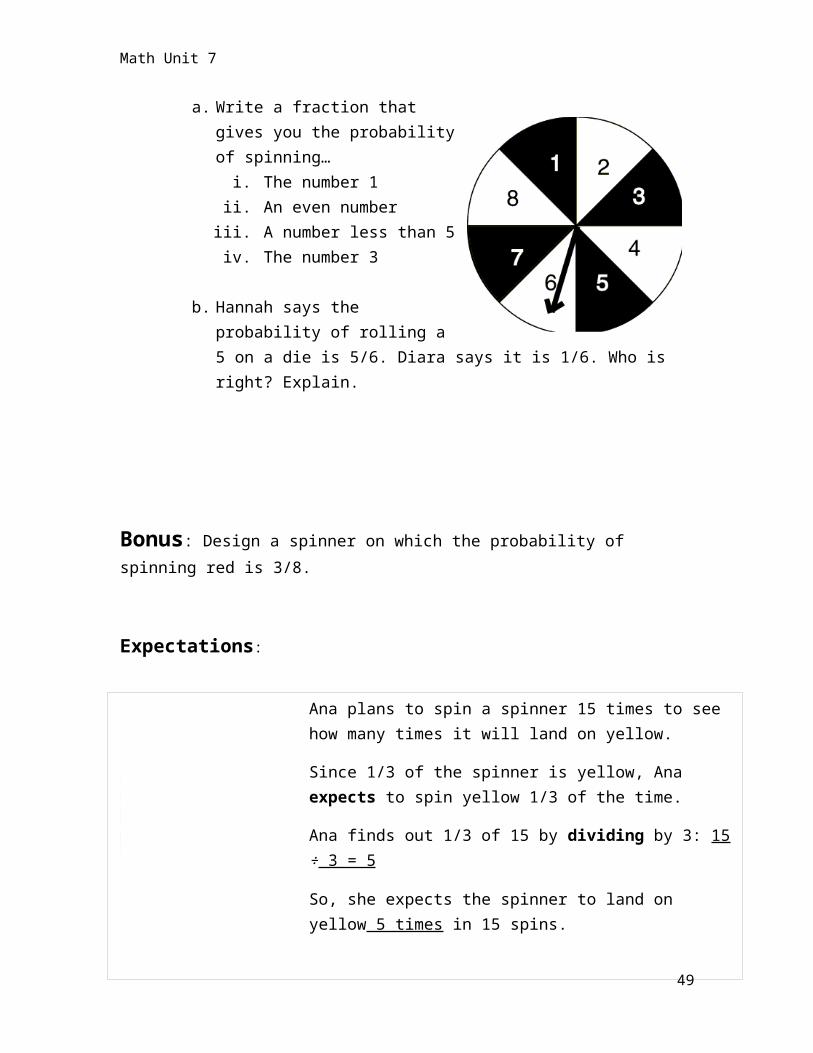
2. Working with fractions:a. Write a fraction that gives you the probability of spinning…
i. The number 1ii. An even numberiii. A number less than 5iv. The number 3
38
B R R
G B Y
R B G
Y BB R G
Math Unit 7
b. Hannah says the probability of rolling a 5 on a die is 5/6. Diara says it is 1/6. Who is right? Explain.
Bonus: Design a spinner on which the probability of spinning red is 3/8.
Expectations:
Explore:
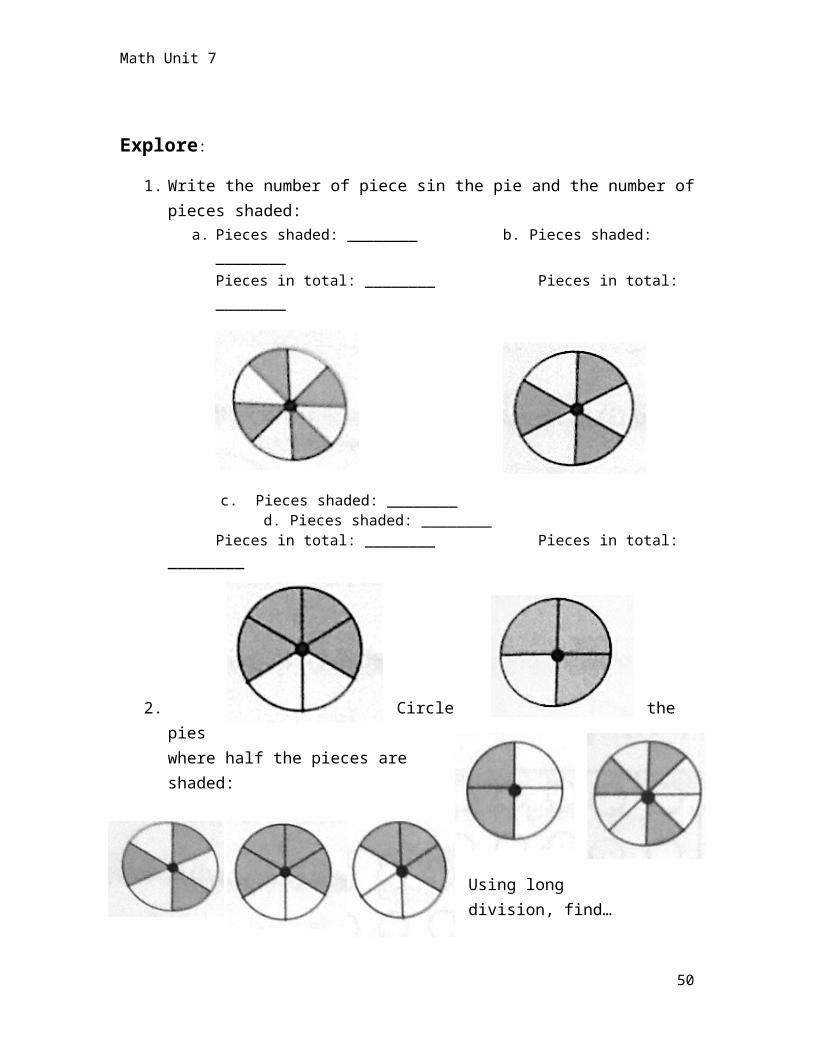
1. Write the number of piece sin the pie and the number of pieces shaded:
a. Pieces shaded: ________ b. Pieces shaded: ________Pieces in total: ________ Pieces in total: ________
39
Ana plans to spin a spinner 15 times to see how many times it will land on yellow.
Since 1/3 of the spinner is yellow, Ana expects to spin yellow 1/3 of the time.
Ana finds out 1/3 of 15 by dividing by 3: 15 ÷ 3 = 5
So, she expects the spinner to land on yellow 5 times in 15 spins.

Math Unit 7
c. Pieces shaded: ________ d. Pieces shaded: ________Pieces in total: ________ Pieces in total: ________
2. Circle the pies where half the
pieces are shaded:
40

Math Unit 7
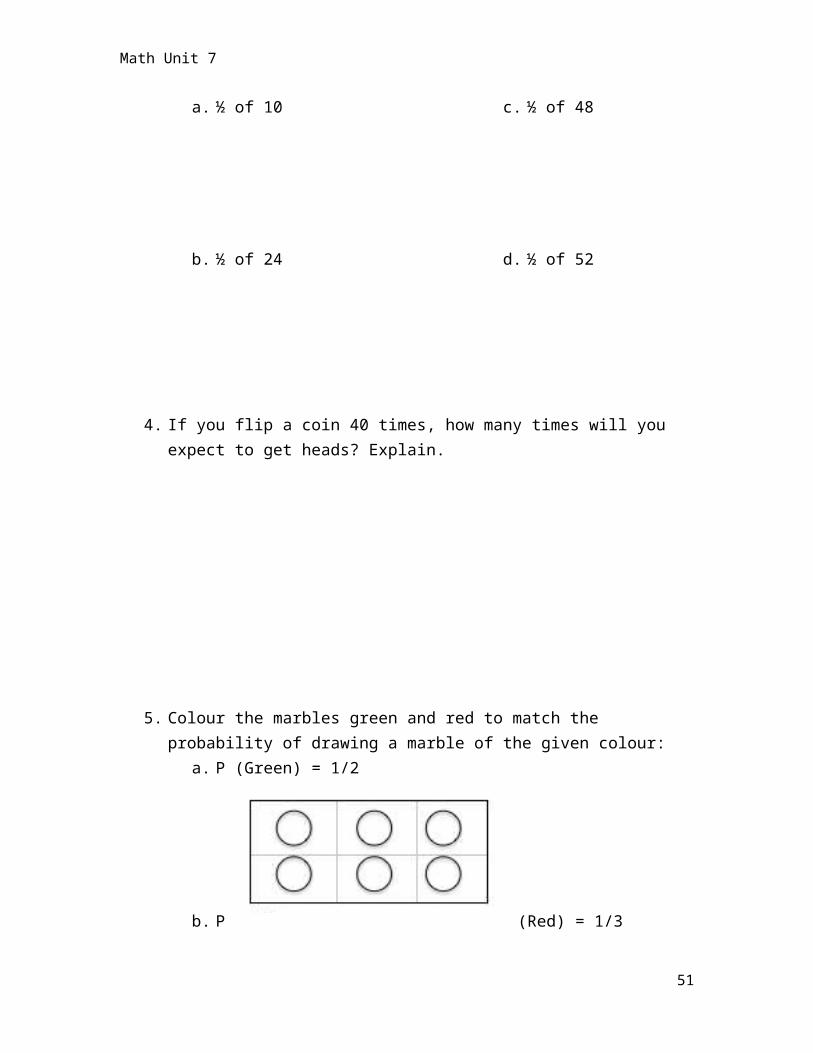
3. Using long division, find…
a. ½ of 10
b. ½ of 24
c. ½ of 48
d. ½ of 52
4. If you flip a coin 40 times, how many times will you expect to get heads? Explain.
5. Colour the marbles green and red to match the probability of drawing a marble of the given colour:
a. P (Green) = 1/2
b. P (Red) = 1/3
41

Math Unit 7
c. P (Blue) = 3/4
6. Match the probability with the descriptions of the event:a. The probability of the event is 0b. The probability of the event is 1c. The probability of the event is less than ½d. The probability of the event is greater than ½
The event is likely ________
The event is impossible _______
The event it unlikely ________
The event is certain ________
Games and Expectations
42
If an event cannot happen it is impossible.Example: rolling an eight on a die.
If an event must happen it is certain.Example: When you roll a dice you are certain it will land on a number less than 7.
It is likely that you will spin yellow on your turn.It is unlikely that you will spin red on the spinner.
When an event is expected to occur exactly half the time, we say that there is an even chance of that event occurring.

Math Unit 7
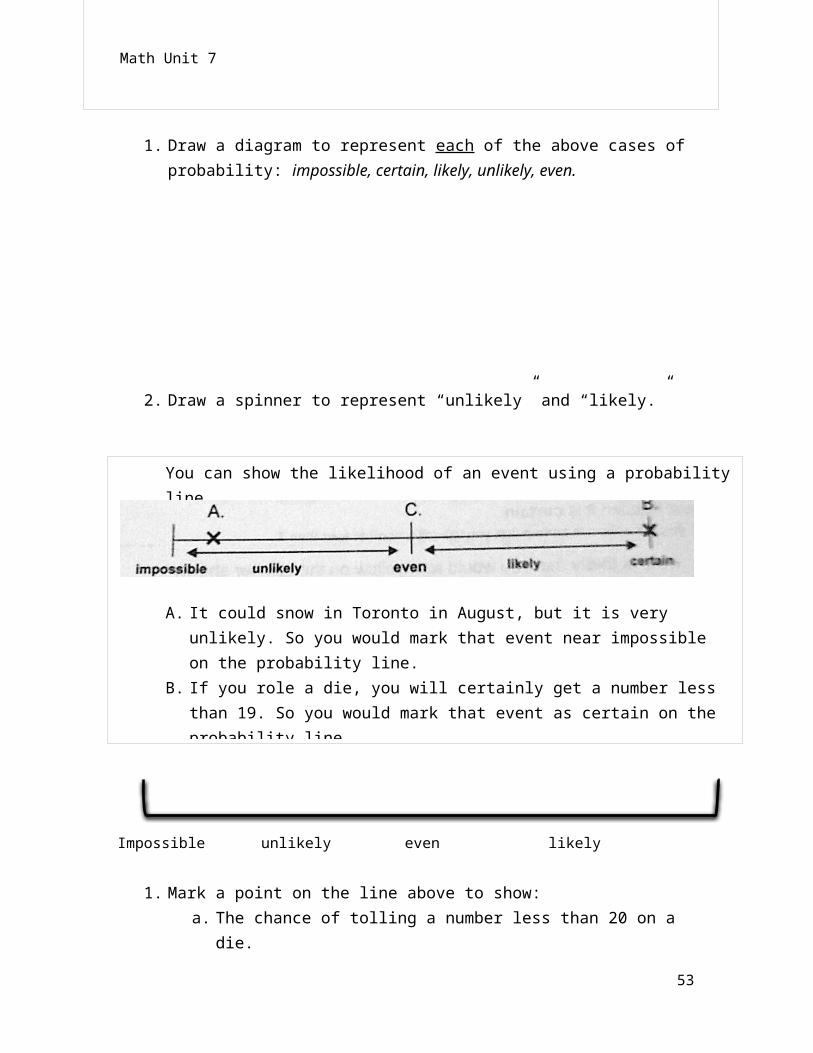
1. Draw a diagram to represent each of the above cases of probability: impossible, certain, likely, unlikely, even.
2. Draw a spinner to represent “unlikely” and “likely.”
1. Mark a point on the line above to show:a. The chance of tolling a number less than 20 on a die. b. The chance of flipping tails on a coin.c. The change of seeing a wolf on the street.d. The chance of having a pop-quiz in the next 5 minutes.
43
You can show the likelihood of an event using a probability line.
A. It could snow in Toronto in August, but it is very unlikely. So you would mark that event near impossible on the probability line.
B. If you role a die, you will certainly get a number less than 19. So you would mark that event as certain on the probability line.
C. Even probability means the event will occur half the time.
Impossible unlikely even likely certain
Math Unit 7
2. Create four “likelihood” questions and have a friend solve them
on a number line
Due Date:______________
Show You Know
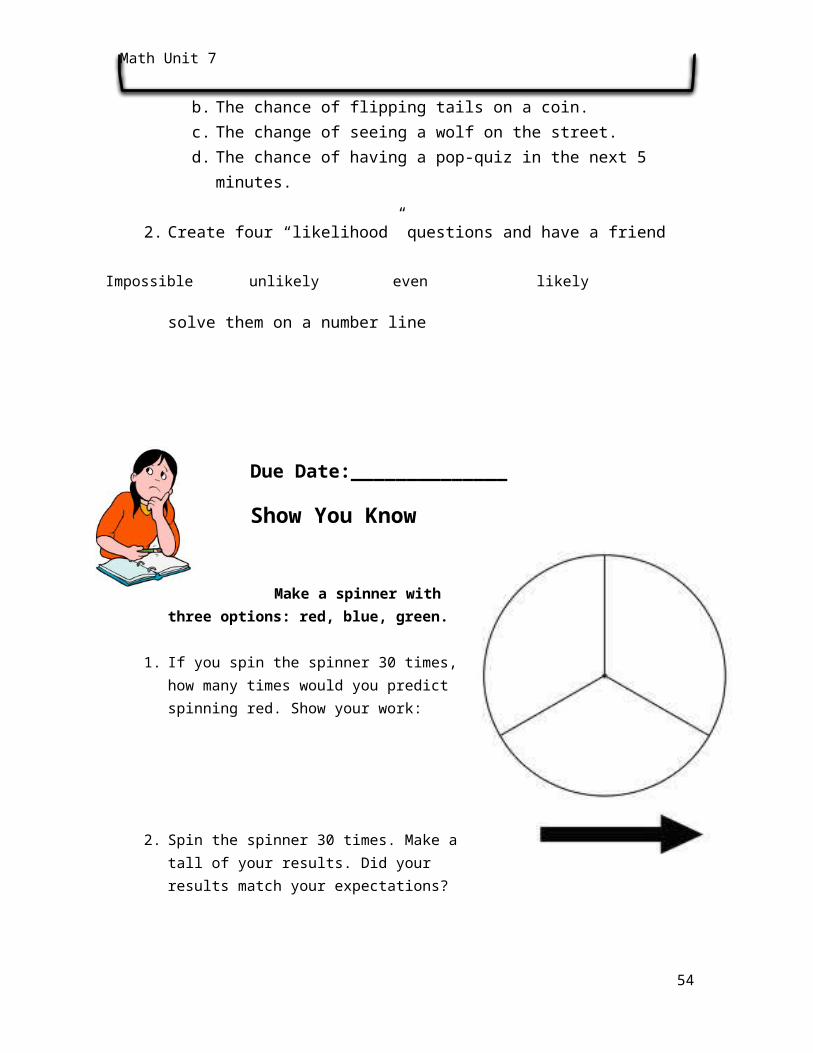
Make a spinner with three options: red, blue, green.
1. If you spin the spinner 30 times, how many times would you predict spinning red. Show your work:
2. Spin the spinner 30 times. Make a tall of your results. Did your results match your expectations?
3. If you roll a die repeatedly, what fraction of the time would you expect to roll a 6? Explain.
44
Impossible unlikely even likely certain
Math Unit 7
4. You have 3 bills in your pocket: a $5 a $10 a $20
You reach in and pull out a pair of bills.
a. What are the possible combinations of the two bills you could pull out?
b. Would you expect to pull a pair of bills that add up to $30? Are the chances likely?
c. How did you solve the problem in part b)? Did you make a list, picture, calculation?
5. Draw the spinners to match the probabilities given
a. The probability is spinning 3 is ¼
b. The probability of spinning an even number is 5/6.
c. The probability of spinning a multiple 3 is 2/5.
d. The probability of spinning of 2 is ½.
45

Math Unit 7
Tree Diagram
Example #1
46
A tree diagram is a useful tool for solving probability equations.
When you toss a coin, for instance, there is a 50:50 chance it will land on heads:
When you toss the coin two times, the branches expand yet again:
You can calculate the overall possibility by multiplying along the branches and adding up the outcomes. The outcomes ALWAYS add up to 1.
Math Unit 7
You are at a soccer game, and love being goalkeeper, but that depends on who the coach is.
When Sam is the coach, you have a 0.5 chance of being goalie.
When Alex is the coach, you have a 0.3 chance of being goalie
Sam is the coach more often, about 6 out of 10 games. So what is the probability you will be goalie today?
The probability of getting Sam is 60%, so the probability of getting Alex is 40%. Okay, so now you know that Sam is probably going to be the coach. What is the probability you will get to be goalie?
If Alex is the coach, what is the chance you will get to be goalie?
Example #2: Rock, paper, scissors
Step 1: Make a group of 3
Step 2: choose a partner to keep track of results using a tree diagram.
Step 3: Scribe writes names of students in first branches of diagram. How many possible outcomes are there? Three. Draw three branches
47
Math Unit 7
off of each name.
Step 4: Predict the odds of each person choosing rock, paper or scissors
Step 5: play 18 games. Keep track of the results of each player.
Step 6: Check back to your guess. How close were you?
Example #3: Weather forecast
Mrs. Clement is planning a outdoors lesson and is hoping for good weather. She looks at the last seven days weather forecast. What is the probability that it will rain on Tuesday?
Draw a tree diagram that shows the possible outcomes for weather the following week, based on this week’s weather forecast.
Step 1: write the possible outcomes: rain, partly cloudy, cloudy
Step 2: Under each possibility, write the fraction for the 8-day week displayed (hint: 3 out of 8 days are rainy)
Step 3: following each path, what are the possible outcomes for the following week?
48
Math Unit 7
BONUS: Probability of love
Step 1: watch the film: http://www.youtube.com/watch?v=we05r3ec1Ag
Step 2: draw tree diagrams for the various situations shown in the movie
Step 3: compare your answers with someone else
Helpful movies:
http://www.youtube.com/watch?v=x1rMdKCu6tU
Due Date:______________
Show You Know
1. Find three examples of probability used in the real world. Draw a tree chart that explains the chances demonstrated in these examples
For example: McDonald’s Monopoly- There is a 1:2,345,023 chance of winning a car. Will I be taking a car
49
Math Unit 7
home any time soon? Likely...no… See http://www.wisebread.com/cracking-the-infamous-mcdonalds-monopoly-game for more information.
50
Math Unit 7
Outliers
Something that is situated away from or classed differently from a main or related body
A statistical observation that is markedly different in value from the others of the sample
51
Malcolm Gladwell, “Outliers” http://www.youtube.com/watch?v=Hz4hPbHIZ6Y

Math Unit 7
At the grocery store:
Marks on a test:
Runners in a marathon:
52
Math Unit 7
Explore1. The following table gives the math scores of 10 friends:
a. Are there any outliers? How did you find out?
b. What is the mean?
2. The temperatures (in °F) recorded at Exton at noon on each day for two weeks were as follows:
81, 78, 77, 75, 80, 82, 84, 78, 74, 75, 49, 71, 76, 80
If the outlier is excluded, what was the mean temperature?
53
Why are outliers important?
Data that deviates from the norm Random events Variables Patterns
Math Unit 7
Dependent & Independent Events
Key words:
Dependent = replace it: put it back
Example: pulling a marble out of a bag
Independent = don’t replace itExample: spinning a spinner twice
Example #1: If I have a bag of starbursts. What is the probability that I will pull out a lemon flavour?
If I pull out a colour and then put it back, this is an independent eventIf I pull out a colour, and then take another colour, this is a dependent event
Example #2:
1. Make up an event using spinners, dice,
54
Video: https://www.youtube.com/watch?v=ZRzZX2aN3I0
Math Unit 7
To Recap:
Tables and diagrams organize outcomes Probability is the likelihood of something happening Favourable outcomes are the successful results in an experiment Outcomes are the results of a probability experiment
Each of the mean, median and mode is a measure of central tendency, or average
The mean is the number, divided by the set of objects The median is the middle number The mode is the number that occurs the most Probability comes in ranges: unlikely, likely, even
Range is the difference between the largest and smallest numbers An outlier is a number that is much greater or much less than the
average An independent event is one event that has no effect on the
outcomes of another event A tree diagram is used to organize outcomes
Stats Poster Competition:
1. Choose one of the following topics (if you would like to propose your own, please see me by: _______________)
Environment
55

Math Unit 7
Social media School
Community Sports
2. Create a poster on a topic that you are passionate about.3. Create a hypothesis about the results.4. Collect evidence and data5. Build graphs and charts. Write explanations for your
information
Example posters may be found at: http://magazine.amstat.org/blog/2012/08/01/posterproject2012winners/
56
Please read these rules carefully Posters must measure between 18 and 24 inches high and 24 and 30 inches wide. Any layers of paper on posters must be affixed securely. Any weight paper is permitted. Posters must be the original design and creation of the entrants themselves. Computer graphics may be used. Subject matter is the choice of the participant(s) or their classmates. An example of the original data, brief descriptions of method of collection and purpose
of the experiment must be taped to the back of the poster. Cite references for published data. Do not show data tables on the front of the poster. Reading off numbers is not the point of the display.
Paperclip (do not glue nor staple) the entry form to the front of each poster. Each poster must have one accompanying entry form. Posters without entry forms will not be judged.
Be sure the poster itself gives no information that identifies the team or school. Students may work individually or in teams :
For those in the K-3 category, there is no restriction on the size of the team; it may be as large as the entire class.
For other grade categories, the maximum number of team members is 4 students. For teams with members from different grades, the highest grade determines the
entry category.