hazop procedure - documents & reports - all...
TRANSCRIPT
The Egyptian Natural Gas Company
Prepared by:
Abo Homos-Nubaria
Natural Gas Pipeline,
Egypt
QUANTITATIVE RISK ASSESSMENT
July 2011

Abo Homos-Nubaria Pipeline QRA
TABLE OF CONTENTS
1 Executive Summary...................................................................................................32 Introduction.................................................................................................................73 Technical Definitions..................................................................................................84 Project Description...................................................................................................10
Pipeline Route.................................................................................................................................... 10Pipeline Design Criteria...................................................................................................................... 10Valve Room Locations........................................................................................................................11Major Crossings.................................................................................................................................. 11
Design Gas Composition and Flow Rate..................................................................................125 Assessment of Risks................................................................................................136 Methodology.............................................................................................................147 Plan of Work.............................................................................................................168 Operation of the Pipeline..........................................................................................179 Emergency Plan.......................................................................................................1810 Weather Data........................................................................................................1911 Release Scenarios................................................................................................2512 Impairment Criteria................................................................................................2813 Flammability Assessment......................................................................................29
13.1 General........................................................................................................................2913.2 Process Hydrocarbons................................................................................................30
14 Consequence Modelling Input Data......................................................................3115 Sensitivity Analysis................................................................................................3416 Ignited Release Scenario......................................................................................37
16.1 Generic Causes of Release........................................................................................3716.2 Generic Causes of Ignition..........................................................................................37
17 Typical Fire Consequence Analysis......................................................................3917.1 Hydrocarbon Releases................................................................................................39
17.1.1 Gaseous Release.................................................................................................................3917.1.2 Liquid Release......................................................................................................................4017.1.3 Toxic Gas release................................................................................................................41
17.2 Fire..............................................................................................................................4117.2.1 Flash Fire............................................................................................................................. 4317.2.2 Unobstructed Jet Fires.........................................................................................................4417.2.3 Obstructed Jet Fires.............................................................................................................45
18 Release Scenarios................................................................................................4719 Consequence Modelling Results...........................................................................49
19.1 70Bar - Full Bore Rupture [32 Inch] - Vertical Release - Gas Dispersion...................5119.2 70Bar - Full Bore Rupture [32 Inch] - Vertical Release - Jet Fire................................5219.3 70Bar - Major Leak [16 Inch] - Vertical Release - Gas Dispersion..............................6319.4 70Bar - Major Leak [16 Inch] - Vertical Release - Jet Fire..........................................6419.5 70Bar - Minor Leak [1 Inch] - Vertical Release - Gas Dispersion................................6519.6 70Bar - Minor Leak [1 Inch] - Vertical Release - Jet Fire............................................6619.7 70Bar - Depressurization Case [10 Inch Vent at 10 Meter Height].............................6719.8 Explosion Case...........................................................................................................68
20 Likelihood Data......................................................................................................5920.1 Process Release.........................................................................................................59
1

Abo Homos-Nubaria Pipeline QRA
20.2 Ignition Probability.......................................................................................................5921 Risk Assessment...................................................................................................60
21.1 Risk Assessment Basis...............................................................................................6021.2 Risk Assessment for Buried Underground Pipeline....................................................6021.3 Risk Assessment for Aboveground Pipeline...............................................................60
22 Risk Evaluation......................................................................................................6123 Risk Reduction Measures (Recommendations)....................................................6224 Uncertainty Analysis..............................................................................................6325 References............................................................................................................6426 Appendix-1 FRED Simulation Cases for PRS.......................................................65
26.2 Table of Contents........................................................................................................6526.3 70Bar - Full Bore Rupture [32 Inch] - Vertical Release...............................................65
26.3.1 Scenario Summary...............................................................................................................6526.3.2 Jet Fire................................................................................................................................. 6726.3.3 Pool Chart............................................................................................................................ 6926.3.4 Dispersion............................................................................................................................ 7026.3.5 Warnings.............................................................................................................................. 71
26.4 70Bar - Half Bore Rupture [16 Inch] - Vertical Release...............................................7267.4.1 Scenario Summary...............................................................................................................7267.4.2 Jet Fire................................................................................................................................. 7467.4.3 Pool Chart............................................................................................................................ 7667.4.4 Dispersion............................................................................................................................ 7767.4.5 Warnings.............................................................................................................................. 78
26.5 70Bar - Minor Leak [1 Inch] - Vertical Release............................................................7926.5.1 Scenario Summary...............................................................................................................7926.5.2 Jet Fire................................................................................................................................. 8126.5.3 Pool Chart............................................................................................................................ 8326.5.4 Dispersion............................................................................................................................ 8426.5.5 Warnings.............................................................................................................................. 85
26.6 70Bar - Depressurization [10 Inch] - Vertical Release................................................8626.6.1 Scenario Summary...............................................................................................................8626.6.2 Jet Fire................................................................................................................................. 8826.6.3 Pool Chart............................................................................................................................ 9026.6.4 Dispersion............................................................................................................................ 9226.6.5 Warnings.............................................................................................................................. 93
26.7 Explosion [Confined space].........................................................................................9326.7.1 Scenario Summary...............................................................................................................9326.7.2 Pressure Decay with Distance Chart....................................................................................9426.7.3 Warnings.............................................................................................................................. 94
2

Abo Homos-Nubaria Pipeline QRA
1 Executive Summary
Quantitative risk assessment study (QRA) has been performed for the Abo Homos-Nubaria Gas Pipeline 32" Gas Pipeline for the Egyptian natural Gas Company (GASCO).
The scope of this quantitative risk assessment (QRA) study is to perform consequence modelling analysis and risk assessment of the overall pipeline, while the pipeline inlet and outlet facilities are outside the scope of this study.
In order to perform consequence modelling analysis of the potential hazardous scenarios resulting from loss of containment of the pipeline, some assumptions and design basis have been proposed.
the pipeline release orientation have been proposed to be a vertical release, which is considered for buried underground pipeline releasing the entrapped materials in the vertical direction upwards (represents the actual release scenario). Other release orientations represent the exaggerated release scenario.
For the pipeline leak scenario, the release rate has been simulated based on 3-hole sizes as follows:
Full bore rupture (32-inchs); Half bore rupture (16-inches); Pin hole leak (1-inch).
The first leak size is a full bore rupture of the pipeline (32 inch leak), which presents a hole diameter equivalent to the pipeline diameter. This scenario presents the worst case scenario for maximum release rate in order to represent a catastrophic release scenario.
The second leak size is a half bore rupture of the pipeline (16 inch leak), which presents a hole diameter equivalent to half the pipeline diameter. This scenario presents the severe case scenario for a reduced release rate in order to represent a major release scenario.
The third leak size is a one inch hole in the pipeline (1 inch leak), which presents a pin hole in the pipeline wall or small deformation equivalent to the one inch hole in diameter. This scenario presents the mild case scenario for a reduced release rate in order to represent a minor release scenario.
FRED has been selected for the consequence modeling of different types of hazardous consequences modeling presented as follows:
Jet fires (resulting from immediate ignition). Gas clouds and Flash fires (resulting from delayed ignition),
Weather conditions have been selected based on wind speed and stability class for the greater Cairo area detailed weather statistics.
3

Abo Homos-Nubaria Pipeline QRA
The worst case weather conditions have been selected for consequence modelling represented by wind speed of 10 m/s and stability class "D" representing prevailing weather conditions, in order to obtain conservative results.
The gas dispersion distances have been calculated in meters in concentration terms of Lower Flammability Limits (LFL) and Upper Flammability Limits (UFL) presented by Part Per Million (PPM) concentrations in order to represent the flammability range of the released gas cloud; however the extent of damage is presented by LFL only.
The heat radiation from flash fires will not significantly affect humans, equipment or structures outside the 12.5 (Kw/m2) heat radiation envelopes due to the short duration of flash fires [in terms of milliseconds].
Since the jet fire is originally a high momentum directed jet release, hence the effects of wind direction, wind speed or atmospheric stability on the jet flame are minimal.
The jet fire (flame length) and heat radiation distances are measured in meters.
The extent of harmful effects on humans is presented by the distance to the heat radiation contour of 12.5 (Kw/m2) and the extent of damage for equipment is presented by the flame length (frustum).
Fire consequence analysis has been described in details in fire consequence effects section, which details the hazardous effects from different types of fires.
For the purposes of the hazard analysis and consequence modelling, a number of representative release scenarios and physical impact cases are defined in as per Table below.
Table 1.1: Representative Release CasesRelease
OrientationHole Size / Leak Type
Hole Size (Inch)
Press. (Bar)
Hazardous Scenario Case Identification
1.0Vertical ReleaseOrientation
Full Bore Rupture(Catastrophic Failure)
32 Inch 70
Gas Dispersion
70Bar - Full Bore Rupture [12 Inch] - Vertical Release - Gas Dispersion
Jet Fire 70Bar - Full Bore Rupture [12 Inch] - Vertical Release - Jet Fire
Half Bore Rupture(Major Leak)
16 Inch 70
Gas Dispersion
70Bar - Half Bore Rupture [6 Inch] - Vertical Release - Gas Dispersion
Jet Fire 70Bar - Half Bore Rupture [6 Inch] - Vertical Release - Jet Fire
Pin Hole(Minor Leak) 1 Inch 70
Gas Dispersion
70Bar - Pin Hole leak [1 Inch] - Vertical Release - Gas Dispersion
Jet Fire 70Bar - Pin Hole leak [1 Inch] - Vertical Release - Jet Fire
Jet Fire 70Bar - Pin Hole leak [1 Inch] - Horizontal Release - Jet Fire
2.0Depressurization
PlannedDepressurization
10 Inch 70 Gas Dispersion
70Bar - Depressurization [10 Inch] - Vertical Release - Gas Dispersion
3.0Explosion N/A N/A N/A Explosion Explosion scenario
4

Abo Homos-Nubaria Pipeline QRA
Pipeline release generic failure frequencies and ignition probabilities have then been identified for the detailed quantitative risk assessment (QRA) purposes from E&P Forum, UKOPA and EGIG.
The failure rate of buried underground pipelines is lower than aboveground pipelines due to the protection from third parties impacts and adverse atmospheric conditions.
On the other hand, the probability of occurrence of a pipeline full bore leak (catastrophic failure) is deemed to be much lower than a half bore leak.
Quantitative risk assessment (QRA) has been performed to all types of the modelled hazardous events (flash fires and jet fires).
The risks have been assessed for the industrial workers and general public representing the two types of risk namely the "Individual Risk" and "Societal Risk".
From the risk assessment and the international risk acceptance criteria the risk evaluation for individual and societal risk presented in the following table.
Table 1.2 Buried Underground Pipeline Orientation Risk Evaluation Summary TableNo Risk Type Calculated Risk ALARP Limits Risk Acceptance1.0 Individual Risk 6.60E-08 1.0E-03 to 1.0E-05 Acceptable (√)2.0 Societal Risk 6.60E-07 1.0E-04 to 1.0E-06 Acceptable (√)
It has been concluded that the risk falls within the Acceptable limits for the individual risk to workers and public for the pipeline. However, the following measures (recommendations) should be adhered:
Ensure pipeline design, commissioning, start-up, construction and operation is complying with code requirements (ASME B31.8 Gas Transmission and Distribution Piping Systems).
Ensure Signs or markers shall be installed where it is considered necessary to indicate the presence of a pipeline at road, highway, railroad, and stream crossings. Additional signs and markers shall be installed along the remainder of the pipeline at locations where there is a probability of damage or interference (ASME B31.8 requirement).
Signs or markers and the surrounding right-of way shall be maintained so markers can be easily read and are not obscured (ASME B31.8 requirement).
The signs or markers shall include the words “Gas" (or name of gas transported) Pipeline,” the name of the operating company, and the telephone number (including area code) where the operating company can be contacted (ASME B31.8 requirement).
Ensure Overpressure protection is provided by a device or equipment installed in a gas piping system that prevents the pressure in the system or part of the system from exceeding a predetermined value (ASME B31.8 requirement).
Emergency Response plan (ERP) to include means for detection pipeline leak or rupture also, means for safe and quick isolation of the damaged section of the pipeline.
5

Abo Homos-Nubaria Pipeline QRA
Finally, uncertainty analysis has been performed in order to verify and ensure that certainty of the results obtained from the consequence modelling analysis and quantitative risk assessment are certain and none of the scenarios or input factors have been neglected or underestimated.
Hence, the risk shall be within the acceptable and tolerable limits, if the pipeline is buried underground and all safe design precautions have been considered and strictly followed in the design, construction and operation of the Pipeline.
6
Abo Homos-Nubaria Pipeline QRA
2 Introduction
This report represents the Quantitative risk assessment study (QRA) performed for the Abo Homos-Nubaria Gas Pipeline 32" Gas Pipeline for the Egyptian natural Gas Company (GASCO).
The scope of this quantitative risk assessment (QRA) study is to perform consequence modelling analysis and risk assessment of the overall pipeline, while the pipeline inlet and outlet facilities are outside the scope of this study.
Objectives:
The primary objective is to perform a quantitative risk assessment to identify the major risk issues and contributors with a “best estimate” of the associated levels of risk for the pipeline and its boundaries and crossings.
In general the work will cover, but not necessarily be limited to, the following:
o Define data to be provided,
o Review key project data,
o Perform physical survey of the pipeline route to identify possible ‘hot spots’,
o Define possible accident scenarios and events,
o Conduct a full consequence analysis in relation to gas leaks and fire scenarios,
o Perform quantitative risk assessment,
o Conduct ALARP risk reduction/mitigation review,
o Define possible risk elimination/reduction measures,
o Propose residual risk control measures.
7

Abo Homos-Nubaria Pipeline QRA
3 Technical Definitions
Confinement A qualitative or quantitative measure of the enclosure or partial enclosure areas where vapors cloud may be contained.
Congestion A qualitative or quantitative measure of the physical layout, spacing, and obstructions within a facility that promote development of a vapor cloud explosion.
EERA Escape, Evacuation and Rescue Assessment
ESD Emergency Shut Down
FRA Fire Risk Assessment
Gas cloud dispersion
Gas cloud air dilution naturally reduces the concentration to below the LEL or no longer considered ignitable (typically defined as 50% of the LEL).
Hazard An inherent physical or chemical characteristic (flammability, toxicity, corrosivity, stored chemical or mechanical energy) or set of conditions that has the potential for causing harm to people, property, or the environment.
Individual risk The risk to a single person inside a particular building. Maximum individual risk is the risk to the most-exposed person and assumes that the person is exposed.
QRA Quantitative Risk Assessment
Risk Relates to the probability of exposure to a hazard, which could result in harm to personnel, the environment or general public. Risk is a measure of potential for human injury or economic loss in terms of both the incident likelihood and the magnitude of the injury or loss.
Risk assessment
The identification and analysis, either qualitative or quantitative, of the likelihood and outcome of specific events or scenarios with judgments of probability and consequences.
8

Abo Homos-Nubaria Pipeline QRA
Vapor cloud explosion (VCE)
An explosion in air of a flammable material cloud
9

Abo Homos-Nubaria Pipeline QRA
4 Project Description
Pipeline Route
The Abo Homos-Nubaria gas pipeline starts from the outlet of a gas collection unit at Abo Homos, and extends to the southwest for 400 m. It then turns to the southeast and runs parallel to the ring road to Basnatawy for 2.5 km, and then extends toward the south, intersecting El-Mahmoudiya canal, Cairo-Alexandria railway, and Cairo-Alexandria road near the El-Azmaly estate. It follows the eastern side of El-Khadra canal, and then follows the Damanhour canal eastward for 2.5 km until turning south for 1 km to cross the Abdel Hamid canal and continue along it briefly for 500 m. The pipeline turns southeast and again follows the Damanhour canal at the east side of the Sharawa estate. The pipeline crosses the road to Hosh Issa, and then runs parallel to the Khairy drain along the western side for about 15 km, until it nears a transformer station at El-Nagareen estate. The path crosses the Ferhash canal and continues eastward alongside it, then turns south with the Abo Shousha canal. It crosses El-Hagar canal and runs along its southern side for 11.5 km, and then crosses back to the northern side before El-Haddayn estate. The pipeline passes north of El-Ashraf, then turns south to cross the Nubaria canal and continue along it for 3 km, then once again turns south, crossing the Alexandria-Embaba railway, and finally reaching the Nubaria power station.
Pipeline Design Criteria
At the minimum, the pipeline will be built, operated, and maintained to the standards of ASME B31.8, which dictates the use of good engineering practices for public safety in all conditions and local regulations as a minimum, along with any additional local regulations. as well as other relevant high standards for pipeline routing with consideration for nearby settlements.
Settled areas along the pipeline are classified by population density, which is used to determine the Location Class, as defined in Table 4-1. Location Classes are used to determine the design criteria appropriate for different sections of the pipeline. They are also used in determining the amount of surveillance activity to be conducted.
Table 4-1: Determination of Location Class
Generally a zone 200m wide is considered on either side of the route of the pipeline. To include a maximum number of buildings for human occupancy, the pipeline route is also divided lengthwise into sections of 1 mile. Within a multiple dwelling unit, each separate dwelling unit is counted as a separate
10

Abo Homos-Nubaria Pipeline QRA
building. However, ASME B31.8 does not provide restrictions on the proximity of a pipeline to a building or group of buildings, which can lead to pipelines being constructed close to buildings (and vice versa).
The following proximity limits should be applied to all pipeline design and to new buildings developed close to existing pipelines.
No pipeline operating at a pressure greater than 7 bar must can be within 3m of a building in residential areas, and 6m desert areas.
Any pipeline closer than 25 m to a normally occupied building should operate at a pressure that is 40% of the material yield strength or less, and have a wall thickness of at least 0.375".
Any pipeline closer than 12.5m to a normally occupied building should operate at a pressure that is 40% of the material yield strength or less, and be laid with greater than or equal to 0.5" wall thickness.
Wall thickness is also increased at road crossings, and impact protection measures (cast in site or pre - cast concrete slab) shall be provided on all pipeline crossings. Warning tape is placed above and below such impact protection.
Valve Room Locations
Eight (8) valve rooms will be constructed along the pipeline, in the following locations:
valve room (1) at zero km (Abo Homos collection station) valve room (2) at 7 km valve room (3) at 10 km valve room (4) at 24 km valve room (5) at 43 km valve room (6) at 54.5 km valve room (7) at 59.5 km valve room (8) at 65 km (Nubaria power station)
Major Crossings
There are many crossing that the proposed pipeline route encounters. Some of them will be crossed using an open trench, but major crossings and waterways will be crossed using the Horizontal Directional Drilling (HDD) technique. The following crossings will be encountered:
Mahmoudiya Canal – 5.3 km Cairo-Alexandria Agricultural Road and Railway – 8.5 km El-Khadra Canal – 9.2 km Hosh Issa Road – 15.8 km El-Zamarana Canal – 23.1 km Ferhash Road – 39.3 km El-Hagar Canal – 43.9 km Zohor El-omra Canal – 54 km Nubaria Canal – 63 km
11

Abo Homos-Nubaria Pipeline QRA
Design Gas Composition and Flow Rate
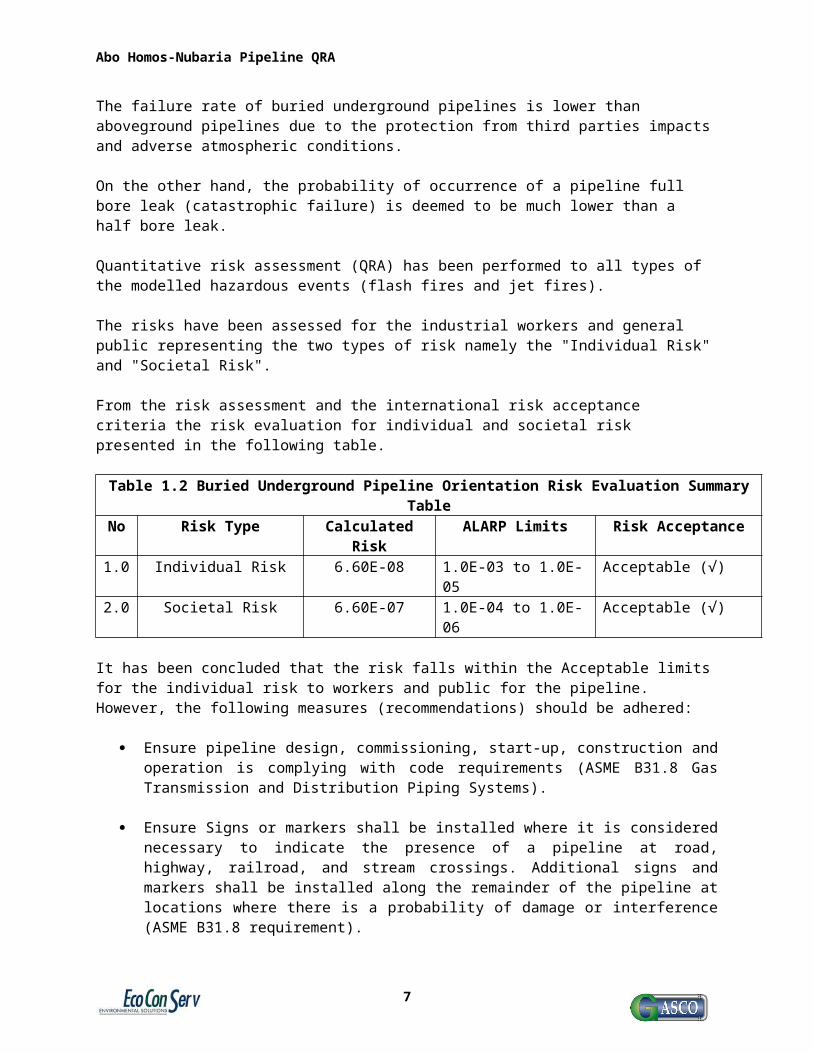
The main stream of natural gas will come from the national network once the pipeline has been filtered. The pipeline is designed to transport the gas at a maximum inlet pressure of 70 bar. The compositions of the gas coming from the national network are indicated in the table below.
Table 4-2: National Network Gas Composition [Reference: GASCO]
ContaminantsLean Gas
CompositionRich Gas Composition
Carbon Dioxide CO2 0.150 3.990
Nitrogen N2 0.760 0.050
Oxygen O2 0.000 0.000
Hydrogen H2 0.000 0.000
Methane CH4 97.313 80.224
Ethane C2H6 1.710 10.069
Propane C3H8 0.040 3.880
iso-Butane i-C4. 0.020 0.570
n-Butane n-C4. 0.000 0.6899
iso-Pentane i-C5 0.000 0.2100
n-Pentane n-C5 0.000 0.1200
n-Hexane n-C6 0.000 0.1200
n-Heptane n-C7 0.000 0.0700
n-Octane n-C8 0.000 0.00
n-Nonane n-C9 0.000 0.000
Total 100.000 100.000
Gas delivered will be commercially free of materials and dust or other solid or liquid matter which may interfere with the operation of lines.
12

Abo Homos-Nubaria Pipeline QRA
5 Assessment of Risks
This part of the study would address the identification, analysis and subsequent assessment of major hazards associated with the relevant onshore pipeline.
They are categorised, and makes judgement on the tolerability of risks to personnel associated with these hazards. The international criteria for risk tolerability are used to base such judgements.
Scenarios that could result in major hazards will be identified and evaluated using Quantified Risk Assessment ‘QRA’. This technique is used to establish the expected frequency of such incidents occurring on each facility and their consequences.
This section will be linked to the rest of the proposed study in order to tie together the logic of the arguments and bring the findings into better context. It will encompass:
o Policy, Standards and Criteria,
o The sources of hazards,
o Hazardous substances, and their inventories,
o Events which are capable to cause major accidents,
o Analysis of the consequences and their effects on employees, third parties and the public,
o Evaluation of individual and societal risks, using International Risk Tolerability Criterion,
o Measures to prevent, control or minimise likely consequences,
o Emergency procedures and emergency systems, derived from consideration of the above issues.
From these studies, risk reduction measures are identified, and improvements to the hardware and the management systems are considered.
13

Abo Homos-Nubaria Pipeline QRA
6 Methodology
The proposed QRA methodology is shown in Figure 6.1.
Failure CaseDefinition
ScenarioDevelopment
FrequencyAnalysis
Analysis ofConsequences
Impact Assessment
Estimate/Measure Risks
Evaluate Risks
Decide RiskMitigation Measures
UGD Criteria
Verify
Pipeline Data IdentifyHazards
Failure CaseDefinition
ScenarioDevelopment
FrequencyAnalysis
Analysis ofConsequences
Impact Assessment
Estimate/Measure Risks
Evaluate Risks
Decide RiskMitigation Measures
BG Criteria
Verify
Pipeline Data IdentifyHazards
Failure CaseDefinition
ScenarioDevelopment
FrequencyAnalysis
Analysis ofConsequences
Impact Assessment
Estimate/Measure Risks
Evaluate Risks
Decide RiskMitigation Measures
UGD Criteria
Verify
Pipeline Data IdentifyHazards
Failure CaseDefinition
ScenarioDevelopment
FrequencyAnalysis
Analysis ofConsequences
Impact Assessment
Estimate/Measure Risks
Evaluate Risks
Decide RiskMitigation Measures
BG Criteria
Verify
Pipeline Data IdentifyHazards
FIGURE 6.1 QRA Risk Assessment Frame-work
14

Abo Homos-Nubaria Pipeline QRA
The QRA Criteria for risk tolerability is shown in Figure 6.2.
ALARPRegion
1 in 10,000
ALARPRegion
1 in 1000
1 in 100,0001 in 1 million
Individual Risk to Personnel Individual Risk to the Public
ALARPRegion
1 in 10,000
ALARPRegion
1 in 1000
1 in 100,0001 in 1 million
Individual Risk to Personnel Individual Risk to the Public
FIGURE 6.2 International Gas Criteria for the QRA Risk Tolerability
15
Abo Homos-Nubaria Pipeline QRA
7 Plan of Work
The plan of work includes the following:
o Review the relevant facilities documentation.
o Carry out a physical survey of the pipeline route in order to identify the potential hot spot.
o Identify the prevailing weather conditions.
o Set the QRA methodology.
o Investigate generic and specific release scenarios.
o Define the impairment criteria.
o Perform flammability assessment.
o Select the appropriate consequence modelling software to be used.
o Perform sensitivity analysis.
o Define ignited release scenarios.
o Define the consequence modelling analysis input data.
o Perform consequence modelling analysis using the selected modelling software.
o Define failure frequencies (frequency assessment).
o Perform risk assessment.
o Risk evaluation with respect to international risk acceptance criterion.
o Investigate risk reduction measures and corrective actions (as applicable).
16

Abo Homos-Nubaria Pipeline QRA
8 Operation of the Pipeline
The pipeline is provided with an automatic shutdown valve (ESDV) at the pipeline start. This ESDV is included within the inlet station facilities at the pipeline start.
Also, another automatic shutdown valve (ESDV) shall be installed at the pipeline end. This ESDV shall be included within the receiving station facilities at the pipeline end.
Other inline sectionalizing valves are manual isolation valves installed on different intervals on the pipeline route in order to minimize leaks and potential failures.
Flow measurements are provided for the pipeline to facilitate flow measurement and leakage indication.
17

Abo Homos-Nubaria Pipeline QRA
9 Emergency Plan
Emergencies in Stations:
There is an emergency plan for the existing pipelines.
Actions in response to the emergency cases are generally restricted to the isolation of valves, reporting the incident and follow up with relevant authorities.
Gas Pipeline:
The Company has an emergency booklet that covers the main gas transmission line and customers.
There is also an emergency room dedicated for such emergencies. Emergencies are prioritised at different levels, and include the following:
o Gas leaks (instrumentation and equipment),
o Gas explosion,
o Natural events to include earthquakes, heavy rain and external events.
Response to these emergencies focus on isolation and reporting for actions.
18

Abo Homos-Nubaria Pipeline QRA
10 Weather Data
The Weather Data relevant to this study consists of a list of weather conditions in the form of different combinations of wind-speed, temperature, humidity and atmospheric stability. The weather conditions are an important input into the dispersion calculations and results for a single set of conditions could give a misleading picture of the hazard potential.
Mete oceanographic data gathered for Greater Cairo over a period of 5 years. This data included wind speed and direction; air temperature and pressure, as well as current speed, direction and wave height.
The general climatic conditions at North Cairo are summarised below:
Air Temperature oC:o Minimum recorded - 1.1o Maximum recorded 52.2o Yearly average 28
Relative humidity %:o Average daily minimum 82o Average daily minimum 54o Annual average 78
The recorded annual wind speeds at Cairo are shown in Table 10.1.
Table 10.1 Wind speeds at Cairo (Knots)
Month Jan. Feb. Mar. Apr. May June July Aug. Sep. Oct. Nov. Dec
Wind speed 4.7 5.6 6.3 6.2 5.6 5.2 4.4 3.4 3.6 4.0 3.8 4.4
In wind Rose figures the radius = 10%
Average wind speed = 2.44 m/sec.
Wind Direction:
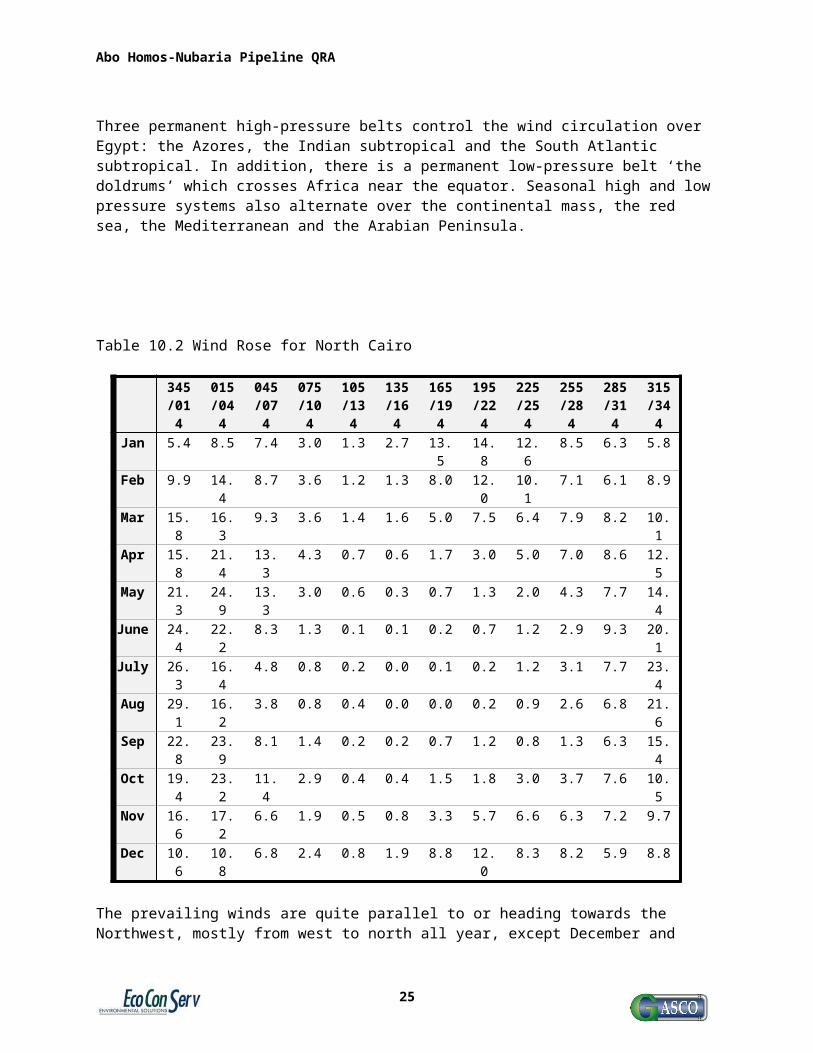
Three permanent high-pressure belts control the wind circulation over Egypt: the Azores, the Indian subtropical and the South Atlantic subtropical. In addition, there is a permanent low-pressure belt ‘the doldrums’ which crosses Africa near the equator. Seasonal high and low pressure systems also alternate over the continental mass, the red sea, the Mediterranean and the Arabian Peninsula.
19

Abo Homos-Nubaria Pipeline QRA
Table 10.2 Wind Rose for North Cairo
345/014
015/044
045/074
075/104
105/134
135/164
165/194
195/224
225/254
255/284
285/314
315/344
Jan 5.4 8.5 7.4 3.0 1.3 2.7 13.5 14.8 12.6 8.5 6.3 5.8Feb 9.9 14.4 8.7 3.6 1.2 1.3 8.0 12.0 10.1 7.1 6.1 8.9Mar 15.8 16.3 9.3 3.6 1.4 1.6 5.0 7.5 6.4 7.9 8.2 10.1Apr 15.8 21.4 13.3 4.3 0.7 0.6 1.7 3.0 5.0 7.0 8.6 12.5May 21.3 24.9 13.3 3.0 0.6 0.3 0.7 1.3 2.0 4.3 7.7 14.4June 24.4 22.2 8.3 1.3 0.1 0.1 0.2 0.7 1.2 2.9 9.3 20.1July 26.3 16.4 4.8 0.8 0.2 0.0 0.1 0.2 1.2 3.1 7.7 23.4Aug 29.1 16.2 3.8 0.8 0.4 0.0 0.0 0.2 0.9 2.6 6.8 21.6Sep 22.8 23.9 8.1 1.4 0.2 0.2 0.7 1.2 0.8 1.3 6.3 15.4Oct 19.4 23.2 11.4 2.9 0.4 0.4 1.5 1.8 3.0 3.7 7.6 10.5Nov 16.6 17.2 6.6 1.9 0.5 0.8 3.3 5.7 6.6 6.3 7.2 9.7Dec 10.6 10.8 6.8 2.4 0.8 1.9 8.8 12.0 8.3 8.2 5.9 8.8
The prevailing winds are quite parallel to or heading towards the Northwest, mostly from west to north all year, except December and January, when they are from SE. When atmospheric low pressure is passing quite frequently and fast, the wind direction will change ‘anti-clockwise’, normally during a short period of one to two days. After a low pressure has passed, the wind returns to the prevailing direction (W-NW). The mean wind speed at Cairo is 2.44 m/sec.
Data on the direction of wind at North Cairo was obtained from the Egyptian Meteorological Office. Table 10.2 shows the analysis of the 12-months wind distribution data over a period of 10 years. FIGURE 10.1 gives the average wind directions at Cairo throughout the year.
20

Jan Feb March April
May June July August
Sept Oct Nov Dec
Jan Feb March April
May June July August
Sept Oct Nov Dec
0- 2.5
2.5- 55- 7.5
7.5-10
10- 12.512.5- 15
15- 17.517.5- 20
20- 22.5
> 22.5 m/sec
N2.4
18%
5%
4%
4%3%
5%8%
5%
20%
15%
6%
7%
0- 2.5
2.5- 55- 7.5
7.5-10
10- 12.512.5- 15
15- 17.517.5- 20
20- 22.5
> 22.5 m/sec
0- 2.5
2.5- 55- 7.5
7.5-10
10- 12.512.5- 15
15- 17.517.5- 20
20- 22.5
> 22.5 m/sec
NN2.4
18%
5%
4%
4%3%
5%8%
5%
20%
15%
6%
7%
Abo Homos-Nubaria Pipeline QRA
FIGURE 10.1 Average wind directions at Cairo
The overall analysis of the wind data at Cairo is given in what is known as the wind rose. FIGURE 10.2 shows Cairo wind rose, based on data collected during 1992- 2000. Note that winds blow towards the centre of the rose.
FIGURE 10.2 the Wind Rose at Cairo
21
Abo Homos-Nubaria Pipeline QRA
Stability Categories:
The two most significant variables, which would affect the dispersion calculations, are: Wind-speed and atmospheric stability. The stability class is a measure of the atmospheric turbulence caused by thermal gradients. Pasquill Stability identifies six main categories, which are shown in the Table 10.3.
Table 10.3 Pasquill Stability CategoriesA B C D E F
Very Unstable Unstable Moderately Unstable Neutral Moderately Stable Stable
Neutral conditions correspond to a vertical temperature gradient of about 1(oC) per 100m.
Cairo weather data for the Geographical area is somewhat limited and do not show seasonal variations over a long time.
Therefore, the calculations included in this study have considered alternative stabilities for the average wind speed of 2.4 m/sec.
This was done with reasonable accuracy, since the stability is related to the wind speed, and the range of stabilities that is observed for a given wind speed is generally small, as shown in the Table 10.4.
As the range is large for a given wind speed, the calculations have initially considered four different combinations of wind speeds and stability classes to include the worst possible conditions.
The calculations have also considered atmospheric temperature (30oC), relative humidity 70% and surface roughness parameter of 0.1.
Table 10.4 The Relationship between Wind speed and Stability
Wind speed Day-timeSolar Radiation
Night-timeCloud Cover
(m/s) strong medium slight thin<3/8
medium>3/8
overcast>4/5
<2 A A-B B - - D2-3 A-B B C E F D3-5 B B-C C D E D5-6 C C-D D D D D>6 C D D D D D
At night, the ground is often cooler than the air if the sky is clear, and this gives rise to the most stable conditions and potentially the greatest effect distances.
FIGURE 10.3 shows the criteria used for the selection of weather parameters used for the consequences modelling for this study.
22

Abo Homos-Nubaria Pipeline QRA
Is the ground coveredin frost or snow?
Yes Check categoryagainst wind speed
m/s0- 6> 7
F
ENo
Is it night-time? Is sky overcast? DYes Yes
No
Sky more than half coveredCoastal sites
Inland sites
No
Sky clear?
Check category against wind speed
Check category against wind speed
m/s< 2 2> 3
F
E
D
m/s< 2
2-4> 5
F
E
D
Wind mainly from from the sea?
DYes
Time within 1 hr before sunset?
DYes
No
Y
No
Time within 1 hr after sunrise?
No
Sky clear and wind calm/light?
YesYes
No
F
D
Is sky overcast?
No Check category against wind speed
m/s0- 4
> 5
C
D
Yes
Select weather type from
Hot Warm Cool
Check category against wind speed
Check category against wind speed
Check category against wind speed
Summer only
m/s0- 4
C
D > 5
m/s< 1
1- 34- 7
A
B
C> 7
D
m/s< 3
3- 45- 8
A
B
C> 8
D
No
23

Abo Homos-Nubaria Pipeline QRA
FIGURE 10.3 Determinations of Modified Pasquill Stability Categories
Category D (neutral) is the most probable at inland sites, and appears to occur for up to 80% of the time at Cairo. To overcome the uncertainty of the accuracy of Cairo weather data results, the following cases were selected in this analysis to study the effects of normal and extreme weather conditions at Cairo.
Table 10.5 Sets of weather conditions initially selected for this study:Set 1 Set 2
Wind speed Stability Wind speed Stability2 m/s F 10 m/s D
The wind speed range between 1 to 5 m/s was considered to be reasonable representation of typical conditions at Cairo. This would overcome some of the uncertainty of the meteorological data provided by the meteorological office. Wind speeds in excess of 8 m/s are likely to disperse the cloud over long distances to well below LFL.
The weather set 2 was eventually selected to represent the most likely conditions; however the worst case conditions shall be defined by a sensitivity analysis study.
24
Abo Homos-Nubaria Pipeline QRA
11 Release Scenarios
Events associated with release, dispersion and ignition of flammable releases considered in this study can be summarized in the following figure.
Release
More obstacles Greater confinement Flame acceleration
Ignites?
Jet fire Internal explosion Pool fire Cloud fire Fast flame Safe
dispersion
Dispersing cloud
Ignites?
No
Yes No
Yes
BLEVE
Impinge?
Yes
Structural Failure
Figure 11.1 Hazardous events
These events can be more detailed as follows:
Jet fires A jet fire will result from an ignited pressurized hydrocarbon gas release. The consequence of jet fires is directional depending on the on release orientation. Jet fires typically have flame temperature of about 2,200 oF and can produce high intensity thermal radiation. The high temperature poses a hazard from direct effects of heat on humans and also from possibility of escalation. If a jet flame impinges upon a target such as a vessel, pipe or structural member, it can cause failure of the item to fail within several minutes.
Jet (spray) fire will also result from ignited continuous releases of pressurized flammable liquid. The momentum of the release carries the material forwards in
25

Abo Homos-Nubaria Pipeline QRA
a plume entraining air to give a flammable mixture as gas is released from the plume.
Flash fires If flammable gas accumulates in an unconfined area and is ignited, then the result will be a flash fire within the flammable limits of the vapour cloud.
Explosions Ignition of accumulated gas in semi-confined areas may also be accompanied by an explosion; the overpressure generated will depend on the degree of congestion and confinement of the process area, and the gas cloud size.
Pool fires If a liquid release is ignited after it has time to form a pool, a pool fire results. Because they are less well aerated, pool fires tend to have lower flame temperatures and produce lower levels of thermal radiation than jet fires. They also produce more smoke. Although a pool fire can still lead to structure failure of items within the flame, this would take longer than in a jet fire.
An additional hazard of pool fires is their ability to flow. A burning liquid pool can spread along horizontal surface or run down a vertical surface to give a running fire.
BLEVE(Fire Ball)
BLEVE stands for Boiling Liquid Expanding Vapour Explosion.
A fire ball can occur if a vessel containing fuel ruptures in the presence of an ignition source (usually a jet or pool fire). A fraction of the liquefied fuel subsequently released will evaporate immediately and take part in a huge fireball, which has the shape of a hemispherical burning cloud or ball of fire. High degree of turbulent mixing and rapid air entrainment allows large quantities of fuel to be consumed in a short period of time.
Structural failure
Loss of structure integrity due to overheating of structure members. The structure shall collapse under much lower load than the designed due to increased temperature.
Safe dispersion
Dilution of the released gases beyond the lower flammability limits (LFL) leading to safe dispersion situation.
26

Abo Homos-Nubaria Pipeline QRA
12 Impairment Criteria
This section defines the human injury and asset impairment criteria in caring out the consequence analysis of the identified hazardous events scenarios on the proposed facilities.
Table 12.1 represents standard human impact criteria as applied in consequence modelling.
Table 12.1: Criteria for Assessment of Fire Effects on HumansEvent Effect Distance to EffectJet fire / Pool fire 4.7kW/m2 Will cause pain in 15-20 seconds and injury after 30
seconds exposure.12.5 kW/m2 Significant chance of fatality for extended exposure
and high chance of injury.37.5 kW/m2 Significant chance of fatality for people exposed
instantaneously.Flash fire LFL Fatal for people in the flammable cloud pathExplosion overpressure
0.05 Bar Will cause injuries from flying debris0.2 Bar 20% chance of fatality to a person in a protected
enclosure0.3 Bar Threshold for eardrum damage,
50% chance of fatality for a person within enclosure,15% chance of fatality for a person in the open.
0.50 Bar Will cause 100 % fatality for a person within enclosure or in the open.
The criteria applied for assessment of the effects of fire on assets are summarised in Table 12.2.
Table 12.2: Criteria for Assessment of Fire Effects on AssetsImpairment Mechanism Level EffectThermal Radiation 4.7kW/m2 Impairment of evacuation/embarkation areas
6.3 kW/m2 Impairment of escape routesThermal Radiation or Flame Impingement on Load Bearing Structural Steel
500 deg.C Structural Failure.
Both jet fires and explosions can lead to structure failure of items, though this will take several times longer for jet fires than for explosions. Table 13.3 presents indicative failure times under hydrocarbon fire impact conditions, where times to failure refer to burn through or loss of load bearing capacity.
Table 12.3: Structure Failure times in Fires (Indicative)
Component Time to Failure (Min)Jet Fire Pool Fire
Unprotected structural steel beam 10 10Unprotected steel plate 5 10A-60 firewall 15 60H-120 firewall 60 120
27

Abo Homos-Nubaria Pipeline QRA
Table 12.4 reports published information on the explosion overpressure effects.
Table 12.4: Explosion Overpressure EffectsExplosion Overpressure - Bar(g) Damage
0.02 50% windows shattering0.07 Collapse of tank roof
0.07-0.14 Connection failure of corrugated panelling0.08-0.1 Minor damage to steel framework0.15-0.2 Wall of concrete blocks shattered
0.2 Collapse of steel framework0.3 "Reparable damage" cladding blown off. Offshore bridjes and lifeboats
impaired0.34 Steel walls blown off. Process plant within offshore module rupture, in
neighbouring modules damaged. 50% chance for ESD valve closure failing
1.0 Columns and buoyant deck of semi-sub ruptured2.0 Riser wall rupture
28

Abo Homos-Nubaria Pipeline QRA
13 Flammability Assessment
13.1 General
An assessment of all flammable and combustible materials present on the facilities is required to determine those materials that can be excluded from further assessment in the QRA due to low flammability and hence the low probability of ignition.
In order for a fire to start there must be an ignition source of sufficient heat intensity to cause ignition. However, after a fire has started, the heat necessary to sustain combustion is typically supplied by the combustion process.
A flammable gas or vapour burns in air only over a limited concentration range. Below a certain concentration in air, the Lower Flammability Limit (LFL), the mixture is too ‘lean’, and above a certain concentration in air, the Upper Flammability limit (UFL), the mixture is too ‘rich’ to sustain combustion.
The concentrations between these limits constitute the flammable range.
Flammability limits vary between hydrocarbon gases. For example, propane is flammable between 2.1 and 9.5% v/v. Process streams consist of a mixture of hydrocarbons and on loss of containment the flammability limits depend on the composition of the gas or vapour that is released to air.
The flash point of a flammable liquid is the temperature at which the vapour pressure is sufficient to result in a concentration of vapour in air above the liquid corresponding to the lower flammable limit.
On loss of containment or where open to the atmosphere, a hydrocarbon liquid that has a flash point below ambient temperature is readily ignitable. A liquid with a high flash point, could also ignite if raised in temperature above its flash point by an external heat source, if released as a high pressure spray that promotes vaporisation, or if soaked into lagging (insulating materials). Flash point is the main parameter in the hazard classification of flammable liquids.
The flammability of materials has been assessed using the Flammability Hazard Ranking from NFPA 325M under the categories summarised in Table 13.1. Flammable liquid classes referred to in Table 13.1 are explained in IP15.
In general, materials with a flammability rating of 3 and 4 are readily ignited and present a greater fire hazard than materials with flammability rating of 1 or 2 that require pre-heating (e.g. by an existing fire) before ignition can occur.
29

Abo Homos-Nubaria Pipeline QRA
Table 13.1: NFPA 325M Flammability RatingFlammability
RatingDescription
4This degree includes flammable gases, liquids and class IA flammable liquids. The preferred method of fire attack is to stop the flow of material or to protect exposures while allowing the fire to burn itself out.
3
This degree includes class IB and IIC flammable liquids and materials that can be easily ignited under almost all normal temperature conditions. Water may be ineffective in controlling or extinguishing fires in such materials.
2
This degree includes materials that must be moderately heated before ignition will occur and includes class II and IIIA combustible liquids and solids and semi-solids that readily give off ignitable vapours. Water spray may be used to extinguish fires in these materials because the materials can be cooled below their flash points.
1
This degree includes materials that must be pre-heated before ignition will occur, such as class IIIB combustible liquids and solids and semi-solids whose flash point exceeds 93.4ºC, as well as most ordinary combustible materials. Water may cause frothing if it sinks below the surface of the burning liquid and turns to steam. However, a water fog that is gently applied to the surface of the liquid will cause frothing that will extinguish the fire.
0 This degree includes any material that will not burn.
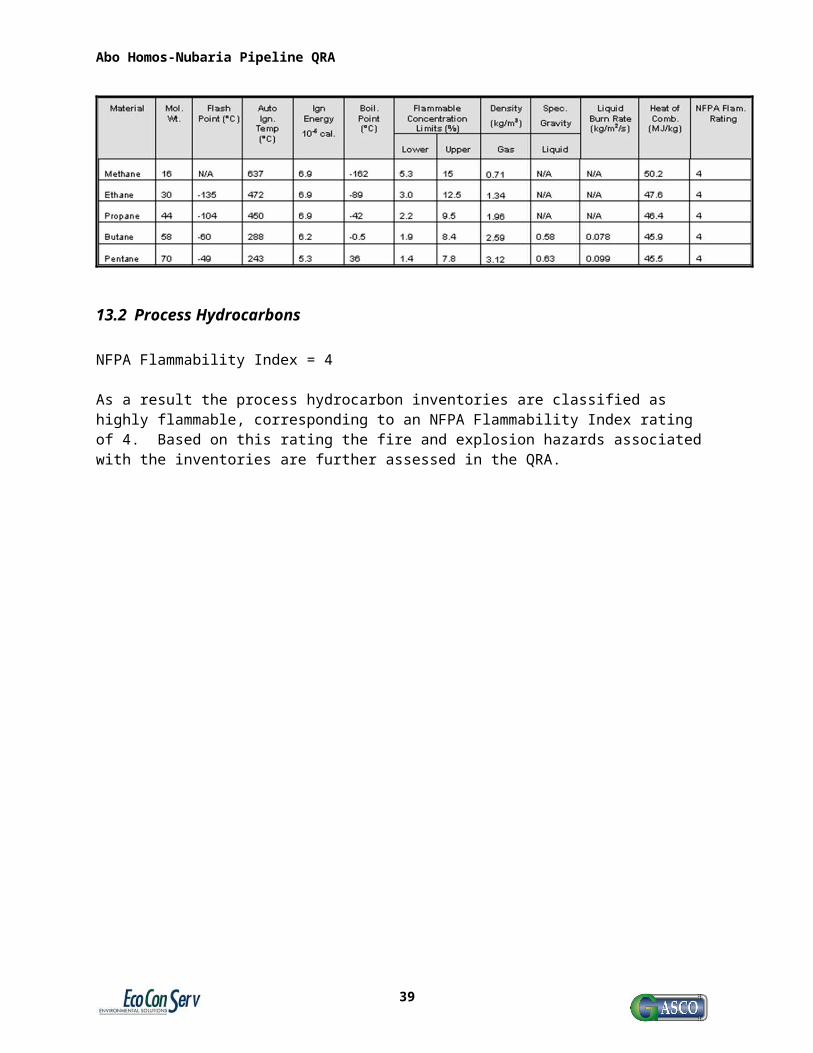
The properties of the various flammable materials present on the facilities are summarised in Table 13.2. The flammability of the various inventories is discussed in further detail in the following sections.
Table 13.2 physical properties of Selected Flammable / Combustible materials
13.2 Process Hydrocarbons
NFPA Flammability Index = 4
As a result the process hydrocarbon inventories are classified as highly flammable, corresponding to an NFPA Flammability Index rating of 4. Based on this rating the fire and explosion hazards associated with the inventories are further assessed in the QRA.
30

Abo Homos-Nubaria Pipeline QRA
14 Consequence Modelling Input Data
Consequence modelling will be used to simulate the Major Accident Events (MAE) raised from the scenario identification.
FRED determines the heat radiation contours from different fire scenarios depending on the amount of fuel burning, type of fuel and wind direction. It calculates a fluid release flow rate depending on the fluid pressure, the size and location of the hole. Also, It calculates the explosion overpressure contours resulting from the ignition of released gas inside confined space depending on the type of the fuel exploding and the degree of confinement. Finally it performs gas dispersion calculation and calculates the gas concentration contours in fraction of the lower explosive limits depending on the type of gas released, release rate, wind stability, wind speed and surface roughness.
The following simulation modules are included (detailed list):
Tank Top Fire Pool Fire Trench Fire Gas Jet Flame (known reservoir pressure) Gas Jet Flame (Known mass flow rate) Shell BLEVE BLEVE (TNO) Temperature Rise Pressurised release (known reservoir pressure) Pressurised release (known mass flow rate) Pressure relief valve Blowdown Two-Phase Blowdown LPG two-phase Explosion CAM Explosion TNO Explosion TNT Dense gas dispersion Gaussian dispersion (instantaneous) Gaussian dispersion (Continuous) Gaussian dispersion (Non boiling liquid pool) Heat Up Vessel Burst Bubble Plume
This hazardous consequence simulation is normally carried out in order to optimize the design, while on the other hand it will be used in this study to estimate the degree of danger raised from the hazardous events on the facilities under study in order to assess the associated risks.
31
Abo Homos-Nubaria Pipeline QRA
The input file is detailed as follows:
Contaminants Rich Gas Composition
Carbon Dioxide CO2 3.990
Nitrogen N2 0.050
Oxygen O2 0.000
Hydrogen H2 0.000
Methane CH4 80.224
Ethane C2H6 10.069
Propane C3H8 3.880
iso-Butane i-C4. 0.570
n-Butane n-C4. 0.6899
iso-Pentane i-C5 0.2100
n-Pentane n-C5 0.1200
n-Hexane n-C6 0.1200
n-Heptane n-C7 0.0700
n-Octane n-C8 0.00
n-Nonane n-C9 0.000
Total 100.000
Process conditions:
Process conditions:
Temperature = 50 °C Pressure = 70 bara Pressure downstream of release = 1.013 bara Use standard atmospheric pressure = yes Release source = Vapor space
Hole & release geometry:
Hole geometry:
Failure type = Custom Hole diameter = 0.8 / 0.4 / 0.025 m Discharge coefficient = 0.8
Pipe:
Pipe length = 10000 m Pipe diameter = 0.813 m
32

Abo Homos-Nubaria Pipeline QRA
Pipe surface roughness = 4.6e-005 m Sum loss coefficient = 0
Release:
Release height = 0 m Release angle from vertical = 0 / 90 deg Release angle, clockwise from North = 0 deg
Weather:
Temperature = 40 °C Relative humidity = 75 % Wind speed = 2 & 10 m/s Direction wind is going to = 180 deg (measured clockwise from North) Atmospheric stability conditions define by = Pasquill class Pasquill class = "F" stable & "D" Unstable
Thermal radiation:
Radiation contours = 1.5, 2.5, 6.3, 12.5, 32 kW/m² Height at which plan view contours to be plotted = 0 m Cross flame distance at which side view contours to be plotted = 0 m
Dispersion:
Surface roughness = 0.01 m Contours to plot: Plot type = LFL/UFL Sampling time = Instantaneous
Technical Notes:
Fred includes two methods of inputs to the discharge modelling, one is “known reservoir pressure” and the second is “known release mass flow rate”. The scenario was selected as “known reservoir pressure” in order to represent the maximum desired flow rate through the hole.
Pipe surface roughness was selected as 4.6e-005, which represents the steel material.
Different wind speeds were selected for the gas dispersion and heat radiation modelling, basically 2 m/s and 10 m/s.
Dispersion sampling time was selected to be “Instantaneous”, which represents the worst-case scenario (stricter than 10 minutes sampling).
33

Abo Homos-Nubaria Pipeline QRA
15 Sensitivity Analysis
The sensitivity analysis shall be performed in order to determine the worst case parameters (or the combination of the worst case parameters), which shall be utilized in the consequence modelling.
The sensitivity analysis shall include the following parameters:
1.0 Release flow rate:
The release flow rate depends on the size of the hole assumed to leak, which can be summarized as follows:
Catastrophic leak or full bore rupture (presents maximum release rate).
Major leak or half bore rupture (presents minimum release rate).
2.0 Release pressure:
The release pressure depends on the process design and operating pressure of the released materials, which can be summarized as follows:
The proposed maximum pipeline design pressure.
The proposed minimum pipeline design pressure.
3.0 Release temperature:
The release temperature depends on the process design and operating temperature of the released materials, which can be summarized as follows:
The proposed maximum pipeline design temperature.
The proposed minimum pipeline design temperature.
4.0 Ambient temperature:
Ambient temperature varies from high ambient temperatures in the summer to low ambient temperatures in the winter, which can be summarized as follows:
The proposed maximum ambient temperature in the summer is 40 (oC)
The proposed minimum ambient temperature in the winter is 5 (oC)
5.0 Relative humidity:
34

Abo Homos-Nubaria Pipeline QRA
Relative humidity varies from high relative humidity in the summer to low relative humidity in the winter, which can be summarized as follows:
The proposed maximum relative humidity is 90 %.
The proposed minimum relative humidity is 50 %.
6.0 Wind speed:
Wind speed varies from high wind speed to low wind speed depending on the weather conditions, which can be summarized as follows:
The proposed maximum wind speed is 10 m/s (presents very unstable weather conditions).
The proposed minimum wind speed is 2 m/s (presents very stable weather conditions).
7.0 Wind stability:
Wind stability presented as Pasquill stability classes varies from very unstable weather to very stable weather depending on the weather conditions, which can be summarized as follows:
The proposed very unstable weather is (A).
The proposed very stable weather is (F).
Different Pasquill stability classes are represented in the following table:
Number Class Description1. A Very Unstable2. B Unstable3. C Slightly Unstable4. D Neutral5. E Stable6. F Very Stable
Each of the previously mentioned parameters shall be checked with all other parameters are constant. (I.e. these parameters shall be checked one by one, and for each case all other parameters shall remain unchanged in order to determine the worst case scenario for each parameter).
From the sensitivity analysis for the gas dispersion, it can be concluded that:
1. The gas dispersion distances shall be increased by higher release flow rate.
2. The gas dispersion distances shall be increased by higher release pressures.
35
Abo Homos-Nubaria Pipeline QRA
3. The gas dispersion distances shall be increased by lower release temperatures.
4. The gas dispersion distances shall be increased by higher ambient temperatures.
5. The gas dispersion distances shall be increased by lower relative humidity.
6. The gas dispersion distances shall be increased by lower wind speeds.
7. The gas dispersion distances shall be increased by higher weather stability.
From the sensitivity analysis for the heat radiation, it can be concluded that:
1. The jet flame heat radiation distances shall be increased by higher release flow rate.
2. The jet flame heat radiation distances shall be increased by higher release pressures.
3. The jet flame heat radiation distances shall be increased by higher release temperatures.
4. The jet flame heat radiation distances shall not be affected by ambient temperatures.
5. The jet flame heat radiation distances shall not be affected by relative humidity.
6. The jet flame heat radiation distances shall be increased by higher wind speeds.
7. The jet flame heat radiation distances shall not be affected by weather stability.
From the sensitivity analysis performed, it has been concluded that there is a combination of set of parameters that gives the worst case scenarios for the gas dispersion and heat radiation, while on the opposite side; there is a combination of set of parameters that gives the mild case scenarios for the gas dispersion and heat radiation.
Both cases (the worst cases and mild cases) can be simulated using consequence modelling, however only the worst case scenarios for gas dispersion and heat radiation shall be governing in this report in order to present a conservative approach leading to conservative QRA results.
From the sensitivity analysis, the following parameters have been selected to represent the worst case scenario parameters and shall be utilized in the consequence modelling analysis:
The proposed maximum ambient temperature in the summer is 40 (oC),
The proposed minimum relative humidity in the winter is 50 %,
The proposed minimum wind speed is 2 m/s (presents very stable weather conditions),
The proposed very stable weather stability class is (F).
36

Abo Homos-Nubaria Pipeline QRA
16 Ignited Release Scenario
16.1 Generic Causes of Release
Historically, incidents involving the loss of containment of flammable/combustible material in the oil and gas facilities have occurred due to causes including:
Human error associated with operations and maintenance activities; Corrosion Erosion Fatigue/vibration/vortex shedding; Brittle fracture (e.g. due to low temperatures embrittlement); Impact (e.g. due to dropped object, projectile, impacts…etc.); Creep; Natural causes (e.g. storm, earthquake…etc); Operation beyond design envelope; Inappropriate choice of materials; and Inadequate design.
In relation to the new facilities, thorough design and the implementation by Company of an appropriate Safety Management System will ensure many of the causes listed above are either avoided or significantly reduced in potential.
16.2 Generic Causes of Ignition
Historically, the causes of ignition of released flammable/combustible material in the oil and gas facilities have included:
Flames/direct heat; Hot surfaces; Hot work (e.g. welding, flame cutting, grinding); Mechanical sparks; Electrical equipment not classified for hazardous areas; Faulty electrical equipment; Lightning; Engines; Distressed equipment (e.g. overheated bearings); Impact energy (e.g. tools, dropped objects, projectiles); Chemical energy; Static electricity; Illicit smoking; and Hot soot particles.
Similar to causes of release, the above listed causes of ignition on the new facilities will be either avoided or significantly reduced in potential through thorough design and the implementation by Company of an appropriate Safety Management System.
37

Abo Homos-Nubaria Pipeline QRA
17 Typical Fire Consequence Analysis
17.1 Hydrocarbon Releases
Hydrocarbon releases in the industry are either gaseous, mists or liquids and are either atmospheric releases or pressurized. Gas and mist releases are considered more significant since they are readily ignitable since they are in the gas state and due to the generation of vapour clouds which if ignited are instantly destructive in a widespread nature versus liquid fires that may be less prone to ignition, generally localized and relatively controllable.
The cause of a release can be external or internal corrosion, internal erosion, equipment wear, metallurgical defects, operator errors third party damage or for operational requirements.
Generally releases are categorized as:
1 Catastrophic Failure: A vessel or tank opens completely immediately releasing its contents.
2 The amount of release is dependent of the size of the container.
3 Long Rupture: A section of pipe is removed leading to two sources of gas. Each section being vented in an opening whose cross sectional areas are equal to the cross sectional area of the pipe (e.g., pipeline external impact and a section is removed).
4 Open Pipe: The end of a pipe is fully opened exposing the cross sectional area of the pipe.
5 Short Rupture: A split occurs on the side of the pipe or hose. The cross sectional area of the opening will typically be equal to the cross sectional area of the pipe or hose (e.g., pipe seam split).
6 Leak: Leaks are typically developed from valve or pump seal packing failures, localized corrosion or erosion effects and are typically "small" to "pin-hole" sized (e.g., corrosion or erosion leakages).
7 Vents, Drains, Sample Ports Failures: Small diameter piping or valves may be opened or fail which release vapours or liquids to the environment unexpectedly.
8 Normal Operational Releases: Process storage or sewer vents, relief valve outlets, tank seals, which are considered normal and acceptable practices that release to the atmosphere.
17.1.1 Gaseous Release
38
Abo Homos-Nubaria Pipeline QRA
There are a number of factors that determine the release rate and initial geometry of a hydrocarbon gas release. The most significant is whether the gas is under pressure or released at atmospheric conditions.
Depending on the release source the escaping gas can last from several minutes or hours, until the supply is isolated, depleted or fully depressurized. Common long duration sources are massive storage equipment, or long pipelines without intermediate isolation capabilities.
If released under atmospheric conditions the gas will either rise or fall depending on its vapour density and will be directed in the path of the prevailing wind. In the absence of a wind, heavier gases will collect in low points in the terrain. Normally atmospheric gas releases are dispersed within relatively close distances to their point source, usually about 3 meters (10 ft.) These atmospheric releases, if ignited, will burn relatively close to the source point, normally in a vertical position with flames of short length.
For gases released under pressure, there are a number of determining factors that influence the release rates and initial geometry of the escaping gases. The pressurized gas is released as gas jet and depending on the nature of the failure may be directed at any direction. All or part of a gas jet may be deflected by surrounding structures or equipment.
If adequate isolation capabilities are available and employed, the initial release will be characterized by high flow and momentum which decreases as isolation is applied or supplied are exhausted. Within a few pipe diameters of the release point, the pressure of released gases decreases. Escaping gases are normally very turbulent and air will immediately be drawn into the mixture. The mixing of air will also reduce the velocity of the escaping gas jet. Obstacles such overhead platforms or structures will disrupt momentum forces of any pressurized release. These releases will generally produce a vapour cloud, which if not ignited will eventually disperse in the atmosphere. Where turbulent dispersion processes are prevalent (e.g., high pressure flow, winds, congestion, etc.), the gas will spread in both horizontal and vertical dimensions while continuing mixing with available oxygen in the air. Initially escaping gases are above the UEL but with dispersion and turbulence effects they rapidly pass into the flammable limits. If not ignited and given an adequate distance they will eventually disperse below the LEL. Various computer software programs are currently available that can calculate the turbulent jet dispersion, downwind explosive atmospheric locations, and volumes for any given flammable commodity, release rates and atmospheric data input.Generally most gases have a low vapour density and will rise. In any event, the height of a gas plume will mostly be limited by the ambient atmospheric stability and wind speed. If the gases are ignited, the height of the plume will rise due to the increased buoyancy of the high temperature gases from the combustion process.
17.1.2 Liquid Release
When a liquid is released from process equipment, several things may happen, as shown in the Figure. If the liquid is stored under pressure at a temperature above its normal boiling point (superheated), it will flash partially to vapour when released to atmospheric pressure. The vapour produced may entrain a significant quantity of liquid as droplets. Some of this liquid may rainout onto the ground, and some may remain suspended as an aerosol with subsequent possible evaporation. The liquid remaining behind is likely to form a boiling pool which will continue to evaporate, resulting in additional vapour loading into the air. An example of a
39
Abo Homos-Nubaria Pipeline QRA
superheated release is a release of liquid ammonia from a pressurized container stored at ambient temperature.
17.1.3 Toxic Gas release
The inhalation of toxic gases can give rise to effects, which range in severity from mild irritation of the respiratory system to death. Lethal effects of inhalation depend on the concentration of the gas to which people are exposed and on the duration of exposure. Mostly this dependence is non linear; as the concentration increases, the time required to produce a specific injury decreases rapidly.
Immediately dangerous to life and health (IDLH) is defined as a condition that poses immediate danger to life or health, or a condition that poses a threat of severe exposure.
Two factors are considered when establishing the IDHL limits:
Personnel must be able to escape such an environment without suffering permanent health damage,
Personnel must be able to escape without severe eye or respiratory tract irritation or other condition that might impair their escape.
Immediately Dangerous to Life and Health: (IDLH) is an atmospheric concentration of any toxic, corrosive, or asphyxiate substance that poses an immediate threat to life or would cause irreversible or delayed adverse health effects or would interfere with an individual’s ability to escape from a dangerous atmosphere.
17.2 Fire
The combustion process:
Fire, or combustion, is a chemical reaction in which a substance combines with oxygen and heat is released.
Usually fire occurs when a source of heat comes into contact with a combustible material. If a combustible liquid or solid is heated it evolves vapour, and if the concentration of vapour is high enough it forms a flammable mixture with the oxygen of the air. If this flammable mixture is then heated further to its ignition point, combustion starts. Similarly, a combustible gas or vapour mixture burns if it is heated to a sufficiently high temperature.
Thus there are three conditions essential for a fire: (1) fuel, (2) oxygen, and (3) heat. These three conditions are often represented as the fire triangle.
If one of the conditions is missing, fire does not occur and if one of them is removed, fire is extinguished.
40

Abo Homos-Nubaria Pipeline QRA
Normally the heat required is initially supplied by an external source and then provided by the combustion process itself. The amount of heat needed to cause ignition depends on the form of the substance. A gas or vapour may be ignited by a spark or small flame.
Ignition of a combustible gas or vapour mixture may occur in two ways. In the first the energy for ignition is supplied by a local source such as a spark or small flame at a point within the mixture.
In the second the bulk gas mixture is heated up to its ignition temperature.
The three conditions of the fire triangle indicate how fires may be fought. The first method is to cut off the fuel. This is particularly relevant for fires caused by leaks on process plant. The second method is to remove heat. This is usually done by putting water on the fire. The third method is to stop the supply of oxygen. This may be affected in various ways, including the use of foam or inert gas.
Fire is sustained only if there is a net release of heat.
The heat comes from the combustion of fuel. If this fuel is liquid or solid, it must first be vaporized. With liquids or solids fire usually involves a process of positive feedback. The heat evolved by the fire causes the vaporization of an increasing amount of fuel and the fire spreads.
Fire growth and spread:
Fire normally grows and spreads by direct burning, which results from impingement of the flame on combustible materials, by heat transfer or by travel of the burning material.
The three main modes of heat transfer are (1) conduction, (2) convection and (3) radiation. All these modes are significant in heat transfer from fires.
Conduction is important particularly in allowing heat to pass through a solid barrier and ignite material on the other side.
Most of the heat transfer from fires, however, is by convection and radiation. It is estimated that in most fires some 75% of the heat emanates by convection. On open plant much of the heat is dissipated into the atmosphere, but in steel structures it is transferred to the steel supports.
Radiation is the other main mode of heat transfer. Although it usually accounts for a smaller proportion of the heat issuing from the fire, radiated heat is transferred directly to nearby objects, does not go preferentially upwards and crosses open spaces. For these reasons it is generally the most significant mode of transfer on open plant.
Combustion of a flammable gas/air mixture occurs if the composition of the mixture lies in the flammable range and if the conditions exist for ignition. As already mentioned, ignition may result from either (1) bulk gas temperature rise or (2) local ignition.
The combustion of the mixture occurs if the bulk gas is heated up to its auto-ignition temperature.Alternatively, combustion occurs if there is applied to the mixture a source of ignition which has sufficient energy to ignite it.
Flammability limits:
41

Abo Homos-Nubaria Pipeline QRA
A flammable gas burns in air only over a limited range of composition. Below a certain concentration of the flammable gas, the lower flammability limit, the mixture is too `lean', while above a certain concentration, the upper flammability limit; it is too `rich'.
The concentrations between these limits constitute the flammable range. The lower and upper flammability limits (LFL and UFL) are also sometimes called, respectively, the lower and upper explosive limits (LEL and UEL). They are distinct from the detonability limits.
Flammability limits are affected by pressure, temperature, direction of flame propagation and surroundings.
17.2.1 Flash Fire
A flash fire would result if a flammable vapour cloud builds up and engulfs a source of ignition, or an ignition source is introduced. The volume of the combustion products are approximately 8 times the volume of the vapour cloud, hence a flash fire would be much larger than the initial un-ignited vapour cloud. Although a flash fire can cause fatalities by flame impingement, it would be of insufficient duration to cause escalation unless it develops significant overpressure. It would then be termed a vapour cloud explosion.
Due to the short duration of a flash fire, fatalities are considered to occur only within the flame itself.
The size of the vapour cloud depends on:
Release rate; Composition; Wind conditions.
Dispersion calculations should be performed to estimate the maximum gas cloud sizes within the LFL. These have been based upon horizontal releases into open air in the same direction as the wind for various wind speeds.
The results of the gas dispersion calculations shall be represented graphically. These results will be used to assess the potential for an ignition source to be engulfed in a vapour cloud, the extent of potential flash fires and the potential for explosion.
The dispersion calculations are valid for open area releases. Releases in congested areas will not disperse so readily and this will be taken into account in the assessment of effects on personnel and asset.
The conclusions from the dispersion calculations are:
the heavier gases, propane and butane, produce similar size gas clouds for the same releases rate;
methane gas tends to rise more rapidly due to buoyancy, particularly in light wind conditions;
42

Abo Homos-Nubaria Pipeline QRA
The larger the gas cloud, the greater the size of the flash fire and potential explosion overpressure upon ignition.
17.2.2 Unobstructed Jet Fires
Gas or vapour releases from holes in high-pressure hydrocarbon inventories give rise to turbulent jet fires if ignited. With this fire type pure fuel is released through an orifice and the air required for combustion is entrained from the surrounding atmosphere. At high release rates, the jet becomes highly turbulent, entrains more air and burns hotter.
The jet lengths have been modelled using SHELL FRED (4.0). FRED uses the ‘Chamberlain’ model developed by the Shell Oil Company to derive gas jet flame lengths.
Releases from the liquid phase of a process vessel (e.g. separator) will typically be driven by the vapour pressure of the liquid. Once the gas/liquid interface falls below the level of the leak a gas jet fire release will ensue driven by the pressure of the gas in the system.
High-pressure condensate releases will atomise due to the momentum of release and vaporise due to the heat from the fire and burn as a self sustaining jet, some heavier fractions can drop out when the pressure drops to below approximately 5 bar(a), resulting in surface pool fire forming below the jet fire.
Thermal radiation isopleths are proportional to the size of the jet fire. The dimensions of 1.5, 4.7, 6.3, 12.5 and 37.5 kW/m2 isopleths shall be calculated and included on the graph to facilitate assessment of effects on personnel and impairment of safety critical systems. The jet flame length (metres) for methane releases may be approximated from the mass release rate, m (kg/s) using a power law curve as follows:
Jet Length = 13.5 m0.45 (based on BP Cirrus modelling results)
Jet flame lengths for propane, butane and condensate are approximately 15% longer than for methane.
The unobstructed jet fires will only occur from ignited releases originating from inventories at the edge of the process area and orientated outboard. These are less likely to cause damage or fatalities.
Due to the congestion presented by the equipment and pipe work, the majority of potential process fires on the process area will be obstructed. These obstructed jet fires will result in a fireball type of fire, instead of a jet fire.
For jet fires, the fire fighting systems (firewater or other fire fighting agents) are not efficient to fight such types of fires due to the high momentum release initiating such jet fires. Hence, the only way to control jet fires is to limit the isolatable inventory feeding the jet flame.
The jet fire will deplete by time due to the decrease in driving force across the release point "the hole", consequently the jet flame is expected to be reduced by time.
43

Abo Homos-Nubaria Pipeline QRA
For jet fires, it is essential to predict the approximate jet fire time duration in order to assess the extent of the hazardous consequences. Based on the isolatable section inventory within the system and the assumption that all operators are aware and trained to deal with such emergency situations, the approximate jet fire duration can be estimated as short duration fires.
If the ESD system shall operate effectively in such cases; hence the approximate jet fire durations can be estimated as too short to cause fatality, injury or massive damage to equipment.
17.2.3 Obstructed Jet Fires
Most jet fires will be obstructed due to the relatively congested layouts. These will burn as a continuous fireball. The diameter of these fireballs and the associated thermal radiation isopleths are calculated by considering the thermal radiation levels surrounding the fire.
For fires above single grade level, the radiation isopleths are in the shape of a hemisphere. The heat radiated through the hemispherical skin is assumed to be equal to the heat generated by the burning as follows:
Surface area of a hemisphere, A = 2лr2
Hence Q.(2.л.r2) = m.H.p
And r = √(m.H.p/2.л.Q)
Where Q = Heat flux (kW/m2)
p = Proportion of heat radiated (typically 20%)H = Heat of Combustion (kJ/kg)m = Burning Rate (kg/s) (equivalent to release rate)r = Radius (m)
The actual fireball radius is estimated based on setting Q at 150 kW/m2, which gives a conservative fire size. Curves are also calculated for the 1.5, 4.7, 6.3, 12.5 and 37.5 kW/m2 isopleths.
For fires between multiple levels structure, the radiation isopleth is assumed to be in the shape of a cylinder, the height of which is the distance between decks.
The equilibrium equation for this case is calculated as follows:
Surface area of a cylinder (excluding ends), A = 2.л.r
Hence Q.(2.л.h.r) = m.H.p
And r = (m.H.p/2.л.h.Q)
Where h = Height (or length) of cylinder (m)
44

Abo Homos-Nubaria Pipeline QRA
For instance, a fireball in the centre of the deck level associated with a release rate greater than approximately 5 kg/s would produce fatal radiation levels to a distance about 20m from the fire source. In reality, the fire would soon become ventilation limited and would tend to fill the area with flames lapping out around the perimeter.
45

Abo Homos-Nubaria Pipeline QRA
18 Release Scenarios
For the purposes of the hazard analysis and consequence modelling, a number of representative release scenarios and physical impact cases are defined in as per Table 19.1.
Table 19.1: Representative Release Cases
Release Orientation
Hole Size / Leak Type
Hole Size
(Inch)Press. (Bar)
Hazardous Scenario Case Identification
1.0Vertical ReleaseOrientation
Full Bore Rupture(Catastrophic Failure)
32 Inch 70
Gas Dispersion
70Bar - Full Bore Rupture [12 Inch] - Vertical Release - Gas Dispersion
Jet Fire
70Bar - Full Bore Rupture [12 Inch] - Vertical Release - Jet Fire
Half Bore Rupture(Major Leak)
16 Inch 70
Gas Dispersion
70Bar - Half Bore Rupture [6 Inch] - Vertical Release - Gas Dispersion
Jet Fire
70Bar - Half Bore Rupture [6 Inch] - Vertical Release - Jet Fire
Pin Hole(Minor Leak) 1 Inch 70
Gas Dispersion
70Bar - Pin Hole leak [1 Inch] - Vertical Release - Gas Dispersion
Jet Fire70Bar - Pin Hole leak [1 Inch] - Vertical Release - Jet Fire
Jet Fire70Bar - Pin Hole leak [1 Inch] - Horizontal Release - Jet Fire
3.0Depressurization
PlannedDepressurization
10 Inch 70 Gas Dispersion
70Bar - Depressurization [10 Inch] - Vertical Release - Gas Dispersion
4.0Explosion N/A N/A N/A Explosion Explosion scenario
46

Abo Homos-Nubaria Pipeline QRA
The full details of the cases / runs are presented in Appendix-1 including the following data:
Process stream composition:
Process conditions:
Hole & release geometry:
Hole geometry:
Pipeline details:
Release details:
Weather details:
Thermal radiation contours:
Dispersion calculations.
Also, the full details of all cases / runs presented in Appendix-1 including the following figures:
Jet fire side view;
Jet fire top view;
Impingement flame probability of occurrence side view;
Flammable pollutant dispersal side view;
Flammable pollutant dispersal side view;
Actual plan top view (scenario actual plan view).
47

Abo Homos-Nubaria Pipeline QRA
19 Consequence Modelling Results
In order to perform consequence modelling analysis of the potential hazardous scenarios resulting from loss of containment, some assumptions and design basis have been proposed.
the pipeline release orientation have been proposed to be a vertical release, which is considered for buried underground pipeline releasing the entrapped materials in the vertical direction upwards (represents the actual release scenario). Other release orientations represent the exaggerated release scenario.
For the pipeline leak scenario, the release rate has been simulated based on 3-hole sizes as follows:
Full bore rupture (32-inchs); Half bore rupture (16-inches); Pin hole leak (1-inch).
The first leak size is a full bore rupture of the pipeline (32 inch leak), which presents a hole diameter equivalent to the pipeline diameter. This scenario presents the worst case scenario for maximum release rate in order to represent a catastrophic release scenario.
The second leak size is a half bore rupture of the pipeline (16 inch leak), which presents a hole diameter equivalent to half the pipeline diameter. This scenario presents the severe case scenario for a reduced release rate in order to represent a major release scenario.
The third leak size is a one inch hole in the pipeline (1 inch leak), which presents a pin hole in the pipeline wall or small deformation equivalent to the one inch hole in diameter. This scenario presents the mild case scenario for a reduced release rate in order to represent a minor release scenario.
FRED has been selected for the consequence modeling of different types of hazardous consequences modeling presented as follows:
Jet fires (resulting from immediate ignition). Gas clouds and Flash fires (resulting from delayed ignition),
Weather conditions have been selected based on wind speed and stability class for the greater Cairo area detailed weather statistics.
The worst case weather conditions for gas dispersion is the stable weather conditions, represented by wind speed of 2 m/s and stability class "F" representing "Very Stable" weather conditions, in order to obtain conservative results.
The gas dispersion distances have been calculated in meters in concentration terms of Lower Flammability Limits (LFL) and Upper Flammability Limits (UFL) presented by Part Per Million (PPM) concentrations in order to represent the flammability range of the released gas cloud; however the extent of damage is presented by LFL only.
48

Abo Homos-Nubaria Pipeline QRA
The heat radiation from flash fires will not significantly affect humans, equipment or structures outside the 12.5 (Kw/m2) heat radiation envelopes due to the short duration of flash fires [in terms of milliseconds].
Since the jet fire is originally a high momentum directed jet release, hence the effects of wind direction, wind speed or atmospheric stability on the jet flame are minimal.
The jet fire (flame length) and heat radiation distances are measured in meters.
The extent of harmful effects on humans is presented by the distance to the heat radiation contour of 12.5 (Kw/m2) and the extent of damage for equipment is presented by the flame length (frustum).
The following figures present the gas cloud distances in meters which consequently represent the extent of damage distances to the LFL for different pressure profiles, different release orientations and different leak sizes (release rates), as a result from the consequence modelling simulation analysis performed.
Since the gas is heavier than air, the released plume tends to disperse on the ground level depending on the weather conditions of the area, which in general is more likely to meet an ignition source leading to flash fire.
19.1
49

Abo Homos-Nubaria Pipeline QRA
19.1 Rupture [32 Inch] - Vertical Release - Gas Dispersion
50

Abo Homos-Nubaria Pipeline QRA
19.2 70Bar - Full Bore Rupture [32 Inch] - Vertical Release - Jet Fire
51

Abo Homos-Nubaria Pipeline QRA
19.3 70Bar - Major Leak [16 Inch] - Vertical Release - Gas Dispersion
52

Abo Homos-Nubaria Pipeline QRA
19.4 70Bar - Major Leak [16 Inch] - Vertical Release - Jet Fire
53

Abo Homos-Nubaria Pipeline QRA
19.5 70Bar - Minor Leak [1 Inch] - Vertical Release - Gas Dispersion
54

Abo Homos-Nubaria Pipeline QRA
19.6 70Bar - Minor Leak [1 Inch] - Vertical Release - Jet Fire
55

Abo Homos-Nubaria Pipeline QRA
19.7 70Bar - Depressurization Case [10 Inch Vent at 10 Meter Height]
56

Abo Homos-Nubaria Pipeline QRA
19.8 Explosion Case
57

Abo Homos-Nubaria Pipeline QRA
20 Likelihood Data
20.1 Process Release
A summary of historical pipeline failure data from some of the best sources of data for land-based pipelines are summarized in the following table (based on E&P Forum, CONCAWE, PARLOC and EGIG):
Table 21.1 Comparison of Pipeline Failure Rate DataNo. Source Failure rate / year / Km1 US Gas Pipelines (1985 – 1994) 1.66 X 10⁻⁴
2 US hazardous liquid pipelines (1986 – 1998) 8.05 X 10⁻⁴
3 CONCAWE European Oil Pipelines (1990 – 1998) 3.25 X 10⁻⁴
4 European Gas Pipeline Incident Data group (1970 – 1997) 4.77 X 10⁻⁴
The pipeline leak frequency shall be extracted to be (2.2 X 10⁻⁴).
20.2 Ignition Probability
The probability of ignition depends on the availability of a flammable mixture, the flammable mixture reaching an ignition source and the type of ignition source (energy etc.).
The ignition sources may include:
Hot work Faults in electrical equipment Faults in rotating equipment Ignition caused by combustion engines or hot surfaces Automatic ignition in the event of a fracture or rupture Static electricity Open flame
Generic ignition probabilities have been taken from Lees.
Ignition probability data are provided for gas release based on mass release rate.
Typical ignition probability data are given in Table 21.2.
Table 21.2 Ignition Probability Data
Mass Release Category Mass Release Rate (Kg / Sec) Ignition ProbabilityGas Oil
Minor < 1 0.01 0.01Major 1 – 50 0.07 0.03Massive > 50 0.3 0.08
58
Abo Homos-Nubaria Pipeline QRA
21 Risk Assessment
21.1 Risk Assessment Basis
Risk shall be determined for both workers and public using international risk management guidelines as a reference. The risk will be compared with international risk acceptance criteria.
Risk assessment will comprise the following items:
Failure rate, Ignition probability, Occupancy, Vulnerability.
Where:
Failure rate: is the failure frequency.
Ignition Probability: is the likelihood of a release to become a fire or explosion.
Occupancy: is the personnel presence in the area. [10 workers assumed to be present outdoors].
Vulnerability: is the likelihood that the specific person will be fatally injured by the effect of the event (determined from the consequence modelling software).
21.2 Risk Assessment for Buried Underground Pipeline
Individual risk for buried underground pipeline
IR = 6.6 X 10⁻⁸ per year
Societal risk for buried underground pipeline
SR = 6.6 X 10⁻⁷ per year
59

Abo Homos-Nubaria Pipeline QRA
22 Risk Evaluation
Risk assessment shall be evaluated based on the international risk acceptance criteria (Figure 22.1).
The ALARP principle has been adopted for risk evaluation. The ALARP region is that point at which the time, effort difficulty and cost of further risk reduction become out of proportion compared with the amount of risk reduction achieved.
The international risk acceptance criteria are presented in the following figure.
UNACCEPTABLE REGION
ACCEPTABLE REGION
ACCEPTABLE REGION
(Risk must be demonstrated to have been reduced to a level which is
practicable with a view to cost/benefit)
INDIVIDUAL RISK TO WORKERS(including contractor employees)
INDIVIDUAL RISK TO THE PUBLIC(all those not directly involved with company
activities)
ALARP Benchmark existing installations1 in 5,000 per year
ALARP Benchmark new installations 1 in 50,000 per year
ALARP OR TOLERABILITY REGIONALARP OR TOLERABILITY
REGION
Maximum tolerable limit1 in 1000 per year
Maximum tolerable limit1 in 10,000 per year
Minimum tolerable limit1 in 1 million per year
Minimum tolerable limit1 in 100,000 per year
WorkersPublic
Figure 22.1 International Risk Acceptance Criteria
From the risk assessment and the international risk acceptance criteria the risk evaluation for individual and societal risks for both pipeline orientations are presented in the following tables.
Table 22.1 Buried Underground Pipeline Orientation Risk Evaluation Summary TableNo Risk Type Calculated Risk ALARP Limits Risk Acceptance1.0 Individual Risk 6.60E-08 1.0E-03 to 1.0E-05 Acceptable (√)2.0 Societal Risk 6.60E-07 1.0E-04 to 1.0E-06 Acceptable (√)
60
Abo Homos-Nubaria Pipeline QRA
23 Risk Reduction Measures (Recommendations)
Risk reduction measures (Recommendations) may include reducing the risk by several technically feasible methods, generally are as follows:
Measures to eliminate the risk.
Measures to reduce the exposure of personnel to the hazards.
Measures to reduce the frequency of occurrence.
Measures to mitigate the consequences if the event does occur.
Measures to improve evacuation in case of emergency (event occurs).
It has been concluded that the risk falls within the Acceptable limits for the individual risk to workers and public for the pipeline. However, the following measures (recommendations) should be adhered:
Ensure pipeline design, commissioning, start-up, construction and operation is complying with code requirements (ASME B31.8 Gas Transmission and Distribution Piping Systems).
Ensure Signs or markers shall be installed where it is considered necessary to indicate the presence of a pipeline at road, highway, railroad, and stream crossings. Additional signs and markers shall be installed along the remainder of the pipeline at locations where there is a probability of damage or interference (ASME B31.8 requirement).
Signs or markers and the surrounding right-of way shall be maintained so markers can be easily read and are not obscured (ASME B31.8 requirement).
The signs or markers shall include the words “Gas" (or name of gas transported) Pipeline,” the name of the operating company, and the telephone number (including area code) where the operating company can be contacted (ASME B31.8 requirement).
Ensure Overpressure protection is provided by a device or equipment installed in a gas piping system that prevents the pressure in the system or part of the system from exceeding a predetermined value (ASME B31.8 requirement).
Emergency Response plan (ERP) to include means for detection pipeline leak or rupture also, means for safe and quick isolation of the damaged section of the pipeline.
61

Abo Homos-Nubaria Pipeline QRA
24 Uncertainty Analysis
Uncertainty analysis is performed to define the uncertainty data in the input model, underestimation of consequences, neglected items, assumed points, exaggeration points or overestimation.
In this QRA study all input data have been selected based on the worst case scenarios. The selection of the worst case scenarios shall result in conservative design leading to conservative results.
A list of worst case scenarios and conservative assumptions include the following:
Selection of the minimum wind speed of 2 m/s with stability class "F" in order to represent a "Very Stable" weather conditions in the consequence modelling calculations.
Selection of the maximum ambient temperature of 40 C in the consequence modelling calculations.
Selection of the minimum relative humidity of 50% in the consequence modelling calculations.
The maximum operating pressure has been selected as the simulation pressure.
Simulation sampling time has been selected as "Instantaneous" in stead of 10-minutes sampling to investigate the maximum plume length in order to achieve conservative results.
Selection of the maximum hole size to be the controlling case. The selected 2-hole sizes are 32-inch, representing catastrophic failure as a full bore rupture and 16-inche representing major leak as a half bore rupture.
The release direction (release orientation) has been selected in the direction towards the populated area under study representing the worst case directional orientation.
The prevailing wind direction has been selected in the direction towards the populated area under study representing the worst case wind direction.
The highest failure rate has been selected as the basis for failure data.
The highest ignition probability has been selected for all ignition probability data.
The vulnerability of all hazardous events has been selected on the worst case scenario.
Hence, there is no uncertainty in the QRA calculations and all the calculated risks are certain.
62
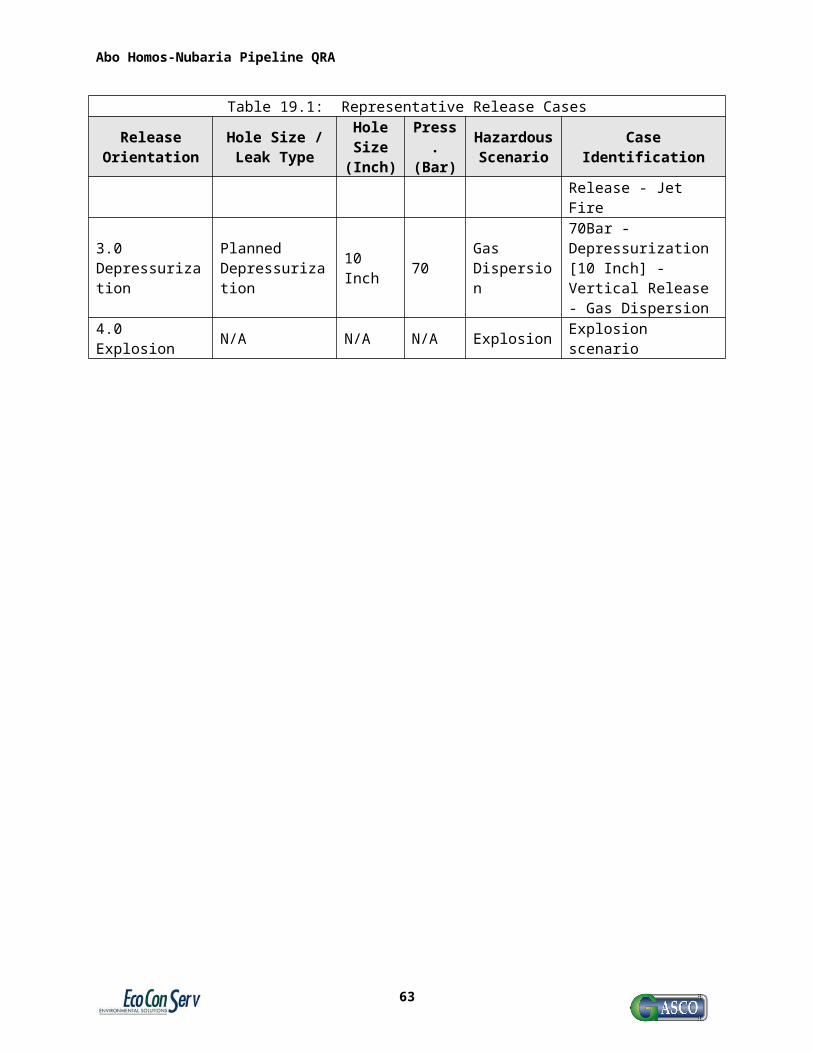
Abo Homos-Nubaria Pipeline QRA
25 References
1. NFPA 325M,
2. FRED Version (4.0) documentation,
3. Frank P. Lees, Loss Prevention in the Process Industries, 2001,
4. API-581, Risk Based Inspection recommended practice,
5. E&P Forum,
6. Project Documents.
63

Abo Homos-Nubaria Pipeline QRA
26 Appendix-1 FRED Simulation Cases for PRS
Author EcoConServCompany EcoConServDepartment HSERevision 0Notes QRA - Consequence ModellingRevision date 24 July 2011
26.2 Table of Contents
70Bar - Full Bore Rupture [32 Inch] - Vertical Release70Bar - Half Bore Rupture [16 Inch] - Vertical Release70Bar - Minor Leak [1 Inch] - Vertical Release70Bar - Depressurization [10 Inch] - Vertical ReleaseExplosion [Confined space]
26.3 70Bar - Full Bore Rupture [32 Inch] - Vertical Release
26.3.1 Scenario Summary
26.3.1.1 ScenarioScenario = 70Bar - Full Bore Rupture [32 Inch] - Vertical Release Fluid = Natural gas
26.3.1.2 Process conditionsCalculate at = User input pressure Temperature = 40 °C Pressure = 70 bara
26.3.1.2.1 Pressure downstream of release Pressure = 1.013 bara Use standard atmospheric pressure = yes
26.3.1.2.2 Release from Release source = Vapour space
64

Abo Homos-Nubaria Pipeline QRA
26.3.1.3 Hole & release geometry
26.3.1.3.1 Hole geometry Failure type = Custom Hole diameter = 0.799 m Discharge coefficient = 0.8
26.3.1.3.2 Pipe Pipe length = 0 m
26.3.1.3.3 Release Release height = 0 m Release angle from vertical = 0 deg Release angle, clockwise from North = 0 deg
26.3.1.4 Weather
26.3.1.4.1 Ambient conditions Temperature = 40 °C Relative humidity = 75 % Wind speed = 10 m/s Direction wind is going to = 0 deg (measured clockwise from North)
26.3.1.4.2 Atmospheric stability conditions Define by = Pasquill class Pasquill class = D Neutral
26.3.1.5 Thermal radiationRadiation contours = 1.58, 4.73, 6.31, 9.46, 37.5 kW/m² Height at which plan view contours to be plotted = 0 m Cross flame distance at which side view contours to be plotted = 0 m
26.3.1.6 DispersionSurface roughness = 0.1 m Contours to plot: 47226.4 ppm 148597.8 ppm Plot type = LFL/UFL Sampling time = Instantaneous
26.3.1.7 Release summaryMass flow rate = 5571.0 kg/s Flux = 11110.9 kg/m²/s Static exit pressure = 35.59 bara Exit temperature = -55.14 °C Exit density = 35.6 kg/m³ Exit velocity = 312.1 m/s Residence time = 0 s Vapour fraction at exit = 1 mol/mol Expanded exit velocity = 623.4 m/s Air equivalent source diameter = 3.079 m
65

Abo Homos-Nubaria Pipeline QRA
26.3.1.8 Release CompositionMolecular Weight of Release = 18.13 kg/kmol Component Weight
Fraction norm
Mole Fraction
norm
Critical Temp °C
Critical Pressure
bara
Molecular Weight kg/kmol
Atmos BP °C
Freeze Pt °C
Heat of Comb kJ/kg
n-Butane 0.0321 0.0100 152.1 37.41 58.12 -0.5001 -138.4 45742.7Propane 0.0487 0.0200 96.7 41.91 44.1 -42.1 -187.7 46383.8Ethane 0.0829 0.0500 32.18 48.08 30.07 -88.6 -182.8 47514.8Methane 0.7966 0.9000 -82.6 45.35 16.04 -161.5 -182.5 50043.9Nitrogen 0.0155 0.0100 -146.9 33.56 28.01 -195.8 -210 0Carbon dioxide 0.0243 0.0100 31.06 72.86 44.01 -86.9 -56.6 0
26.3.1.9 Reservoir summary (at reservoir pressure)Bubble point temperature = n/a Dew point temperature = n/a Vapour fraction = 1
26.3.1.9.1Properties of phases
Vapour LiquidMolecular weight (kg/kmol) 18.13 0Density (kg/m³) 55.5 0Enthalpy (kJ/kmol) 193.3 0Entropy (kJ/kmol*K) -29.46 0Cv (kJ/kg*K) 1.725 0Cp (kJ/kg*K) 2.627 0Sound velocity (m/s) 414.8 0Viscosity (e-3 kg/m*s) 0.01354 0Surface tension (e-3 N/m) 0 0
26.3.2 Jet Fire
26.3.2.1 Jet Fire SummaryFlame length (of frustum) = 233.6 m Cone width of flame base = 34.82 m Cone width of flame end = 103.3 m Flame lift-off = 121.9 m
Flame angle from vertical = 24.55 deg Flame angle, clockwise from North = 0 deg
Surface emissive power = 258.1 kW/m² Fraction of heat radiated = 0.05906 Total combustion power = 264788.1 MW Heat of combustion = 47529.6 kJ/kg
66

Abo Homos-Nubaria Pipeline QRA
26.3.2.2 Side view
Raw plot data
26.3.2.3 Top view
67

Abo Homos-Nubaria Pipeline QRA
Raw plot data
26.3.2.4 Impingement
Raw plot data
26.3.3 Pool Chart
26.3.3.1 No pool can form
68

Abo Homos-Nubaria Pipeline QRA
26.3.4 Dispersion
26.3.4.1 Dispersion SummaryContour value (ppm) 47226.4 148597.8
Downwind distance (m) 72.92 19.03
Height above ground (m) 161.7 91.96
Mass in plume between specified limits = 241723.0 kg Volume of plume containing this mass = 225706.0 m³ Pollutant-only mass in this volume = 13477.4 kg Specified minimum = 4.723 vol% Specified maximum = 100 vol%
26.3.4.2 Jet - side
Raw plot data
69

Abo Homos-Nubaria Pipeline QRA
26.3.4.3 Jet - top
Raw plot data
26.3.5 Warnings1 - Temperature outside experimental range -5 to 15 C2 - Pressure outside experimental range 0 to 20 bara3 - Pressure downstream parameter has not been experimentally determined4 - Warning: some vapour condenses - assume metastable flow5 - Dew point calculation not possible at requested pressure6 - Ambient temperature outside extrapolated range -5 to 30 C7 - Mass flow rate outside extrapolated range 0 to 100 kg/s8 - Ambient temperature outside experimental range 0 to 15 C9 - Release height outside experimental range 0.5 to 100 m10 - Mass flow rate outside experimental range 0 to 30 kg/s11 - Contour value outside experimental range 0 to 35 kW/m212 - Ambient pressure parameter has not been experimentally determined13 - Release height increased above surface roughness
70

Abo Homos-Nubaria Pipeline QRA
top
26.4 70Bar - Half Bore Rupture [16 Inch] - Vertical Release
26.4.1 Scenario Summary
26.4.1.1 ScenarioScenario = 70Bar - Half Bore Rupture [16 Inch] - Vertical Release Fluid = Natural gas
26.4.1.2 Process conditionsCalculate at = User input pressure Temperature = 40 °C Pressure = 70 bara
26.4.1.2.1 Pressure downstream of release Pressure = 1.013 bara Use standard atmospheric pressure = yes
26.4.1.2.2 Release from Release source = Vapour space
26.4.1.3 Hole & release geometry
26.4.1.3.1 Hole geometry Failure type = Custom Hole diameter = 0.4 m Discharge coefficient = 0.8
26.4.1.3.2 Pipe Pipe length = 0 m
26.4.1.3.3 Release Release height = 0 m Release angle from vertical = 0 deg Release angle, clockwise from North = 0 deg
26.4.1.4 Weather
26.4.1.4.1 Ambient conditions Temperature = 40 °C Relative humidity = 75 % Wind speed = 10 m/s Direction wind is going to = 0 deg (measured clockwise from North)
71

Abo Homos-Nubaria Pipeline QRA
26.4.1.4.2 Atmospheric stability conditions Define by = Pasquill class Pasquill class = D Neutral
26.4.1.5 Thermal radiationRadiation contours = 1.58, 4.73, 6.31, 9.46, 37.5 kW/m² Height at which plan view contours to be plotted = 0 m Cross flame distance at which side view contours to be plotted = 0 m
26.4.1.6 DispersionSurface roughness = 0.1 m Contours to plot: 47226.4 ppm 148597.8 ppm Plot type = LFL/UFL Sampling time = Instantaneous
26.4.1.7 Release summaryMass flow rate = 1396.2 kg/s Flux = 11110.9 kg/m²/s Static exit pressure = 35.59 bara Exit temperature = -55.14 °C Exit density = 35.6 kg/m³ Exit velocity = 312.1 m/s Residence time = 0 s Vapour fraction at exit = 1 mol/mol Expanded exit velocity = 623.4 m/s Air equivalent source diameter = 1.542 m
26.4.1.8 Release CompositionMolecular Weight of Release = 18.13 kg/kmol Component Weight
Fraction norm
Mole Fraction
norm
Critical Temp °C
Critical Pressure
bara
Molecular Weight kg/kmol
Atmos BP °C
Freeze Pt °C
Heat of Comb kJ/kg
n-Butane 0.0321 0.0100 152.1 37.41 58.12 -0.5001 -138.4 45742.7Propane 0.0487 0.0200 96.7 41.91 44.1 -42.1 -187.7 46383.8Ethane 0.0829 0.0500 32.18 48.08 30.07 -88.6 -182.8 47514.8Methane 0.7966 0.9000 -82.6 45.35 16.04 -161.5 -182.5 50043.9Nitrogen 0.0155 0.0100 -146.9 33.56 28.01 -195.8 -210 0Carbon dioxide 0.0243 0.0100 31.06 72.86 44.01 -86.9 -56.6 0
26.4.1.9 Reservoir summary (at reservoir pressure)Bubble point temperature = n/a Dew point temperature = n/a Vapour fraction = 1
26.4.1.9.1Properties of phases
Vapour Liquid
72

Abo Homos-Nubaria Pipeline QRA
Molecular weight (kg/kmol) 18.13 0Density (kg/m³) 55.5 0Enthalpy (kJ/kmol) 193.3 0Entropy (kJ/kmol*K) -29.46 0Cv (kJ/kg*K) 1.725 0Cp (kJ/kg*K) 2.627 0Sound velocity (m/s) 414.8 0Viscosity (e-3 kg/m*s) 0.01354 0Surface tension (e-3 N/m) 0 0
26.4.2 Jet Fire
26.4.2.1 Jet Fire SummaryFlame length (of frustum) = 134.5 m Cone width of flame base = 20.02 m Cone width of flame end = 51.73 m Flame lift-off = 70.07 m
Flame angle from vertical = 25.13 deg Flame angle, clockwise from North = 0 deg
Surface emissive power = 254.5 kW/m² Fraction of heat radiated = 0.06782 Total combustion power = 66362.8 MW Heat of combustion = 47529.6 kJ/kg
26.4.2.2 Side view
73

Abo Homos-Nubaria Pipeline QRA
Raw plot data
26.4.2.3 Top view
Raw plot data
26.4.2.4 Impingement
74

Abo Homos-Nubaria Pipeline QRA
Raw plot data
26.4.3 Pool Chart
26.4.3.1 No pool can form
75
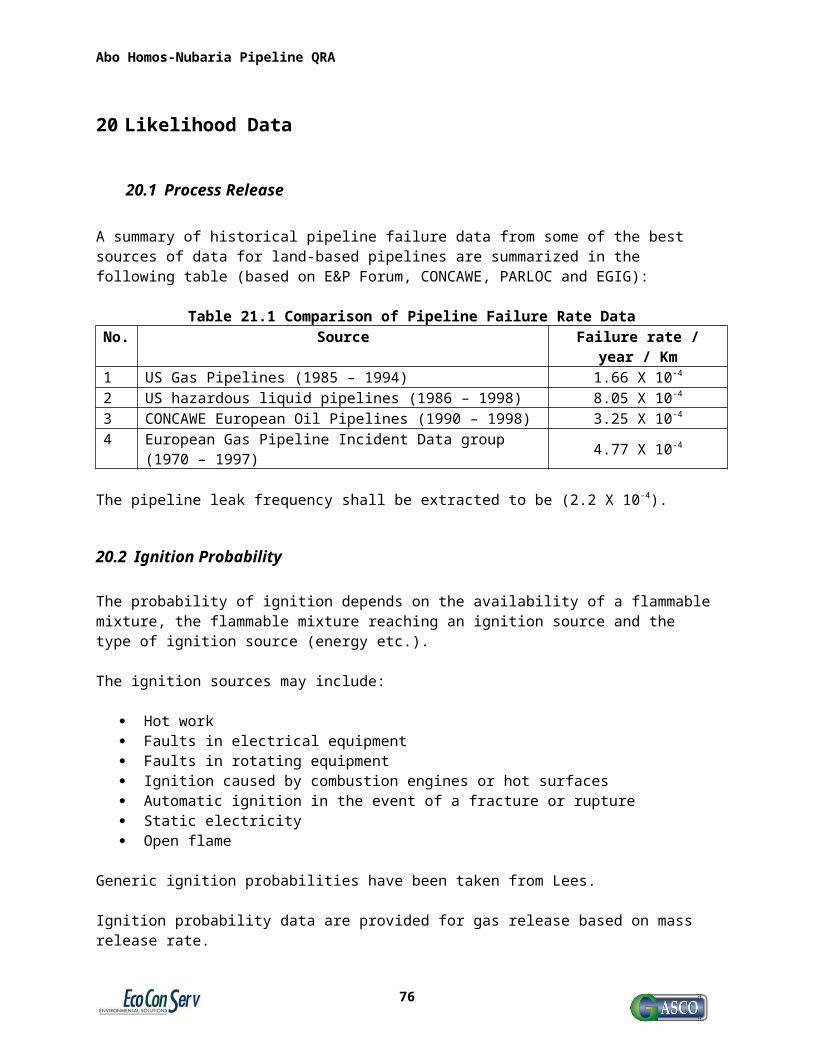
Abo Homos-Nubaria Pipeline QRA
26.4.4 Dispersion
26.4.4.1 Dispersion SummaryContour value (ppm) 47226.4 148597.8
Downwind distance (m) 35.66 9.302
Height above ground (m) 87.76 48.9
Mass in plume between specified limits = 32911.3 kg Volume of plume containing this mass = 30607.4 m³ Pollutant-only mass in this volume = 1815.5 kg Specified minimum = 4.723 vol% Specified maximum = 100 vol%
26.4.4.2 Jet - side
Raw plot data
76

Abo Homos-Nubaria Pipeline QRA
26.4.4.3 Jet - top
Raw plot data
26.4.5 Warnings1 - Temperature outside experimental range -5 to 15 C2 - Pressure outside experimental range 0 to 20 bara3 - Pressure downstream parameter has not been experimentally determined4 - Warning: some vapour condenses - assume metastable flow5 - Dew point calculation not possible at requested pressure6 - Ambient temperature outside extrapolated range -5 to 30 C7 - Mass flow rate outside extrapolated range 0 to 100 kg/s8 - Ambient temperature outside experimental range 0 to 15 C9 - Release height outside experimental range 0.5 to 100 m10 - Mass flow rate outside experimental range 0 to 30 kg/s11 - Contour value outside experimental range 0 to 35 kW/m212 - Ambient pressure parameter has not been experimentally determined13 - Release height increased above surface roughness
77

Abo Homos-Nubaria Pipeline QRA
top
26.5 70Bar - Minor Leak [1 Inch] - Vertical Release
26.5.1 Scenario Summary
26.5.1.1 ScenarioScenario = 70Bar - Minor Leak [1 Inch] - Vertical Release Fluid = Natural gas
26.5.1.2 Process conditionsCalculate at = User input pressure Temperature = 40 °C Pressure = 70 bara
26.5.1.2.1 Pressure downstream of release Pressure = 1.013 bara Use standard atmospheric pressure = yes
26.5.1.2.2 Release from Release source = Vapour space
26.5.1.3 Hole & release geometry
26.5.1.3.1 Hole geometry Failure type = Custom Hole diameter = 0.0254 m Discharge coefficient = 0.8
26.5.1.3.2 Pipe Pipe length = 0 m
26.5.1.3.3 Release Release height = 0 m Release angle from vertical = 0 deg Release angle, clockwise from North = 0 deg
26.5.1.4 Weather
26.5.1.4.1 Ambient conditions Temperature = 40 °C Relative humidity = 75 % Wind speed = 10 m/s Direction wind is going to = 0 deg (measured clockwise from North)
78

Abo Homos-Nubaria Pipeline QRA
26.5.1.4.2 Atmospheric stability conditions Define by = Pasquill class Pasquill class = D Neutral
26.5.1.5 Thermal radiationRadiation contours = 1.58, 4.73, 6.31, 9.46, 37.5 kW/m² Height at which plan view contours to be plotted = 0 m Cross flame distance at which side view contours to be plotted = 0 m
26.5.1.6 DispersionSurface roughness = 0.1 m Contours to plot: 47226.4 ppm 148597.8 ppm Plot type = LFL/UFL Sampling time = Instantaneous
26.5.1.7 Release summaryMass flow rate = 5.63 kg/s Flux = 11110.9 kg/m²/s Static exit pressure = 35.59 bara Exit temperature = -55.14 °C Exit density = 35.6 kg/m³ Exit velocity = 312.1 m/s Residence time = 0 s Vapour fraction at exit = 1 mol/mol Expanded exit velocity = 623.4 m/s Air equivalent source diameter = 0.09789 m
26.5.1.8 Release CompositionMolecular Weight of Release = 18.13 kg/kmol Component Weight
Fraction norm
Mole Fraction
norm
Critical Temp °C
Critical Pressure
bara
Molecular Weight kg/kmol
Atmos BP °C
Freeze Pt °C
Heat of Comb kJ/kg
n-Butane 0.0321 0.0100 152.1 37.41 58.12 -0.5001 -138.4 45742.7Propane 0.0487 0.0200 96.7 41.91 44.1 -42.1 -187.7 46383.8Ethane 0.0829 0.0500 32.18 48.08 30.07 -88.6 -182.8 47514.8Methane 0.7966 0.9000 -82.6 45.35 16.04 -161.5 -182.5 50043.9Nitrogen 0.0155 0.0100 -146.9 33.56 28.01 -195.8 -210 0Carbon dioxide 0.0243 0.0100 31.06 72.86 44.01 -86.9 -56.6 0
26.5.1.9 Reservoir summary (at reservoir pressure)Bubble point temperature = n/a Dew point temperature = n/a Vapour fraction = 1
26.5.1.9.1Properties of phases
Vapour Liquid
79

Abo Homos-Nubaria Pipeline QRA
Molecular weight (kg/kmol) 18.13 0Density (kg/m³) 55.5 0Enthalpy (kJ/kmol) 193.3 0Entropy (kJ/kmol*K) -29.46 0Cv (kJ/kg*K) 1.725 0Cp (kJ/kg*K) 2.627 0Sound velocity (m/s) 414.8 0Viscosity (e-3 kg/m*s) 0.01354 0Surface tension (e-3 N/m) 0 0
26.5.2 Jet Fire
26.5.2.1 Jet Fire SummaryFlame length (of frustum) = 14.9 m Cone width of flame base = 2.206 m Cone width of flame end = 3.285 m Flame lift-off = 7.722 m
Flame angle from vertical = 26.95 deg Flame angle, clockwise from North = 0 deg
Surface emissive power = 223.5 kW/m² Fraction of heat radiated = 0.1177 Total combustion power = 267.6 MW Heat of combustion = 47529.6 kJ/kg
26.5.2.2 Side view
80

Abo Homos-Nubaria Pipeline QRA
Raw plot data
26.5.2.3 Top view
Raw plot data
26.5.2.4 Impingement
81

Abo Homos-Nubaria Pipeline QRA
Raw plot data
26.5.3 Pool Chart
26.5.3.1 No pool can form
82

Abo Homos-Nubaria Pipeline QRA
26.5.4 Dispersion
26.5.4.1 Dispersion SummaryContour value (ppm) 47226.4 148597.8
Downwind distance (m) 2.132 0.501
Height above ground (m) 7.314 3.946
Mass in plume between specified limits = 11.89 kg Volume of plume containing this mass = 11.01 m³ Pollutant-only mass in this volume = 0.633 kg Specified minimum = 4.723 vol% Specified maximum = 100 vol%
26.5.4.2 Jet - side
Raw plot data
83
Abo Homos-Nubaria Pipeline QRA
26.5.4.3 Jet - top
Raw plot data
26.5.5 Warnings1 - Temperature outside experimental range -5 to 15 C2 - Pressure outside experimental range 0 to 20 bara3 - Pressure downstream parameter has not been experimentally determined4 - Warning: some vapour condenses - assume metastable flow5 - Dew point calculation not possible at requested pressure6 - Ambient temperature outside extrapolated range -5 to 30 C7 - Ambient temperature outside experimental range 0 to 15 C8 - Release height outside experimental range 0.5 to 100 m9 - Contour value outside experimental range 0 to 35 kW/m210 - Ambient pressure parameter has not been experimentally determined11 - Release height increased above surface roughness
84

Abo Homos-Nubaria Pipeline QRA
top
26.6 70Bar - Depressurization [10 Inch] - Vertical Release
26.6.1 Scenario Summary
26.6.1.1 ScenarioScenario = 70Bar - Depressurization [10 Inch] - Vertical Release Fluid = Natural gas
26.6.1.2 Process conditionsCalculate at = User input pressure Temperature = 40 °C Pressure = 70 bara
26.6.1.2.1 Pressure downstream of release Pressure = 1.013 bara Use standard atmospheric pressure = yes
26.6.1.2.2 Release from Release source = Vapour space
26.6.1.3 Hole & release geometry
26.6.1.3.1 Hole geometry Failure type = Custom Hole diameter = 0.254 m Discharge coefficient = 0.8
26.6.1.3.2 Pipe Pipe length = 0 m
26.6.1.3.3 Release Release height = 0 m Release angle from vertical = 0 deg Release angle, clockwise from North = 0 deg
26.6.1.4 Weather
26.6.1.4.1 Ambient conditions Temperature = 40 °C Relative humidity = 75 % Wind speed = 10 m/s Direction wind is going to = 0 deg (measured clockwise from North)
85
Abo Homos-Nubaria Pipeline QRA
26.6.1.4.2 Atmospheric stability conditions Define by = Pasquill class Pasquill class = D Neutral
26.6.1.5 Thermal radiationRadiation contours = 1.58, 4.73, 6.31, 9.46, 37.5 kW/m² Height at which plan view contours to be plotted = 0 m Cross flame distance at which side view contours to be plotted = 0 m
26.6.1.6 DispersionSurface roughness = 0.1 m Contours to plot: 47226.4 ppm 148597.8 ppm Plot type = LFL/UFL Sampling time = Instantaneous
26.6.1.7 Release summaryMass flow rate = 563 kg/s Flux = 11110.9 kg/m²/s Static exit pressure = 35.59 bara Exit temperature = -55.14 °C Exit density = 35.6 kg/m³ Exit velocity = 312.1 m/s Residence time = 0 s Vapour fraction at exit = 1 mol/mol Expanded exit velocity = 623.4 m/s Air equivalent source diameter = 0.9789 m
26.6.1.8 Release CompositionMolecular Weight of Release = 18.13 kg/kmol Component Weight
Fraction norm
Mole Fraction
norm
Critical Temp °C
Critical Pressure
bara
Molecular Weight kg/kmol
Atmos BP °C
Freeze Pt °C
Heat of Comb kJ/kg
n-Butane 0.0321 0.0100 152.1 37.41 58.12 -0.5001 -138.4 45742.7Propane 0.0487 0.0200 96.7 41.91 44.1 -42.1 -187.7 46383.8Ethane 0.0829 0.0500 32.18 48.08 30.07 -88.6 -182.8 47514.8Methane 0.7966 0.9000 -82.6 45.35 16.04 -161.5 -182.5 50043.9Nitrogen 0.0155 0.0100 -146.9 33.56 28.01 -195.8 -210 0Carbon dioxide 0.0243 0.0100 31.06 72.86 44.01 -86.9 -56.6 0
26.6.1.9 Reservoir summary (at reservoir pressure)Bubble point temperature = n/a Dew point temperature = n/a Vapour fraction = 1
26.6.1.9.1Properties of phases
Vapour Liquid
86

Abo Homos-Nubaria Pipeline QRA
Molecular weight (kg/kmol) 18.13 0Density (kg/m³) 55.5 0Enthalpy (kJ/kmol) 193.3 0Entropy (kJ/kmol*K) -29.46 0Cv (kJ/kg*K) 1.725 0Cp (kJ/kg*K) 2.627 0Sound velocity (m/s) 414.8 0Viscosity (e-3 kg/m*s) 0.01354 0Surface tension (e-3 N/m) 0 0
26.6.2 Jet Fire
26.6.2.1 Jet Fire SummaryFlame length (of frustum) = 93.64 m Cone width of flame base = 13.92 m Cone width of flame end = 32.85 m Flame lift-off = 48.72 m
Flame angle from vertical = 25.48 deg Flame angle, clockwise from North = 0 deg
Surface emissive power = 251.1 kW/m² Fraction of heat radiated = 0.07427 Total combustion power = 26759.2 MW Heat of combustion = 47529.6 kJ/kg
26.6.2.2 Side view
87

Abo Homos-Nubaria Pipeline QRA
Raw plot data
26.6.2.3 Top view
Raw plot data
26.6.2.4 Impingement
88

Abo Homos-Nubaria Pipeline QRA
Raw plot data
26.6.3 Pool Chart
26.6.3.1 No pool can form
89

Abo Homos-Nubaria Pipeline QRA
26.6.4 Dispersion
26.6.4.1 Dispersion SummaryContour value (ppm) 47226.4 148597.8
Downwind distance (m) 22.47 5.786
Height above ground (m) 57.4 32.56
Mass in plume between specified limits = 9022.8 kg Volume of plume containing this mass = 8377.5 m³ Pollutant-only mass in this volume = 492.5 kg Specified minimum = 4.723 vol% Specified maximum = 100 vol%
26.6.4.2 Jet - side
Raw plot data
90

Abo Homos-Nubaria Pipeline QRA
26.6.4.3 Jet - top
Raw plot data
26.6.5 Warnings1 - Temperature outside experimental range -5 to 15 C2 - Pressure outside experimental range 0 to 20 bara3 - Pressure downstream parameter has not been experimentally determined4 - Warning: some vapour condenses - assume metastable flow5 - Dew point calculation not possible at requested pressure6 - Ambient temperature outside extrapolated range -5 to 30 C7 - Mass flow rate outside extrapolated range 0 to 100 kg/s8 - Ambient temperature outside experimental range 0 to 15 C9 - Release height outside experimental range 0.5 to 100 m10 - Mass flow rate outside experimental range 0 to 30 kg/s11 - Contour value outside experimental range 0 to 35 kW/m212 - Ambient pressure parameter has not been experimentally determined13 - Release height increased above surface roughness
91

Abo Homos-Nubaria Pipeline QRA
top
26.7 Explosion [Confined space]
26.7.1 Scenario Summary
26.7.1.1 ScenarioScenario = Explosion [Confined space] Fluid = Methane
26.7.1.2 Congested regionRegion size, m Number of grids Blockage ratio
Length 10 3 0.3Width 10 3 0.3Height 5
Complexity level = 3 With roof = yes Partially filled = no
Angle of congested region length = 0 deg (measured clockwise from North)
26.7.1.3 Pulse at a distance from edge of congested regionDistance = 10 m Overpressure = 0.038 bar Duration = 62.9 ms Rise time = 40.3 ms
26.7.1.4 Source propertiesOverpressure = 0.07719 bar Radius = 7.763 m
26.7.1.5 Response at distances from edge of congested regionDistance to 50% window breaking (0.020 bar) = 24.2 m Distance to glass damage causing injury (0.050 bar) = 6.2 m Distance to repairable damage to buildings (0.100 bar) = 0.0 m Distance to heavy damage buildings/plant (0.340 bar) = 0.0 m
26.7.1.6 Custom Contour ValuesOverpressure (mbar) Distance (m)25 18.21 50 6.222
92

Abo Homos-Nubaria Pipeline QRA
100 0 300 0 500 0
26.7.1.7 Exceedance FuelEquivalant exceedance fuel = Methane Fuel Factor = 0.6034
26.7.2 Pressure Decay with Distance Chart
26.7.2.1 Overpressure
Raw plot data
26.7.3 Warnings1 - Congested region length outside experimental range 1 to 8 m2 - Congested region width outside experimental range 1 to 8 m3 - Congested region height outside experimental range 1 to 4 m4 - Number of grids for length outside experimental range 4 to 305 - Number of grids for width outside experimental range 4 to 306 - Requested contour is greater than source pressure
93