full health indicators report 2015 not meeting standards · web viewcoordinates were converted...
TRANSCRIPT

Full Health Indicators Report 2015 not meeting standards
Report AreaBerkeley County, SC; Charleston County, SC; Dorchester County, SCData CategorySocial & Economic Factors | Physical Environment | Clinical Care | Health Behaviors | Health OutcomesSocial & Economic FactorsEconomic and social insecurity often are associated with poor health. Poverty, unemployment, and lack of educational achievement affect access to care and a community’s ability to engage in healthy behaviors. Without a network of support and a safe community, families cannot thrive. Ensuring access to social and economic resources provides a foundation for a healthy community.
Data Indicators: Social & Economic Factors
High School Graduation Rate (EdFacts)High School Graduation Rate (NCES)Housing Cost Burden (30%)
Insurance - Uninsured Children
High School Graduation Rate (Ed Facts ) Within the report area 75.1% of students are receiving their high school diploma within four years. This indicator is relevant because research suggests education is one the strongest predictors of health (Freudenberg & Ruglis, 2007).
Report Area Total Student Cohort Estimated Number of Diplomas Issued Cohort Graduation Rate
Report Area 6,771 5,085 75.1
Berkeley County, SC 2,238 1,656 73.99
Charleston County, SC 2,657 1,993 75.01
Dorchester County, SC 1,876 1,436 76.55
South Carolina 50,385 38,749 76.9
Cohort Graduation Rate
Report Area (75.1%)South Carolina
(76.9%)United States (82.2%)

Report Area Total Student Cohort Estimated Number of Diplomas Issued Cohort Graduation Rate
United States 3,351,452 2,754,352 82.2Note: This indicator is compared with the state average. Data breakout by demographic groups are not available.Data Source: US Department of Education, EDFacts. Accessed via DATA.GOV. Additional data analysis by CARES. Source geography: School District
On-Time Graduation, Rate by School District (Secondary), EDFacts 2011-12
Over 94.0% 85.1 - 94.0% 75.1 - 85.0% Under 75.1% No Data or Data Suppressed
Report Area
High School Graduation Rate (NCES)Within the report area 68.8% of students are receiving their high school diploma within four years. This is less than the Healthy People 2020 target of 82.4%. This indicator is relevant because research suggests education is one the strongest predictors of health (Freudenberg & Ruglis, 2007).
Report Area Average Freshman Base Enrollment
Estimated Number of Diplomas Issued
On-Time Graduation Rate
Report Area 7,677 5,282 68.8
Berkeley County, SC 2,116 1,437 67.9
Charleston County, SC 3,630 2,472 68.1
Dorchester County, SC 1,930 1,372 71.1
South Carolina 59,274 39,114 66
On-Time Graduation Rate
Report Area (68.8%)HP 2020 Target
(82.4%)United States (75.5%)

Report Area Average Freshman Base Enrollment
Estimated Number of Diplomas Issued
On-Time Graduation Rate
United States 4,024,345 3,039,015 75.5
HP 2020 Target >=82.4Note: This indicator is compared with the Healthy People 2020 Target. Data breakout by demographic groups are not available.Data Source: National Center for Education Statistics, NCES - Common Core of Data. Source geography: County
On-Time Graduation, Rate by School District (Secondary), NCES CCD 2008-09
Over 94.1% 85.1 - 94.0% 75.1 - 85.0% Under 75.1% No Data or Data Suppressed
Report Area
Housing Cost Burden (30%)
This indicator reports the percentage of the households where housing costs exceed 30% of total household income. This indicator provides information on the cost of monthly housing expenses for owners and renters. The information offers a measure of housing affordability and excessive shelter costs. The data also serve to aid in the development of housing programs to meet the needs of people at different economic levels.
Report Area Total Households
Cost Burdened Households (Housing Costs Exceed 30% of
Income)
Percentage of Cost Burdened Households(Over 30% of Income)
Report Area 259,430 96,791 37.31%
Percentage of Households where Housing Costs Exceed 30% of Income

Report Area Total Households
Cost Burdened Households (Housing Costs Exceed 30% of
Income)
Percentage of Cost Burdened Households(Over 30% of Income)
Berkeley County, SC 65,392 21,194 32.41%
Charleston County, SC
143,717 58,280 40.55%
Dorchester County, SC
50,321 17,317 34.41%
South Carolina 1,780,251 558,643 31.38%
United States 115,610,224 41,002,236 35.47%Note: This indicator is compared with the state average.Data Source: US Census Bureau, American Community Survey. Source geography: Tract
Report Area (37.31%)South Carolina (31.38%)United States (35.47%)
Cost Burdened Households (Housing Costs Exceed 30% of Household Income), Percent by Tract, ACS 2009-13
Over 35.1% 28.1 - 35.0% 21.1 - 28.0% Under 21.1% No Data or Data Suppressed
Report Area
Cost Burdened Households by Tenure, TotalThis data shows the number of households that spend more than 30% of the household income on housing costs. In the report area, there were 96,791 cost burdened households according to the U.S. Census Bureau American Community Survey (ACS) 200-2013 5-year estimates. The data for this indicator is only reported for households where household housing costs and income earned was identified in the American Community Survey.

Report Area Cost Burdened Households
Cost Burdened Rental Households
Cost Burdened Owner Occupied Households
(With Mortgage)
Cost Burdened Owner Occupied Households
(With No Mortgage)
Report Area 96,791 45,529 42,451 8,811
Berkeley County, SC 21,194 9,032 9,692 2,470
Charleston County, SC 58,280 29,626 23,939 4,715
Dorchester County, SC 17,317 6,871 8,820 1,626
South Carolina 558,643 253,270 243,863 61,510
United States 41,002,236 19,581,492 17,636,344 3,784,400
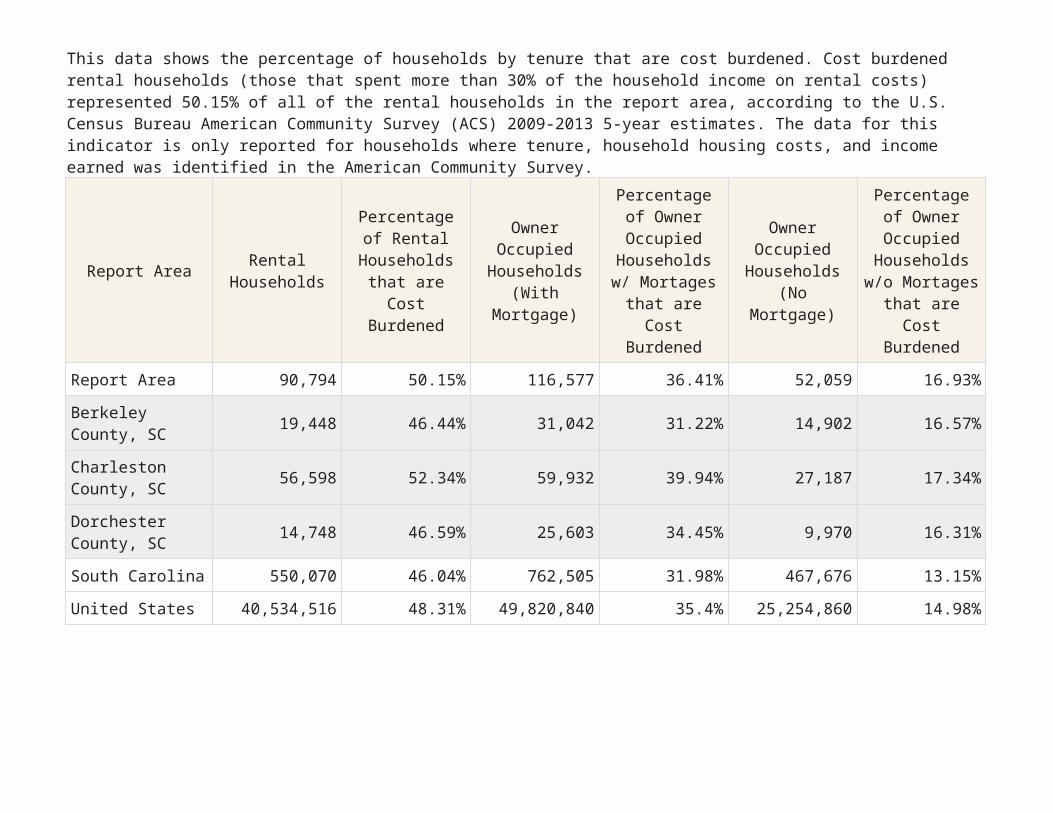
Cost Burdened Households by Tenure, PercentThis data shows the percentage of households by tenure that are cost burdened. Cost burdened rental households (those that spent more than 30% of the household income on rental costs) represented 50.15% of all of the rental households in the report area, according to the U.S. Census Bureau American Community Survey (ACS) 2009-2013 5-year estimates. The data for this indicator is only reported for households where tenure, household housing costs, and income earned was identified in the American Community Survey.

Report Area Rental Households
Percentage of Rental
Households that are Cost
Burdened
Owner Occupied
Households(With Mortgage)
Percentage of Owner Occupied Households w/ Mortages that
are Cost Burdened
Owner Occupied Households
(No Mortgage)
Percentage of Owner Occupied Households w/o Mortages that
are Cost Burdened
Report Area 90,794 50.15% 116,577 36.41% 52,059 16.93%
Berkeley County, SC 19,448 46.44% 31,042 31.22% 14,902 16.57%
Charleston County, SC 56,598 52.34% 59,932 39.94% 27,187 17.34%
Dorchester County, SC 14,748 46.59% 25,603 34.45% 9,970 16.31%
South Carolina 550,070 46.04% 762,505 31.98% 467,676 13.15%
United States 40,534,516 48.31% 49,820,840 35.4% 25,254,860 14.98%
Insurance - Uninsured Children
The lack of health insurance is considered a key driver of health status.
This indicator reports the percentage of children under age 19 without health insurance coverage. This indicator is relevant because lack of insurance is a primary barrier to healthcare access including regular primary care, specialty care, and other health services that contributes to poor health status.
Report AreaTotal
Population Under Age 19
Population with Medical
Insurance
Percent Population With
Medical Insurance
Population Without Medical
Insurance
Percent Population
Without Medical
Insurance
Report Area 164,522 149,262 90.72% 15,260 9.28%
Berkeley County, SC
48,452 43,881 90.6% 4,571 9.4%
Charleston County, SC
77,330 69,950 90.5% 7,380 9.5%
Dorchester County, SC
38,740 35,431 91.5% 3,309 8.5%
South Carolina
1,117,084 1,018,705 91.19% 98,378 8.81%
United States 76,468,844 70,705,585 92.46% 5,763,259 7.54%Note: This indicator is compared with the state average.Data Source: US Census Bureau, Small Area Health Insurance Estimates. Source geography: County
Percent Population Without Medical Insurance
Report Area (9.28%)South Carolina
(8.81%)United States (7.54%)

Uninsured Population, Age 0-18, Percent by County, SAHIE 2012
Over 10.0% 8.1 - 10.0% 6.1 - 8.0% Under 6.1% No Data or Data Suppressed
Report Area
Uninsured Population Under Age 18, Percent by Year, 2008 through 2012Report Area 2008 2009 2010 2011 2012
Report Area 13.18% 10.35% 9.37% 9.7% 9.28%
Berkeley County, SC 14.8% 11.3% 10.1% 11.9% 9.4%
Charleston County, SC 12.6% 9.8% 9% 8.9% 9.5%
Dorchester County, SC 12.5% 10.3% 9.1% 8.4% 8.5%
South Carolina 12.16% 10.55% 9.85% 9.03% 8.81%
United States 7.13% 9.02% 8.45% 7.89% 7.54%

Physical EnvironmentA community’s health also is affected by the physical environment. A safe, clean environment that provides access to healthy food and recreational opportunities is important to maintaining and improving community health.
Air Quality - Particulate Matter 2.5
This indicator reports the percentage of days with particulate matter 2.5 levels above the National Ambient Air Quality Standard (35 micrograms per cubic meter) per year, calculated using data collected by monitoring stations and modeled to include counties where no monitoring stations occur. This indicator is relevant because poor air quality contributes to respiratory issues and overall poor health.

Report Area Total Population
Average Daily Ambient
Particulate Matter 2.5
Number of Days
Exceeding Emissions Standards
Percentage of Days
Exceeding Standards,
Crude Average
Percentage of Days
Exceeding Standards,
Pop. Adjusted Average
Report Area 664,607 9.57 2.92 0.80 0.82%
Berkeley County, SC
177,843 9.96 3.13 0.86 0.86%
Charleston County, SC
350,209 9.23 2.58 0.71 0.73%
Dorchester County, SC
136,555 10.02 3.72 1.02 1.01%
South Carolina
4,625,364 10.75 2.36 0.65 0.65%
United States 312,471,327 10.65 4.17 1.14 1.19%Note: This indicator is compared with the state average. Data breakout by demographic groups are not available.Data Source: Centers for Disease Control and Prevention, National Environmental Public Health Tracking Network. Source geography: Tract
Percentage of Days Exceeding Standards, Pop. Adjusted Average
Report Area (0.82%)South Carolina (0.65%)United States (1.19%)
Fine Particulate Matter Levels (PM 2.5), Percent Days Above NAAQ Standards by Tract, NEPHTN 2008
Over 6.0% 1.1 - 6.0% 0.51 - 1.0% Under 0.51% No Days Above NAAQS Standards No Data or Data Suppressed
Report Area

Fast Food Restaurant Access
This indicator reports the number of fast food restaurants per 100,000 population. Fast food restaurants are defined as limited-service establishments primarily engaged in providing food services (except snack and nonalcoholic beverage bars) where patrons generally order or select items and pay before eating. This indicator is relevant because it provides a measure of healthy food access and environmental influences on dietary behaviors.
Report Area Total Population Number of Establishments
Establishments, Rate per 100,000 Population
Report Area 664,607 528 79.45
Berkeley County, SC 177,843 111 62.41
Charleston County, SC 350,209 340 97.08
Dorchester County, SC 136,555 77 56.39
South Carolina 4,625,364 3,432 74.2
United States 312,471,327 224,877 71.97Note: This indicator is compared with the state average.Data Source: US Census Bureau, County Business Patterns. Additional data analysis by CARES. Source geography: County
Fast Food Restaurants, Rate (Per 100,000 Population)
Report Area (79.45)South Carolina
(74.2)United States
(71.97)
Fast Food Restaurants, Rate (Per 100,000 Pop.) by County, CBP 2012
Over 100.0 75.1 - 100.0 50.1 - 75.0 Under 50.1 No Fast Food Restaurants
Report Area

Fast Food Restaurants,Rate per 100,000 Population by Year, 2008 through 2012
Report Area 2008 2009 2010 2011 2012
Report Area 72.67 74.78 76.29 81.25 79.45
Berkeley County, SC 55.67 53.98 59.6 62.41 62.41
Charleston County, SC 88.23 93.37 93.94 100.8 97.08
Dorchester County, SC 54.92 54.19 52.73 55.66 56.39
South Carolina 70.63 71.41 73.25 73.05 74.2
United States 67.43 67.43 68.31 69.2 71.97
Housing Environment - Substandard Housing

This indicator reports the number and percentage of owner- and renter-occupied housing units having at least one of the following conditions: 1) lacking complete plumbing facilities, 2) lacking complete kitchen facilities, 3) with 1.01 or more occupants per room, 4) selected monthly owner costs as a percentage of household income greater than 30 percent, and 5) gross rent as a percentage of household income greater than 30 percent. Selected conditions provide information in assessing the quality of the housing inventory and its occupants. This data is used to easily identify homes where the quality of living and housing can be considered substandard.
Report Area Total Occupied Housing Units
Occupied Housing Units with One or More Substandard
Conditions
Percent Occupied Housing Units with
One or More Substandard Conditions
Report Area 259,430 95,556 36.83%
Berkeley County, SC 65,392 20,733 31.71%
Charleston County, SC
143,717 57,606 40.08%
Dorchester County, SC
50,321 17,217 34.21%
South Carolina 1,780,251 562,483 31.6%
United States 115,610,216 41,747,016 36.11%Note: This indicator is compared with the state average.Data Source: US Census Bureau, American Community Survey. Source geography: Tract
Percent Occupied Housing Units with One or More Substandard Conditions
Report Area (36.83%)South Carolina (31.6%)United States (36.11%)

Substandard Housing Units, Percent of Total by Tract, ACS 2009-13
Over 34.0% 28.1 - 34.0% 22.1 - 28.0% Under 22.1% No Data or Data Suppressed
Report Area
Substandard Housing: Number of Substandard Conditions Present
Report Area No Conditions One Condition Two or Three Conditions Four Conditions
Report Area 63.17% 35.75% 1.08% 0%
Berkeley County, SC 68.29% 30.58% 1.13% 0%
Charleston County, SC 59.92% 39% 1.08% 0%
Dorchester County, SC 65.79% 33.2% 1.01% 0%
South Carolina 68.4% 30.31% 1.28% 0%
United States 63.89% 33.96% 2.14% 0.01%

Substandard Housing: Households Lacking Complete Plumbing FacilitiesComplete plumbing facilities include: (a) hot and cold running water, (b) a flush toilet, and (c) a bathtub or shower. All three facilities must be located inside the house, apartment, or mobile home, but not necessarily in the same room. Housing units are classified as lacking complete plumbing facilities when any of the three facilities is not present.
Report Area Total Occupied Housing Units Housing Units Lacking Complete Plumbing Facilities
Housing Units Lacking Complete Plumbing Facilities,
Percent
Report Area 259,430 661 0.25%
Berkeley County, SC 65,392 194 0.3%
Charleston County, SC 143,717 383 0.27%
Dorchester County, SC 50,321 84 0.17%
South Carolina 1,780,251 7,082 0.4%
United States 115,610,216 572,007 0.49%

Substandard Housing: Households Lacking Complete Kitchen FacilitiesA unit has complete kitchen facilities when it has all three of the following facilities: (a) a sink with a faucet, (b) a stove or range, and (c) a refrigerator. All kitchen facilities must be located in the house, apartment, or mobile home, but they need not be in the same room. A housing unit having only a microwave or portable heating equipment such as a hot plate or camping stove should not be considered as having complete kitchen facilities. An icebox is not considered to be a refrigerator.
Report Area Total Occupied Housing Units Housing Units Lacking Complete Kitchen Facilities
Housing Units Lacking Complete Kitchen Facilities,
Percent
Report Area 301,477 6,224 2.06%
Berkeley County, SC 74,281 1,607 2.16%
Charleston County, SC 171,625 3,693 2.15%
Dorchester County, SC 55,571 924 1.66%
South Carolina 2,143,464 70,512 3.29%
United States 132,057,808 3,958,536 3%

Substandard Housing: Households Lacking Telephone ServiceA telephone must be in working order and service available in the house, apartment, or mobile home that allows the respondent to both make and receive calls. Households that have cell-phones (no land-line) are counted as having telephone service available. Households whose service has been discontinued for nonpayment or other reasons are not counted as having telephone service available.
Report Area
Total Housing Units Lacking
Telephone Service
Total Housing Units Lacking
Telephone Service
Owner-Occupied Units
Lacking Telephone
Service
Owner-Occupied Units
Lacking Telephone
Service
Renter-Occupied Units
Lacking Telephone
Service
Renter-Occupied Units
Lacking Telephone
Service
Report Area 6,849 2.64% 3,190 1.89% 3,659 4.03%
Berkeley County, SC 2,074 3.17% 1,256 2.73% 818 4.21%
Charleston County, SC 3,803 2.65% 1,382 1.59% 2,421 4.28%

Report Area
Total Housing Units Lacking
Telephone Service
Total Housing Units Lacking
Telephone Service
Owner-Occupied Units
Lacking Telephone
Service
Owner-Occupied Units
Lacking Telephone
Service
Renter-Occupied Units
Lacking Telephone
Service
Renter-Occupied Units
Lacking Telephone
Service
Dorchester County, SC 972 1.93% 552 1.55% 420 2.85%
South Carolina 49,589 2.79% 20,935 1.7% 28,654 5.21%
United States 2,825,796 2.44% 1,093,979 1.46% 1,731,817 4.27%
Liquor Store Access
This indicator reports the number of beer, wine, and liquor stores per 100,000 population, as defined by North American Industry Classification System (NAICS) Code 445310. This indicator is relevant because it provides a measure of healthy food access and environmental influences on dietary behaviors.

Report Area Total Population Number of Establishments
Establishments, Rate per 100,000 Population
Report Area 664,607 65 9.78
Berkeley County, SC 177,843 15 8.43
Charleston County, SC 350,209 38 10.85
Dorchester County, SC 136,555 12 8.79
South Carolina 4,625,364 402 8.69
United States 312,471,327 32,327 10.35Note: This indicator is compared with the state average.Data Source: US Census Bureau, County Business Patterns. Additional data analysis by CARES. Source geography: County
Liquor Stores, Rate (Per 100,000 Population)
Report Area (9.78)South Carolina
(8.69)United States
(10.35)
Beer, Wine and Liquor Stores, Rate (Per 100,000 Pop.) by County, CBP 2012
Over 18.0 12.1 - 18.0 6.1 - 12.0 Under 6.1 No Beer, Wine, or Liquor Stores
Report Area
Beer, Wine and Liquor Stores,Rate per 100,000 Population by Year, 2008 through 2012
Report Area 2008 2009 2010 2011 2012
Report Area 6.47 6.92 8.73 9.93 9.78
Berkeley County, 5.62 5.06 7.87 8.43 8.43

Report Area 2008 2009 2010 2011 2012
SC
Charleston County, SC 7.42 8.57 9.71 11.14 10.85
Dorchester County, SC 5.13 5.13 7.32 8.79 8.79
South Carolina 8.09 8.28 8.32 8.67 8.69
United States 9.83 9.93 10.08 10.2 10.35
SNAP-Authorized Food Store Access
This indicator reports the number of SNAP-authorized food stores as a rate per 100,000 population. SNAP-authorized stores include grocery stores as well as supercenters, specialty food stores, and convenience stores that are authorized to accept SNAP (Supplemental Nutrition Assistance Program) benefits.

Report Area Total Population Total SNAP-Authorized Retailers
SNAP-Authorized Retailers, Rate per 100,000 Population
Report Area 664,607 617 92.84
Berkeley County, SC 177,843 141 79.28
Charleston County, SC 350,209 373 106.51
Dorchester County, SC 136,555 103 75.43
South Carolina 4,625,364 5,146 111.26
United States 312,471,327 245,113 78.44Note: This indicator is compared with the state average. Data breakout by demographic groups are not available.Data Source: US Department of Agriculture, Food and Nutrition Service, USDA - SNAP Retailer Locator. Additional data analysis by CARES. Source geography: Tract
SNAP-Authorized Retailers, Rate
(Per 100,000 Population)
Report Area (92.84)South Carolina
(111.26)United States (78.44)
SNAP-Authorized Retailers, Rate per 10,000 Population by Tract, USDA 2014
Over 12.0 6.1 - 12.0 Under 6.0 No SNAP-Authorized Retailers No Population or No Data
Report Area
Clinical CareA lack of access to care presents barriers to good health. The supply and accessibility of facilities and physicians, the rate of uninsurance, financial hardship, transportation barriers, cultural competency, and coverage limitations affect access.
Rates of morbidity, mortality, and emergency hospitalizations can be reduced if community residents access services such as

health screenings, routine tests, and vaccinations. Prevention indicators can call attention to a lack of access or knowledge regarding one or more health issues and can inform program interventions.
Pneumonia Vaccination
This indicator reports the percentage of adults aged 65 and older who self-report that they have ever received a pneumonia vaccine. This indicator is relevant because engaging in preventive behaviors decreases the likelihood of developing future health problems. This indicator can also highlight a lack of access to preventive care, a lack of health knowledge, insufficient provider outreach, and/or social barriers preventing utilization of services.
Report Area Total Population Age 65
Estimated Population with
Annual Pneumonia Vaccination
Crude Percentage Age-Adjusted Percentage
Report Area 74,250 49,063 66.08% 67.59%
Berkeley County, SC
17,201 11,628 67.6% 69.6%
Charleston County, SC
43,643 28,761 65.9% 67%
Dorchester County, SC
13,406 8,674 64.7% 66.9%
South Carolina 616,496 417,368 67.7% 68.8%
United States 39,608,820 26,680,462 67.36% 67.51%Note: This indicator is compared with the state average. Data breakout by demographic groups are not available.Data Source: Centers for Disease Control and Prevention, Behavioral Risk Factor Surveillance System. Accessed via the Health Indicators Warehouse. Source geography: County
Percent Population Age 65 with Pneumonia Vaccination
(Age-Adjusted)
Report Area (67.59%)South Carolina (68.8%)United States (67.51%)

Annual Pneumonia Vaccination, Percent of Adults Age 65 by County, BRFSS 2006-12
Over 72.0% 68.1 - 72.0% 64.1 - 68.0% Under 64.1% No Data or Data Suppressed
Report Area
High Blood Pressure Management
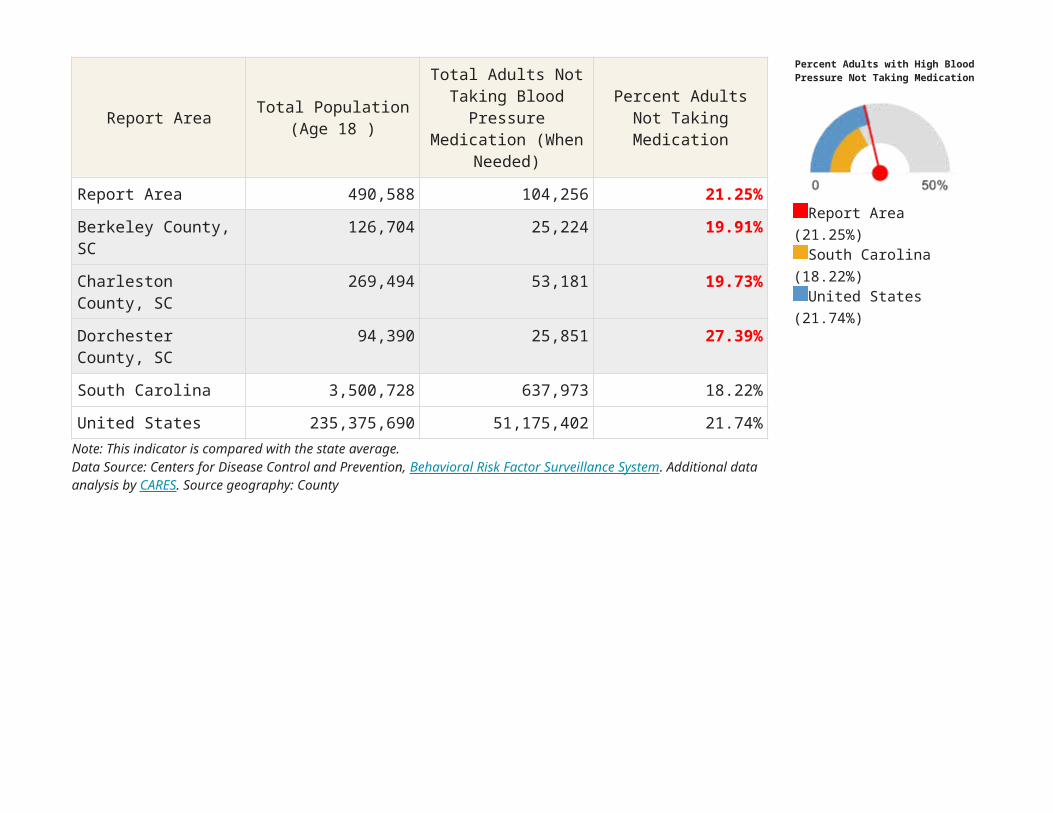
In the report area, 21.25% of adults, or 104,256, self-reported that they are not taking medication for their high blood pressure according to the CDC's Behavioural Risk Factor Surveillance System (2006-2010). This indicator is relevant because engaging in preventive behaviors decreases the likelihood of developing future health problems. When considered with other indicators of poor health, this indicator can also highlight a lack of access to preventive care, a lack of health knowledge, insufficient provider outreach, and/or social barriers preventing utilization of services.
Report Area Total Population(Age 18 )
Total Adults Not Taking Blood Pressure
Medication (When Needed)
Percent Adults Not Taking Medication
Report Area 490,588 104,256 21.25%
Berkeley County, SC 126,704 25,224 19.91%
Charleston County, SC 269,494 53,181 19.73%
Dorchester County, SC
94,390 25,851 27.39%
South Carolina 3,500,728 637,973 18.22%
Percent Adults with High Blood Pressure Not Taking Medication
Report Area (21.25%)South Carolina (18.22%)United States (21.74%)

Report Area Total Population(Age 18 )
Total Adults Not Taking Blood Pressure
Medication (When Needed)
Percent Adults Not Taking Medication
United States 235,375,690 51,175,402 21.74%Note: This indicator is compared with the state average.Data Source: Centers for Disease Control and Prevention, Behavioral Risk Factor Surveillance System. Additional data analysis by CARES. Source geography: County
Adults Age 18 with High Blood Pressure, Not Taking Medication, Percent by County, BRFSS 2006-10
Over 85.0% 80.1 - 85.0% 75.1 - 80.0% Under 75.1% No Data or Data Suppressed
Report Area
Adults Not Taking Medicine for High Blood Pressure by Race / Ethnicity, Percent
Report Area White (Non-Hispanic)
Black (Non-Hispanic)
Other Race (Non-Hispanic) Hispanic / Latino
South Carolina 11.05% 10.41% 13.14% 13.27%
United States 14.31% 12.19% 20.1% 21.72%Note: No county data available. See FOOTNOTES for more details.

Lack of a Consistent Source of Primary Care
This indicator reports the percentage of adults aged 18 and older who self-report that they do not have at least one person who they think of as their personal doctor or health care provider. This indicator is relevant because access to regular primary care is important to preventing major health issues and emergency department visits.
Report Area Survey Population(Adults Age 18 )
Total Adults Without Any Regular Doctor
Percent Adults Without Any Regular Doctor
Report Area 510,110 116,937 22.92%
Berkeley County, SC 138,989 33,276 23.94%
Charleston County, SC 261,287 60,980 23.34%
Dorchester County, SC 109,834 22,681 20.65%
South Carolina 3,522,879 782,973 22.23%
United States 236,884,668 52,290,932 22.07%
Percent Adults Without Any Regular Doctor
Report Area (22.92%)South Carolina
(22.23%)United States (22.07%)

Note: This indicator is compared with the state average.Data Source: Centers for Disease Control and Prevention, Behavioral Risk Factor Surveillance System. Additional data analysis by CARES. Source geography: County
No Consistent Source of Primary Care, Percent of Adults Age 18 by County, BRFSS 2011-12
Over 25.0% 19.1 - 25.0% 13.1 - 19.0% Under 13.1% No Data or Data Suppressed
Report Area
Adults Without a Consistent Source of Primary Care by Race / Ethnicity, Percent
Report Area White (Non-Hispanic)
Black (Non-Hispanic)
Other Race (Non-Hispanic) Hispanic / Latino
South Carolina 18.79% 25.13% 32.7% 50.82%
United States 17.15% 25.28% 25.47% 38.58%Note: No county data available. See FOOTNOTES for more details.

Health BehaviorsHealth behaviors such as poor diet, a lack of exercise, and substance abuse contribute to poor health status.
Alcohol Consumption
This indicator reports the percentage of adults aged 18 and older who self-report heavy alcohol consumption (defined as more than two drinks per day on average for men and one drink per day on average for women). This indicator is relevant because current behaviors are determinants of future health and this indicator may illustrate a cause of significant health issues, such as cirrhosis, cancers, and untreated mental and behavioral health needs.
Report Area Total Population Age 18
Estimated Adults Drinking
Excessively
Estimated Adults Drinking
Excessively(Crude
Percentage)
Estimated Adults Drinking
Excessively(Age-Adjusted Percentage)
Report Area 502,082 87,938 17.51% 17.91%
Estimated Adults Drinking Excessively
(Age-Adjusted Percentage)
Berkeley County, SC
130,515 19,186 14.7% 14.2%
Charleston County, SC
273,989 54,798 20% 21%
Dorchester County, SC
97,578 13,954 14.3% 14.2%
South Carolina 3,500,728 500,604 14.3% 14.9%
United States 232,556,016 38,248,349 16.45% 16.94%Note: This indicator is compared with the state average. Data breakout by demographic groups are not available.Data Source: Centers for Disease Control and Prevention, Behavioral Risk Factor Surveillance System. Accessed via the Health Indicators Warehouse. Source geography: County
Report Area (17.91%)South Carolina
(14.9%)United States
(16.94%)
Excessive Drinking, Percent of Adults Age 18 by County, BRFSS 2006-12
Over 22.0% 18.1 - 22.0% 14.1 - 18.0% Under 14.1% No Data or Data Suppressed
Report Area
Alcohol Expenditures
This indicator reports estimated expenditures for alcoholic beverages purchased at home, as a percentage of total household expenditures. This indicator is relevant because current behaviors are determinants of future health and this indicator may illustrate a cause of significant health issues, such as cirrhosis, cancers, and untreated mental and behavioral health needs.
Report Area State Rank Z-Score (US) Z-Score (State)
Average Expenditures
Percentage of Food-At-Home
Alcoholic Beverage Expenditures, Percentage of Total Food-At-Home

(USD) Expenditures
Report Area no data 0.77 0.56 $880.27 16.23%
Berkeley County, SC
17 0.4 0.19 suppressed suppressed
Charleston County, SC
3 1.11 0.89 suppressed suppressed
Dorchester County, SC
17 0.35 0.15 suppressed suppressed
South Carolina
no data 0.33 0 $794.45 14.95%
United States
no data no data no data $839.54 14.29%
Note: This indicator is compared with the state average. Data breakout by demographic groups are not available.Data Source: Nielsen, Nielsen SiteReports. Source geography: Tract
Expenditures
Report Area (16.23)South Carolina (14.95)United States (14.29)
Alcoholic Beverage Expenditures, Percent of Food-At-Home Expenditures, National Rank by Tract, Nielsen 2014
1st Quintile (Highest Expenditures) 2nd Quintile 3rd Quintile 4th Quintile 5th Quintile (Lowest Expenditures) No Data or Data Suppressed
Report Area
Tobacco Usage - Quit Attempt

An estimated 63.5% of adult smokers in the report area attempted to quit smoking for at least 1 day in the past year. This indicator is relevant because tobacco use is linked to leading causes of death such as cancer and cardiovascular disease and supporting efforts to quit smoking may increase positive health outcomes.
Report Area Survey Population(Smokers Age 18 )
Total Smokers with Quit Attempt in Past 12
Months
Percent Smokers with Quit Attempt in Past 12
Months
Report Area 111,136 70,566 63.5%
Berkeley County, SC 34,076 20,877 61.27%
Charleston County, SC 55,108 36,298 65.87%
Dorchester County, SC 21,952 13,391 61.00%
South Carolina 797,423 495,413 62.13%
United States 45,526,654 27,323,073 60.02%Note: This indicator is compared with the state average.Data Source: Centers for Disease Control and Prevention, Behavioral Risk Factor Surveillance System. Additional data analysis by CARES. Source geography: County
Percent Smokers with Quit Attempt in Past 12 Months
Report Area (63.5%)South Carolina (62.13%)United States (60.02%)
Smokers Who Quit / Attempted to Quit in Past 12 Months, Percent by County, BRFSS 2011-12
Over 64.0% 58.1 - 64.0% 52.1 - 58.0% Under 52.1% No Data or Data Suppressed
Report Area
Adult Smokers with Quit Attempt in Past 1 Year by Race / Ethnicity, Percent

Report Area White (Non-Hispanic)
Black (Non-Hispanic)
Other Race (Non-Hispanic) Hispanic / Latino
South Carolina 57.65% 73.05% 69.35% 61.13%
United States 56.63% 70.87% 62.26% 65.83%Note: No county data available. See FOOTNOTES for more details.
Health OutcomesMeasuring morbidity and mortality rates allows assessing linkages between social determinants of health and outcomes. By comparing, for example, the prevalence of certain chronic diseases to indicators in other categories (e.g., poor diet and exercise) with outcomes (e.g., high rates of obesity and diabetes), various causal relationship may emerge, allowing a better understanding of how certain community health needs may be addressed.
Depression (Medicare Population)
This indicator reports the percentage of the Medicare fee-for-service population with depression.
Report Area Total Medicare Beneficiaries with Percent with Percentage of Medicare Beneficiaries with

Beneficiaries Depression Depression
Report Area 83,300 12,504 15.01%
Berkeley County, SC 16,290 2,443 15%
Charleston County, SC
51,667 7,686 14.88%
Dorchester County, SC
15,343 2,375 15.48%
South Carolina 664,848 93,336 14.04%
United States 34,126,305 5,271,176 15.45%Note: This indicator is compared with the state average. Data breakout by demographic groups are not available.Data Source: Centers for Medicare and Medicaid Services . Source geography: County
Depression
Report Area (15.01%)South Carolina (14.04%)United States (15.45%)
Beneficiaries with Depression, Percent by County, CMS 2012
Over 18.0% 15.1 - 18.0% 12.1 - 15.0% Under 12.1% No Data or Data Suppressed
Report Area
High Cholesterol (Medicare Population)
This indicator reports the percentage of the Medicare fee-for-service population with hyperlipidemia, which is typically associated with high cholesterol.
Report Area Total Medicare Beneficiaries with Percent with High Percentage of Medicare Beneficiaries with
High Cholesterol

Beneficiaries High Cholesterol Cholesterol
Report Area 83,300 41,654 50%
Berkeley County, SC 16,290 9,091 55.81%
Charleston County, SC
51,667 24,891 48.18%
Dorchester County, SC
15,343 7,672 50%
South Carolina 664,848 323,383 48.64%
United States 34,126,305 15,273,052 44.75%Note: This indicator is compared with the state average. Data breakout by demographic groups are not available.Data Source: Centers for Medicare and Medicaid Services . Source geography: County
Report Area (50%)South Carolina (48.64%)United States (44.75%)
Beneficiaries with High Cholesterol, Percent by County, CMS 2012
Over 48.0% 42.1 - 48.0% 36.1 - 42.0% Under 36.1% No Data or Data Suppressed
Report Area
Asthma Prevalence
This indicator reports the percentage of adults aged 18 and older who self-report that they have ever been told by a doctor, nurse, or other health professional that they had asthma. This indicator is relevant because asthma is a prevalent problem in the U.S. that is often exacerbated by poor environmental conditions.

Report Area Survey Population(Adults Age 18 )
Total Adults with Asthma
Percent Adults with Asthma
Report Area 508,413 66,873 13.15%
Berkeley County, SC 139,565 17,245 12.36%
Charleston County, SC 259,692 34,948 13.46%
Dorchester County, SC 109,156 14,680 13.45%
South Carolina 3,526,734 456,596 12.95%
United States 237,197,465 31,697,608 13.36%Note: This indicator is compared with the state average.Data Source: Centers for Disease Control and Prevention, Behavioral Risk Factor Surveillance System. Additional data analysis by CARES. Source geography: County
Percent Adults with Asthma
Report Area (13.15%)South Carolina
(12.95%)United States (13.36%)
Asthma (Diagnosed), Percent of Adults Age 18 by County, BRFSS 2011-12
Over 16.0% 13.1 - 16.0% 10.1 - 13.0% Under 10.1% No Data or Data Suppressed
Report Area
Adults Ever Diagnosed with Asthma by Race / Ethnicity, Percent
Report Area White (Non-Hispanic)
Black (Non-Hispanic)
Other Race (Non-Hispanic) Hispanic / Latino
South Carolina 12.48% 13.59% 14.82% 13.23%
United States 13.19% 15.75% 11.9% 12.02%Note: No county data available. See FOOTNOTES for more details.

Chlamydia Incidence
This indicator reports incidence rate of chlamydia cases per 100,000 population. This indicator is relevant because it is a measure of poor health status and indicates the prevalence of unsafe sex practices.
Report Area Total Population Total Chlamydia Infections
Chlamydia Infection Rate (Per 100,000
Pop.)
Report Area 682,121 4,015 588.61
Berkeley County, SC 183,525 790 430.5
Charleston County, SC 357,704 2,482 693.9
Dorchester County, SC 140,892 743 527.4
South Carolina 4,679,230 27,149 580.2
United States 311,577,841 1,422,976 456.7
Chlamydia Infection Rate (Per 100,000 Pop.)
Report Area (588.61)South Carolina
(580.2)United States (456.7)

Note: This indicator is compared with the state average.Data Source: Centers for Disease Control and Prevention, National Center for HIV/AIDS, Viral Hepatitis, STD, and TB Prevention. Source geography: County
Chlamydia, Infection Rate per 100,000 Population by County, NCHHSTP 2012
Over 500.0 300.1 - 500.0 150.1 - 300.0 Under 150.1 No Data or Data Suppressed
Report Area
Chlamydia Incidence Rate (Per 100,000 Pop.) by Race / Ethnicity
Report Area Non-Hispanic White Non-Hispanic Black Asian / Pacific Islander
American Indian / Alaska Native Hispanic / Latino
South Carolina 142.5 933.95 109.3 112.47 171.38
United States 171.72 1,140.79 118.8 696.2 377.52Note: No county data available. See FOOTNOTES for more details.

Chlamydia Incidence Rate (Per 100,000 Pop.) by Year, 2003 through 2011Report Area 2003 2004 2005 2006 2007 2008 2009 2010 2011
Report Area 427.55 484.03 481.09 552.9 621.33 642.51 640.79 595.99 655.02
Berkeley County, SC 181 266.6 228.8 273.2 364.9 406.9 446.7 400.9 465.3
Charleston County, SC 578.5 627.7 637.5 710.7 758.7 785.5 769 715.9 784.4
Dorchester County, SC 309.1 349.5 362.4 470.7 579.7 564.8 549.8 542.6 573.5
South Carolina 352.6 438.84 429.98 517.23 599.65 587.59 584.36 573.47 625.51
United 298.78 313.66 326.59 341.74 365.5 395.54 402.72 420.56 454.12

Report Area 2003 2004 2005 2006 2007 2008 2009 2010 2011
States
Gonorrhea Incidence
This indicator reports incidence rate of Gonorrhea cases per 100,000 population. This indicator is relevant because it is a measure of poor health status and indicates the prevalence of unsafe sex practices.
Report Area Total Population Total Gonorrhea Infections
Gonorrhea Infection Rate (Per 100,000
Pop.)
Report Area 682,121 1,131 165.81
Berkeley County, SC 183,525 217 118.2
Charleston County, SC 357,704 720 201.3
Gonorrhea Infection Rate (Per 100,000 Pop.)
Report Area (165.81)

Report Area Total Population Total Gonorrhea Infections
Gonorrhea Infection Rate (Per 100,000
Pop.)
Dorchester County, SC 140,892 194 137.7
South Carolina 4,679,230 7,618 162.8
United States 311,466,046 334,826 107.5Note: This indicator is compared with the state average.Data Source: Centers for Disease Control and Prevention, National Center for HIV/AIDS, Viral Hepatitis, STD, and TB Prevention. Source geography: County
South Carolina (162.8)United States (107.5)
Gonorrhea, Infection Rate per 100,000 Population by County, NCHHSTP 2012
Over 80.0 20.1 - 80.0 Under 20.1 No Cases No Data or Data Suppressed
Report Area
Gonorrhea Incidence Rate (Per 100,000 Pop.) by Race / Ethnicity
Report Area Non-Hispanic White Non-Hispanic Black Asian / Pacific Islander
American Indian / Alaska Native Hispanic / Latino
South Carolina 26.14 325.51 14.38 32.14 24.83
United States 29.7 422.05 17.82 124.21 60.7Note: No county data available. See FOOTNOTES for more details.

Gonorrhea Incidence Rate (Per 100,000 Pop.) by Year, 2003 through 2011Report Area 2003 2004 2005 2006 2007 2008 2009 2010 2011
Report Area 245.96 251.79 239.7 282.17 270.91 261.13 192.51 171.53 177.97
Berkeley County, SC 82.6 92.9 104.8 124.8 134.5 139.4 110.1 96.2 105.2
Charleston County, SC 353.3 369.1 341.4 390.2 365 351.1 255.6 232.1 240.1
Dorchester County, SC 145 115.9 123.2 182.4 190.3 177 130.4 114.2 115
South Carolina 205.39 218.46 201.19 238.82 234.27 210.77 182.36 172.31 180.53
United 113.82 111.02 113.17 118.23 116.63 109.46 96.96 99.08 103.09

Report Area 2003 2004 2005 2006 2007 2008 2009 2010 2011
States
HIV Prevalence
This indicator reports prevalence rate of HIV per 100,000 population. This indicator is relevant because HIV is a life-threatening communicable disease that disproportionately affects minority populations and may also indicate the prevalence of unsafe sex practices.
Report Area Total Population Population with HIV / AIDS
Population with HIV / AIDS,
Rate (Per 100,000 Pop.)
Report Area 554,070 2,049 369.81
Berkeley County, SC 145,815 263 180
Population with HIV / AIDS,Rate (Per 100,000 Pop.)

Report Area Total Population Population with HIV / AIDS
Population with HIV / AIDS,
Rate (Per 100,000 Pop.)
Charleston County, SC 297,171 1,547 520.7
Dorchester County, SC 111,084 239 215
South Carolina 3,858,786 14,044 363.95
United States 509,288,471 1,733,459 340.37Note: This indicator is compared with the state average.Data Source: Centers for Disease Control and Prevention, National Center for HIV/AIDS, Viral Hepatitis, STD, and TB Prevention. Source geography: County
Report Area (369.81)South Carolina
(363.95)United States (340.37)
HIV Prevalence, Rate (Per 100,000 Pop.) by County, NCHHSTP 2010
Over 200.0 100.1 - 200.0 50.1 - 100.0 Under 50.1 No Data or Data Suppressed
Report Area
HIV Prevalence Rate by Race / EthnicityReport Area Non-Hispanic White Non-Hispanic Black Hispanic / Latino
Report Area 167.06 903.73 299.41
Berkeley County, SC 90.9 438.4 204.3
Charleston County, SC 235.6 1,208.8 399

Report Area Non-Hispanic White Non-Hispanic Black Hispanic / Latino
Dorchester County, SC 89.6 576.7 134.8
South Carolina 133.51 964.93 265.83
United States 180.16 1,235.54 464.11
HIV Prevalence Rate (Per 100,000 Pop.) by Year, 2008 through 2011Report Area 2008 2009 2010
Report Area 367.68 361.6 369.81
Berkeley County, SC 152.2 169.7 180
Charleston County, SC 524.4 503.2 520.7
Dorchester County, SC 219.4 223.4 215
South Carolina 355.81 360.96 363.95
United States 327.37 335.38 342.17

Cancer Incidence - Breast
This indicator reports the age adjusted incidence rate (cases per 100,000 population per year) of females with breast cancer adjusted to 2000 U.S. standard population age groups (Under Age 1, 1-4, 5-9, ..., 80-84, 85 and older). This indicator is relevant because cancer is a leading cause of death and it is important to identify cancers separately to better target interventions.
Report Area Female Population Average New Cases per Year
Annual Incidence Rate(Per 100,000 Pop.)
Report Area 335,110 461 128.8
Berkeley County, SC 87,488 107 120.6
Charleston County, SC 178,770 261 131
Dorchester County, SC 68,852 93 132.8
South Carolina 2,348,847 3,362 123
United States 155,863,552 216,052 122.7
Annual Breast Cancer Incidence Rate
(Per 100,000 Pop.)
Report Area (128.8)HP 2020 Target (40.9)United States (122.7)

Report Area Female Population Average New Cases per Year
Annual Incidence Rate(Per 100,000 Pop.)
HP 2020 Target <= 40.9Note: This indicator is compared with the Healthy People 2020 Target.Data Source: National Institutes of Health, National Cancer Institute, Surveillance, Epidemiology, and End Results Program. State Cancer Profiles. Source geography: County
Breast Cancer, Incidence Rate (Per 100,000 Pop.) by County, STCANPRO 2007-11
Over 135.0 115.1 - 135.0 95.1 - 115.0 Under 95.1 No Data or Data Suppressed
Report Area
Population by Race / Ethnicity, Breast Cancer Incidence Rate (Per 100,000)
Report Area White Black Asian / Pacific Islander
American Indian / Alaskan Native Hispanic / Latino
Report Area 129.6 122.8 no data no data no data
Berkeley County, SC 104.4 139.8 suppressed suppressed suppressed
Charleston County, SC 140.2 120.8 suppressed suppressed suppressed
Dorchester County, SC 132.1 108.5 suppressed suppressed suppressed
South Carolina 122.9 118.5 no data no data no data

Report Area White Black Asian / Pacific Islander
American Indian / Alaskan Native Hispanic / Latino
United States 120.7 117.9 83 64.4 90.5
Population by Race / Ethnicity, New Breast Cancer Incidence (Count)
Report Area White Black Asian / Pacific Islander
American Indian / Alaskan Native Hispanic / Latino
Report Area 314 121 no data no data no data
Berkeley County, SC 63 30 no data no data no data
Charleston County, SC 185 73 no data no data no data
Dorchester County, SC 66 18 no data no data no data
South Carolina 2,420 803 no data no data no data

Report Area White Black Asian / Pacific Islander
American Indian / Alaskan Native Hispanic / Latino
United States 174,757 22,918 6,607 949 14,396
Cancer Incidence - Cervical
This indicator reports the age adjusted incidence rate (cases per 100,000 population per year) of females with cervical cancer adjusted to 2000 U.S. standard population age groups (Under age 1, 1-4, 5-9, ..., 80-84, 85 and older). This indicator is relevant because cancer is a leading cause of death and it is important to identify cancers separately to better target interventions.
Report Area Female Population Average New Cases per Year
Annual Incidence Rate(Per 100,000 Pop.)
Report Area 335,110 25 7.43
Berkeley County, SC 87,488 8 9.3
Charleston County, SC 178,770 12 6.5
Dorchester County, SC 68,852 5 7.6
South Carolina 2,348,847 198 8.2
United States 155,863,552 12,530 7.8
HP 2020 Target <= 7.1Note: This indicator is compared with the Healthy People 2020 Target.Data Source: National Institutes of Health, National Cancer Institute, Surveillance, Epidemiology, and End Results Program. State Cancer Profiles. Source geography: County
Annual Cervical Cancer Incidence Rate
(Per 100,000 Pop.)
Report Area (7.43)HP 2020 Target (7.1)United States (7.8)

Cervical Cancer, Incidence Rate (Per 100,000 Pop.) by County, STCANPRO 2007-11
Over 10.0 8.1 - 10.0 6.1 - 8.0 Under 6.1 No Data or Data Suppressed
Report Area
Population by Race / Ethnicity, Cervical Cancer Incidence Rate (Per 100,000)
Report Area White Black Asian / Pacific Islander
American Indian / Alaskan Native Hispanic / Latino
Report Area 7.5 8.9 no data no data no data
Berkeley County, SC 10.9 no data suppressed suppressed suppressed
Charleston County, SC 6 9 suppressed suppressed suppressed
Dorchester County, SC no data no data suppressed suppressed suppressed
South Carolina 8 9.8 no data no data no data
United States 7.5 10.1 6.6 6.4 10.9

Population by Race / Ethnicity, New Cervical Cancer Incidence (Count)
Report Area White Black Asian / Pacific Islander
American Indian / Alaskan Native Hispanic / Latino
Report Area 13 5 no data no data no data
Berkeley County, SC 6 no data no data no data no data
Charleston County, SC 7 5 no data no data no data
Dorchester County, SC no data no data no data no data no data
South Carolina 129 67 no data no data no data
United States 9,522 1,998 538 108 2,006
Cancer Incidence - Lung

This indicator reports the age adjusted incidence rate (cases per 100,000 population per year) of colon and rectum cancer adjusted to 2000 U.S. standard population age groups (Under age 1, 1-4, 5-9, ..., 80-84, 85 and older). This indicator is relevant because cancer is a leading cause of death and it is important to identify cancers separately to better target interventions.
Report Area Total Population Average New Cases per Year
Annual Incidence Rate(Per 100,000 Pop.)
Report Area 655,456 455 71.77
Berkeley County, SC 174,679 132 87
Charleston County, SC 346,981 239 65.4
Dorchester County, SC 133,796 84 71.9
South Carolina 4,575,864 3,601 70.3
United States 306,603,776 212,768 64.9Note: This indicator is compared with the state average.Data Source: National Institutes of Health, National Cancer Institute, Surveillance, Epidemiology, and End Results Program. State Cancer Profiles. Source geography: County
Annual Lung Cancer Incidence Rate
(Per 100,000 Pop.)
Report Area (71.77)South Carolina (70.3)United States (64.9)
Lung Cancer, Incidence Rate (Per 100,000 Pop.) by County, STCANPRO 2007-11
Over 84.0 72.1 - 84.0 60.1 - 72.0 Under 60.1 No Data or Data Suppressed
Report Area
Population by Race / Ethnicity, Lung Cancer Incidence Rate (Per 100,000)

Report Area White Black Asian / Pacific Islander
American Indian / Alaskan Native Hispanic / Latino
Report Area 74.8 66.8 no data no data no data
Berkeley County, SC 97.2 51.7 suppressed suppressed suppressed
Charleston County, SC 65.1 72.1 suppressed suppressed suppressed
Dorchester County, SC 75.9 66.8 suppressed suppressed suppressed
South Carolina 73.3 62.7 no data no data no data
United States 65.6 68.2 36.2 43.4 34.6
Population by Race / Ethnicity, New Lung Cancer Incidence (Count)

Report Area White Black Asian / Pacific Islander
American Indian / Alaskan Native Hispanic / Latino
Report Area 332 107 no data no data no data
Berkeley County, SC 103 18 no data no data no data
Charleston County, SC 163 73 no data no data no data
Dorchester County, SC 66 16 no data no data no data
South Carolina 2,797 711 no data no data no data
United States 180,739 21,506 4,336 964 7,983
Cancer Incidence - Prostate
This indicator reports the age adjusted incidence rate (cases per 100,000 population per year) of males with prostate cancer adjusted to 2000 U.S. standard population age groups (Under age 1, 1-4, 5-9, ..., 80-84, 85 and older). This indicator is relevant because cancer is a leading cause of death and it is important to identify cancers separately to better target interventions.
Report Area Male Population Average New Cases per Year
Annual Incidence Rate(Per 100,000 Pop.)
Report Area 320,346 457 146.93
Berkeley County, SC 87,191 110 138.7
Charleston County, SC 168,211 246 141.8
Dorchester County, SC 64,944 101 173.4
South Carolina 2,227,017 3,549 146.7
United States 150,740,224 220,000 142.3Note: This indicator is compared with the state average.Data Source: National Institutes of Health, National Cancer Institute, Surveillance, Epidemiology, and End Results Program. State Cancer Profiles. Source geography: County
Annual Prostate Cancer Incidence Rate
(Per 100,000 Pop.)
Report Area (146.93)South Carolina (146.7)United States (142.3)

Prostate Cancer, Incidence Rate (Per 100,000 Pop.) by County, STCANPRO 2007-11
Over 160.0 140.1 - 160.0 120.1 - 140.0 Under 120.1 No Data or Data Suppressed
Report Area
Population by Race / Ethnicity, Prostate Cancer Incidence Rate (Per 100,000)
Report Area White Black Asian / Pacific Islander
American Indian / Alaskan Native Hispanic / Latino
Report Area 132.5 200.3 no data no data no data
Berkeley County, SC 125.9 200.4 suppressed suppressed suppressed
Charleston County, SC 128.8 193.9 suppressed suppressed suppressed
Dorchester County, SC 151.7 224.4 suppressed suppressed suppressed
South Carolina 129.5 219.9 no data no data no data
United States 133.3 217.9 73.8 75.8 123.6

Population by Race / Ethnicity, New Prostate Cancer Incidence (Count)
Report Area White Black Asian / Pacific Islander
American Indian / Alaskan Native Hispanic / Latino
Report Area 293 143 no data no data no data
Berkeley County, SC 72 33 no data no data no data
Charleston County, SC 155 84 no data no data no data
Dorchester County, SC 66 26 no data no data no data
South Carolina 2,340 1,076 no data no data no data
United States 171,991 30,367 4,018 778 13,248
Low Birth Weight

This indicator reports the percentage of total births that are low birth weight (Under 2500g). This indicator is relevant because low birth weight infants are at high risk for health problems. This indicator can also highlight the existence of health disparities.
Report Area Total Live Births Low Weight Births (Under 2500g)
Low Weight Births, Percent of Total
Report Area 63,238 5,747 9.09%
Berkeley County, SC 16,737 1,423 8.5%
Charleston County, SC 34,678 3,260 9.4%
Dorchester County, SC 11,823 1,064 9%
South Carolina 418,684 41,450 9.9%
United States 29,300,495 2,402,641 8.2%
HP 2020 Target <=7.8%Note: This indicator is compared with the Healthy People 2020 Target.Data Source: US Department of Health & Human Services, Health Indicators Warehouse. Centers for Disease Control and Prevention, National Vital Statistics System. Accessed via CDC WONDER. Source geography: County
Percent Low Birth Weight Births
Report Area (9.09%)HP 2020 Target
(7.8%)United States (8.2%)
Low Birth Weight, Percent of Live Births by County, NVSS 2006-12
Over 10.0% 8.1 - 10.0% 6.1 - 8.0% Under 6.1% No Data or Data Suppressed
Report Area
Babies Born with Low Birth Weight, Percent by Race / Ethnicity

Report Area White (Non-Hispanic)
Black (Non-Hispanic) Asian or Pacific Islander Hispanic / Latino
Report Area 6.72% 14.33% 7.6% 6.34%
Berkeley County, SC 6.9% 13.6% 8% 5.7%
Charleston County, SC 6.5% 14.7% 7.1% 6.7%
Dorchester County, SC 7.1% 14.3% 8.5% 6.2%
South Carolina 7.7% 14.8% 8.4% 6.4%
United States 7.2% 13.6% 8.2% 7%
Babies Born with Low Birth Weight, Percent by Time Period, 2002-2008 through 2006-2012
Report Area 2002-2008 2003-2009 2004-2010 2005-2011 2006-2012
Report Area 9.61% 9.57% 9.3% 9.25% 9.09%

Report Area 2002-2008 2003-2009 2004-2010 2005-2011 2006-2012
Berkeley County, SC 9.3% 9% 8.7% 8.7% 8.5%
Charleston County, SC 10% 10% 9.7% 9.6% 9.4%
Dorchester County, SC 8.9% 9.1% 9% 9% 9%
South Carolina 10.1% 10.1% 10.1% 10% 9.9%
United States 8.1% 8.1% 8.2% 8.2% 8.2%
Mortality - Cancer
This indicator reports the rate of death due to malignant neoplasm (cancer) per 100,000 population. Figures are reported as crude rates, and as rates age-adjusted to year 2000 standard. Rates are resummarized for report areas from county level data, only where data is available. This indicator is relevant because cancer is a leading cause of death in the United States.

Report Area Total PopulationAverage Annual
Deaths, 2007-2011
Crude Death Rate
(Per 100,000 Pop.)
Age-Adjusted Death Rate
(Per 100,000 Pop.)
Report Area 654,834 1,135 173.36 180.78
Berkeley County, SC
174,494 258 147.63 173.57
Charleston County, SC
346,755 679 195.93 188.27
Dorchester County, SC
133,585 198 148.37 170.77
South Carolina 4,573,514 9,218 201.54 185.22
United States 306,486,831 569,481 185.81 174.08
HP 2020 Target <= 160.6Note: This indicator is compared with the Healthy People 2020 Target.Data Source: Centers for Disease Control and Prevention, National Vital Statistics System. Accessed via CDC WONDER. Centers for Disease Control and Prevention, Wide-Ranging Online Data for Epidemiologic Research. Source geography: County
Cancer Mortality, Age-Adjusted Death Rate
(Per 100,000 Pop.)
Report Area (180.78)HP 2020 Target
(160.6)United States (174.08)
Cancer Mortality, Age Adj. Rate (Per 100,000 Pop.) by County, NVSS 2007-11
Over 200.0 180.1 - 200.0 160.1 - 180.0 Under 160.1 No Data or Data Suppressed
Report Area

Population by Gender, Cancer Mortality, Age-Adjusted Rate (Per 100,000 Pop.)Report Area Male Female
Report Area 229.06 147.59
Berkeley County, SC 224.74 137.64
Charleston County, SC 236.93 155.06
Dorchester County, SC 214.5 140.78
South Carolina 235.5 150.37
United States 211.52 147.92
Population by Race / Ethnicity, Cancer Mortality, Age-Adjusted Rate (Per 100,000 Pop.)
Report Area Non-Hispanic White Non-Hispanic Black Non-Hispanic AsianNon-Hispanic
American Indian / Alaskan Native
Hispanic / Latino
Report Area 173.3 208.9 99.94 no data 103.77

Report Area Non-Hispanic White Non-Hispanic Black Non-Hispanic AsianNon-Hispanic
American Indian / Alaskan Native
Hispanic / Latino
Berkeley County, SC 181.79 168.99 75.07 no data 94.36
Charleston County, SC 170.66 234.03 120.77 no data 109.06
Dorchester County, SC 168.88 184.06 no data no data no data
South Carolina 177.79 211.3 81.13 129.8 93.71
United States 182.58 214.88 111.57 152.74 119.74
Cancer Mortality, Age-Adjusted Rate (Per 100,000 Pop.) by Year, 2002 through 2011

Report Area 2002 2003 2004 2005 2006 2007 2008 2009 2010 2011
South Carolina 205.79 204.41 195.82 198.2 194.7 188.47 189.99 182.77 183.62 181.95
United States 194.34 190.85 186.79 185.09 181.78 179.26 176.37 173.53 172.79 168.96
Mortality - Stroke
Within the report area there are an estimated 53.27 deaths due to cerebrovascular disease (stroke) per 100,000 population. This is greater than than the Healthy People 2020 target of less than or equal to 33.8. Figures are reported as crude rates, and as rates age-adjusted to year 2000 standard. Rates are resummarized for report areas from county level data, only where data is available. This indicator is relevant because stroke is a leading cause of death in the United States.
Report Area Total Population Average Annual Deaths,
2007-2011
Crude Death Rate
(Per 100,000
Age-Adjusted Death Rate
(Per 100,000
Stroke Mortality, Age-Adjusted Death Rate
(Per 100,000 Pop.)

Pop.) Pop.)
Report Area 654,834 301 45.9 53.27
Berkeley County, SC
174,494 66 38.05 54.4
Charleston County, SC
346,755 175 50.47 49.64
Dorchester County, SC
133,585 59 44.32 61.2
South Carolina 4,573,514 2,368 51.78 50.65
United States 306,486,831 131,470 42.9 40.39
HP 2020 Target <= 33.8Note: This indicator is compared with the Healthy People 2020 Target.Data Source: Centers for Disease Control and Prevention, National Vital Statistics System. Accessed via CDC WONDER. Centers for Disease Control and Prevention, Wide-Ranging Online Data for Epidemiologic Research. Source geography: County
Report Area (53.27)HP 2020 Target (33.8)United States (40.39)
Stroke Mortality, Age Adj. Rate (Per 100,000 Pop.) by County, NVSS 2007-11
Over 36.0 28.1 - 36.0 20.1 - 28.0 Under 20.1 No Data or Data Suppressed
Report Area
Population by Gender, Stroke Mortality, Age-Adjusted Rate (Per 100,000 Pop.)

Report Area Male Female
Report Area 50.9 53.42
Berkeley County, SC 61.07 49.1
Charleston County, SC 46 50.44
Dorchester County, SC 49.93 66.69
South Carolina 51.12 49.08
United States 40.51 39.62
Population by Race / Ethnicity, Stroke Mortality, Age-Adjusted Rate (Per 100,000 Pop.)
Report Area Non-Hispanic White Non-Hispanic Black Non-Hispanic AsianNon-Hispanic
American Indian / Alaskan Native
Hispanic or Latino
Report Area 47.27 67.91 no data no data no data

Report Area Non-Hispanic White Non-Hispanic Black Non-Hispanic AsianNon-Hispanic
American Indian / Alaskan Native
Hispanic or Latino
Berkeley County, SC 44.71 79.62 no data no data no data
Charleston County, SC 44.06 60.79 no data no data no data
Dorchester County, SC 58.3 74.45 no data no data no data
South Carolina 45.48 66.2 36.55 32.48 29.35
United States 42.93 33.86 15.56 70.31 32.88
Stroke Mortality, Age-Adjusted Rate (Per 100,000 Pop.) by Year, 2002 through 2011

Report Area 2002 2003 2004 2005 2006 2007 2008 2009 2010 2011
South Carolina 74.44 71.17 66.54 60.24 53.83 55.84 52.57 51.29 47.87 46.28
United States 57.24 54.57 51.18 47.96 44.8 43.52 42.05 39.59 39.13 37.9
Mortality - Unintentional Injury
This indicator reports the rate of death due to unintentional injury (accident) per 100,000 population. Figures are reported as crude rates, and as rates age-adjusted to year 2000 standard. Rates are resummarized for report areas from county level data, only where data is available. This indicator is relevant because accidents are a leading cause of death in the U.S.

Report Area Total PopulationAverage Annual
Deaths, 2007-2011
Crude Death Rate
(Per 100,000 Pop.)
Age-Adjusted Death Rate
(Per 100,000 Pop.)
Report Area 654,834 288 44.04 44.75
Berkeley County, SC
174,494 73 41.61 43.99
Charleston County, SC
346,755 169 48.85 48.15
Dorchester County, SC
133,585 46 34.73 36.91
South Carolina 4,573,514 2,287 50.01 49.7
United States 306,486,831 122,185 39.87 38.85
HP 2020 Target <= 36.0Note: This indicator is compared with the Healthy People 2020 Target.Data Source: Centers for Disease Control and Prevention, National Vital Statistics System. Accessed via CDC WONDER. Centers for Disease Control and Prevention, Wide-Ranging Online Data for Epidemiologic Research. Source geography: County
Unintentional Injury (Accident) Mortality, Age-Adjusted Death Rate
(Per 100,000 Pop.)
Report Area (44.75)HP 2020 Target (36)United States (38.85)
Unintentional Injury (Accident) Mortality, Age Adj. Rate (Per 100,000 Pop.) by County, NVSS 2007-11
Over 70.0 50.1 - 70.0 40.1 - 50.0 Under 40.1 No Data or Data Suppressed
Report Area

Population by Gender, Accident Mortality, Age-Adjusted Rate (Per 100,000 Pop.)Report Area Male Female
Report Area 62.36 28.61
Berkeley County, SC 62.17 27.56
Charleston County, SC 66.96 30.63
Dorchester County, SC 50.71 24.68
South Carolina 68.51 32.54
United States 53.19 25.67
Population by Race / Ethnicity, Accident Mortality, Age-Adjusted Rate (Per 100,000 Pop.)
Report Area Non-Hispanic White Non-Hispanic Black Non-Hispanic AsianNon-Hispanic
American Indian / Alaskan Native
Hispanic / Latino
Report Area 45.18 44.55 no data no data 43.65

Report Area Non-Hispanic White Non-Hispanic Black Non-Hispanic AsianNon-Hispanic
American Indian / Alaskan Native
Hispanic / Latino
Berkeley County, SC 45.55 47.38 no data no data 21.82
Charleston County, SC 48.51 45.01 no data no data 55.91
Dorchester County, SC 36.64 39.52 no data no data no data
South Carolina 52.78 43.71 15.8 27.53 36.1
United States 42.93 33.86 15.56 70.31 27.38
Accident Mortality, Age-Adjusted Rate (Per 100,000 Pop.) by Year, 2002 through 2011

Report Area 2002 2003 2004 2005 2006 2007 2008 2009 2010 2011
South Carolina 48.74 47.52 50.1 53.44 53.3 53.18 50.37 47.96 48.86 48.17
United States 37.12 37.59 38.06 39.51 40.24 40.36 39.25 37.49 37.99 39.13
Mortality - Pedestrian Accident
This indicator reports the rate of pedestrians killed by motor vehicles per 100,000 population. This indicator is relevant because pedestrian-motor vehicle crash deaths are preventable and they are a cause of premature death.
Report Area Total Deaths,2008-2010
Average Annual Deaths,
2008-2010
Average Annual Death Rate
(Per 100,000 Pop.)
Report Area 49 16 2.4
Pedestrian Motor Vehicle Death, Age-Adjusted Death Rate
(Per 100,000 Pop.)

Report Area Total Deaths,2008-2010
Average Annual Deaths,
2008-2010
Average Annual Death Rate
(Per 100,000 Pop.)
Berkeley County, SC 10 3 1.87
Charleston County, SC
34 11 3.24
Dorchester County, SC
5 1 1.22
South Carolina 280 93 2
United States 12,750 4,250 1.38
HP 2020 Target <= 1.3Note: This indicator is compared with the Healthy People 2020 Target. Data breakout by demographic groups are not available.Data Source: US Department of Transportation, National Highway Traffic Safety Administration, Fatality Analysis Reporting System. Source geography: County
Report Area (2.4)HP 2020 Target (1.3)United States (1.38)
Pedestrian Motor Vehicle Accident Mortality, Age Adj. Rate (Per 100,000 Pop.) by County, NHTSA 2008-10
Over 2.5% 1.6 - 2.5% 1.1 - 1.5% Under 1.1% No Deaths
Report Area
Mortality - Homicide

This indicator reports the rate of death due to assault (homicide) per 100,000 population. Figures are reported as crude rates, and as rates age-adjusted to year 2000 standard. Rates are resummarized for report areas from county level data, only where data is available. This indicator is relevant because homicide rate is a measure of poor community safety and is a leading cause of premature death.
Report Area Total PopulationAverage Annual
Deaths, 2007-2011
Crude Death Rate (Per 100,000
Pop.)
Age-Adjusted Death Rate
(Per 100,000 Pop.)
Report Area 654,834 53 8.15 7.88
Berkeley County, SC
174,494 11 6.07 5.9
Charleston County, SC
346,755 35 10.15 9.68
Dorchester County, SC
133,585 8 5.69 5.81
South Carolina 4,573,514 352 7.7 7.79
United States 306,486,831 17,097 5.58 5.63
HP 2020 Target <= 5.5Note: This indicator is compared with the Healthy People 2020 Target.Data Source: Centers for Disease Control and Prevention, National Vital Statistics System. Accessed via CDC WONDER. Centers for Disease Control and Prevention, Wide-Ranging Online Data for Epidemiologic Research. Source geography: County
Homicide, Age-Adjusted Death Rate
(Per 100,000 Pop.)
Report Area (7.88)HP 2020 Target (5.5)United States (5.63)

Homicide Mortality, Age Adj. Rate (Per 100,000 Pop.) by County, NVSS 2007-11
Over 9.0 6.1 - 9.0 3.1 - 6.0 Under 3.1 No Data or Data Suppressed
Report Area
Population by Gender, Homicide Mortality, Age-Adjusted Rate (Per 100,000 Pop.)Report Area Male Female
Report Area 12.83 3.27
Berkeley County, SC 8.28 3.75
Charleston County, SC 16.46 3.04
Dorchester County, SC 9.57 no data
South Carolina 12.2 3.5
United States 8.87 2.36

Population by Race / Ethnicity, Homicide Mortality, Age-Adjusted Rate (Per 100,000 Pop.)
Report Area Non-Hispanic White Non-Hispanic Black Non-Hispanic AsianNon-Hispanic
American Indian / Alaskan Native
Hispanic / Latino
Report Area 3.07 19.3 no data no data 16.17
Berkeley County, SC 2.71 15.17 no data no data no data
Charleston County, SC 3.04 23.34 no data no data 16.17
Dorchester County, SC 3.6 12.33 no data no data no data
South Carolina 3.99 15.47 no data no data 6.77
United States 2.68 19.67 2.04 8.84 5.9

Homicide Mortality, Age-Adjusted Rate (Per 100,000 Pop.) by Year, 2002 through 2011Report Area 2002 2003 2004 2005 2006 2007 2008 2009 2010 2011
South Carolina 7.91 7.84 7.76 7.92 8.99 8.59 7.86 7.64 7.09 7.82
United States 6.11 6.11 5.94 6.16 6.26 6.15 5.93 5.54 5.33 5.3

Mortality - Suicide
This indicator reports the rate of death due to intentional self-harm (suicide) per 100,000 population. Figures are reported as crude rates, and as rates age-adjusted to year 2000 standard. Rates are resummarized for report areas from county level data, only where data is available. This indicator is relevant because suicide is an indicator of poor mental health.
Report Area Total PopulationAverage Annual
Deaths, 2007-2011
Crude Death Rate (Per 100,000
Pop.)
Age-Adjusted Death Rate
(Per 100,000 Pop.)
Report Area 654,834 85 12.95 12.53
Berkeley County, SC
174,494 21 12.26 12.52
Charleston County, SC
346,755 49 14.25 13.33
Suicide, Age-Adjusted Death Rate
(Per 100,000 Pop.)
Report Area (12.53)HP 2020 Target
(10.2)United States (11.82)

Report Area Total PopulationAverage Annual
Deaths, 2007-2011
Crude Death Rate (Per 100,000
Pop.)
Age-Adjusted Death Rate
(Per 100,000 Pop.)
Dorchester County, SC
133,585 14 10.48 10.48
South Carolina 4,573,514 602 13.16 12.76
United States 306,486,831 37,085 12.1 11.82
HP 2020 Target <= 10.2Note: This indicator is compared with the Healthy People 2020 Target.Data Source: Centers for Disease Control and Prevention, National Vital Statistics System. Accessed via CDC WONDER. Centers for Disease Control and Prevention, Wide-Ranging Online Data for Epidemiologic Research. Source geography: County
Suicide Mortality, Age Adj. Rate (Per 100,000 Pop.) by County, NVSS 2007-11
Over 18.0 14.1 - 18.0 11.1 - 14.0 Under 11.1 No Data or Data Suppressed
Report Area
Population by Gender, Suicide Mortality, Age-Adjusted Rate (Per 100,000 Pop.)Report Area Male Female
Report Area 20.86 5.34
Berkeley County, SC 21.35 4.58

Report Area Male Female
Charleston County, SC 22.37 5.51
Dorchester County, SC 16.3 5.88
South Carolina 20.81 5.52
United States 19.35 4.89
Population by Race / Ethnicity, Suicide Mortality, Age-Adjusted Rate (Per 100,000 Pop.)
Report Area Non-Hispanic White Non-Hispanic Black Non-Hispanic AsianNon-Hispanic
American Indian / Alaskan Native
Hispanic / Latino
Report Area 16.13 6.01 no data no data no data
Berkeley County, SC 16.23 no data no data no data no data
Charleston 17.41 6.01 no data no data no data

Report Area Non-Hispanic White Non-Hispanic Black Non-Hispanic AsianNon-Hispanic
American Indian / Alaskan Native
Hispanic / Latino
County, SC
Dorchester County, SC 12.91 no data no data no data no data
South Carolina 16.49 4.73 6.31 no data 29.35
United States 14.55 5.34 5.96 15.71 32.88
Suicide Mortality, Age-Adjusted Rate (Per 100,000 Pop.) by Year, 2002 through 2011Report Area 2002 2003 2004 2005 2006 2007 2008 2009 2010 2011
South Carolina 10.75 11.46 11.3 11.83 11.8 11.62 12 13.03 13.46 13.59
United 10.95 10.79 10.99 10.93 11 11.29 11.6 11.76 12.11 12.34

Report Area 2002 2003 2004 2005 2006 2007 2008 2009 2010 2011
States
Infant Mortality
This indicator reports the rate of deaths to infants less than one year of age per 1,000 births. This indicator is relevant because high rates of infant mortality indicate the existence of broader issues pertaining to access to care and maternal and child health.
Report Area Total Births Total Infant Deaths Infant Mortality Rate (Per 1,000 Births)
Report Area 46,915 357 7.61
Berkeley County, SC 12,925 93 7.2
Charleston County, SC 24,725 220 8.9
Dorchester County, SC 9,265 44 4.8
Infant Mortality Rate (Per 1,000 Births)
Report Area (7.61)

Report Area Total Births Total Infant Deaths Infant Mortality Rate (Per 1,000 Births)
South Carolina 302,210 2,387 7.9
United States 20,913,535 136,369 6.52
HP 2020 Target <= 6.0Note: This indicator is compared with the Healthy People 2020 Target.Data Source: Centers for Disease Control and Prevention, National Vital Statistics System. Accessed via CDC WONDER. Centers for Disease Control and Prevention, Wide-Ranging Online Data for Epidemiologic Research. Source geography: County
HP 2020 Target (6)United States (6.52)
Infant Mortality, Rate (Per 1,000 Live Births) by County, AHRF 2006-10
Over 10.0 8.1 - 10.0 5.1 - 8.0 Under 5.1 No Data or Data Suppressed
Report Area
Infant Mortality Rate (Per 1,000 Live Births) by Race / EthnicityReport Area Non-Hispanic White Non-Hispanic Black Hispanic or Latino
Report Area no data no data no data
Report Area no data no data no data
Report Area no data no data no data
Berkeley County, SC no data no data no data
Charleston County, SC no data no data no data

Report Area Non-Hispanic White Non-Hispanic Black Hispanic or Latino
Dorchester County, SC no data no data no data
South Carolina 5.7 12.3 5.6
United States 5.5 12.7 5.4
FOOTNOTESHigh School Graduation Rate (Ed Facts )
Data Background
EDFacts is a U. S. Department of Education (ED) initiative to collect, analyze, report on, and promote the use of high-quality, kindergarten through grade 12 (K–12) performance data for use in education planning, policymaking, and management and budget decision-making to improve outcomes for students. EDFacts centralizes data provided by state education agencies, local education agencies, and schools, and provides users with the ability to easily analyze and report on submitted data. ED collects performance data at the school and school-district levels and provides public use files containing data that have been modified to protect against the ability to determine personally identifiable information on students.
Methodology

Graduation rates are acquired for all US school-districts in the United States from US Department of Education (ED) EdFacts data tables. States are required to report graduation data to the US Department of Education under Title I, Part A of the Elementary and Secondary Education Act (ESEA). Specifically, states are required to report rates based on a cohort method, which would provide a more uniform and accurate measure of the high school graduation rate that improved comparability across states. The cohort graduation rate is defined as “the number of students who graduate in four years with a regular high school diploma divided by the number of students who form the adjusted cohort for the graduating class.” From the beginning of 9th grade (or the earliest high school grade), students who are entering that grade for the first time form a cohort that is “adjusted” by adding any students who subsequently transfer into the cohort and subtracting any students who subsequently transfer out, emigrate to another country, or die.
County-level summaries are calculated by CARES using small-area estimation technique based on the proportion of the population aged 15-19 in each school district/county. The population figures for this calculation are based on data from the 2010 US Decennial Census at the census block geographic level.
For more information please consult the original data the original data or download the complete EdFacts Data Documentation.
Notes
Race and EthnicityStatistics by race and ethnicity are not provided for this indicator.
Data Limitations1. Graduation rates for some school districts are provided by EdFacts as ranges; range mid-points were calculated by CARES to facilitate data manipulation. 2. Data is not currently available for three states - Idaho, Kentucky, and Oklahoma - due to incomplete student cohort data for the four years prior to 2011.
High School Graduation Rate (NCES)
Data Background
The National Center for Education Statistics (NCES) is the primary federal entity for collecting, analyzing, and reporting data related to education in the United States and other nations. It fulfils a congressional mandate to collect, collate, analyze, and report full and complete statistics on the condition of education in the United States; conduct and publish reports and specialized analyses of the meaning and significance of such statistics; assist state and local education agencies in improving their statistical systems; and review and report on education activities in foreign countries.Citation: Documentation to the NCES Common Core of Data Public Elementary/Secondary School Universe Survey (2013).
The National Center for Education Statistics releases a dataset containing detailed information about every public school in the United States in their annual Common Core of Data (CCD) files. The information from which this data is compiled is supplied by state education agency officials. The CCD reports information about both schools and school districts, including name, address, and phone number; descriptive information about students and staff demographics; and fiscal data, including revenues and current expenditures.
For more information, please visit the Common Core of Data web page.

MethodologyGraduation rates are acquired for all US counties from the 2012 County Health Rankings (CHR). The 2011 County Health Rankings (CHR) used graduation rates calculated from the National Center for Education Statistics (NCES) using an estimated cohort. This measure is generally known as the Averaged Freshman Graduation Rate (AFGR). Starting in 2012, CHR reports cohort graduation rates collected from State Department of Education websites. These rates are an improvement over the AFGR rates previously reported due to student-level outcomes tracking that accounts better for transfers, early and late completers. For 12 states, CHR continues to use NCES-based AFGRs. These states are: AL, AK, AR, CT, HI, ID, MT, NJ, ND, OK, SD and TN.
Total freshmen cohorts were compiled for all counties from school-level data, provided by NCES for academic years 2005-06 through 2007-08. Using the graduation rates from the 2012 CHR and these class sizes, the number of graduates* was estimated for each county. On-time graduation rate, or average freshman graduation rate, is re-calculated for unique service areas and aggregated county groupings using the following formula:
Graduation Rate = [Estimated Number of Graduates] / [Average Base Freshman Enrollment] * 100.
*Average freshman graduation rate is a measure of on-time graduation only. It does not include 5th year high school completers, or high-school equivalency completers such as GED recipients. For more information on average freshman graduation rates, please review the information on page 4 of the NCES Common Core of Data Public-Use Local Education Agency Dropout and Completion Data File
Notes
Race and EthnicityStatistics by race and ethnicity are not provided for this indicator from the data source. Detailed race/ethnicity data may be available at a broader geographic level, or from a local source.
Housing Cost Burden (30%)
Data Background
The American Community Survey (ACS) is a nationwide, continuous survey designed to provide communities with reliable and timely demographic, housing, social, and economic data. The ACS samples nearly 3 million addresses each year, resulting in nearly 2 million final interviews. The ACS replaces the long-form decennial census; however, the number of household surveys reported annually for the ACS is significantly less than the number reported in the long-form decennial census. As a result, the ACS combines detailed population and housing data from multiple years to produce reliable estimates for small counties, neighborhoods, and other local areas. Negotiating between timeliness and accuracy, the ACS annually releases current, one-year estimates for geographic areas with large populations; three-year and five-year estimates are also released each year for additional areas based on minimum population thresholds.
Citation: U.S. Census Bureau: A Compass for Understanding and Using American Community Survey Data (2008).

For more information about this source, including data collection methodology and definitions, refer to the American Community Survey website.
MethodologyCounts of total households and households by monthly housing cost are acquired from the U.S. Census Bureau’s American Community Survey (ACS). Data represent estimates for the 5 year period 2009-2013. Mapped data are summarized to 2010 census tract boundaries. The data for monthly housing costs as a percentage of household income are developed from a distribution of “Selected Monthly Owner Costs as a Percentage of Household Income” for owner-occupied and “Gross Rent as a Percentage of Household Income” for renter-occupied units. The owner-occupied categories are further separated into those with a mortgage and those without a mortgage. Indicator statistics are measured as a percentage total households using the following formula:
[Households with Costs Exceeding 30% of Income] / [Total Households] * 100
For more information on the data reported in the American Community Survey, please see the complete American Community Survey 2013 Subject Definitions.
Insurance - Uninsured Children
Data Background
The Small Area Health Insurance Estimates (SAHIE) program was created to develop model-based estimates of health insurance coverage for counties and states. It is currently the only dataset providing complete health-insurance coverage estimates. The models predict state and county level insurance estimates for total populations, as well as population groups defined by age, sex, race and income.
The SAHIE program models health insurance coverage by combining survey data with population estimates and administrative records. SAHIE estimates are a product of the US Census Bureau with funding from the Centers for Disease Control and Prevention.
The SAHIE health insurance models use data from the following sources:
American Community Survey Internal Revenue Service: Federal Tax Returns Supplemental Nutrition Assistance Program (SNAP): Participation Records County Business Patterns Medicaid and Children's Health Insurance Program (CHIP): Participation Records US Census 2010
MethodologyCounts of the number of persons without medical insurance are modelled for the Small Area Income and Health Insurance Estimates (SAHIE) datasets by the Census Bureau using both survey and census data. In this reporting platform, indicator percentages are summarized from the SAHIE estimates based on the following formula:
Percentage = SUM [Uninsured Population] / SUM [Total Population] * 100

For more information about the data used in these estimates, please visit the Small Area Health Insurance Estimates website and view the provided Data Inputs page.
Notes
Race and EthnicityRace and ethnicity (Hispanic origin) are collected as two separate categories based on methods established by the U.S. Office of Management and Budget (OMB) in 1997. Data reported from the US Census Bureau's Small Area Health Insurance Estimates (SAHIE) program is available by combined race and ethnicity, and is reported only for state and national data summaries. County level statistics by race and ethnicity are not provided for this indicator from the data source. Detailed race/ethnicity data may be available from a local source.
Air Quality - Particulate Matter 2.5
Data Background
The National Environmental Public Health Tracking Network (Tracking Network) is a system of integrated health, exposure, and hazard information and data from a variety of national, state, and city sources. The Tracking Network provides information about the following types of data:Health effect data: Data about health conditions and diseases, such as asthma and birth defects. Environmental hazard data: Data about chemicals or other substances such as carbon monoxide and air pollution in the environment. Exposure data: Data about the amount of a chemical in a person's body, such as lead in blood. Other data: Data that helps us learn about relationships between exposures and health effects. For example, information about age, sex, race, and behavior or lifestyle choices that may help us understand why a person has a particular health problem.
State and county level Tracking Network data is available to view or download through the Map Viewer or through the Indicators and Data web page.
MethodologyIndicator data are acquired from the Centers for Disease Control and Prevention (CDC) and Environmental Protection Agency (EPA) National Environmental Public Health Tracking Network (NEPHTN) Air Quality Data web page. Utilized data includes the EPA’s daily Ozone concentration estimates, a Hierarchical Bayesian Space Time Modeling System (HBM) coverage for the contiguous U.S., presented as centroid-coordinates representing a 12 x 12 km grid. Data was extracted for each coordinate, including: Average Ozone Concentration = SUM [ Concentration ] / 365 Number of Days Above Regulatory Standard* = COUNT [ Days Where Ozone > 75 ]
Coordinates were converted to raster and all data was summarized by US census tracts (2010). Final data includes the average annual Ozone concentration, as well as the number and percentage of days where Ozone concentrations exceed air quality standards. For more information about the data used in these estimates, please visit the EPA's Air Quality Data resource page.
Notes

Race and EthnicityStatistics by race and ethnicity are not provided for this indicator.
Fast Food Restaurant Access
Data Background
County Business Patterns (CBP) is an annual series that provides sub-national economic data by industry. Data for establishments are presented by geographic area, 6-digit NAICS industry, legal form of organization (U.S. and state only), and employment size class. Information is available on the number of establishments, employment during the week of March 12, first quarter payroll, and annual payroll. ZIP Code Business Patterns data are available shortly after the release of County Business Patterns. It provides the number of establishments by employment-size classes by detailed industry in the U.S.
County Business Patterns basic data items are extracted from the Business Register (BR), a database of all known single and multi-establishment employer companies maintained and updated by the U.S. Census Bureau. The BR contains the most complete, current, and consistent data for business establishments. The annual Company Organization Survey provides individual establishment data for multi-establishment companies. Data for single-establishment companies are obtained from various Census Bureau programs, such as the Economic Census, Annual Survey of Manufactures and Current Business Surveys, as well as from administrative record sources.
Citation: U.S. Census Bureau: County Business Patterns (2012).
For more information about this source, including data collection methodology and definitions, refer to the County Business Patterns website.
MethodologyPopulation figures are acquired for this indicator from the U.S. Census Bureau, 2010 Decennial Census, Summary File 1. Industry counts are acquired from the U.S. Census Bureau, County Business Patterns data file. Industries are stratified based on the 2012 North American Industry Classification System (NAICS) a coding system used by Federal statistical agencies in classifying business establishments for the purpose of collecting, analyzing, and publishing statistical data related to the U.S. business economy. Establishment rates for each county are derived using the following formula: Rate = [Establishment Count] / [Population] * 100,000
The specific NAICS codes used to identify establishment categories within the County Business Patterns (CBP) are listed below.
Grocery stores and supermarkets: 445110Grocery stores are establishments engaged in selling a "general line of food, such as canned and frozen foods; fresh fruits and vegetables; and fresh and prepared meats, fish, and poultry". Examples include supermarkets, commissaries and food stores. Convenience stores are excluded.
Fast food restaurants: 722513 (formerly 722211)Any “limited service” establishments where the customer typically orders or selects items and pay before eating. Establishments may include carryout restaurants, delicatessens, drive-ins, pizza delivery shops, sandwich shops, and other fast food restaurants

Alcoholic beverage retailers: 445310 Establishments engaged in “retailing packaged alcoholic beverages, such as ale, beer, wine, and liquor“. Bars and other venues serving alcoholic beverages intended for immediate consumption on the premises are not included.
Recreational Facilities: 713940Establishments engaged in operating facilities which offer “exercise and other active physical fitness conditioning or recreational sports activities”. Examples include athletic clubs, gymnasiums, dance centers, tennis clubs, and swimming pools.
A complete list of NAICS codes and definitions is available using the NAICS Association’s free lookup service .
Notes
Data Limitations1. Data are reported based on the primary NAICS code of the establishment. By definition, the primary NAICS code should reflect 50% or more of the establihsment's activity. This definition may exclude some establishments from a particular industry classification. For example, a convenience store which also sells liquor may be classified only as a convenience store (445120) and not a beer, wine and liquor store (445310).
Race and EthnicityStatistics by race and ethnicity are not provided for this indicator.
Data LimitationsReported data represent summaries limited by county boundaries. When comparing rates, consider the following: 1) Rates assume uniform distribution of both establishments and populations throughout the county and may not detect disparities in access for rural or minority populations. 2) Summaries may over-represent or under-represent county rates when populations or establishments are highly concentrated on county border lines. 3) Rates do not describe quality of the establishment or utilization frequency.
Housing Environment - Substandard Housing
Data Background
The American Community Survey (ACS) is a nationwide, continuous survey designed to provide communities with reliable and timely demographic, housing, social, and economic data. The ACS samples nearly 3 million addresses each year, resulting in nearly 2 million final interviews. The ACS replaces the long-form decennial census; however, the number of household surveys reported annually for the ACS is significantly less than the number reported in the long-form decennial census. As a result, the ACS combines detailed population and housing data from multiple years to produce reliable estimates for small counties, neighborhoods, and other local areas. Negotiating between timeliness and accuracy, the ACS annually releases current, one-year estimates for geographic areas with large populations; three-year and five-year estimates are also released each year for additional areas based on minimum population thresholds.
Citation: U.S. Census Bureau: A Compass for Understanding and Using American Community Survey Data (2008).

For more information about this source, including data collection methodology and definitions, refer to the American Community Survey website.
MethodologyCounts of housing units by age and condition are acquired from the U.S. Census Bureau’s American Community Survey. Data represent estimates for the 5 year period 2008-2012. Mapped data are summarized to 2010 census tract boundaries. Area estimates are developed at the U.S. Census Bureau, and given as a value for each geographic area. Raw counts are not provided, inhibiting the ability to produce median ages for report areas.
For more information on the data reported in the American Community Survey, please see the complete American Community Survey 2012 Subject Definitions.
Liquor Store Access
Data Background
County Business Patterns (CBP) is an annual series that provides sub-national economic data by industry. Data for establishments are presented by geographic area, 6-digit NAICS industry, legal form of organization (U.S. and state only), and employment size class. Information is available on the number of establishments, employment during the week of March 12, first quarter payroll, and annual payroll. ZIP Code Business Patterns data are available shortly after the release of County Business Patterns. It provides the number of establishments by employment-size classes by detailed industry in the U.S.
County Business Patterns basic data items are extracted from the Business Register (BR), a database of all known single and multi-establishment employer companies maintained and updated by the U.S. Census Bureau. The BR contains the most complete, current, and consistent data for business establishments. The annual Company Organization Survey provides individual establishment data for multi-establishment companies. Data for single-establishment companies are obtained from various Census Bureau programs, such as the Economic Census, Annual Survey of Manufactures and Current Business Surveys, as well as from administrative record sources.
Citation: U.S. Census Bureau: County Business Patterns (2012).
For more information about this source, including data collection methodology and definitions, refer to the County Business Patterns website.
MethodologyPopulation figures are acquired for this indicator from the U.S. Census Bureau, 2010 Decennial Census, Summary File 1. Industry counts are acquired from the U.S. Census Bureau, County Business Patterns data file. Industries are stratified based on the 2012 North American Industry Classification System (NAICS) a coding system used by Federal statistical agencies in classifying business establishments for the purpose of collecting, analyzing, and publishing statistical data related to the U.S. business economy. Establishment rates for each county are derived using the following formula:
Rate = [Establishment Count] / [Population] * 100,000
The specific NAICS codes used to identify establishment categories within the County Business Patterns (CBP) are listed below.

Grocery stores and supermarkets: 445110Grocery stores are establishments engaged in selling a "general line of food, such as canned and frozen foods; fresh fruits and vegetables; and fresh and prepared meats, fish, and poultry". Examples include supermarkets, commissaries and food stores. Convenience stores are excluded.
Fast food restaurants: 722513 (formerly 722211)Any “limited service” establishments where the customer typically orders or selects items and pay before eating. Establishments may include carryout restaurants, delicatessens, drive-ins, pizza delivery shops, sandwich shops, and other fast food restaurants
Alcoholic beverage retailers: 445310 Establishments engaged in “retailing packaged alcoholic beverages, such as ale, beer, wine, and liquor“. Bars and other venues serving alcoholic beverages intended for immediate consumption on the premises are not included.
Recreational Facilities: 713940Establishments engaged in operating facilities which offer "exercise and other active physical fitness conditioning or recreational sports activities". Examples include athletic clubs, gymnasiums, dance centers, tennis clubs, and swimming pools.
A complete list of NAICS codes and definitions is available using the NAICS Association’s free lookup service .
Notes
Race and EthnicityStatistics by race and ethnicity are not provided for this indicator.
Data LimitationsReported data represent summaries limited by county boundaries. When comparing rates, consider the following: 1) Rates assume uniform distribution of both establishments and populations throughout the county and may not detect disparities in access for rural or minority populations. 2) Summaries may over-represent or under-represent county rates when populations or establishments are highly concentrated on county border lines. 3) Rates do not describe quality of the establishment or utilization frequency.
Data Limitations1. Data are reported based on the primary NAICS code of the establishment. By definition, the primary NAICS code should reflect 50% or more of the establihsment's activity. This definition may exclude some establishments from a particular industry classification. For example, a convenience store which also sells liquor may be classified only as a convenience store (445120) and not a beer, wine and liquor store (445310).2. State laws regarding the retail sale of alcoholic beverages vary. Use caution when comparing data across States.
SNAP-Authorized Food Store Access
Data Background
The Food and Nutrition Service (FNS) is an agency of USDA's Food, Nutrition, and Consumer Services. FNS works to end hunger and obesity through the administration of 15 federal nutrition assistance programs including WIC, Supplemental Nutrition Assistance Program (SNAP), and school meals. In partnership with State and Tribal governments, FNS' pograms serve one in four Americans during the course of a year. The FNS mission is to increase food security and reduce hunger by providing children and low-income people access to food, a healthful diet and nutrition education in a way that supports American agriculture and inspires public confidence.
Methodology

Locations of SNAP-Authorized retailers was acquired from the US Department of Agriculture (USDA) Food and Nutrition Service (FNS) SNAP Retailers Locator. This data was processed and each retailer was assigned to the census tract which it fell entirely within. Counts of retailers per each census tract were generated. SNAP-retailer access rates were then calculated for each tract based on the number of stores per 10,000 population.
Locations of SNAP-authorized retailers are compiled by the USDA's Food and Nutrition Service, SNAP Benefits Redemption Division. This data is updated periodically and was last current as of July 16, 2013. Population data are from the U.S. Census Bureau 2010 Decennial Census. Indicator data is presented as a rate per 10,000 population based on the following formula:
Rate = [SNAP-Authorized Retailers] / [Total Population] * 10,000
For more information, please refer to the SNAP Retailer Locator documentation.
Notes
Data LimitationsReported data represent summaries limited by census tract boundaries. When comparing rates, consider the following: 1) Rates assume uniform distribution of both establishments and populations throughout the tract and may not detect disparities in access for rural or minority populations. 2) Summaries may over-represent or under-represent tract rates when populations or establishments are highly concentrated near tract borders. 3) Rates do not describe quality of the establishment or utilization frequency.
Race and EthnicityStatistics by race and ethnicity are not provided for this indicator.
Pneumonia Vaccination
Data Background
The Behavioral Risk Factor Surveillance System (BRFSS) is
“... a collaborative project of the Centers for Disease Control and Prevention (CDC) and U.S. states and territories. The BRFSS, administered and supported by CDC's Behavioral Risk Factor Surveillance Branch, is an ongoing data collection program designed to measure behavioral risk factors for the adult population (18 years of age or older) living in households. ”Citation: Centers for Disease Control and Prevention, Office of Surveillance, Epidemiology, and Laboratory Services. Overview: BRFSS 2010.
The health characteristics estimated from the BRFSS include data pertaining to health behaviors, chronic conditions, access and utilization of healthcare, and general health. Surveys are administered to populations at the state level and then delivered to the CDC and tabulated into county estimates by the BRFSS analysis team. Annual risk factor prevalence data are released for those geographic areas with 50 or more survey results and 10,000 or more total population (50 States, 170 Cities and Counties) in order to maintain the accuracy and

confidentiality of the data. Multi-year estimates are produced by the NCHS to expand the coverage of data to approximately 2500 counties. These estimates are housed in the Health Indicator Warehouse, the official repository of the nation’s health data.
For more information on the BRFSS survey methods, or to obtain a copy of the survey questionnaires, please visit the Behavioral Risk Factor Surveillance System home page.
MethodologyIndicator percentages are acquired for years 2006-2012 from Behavioral Risk Factor Surveillance System (BRFSS) prevalence data, which is housed in the Health Indicator Warehouse. Percentages are generated based on the valid responses to the following questions: "Have you EVER had a pneumonia shot? A pneumonia shot or pneumococcal vaccine is usually given only once or twice in a person's lifetime and is different from the flu shot. Have you ever had a pneumonia shot?"Respondents are considered to have had a pneumonia vaccination if they answer that they had ever had a vaccine. Percentages are age-adjusted and only pertain to the non-institutionalized population aged 65 and up. Population numerators (number of adults) are not provided in the Health Indicator Warehouse data tables and were generated using the following formula:
[Persons having a Pneumonia vaccinination] = ([Indicator Percentage] / 100) * [Total Population] .
Adult population figures used in the data tables are acquired from the American Community Survey (ACS) 2007-2011 five year estimates. Additional detailed information about the BRFSS, including questionnaires, data collection procedures, and data processing methodologies are available on the BRFSS web site. For additional information about the multi-year estimates, please visit the Health Indicator Warehouse.
Notes
Race and EthnicityStatistics by race and ethnicity are not provided for this indicator from the data source. Detailed race/ethnicity data may be available at a broader geographic level, or from a local source.
Data SuppressionSuppression is used to avoid misinterpretation when rates are unstable. Data is suppressed when the total number of persons sampled (for each geographic area / population group combination) over the survey period is less than 50, or when the standard error of the estimate exceeds 10% of the calculated value.
High Blood Pressure Management
Data Background
The Behavioral Risk Factor Surveillance System (BRFSS) is
“... a collaborative project of the Centers for Disease Control and Prevention (CDC) and U.S. states and territories. The BRFSS, administered and supported by CDC's Behavioral Risk Factor Surveillance Branch, is an ongoing data collection program designed to measure behavioral risk factors for the adult population (18 years of age or older) living in households.

”Citation: Centers for Disease Control and Prevention, Office of Surveillance, Epidemiology, and Laboratory Services. Overview: BRFSS 2010.
The health characteristics estimated from the BRFSS include data pertaining to health behaviors, chronic conditions, access and utilization of healthcare, and general health. Surveys are administered to populations at the state level and then delivered to the CDC. BRFSS annual survey data are publically available and maintained on the CDC's BRFSS Annual Survey Data web page.
For more information on the BRFSS survey methods, or to obtain a copy of the survey questionnaires, please visit the Behavioral Risk Factor Surveillance System home page.
MethodologyIndicator percentages are acquired from analysis of annual survey data from the Behavioral Risk Factor Surveillance System (BRFSS) for years 2006-2010. Percentages are generated based on valid responses to the following questions: "Have you EVER been told by a doctor, nurse or other health professional that you have high blood pressure? “ and “Are you currently taking medicine for your high blood pressure?”This indicator represents the percentage of those persons who answered that ‘yes’ they have high blood pressure who also answered ‘no’, that they are not currently taking medication to control it. Data only pertain to the non-institutionalized population aged 18 and up and are weighted to reflect the total county population, including non-respondents, using the methods described in the BRFSS Comparability of Data documentation. Population numerators (estimated number of adults exercising each risk behavior) are not provided in the annual survey data and were generated for the data tables using the following formula:
Adults Not Taking Blood Pressure Medication = ([Indicator Percentage] / 100) * [Total Adult Population]
The population figures used for these estimates are acquired from the American Community Survey (ACS) 2006-2010 five year estimates.Additional detailed information about the BRFSS, including questionnaires, data collection procedures, and data processing methodologies are available on the Behavioral Risk Factor Surveillance System home page.
Notes
Data SuppressionSuppression is used to avoid misinterpretation when rates are unstable. Data is suppressed when the total number of persons sampled (for each geographic area / population group combination) over the survey period is less than 20. Data are unreliable when the total number of persons sampled over the survey period is less than 50. Confidence intervals are available when exploring the data through the map viewer.
Race and EthnicityRace and ethnicity (Hispanic origin) are collected as two separate categories in the Behavioral Risk Factor Surveillance System (BRFSS) interview surveys based on methods established by the U.S. Office of Management and Budget (OMB) in 1997. Before the raw survey data files are released, self-identified race and ethnicity variables are recoded by National Center for Health Statistics (NCHS) analysts into the

following categories: White, Non-Hispanic; Black, Non-Hispanic; Multiple Race, Non-Hispanic; Other Race, Non-Hispanic; and Hispanic or Latino. Due to sample size constraints, race and ethnicity statistics are only reported at the state and national levels.
Lack of a Consistent Source of Primary Care
Data Background
The Behavioral Risk Factor Surveillance System (BRFSS) is
“... a collaborative project of the Centers for Disease Control and Prevention (CDC) and U.S. states and territories. The BRFSS, administered and supported by CDC's Behavioral Risk Factor Surveillance Branch, is an ongoing data collection program designed to measure behavioral risk factors for the adult population (18 years of age or older) living in households. ”Citation: Centers for Disease Control and Prevention, Office of Surveillance, Epidemiology, and Laboratory Services. Overview: BRFSS 2010.
The health characteristics estimated from the BRFSS include data pertaining to health behaviors, chronic conditions, access and utilization of healthcare, and general health. Surveys are administered to populations at the state level and then delivered to the CDC. BRFSS annual survey data are publically available and maintained on the CDC's BRFSS Annual Survey Data web page.
For more information on the BRFSS survey methods, or to obtain a copy of the survey questionnaires, please visit the Behavioral Risk Factor Surveillance System home page.
MethodologyIndicator percentages are acquired from analysis of annual survey data from the Behavioral Risk Factor Surveillance System (BRFSS) for years 2011-2012. Percentages are generated based on valid responses to the following questions: " Do you have one person you think of as your personal doctor or health care provider? (If "No" ask "Is there more than one or is there no person who you think of as your personal doctor or health care provider?".)”This indicator represents the percentage of those persons who answered “no” to both parts of the question, indicating that they do not see any regular doctor. Data only pertain to the non-institutionalized population aged 18 and up and are weighted to reflect the total county population using the methods described in the BRFSS Comparability of Data documentation.
Additional detailed information about the BRFSS, including questionnaires, data collection procedures, and data processing methodologies are available on the Behavioral Risk Factor Surveillance System home page.
Notes
Data SuppressionSuppression is used to avoid misinterpretation when rates are unstable. Data is suppressed when the total number of persons sampled (for each geographic area / population group combination) over the survey period is less than 20. Data are unreliable when the total number of

persons sampled over the survey period is less than 50. Confidence intervals are available when exploring the data through the map viewer.
Race and EthnicityRace and ethnicity (Hispanic origin) are collected as two separate categories in the Behavioral Risk Factor Surveillance System (BRFSS) interview surveys based on methods established by the U.S. Office of Management and Budget (OMB) in 1997. Before the raw survey data files are released, self-identified race and ethnicity variables are recoded by National Center for Health Statistics (NCHS) analysts into the following categories: White, Non-Hispanic; Black, Non-Hispanic; Multiple Race, Non-Hispanic; Other Race, Non-Hispanic; and Hispanic or Latino. Due to sample size constraints, race and ethnicity statistics are only reported at the state and national levels.
Alcohol Consumption
Data Background
The Behavioral Risk Factor Surveillance System (BRFSS) is
“... a collaborative project of the Centers for Disease Control and Prevention (CDC) and U.S. states and territories. The BRFSS, administered and supported by CDC's Behavioral Risk Factor Surveillance Branch, is an ongoing data collection program designed to measure behavioral risk factors for the adult population (18 years of age or older) living in households. ”Citation: Centers for Disease Control and Prevention, Office of Surveillance, Epidemiology, and Laboratory Services. Overview: BRFSS 2010.
The health characteristics estimated from the BRFSS include data pertaining to health behaviors, chronic conditions, access and utilization of healthcare, and general health. Surveys are administered to populations at the state level and then delivered to the CDC and tabulated into county estimates by the BRFSS analysis team. Annual risk factor prevalence data are released for those geographic areas with 50 or more survey results and 10,000 or more total population (50 States, 170 Cities and Counties) in order to maintain the accuracy and confidentiality of the data. Multi-year estimates are produced by the NCHS to expand the coverage of data to approximately 2500 counties. These estimates are housed in the Health Indicator Warehouse, the official repository of the nation’s health data.
For more information on the BRFSS survey methods, or to obtain a copy of the survey questionnaires, please visit the Behavioral Risk Factor Surveillance System home page.
MethodologyIndicator percentages are acquired for years 2006-2012 from Behavioral Risk Factor Surveillance System (BRFSS) prevalence data, which is housed in the Health Indicator Warehouse. Percentages are generated based on the valid responses to the following question: "One drink is equivalent to a 12-ounce beer, a 5-ounce glass of wine, or a drink with one shot of liquor. During the past 30 days, on the days when you drank, about how many drinks did you drink on the average?" Respondents are considered heavy drinkers if they were male and reported having more than 2 drinks per day, or females that reported having more than 1 drink per day. Percentages are age-adjusted and only pertain to the non-institutionalized population aged 18 and up.

Population numerators (number of adults) are not provided in the Health Indicator Warehouse data tables and were generated using the following formula:
[Heavy Drinkers] = ([Indicator Percentage] / 100) * [Total Population] .
Adult population figures used in the data tables are acquired from the American Community Survey (ACS) 2007-2011 five year estimates. Additional detailed information about the BRFSS, including questionnaires, data collection procedures, and data processing methodologies are available on the BRFSS web site. For additional information about the multi-year estimates, please visit the Health Indicator Warehouse.
Notes
Race and EthnicityStatistics by race and ethnicity are not provided for this indicator from the data source. Detailed race/ethnicity data may be available at a broader geographic level, or from a local source.
Data SuppressionSuppression is used to avoid misinterpretation when rates are unstable. Data is suppressed when the total number of persons sampled (for each geographic area / population group combination) over the survey period is less than 50, or when the standard error of the estimate exceeds 10% of the calculated value.
Alcohol Expenditures
Data Background
Nielsen is a publically held information company and a primary supplier of consumer spending data around the world, using both statistical analysis and field sampling techniques to produce accurate and timely information. Published annually, SiteReports provide market analysis to Nielsen customers at multiple geographic levels, spanning a wide range of topics including population demographics, household spending, and market potential. The SiteReports Consumer Buying Power (CBP) database is created using statistical models estimated from the Bureau of Labor Statistics' Consumer Expenditure Surveys (CEX). This survey provides information on the buying habits of American consumers, including expenditures, income, and other characteristics of the consumer unit (families and single consumers). The Consumer Expenditure Survey consists of two surveys: the quarterly Interview survey and the weekly Diary Survey. The surveys target the total non-institutionalized population (urban and rural) of the United States. The data is collected from the independent quarterly interview and weekly diary surveys of approximately 7,500 sample households. Each survey has its own independent sample, and each collects data on household income and socioeconomic characteristics. The current Nielsen Consumer Buying Power data uses a rolling five years of data from the Consumer Expenditure Survey, administered from 2005 through 2009. In addition to this data, the Nielsen Consumer Buying Power database also incorporates information from the following sources:
Nielsen Demographic Update Nielsen Cartographics U.S. Census Bureau: Census of Retail Trade

. For more information, please visit the Nielsen SiteReports website.
MethodologyCensus tract level average and aggregated total household expenditures and category expenditures were acquired from the 2011 Nielsen Consumer Buying Power (CBP) SiteReports. Tract-level and county-level expenditure estimates are proprietary Nielsen data restricted from public distribution and subject to terms of use agreements. Indicator data tables contain state and national ranks for counties, and percent expenditure estimates based on aggregated tract-level data. The percent expenditure figures calculated for custom geographic areas can be expressed using the following formula:
Percent Expenditures = [Category Expenditures] / [Total Area Expenditures] * 100
To generate acceptable county-level output for indicator report pages, percent expenditures for each food-at-home category were sorted and ranked by county. Each county’s within-state rank and that rank’s percentile are displayed in the indicator data table. This information is not available for custom geographic areas, for states, or for the total United States. County percentiles are calculated using the following formula:
Percentile = [County Within State Rank ] / [Total Number of Counties in State ] * 100
To generate acceptable map output in compliance with the Nielsen terms of use agreement, percent expenditures for each tract were sorted and ranked; quintiles were assigned to each tract based on national rank and symbolized within the map. Additional attributes include each tract’s within-state rank and quintile. Definitions for food-at-home categories used for consumer spending indicators are based on categories in the BLS Consumer Expenditure Survey (CEX), and are listed below.
Soft drinks: Soft drink expenditures included in this category are any non-alcoholic carbonated beverages purchased for consumption at home. Soft drinks purchased at restaurants and other dining establishments are not included.
Alcoholic beverages: Alcohol expenditures included in this category are any beer, wine, and liquor purchased for consumption at home. Alcohol purchased at restaurants and bars is not included.
Fruit and vegetables: Fruit and vegetables expenditures included in this category are all fresh, frozen and canned fruits and vegetables purchased for consumption at home.
Tobacco: Tobacco expenditures included in this category are cigarettes only; cigars and other tobacco products are not included.
Further details about the analysis used by Nielsen group can be found in the Consumer Buying Power Methodology.
Notes
Race and EthnicityStatistics by race and ethnicity are not provided for this indicator.
Tobacco Usage - Quit Attempt
Data Background
The Behavioral Risk Factor Surveillance System (BRFSS) is

“... a collaborative project of the Centers for Disease Control and Prevention (CDC) and U.S. states and territories. The BRFSS, administered and supported by CDC's Behavioral Risk Factor Surveillance Branch, is an ongoing data collection program designed to measure behavioral risk factors for the adult population (18 years of age or older) living in households. ”Citation: Centers for Disease Control and Prevention, Office of Surveillance, Epidemiology, and Laboratory Services. Overview: BRFSS 2010.
The health characteristics estimated from the BRFSS include data pertaining to health behaviors, chronic conditions, access and utilization of healthcare, and general health. Surveys are administered to populations at the state level and then delivered to the CDC. BRFSS annual survey data are publically available and maintained on the CDC's BRFSS Annual Survey Data web page.
For more information on the BRFSS survey methods, or to obtain a copy of the survey questionnaires, please visit the Behavioral Risk Factor Surveillance System home page.
MethodologyIndicator percentages are acquired from analysis of annual survey data from the Behavioral Risk Factor Surveillance System (BRFSS) for years 2011-2012. Percentages are generated based on valid responses to the following questions: "During the past 12 months, have you stopped smoking for one day or longer because you were trying to quit smoking?"Data only pertain to the non-institutionalized population aged 18 and up and are weighted to reflect the total county population using the methods described in the BRFSS Comparability of Data documentation.
Additional detailed information about the BRFSS, including questionnaires, data collection procedures, and data processing methodologies are available on the Behavioral Risk Factor Surveillance System home page.
Notes
Data SuppressionSuppression is used to avoid misinterpretation when rates are unstable. Data is suppressed when the total number of persons sampled (for each geographic area / population group combination) over the survey period is less than 20. Data are unreliable when the total number of persons sampled over the survey period is less than 50. Confidence intervals are available when exploring the data through the map viewer.
Race and EthnicityRace and ethnicity (Hispanic origin) are collected as two separate categories in the Behavioral Risk Factor Surveillance System (BRFSS) interview surveys based on methods established by the U.S. Office of Management and Budget (OMB) in 1997. Before the raw survey data files are released, self-identified race and ethnicity variables are recoded by National Center for Health Statistics (NCHS) analysts into the following categories: White, Non-Hispanic; Black, Non-Hispanic; Multiple Race, Non-Hispanic; Other Race, Non-Hispanic; and Hispanic or Latino. Due to sample size constraints, race and ethnicity statistics are only reported at the state and national levels.
Depression (Medicare Population)

Data Background
The Centers for Medicare & Medicaid Services (CMS), a branch of the Department of Health and Human Services (HHS), is the federal agency that runs the Medicare Program and monitors Medicaid programs offered by each state. Medicare is a type of federally-funded health insurance available to disabled persons and the population age 65 and older. CMS provides various data on the Medicare population based on claims and enrollment data.
MethodologyIndicator percentages are acquired for 2012 from Centers for Medicare and Medicaid Services (CMS) Chronic Conditions Warehouse. The data used in the chronic condition reports are based upon CMS administrative enrollment and claims data for Medicare beneficiaries enrolled in the fee-for-service program. Beneficiaries who died during the year are included up to their date of death if they meet the other inclusion criteria. Chronic condition prevalence estimates are calculated by CMS by taking the beneficiaries with a particular condition divided by the total number of beneficiaries in our fee-for-service population, expressed as a percentage. For more information and to view the original data, please visit the CMS Chronic Conditions web page.
High Cholesterol (Medicare Population)
Data Background
The Centers for Medicare & Medicaid Services (CMS), a branch of the Department of Health and Human Services (HHS), is the federal agency that runs the Medicare Program and monitors Medicaid programs offered by each state. Medicare is a type of federally-funded health insurance available to disabled persons and the population age 65 and older. CMS provides various data on the Medicare population based on claims and enrollment data.
MethodologyIndicator percentages are acquired for 2012 from Centers for Medicare and Medicaid Services (CMS) Chronic Conditions Warehouse. The data used in the chronic condition reports are based upon CMS administrative enrollment and claims data for Medicare beneficiaries enrolled in the fee-for-service program. Beneficiaries who died during the year are included up to their date of death if they meet the other inclusion criteria. Chronic condition prevalence estimates are calculated by CMS by taking the beneficiaries with a particular condition divided by the total number of beneficiaries in our fee-for-service population, expressed as a percentage. For more information and to view the original data, please visit the CMS Chronic Conditions web page.
Asthma Prevalence
Data Background
The Behavioral Risk Factor Surveillance System (BRFSS) is
“... a collaborative project of the Centers for Disease Control and Prevention (CDC) and U.S. states and territories. The BRFSS, administered and supported by CDC's Behavioral Risk Factor Surveillance Branch, is an ongoing data collection program designed to measure behavioral risk factors for the adult population (18 years of age or older) living in households. ”

Citation: Centers for Disease Control and Prevention, Office of Surveillance, Epidemiology, and Laboratory Services. Overview: BRFSS 2010.
The health characteristics estimated from the BRFSS include data pertaining to health behaviors, chronic conditions, access and utilization of healthcare, and general health. Surveys are administered to populations at the state level and then delivered to the CDC. BRFSS annual survey data are publically available and maintained on the CDC's BRFSS Annual Survey Data web page.
For more information on the BRFSS survey methods, or to obtain a copy of the survey questionnaires, please visit the Behavioral Risk Factor Surveillance System home page.
MethodologyIndicator percentages are acquired from analysis of annual survey data from the Behavioral Risk Factor Surveillance System (BRFSS) for years 2011-2012. Percentages are generated based on valid responses to the following questions: "Have you ever been told by a doctor, nurse, or health professional that you have Asthma?"This indicator represents the percentage of those persons who answered “yes”. Data only pertain to the non-institutionalized population aged 18 and up and are weighted to reflect the total county population using the methods described in the BRFSS Comparability of Data documentation.
Additional detailed information about the BRFSS, including questionnaires, data collection procedures, and data processing methodologies are available on the Behavioral Risk Factor Surveillance System home page.
Notes
Data SuppressionSuppression is used to avoid misinterpretation when rates are unstable. Data is suppressed when the total number of persons sampled (for each geographic area / population group combination) over the survey period is less than 20. Data are unreliable when the total number of persons sampled over the survey period is less than 50. Confidence intervals are available when exploring the data through the map viewer.
Race and EthnicityRace and ethnicity (Hispanic origin) are collected as two separate categories in the Behavioral Risk Factor Surveillance System (BRFSS) interview surveys based on methods established by the U.S. Office of Management and Budget (OMB) in 1997. Before the raw survey data files are released, self-identified race and ethnicity variables are recoded by National Center for Health Statistics (NCHS) analysts into the following categories: White, Non-Hispanic; Black, Non-Hispanic; Multiple Race, Non-Hispanic; Other Race, Non-Hispanic; and Hispanic or Latino. Due to sample size constraints, race and ethnicity statistics are only reported at the state and national levels.
Chlamydia Incidence
Data Background

The National Center for HIV/AIDS, Viral Hepatitis, Sexually Transmitted Disease (STD), and Tuberculosis (TB) Prevention (NCHHSTP) is the branch of the Centers for Disease Control and Prevention (CDC) responsible for public health surveillance, prevention research, and programs to prevent and control HIV and AIDS, other STDs, viral hepatitis, and TB. NCHHSTP developed a set of indicators to monitor the prevalence and track its progress toward ending these diseases in each state, and regularly reports its progress. The NCHHSTEP program includes data from new patient case reports from 56 areas (all 50 states, the District of Columbia, American Samoa, Guam, the Northern Mariana Islands, Puerto Rico, and the U.S. Virgin Islands).
MethodologyCases of a given STD refer to confirmed diagnoses during a given time period. For example, the 2010 data on gonorrhea infection would include persons with laboratory-confirmed infection diagnosed between January 1, 2010 and December 31, 2010, and reported to CDC through June 8, 2011. Rates per 100,000 population were calculated for each STD. The population denominators used to compute these rates for the 50 states and the District of Columbia were based on the National Center for Health Statistics (NCHS) bridged-race population counts for the 2000–2010. These estimates are a modification of the U.S. Census Bureau population estimates in which the 31 race categories used by the Census Bureau are bridged into the five race/ethnicity groups that have been historically used to report race data for STD cases. Each rate was calculated by dividing the number of cases for the calendar year by the population for that calendar year and then multiplying the number by 100,000.
For more information, visit the NCHHSTP Atlas and click on the “About these data and footnotes” link.
Notes
Race and EthnicityRace and ethnicity (Hispanic origin) are collected as two separate categories by state departments of health based on methods established by the U.S. Office of Management and Budget (OMB) in 1997. Data reported from the CDC National Center for HIV/AIDS, Viral Hepatitis, STD, and TB Prevention (NCHHSTP) is available by combined race and ethnicity, and is reported only for state and national data summaries. County level statistics by race and ethnicity are not provided for this indicator from the data source. Detailed race/ethnicity data may be available from a local source.
Gonorrhea Incidence
Data Background
The National Center for HIV/AIDS, Viral Hepatitis, Sexually Transmitted Disease (STD), and Tuberculosis (TB) Prevention (NCHHSTP) is the branch of the Centers for Disease Control and Prevention (CDC) responsible for public health surveillance, prevention research, and programs to prevent and control HIV and AIDS, other STDs, viral hepatitis, and TB. NCHHSTP developed a set of indicators to monitor the prevalence and track its progress toward ending these diseases in each state, and regularly reports its progress. The NCHHSTEP program includes data from new patient case reports from 56 areas (all 50 states, the District of Columbia, American Samoa, Guam, the Northern Mariana Islands, Puerto Rico, and the U.S. Virgin Islands).
MethodologyCases of a given STD refer to confirmed diagnoses during a given time period. For example, the 2010 data on gonorrhea infection would include persons with laboratory-confirmed infection diagnosed between January 1, 2010 and December 31, 2010, and reported to CDC

through June 8, 2011. Rates per 100,000 population were calculated for each STD. The population denominators used to compute these rates for the 50 states and the District of Columbia were based on the National Center for Health Statistics (NCHS) bridged-race population counts for the 2000–2010. These estimates are a modification of the U.S. Census Bureau population estimates in which the 31 race categories used by the Census Bureau are bridged into the five race/ethnicity groups that have been historically used to report race data for STD cases. Each rate was calculated by dividing the number of cases for the calendar year by the population for that calendar year and then multiplying the number by 100,000.
For more information, visit the NCHHSTP Atlas and click on the “About these data and footnotes” link.
Notes
Race and EthnicityRace and ethnicity (Hispanic origin) are collected as two separate categories by state departments of health based on methods established by the U.S. Office of Management and Budget (OMB) in 1997. Data reported from the CDC National Center for HIV/AIDS, Viral Hepatitis, STD, and TB Prevention (NCHHSTP) is available by combined race and ethnicity, and is reported only for state and national data summaries. County level statistics by race and ethnicity are not provided for this indicator from the data source. Detailed race/ethnicity data may be available from a local source.
HIV Prevalence
Data Background
The National Center for HIV/AIDS, Viral Hepatitis, Sexually Transmitted Disease (STD), and Tuberculosis (TB) Prevention (NCHHSTP) is the branch of the Centers for Disease Control and Prevention (CDC) responsible for public health surveillance, prevention research, and programs to prevent and control HIV and AIDS, other STDs, viral hepatitis, and TB. NCHHSTP developed a set of indicators to monitor the prevalence and track its progress toward ending these diseases in each state, and regularly reports its progress. The NCHHSTEP program includes data from new patient case reports from 56 areas (all 50 states, the District of Columbia, American Samoa, Guam, the Northern Mariana Islands, Puerto Rico, and the U.S. Virgin Islands).
MethodologyCases of a given STD refer to confirmed diagnoses during a given time period. For example, the 2010 data on gonorrhea infection would include persons with laboratory-confirmed infection diagnosed between January 1, 2010 and December 31, 2010, and reported to CDC through June 8, 2011. Rates per 100,000 population were calculated for each STD. The population denominators used to compute these rates for the 50 states and the District of Columbia were based on the National Center for Health Statistics (NCHS) bridged-race population counts for the 2000–2010. These estimates are a modification of the U.S. Census Bureau population estimates in which the 31 race categories used by the Census Bureau are bridged into the five race/ethnicity groups that have been historically used to report race data for STD cases. Each rate was calculated by dividing the number of cases for the calendar year by the population for that calendar year and then multiplying the number by 100,000.
For more information, visit the NCHHSTP Atlas and click on the “About these data and footnotes” link.
Notes

Race and EthnicityRace and ethnicity (Hispanic origin) are collected as two separate categories by state departments of health based on methods established by the U.S. Office of Management and Budget (OMB) in 1997. Data reported from the CDC National Center for HIV/AIDS, Viral Hepatitis, STD, and TB Prevention (NCHHSTP) is available by combined race and ethnicity, and is reported only for state and national data summaries. County level statistics by race and ethnicity are not provided for this indicator from the data source. Detailed race/ethnicity data may be available from a local source.
Cancer Incidence - Breast
Data Background
The Surveillance, Epidemiology and End Results (SEER) program of the National Cancer Institute (NCI) collect information on incidence, prevalence and survival from state and local cancer resgistries in 14 US sates. SEER also compiles cancer mortality statistics for the entire country.
The State Cancer Profiles website provides statistics to help guide and prioritize cancer control activities at the state and local levels. State Cancer Profiles are a collaborative effort of the National Cancer Institute (NCI) and the Centers for Disease Control and Prevention (CDC). The incidence rates tables accessed through the State Cancer Profiles website provide incidence statistics compiled from state and local cancer registries. Statistics are available for those states with cancer registries whose data have met the criteria required for inclusion in the US Cancer Statistics. Data is provided for use in assessing the burden and risk for a major cancer site for the US overall or for a selected state and its counties.
State-based cancer registries are data systems that collect, manage, and analyze data about cancer cases and cancer deaths. In each state, medical facilities (including hospitals, physicians' offices, therapeutic radiation facilities, freestanding surgical centers, and pathology laboratories) report these data to a central cancer registry. State cancer registries receive funding and program guidance through the CDC’s National Program of Cancer Registries and the National Cancer Institute’s Surveillance, Epidemiology and End Results (SEER) program.
For more information, please visit the State Cancer Profiles website.
MethodologyAnnual incidence rates are acquired for all US states and counties as an average for years 2007-2011 from the State Cancer Profiles Incidence Rates Tables. This source provides the average annual incidence of new cancer cases, as well as incidence rates, age adjusted to the 2000 US standard population. The new case counts (incidence) used to generate the State Cancer Profiles data tables are provided by the National Program of Cancer Registries Cancer Surveillance System (NPCR-CSS), the Centers for Disease Control and Prevention, and by the National Cancer Institute's Surveillance, Epidemiology, and End Results (SEER) Program. The population data displayed in the report summary tables are based on American Community Survey 2007-11 5-year estimates and are shown for reference only.
In order to perform aggregate (multi-county or service area) incidence rate estimates with the data provided, age-adjusted total populations are first back-calculated using the following formula:
Adj. Population = ([Cancer Incidence] / ([Adj. Incidence Rate] / 100,000) )

This estimated population figure is then used in the formula to re-calculate age-adjusted cancer rates as follows: Adj. Incidence Rate = 100,000 * ([Cancer Incidence] / [Adj. Population])
For more information about the State Cancer Profiles data, including age-adjustment and data suppression, please visit the SEER*Stat website.
Notes
Data Limitations1. Data is not available for the state of Kansas because of state legislation and regulations which prohibit the release of county level data to outside entities. 2. Data is not available for the state of Minnesota. 3. Data for Ohio counties are acquired from CDC WONDER. Data are estimates based on metropolitan areas which consist of multiple counties.4.Data for the state of Michigan do not include cases diagnosed in other states because data exchange agreements prohibit the release of data to third parties.
Race and EthnicityCancer statistics from the State Cancer Profiles database are reported by race alone (White, Black, Amer. Indian/AK Native, and Asian) or by ethnicity alone (Hispanic), or for the white Hispanic and white non-Hispanic population. NHIA (NAACCR Hispanic Identification Algorithm) was used to determine Hispanic ethnicity. See the Technical Notes section of the 2003 United States Cancer Statistics Report for more information.
Data SuppressionSuppression is used to avoid misinterpretation when rates are unstable. Data is suppressed when the number of cases is less than 16 (for each county/cancer/population group combination) over the time period monitored, or when the total population (per race-ethnicity-sex grouping) of the report area is less than 50,000
Cancer Incidence - Cervical
Data Background
The Surveillance, Epidemiology and End Results (SEER) program of the National Cancer Institute (NCI) collect information on incidence, prevalence and survival from state and local cancer resgistries in 14 US sates. SEER also compiles cancer mortality statistics for the entire country.
The State Cancer Profiles website provides statistics to help guide and prioritize cancer control activities at the state and local levels. State Cancer Profiles are a collaborative effort of the National Cancer Institute (NCI) and the Centers for Disease Control and Prevention (CDC). The incidence rates tables accessed through the State Cancer Profiles website provide incidence statistics compiled from state and local cancer registries. Statistics are available for those states with cancer registries whose data have met the criteria required for inclusion in

the US Cancer Statistics. Data is provided for use in assessing the burden and risk for a major cancer site for the US overall or for a selected state and its counties.
State-based cancer registries are data systems that collect, manage, and analyze data about cancer cases and cancer deaths. In each state, medical facilities (including hospitals, physicians' offices, therapeutic radiation facilities, freestanding surgical centers, and pathology laboratories) report these data to a central cancer registry. State cancer registries receive funding and program guidance through the CDC’s National Program of Cancer Registries and the National Cancer Institute’s Surveillance, Epidemiology and End Results (SEER) program.
For more information, please visit the State Cancer Profiles website.
MethodologyAnnual incidence rates are acquired for all US states and counties as an average for years 2007-2011 from the State Cancer Profiles Incidence Rates Tables. This source provides the average annual incidence of new cancer cases, as well as incidence rates, age adjusted to the 2000 US standard population. The new case counts (incidence) used to generate the State Cancer Profiles data tables are provided by the National Program of Cancer Registries Cancer Surveillance System (NPCR-CSS), the Centers for Disease Control and Prevention, and by the National Cancer Institute's Surveillance, Epidemiology, and End Results (SEER) Program. The population data displayed in the report summary tables are based on American Community Survey 2007-11 5-year estimates and are shown for reference only.
In order to perform aggregate (multi-county or service area) incidence rate estimates with the data provided, age-adjusted total populations are first back-calculated using the following formula:
Adj. Population = ([Cancer Incidence] / ([Adj. Incidence Rate] / 100,000) )
This estimated population figure is then used in the formula to re-calculate age-adjusted cancer rates as follows: Adj. Incidence Rate = 100,000 * ([Cancer Incidence] / [Adj. Population])
For more information about the State Cancer Profiles data, including age-adjustment and data suppression, please visit the SEER*Stat website.
Notes
Data Limitations1. Data is not available for the state of Kansas because of state legislation and regulations which prohibit the release of county level data to outside entities. 2. Data is not available for the state of Minnesota. 3. Data for Ohio counties are acquired from CDC WONDER. Data are estimates based on metropolitan areas which consist of multiple counties.4.Data for the state of Michigan do not include cases diagnosed in other states because data exchange agreements prohibit the release of data to third parties.
Race and EthnicityCancer statistics from the State Cancer Profiles database are reported by race alone (White, Black, Amer. Indian/AK Native, and Asian) or

by ethnicity alone (Hispanic), or for the white Hispanic and white non-Hispanic population. NHIA (NAACCR Hispanic Identification Algorithm) was used to determine Hispanic ethnicity. See the Technical Notes section of the 2003 United States Cancer Statistics Report for more information.
Data SuppressionSuppression is used to avoid misinterpretation when rates are unstable. Data is suppressed when the number of cases is less than 16 (for each county/cancer/population group combination) over the time period monitored, or when the total population (per race-ethnicity-sex grouping) of the report area is less than 50,000
Cancer Incidence - Lung
Data Background
The Surveillance, Epidemiology and End Results (SEER) program of the National Cancer Institute (NCI) collect information on incidence, prevalence and survival from state and local cancer resgistries in 14 US sates. SEER also compiles cancer mortality statistics for the entire country.
The State Cancer Profiles website provides statistics to help guide and prioritize cancer control activities at the state and local levels. State Cancer Profiles are a collaborative effort of the National Cancer Institute (NCI) and the Centers for Disease Control and Prevention (CDC). The incidence rates tables accessed through the State Cancer Profiles website provide incidence statistics compiled from state and local cancer registries. Statistics are available for those states with cancer registries whose data have met the criteria required for inclusion in the US Cancer Statistics. Data is provided for use in assessing the burden and risk for a major cancer site for the US overall or for a selected state and its counties.
State-based cancer registries are data systems that collect, manage, and analyze data about cancer cases and cancer deaths. In each state, medical facilities (including hospitals, physicians' offices, therapeutic radiation facilities, freestanding surgical centers, and pathology laboratories) report these data to a central cancer registry. State cancer registries receive funding and program guidance through the CDC’s National Program of Cancer Registries and the National Cancer Institute’s Surveillance, Epidemiology and End Results (SEER) program.
For more information, please visit the State Cancer Profiles website.
MethodologyAnnual incidence rates are acquired for all US states and counties as an average for years 2007-2011 from the State Cancer Profiles Incidence Rates Tables. This source provides the average annual incidence of new cancer cases, as well as incidence rates, age adjusted to the 2000 US standard population. The new case counts (incidence) used to generate the State Cancer Profiles data tables are provided by the National Program of Cancer Registries Cancer Surveillance System (NPCR-CSS), the Centers for Disease Control and Prevention, and by the National Cancer Institute's Surveillance, Epidemiology, and End Results (SEER) Program. The population data displayed in the report summary tables are based on American Community Survey 2007-11 5-year estimates and are shown for reference only.
In order to perform aggregate (multi-county or service area) incidence rate estimates with the data provided, age-adjusted total populations are first back-calculated using the following formula:

Adj. Population = ([Cancer Incidence] / ([Adj. Incidence Rate] / 100,000) )
This estimated population figure is then used in the formula to re-calculate age-adjusted cancer rates as follows: Adj. Incidence Rate = 100,000 * ([Cancer Incidence] / [Adj. Population])
For more information about the State Cancer Profiles data, including age-adjustment and data suppression, please visit the SEER*Stat website.
Notes
Data Limitations1. Data is not available for the state of Kansas because of state legislation and regulations which prohibit the release of county level data to outside entities. 2. Data is not available for the state of Minnesota. 3. Data for Ohio counties are acquired from CDC WONDER. Data are estimates based on metropolitan areas which consist of multiple counties.4.Data for the state of Michigan do not include cases diagnosed in other states because data exchange agreements prohibit the release of data to third parties.
Race and EthnicityCancer statistics from the State Cancer Profiles database are reported by race alone (White, Black, Amer. Indian/AK Native, and Asian) or by ethnicity alone (Hispanic), or for the white Hispanic and white non-Hispanic population. NHIA (NAACCR Hispanic Identification Algorithm) was used to determine Hispanic ethnicity. See the Technical Notes section of the 2003 United States Cancer Statistics Report for more information.
Data SuppressionSuppression is used to avoid misinterpretation when rates are unstable. Data is suppressed when the number of cases is less than 16 (for each county/cancer/population group combination) over the time period monitored, or when the total population (per race-ethnicity-sex grouping) of the report area is less than 50,000
Cancer Incidence - Prostate
Data Background
The Surveillance, Epidemiology and End Results (SEER) program of the National Cancer Institute (NCI) collect information on incidence, prevalence and survival from state and local cancer resgistries in 14 US sates. SEER also compiles cancer mortality statistics for the entire country.
The State Cancer Profiles website provides statistics to help guide and prioritize cancer control activities at the state and local levels. State Cancer Profiles are a collaborative effort of the National Cancer Institute (NCI) and the Centers for Disease Control and Prevention (CDC). The incidence rates tables accessed through the State Cancer Profiles website provide incidence statistics compiled from state and local cancer registries. Statistics are available for those states with cancer registries whose data have met the criteria required for inclusion in

the US Cancer Statistics. Data is provided for use in assessing the burden and risk for a major cancer site for the US overall or for a selected state and its counties.
State-based cancer registries are data systems that collect, manage, and analyze data about cancer cases and cancer deaths. In each state, medical facilities (including hospitals, physicians' offices, therapeutic radiation facilities, freestanding surgical centers, and pathology laboratories) report these data to a central cancer registry. State cancer registries receive funding and program guidance through the CDC’s National Program of Cancer Registries and the National Cancer Institute’s Surveillance, Epidemiology and End Results (SEER) program.
For more information, please visit the State Cancer Profiles website.
MethodologyAnnual incidence rates are acquired for all US states and counties as an average for years 2007-2011 from the State Cancer Profiles Incidence Rates Tables. This source provides the average annual incidence of new cancer cases, as well as incidence rates, age adjusted to the 2000 US standard population. The new case counts (incidence) used to generate the State Cancer Profiles data tables are provided by the National Program of Cancer Registries Cancer Surveillance System (NPCR-CSS), the Centers for Disease Control and Prevention, and by the National Cancer Institute's Surveillance, Epidemiology, and End Results (SEER) Program. The population data displayed in the report summary tables are based on American Community Survey 2007-11 5-year estimates and are shown for reference only.
In order to perform aggregate (multi-county or service area) incidence rate estimates with the data provided, age-adjusted total populations are first back-calculated using the following formula:
Adj. Population = ([Cancer Incidence] / ([Adj. Incidence Rate] / 100,000) )
This estimated population figure is then used in the formula to re-calculate age-adjusted cancer rates as follows: Adj. Incidence Rate = 100,000 * ([Cancer Incidence] / [Adj. Population])
For more information about the State Cancer Profiles data, including age-adjustment and data suppression, please visit the SEER*Stat website.
Notes
Data Limitations1. Data is not available for the state of Kansas because of state legislation and regulations which prohibit the release of county level data to outside entities. 2. Data is not available for the state of Minnesota. 3. Data for Ohio counties are acquired from CDC WONDER. Data are estimates based on metropolitan areas which consist of multiple counties.4.Data for the state of Michigan do not include cases diagnosed in other states because data exchange agreements prohibit the release of data to third parties.
Race and EthnicityCancer statistics from the State Cancer Profiles database are reported by race alone (White, Black, Amer. Indian/AK Native, and Asian) or

by ethnicity alone (Hispanic), or for the white Hispanic and white non-Hispanic population. NHIA (NAACCR Hispanic Identification Algorithm) was used to determine Hispanic ethnicity. See the Technical Notes section of the 2003 United States Cancer Statistics Report for more information.
Data SuppressionSuppression is used to avoid misinterpretation when rates are unstable. Data is suppressed when the number of cases is less than 16 (for each county/cancer/population group combination) over the time period monitored, or when the total population (per race-ethnicity-sex grouping) of the report area is less than 50,000
Low Birth Weight
Data Background
The Health Indicator Warehouse is the official repository of the nation's health data, providing public access to the information resources of the Centers for Disease Control and Prevention (CDC), the Environmental Protection Agency (EPA), the Health Resources and Services Administration (HRSA), and others. When applicable, data can be obtained grouped by various information, including state, county, gender, race, ethnicity, and educational attainment.
The Division of Vital Statistics is a branch of the Centers for Disease Control and Prevention (CDC) National Center for Health Statistics (NCHS) responsible for maintaining birth and death records for the nation. Data are compiled for the National Vital Statistics System (NVSS) through a joint effort between the NCHS and various state and local health agencies, who are responsible for registering vital events – births, deaths, marriages, divorces, and fetal deaths. NVSS statistics are released annually in various data warehouses, including CDC WONDER , VitalStats, and the Health Indicator Warehouse .
MethodologyCounts for this indicator represent the annual average births over the 7-year period 2003-2009. Original data was tabulated by the CDC based on information reported on each birth certificate. Rates represent the number of births weighing less than 2,500 grams per 100 live births based on the following formula:
Rate = [Births Weighting < 2500g] / [Total Births] * 100
Data was acquired from the Health Indicators Warehouse. For more information about this source, including data inclusion requirements and subject definitions, please visit the Health Indicator Warehouse indicator page or refer to the NVSS natality public use file documention .
Notes
Race and EthnicityRace and ethnicity (Hispanic origin) are collected as two separate categories by state vital statistics registries based on methods established by the U.S. Office of Management and Budget (OMB) in 1997. All mortality statistics from the CDC WONDER databases are available by race alone (White, Black, Amer. Indian/AK Native, and Asian) ethnicity alone (Hispanic, Non-Hispanic), or by combined race and ethnicity. Data is reported separately for race alone and for ethnicity alone in order to maintain large enough sample sizes for the inclusion of small counties in the disaggregated data tables.

Mortality - Cancer
Data Background
The Division of Vital Statistics is a branch of the Centers for Disease Control and Prevention (CDC) National Center for Health Statistics (NCHS) responsible for maintaining birth and death records for the nation. Data are compiled for the National Vital Statistics System (NVSS) through a joint effort between the NCHS and various state and local health agencies, who are responsible for registering vital events – births, deaths, marriages, divorces, and fetal deaths. NVSS statistics are released annually in various data warehouses, including CDC WONDER , VitalStats, and the Health Indicator Warehouse .
CDC WONDER, developed by the Centers for Disease Control and Prevention (CDC), is an integrated information and communication system for public health. Its purposes are:
To promote information-driven decision making by placing timely, useful facts in the hands of public health practitioners and researchers, and
To provide the general public with access to specific and detailed information from CDC.
CDC WONDER provides:
Access statistical research data published by CDC, as well as reference materials, reports and guidelines on health-related topics; The ability to query numeric datasets on CDC's computers, via "fill-in-the blank" web pages. Public-use data sets about mortality
(deaths), cancer incidence, HIV and AIDS, tuberculosis, vaccinations, natality (births), census data and many other topics are available for query, and the requested data are readily summarized and analyzed, with dynamically calculated statistics, charts and maps.
CDC WONDER data can be obtained grouped by various information, including state, county, gender, race, ethnicity, and educational attainment. For more information, please visit the CDC WONDER website.
MethodologyCounty population figures and death statistics are acquired using CDC WONDER from the Underlying Cause of Death database. Conditions were queried for years 2006-2010 based on a selection of codes from the International Classification of Diseases (ICD), Version 10. The ICD-10 is the current global health information standard for mortality and morbidity statistics. The ICD has been maintained by the World Health Organization since its conception in 1948. A searchable, detailed list of current ICD-10 Codes (Version 2010) is available from the World Health Organization.
Mortality rates were acquired from the source age-adjusted to the year 2000 U.S. standard. To recalculate age-adjusted mortality rates for unique service areas and aggregated county groupings, the following formula was used:
Mortality Rate = [SUM(Total Population) * ((Age-Adjusted Rate)/100,000)] / [SUM(Total Population)] * 100,000.

The specific codes used for reported mortality indicators are listed below.
Assault (homicide): U01-U02, X85-Y09, Y87.1 Cerebrovascular disease (stroke): I60-I69 Coronary (ischaemic) heart disease:I20-I25 Chronic lower respiratory disease: J40-J47 Heart disease: I00–I09, I11, I13, I20–I51 Intentional self-harm (suicide): U03, X60-X84, Y87.0 Malignant neoplasm (cancer): C00-C97 Motor vehicle accident: V01-V79 Unintentional injury (accident): V01-X59, Y85-Y86
Notes
Data SuppressionSuppression is used to avoid misinterpretation when rates are unstable. Data is suppressed when the total number of cases is less than 10 (for each county/cause of death/population group) over the time period monitored. Rates should be considered unreliable when calculated with a numerator (number of cases) less than 20.
Trends Over TimeTrends over time are produced using single-year mortality data from the CDC WONDER query system. Use caution when comparing single-year mortality rates with 5-year aggregate mortality rates. Trend data is available for states and for the total US; county-level data is not provided due to data suppression / low numerator counts.
Race and EthnicityRace and ethnicity (Hispanic origin) are collected as two separate categories by state vital statistics registries based on methods established by the U.S. Office of Management and Budget (OMB) in 1997. All mortality statistics from the CDC WONDER databases are available by race alone (White, Black, Amer. Indian/AK Native, and Asian) ethnicity alone (Hispanic, Non-Hispanic), or by combined race and ethnicity. Data is reported here in combination, and thus may be subject to higher suppression than if reported separately.
Mortality - Stroke
Data Background
The Division of Vital Statistics is a branch of the Centers for Disease Control and Prevention (CDC) National Center for Health Statistics (NCHS) responsible for maintaining birth and death records for the nation. Data are compiled for the National Vital Statistics System (NVSS) through a joint effort between the NCHS and various state and local health agencies, who are responsible for registering vital events – births, deaths, marriages, divorces, and fetal deaths. NVSS statistics are released annually in various data warehouses, including CDC WONDER , VitalStats, and the Health Indicator Warehouse .
CDC WONDER, developed by the Centers for Disease Control and Prevention (CDC), is an integrated information and communication system for public health. Its purposes are:

To promote information-driven decision making by placing timely, useful facts in the hands of public health practitioners and researchers, and
To provide the general public with access to specific and detailed information from CDC.
CDC WONDER provides:
Access statistical research data published by CDC, as well as reference materials, reports and guidelines on health-related topics; The ability to query numeric datasets on CDC's computers, via "fill-in-the blank" web pages. Public-use data sets about mortality
(deaths), cancer incidence, HIV and AIDS, tuberculosis, vaccinations, natality (births), census data and many other topics are available for query, and the requested data are readily summarized and analyzed, with dynamically calculated statistics, charts and maps.
CDC WONDER data can be obtained grouped by various information, including state, county, gender, race, ethnicity, and educational attainment. For more information, please visit the CDC WONDER website.
MethodologyCounty population figures and death statistics are acquired using CDC WONDER from the Underlying Cause of Death database. Conditions were queried for years 2006-2010 based on a selection of codes from the International Classification of Diseases (ICD), Version 10. The ICD-10 is the current global health information standard for mortality and morbidity statistics. The ICD has been maintained by the World Health Organization since its conception in 1948. A searchable, detailed list of current ICD-10 Codes (Version 2010) is available from the World Health Organization.
Mortality rates were acquired from the source age-adjusted to the year 2000 U.S. standard. To recalculate age-adjusted mortality rates for unique service areas and aggregated county groupings, the following formula was used:
Mortality Rate = [SUM(Total Population) * ((Age-Adjusted Rate)/100,000)] / [SUM(Total Population)] * 100,000.
The specific codes used for reported mortality indicators are listed below.
Assault (homicide): U01-U02, X85-Y09, Y87.1 Cerebrovascular disease (stroke): I60-I69 Coronary (ischaemic) heart disease:I20-I25 Chronic lower respiratory disease: J40-J47 Heart disease: I00–I09, I11, I13, I20–I51 Intentional self-harm (suicide): U03, X60-X84, Y87.0 Malignant neoplasm (cancer): C00-C97 Motor vehicle accident: V01-V79 Unintentional injury (accident): V01-X59, Y85-Y86

Notes
Data SuppressionSuppression is used to avoid misinterpretation when rates are unstable. Data is suppressed when the total number of cases is less than 10 (for each county/cause of death/population group) over the time period monitored. Rates should be considered unreliable when calculated with a numerator (number of cases) less than 20.
Trends Over TimeTrends over time are produced using single-year mortality data from the CDC WONDER query system. Use caution when comparing single-year mortality rates with 5-year aggregate mortality rates. Trend data is available for states and for the total US; county-level data is not provided due to data suppression / low numerator counts.
Race and EthnicityRace and ethnicity (Hispanic origin) are collected as two separate categories by state vital statistics registries based on methods established by the U.S. Office of Management and Budget (OMB) in 1997. All mortality statistics from the CDC WONDER databases are available by race alone (White, Black, Amer. Indian/AK Native, and Asian) ethnicity alone (Hispanic, Non-Hispanic), or by combined race and ethnicity. Data is reported here in combination, and thus may be subject to higher suppression than if reported separately.
Mortality - Unintentional Injury
Data Background
The Division of Vital Statistics is a branch of the Centers for Disease Control and Prevention (CDC) National Center for Health Statistics (NCHS) responsible for maintaining birth and death records for the nation. Data are compiled for the National Vital Statistics System (NVSS) through a joint effort between the NCHS and various state and local health agencies, who are responsible for registering vital events – births, deaths, marriages, divorces, and fetal deaths. NVSS statistics are released annually in various data warehouses, including CDC WONDER , VitalStats, and the Health Indicator Warehouse .
CDC WONDER, developed by the Centers for Disease Control and Prevention (CDC), is an integrated information and communication system for public health. Its purposes are:
To promote information-driven decision making by placing timely, useful facts in the hands of public health practitioners and researchers, and
To provide the general public with access to specific and detailed information from CDC.
CDC WONDER provides:
Access statistical research data published by CDC, as well as reference materials, reports and guidelines on health-related topics; The ability to query numeric datasets on CDC's computers, via "fill-in-the blank" web pages. Public-use data sets about mortality
(deaths), cancer incidence, HIV and AIDS, tuberculosis, vaccinations, natality (births), census data and many other topics are available for query, and the requested data are readily summarized and analyzed, with dynamically calculated statistics, charts and maps.

CDC WONDER data can be obtained grouped by various information, including state, county, gender, race, ethnicity, and educational attainment. For more information, please visit the CDC WONDER website.
MethodologyCounty population figures and death statistics are acquired using CDC WONDER from the Underlying Cause of Death database. Conditions were queried for years 2006-2010 based on a selection of codes from the International Classification of Diseases (ICD), Version 10. The ICD-10 is the current global health information standard for mortality and morbidity statistics. The ICD has been maintained by the World Health Organization since its conception in 1948. A searchable, detailed list of current ICD-10 Codes (Version 2010) is available from the World Health Organization.
Mortality rates were acquired from the source age-adjusted to the year 2000 U.S. standard. To recalculate age-adjusted mortality rates for unique service areas and aggregated county groupings, the following formula was used:
Mortality Rate = [SUM(Total Population) * ((Age-Adjusted Rate)/100,000)] / [SUM(Total Population)] * 100,000.
The specific codes used for reported mortality indicators are listed below.
Assault (homicide): U01-U02, X85-Y09, Y87.1 Cerebrovascular disease (stroke): I60-I69 Coronary (ischaemic) heart disease:I20-I25 Chronic lower respiratory disease: J40-J47 Heart disease: I00–I09, I11, I13, I20–I51 Intentional self-harm (suicide): U03, X60-X84, Y87.0 Malignant neoplasm (cancer): C00-C97 Motor vehicle accident: V01-V79 Unintentional injury (accident): V01-X59, Y85-Y86
Notes
Data SuppressionSuppression is used to avoid misinterpretation when rates are unstable. Data is suppressed when the total number of cases is less than 10 (for each county/cause of death/population group) over the time period monitored. Rates should be considered unreliable when calculated with a numerator (number of cases) less than 20.
Trends Over TimeTrends over time are produced using single-year mortality data from the CDC WONDER query system. Use caution when comparing single-year mortality rates with 5-year aggregate mortality rates. Trend data is available for states and for the total US; county-level data is not provided due to data suppression / low numerator counts.

Race and EthnicityRace and ethnicity (Hispanic origin) are collected as two separate categories by state vital statistics registries based on methods established by the U.S. Office of Management and Budget (OMB) in 1997. All mortality statistics from the CDC WONDER databases are available by race alone (White, Black, Amer. Indian/AK Native, and Asian) ethnicity alone (Hispanic, Non-Hispanic), or by combined race and ethnicity. Data is reported here in combination, and thus may be subject to higher suppression than if reported separately.
Mortality - Pedestrian Accident
Data Background
The Fatality Analysis Reporting System (FARS) data is a census of all police-reported qualifying fatal crashes that occur within the 50 States, the District of Columbia, and Puerto Rico. To be included in the file set, a crash must involve a motor vehicle traveling on a traffic way customarily open to the public, and must result in the death of a motorist or a non-motorist within 30 days of the crash. Police report data is collected by National Highway Traffic Safety Administration (NHTSA) analysts located in each state. There is no Federal mandate for crash reporting; however, on a voluntary basis most States collect a similar core set of information about fatal crashes. Incompatible data is recoded for inclusion in the FARS database.
More information is available in the NHTSA’s Crash Data Collection Programs report to congress, and online at the Fatality Analysis Reporting System website.
MethodologyCrash-related data was acquired using the Fatality Analysis Reporting System (FARS) web-based query tool. Fatalities for non-vehicle occupants (pedestrians) were aggregated by county for years 2008-2010 to obtain a total fatality count. Pedestrian death figures do not include fatalities to bicyclists or persons on personal conveyances (scooters, skateboards). Three years of data were averaged to produce an annual fatality figure for each county ([Total Deaths] / 3 ). Population data was acquired from the U.S. Census Bureau's 2010 decennial census. Motor-vehicle mortality rates are reported as the average annual fatalities per 100,000 population using the following formula:
Mortality Rate = [Average Annual Deaths] / [Total Population] * 100,000.
Original motor vehicle crash data may be accessed using the FARS query tool.
Mortality - Homicide
Data Background
The Division of Vital Statistics is a branch of the Centers for Disease Control and Prevention (CDC) National Center for Health Statistics (NCHS) responsible for maintaining birth and death records for the nation. Data are compiled for the National Vital Statistics System (NVSS) through a joint effort between the NCHS and various state and local health agencies, who are responsible for registering vital events – births, deaths, marriages, divorces, and fetal deaths. NVSS statistics are released annually in various data warehouses, including CDC WONDER , VitalStats, and the Health Indicator Warehouse .
CDC WONDER, developed by the Centers for Disease Control and Prevention (CDC), is an integrated information and communication system for public health. Its purposes are:

To promote information-driven decision making by placing timely, useful facts in the hands of public health practitioners and researchers, and
To provide the general public with access to specific and detailed information from CDC.
CDC WONDER provides:
Access statistical research data published by CDC, as well as reference materials, reports and guidelines on health-related topics; The ability to query numeric datasets on CDC's computers, via "fill-in-the blank" web pages. Public-use data sets about mortality
(deaths), cancer incidence, HIV and AIDS, tuberculosis, vaccinations, natality (births), census data and many other topics are available for query, and the requested data are readily summarized and analyzed, with dynamically calculated statistics, charts and maps.
CDC WONDER data can be obtained grouped by various information, including state, county, gender, race, ethnicity, and educational attainment. For more information, please visit the CDC WONDER website.
MethodologyCounty population figures and death statistics are acquired using CDC WONDER from the Underlying Cause of Death database. Conditions were queried for years 2006-2010 based on a selection of codes from the International Classification of Diseases (ICD), Version 10. The ICD-10 is the current global health information standard for mortality and morbidity statistics. The ICD has been maintained by the World Health Organization since its conception in 1948. A searchable, detailed list of current ICD-10 Codes (Version 2010) is available from the World Health Organization.
Mortality rates were acquired from the source age-adjusted to the year 2000 U.S. standard. To recalculate age-adjusted mortality rates for unique service areas and aggregated county groupings, the following formula was used:
Mortality Rate = [SUM(Total Population) * ((Age-Adjusted Rate)/100,000)] / [SUM(Total Population)] * 100,000.
The specific codes used for reported mortality indicators are listed below.
Assault (homicide): U01-U02, X85-Y09, Y87.1 Cerebrovascular disease (stroke): I60-I69 Coronary (ischaemic) heart disease:I20-I25 Chronic lower respiratory disease: J40-J47 Heart disease: I00–I09, I11, I13, I20–I51 Intentional self-harm (suicide): U03, X60-X84, Y87.0 Malignant neoplasm (cancer): C00-C97 Motor vehicle accident: V01-V79 Unintentional injury (accident): V01-X59, Y85-Y86

Notes
Data SuppressionSuppression is used to avoid misinterpretation when rates are unstable. Data is suppressed when the total number of cases is less than 10 (for each county/cause of death/population group) over the time period monitored. Rates should be considered unreliable when calculated with a numerator (number of cases) less than 20.
Trends Over TimeTrends over time are produced using single-year mortality data from the CDC WONDER query system. Use caution when comparing single-year mortality rates with 5-year aggregate mortality rates. Trend data is available for states and for the total US; county-level data is not provided due to data suppression / low numerator counts.
Race and EthnicityRace and ethnicity (Hispanic origin) are collected as two separate categories by state vital statistics registries based on methods established by the U.S. Office of Management and Budget (OMB) in 1997. All mortality statistics from the CDC WONDER databases are available by race alone (White, Black, Amer. Indian/AK Native, and Asian) ethnicity alone (Hispanic, Non-Hispanic), or by combined race and ethnicity. Data is reported here in combination, and thus may be subject to higher suppression than if reported separately.
Mortality - Suicide
Data Background
The Division of Vital Statistics is a branch of the Centers for Disease Control and Prevention (CDC) National Center for Health Statistics (NCHS) responsible for maintaining birth and death records for the nation. Data are compiled for the National Vital Statistics System (NVSS) through a joint effort between the NCHS and various state and local health agencies, who are responsible for registering vital events – births, deaths, marriages, divorces, and fetal deaths. NVSS statistics are released annually in various data warehouses, including CDC WONDER , VitalStats, and the Health Indicator Warehouse .
CDC WONDER, developed by the Centers for Disease Control and Prevention (CDC), is an integrated information and communication system for public health. Its purposes are:
To promote information-driven decision making by placing timely, useful facts in the hands of public health practitioners and researchers, and
To provide the general public with access to specific and detailed information from CDC.
CDC WONDER provides:
Access statistical research data published by CDC, as well as reference materials, reports and guidelines on health-related topics; The ability to query numeric datasets on CDC's computers, via "fill-in-the blank" web pages. Public-use data sets about mortality
(deaths), cancer incidence, HIV and AIDS, tuberculosis, vaccinations, natality (births), census data and many other topics are available for query, and the requested data are readily summarized and analyzed, with dynamically calculated statistics, charts and maps.

CDC WONDER data can be obtained grouped by various information, including state, county, gender, race, ethnicity, and educational attainment. For more information, please visit the CDC WONDER website.
MethodologyCounty population figures and death statistics are acquired using CDC WONDER from the Underlying Cause of Death database. Conditions were queried for years 2006-2010 based on a selection of codes from the International Classification of Diseases (ICD), Version 10. The ICD-10 is the current global health information standard for mortality and morbidity statistics. The ICD has been maintained by the World Health Organization since its conception in 1948. A searchable, detailed list of current ICD-10 Codes (Version 2010) is available from the World Health Organization.
Mortality rates were acquired from the source age-adjusted to the year 2000 U.S. standard. To recalculate age-adjusted mortality rates for unique service areas and aggregated county groupings, the following formula was used:
Mortality Rate = [SUM(Total Population) * ((Age-Adjusted Rate)/100,000)] / [SUM(Total Population)] * 100,000.
The specific codes used for reported mortality indicators are listed below.
Assault (homicide): U01-U02, X85-Y09, Y87.1 Cerebrovascular disease (stroke): I60-I69 Coronary (ischaemic) heart disease:I20-I25 Chronic lower respiratory disease: J40-J47 Heart disease: I00–I09, I11, I13, I20–I51 Intentional self-harm (suicide): U03, X60-X84, Y87.0 Malignant neoplasm (cancer): C00-C97 Motor vehicle accident: V01-V79 Unintentional injury (accident): V01-X59, Y85-Y86
Notes
Data SuppressionSuppression is used to avoid misinterpretation when rates are unstable. Data is suppressed when the total number of cases is less than 10 (for each county/cause of death/population group) over the time period monitored. Rates should be considered unreliable when calculated with a numerator (number of cases) less than 20.
Trends Over TimeTrends over time are produced using single-year mortality data from the CDC WONDER query system. Use caution when comparing single-year mortality rates with 5-year aggregate mortality rates. Trend data is available for states and for the total US; county-level data is not provided due to data suppression / low numerator counts.

Race and EthnicityRace and ethnicity (Hispanic origin) are collected as two separate categories by state vital statistics registries based on methods established by the U.S. Office of Management and Budget (OMB) in 1997. All mortality statistics from the CDC WONDER databases are available by race alone (White, Black, Amer. Indian/AK Native, and Asian) ethnicity alone (Hispanic, Non-Hispanic), or by combined race and ethnicity. Data is reported here in combination, and thus may be subject to higher suppression than if reported separately.
Infant Mortality
Data Background
The Division of Vital Statistics is a branch of the Centers for Disease Control and Prevention (CDC) National Center for Health Statistics (NCHS) responsible for maintaining birth and death records for the nation. Data are compiled for the National Vital Statistics System (NVSS) through a joint effort between the NCHS and various state and local health agencies, who are responsible for registering vital events – births, deaths, marriages, divorces, and fetal deaths. NVSS statistics are released annually in various data warehouses, including CDC WONDER , VitalStats, and the Health Indicator Warehouse .
CDC WONDER, developed by the Centers for Disease Control and Prevention (CDC), is an integrated information and communication system for public health. Its purposes are:
To promote information-driven decision making by placing timely, useful facts in the hands of public health practitioners and researchers, and
To provide the general public with access to specific and detailed information from CDC.
CDC WONDER provides:
Access statistical research data published by CDC, as well as reference materials, reports and guidelines on health-related topics; The ability to query numeric datasets on CDC's computers, via "fill-in-the blank" web pages. Public-use data sets about mortality
(deaths), cancer incidence, HIV and AIDS, tuberculosis, vaccinations, natality (births), census data and many other topics are available for query, and the requested data are readily summarized and analyzed, with dynamically calculated statistics, charts and maps.
CDC WONDER data can be obtained grouped by various information, including state, county, gender, race, ethnicity, and educational attainment. For more information, please visit the CDC WONDER website.
MethodologyTotal births and infant mortality rates are 5-year averages acquired from the 2012 Health Resources and Services Administration (HRSA) Area Resource File (ARF). Total infant deaths are back-calculated based on these figures. Mortality rates represent the number of deaths to infants under age 1 per 1,000 total live births, based on the following formula:
Rate = [Total Deaths Under Age 1] / [Total Births] * 1,000
The ARF documentation states the following about the infant mortality data:

The NCHS Mortality Data were obtained from the National Center for Health Statistics Detail Mortality data files, as compiled from data provided by the 57 vital statistics jurisdictions through the Vital Statistics Cooperative Program. The number of infant deaths for a county are based on place of residence; non residents of the US are excluded. Averages are provided rather than actual data for each year because of data use restrictions required by NCHS beginning with 1989 data.
For additional information, please review the documentation for the HRSA ARF, available for download here.
Notes
Race and EthnicityRace and ethnicity (Hispanic origin) are collected as two separate categories by state departments of health based on methods established by the U.S. Office of Management and Budget (OMB) in 1997. Data reported from the CDC is available by combined race and ethnicity, and is reported here only for state and national data summaries. County level statistics by race and ethnicity are not provided for this indicator due to sample size limitations. Detailed race/ethnicity data may be available from a local source.
Data SuppressionSuppression is used to avoid misinterpretation when rates are unstable. Data is suppressed when there are fewer than 10 cases in the numerator (for each county / population group combination) over the report period.
Report prepared by Community Commons, April 01, 2015.