digital.csic.esdigital.csic.es/bitstream/10261/64596/1/56-2011.docx · web viewit has been reported...
TRANSCRIPT
Post-print of: Catal Lett (2011) 141:1037–1046
High-Stable Mesoporous Ni-Ce/Clay Catalysts for Syngas Production
Carlos Enrique Daza (1, 4) , Oscar A. Gamba (1), Yesid Hernández (2), Miguel A. Centeno (2), Fanor Mondragón (3), Sonia Moreno (1) and Rafael Molina (1)
(1) Estado Sólido y Catálisis Ambiental. Departamento de Química, Facultad de Ciencias, Universidad Nacional de Colombia, AK 30 No. 45-03, Bogotá, Colombia
(2) Instituto de Ciencia de Materiales de Sevilla, Centro Mixto CSIC-Universidad de Sevilla, Avda. Américo Vespucio 49, 41092 Sevilla, Spain
(3) Química de Recursos Energéticos y Medio Ambiente, Universidad de Antioquia, Cra. 53 61-30, Medellín, Colombia
(4) Present address: Departamento de Química, Pontificia Universidad Javeriana, Cra. 7 No. 43-82, Bogotá, Colombia
Abstract
A mesoporous-type catalytic support was synthesized through the modification of a smectite with polyvinyl alcohol (PVA) and microwaves. Texture and micro-morphology of the support was determined. Several techniques were employed in order to describe the chemical environment of active species on the surface. Ni0 particle sizes were dependent on the structural site of reducible species. High stable Ni-Ce catalysts (calcined at 800 °C) were evaluated in the CO2 reforming of methane reaction at 700 °C (WHSV = 96 L g−1 h−1, without dilution gas and pre-reduction). The catalysts have presented CH4 conversions between 40 and 65%, CO2 conversion between 35 and 65% and H2/CO ratios between 0.2 and 0.4.
Keywords
Delamination, Clay mineral, Syngas, Reforming
1 Introduction
For several decades modified clay minerals have been used as functional materials in catalytic reactions as supports and/or catalysts, not only for their low cost and high availability but also because of their particular physicochemical properties. The final textural and morphological properties of the material can be modified by choosing and changing different synthesis parameters as the nature of the mineral and the modifying species, the particle size, heat treatment, among others [1–8].

Clay modification allows obtaining nanocomposites with open and rigid structures through the modification of the interlayer space of the structure. Specifically, the micro-structural morphology of modified clays is a matter of vital importance in the textural properties of the material. The modification process of clay minerals can be oriented to generate a face to face-type layered ordering as in the case of pillared clays or edge to face or edge to face type aggregates in associations known as delaminated clays [9–11].
The interest in delaminated clays lies in that these materials present meso- and macro-porosity, which extends their catalytic and adsorbent applications with high selectivity of shape for species and molecules of great size. The wide distribution of pore sizes that the delaminated structures have helps the disposition of well dispersed and distributed active phases on the surface [12–15]. However, microstructural and spectroscopic characterization of these nanomaterials is not widely described in literature.
Delamination methods are usually of the mechanical type [16–19]; these methods help the breaking down of grain and the exfoliation of the mineral. In the specific case of the exposure to microwaves the fragmentation of crystalline aggregates of greater size can be promoted and the increase of the diffusion of cationic species to the interlayer space of the mineral can be favored. The exposure to great microwave powers can cause the dispersion of layer due to the diminution of the size of the aggregates [4].
The use of non-ionic surfactants allows the modulation of the porosity of modified clay minerals by means of methods in which the size of pore is controlled by the organic molecule [9]. It has been reported that depending on the nature of clay and polymer and the method of synthesis, the making up of the surfactants and the structure of clay minerals can be achieved in different ways [9, 14, 20, 21].
Some authors have reported the use of modified clay minerals with different types of surfactants as mesoporous catalytic supports in CO2 reforming of methane which presented excellent results [22, 23]. There was a relationship between the catalytic activity and the mesoporous area of the support indicating that an increase is showed when the area is greater.
We have reported the use of a delaminated natural smectite using PVA and microwaves as Ni and Ce support for the production of syngas through the dry reforming of methane [24, 25]. Catalysts with several Ce compositions and calcined at 500 and 800 °C were tested in catalytic experiments at 30 L g−1 h−1 varying the temperature and using diluent gas. Also, the catalysts calcined at 800 °C were tested at 700 °C and 60 L g−1 h−1 for 100 h using diluent gas. The Ce-promoted catalysts showed very high performance in syngas production without considerable level of deactivation. Characterization of these catalysts by X-ray diffraction (XRD) and temperature programmed reduction (H2-TPR) was previously obtained.
However, some conclusions about the porous nature of the support and the type of reducible Ni species in the catalysts needed stronger spectroscopic evidence in order to confirm the hypotheses in the published papers. Valuable and complementary non-

reported information about the morphological, micro-structural, textural and chemical characteristics of the delaminated support and the catalysts are presented and discussed in this work.
In this paper, we also want to report, the interesting result of catalytic testing using a very high spatial velocity (96 L g−1 h−1) with the same reported catalysts calcined at 800 °C. In this case, no diluent gas and no reduction treatment (before not reported in this catalytic system) were used which is so important at an industrial level.
2 Experimental Part
2.1 Synthesis of the Support
A delaminated-type smectite support was synthesized like reported elsewhere [24, 25]. A pillared clay synthesized by traditional Al-method and calcined at 500 °C was used for comparison [1–8, 24, 25].
2.2 Synthesis of the Catalysts
The catalysts were synthesized by wet impregnation of delaminated-type support using Ni(NO3)2·6H2O and Ce(NO3)3·6H2O as precursors. The solids were calcined at 800 °C for 4 h (10 °C min−1). Catalysts with 10% wt. of Ni and 0, 3 and 10% wt. of Ce were obtained which were called XCeDC, where X corresponds to the nominal load of Ce.
2.3 Characterization
The N2-sorptometry analyses were performed in an ASAP 2010 MICROMERITICS equipment at 77 K with previous degassing of the sample at 150 °C for 4 h. The BET Model (0.02 ≤ P/P0 ≤ 0.12 for type I isotherms and 0.05 ≤ P/P0 ≤ 0.35 for type IV isotherms) were used for determining the superficial areas. The microporous areas and volumes were determined from t curves using the De Boer’s method (in the range of statistical thickness of 3.5 Å ≤ t≤ 5.0 Å). The BJH method was employed for the pore distribution determination.
The scanning electron micrographs (SEM) were taken using a FEI-QUANTA 200 equipment. The transmission electron micrographs (TEM) were taken with a PHILIPS CM200 microscope operated at 200 kV. Both instruments were equipped with an electron dispersive spectroscopy (EDS) nano-sonde.
X-ray photoelectron spectroscopy (XPS) was carried out in a PHYSYCAL ELECTRONICS MODEL 5600ci spectrometer equipped with a hemispheric analyzer and multi-channel detector. Polychromatic radiation from the Al-Standard (350 W, 15.0 kV) source was used for the high-resolution analysis. All reported binding energies were corrected using the C1s signal in 284.5 eV as internal standard. The acquisition and the processing of data were carried out with the Multipak 6.0 Software. The elemental molar fractions were calculated from the normalized areas after the
subtraction of the baseline, using sensibility and transmission factors given by the instrument. Bulk composition was obtained by Inductively Couple Plasma Spectroscopy (ICPS) with a TJA IRIS 1000 Radial ICP-AES equipment.
Coke after reaction was quantified by thermogravimetric analysis (TGA). A TA-INSTRUMENTS 2950 equipment with a precision of ±0.001 mg was used. The tests were carried out under air atmosphere at 100 mL min−1 and 10 °C min−1.
Apparent activation energies in Ni reduction were determined by the Kissinger’s method cited by Jankovic et al. [26]. Several Temperature-Programmed Reduction profiles (TPR) varying the rates of temperature (β) were performed and maximum temperatures of reduction (Tmax) were determined. From a plot of ln(β/T2max) versus 1/Tmax and fitting to a straight line, the apparent activation energy Ea can be calculated from the intercept and slope, respectively, according to following expression (Eq. 1):
Lnβ/T2=lnAR/Ea−Ea/RTmax
2.4 Catalytic ExperimentsThe Ni-Ce catalysts supported on the delaminated clay were tested in the CO2 reforming of methane reaction. The catalytic experiments were carried out in a fixed bed quartz reactor (6 mm of diameter) at 700 °C using 50 mg of the solid in powder (150 μm). The reactor was fed with a 40/40 CH4/CO2 mixture with a total flow of 80 mL min−1 without diluent gas (96 L g−1 h−1). The temperature was raised at the rate of 10 °C min−1 in He flow and the reacting agents were injected at 700 °C. The catalyst was not pre-reduced. The exit gases were quantified with a quadrupole mass spectrometer (ThermoONIX) connected on line. The quantity of H2O steam was determined using a cold trap to the exit of gases [27].3 Results and Discussion3.1 Characterization of the Delaminated-Type SupportFigure 1a shows the N2 adsorption isotherms for the delaminated-type support and the starting and pillared clay for comparison. The porosity generation in the delaminated and pillared solids, and the subsequent improvement in the adsorption capacity of solids, is verified in the adsorption volumes which are considerably greater than those obtained with the starting clay. The isotherms for each one of the solids are clearly different indicating different pores structures for each material. The starting clay presents a II-type isotherm which is typical of solids with low porosity. The delaminated clay shows a IV-type isotherm that is typical of mesoporous materials while the pillared clay shows a I-type isothermal that is characteristic of microporous solids [18, 28, 29].
Table 1 shows the textural parameters of the solids that were calculated using different methods. The modified solids show an increase in the superficial areas with regards to the starting mineral given the micro-morphology that generates a new pore structure.
The values of these areas are very similar for both solids; nevertheless, the superficial area for the pillared clay is determined, in greater proportion, by the microporous area (~90%) whereas for the delaminated clay the area corresponds predominantly to the area of mesoporous (~74%). The foregoing is confirmed with the distributions of pore size (see Fig. 1b) calculated by the BJH method, which indicate the pore formation of greater size in the mesoporous region for the delaminated solid compared with the pillared one. In the case of the delaminated-type support, we can see a multimodal distribution indicating the heterogeneity of the pore sizes in this material.
The grain morphology of the pillared and delaminated solids was assessed by SEM (see Fig. 2). The materials are made up of grains with flake-type morphology. Although there are no flat aggregates (that suggest face to face organizations), many primary aggregates seem to be formed by sheet groups which are compacted well. In the case of the delaminated-type support (see Fig. 2c), it is possible to see greater exfoliation and superficial erosion of the grains and lesser sizes of aggregates. It is probable that the edge to face associations within the same aggregate (typical of delaminated structures) encourage the breaking of morphological heterogeneous particles. In the same way, the surfactant can avoid the cohesion and growth of primary particles that, in spite of sintering during the calcination process, are smaller than in the case of the pillared solid [9].
The microstructure morphology of the solids was evaluated by TEM (see Fig. 3). Figure 3a shows face to face type layered morphology in bi-dimensional extensions that are typical of pillared structures. On the contrary, it is possible to see for delaminated-type support (see Fig. 3b), edge to edge and face to edge type structural organizations (House of Cards) due to formation of meso- and macro-pores) [9, 13, 16].
In order to know the textural stability of delaminated-type support, the delaminated material was calcined at several temperatures. Table 1 shows the textural parameters of the delaminated mineral calcined at 700 and 800 °C. The calcination at higher temperatures causes a decrease in the SBET of 15% at 700 °C and of 26% at 800 °C which can be the product of closing some pores by thermal effects and/or the partial sintering of primary aggregates of the material. However, the decrease in the texture characteristics typical of the thermal treatment are not considerable and do not represent great deteriorations of the solid for which the it can be described as a material with relative high thermal stability [24, 25].
3.2 Characterization of Active Species Supported on Delaminated-type Clay
Surface characterization of catalysts was performed by XPS spectroscopy. The Ni2p3/2 spectra show binding energies from 855.4 to 855.8 eV and satellite at ~861 eV, and the Ni2p1/2 spectra at 873 eV and satellite at ~879–880 eV. Ni is formed mainly as Ni2+ but the values of the binding energies are higher than those reported for NiO which suggests that the NiO species have strong interactions with the surface. The Ce3d5/2 spectra indicate that the Ce is found mainly as Ce4+ as determined by the presence of the satellite at ~916 eV (see Fig. 4).
There is a positive shift in the Ni binding energies of the main peaks of the promoted catalysts suggesting that the Ce modifies the electronic structure of Ni indicating that there is a strong interaction between Ni and Ce which may explain the promoting effect of Ce. Yang et al. [30] have indicated that oxygen vacancies in CeO2 formed in reducing environments can release electrons that migrate from the CeO2 through Ni-CeO2 interface increasing the electron density of Ni. So that, the electronic character of Ni inhibits the migration of electrons from C–H σ-bond in CH4 molecule to the Ni atom which reduces the cracking of methane tendency. The atomic ratios (see Table 2) indicate that the Ni and Ce are located mainly in the surface of the catalytic support given the higher molar ratios on the surface compared to bulk.
The particle sizes of Ni0 and CeO2 were determined by the XRD Scherrer method after the reduction of the catalyst at 700 °C (1 h/pure H2). The values determined for Ni0 (Table 2) are between 13 and 14 nm which are between the values reported for similar systems [22, 23]. In the case of the CeO2 sizes between 10 and 21 nm were determined, which are greater when the content of Ce is increased. It was possible to establish, that the Ce does not probably affect the particle size of Ni0 due to the fact that the interactions of the NiO with the support are stronger than the NiO-CeO2 interactions which is in agreement with XPS results.
In previous papers, we reported the characterization of the “under study” catalysts using the H2-TPR technique; based on the profiles, we suggested the existence of two types of Ni-species in the pores of support, the first type of species was included in the internal porosity of the layers of the support which gives high stability and makes the reduction process occurred at high temperatures between 820–850 °C. The second type of species was related to species with lower interactions because of its location on the outside of the layered aggregates [24, 25]. The activation energies of these two species were determinate in this research, 92 ± 5 kJ mol−1 was obtained for the first one and 170 kJ mol−1 for the second one. Clearly, the chemical environment of Ni is very different for both species.
In this paper, we proposed the use of TEM in order to relate the structural locations that were raised from H2-TPR with possible differences in Ni0 particle sizes; we believed that in those places where there are more interactions with surface, the particle size is probably lower. Different micrographs of reduced 3CeDC catalyst were taken (see Fig. 5) try to find locations with apparent morphological differences in the support surface; actually, we have found several sites where Ni0-particle sizes are different. In Fig. 5a, for example, large layered-packed crystals were observed, while in Fig. 5b the edge of a particle that shows a thin and slim appearance from the top view of an apparent interlayer spacing was observed. The determination of particle sizes in the case of Fig. 5a clearly indicated the existence of particles with sizes greater than in the case of the micrograph Fig. 5b.

This result makes us raise the particles located in the internal porosity of the support are smaller than those located abroad. If this hypothesis is true, the H2-TPR offers an indirect tool to determine the particle size distribution in this type of solids.
It has been widely reported that the selectivity of the catalyst in dry reforming of methane is particle size dependent and that coke is formed mainly in the larger particles [22, 23]. We believe that the formation of coke on Ni/delaminated clay catalysts mainly happens at the surface external of material and that the reforming reaction mainly occurs in the internal porosity of the catalyst, coke growth will not generate breaking pores.
3.3 Performance in dry reforming of methane
Figure 6 shows the CH4 (Fig. 6a) and CO2 conversion curves (Fig. 6b) according to the time of the Ni-Ce catalysts supported on the mesoporous clay. The catalytic experiments were carried out without dilution gas which represents a benefit considering the scaling up of the process at industrial level.
In the curves, is possible to see that in the first moments of the reaction (first hour), the conversion gradually increases until it reaches a stationary state which is due to the reduction in situ of the catalyst that takes place due to the presence of gases like CH4, H2 and CO. That behavior is more evident in the CH4 conversion curves (Fig. 6a). During the reaction, the decomposition of the CH4 in the NiO particle forms H2 and CHX-coke deposits the latter being the one that reduces the metal. It has been proposed that if the formation of CHX species is encouraged in regards with its gasification through the active oxygen species formed by the dissociation of CO2, the coke formation will be predominant and the catalyst will be quickly deactivated [24, 25].
The conversion curves showed a beneficial effect of Ce in the catalytic activity of the materials which is evident due to the great conversions of both, the CH4 as well as the CO2 of the promoted catalysts. For the catalyst 0CeDC the conversions of CH4 oscillated between the 30 and 45%, whereas for CO2 the conversions were between 30 and 40%. The catalyst 3CeDC showed a slight increase in the conversion of both, CH4 as of CO2 with a percentage between 30 and 50%. Finally, the 10CeDC catalyst presented the greatest conversions which were found around 60% for both reacting agents.
Ni catalysts supported on modified clays with surfactants have been evaluated in the reaction of CO2 reforming of methane using an equimolar mixture of the reacting agents and without dilution gas (18 L g−1 h−1) with previous reduction of the catalyst at 500 °C for 3 h. The authors reported conversions in the first hours of the reaction between 85 and 95% of CH4 and CO2 at 750 °C using Ni catalysts (9% wt.) supported on laponites modified with ZrO2 [22]. Ni catalysts (5% wt.) supported on laponites modified with Al2O3 with conversions between 80 and 95% at 800 °C were reported [23]. Ni catalysts (5% wt.) supported on clays modified by means of different synthesis techniques using PVA and polythene oxide with initial conversions between 50 and

80% were reported [31]. The results set out in the present work are lower than ones reported in literature and similar in some cases. However, WHSV are higher and the reaction temperature is lower than those used in the above mentioned reports.
It is possible to see that under the used conditions the catalyst did not show deactivation levels during the evaluated time. On the other hand, we were able to see of a qualitative way the generation in excess of steam (formed by means of the Reverse Water Gas-Shift reaction) and the low production of light hydrocarbon (ethane, ethylene and propane) which could form due to the polymerization of the CH4 [32]. Ce-promoted catalyst formed lower quantities of steam than no-promoted catalyst (see Table 2).
Table 2 shows the H2/CO ratio of the catalysts which present particularly low values if the stoichiometry of the reaction is considered. The hydrogen consumption due to the in situ reaction of the catalyst during the first hours of reaction, the formation of excess of steam (see Table 2) and the gasification of the coke can explain the enrichment in CO of the obtained output mixture [32].
Table 2 shows the particle sizes of Ni0 and CeO2 calculated by XRD which, compared with the values before the reaction, do not evidence sintering. The foregoing statement indicates that in the obtained catalytic support, the active and promotional species have strong interactions that slow down processes of particle agglomeration which is of great importance in the stability of this type of materials.
The amount of coke formed in each catalyst after 400 min of reaction was quantified by means of TGA in air atmosphere (see Table 2). The catalysts promoted with Ce (3CeDC and 10CeDC) present lower levels of coke formation than the OCeDC catalyst. Nevertheless, an increase in the amount of promoter did not mean a proportional decrease of the amount of coke formed. Thus, the catalyst with 3% wt. of Ce showed no coke formation whereas the 10CeDC catalyst showed 33% wt. of coke. That result indicates that the size of particle of the promoter, which is smaller in the case of the 3CeDC catalyst, has a remarkable effect in the properties of the Ce regarding the formation of coke deposits in the catalyst [24, 25].
It has been reported that the next reactions (Eq. 2 and 3) have participation in the coke elimination using Ce-promoted catalyst [33, 34]:
Ce2O3+CO2→2CeO2+CO (2)
2CeO2+C(coke)→Ce2O3+CO2 (3)
During the reforming process, the reactant CO first absorbs base centers, and then dissociates on Ce2O3 by transferring electrons to CO, and forms CO and CeO2 (Eq. 1). Then, CeO2 reacts with carbon deposited by CH4 dehydrogenation, and CeO2 changes to Ce2O3 again (Eq. 2). When the CeO2 promoter in Ni-catalyst was reduced in situ, oxides Ce2O3 and CeO2 might exist generating oxygen vacancies in fluorite structure. It has been pointed out that the Ce, thanks to its storage and oxygen transport properties through the anionic vacancies formed by the partial reduction of the CeO2, encourages

the adsorption of CO2 and its transport towards the metal-support interface facilitating the gasification of the formed CHX species which results in a net decrease of the formed coke (Table 2) [33, 34].
SEM technique was used to evaluate the formation of coke on the spent catalyst. Fig. 7 shows that the formation of carbon filaments is abundant on the crystalline packings. The micrograph does not show that the filaments penetrate the layered-packing and destroy crystalline pores. Nor is the growth of coke filaments observed in grain dislocations breaking the cohesion of the particles and destroying the grain morphology. This suggests that coke is formed mainly on the outer surface of the particle and not in the interior of the pores which reinforces the hypothesis presented above.
4 Conclusions
A delaminated clay-type functional material was synthesized by means of the modification of a natural mineral clay with PVA and microwaves radiation. The material is made up by house of cards-type layered micro-organizations typical of delaminated conformations that are mostly mesoporous. Ni0 particle sizes were dependent of the structural site of reducible species. The solid can be used to support Ni and Ce, and to obtain high stable catalysts in the reaction of CO2 reforming of methane. The catalysts showed CH4 conversions between 40 and 65% and CO2 between 35 and 65% and H2/CO ratio between 0.2 and 0.4 at 700 °C using a 40/40 CH4/CO2 feed at 96 L g−1 h−1. In these catalysts, Ce showed a beneficial effect in the activity and in the decrease of coke formation during the reaction. The catalyst with 10% wt. of Ni and 3% wt. of Ce presented no coke formation at all.
Acknowledgments
C.E. Daza thanks to COLCIENCIAS for his doctorate scholarship. W. Y. Hernandez thanks to ALBAN program for his doctorate scholarship. The authors thank to project No 201010011587 DIB Universidad Nacional de Colombia and Professor Carlos R. Cabrera at Puerto Rico University for XPS measurements.
References
1. Campos A, Gagea B, Moreno S, Jacobs P, Molina R (2008) Appl Catal A 345:112
2. Carriazo JG, Centeno MA, Odriozola JA, Moreno S, Molina R (2007) Appl Catal A 317:120
3. Carriazo JG, Martínez LM, Odriozola JA, Moreno S, Molina R, Centeno MA (2007) Appl Catal B 72:157
4. Olaya A, Moreno S, Molina R (2009) Appl Catal A 370:7
5. Sanabria NR, Ávila P, Yates M, Rasmussen SB, Molina R, Moreno S (2010) Appl Clay Sci 47:283
6. Pérez A, Centeno MA, Odriozola JA, Molina R, Moreno S (2008) Catal Today 133–135:526
7. Carriazo JG, Molina R, Moreno S (2008) Appl Catal A 334:168
8. Sanabria NR, Centeno MA, Molina R, Moreno S (2009) Appl Catal A 356:243
9. Alexandre M, Dubois P (2000) Mater Sci Eng Rep 28:1
10. Vaccari A (1998) Catal Today 41:53
11. Vaccari A (1999) Appl Clay Sci 14:161
12. De Paiva LB, Morales AR, Valenzuela FR (2008) Appl Clay Sci 42:8
13. Chmielarz L, Gil B, Kuśtrowski P, Piwowarska Z, Dudek B, Michalik M (2009) J Solid State Chem 182:1094
14. Pavlidou S, Papaspyrides CD (2008) Prog Polym Sci 33:1119
15. Yuan P, Annabi-Bergaya F, Tao Q, Fan M, Liu Z, Zhu J, He H, Chen T (2008) J Colloid Interface Sci 324:142
16. Martínez MJ, Fetter G, Domínguez JM, Melo-Banda JA, Ramos-Gómez R (2003) Microporous Mesoporous Mater 58:73
17. Sivakumar S, Damodaran AD, Warrier KGK (1995) Ceram Int 21:85
18. Vicente I, Salagre P, Cesteros Y, Guirado F, Medina F, Sueiras J (2009) Appl Clay Sci 43:103
19. Mei JG, Yu SM, Cheng J (2004) Catal Commun 58:437
20. Alexandre M, Dubois P, Sun T, Garces JM, Jérôme R (2002) Polymer 43:2123
21. Nikkhah SJ, Ramazani SA, Baniasadi H, Tavakolzadeh F (2009) Mater Des 30:2309

22. Hao Z, Zhu HY, Lu GQ (2003) Appl Catal A 242:275
23. Hwang KS, Zhu HY, Lu GQ (2001) Catal Today 68:183
24. Daza C, Kiennemann A, Moreno S, Molina R (2009) Energy Fuels 23:3497
25. Daza C, Kiennemann A, Moreno S, Molina R (2009) Appl Catal A 364:65
26. Jankovic B, Adnadevic B, Mentus S (2008) Chem Eng Sci 63:567
27. Daza C, Gallego J, Moreno JA, Mondragón F, Moreno S, Molina R (2008) Catal Today 133–135:357
28. Gandia LM, Vicente MA, Gil A, Rodriguez F, Unger K (2002) Stud Surf Sci Catal 144:585
29. Gil A, Vicente MA, Gandía LM (2000) Microporous Mesoporous Mater 34:115
30. Yang Y, Li W, Xu H (2002) React Kinet Catal Lett 77:155
31. Wang S, Zhu HY, Lu GQ (1998) J Colloid Interface Sci 204:128
32. Rostrup-Nielsen JR (1993) Catal Today 18:305
33. Kim D, Stöwe K, Müller F, Maier F (2007) J Catal 247:101
34. Xu G, Shi K, Gao Y, Xu H, Wei Y (1999) J Mol Catal A 147:47

Figure captions
Figure 1. N2 Adsorption: (a). Isotherms and (b). BJH pore size distribution
Figure 2. SEM images: (a) SC, (b) PC and (c) DC
Figure 3. TEM images: (a) PC and (b)DC. There is an enlargement on the right side of each image
Figure 4. High resolution XPS spectra for catalysts: (a) Ni2p zone and (b) Ce3d zone
Figure 5. TEM images of different zones of 3CeDC reduced catalyst. EDX was employed for Ni and CeO2 particles identification
Figure 6. Catalytic experiments (700 °C, 40/40 CH4/CO2 and 96 L g−1 h−1): (a) CH4 conversion and (b) CO2 conversion
Figure 7. SEM image of 3CeDC spent catalyst
Table 1
Table 1 Textural parameters of solids
ParameterStarting clay
Pillared clay
Delaminated clay
Delaminated (700 °C)
Delaminated (800 °C)
SBET (m2 g−1) 38 151 142 120 105Vmicropore
(m3 g−1)a 0.0046 0.037 0.0041 0.0039 0.0039
Smicropore
(m2 g−1)a 13 104 12 15 14
Vmesopore
(m3 g−1)b 0.0765 0.0624 0.206 0.187 0.198
Smesopore
(m2 g−1)c 25 45 127 105 91
aValues calculated from the t curves (De Boer Method)bCalculated at P/P0 = 0,96cSmesopore = SBET − Smicropore

Table 2
Table 2 Characterization of catalysts before and after reactionResult 0CeDC 3CeDC 10CeDCCe/Nia – 0.089 (0.125) 0.115 (0.393)Ce/Ala – 0.639 (0.589) 0.765 (0.705)Ni/Ala 0.934 (0.705) 0.987 (0.706) 0.850 (0.710)BET area (m2 g−1) 84 83 72Smesopore (m2 g−1) 74 71 62d Ni0 (nm) 14 14 13d CeO2 (nm) – 10 21d Ni0 (nm)b 16 16 15d CeO2 (nm)b – 6 18Coke (g(gNih)−1)c 0.110 0.000 0.087H2O (g(gNih)−1) 0.5256 0.4315 0.4135H2/COd 0.25 0.20 0.20aXPS atomic ratios. Bulk atomic ratios in parenthesisbAfter ReactioncDetermined by TGAdAverage values

Figure 1

Figure 2
Figure 3

Figure 4
Figure 5
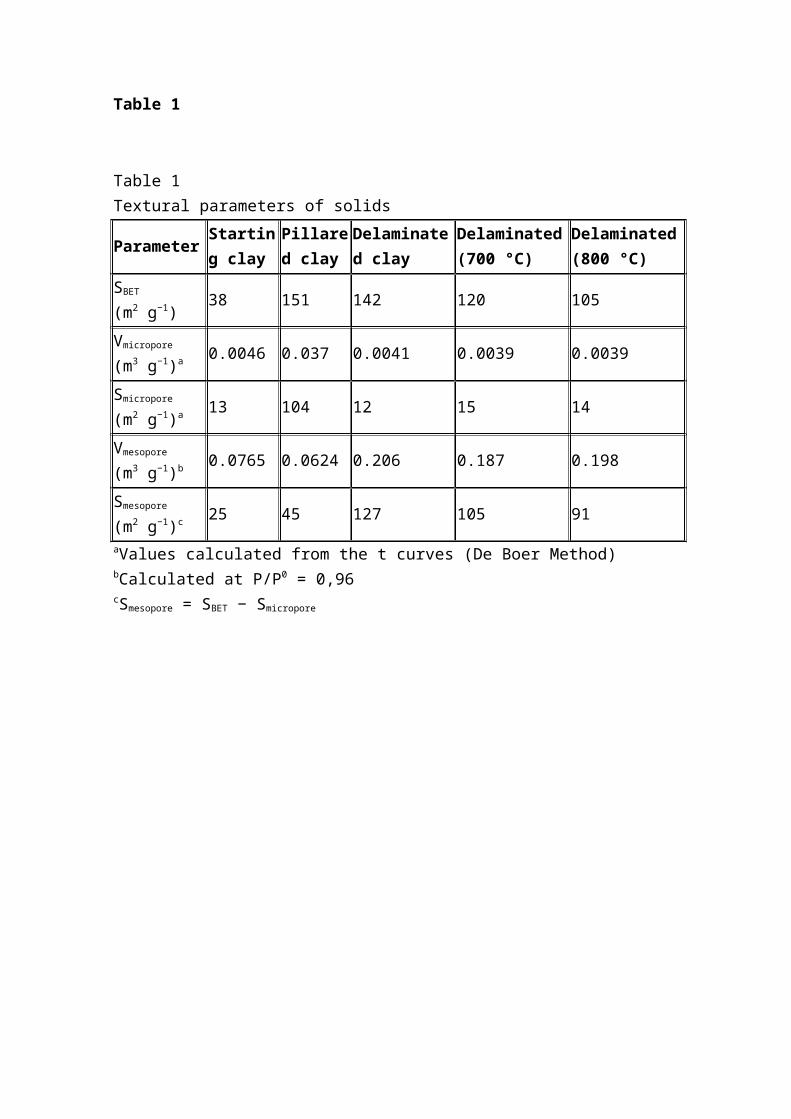
Figure 6
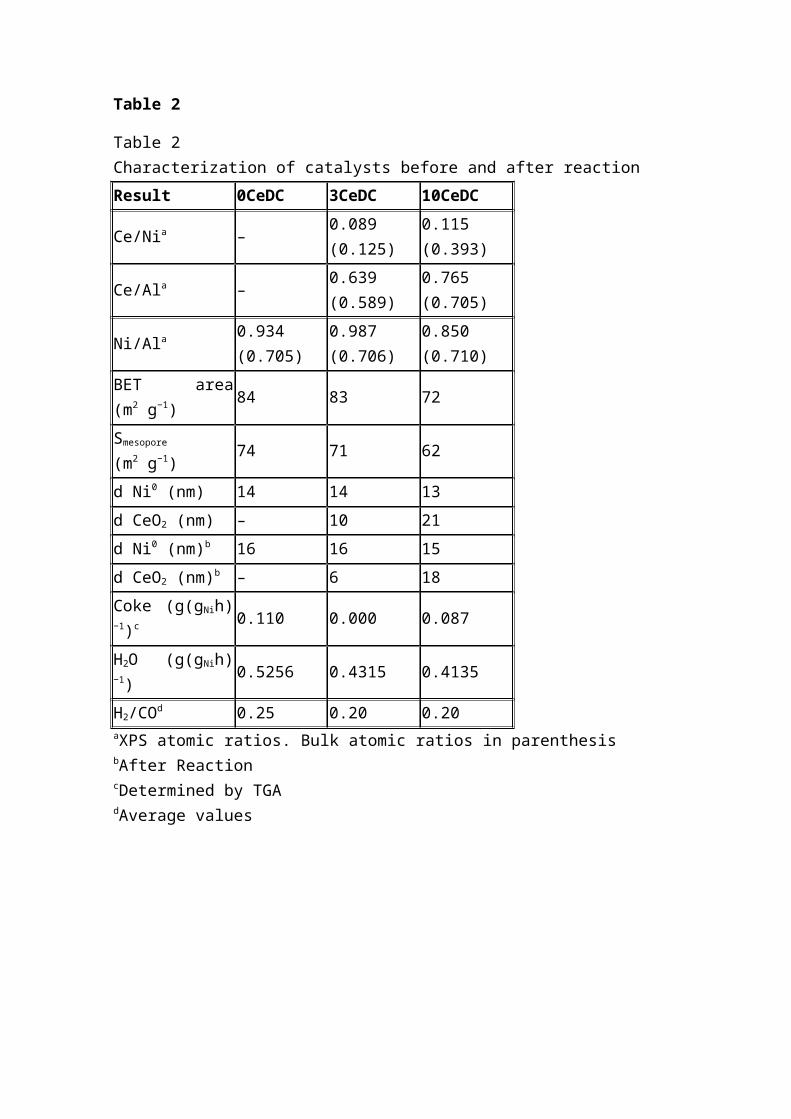
Figure 7