doa estimation in car for abnormal sound...
TRANSCRIPT
DOA estimation in car for abnormal sound localisation
Guan, L, Gu, F, Fazenda, BM, Ball, A, Yichun, Y and Pengxiao, T
Title DOA estimation in car for abnormal sound localisation
Authors Guan, L, Gu, F, Fazenda, BM, Ball, A, Yichun, Y and Pengxiao, T
Type Conference or Workshop Item
URL This version is available at: http://usir.salford.ac.uk/9437/
Published Date 2009
USIR is a digital collection of the research output of the University of Salford. Where copyright permits, full text material held in the repository is made freely available online and can be read, downloaded and copied for noncommercial private study or research purposes. Please check the manuscript for any further copyright restrictions.
For more information, including our policy and submission procedure, pleasecontact the Repository Team at: [email protected].
DOA Estimation in Car for Abnormal Sound Localisation
Guan Luyang1,a, Gu Fengshou1,b, Bruno Fazenda1,c, Andrew Ball1,d,
Yang Yichun2,e, Teng Pengxiao2,f 1Diagnostic Engineering Research Group, University of Huddersfield, UK
2Institute of Acoustics, Chinese Academy of Sciences, P.R. China
[email protected], [email protected], [email protected], [email protected], [email protected], [email protected]
Keywords: DOA estimation, VAD, fault localization
Abstract. Spurious noise in car cabinet can be not only annoying bust also indicative of some
potential faults. A small square microphone array with 4 sensors was adopted in this paper to
localize the sound source in car for fault diagnosis. A new voice activity detection (VAD) algorithm
was proposed for the typical discontinuous short-time noise in car due to some fault and applied to
direction of arrival (DOA) estimation as a pre-processing stage. Four different time delay estimation
methods were compared based on the measurements from a typical passenger. Experimental results
illustrate that the VAD algorithm is crucial to achieve robust fault localization performance and the
generalized cross-correlation method with phase transform weighting function is an appropriate
fault localizer in car.
1. Introduction
Some special noise (rattles, squeaks, etc) in car cabinets are often the forewarning or representations
of some faults. In fault diagnosis, one of the key issues is to localize the fault which emits the
annoying noise. Microphone array diagnostics is an appropriate selection to search for such sound
source.
In this paper, a small microphone array with 4 sensors was applied to estimate the direction of
the sound source in the car. Generalized cross-correlation (GCC) based time delay estimation
methods were compared to select a good direction of arrival (DOA) estimator for an acoustically
reflective environment such as a car cabinet [1, 2]. According to the characteristics of the target
sound, a new VAD algorithm was proposed and applied to DOA estimation to obtain robust DOA
performance for the non-stationary sound source.
2. �ew VAD Method for DOA Estimation
2.1 Characteristics of squeak noise
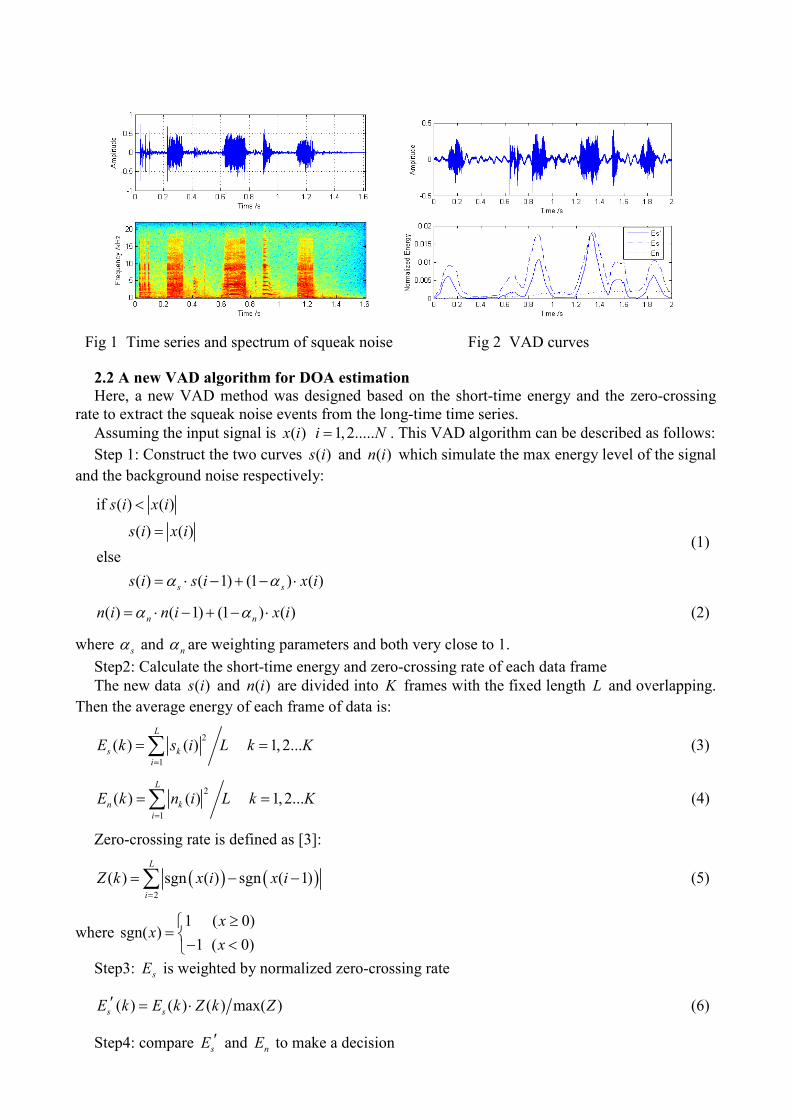
Fig. 1 shows a typical squeak noise in car. Obviously, it is discontinuous, not periodical and just of
very short duration. Its spectrum shows that it’s wide-band sound, so the microphone array with
small aperture can be adapted. However, signal content analysed during a very short time, for
example about 0.1s, can be regarded as approximately stationary.
In DOA estimation, if the discontinuous sound source was treated just as the stationary sound
(white noise, etc), the performance will be interfered greatly during the silent pauses when signal-
to-noise ratio (SNR) is very low. Therefore, in a similar fashion to speech recognition applications,
VAD is indispensable to achieve better performance.
2.2 A new VAD algorithm for DOA estimation
Here, a new VAD method was designed based on the short-time energy and the zero-crossing
rate to extract the squeak noise events from the long-time time series.
Assuming the input signal is ( )x i 1,2.....i �= . This VAD algorithm can be described as follows:
Step 1: Construct the two curves ( )s i and ( )n i which simulate the max energy level of the signal
and the background noise respectively:
if ( ) ( )
( ) ( )
else
( ) ( 1) (1 ) ( )s s
s i x i
s i x i
s i s i x iα α
<
=
= ⋅ − + − ⋅
(1)
( ) ( 1) (1 ) ( )n nn i n i x iα α= ⋅ − + − ⋅ (2)
where sα and nα are weighting parameters and both very close to 1.
Step2: Calculate the short-time energy and zero-crossing rate of each data frame
The new data ( )s i and ( )n i are divided into K frames with the fixed length L and overlapping.
Then the average energy of each frame of data is:
2
1
( ) ( ) 1, 2...L
s k
i
E k s i L k K=
= =∑ (3)
2
1
( ) ( ) 1,2...L
n k
i
E k n i L k K=
= =∑ (4)
Zero-crossing rate is defined as [3]:
( ) ( )2
( ) sgn ( ) sgn ( 1)L
i
Z k x i x i=
= − −∑ (5)
where 1 ( 0)
sgn( )1 ( 0)
xx
x
≥=
− <
Step3: sE is weighted by normalized zero-crossing rate
( ) ( ) ( ) max( )s sE k E k Z k Z′ = ⋅ (6)
Step4: compare sE′ and nE to make a decision
Fig 1 Time series and spectrum of squeak noise Fig 2 VAD curves

if ( ) ( ), decision: actives nE k E k′ > (7)
Fig. 2 shows the time domain signal and its VAD curves of the squeak noise. Obviously, the
weighted short-time energy sE ′ is more appropriate to distinguish the two close events, for
example, the two sound events occurred between 1.2-1.6s in Fig. 2.
Based on the results of VAD algorithm, DOA estimator works only when the target noise occurs
with high SNR. Therefore, not only the DOA estimation performance will be robust, but also the
post-processing of the DOA estimation results will become easier and simpler.
3 GCC based DOA estimation
In microphone array signal processing, time delay estimation (TDE) is one class of robust DOA
estimation methods and has been applied to many research and practical fields successfully. A GCC
based TDE method was adopted in this research.
GCC methods calculate the cross-correlation function xyR based on the cross power spectrum
density xyP of the two signals x and y :
( ) [ ( ) ( )] ( ) ( )xy xy xyR IFFT P W R wτ ω ω τ τ′= = ∗ (8)
The key of GCC methods is the selection of an appropriate weighting function ( )W ω . In the
work presented here, a white noise source was used to measure the performance of different
weighting functions to select the appropriate DOA estimator for fault localization in the car. Four
common weighting functions are described below:
3.1 The ROTH Processor (ROTH)
The Roth weighting function uses one of the signals’ power spectrum density (PSD) as an
approximation of the PSD of the original signal ( )s n to make the cross-correlation function
approach a pulse function.
1( )
( )xx
WP
ωω
= (9)
3.2 The Maximum-Likelihood Processor (ML)
ML processor, also named HT processor, is defined as:
2
2
( )1( )
( ) 1 ( )
xy
xy xy
WP
ρ ωω
ω ρ ω= ⋅
− (10)
where ( )xyρ ω is coherence function:
( )( )
( ) ( )
xy
xy
xx yy
P
P P
ωρ ω
ω ω= (11)
where ( )xxP ω and ( )yyP ω are PSD of the two signals respectively.
3.3 The Smoothed Coherence Transform (SCOT)
The definition of SCOT weighting function is as below:
1( )
( ) ( )xx yy
WP P
ωω ω
= (12)

where ( )xxP ω and ( )yyP ω are PSD of the two input signals respectively. SCOT function is the
most widely used weighting function.
3.4 The Phase Transform (PHAT)
PHAT weighting function is defined as the reciprocal of cross power spectrum density.
1( )
( )xy
WP
ωω
= (13)
For the input signals, it makes the weighted spectrum not sensitive to the source signal but the
channel response. It performs more consistently when the characteristics of the source signal change
over time and is more robust to reverberation than other cross-correlation based methods [1].
4 Experimental Results
4.1 Experiment setup
An experiment was carried out where the sound source was simulated by a speaker fixed at 8
different positions. At every position, the speaker played white noise and squeak noise respectively.
The squeak noise is the real acoustic signal recorded in the car.
A 4-sensor microphone array with a distance of about 0.18m between microphones was fixed in
the center of the car cabinet. Fig. 3 shows the relative positions of array, sound source in the car and
the definition of direction. θ is the direction of sound source we expect to obtain.
In the experiment, the sampling rate was set at 44.1 kHz. The incoming signal was high-pass
filtered and segmented into equal length frames of 0.128s and 50% overlapping. Source direction
estimation is based on each data frame.
Four GCC methods were adopted. According to the weighting functions described above, these
methods are labelled as GCC_ROTH, GCC_ML, GCC_SCOT and GCC_PHAT. Since the sound
source is fixed, the mean and standard deviation were calculated as the criterion for DOA
estimation performance.
4.2 DOA estimation performance for white noise source
Table 1 shows the DOA performance of the four methods for white noise source. It illustrates
that GCC based TDE methods can localize the stationary sound source effectively in the car which
is a reverberant environment.
Among these four methods, GCC_PHAT achieved the best performance. This result is in
consistent with the conclusion in [4].
Fig 3 Sketch of the experiment

4.3 DOA performance for squeak noise
When the SNR is high, it is almost immune to the reflective environment in the car. However, if
the sound is not continuous, such as the squeak noise shown in Fig. 1, the DOA estimation will be
influenced by noise when the sound source pauses. Then the performance descends greatly.
Fig. 4 shows that when the sound source pauses, the DOA estimations are not reliable, and many
results seem to be outliers. These outliers should be removed during post-processing; otherwise, the
performance will be influenced badly.
(a) (b)
(c) (d)
Fig 4 DOA estimation Performance of GCC_PHAT with or without VAD at different positions
(a: front; b: left; c: rear-left; d: rear)
GCC
ROTH
GCC
ML
GCC
SCOT
GCC
PHAT
Right 359.1 (3.16) 358.0 (1.64) 358.2 (0.41) 358.1 (0.02)
Front-right 69.7 (4.44) 70.3 (0.07) 70.3 (0.13) 70.3 (0.10)
Front 91.9 (0.05) 92.1 (0.04) 91.9 (0.05) 92.0 (0.01)
Front-left 122.2 (0.07) 122.1 (1.37) 122.3 (0.02) 122.3 (0.03)
Left 182.8 (0.15) 182.9 (0.06) 182.9 (0.02) 182.9 (0.04)
Rear-left 247.7 (0.05) 247.7 (0.04) 247.9 (0.01) 247.9 (0.01)
Rear 275.7 (0.42) 275.3 (0.29) 276.9 (0.71) 276.6 (0.50)
Rear-right 308.3 (1.74) 307.2 (0.05) 307.2 (0.03) 307.2 (0.03)
Table 1 DOA performance for white noise source

If VAD is adopted before DOA estimation, the system estimates the sound source’s position only
when the target sound occurs. With high SNR target sound signal, a more robust performance can
be achieved even without the post-processing stage.
Table 2 is the mean and standard deviation of DOA estimation results of GCC_PHAT with and
without VAD at different positions and the ‘desired direction’ column refers to the DOA result
using a continuous white noise source.
These results illustrate that if no VAD is applied, the outliers will induce large standard deviation
and degrade DOA performance obviously. When VAD is adopted, the smaller deviation and the
more accurate mean value of DOA results represent a more robust performance. Therefore, VAD is
crucial for discontinuous sound source localization.
5 Conclusions
The typical noises due to some faults in car cabinet are commonly discontinuous in time domain
and non-stationary in frequency domain. To localize the sound source accurately, a new VAD
method was proposed as a pre-processing method and applied to DOA estimation for fault
diagnosis. Experimental results show that GCC method with PHAT weighting function produces
reliable and robust localization in the reverberant car cabinet and VAD is crucial to achieve robust
DOA estimation performance.
Considering a variety of acoustic interferences may exist in practical application, localization of
sound sources with low SNR are now subject of future work by the authors.
References
[1] J. Chen, J. Benesty and Y. Huang. Time Delay Estimation in Room Acoustic Environments: An
overview. Journal on Applied Signal Processing. (2006), p. 1
[2] J. Chen, J. Benesty. Performance of GCC- and AMDF-Based Time-Delay Estimation in
Practical Reverberant Environments. Journal on Applied Signal Proceesing. Vol. 1, (2006), p.
25
[3] J.R. Jang, Audio Signal Processing and Recognition, Information on http://www.cs.nthu.edu.
tw/~jang
[4] J.M. Peterson, K. Chris. Analysis of Source Localization in Reverberant Environments. IEEE
Sensor Array and Multichannel Signal Processing. (2006), p. 672
Desired
Direction
GCC_PHAT
without VAD
GCC_PHAT
with VAD
Right 358.1 357.4 (23.78) 354.5 (5.76)
Front-right 70.3 96.4 (51.46) 73.5 (7.83)
Front 92.0 96.1 (23.66) 92.4 (0.71)
Front-left 122.3 122.4 (49.20)) 122.5 (2.38)
Left 182.9 180.8 (62.66) 182.1 (1.41)
Rear-left 247.9 223.3 (49.59) 247.4 (0.38)
Rear 276.6 230.5 (57.18) 274.7 (0.53)
Rear-right 307.2 263.2 (18.00) 307.4 (1.93)
Table 2 DOA performance for squeak noise source