do you cee? the internet and online advertising market in central and eastern europe
Post on 13-Sep-2014
4.628 views
DESCRIPTION
‘Do you CEE?’ report prepared by Gemius is the key publication for all industry experts in the region. Between 2010 and 2011 edition, International Marketing Director, Marta Klepka presents updated landscape of the internet in CEE. Which are the key countries for the industry in 2011? What kind of characteristic changes & reshuffles have been observed during the past year? What kind of knowledge base does a potential investor need not only to enter but also to conquer a new market? Use the set of internet best practices & business intelligence solutions to grow your business onlineTRANSCRIPT
Do You CEE? The internet and online advertising market in Central and Eastern Europe.
MARTA KLEPKA
Sofia, 26.10.2011
2 DO YOU CEE
The internet and online advertising market in Central and Eastern Europe
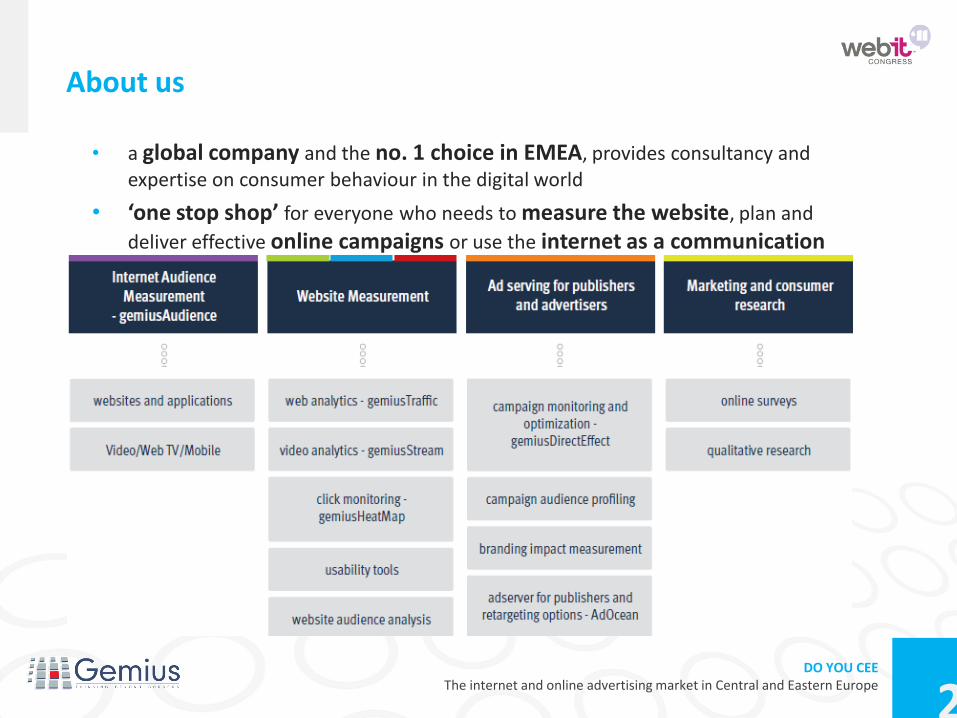
• a global company and the no. 1 choice in EMEA, provides consultancy and expertise on consumer behaviour in the digital world
• ‘one stop shop’ for everyone who needs to measure the website, plan and
deliver effective online campaigns or use the internet as a communication channel
About us
3 DO YOU CEE
The internet and online advertising market in Central and Eastern Europe
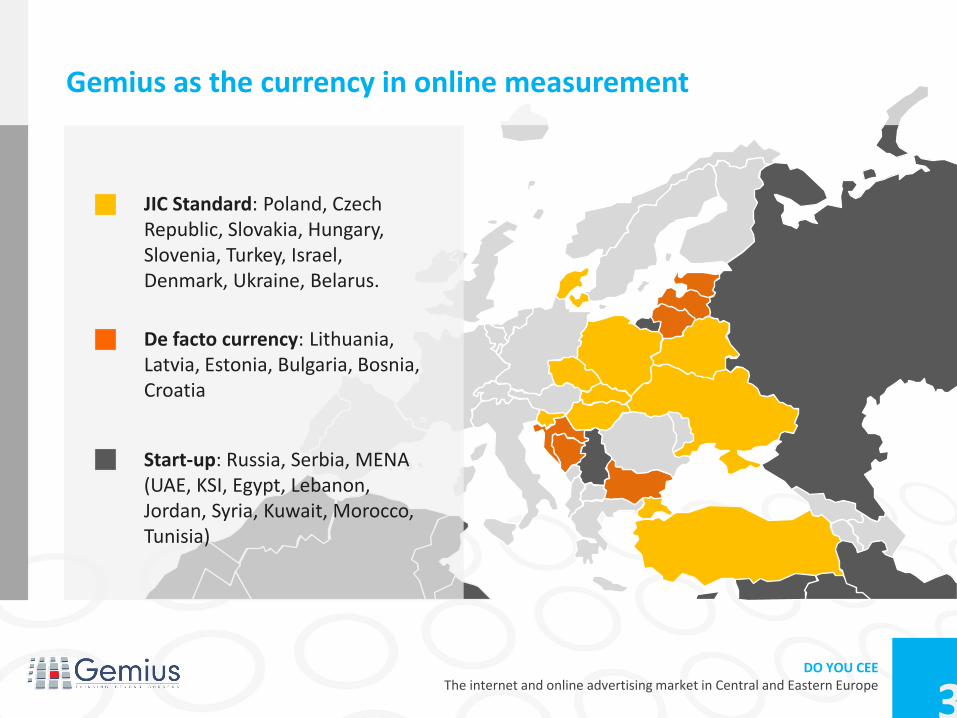
JIC Standard: Poland, Czech Republic, Slovakia, Hungary, Slovenia, Turkey, Israel, Denmark, Ukraine, Belarus.
De facto currency: Lithuania, Latvia, Estonia, Bulgaria, Bosnia, Croatia
Start-up: Russia, Serbia, MENA (UAE, KSI, Egypt, Lebanon, Jordan, Syria, Kuwait, Morocco, Tunisia)
Gemius as the currency in online measurement

4 DO YOU CEE
The internet and online advertising market in Central and Eastern Europe
Do You CEE? The internet and online advertising market in Central and Eastern Europe.

5 DO YOU CEE
The internet and online advertising market in Central and Eastern Europe
Size Potential Highlights
Adspends
Formats
Social
Mobile
Video
Size

6
Market size //
internet population in the CEE region (June 2011); source of data: Ukraine: gemiusAudience; Hungary: gemius/Ipsos Fusion Data; Latvia: gemiusAudience; Czech Republic: NetMonitor - SPIR - Mediaresearch & Gemius; Romania: Mercury Research; Slovakia: AIMmonitor - AIM – Mediaresearch & Gemius; Bulgaria: gemiusAudience (data collected using Synovate research);Poland: Megapanel PBI/Gemius; Slovenia:
gemusAudience; Turkey: IpsosKMG (data for July 2011); Russia: Gemius estimation based on FOM statistics/gemiusFusion Data; Estonia: gemiusAudience (data collected using TURU-UURINGUTE AS research); Lithuania: gemiusAudience; Croatia: Gemius/Valicon; Belarus: gemiusAudience; Romania: Euromonitor; Bosnia: gemiusAudience; Serbia: www.internetworldstats.com (June 2010) [age groups –
Lithuania, Poland: 7+; Czech Rep.: 10+; Croatia, Turkey: 12+; Estonia, Latvia,Hungary: 15+; Ukraine: 16+ Russia: 18+; Slovenia: 10-75; Slovakia: 14-79;Bosnia: 15-65; Bulgaria: 15-69; Belarus: 15-74]
INTERNET POPULATION (mm internet users / 2011)
The largest pure CEE
markets:
Russia (53.7 million internet users)
Poland (18.9 million internet users)
Turkey comes second in this ranking (24.5 million internet users)
0
10
20
30
40
50
60
Mill
ion
s
June 2010
June 2011
7
Market size //
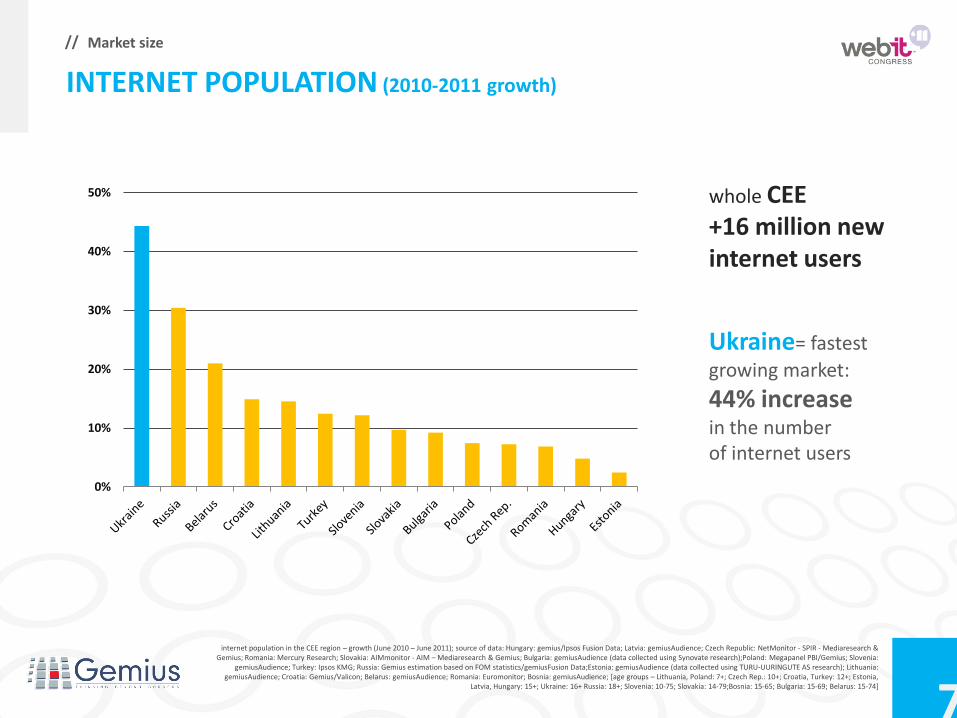
INTERNET POPULATION (2010-2011 growth)
whole CEE +16 million new internet users
Ukraine= fastest
growing market:
44% increase in the number of internet users
internet population in the CEE region – growth (June 2010 – June 2011); source of data: Hungary: gemius/Ipsos Fusion Data; Latvia: gemiusAudience; Czech Republic: NetMonitor - SPIR - Mediaresearch & Gemius; Romania: Mercury Research; Slovakia: AIMmonitor - AIM – Mediaresearch & Gemius; Bulgaria: gemiusAudience (data collected using Synovate research);Poland: Megapanel PBI/Gemius; Slovenia:
gemiusAudience; Turkey: Ipsos KMG; Russia: Gemius estimation based on FOM statistics/gemiusFusion Data;Estonia: gemiusAudience (data collected using TURU-UURINGUTE AS research); Lithuania: gemiusAudience; Croatia: Gemius/Valicon; Belarus: gemiusAudience; Romania: Euromonitor; Bosnia: gemiusAudience; [age groups – Lithuania, Poland: 7+; Czech Rep.: 10+; Croatia, Turkey: 12+; Estonia,
Latvia, Hungary: 15+; Ukraine: 16+ Russia: 18+; Slovenia: 10-75; Slovakia: 14-79;Bosnia: 15-65; Bulgaria: 15-69; Belarus: 15-74]
0%
10%
20%
30%
40%
50%
8
Market size //
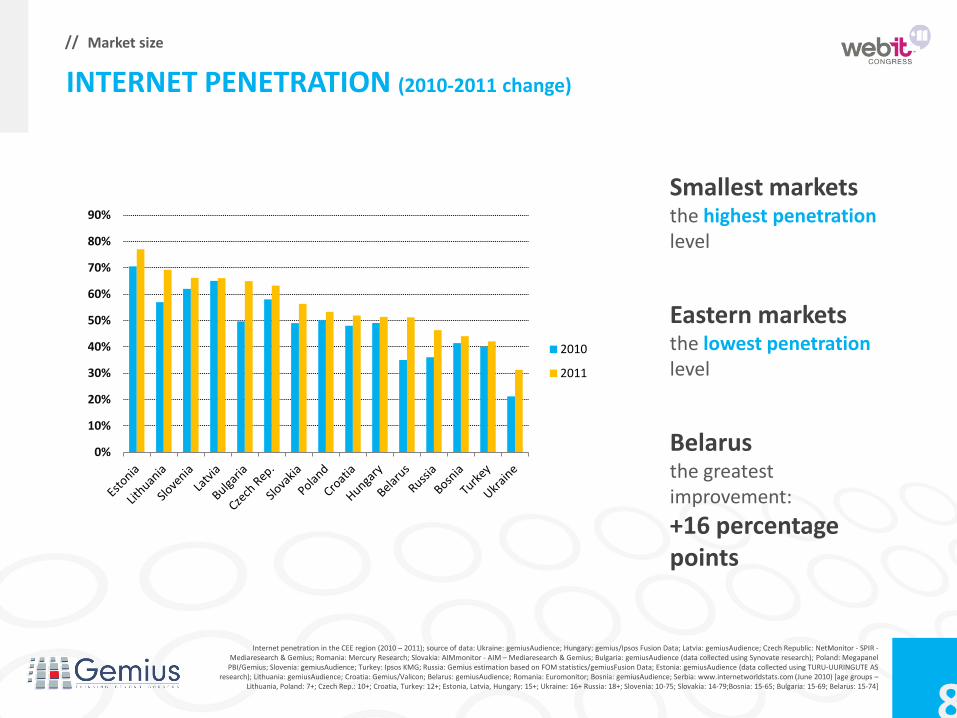
INTERNET PENETRATION (2010-2011 change)
Smallest markets the highest penetration level
Eastern markets the lowest penetration level
Belarus the greatest improvement:
+16 percentage points
Internet penetration in the CEE region (2010 – 2011); source of data: Ukraine: gemiusAudience; Hungary: gemius/Ipsos Fusion Data; Latvia: gemiusAudience; Czech Republic: NetMonitor - SPIR - Mediaresearch & Gemius; Romania: Mercury Research; Slovakia: AIMmonitor - AIM – Mediaresearch & Gemius; Bulgaria: gemiusAudience (data collected using Synovate research); Poland: Megapanel
PBI/Gemius; Slovenia: gemiusAudience; Turkey: Ipsos KMG; Russia: Gemius estimation based on FOM statistics/gemiusFusion Data; Estonia: gemiusAudience (data collected using TURU-UURINGUTE AS research); Lithuania: gemiusAudience; Croatia: Gemius/Valicon; Belarus: gemiusAudience; Romania: Euromonitor; Bosnia: gemiusAudience; Serbia: www.internetworldstats.com (June 2010) [age groups –
Lithuania, Poland: 7+; Czech Rep.: 10+; Croatia, Turkey: 12+; Estonia, Latvia, Hungary: 15+; Ukraine: 16+ Russia: 18+; Slovenia: 10-75; Slovakia: 14-79;Bosnia: 15-65; Bulgaria: 15-69; Belarus: 15-74]
0%
10%
20%
30%
40%
50%
60%
70%
80%
90%
2010
2011

9
Market size //
BROADBAND PENETRATION
Data source: Eurostat
0
5
10
15
20
25
30
35
40
45
Bro
db
and
co
nn
ect
ion
s p
er
10
0 in
hab
itan
ts
Broadband penetration 2010
Only a few CEE markets reach
the EU average when it comes to
broadband penetration.
Some CEE markets are still much worse in these terms than even the worst Western markets.
2009 2010
10 DO YOU CEE
The internet and online advertising market in Central and Eastern Europe
Size Potential
Adspends
Formats
$
Social
Mobile
Video
Potential
Adspends $
Highlights

11
Market potential //
ONLINE ADSPENDS (mm € / 2009-2010 change)
Russians, Poles and Czechs spend
the biggest amount of money on internet advertising
Slovakia opens
the group of small markets
Data source: online adpends in the CEE region (2009-2010); source of data: IAB Europe, TNS LT, SPIR, ZenithOptimedia, Gemius. All countries except for Ukraine, Belarus and Serbia: gross values
€ 0
€ 100
€ 200
€ 300
€ 400
€ 500
€ 600
€ 700
€ 800
Mill
ion
s
2009
2010
12
Market potential //
0
10
20
30
40
50
60
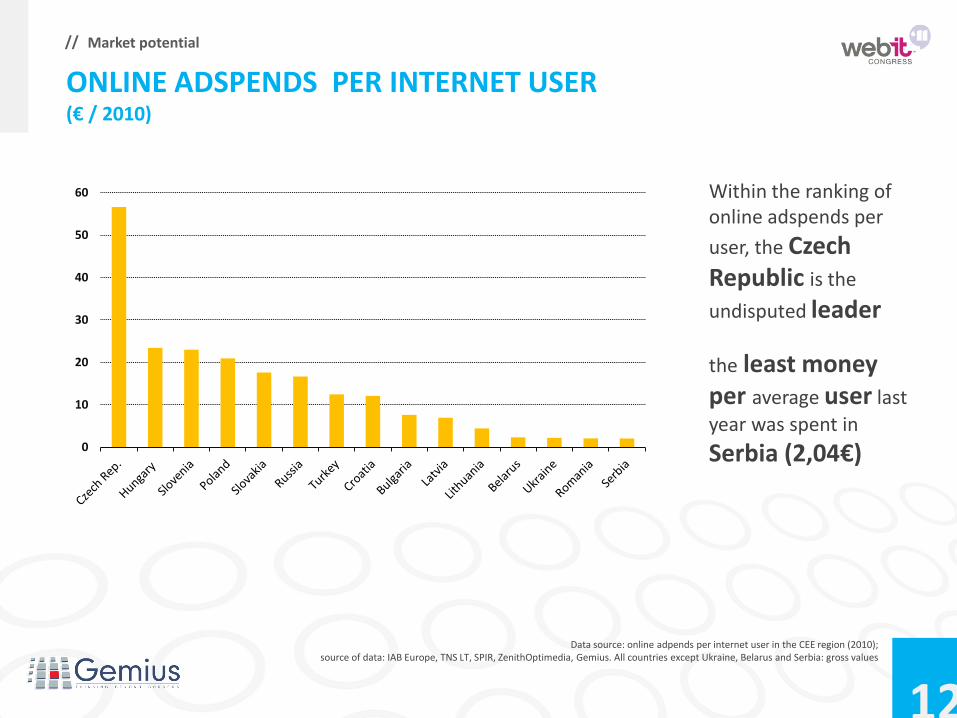
ONLINE ADSPENDS PER INTERNET USER (€ / 2010)
Within the ranking of online adspends per
user, the Czech Republic is the
undisputed leader
the least money per average user last
year was spent in
Serbia (2,04€)
Data source: online adpends per internet user in the CEE region (2010); source of data: IAB Europe, TNS LT, SPIR, ZenithOptimedia, Gemius. All countries except Ukraine, Belarus and Serbia: gross values

13
Market potential //
ONLINE AS SHARE OF TOTAL
Data source: ZenithOptimedia Group, AEF July 2011
The share of online in the total adspend in CEE countries is
much lower than in most countries of
Western Europe.
Still, it is comparable or higher than in the
Mediterranean markets, with Portugal serving the best example.
0%
5%
10%
15%
20%
25%
30%
35%

14 DO YOU CEE
The internet and online advertising market in Central and Eastern Europe
Size Potential
Adspends
Formats
$
Social
Mobile
Video
Potential
Formats
Highlights

15
Market potential //
Analysed Ads: Regular banners + rich media (Toplayer, Preroll, Expand, etc.) Source: gemiusDirectEffect 2011 H1
Share of campaigns using specific ad formats
53,0%
9,1%
7,4%
95,5%
6,9%
5,7%
2,0%
1,4%
88,1%
0,9%
0,6%
36,8%
13,0%
9,9%
6,2%
1,3%
0,7%
Regular Banners
Preroll
Expand
Regular Banners
Toplayer
Expand
Brandmark
Preroll
Regular Banners
Expand
Brandmark
Regular Banners
Preroll
Toplayer
Expand
Pop-up/Pop-under
Brandmark
Slo
vaki
a H
un
gary
C
zech
Rep
. P
ola
nd

16
Market potential //
Average CTR of specific ad formats
Analysed Ads: Regular banners + rich media (Toplayer, Preroll, Expand, etc.) Source: gemiusDirectEffect 2011 H1
0,28%
3,27%
1,52%
0,19%
4,20%
0,26%
2,31%
3,01%
0,20%
0,10%
1,16%
0,19%
1,54%
1,64%
0,50%
0,72%
0,82%
Regular Banners
Preroll
Expand
Regular Banners
Toplayer
Expand
Brandmark
Preroll
Regular Banners
Expand
Brandmark
Regular Banners
Preroll
Toplayer
Expand
Pop-up/Pop-under
Brandmark
Slo
vaki
a H
un
gary
C
zech
Rep
. P
ola
nd

17
Market potential //
Share of ad impressions by sector – Czech Rep.
gemiusAdMonitor
Source: gemiusDirectEffect 2011 H1
3 top industries are almost the same in all the measured countries: -Finance -Telecommunications - Automotive
-Only in Poland car industry was overtook by Entertainment/Trade and Personal Care/ Hygiene
29,2%
18,8%
10,8%
5,8%
5,6%
5,4%
4,9%
3,1%
2,3%
1,9%
1,5%
1,4%
1,2%
0,6%
0,1% 7,3%
Finance, Insurance, Brokerage Telecommunications Automotive Clothing & Accessories Travel, Tourism, Hotels & Restaurants Food Trade Personal Care and Hygiene Household Products Pharmaceuticals Beverages and Alcohol Household Equipment, Furniture And Decorations Computers and Audio Video Real Estate Leisure Time Other

18 DO YOU CEE
The internet and online advertising market in Central and Eastern Europe
Size Potential Highlights
Adspends
Formats
Social
Mobile
Video
Highlights
Video

19
Market highlights //
At present, the biggest part of the
current network traffic is video
And still growing! In Central and Eastern Europe, Internet video traffic will account for
47% of all consumer
Internet traffic in
2015, up from 27% in
2010.
Data source: Cisco VNI 2010
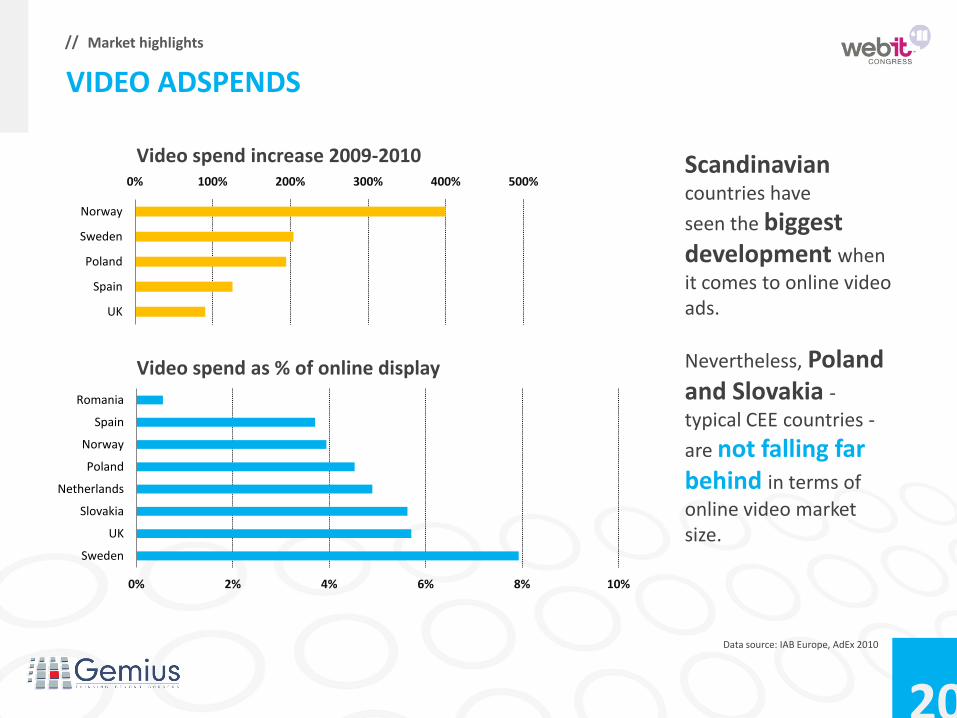
VIDEO ADSPENDS
20
Market highlights //
Scandinavian countries have
seen the biggest development when
it comes to online video ads.
Nevertheless, Poland and Slovakia - typical CEE countries -
are not falling far behind in terms of
online video market size.
Data source: IAB Europe, AdEx 2010
VIDEO ADSPENDS
0% 100% 200% 300% 400% 500%
Norway
Sweden
Poland
Spain
UK
Video spend increase 2009-2010
0% 2% 4% 6% 8% 10%
Sweden
UK
Slovakia
Netherlands
Poland
Norway
Spain
Romania
Video spend as % of online display

21 DO YOU CEE
The internet and online advertising market in Central and Eastern Europe
Size Potential Highlights
Adspends
Formats
Social
Mobile
Video
Highlights
Mobile
22
Market highlights //
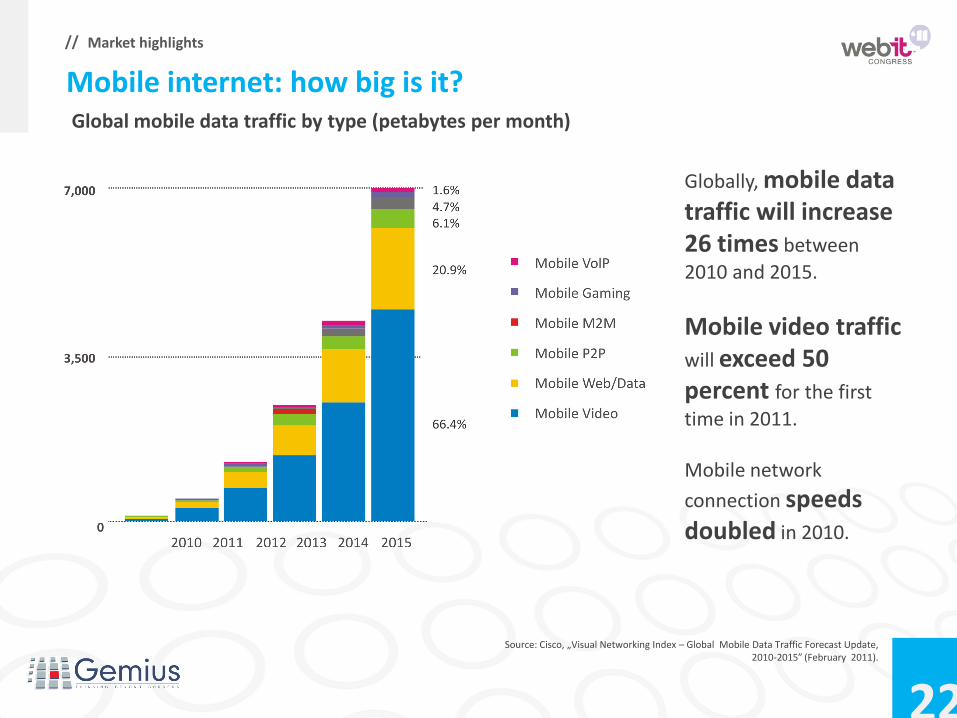
Globally, mobile data traffic will increase 26 times between
2010 and 2015.
Mobile video traffic will exceed 50 percent for the first
time in 2011. Mobile network
connection speeds doubled in 2010.
Source: Cisco, „Visual Networking Index – Global Mobile Data Traffic Forecast Update, 2010-2015” (February 2011).
Global mobile data traffic by type (petabytes per month)
Mobile internet: how big is it?

23
Market highlights //
CEE – share of page views generated by visitors using mobile devices and PC computers
Mobile internet: how big is it?
1,5% Hungary
Page views - mobile devices
2,10%
Czech Republic 4,16%
Slovakia 7,21
% Denmark
1,96%
Ukraine 0,7% Bulgaria
Source of data: Gemius, gemiusTraffic (August 2011).

24
Market highlights //
0
5 000
10 000
15 000
2009 2010 2011 2012
Mobile search advertising Mobile display advertisings Mobile message advertising
Source: eMarketer (March 2008).
Total mobile adspends (mm$)
2007 2,695
2008 4,586
2009 7,375
2010 11,179
2011 15,250
2012 19,149
Mobile internet advertising spending worldwide: which formats? 2007-2012 (in millions)

25
Market highlights //
Source: Gemius, gemiusTraffic: Czech Republic, Bulgaria, Slovakia, Slovenia, Hungary, Poland, Russia, Ukraine (26.09.2011– 02.10.2011).
CEE – top 5 mobile devices (models) by website-averaged percentage share of page views generated on websites monitored by Gemius
21.1% Apple iPad
13.9% Apple iPhone
2.6% 2.2% 1.9%
Sam
su
ng
GT
-i9000
(Ga
lax
y S
)
Sa
ms
un
g G
T-i
91
00
(G
ala
xy S
II)
Preferences of mobile internet users: devices
HT
C D
es
ire
26
Market highlights //
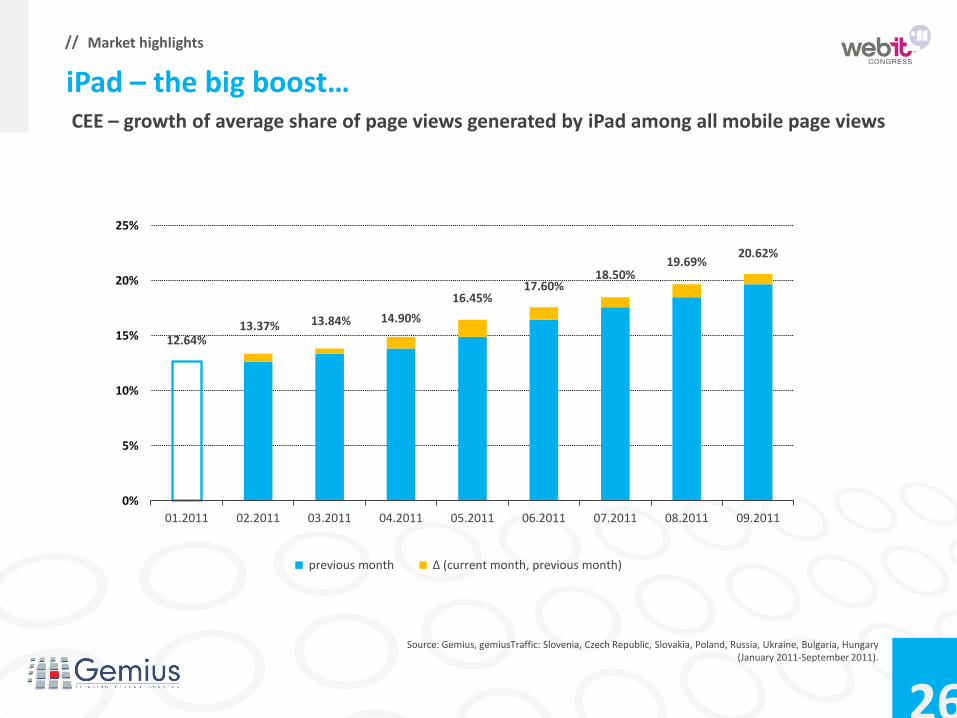
Source: Gemius, gemiusTraffic: Slovenia, Czech Republic, Slovakia, Poland, Russia, Ukraine, Bulgaria, Hungary (January 2011-September 2011).
) CEE – growth of average share of page views generated by iPad among all mobile page views
iPad – the big boost…
12.64% 13.37% 13.84% 14.90%
16.45% 17.60%
18.50% 19.69%
20.62%
0%
5%
10%
15%
20%
25%
01.2011 02.2011 03.2011 04.2011 05.2011 06.2011 07.2011 08.2011 09.2011
previous month ∆ (current month, previous month)

27
Market highlights //
The website-averaged percentage share of page views generated from iPad and iPhone on the selected markets
0%
5%
10%
15%
20%
25%
30%
35%
40%
Apple iPad, Q3 2011
Apple iPhone, Q3 2011
Source: Gemius, gemiusTraffic, Hungary, Denmark, Czech Republic, Bulgaria, Poland, Russia, Slovenia, Slovakia, Ukraine, Q3 2011.

28 DO YOU CEE
The internet and online advertising market in Central and Eastern Europe
Size Potential Highlights
Adspends
Formats
Social
Mobile
Video
Highlights
Social

29
Market highlights //
FACEBOOK USERS IN EUROPE (mm users / 2011)
Surprisingly, Turkey is Facebook’s biggest European market
Former East-block markets still have a growth potential for Facebook but local players remain strong.
Data source: www.socialbakers.com
0
5
10
15
20
25
30
35
April 2011
October 2011

30
Market highlights //
0
5
10
15
20
25
FACEBOOK USERS GROWTH IN THE LAST 6 MONTHS (%)
The Facebook’s pace of growth is
by far stronger in the east than in the west.
In Russia domestic social networks prevail.
Data source: www.socialbakers.com

31
Market highlights //
SOCIAL NETWORKS - Poland
The Polish giant, nk.pl, managed to
maintain a stable position for a year.
On the other hand,
Facebook is rapidly
gaining popularity – in a year it gained almost
50% users.
We will surely know the
winner in 2012.
Data source: Megapanel PBI/Gemius
0
2
4
6
8
10
12
14
Mill
ion
s R
U
Poland - clash of the social titans
nk.pl Group
facebook.com
32
Market highlights //
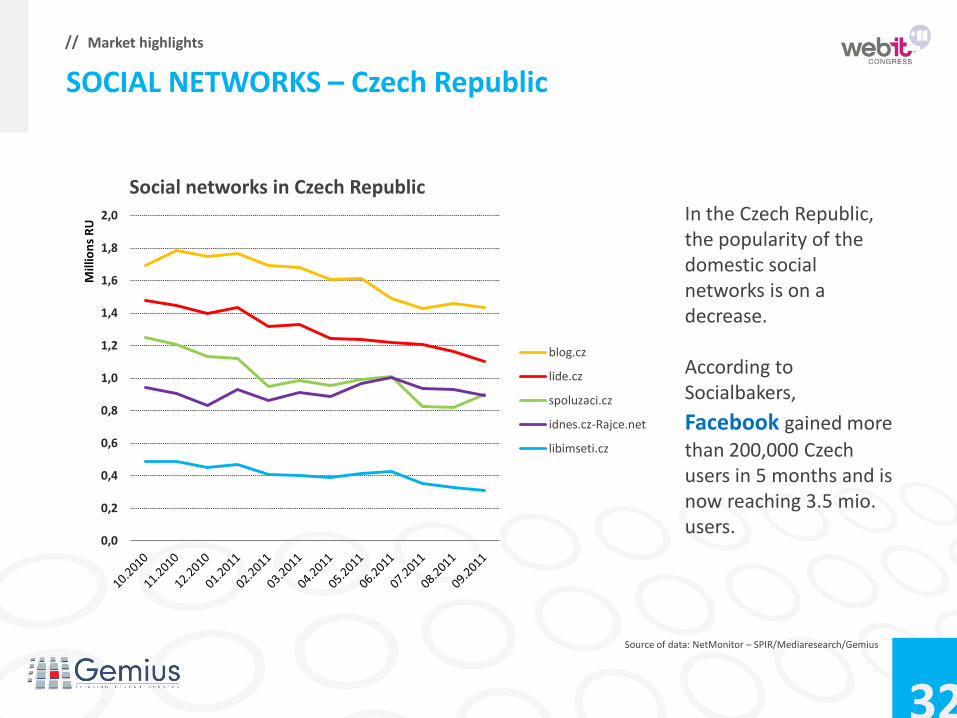
Source of data: NetMonitor – SPIR/Mediaresearch/Gemius
In the Czech Republic, the popularity of the domestic social networks is on a decrease. According to Socialbakers,
Facebook gained more
than 200,000 Czech users in 5 months and is now reaching 3.5 mio. users.
SOCIAL NETWORKS – Czech Republic
0,0
0,2
0,4
0,6
0,8
1,0
1,2
1,4
1,6
1,8
2,0
Mill
ion
s R
U
Social networks in Czech Republic
blog.cz
lide.cz
spoluzaci.cz
idnes.cz-Rajce.net
libimseti.cz
33
Market highlights //
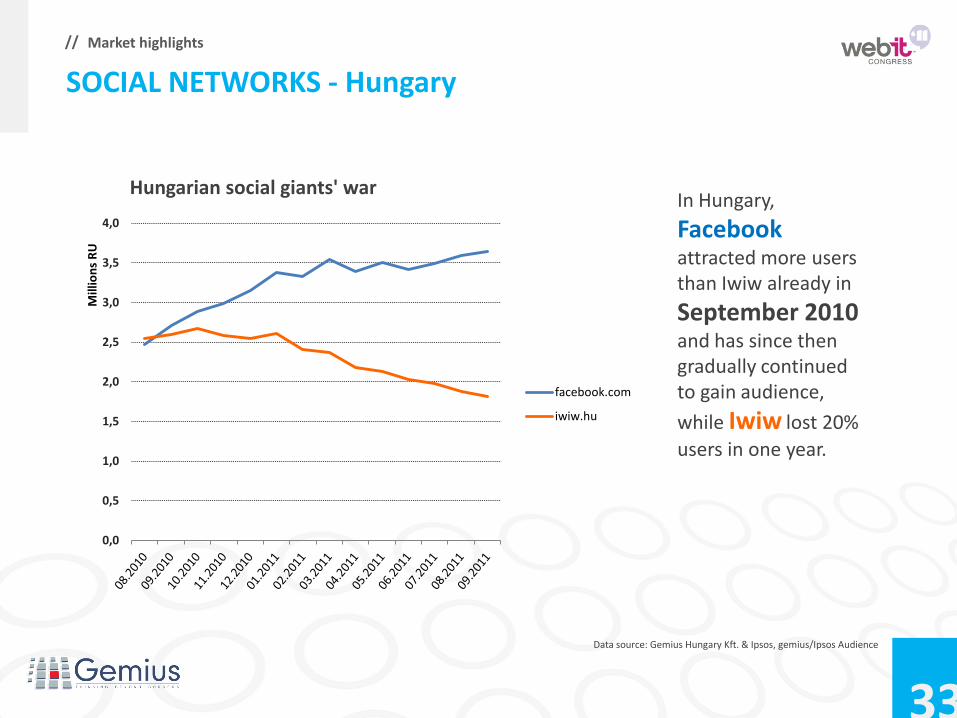
Data source: Gemius Hungary Kft. & Ipsos, gemius/Ipsos Audience
In Hungary,
attracted more users than Iwiw already in
September 2010 and has since then gradually continued to gain audience,
while Iwiw lost 20%
users in one year.
SOCIAL NETWORKS - Hungary
0,0
0,5
1,0
1,5
2,0
2,5
3,0
3,5
4,0
Mill
ion
s R
U
Hungarian social giants' war
facebook.com
iwiw.hu

34
Market highlights //
GOOGLE+
• Cost to build Google+ - 585 million USD • 500 employees engaged in the project
• 50 million users in 88 days
• Mark Zuckerberg is the most popular person on Google +
(almost 600,000 contacts)
Data source: Identyme.com

THANK YOU
Contact: Join us @: Facebook.com/GemiusGroup Twitter.com/Gemius Slideshare.net/Gemius_com YouTube.com/WwwGemiusCom
Marta Klepka
International Marketing Director [email protected]