do tertiary dropout students really not succeed in ...iza discussion paper no. 8015 . march 2014...
TRANSCRIPT

DI
SC
US
SI
ON
P
AP
ER
S
ER
IE
S
Forschungsinstitut zur Zukunft der ArbeitInstitute for the Study of Labor
Do Tertiary Dropout Students Really Not Succeed in European Labour Markets?
IZA DP No. 8015
March 2014
Sylke V. Schnepf

Do Tertiary Dropout Students Really Not Succeed in European Labour Markets?
Sylke V. Schnepf Joint Research Centre, European Commission,
University of Southampton and IZA
Discussion Paper No. 8015 March 2014
(revised version: October 2014)
IZA
P.O. Box 7240 53072 Bonn
Germany
Phone: +49-228-3894-0 Fax: +49-228-3894-180
E-mail: [email protected]
Any opinions expressed here are those of the author(s) and not those of IZA. Research published in this series may include views on policy, but the institute itself takes no institutional policy positions. The IZA research network is committed to the IZA Guiding Principles of Research Integrity. The Institute for the Study of Labor (IZA) in Bonn is a local and virtual international research center and a place of communication between science, politics and business. IZA is an independent nonprofit organization supported by Deutsche Post Foundation. The center is associated with the University of Bonn and offers a stimulating research environment through its international network, workshops and conferences, data service, project support, research visits and doctoral program. IZA engages in (i) original and internationally competitive research in all fields of labor economics, (ii) development of policy concepts, and (iii) dissemination of research results and concepts to the interested public. IZA Discussion Papers often represent preliminary work and are circulated to encourage discussion. Citation of such a paper should account for its provisional character. A revised version may be available directly from the author.
IZA Discussion Paper No. 8015 March 2014 (revised October 2014)
ABSTRACT
Do Tertiary Dropout Students Really Not Succeed in European Labour Markets?*
Tertiary education has been expanding hugely over the last decades, so that tertiary dropout students will constitute a growing distinctive group in future labour markets. University dropout is regularly discussed as a ‘negative’ indicator. However, research on actual career trajectory of dropout students is virtually non-existent. Using data from the 2011 Programme for the International Assessment of Adult Competencies (PIAAC) this study first compares the percentage of adults with tertiary dropout experience between European countries. Second, we examine whether tertiary dropout is a permanent decision as a considerable part of the literature assumes. In a third step, we investigate characteristics of adults with dropout experience. Finally, we estimate the ‘effect’ of dropout on employment status and success of entering prestigious professions comparing results of logistic regression analysis and propensity score matching taking individuals’ characteristics like socio-economic and demographic background, work experience and cognitive skills into account. Results indicate that conditional on these characteristics and for all countries examined on average those individuals who attended but dropped out of tertiary education fare often better and never worse in terms of career progression than those who never enrolled. These to the knowledge of the author first cross national results on tertiary dropouts’ career progression therefore question the purely negative view of tertiary dropout predominant in the literature and at universities. JEL Classification: I21 Keywords: tertiary dropout, labour market chances, European countries,
propensity score matching Corresponding author: Sylke Viola Schnepf European Commission, DG Joint Research Centre Centre for Research on Impact Evaluation (CRIE) Econometrics and Applied Statistics Unit Via E. Fermi 2749, TP 361 I-21027 Ispra (VA), Italy E-mail: [email protected]
* I thank the DEMM, Universitá degli Studi di Milano, Italy and the German Institute for International Educational Research, Germany for their hospitality during work on this paper and seminar participants of both institutes and Traute Meyer and Jürgen Enders for helpful comments.
2
1 Introduction Around the world, tertiary education has been expanding hugely over the last
decades (Schofer & Meyer 2005). Across OECD countries, enrolment increased by
25 percentage points between 1995 and 2009 (OECD 2013a). Therefore, tertiary
dropout students are constituting a growing distinctive group in the labour market.
Higher entry rates into universities are leading to increasing costs of the
tertiary education sector so that policy debate is increasingly evolving around issues
of efficiency of the tertiary sector (OECD 2013a, Aubyn et al. 2009). While efficiency
is difficult to measure, tertiary student dropout rates can serve as an indicator
(OECD 2013a).
Besides the potential importance of dropout rates for efficiency rating of
tertiary education, they have been discussed in literature focusing on patterns of
educational inequalities. This research examining mainly single countries separately
generally indicates that educational inequalities get reinforced during tertiary
education, since parental background is often associated with tertiary drop out, in
some countries even conditional on upper secondary school achievement (i.e.
Powdthavee & Vignoles 2009 for the UK).
The discussions of dropout as efficiency measure and as a factor contributing
to inequality share one assumption: tertiary dropout students do not benefit from
tertiary enrolment. In economics, this assumption is associated with the so called
credentialism theory. It stipulates that what matters in order to enter prestigious
occupations is a graduation certificate. Credentialism is at odds with the human
capital (Becker 1962) and signalling theory. Human capital theory is the backbone of
the Mincer equation models (Mincer 1974) predicting that each year spent in
education accumulates human capital and therefore increases returns to education
independent of a successful graduation. Signalling can also be interpreted in the way
that enrolment into tertiary education already constitutes a first positive signal for
employers and therefore enhances labour market chances even without degree.
(Arrow 1973, Matkovic and Kogan 2012).
Despite the importance of the growing phenomenon of tertiary dropout,
literature examining this group of labour markets entrants and their career pathway is
rare. Davies and Elias (2003) show that while tertiary dropouts have lower chances
of employment than graduates, about half of them move into ‘graduate-track’ type
occupations and earn similarly to graduates in the UK. Using data for the US, Flores-

3
Lagunes and Light (2007) conclude that years since highest grade completed have a
higher effect on wages for non-graduates compared to graduates conditional on
graduation. Matkovic and Kogan (2012) also reject the credentialism theory for
Serbia by concluding that dropout is a better predictor of job entry than not starting
tertiary education and time spend in tertiary education increases dropouts’
employment choices.
This paper’s main objective is to examine labour market success of adults
having experienced tertiary education dropout. In contrast to existing literature
generally focusing on country specific cohorts of tertiary education entrants, we
examine tertiary dropout experience of adults aged 20 to 65 across EU countries.
Using data from the 2011 Programme for the International Assessment of
Adult Competencies (PIAAC) this study first compares the percentage of tertiary
dropouts across countries. Given the unusual dropout measure applied, PIAAC
results are compared to figures published by the OECD.
Since most of existing studies assume that dropout decisions are permanent
(Stratton et al. 2007), in a second step we examine whether this is true. In addition,
descriptive analysis on gender, socio-economic background and cognitive skills by
dropout status are provided.
Results indicate that across countries it is rather a common pattern that
dropouts attain tertiary education later in their life. As a consequence, we split
dropouts into two groups: dropouts with and dropouts without graduation. Dropouts
with graduation are compared to tertiary educated and dropouts without graduation
to individuals who did not enrol into tertiary education but were eligible due to having
completed upper secondary education. These groups are compared in terms of their
employment chances and professional positions attained within the labour market.
Since dropout students are systematically selected on the basis of individual
background and cognitive skills known to be also associated with labour market
outcomes, we need to control for these variables to obtain a meaningful estimate of
dropout ‘effects’. We employ logistic regression analysis and propensity score
matching and compare results between both methods.
The paper is structured as follows: Section 2 provides a literature review.
Section 3 discusses the data and methodology used. In Section 4 we compare
dropout rates between countries and measures. The focus of Section 5 is on

4
characteristics of dropout students while Section 6 scrutinises on labour market
success of adults with tertiary dropout experience and Section 7 concludes.
2 Literature review
Dropout is generally1 discussed as sub-optima outcome at three levels, the
society, the tertiary education systems where the dropout took place and the
individual level. Within the society attrition is discussed to bear a negative
connotation due to a waste of educational resources which coincides with the notion
of dropout being a sign of tertiary education inefficiency (Aubyn et al. 2009, OECD
2013a). At university level some countries like the UK implemented a performance
based rating of tertiary education, so that high dropout rates are penalised. For the
individual, dropout often might be interpreted as individual failure and waste of
resources.
Literature stating that withdrawal patterns reinforce educational inequalities
equally assumes no gain through enrolment. These studies generally employ
longitudinal data of student cohorts over a short time window to examine dropout
decision. Thereby, it is generally assumed that dropout decisions are permanent
even though this is not tested for (Stratton et al. 2007).
This purely negative view of tertiary dropout is surprising, given that there is
only very limited literature available (Stratton at al 2007, Matkovic and Kogan 2012)
on the relationship of tertiary dropout and labour market success.
From a theoretical point of view, individuals’ reasons for dropout decisions are
likely to be related to their future labour market chances especially if labour market
institutions, education systems and student characteristics are considered, which are
the main factors2 regularly associated with dropout.
In a cross-national context differences in labour market flexibility and
education systems are likely to impact on dropouts’ career pathways. Focusing on
labour market regulations, mechanisms for dropouts’ entry into employment might be
quite different to mechanisms for their career development. Applying the
1 Manski (1989) discusses dropout as a neutral result of a natural experiment. 2 Educational institutions are a third main reason discussed for dropout decision but not primarily important for the discussion of labour market success. If students’ expectations are poorly matched by the institution and social integration within universities is weak students drop out (Tinto 1975). The focus on the importance of institutions for withdrawal has been developed further by examining the impact of peers (Johnes & Nabb 2004) and available resources within the institute (Bound and Turner 2007).

5
‘credentialist model’ only an attained degree matters for a successful entry in the
labour market; years of schooling are not important. This theory cannot predict
career progression and is best placed in an ‘occupational labour market’ that is
highly regulated by matching jobs with educational credentials. (Brown 2001) In such
a labour market setting, dropouts would not be in an advantage to individuals eligible
for but never having attended tertiary education. In contrast, the signalling theory can
be attributed to internal labour markets in which once inside the firm promotions to
higher level jobs can be achieved by on the job training. Assuming university entry
as a ‘signal’ dropouts would again fare better access to work than equally educated
counterparts (Matkovic and Kogan 2012) while it is not quite clear whether signalling
helps in terms of career progression. The human capital theory stipulates that every
year in education contributes to a gain in labour market chances for both, entry and
promotion. Given this theory dropouts would fare better than upper secondary
educated adults depending on how long they stayed at university. Matkovic and
Kogan (2012) attribute this theory to flexible labour markets where job matching is
determined purely by market mechanisms.
Besides focusing on the labour market, also the upper secondary education
system might be of importance for explaining dropouts’ chances compared to those
of upper secondary educated. In the past it has been hypothesised, that the more
vocational the school education system is, the lower is the value of vocational
education and consequently the lower the chance to reach professional positions for
upper secondary educated school leavers (Wolbers 2007). We could therefore
assume that tertiary dropouts have an advantage to other upper secondary educated
in countries where school-based vocational pathways are common.
In the light of the labour market and education system structures and their
impact on dropouts’ career chances, the common negative interpretation of tertiary
dropout is likely to occur only in occupational labour markets where credentials of a
graduation certificate alone give access to professional jobs. However, the limited
literature available on career pathways of tertiary dropouts generally indicates that
tertiary dropouts do gain to some extent from university enrolment (Davies and Elias
(2003) for the UK, Flores-Lagunes and Light (2007) for US, Matkovic and Kogan
(2012) for Croatia and Serbia).
This study therefore examines whether dropouts indeed do not benefit from
tertiary enrolment in terms of their career pathways in European labour markets. We

6
thereby try to investigate whether common country patterns exist in terms of
dropouts’ employment chances and access to professional careers. It is beyond the
aim of this study to explain country differences in mechanisms driving the results
since this would need to discuss in-depth each country’s labour market institution in
terms of flexibility and its interplay with the educational system.
While descriptive results will be presented, the study design must control for
skills and socio-economic background which are associated with labour market
success (Buchner et al. 2012) as well as with dropout decision: 3 retention literature
reveals a negative association of ability (i.e. Araque et al. 2009, Smith & Naylor
2001, Montmarquette et al. 2001, Stinebricknen & Stinebrickner 2013, Powdthavee
& Vignoles 2009)4 and socio-economic background (Cingano and Cipollone
2007,Jones & McNabb 2004, Smith & Naylor 2001, Powdthavee & Vignoles 2009)
with tertiary withdrawal rate.
3 Data and methodology Data
PIAAC5 was organised by the OECD in 2011 measuring adults’ development and
use of cognitive literacy, numeracy and problem solving skills in 26 countries. The
survey covers a variety of characteristics related to skills, like for example formal
education, work experience, employment and professional status as well as dropout
from formal education and other background variables like gender, family structure
and socio-economic status. While the survey organisers had cognitive skills as
outcome variable in their mind, future researchers will as well be tempted to use
skills as an explanatory variable (in line with this paper). A general problem of this
approach relates to the direction of the impact of skill formation on the dependent
variable. In this paper we use cognitive skills as a proxy for ability relevant to labour
market success and condition on skills for examining dropouts’ professional
3 Bennett (2003) discusses self‐reported financial hardship in the UK as driving factor for university attrition. In addition, dropout differs by subject area studied (Heublein et al. 2012, Stinebricken & Stinebricken 2013). 4 However, Johnes and McNabb (2004) discuss that peer effects are important in the UK by presenting results indicating that academically able males enrolled in a program with low ability peers are more likely to dropout. 5 PIAAC is the successor of the International Adult Literacy Survey (IALS) and the Adult Literacy and Lifeskills Survey (ALL); however in contrast to previous studies its country cover is considerably higher, data are collected during the same time interval to ensure comparability, and more background information are available as well as different skill measures were used.

7
progression. Nevertheless, it is equally likely that professional success increases
skill levels.
The OECD uses different strategies for the questionnaire design aiming at
making survey instruments comparable (see OECD 2013b).6 Country survey
organisers decided about the sample design which included single stage (for those
countries having national population registries as sampling frames) to multistage
designs. Cognitive kill questions were administered via computer under supervision
of the interviewer and background information was collected via computer-assisted
personal interviewing (CAPI). Response rates to the survey were below 50 per cent
in Sweden (45 per cent) and Spain (48 percent) and below 60 per cent in the
Netherlands (51 per cent), Italy (56 per cent), Poland (56 per cent) and England (59
per cent). Ireland had a comparatively high response rate with 72 per cent. Survey
weights are provided and aim at adjusting for non-response and coverage bias.
Results for Belgium refer to the Flemish speaking part and results for the UK to
England and Northern Ireland only.
Definition of tertiary dropout
Retention and dropout studies examining characteristics of students withdrawing
form tertiary education are employing cross-sectional or panel data and focus on two
time points: entry to tertiary studies and ‘i’ years after entry. This coincides with the
definition used by OECD (2013a).
Completion rate C is defined as number of students having graduated successfully at
time point x+i expressed as percentage of students who enrolled in year x. As a
consequence, completion rates are highly sensitive to the choice of ‘i’. The OECD
defines ‘i’ as the number of full-time study years required completing a degree in the
country being under investigation. The dropout rate is the difference between 1 and
the completion rate.
Individuals not completing within the years required and students having left
tertiary education are equally counted as dropouts (DO). This measure is
problematic since students interrupting their studies, students never having intended
to complete a degree and part-time students are generally count as dropouts. For
different countries, study interruption, so-called ‘no-shows’ and part-time study as
6 For more details on the survey implementation and any other technical information see OECD 2013b.

8
well as prolonged study beyond the years required for completing a degree varies.
This questions cross-national comparability of the data using a small country specific
‘i’. For the calculation of OECD dropout rates cross-sectional instead of longitudinal
data are employed for some countries. This method assumes constant student flows
for year x and year x+i, which might be problematic especially in times of education
reform and economic recession. 7
In contrast, this paper focuses on the experience of tertiary education dropout
among adults aged 25 to 64. Tertiary dropout rates can be derived from two
questions asked at the beginning of the PIAAC questionnaire to those respondents
who report not being studying for any kind of formal qualification during the time of
the interview:
‘Did you ever start studying for any formal qualification, but leave before
completing it?’
Interviewer instructions state: ‘This question refers to programmes as a whole (for
example a bachelors programme at university). 2. If the respondent had a temporary
break, but continued the programme later, this should not be counted as 'leaving
before completing'.8
Individuals answering yes were then asked:
‘What was the level of the qualification you started studying for? If there was
more than one, please report the one with the highest level.’ (OECD 2013c)
In order to be able to compare national programs in terms of qualification level,
national educational attainment information is coded into categories of the
International Standard Classification of Education 1997 (ISCED-97, for how national
educational programmes are classified, see OECD 1999). ISCED levels 5a, 5b and 6
cover tertiary education. ISCED 5a and 6 refer to Bachelor, Master and PhD
programmes and therefore to the more classical university education. ISCED 5b
programmes are shorter, provide less theoretical foundations and prepare for skills
needed for entry into specific professions in the labour market.
While this self-reported dropout statement might be subject to measurement error
(for example, it is left to the respondent to decide whether change of the subject of
the program should count as withdrawal or not), in contrast to the OECD measure 7 I.e. using OECD (2013), dropout rates for countries Belgium, Denmark, Finland, France, Netherlands, Norway and Sweden are based on longitudinal data, but for countries Czech Republic, Poland, Slovak Republic and United Kingdom only on cross‐sectional data. 8 This question is asked after the question on highest qualification obtained.

9
part-time students, students interrupting their studies, students studying longer and
students not having enrolled to complete a degree will not be counted wrongly as
dropouts.
For the purpose of the following study an adult with tertiary dropout experience is
defined to be anyone with at least upper secondary education who is not in formal
education during the interview and reports having dropped out of tertiary education
(ISCED 5a, 5b or 6). Individuals who report having dropped out of tertiary education
after having already completed tertiary studies are not counted as dropouts since the
focus of this paper is on initial dropout.9 Adults with tertiary dropout experience can
hold upper secondary education but also tertiary education in case they re-enrolled
into tertiary education after tertiary dropout and completed their studies.
We restrict our sample to adults aged 25 to 64 who are currently not in education
and have attained at least upper secondary education. Individuals who have
completed their highest education in another country are not included in the analysis.
Taking these exclusions into account sample sizes range from 2,200 in Spain to
5,600 in UK. Given that on average only 14 per cent of upper secondary educated
and 8 per cent of tertiary educated report tertiary dropout (see Table 1), sample
sizes are too small to be able to estimate subgroups within the drop-out sample.
Item non-response for the variables used in our models is generally negligible.
Complex sample design is taken into account for the calculation of standard errors
for regression results. Bootstrapping with 500 replications is used to estimate
standard errors for results of propensity score matching.
Methodology
We measure the ‘effect’ of tertiary dropout on labour market chances, defining labour
market success with two binary variables: first, a variable called ‘employed’ that is
equal to 1 if the person is employed and 0 if the person is unemployed or
economically inactive. Second we employ a variable called ‘manager’ which applies
only to the subset of individuals currently employed. Individuals working as
9 Surprisingly, on average across countries as many as one third of adults who hold tertiary education and who report tertiary dropout terminated their tertiary studies after already having achieved previously a tertiary degree. The predominant part of those terminated a tertiary study at the same or a lower level than the tertiary degree they had previously obtained. This shows that the group of tertiary educated with drop out experience is very heterogeneous, which further justifies the focus on only those tertiary educated who received their tertiary degree after their dropout experience.
10
managers or professionals (International Standard Classification of Occuptions 2008:
first two categories) are coded as 1 and other individuals 0. We assume that upper
secondary education is the entry qualification for tertiary education.
We use two methodologies for estimating the counterfactual effect: regression
analysis and propensity score matching (PSM). Both methods rely on the
assumption, that all relevant differences between adults with and without tertiary
dropout experience can be captured with observable variables covered in the data
set. The PIAAC data set contains a rich set of covariates, given that it includes
information on cognitive skills, socio-economic, demographic background and
education, which, as discussed above, are important determinants of dropout but
also of labour market success. Nevertheless, even with a rich set of controls we
cannot discard the possibility of an impact of unobservables, which would lead to a
bias of our estimated effect.
Assumptions of the regression analysis for retrieving the counterfactual
estimate are more restrictive than those for PSM, given that a linear effect on
potential outcomes and common support, an availability of possible combinations of
covariates similar to both dropout and other adults, is supposed. We present logistic
regression results for coefficients of two explanatory binary variables, dropout with
tertiary education and dropout with upper secondary education, for both outcome
variables conditioning on a rich set of covariates covering socio-economic
background, cognitive skills and work experience.
In contrast, PSM matches those adults with dropout experience to similar
adults without dropout experience based on a propensity score. In detail, we apply
matching for tertiary and upper secondary educated separately. For both groups, we
calculate propensity scores of being a tertiary dropout using probit regression and
conditioning on the same rich set of covariates used in the regression design. We
then match adults with dropout experience with other adults on basis of their
propensity score using nearest neighbour matching with replacement and a caliper
and kernel matching thereby excluding off-support individuals. The estimated ‘effect’
of dropout is then the difference in the outcome measure between both groups. As a
consequence, PSM is non-parametric and therefore relaxes the linearity assumption
as well as common support is taken into account. Given that it compares dropouts
with matched other adults, it measures the so-called ‘average treatment effect of the
treated’ (ATT): i.e. how does dropout experience change labour market chances of

11
dropouts compared to what they would have experienced had they not dropped
out.10
4 How do dropout rates compare between countries? Table 1 provides self-reported tertiary dropout rates by education level of education
and country. As a reminder, the percentage derives from expressing the number of
individuals reporting dropout experience as a share of the total number of adults who
enrolled in tertiary education. The variation between countries is huge. In Italy, every
third adult who enrolled in tertiary education dropped out compared to just every
sixth adult in Germany and the UK. Countries like Poland, Sweden and Ireland meet
the country average with every fifth person having dropped out of tertiary education.
How does this self-reported PIAAC measure compare to the OECD measure
described above? Figure 1 provides a scatter plot of both measures for 15 countries
covered in both sources. It is important to bear in mind that the dropout estimate
used in this paper spans over experience during adults’ lifetime compared to the
OECD estimate of student non-completion within a small number of years after
tertiary education enrolment. As a result, it might therefore surprise that for almost
half of our countries the rank order and size of measure are fairly similar (France,
Denmark, Finland, Belgium, Czech Republic, Spain and the Netherlands). However,
the correlation coefficient between measures is zero if the OECD countries Korea
and Japan are not taken into account and increases to 0.41 with these two countries.
The OECD measure itself changes for some countries considerably between
years11. I.e. in the 2013 OECD report the UK measure is 7 percentage points (20 per
cent) lower than in the 2010 report while for the Slovak Republic it increased by 8
percentage points. For both countries, cross-sectional data were used.
Figure 1 shows that 11 out of the 15 countries are positioned below the
diagonal line, indicating that the OECD dropout estimate is greater than the PIAAC
measure. This is not surprising given that the OECD estimate counts all those
students as dropouts who did not complete within a short time interval ‘i’. Sweden is
the most notable example; for this country the OECD report (2013) states that
tertiary students who do not intend to graduate are counted as dropouts. 10 In contrast, the average treatment effect (ATE) is an average partial effect for a binary variable for a randomly drawn person from the population. 11 OECD tertiary dropout rates for the 16 countries covered in both Education at a Glance reports (2010 and 2013) are correlated with 0.93.
12
It is a common feature of most research on tertiary dropout students to
investigate dropout behaviour only to the time point the student actually drops out:
the predominant part of research does not examine whether tertiary dropout students
re-enter tertiary education and complete a degree. This is very different to research
on school attainment studies, where generally dropout students are defined as only
those who did not postpone completion of their school degree but permanently
decided to drop out.
For judging about the efficiency of the tertiary system as well as on
reinforcement of educational inequalities, there is a clear rational to define also
tertiary dropout only on the basis of permanent dropout. How does the country
ranking discussed above change with this definition?
There are several interesting results to note. First, on average across all
countries, 38 per cent of tertiary dropouts attain a tertiary education degree (last
column in Table 1, weighted by countries). This goes in line with Stratton et al.
(2007) who show that 40 % of all first year attrition is temporary in the US. For many
adults tertiary dropout is therefore not a permanent decision. While on average
across countries 22 per cent of adults experienced drop out, only 14 per cent of
adults did so without having completed a degree.
Remarkable is the huge variation of the percentage of dropouts completing
tertiary education ranging from just 6 per cent in Italy to 58 per cent in Denmark and
Sweden (last column of Table 1). If countries were to be reordered on dropout of
upper secondary educated only, Scandinavian countries would improve their ranking
considerably. These results indicate that it is sensible to differentiate between tertiary
and upper secondary educated dropouts which will be done in the remainder of the
paper.
While this paper does not aim at explaining high tertiary dropout figures there
are several explanations that could be employed depending on how countries tertiary
education systems and labour markets are classified.
A differentiation of countries by the extent of fees students need to pay for
entry into tertiary education has shown not to be helpful in explaining dropout figures
(OECD 2013a).
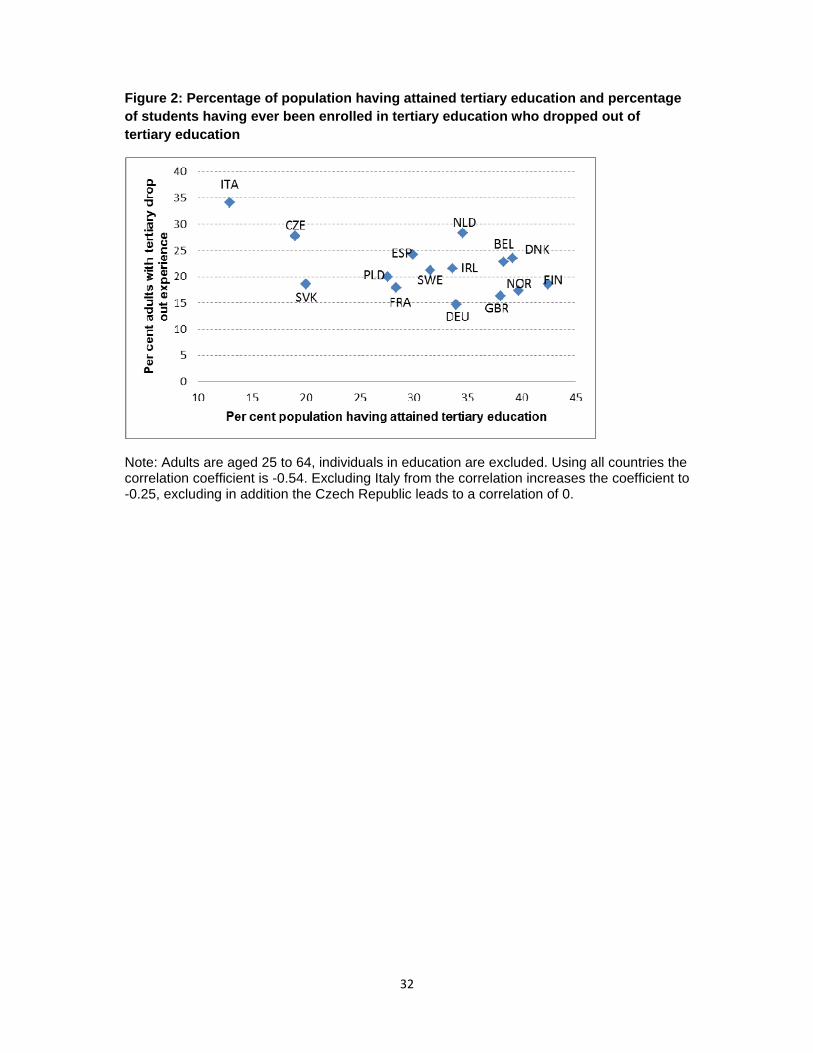
It could be argued that education systems are more efficient if they have high
student intake, so that dropout rates become smaller. At the same time, those
countries with higher university admission deal on average also with students

13
coming from higher parental background compared to countries with low tertiary
completion. Since at the individual level higher parental background is associated
with lower student drop we might assume so similarly at the macro level of countries:
the higher tertiary completion in a country, the higher students’ background and the
hence the lower a countries student dropout. However, while Figure 2 indicates a
negative correlation (-0.54) between per cent of the population having attained
tertiary education and student drop out this correlation coefficient is mainly
determined by the position of Italy and the Czech Republic.
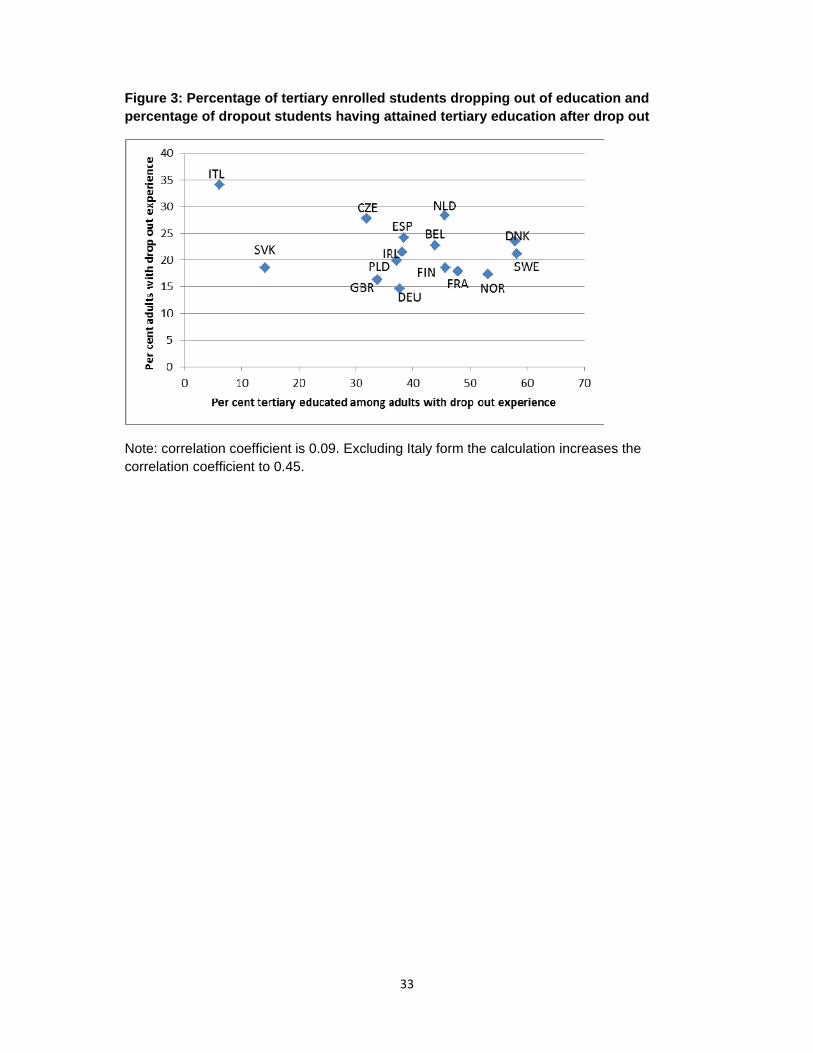
Another classification of education systems could be on the basis of how
flexible entry and exit into tertiary education is. The decision of withdrawal from
tertiary education is easier, if re-entry is possible. A proxy for flexibility could be the
per cent of tertiary dropouts who complete their degree after having dropped out.
However, Figure 3 shows that any possible association between percentage of
dropout students and the per cent among those who later on in their life re-enter and
attain tertiary education is due to the outlier position of Italy.
Most successful in explaining variation between countries regarding dropout
rate might be differences in admission policies. In some European Countries like
Italy, Netherlands and Belgium a school leaving certificate is generally sufficient for
being admitted to study at university (NCIHE 1997). The student population within
these countries includes a spectrum of high and low ability students. This is quite
different to the UK which has a highly selective system with fixed quotas and varying
admission policies based on achievement for different courses. Given that upper
secondary school achievement is highly correlated with university dropout, dropout
rates are lower in countries that use a numerus clausus system of ability selectivity.
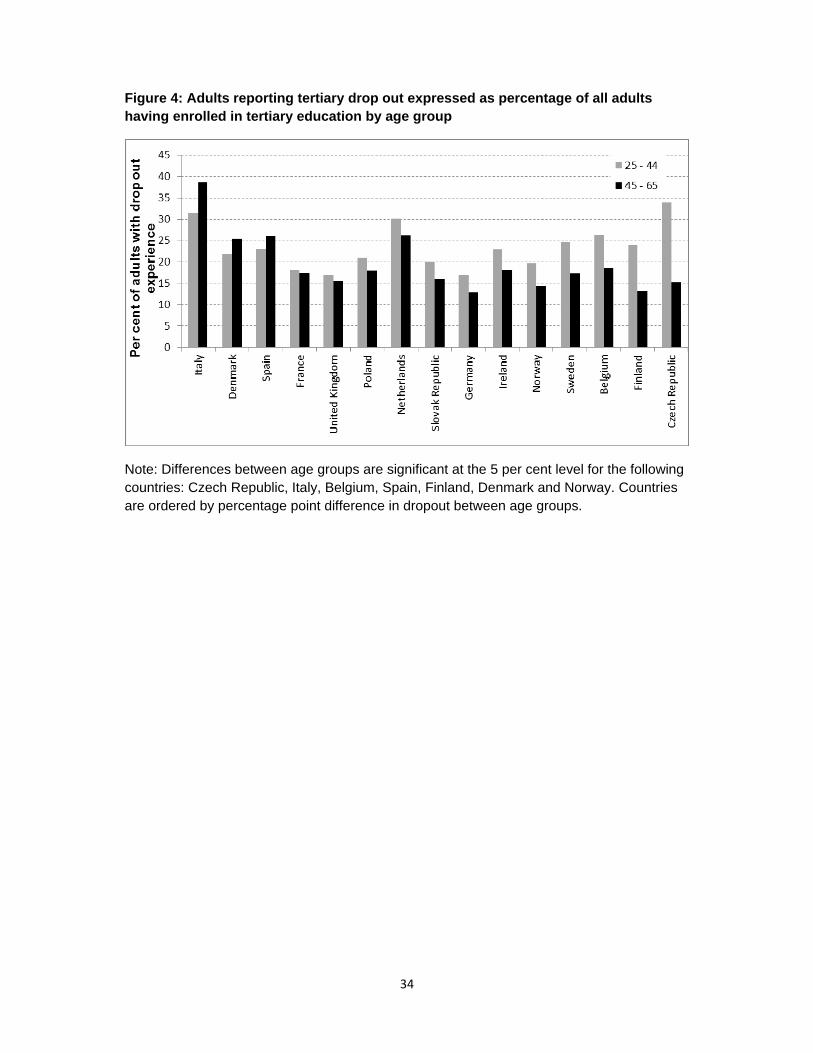
Small sample sizes of dropouts make it difficult to separate out different
cohorts; however it is possible to divide the sample into two age groups: 25 to 44
and 45 to 64 year olds. Figure 4 sorts countries by changes in dropout rates over
time. In seven out of 15 countries differences for both age groups are significant. In
Italy, Denmark and Spain dropout decreased for the younger age cohort while it
increased in the Czech Republic, Belgium, Finland and Norway. In most other
countries changes in dropout rates are relatively small in size.

14
5 Who are dropout students? Given that girls’ upper secondary educational achievement is generally higher than
that of boys and that literature stipulates an existing correlation of ability with
university drop out, it is not surprising that more men than women drop out of tertiary
education. Indeed, OECD (2008) discusses the pattern of increasingly higher female
tertiary completion rates even though gender differences vary by subject area
studied. However, the consistency of this gender pattern in dropout rates across
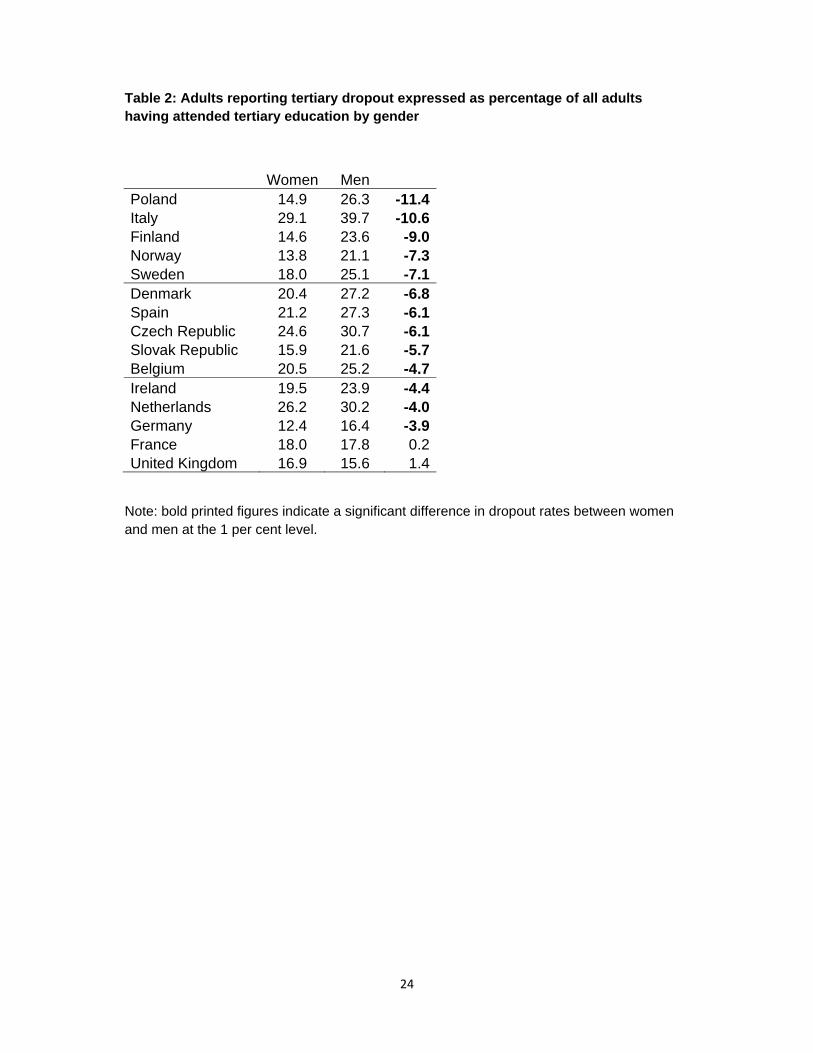
countries and the extent is astonishing. Table 2 shows that in Poland almost twice as
many men than women withdraw from tertiary education. About a third more men
than women drop out in the Scandinavian countries Finland, Norway, Sweden and
Denmark. In nine out of the 15 countries, dropout rates for men are at least 5
percentage points higher than that of women.
Besides gender, socio-economic background is associated with tertiary
dropout. PIAAC information on adults’ family background is mainly limited to parental
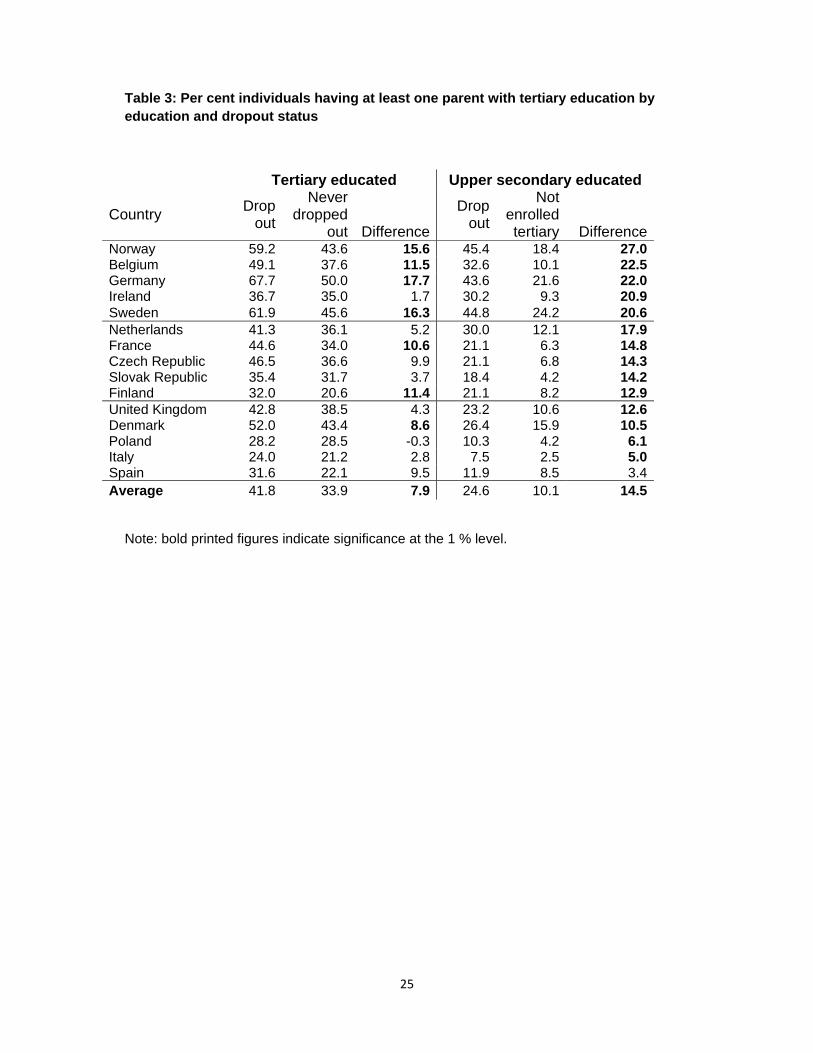
education.12 Table 3 provides the share of individuals having at least one parent with
tertiary education by education and dropout status. For example, among tertiary
educated 68 per cent of dropouts but only 50 per cent of non-dropouts have at least
one parent with a tertiary degree in Germany. Percentage points are printed bold if
differences between equally educated dropouts and counterparts are significant at
the 1 per cent level. Not surprisingly, upper secondary educated dropouts have a
higher parental background in 14 out of 15 countries, which reflects the self-selection
of individuals into tertiary education. Surprising however is that tertiary educated
dropouts have a higher socio-economic background in 8 countries compared to
equally educated. Given that dropouts generally have lower socio-economic
background than other individuals attending tertiary education, this results shows
that only those dropouts manage to reenrol and complete who have the most
advantageous background within the group of individuals having withdrawn.
This pattern is also confirmed once we focus on cognitive skills. Table 4
shows that in 8 out of 15 countries again the tertiary educated dropouts have
12 Information is also available on immigrant status, i.e. whether both parents and individual were born abroad. However, taking into account that tertiary drop out students are on average about 7 per cent of the sample and immigrant students 8.5 %, the sample size is small for investigating a significant ‘effect’ of immigrant status on drop out. Results indicate that in Spain immigrant students are more likely to drop out. In other countries the per cent point differences are similar, but sample sizes too small to claim that differences are significant.

15
significant higher skills than equally educated counterparts. Not surprisingly, also
upper secondary educated dropouts fare better than those who never enrolled into
tertiary education. This confirms the positive selection of dropouts within the
education category they belong to. Since cognitive skills and parental background is
not only positively related to dropout status but as well to labour market chances it is
vital to take these characteristics into account for estimating the ‘effect’ of dropout on
career progression.
6 Labour market success of adults with tertiary dropout experience Given their higher cognitive skills and socio-economic background, we would expect
employment chances to be also better for adults with dropout experience. As Table 5
shows, this is true for upper secondary educated adults. In Italy and Ireland dropouts
are more than 10 percentage points likely to be employed than other upper
secondary educated. For almost all countries, this tendency applies even though
differences are considerably smaller and sometimes not significant. However, tertiary
educated dropouts’ higher skill and socio-economic background does generally not
increase their employment chances compared to equally educated with the UK being
a notable exception. In France and Denmark, dropouts face even lower employment
than other tertiary educated. This indicates that in contrast to upper secondary
educated, tertiary educated dropouts cannot exploit their advantageous
characteristics compared to equally educated adults.
The same picture emerges once we look at career progression in terms of
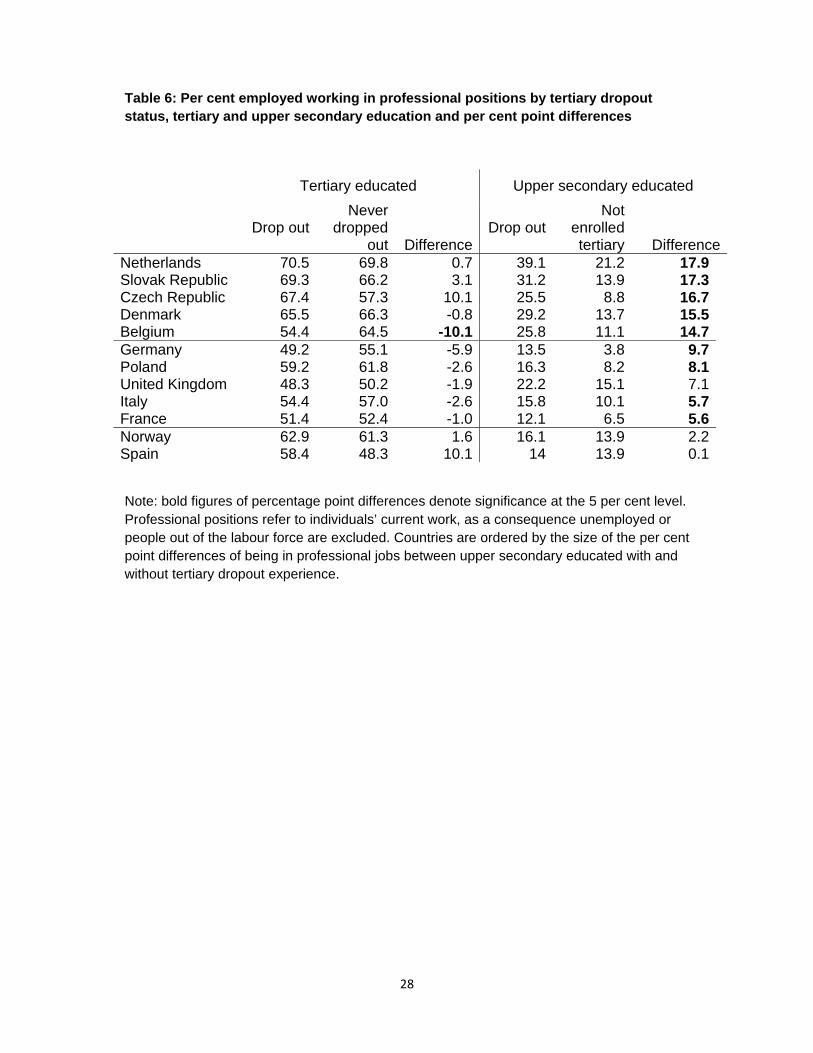
reaching professional positions in the labour market in Table 6. Among the upper
secondary educated, dropouts are between 5 (France and Italy) and 17 percentage
points (Czech Republic, Slovak Republic and Netherlands) more likely to have
gained a prestigious job than individuals who did not enrol in tertiary education. In
nine out of twelve European countries, for which the job position variable ISCO-88
was collected, the differences in career progression are significantly in favour of
dropouts. This is in contrast to tertiary educated, where dropouts fare worse than
their counterparts in seven out of 12 countries, however only in one country
significantly (Belgium). Only in the Czech Republic and Spain (the latter with a
significance level of 10 %) there is an indication of an advantage of dropouts.
In sum, unconditional on background characteristics withdrawal experience
does not penalise, but neither favours tertiary educated in terms of labour market

16
chances but it does increase chances for the upper secondary educated. As
discussed above, we can assume that a considerable part of the differences we find
between adults with and without dropout experience is due to a non-random
selection of adults into dropout status. We showed that dropouts are more likely than
other adults to exhibit those individual characteristics that are positively linked to
better labour market chances.
In order to take selection into account, we first apply logistic regression
analysis. We include an explanatory variable that is equal to 1 if the person has
dropout experience and tertiary education (otherwise 0) and a variable that is equal
to 1 if the person has dropout experience and just upper secondary education.13
Dependent variables are the variables already investigated unconditionally in Tables
5 and 6: being in employment and holding a prestigious job position.
Table 7 presents regression coefficients for the two explanatory variables
tertiary and secondary dropouts only. For both dependent variables three models
were run: one model controlling solely for educational background (using a dummy
on tertiary education), a second model controlling for other individual characteristics
(gender, migration background, young children in the household, whether the
individual has a partner, whether the partner is employed, highest parental
education, age and age square) and a third model that adds cognitive numeracy and
literacy skills14 as well as work experience expressed in years.
Regarding logistic regression results coefficients of covariates (not presented)
were in the expected direction. (Full regression results can be obtained from the
author.) The higher the education the lower was the risk of being not employed and
the higher the chance of holding a professional position. Only in France and the
Netherlands, being a migrant significantly increased the risk of being not in
employment and lowered chances of being a manager. For all countries, having a
child at 6 years old or below decreased the chance of being in employment sizably
and significantly. Conditional on having a partner, having an employed partner either
reduced the risk of not being employed or increased the probability of being a
manager or both significantly in all countries with the exception of the Czech
13 We would have received the same results if we had used a binary variable on dropout and an interaction of the dropout variable with tertiary education. 14 Skills are used as proxy on ability before university dropout. Since skills are positively related to our measures of labour market progression for all countries, it can be shown that the measurement error in our proxy will lead to a downwards bias of the estimated 'effect’. (Angrist and Pischke 2008, p. 50)
17
Republic. Conditional on other factors, individuals with a parent holding tertiary
education were often significantly more likely to be a manager and sometimes more
likely to be not employed. Older age and higher number of years work experience
were associated with a higher probability of not being in employment. Higher
cognitive abilities were generally related to higher probability of being a manager and
lower probability of not working. While for all countries women had a higher
probability of not working conditional on the factors discussed above, the probability
of being a manager differed. In Poland and the Slovak Republic women had a
higher, in France, the Netherlands and the UK women had a lower chance of being a
manger and in the other countries the coefficient was not significant.
Regression coefficients for Model 1 in Table 7 reflect unconditional results
presented in Tables 5 and 6. Changes of the dropout coefficient conditional on other
individual characteristics (Model 2) as well as work experience and skills (Model 3)
reflect the selection into the group of dropouts. For upper secondary educated,
unconditional employment probabilities were higher for dropouts in six out of 15
countries. Conditional on socio-economic background dropout status matters only in
3 countries, whereby once in addition skills and work experience are controlled for
dropouts fare better only in the two countries Italy and Ireland.
In terms of holding prestigious labour market positions, conditioning does lead
to smaller coefficients compared to the unconditional coefficient presented in Model
1. However, in seven countries out of twelve (Belgium, Czech Republic, Denmark,
France, the Netherlands, Poland and Slovak Republic) dropouts are still more likely
to obtain more prestigious jobs than other upper secondary educated adults.
Interestingly, in the three countries (Germany, Italy and the UK) in which dropout
status falls into insignificance this seems to be mainly due to the conditioning on
skills and labour market experience.15
For the tertiary educated, coefficients are generally not significant. They do
fare better in employment in the UK, but worse in Denmark and most other countries.
In terms of professional jobs, about half of the countries’ coefficients indicate a
disadvantage and the other half an advantage of tertiary dropouts. It is interesting to
note, that only conditional on skills tertiary dropouts fare significantly and
considerably worse in Germany regarding their job prospects. For some countries 15 This is of importance showing that a study using a similar design but not having data on cognitive skills would not be able to rely on the conditional independence assumption.
18
however, conditioning on labour market experience, which is likely to be lower for
dropouts, leads to a decrease in the regression coefficient.
Since the interpretation of logistic regression coefficients is not straight
forward, Model 3 is employed in order to calculate predicted probabilities for having
attained a prestigious job or being employed by education and dropout status
conditional on individual characteristics which are set to the mean of the country
sample. The percent point difference of the predicted probabilities between adults
with and without dropout experience but with the same level of education is provided
in Table 8 columns 1 (for being in employment) and 4 (for high professions). sys
Given the regression assumptions of linearity and the problem of common
support as described in Section 3, we use PSM on two separate samples: tertiary
educated and upper secondary educated. We estimate the propensity score of
dropout by taking the same covariates used for the logistic regression design into
account. While, as expected, the propensity score for dropouts is higher than for
non-dropouts, we generally find that common support is given, so that only for some
countries a handful of people are excluded from the matching process. Generally,
matching quality is for all countries and with both matching method, nearest-
neighbour matching with caliper and Kernel Epanechnikov matching, high. However,
in most cases Kernel matching works better given the remaining average mean bias
as well as the higher efficiency of the matching procedure. The disadvantage of
Kernel however is that individuals with very different propensity scores compared to
a treatment person can impact on the results. Table 8 presents percent point
differences between dropouts and equally educated individuals by dependent
variable (professional position and being in employment) and matching methods in
columns 2, 3, 5 and 6. Cells showing significant differences are shaded. The
analysis is conducted for each outcome variable and country separately.
Are tertiary educated with tertiary dropout experience penalised in terms of
labour market success? Percent point differences in employment and professional
status between tertiary educated adults with and without dropout experience (upper
row for each country) are generally not significant for the countries examined. This is
true for both, logistic regression and PSM results. For the UK, PSM with kernel
matching supports the previous results of the logistic regression indicating that
tertiary educated dropouts have higher employment chances. In Denmark tertiaries’
disadvantage is confirmed only by PSM with calliper matching.

19
Tertiary educated dropouts experience a more than 10 percentage point
smaller chances to obtain a professional job than equally educated in Belgium and
Germany. In other countries they do not fare better besides in Spain.
Do tertiary dropouts who never completed tertiary education gain from tertiary
enrolment? In terms of employment, upper secondary dropout adults have an about
5 to 10 percentage point higher probability being employed in Italy and Belgium
consistently across different methods. In addition, there is a general trend that the
percent point differences are positive across countries indicating an advantage for
dropouts.
In six out of twelve countries adults having withdrawn from tertiary education
are more likely to get into professional positions compared to other upper secondary
educated counterparts. Given that sample sizes are small for dropouts, effects need
to be big in size to be significant. In the Netherlands, 15 to 18 percent points more
dropouts than other equally educated are in prestigious positions depending on the
estimation method applied. In the Czech Republic the percent point difference lies
between 11 and 14, in Denmark between 10 and 13 and in Poland between 6 and 10
percentage points. In France, Germany and Italy the percent point difference is
around 4, however not significant.
In sum, once employment and prestigious positions are concerned tertiary
educated dropouts are generally not penalised in comparison to other tertiary
educated (with the exception of Belgium and Germany in terms of prestigious jobs).
Upper secondary educated dropouts have no significant advantage to equally
educated in gaining professional positions in the three Southern countries France,
Italy and Spain and the UK and Norway but benefit from a sizable advantage in the
three Eastern European countries Poland, Czech and Slovak Republic as well as in
the Northern countries Denmark and the Netherlands and Belgium. We checked
whether this advantage could be related to the number of years spent in tertiary
education, which we proxied probably relatively well for about 75 % of dropouts16 by
taking the difference between age of dropping out of tertiary education and age
having completed the highest degree. For the Netherlands and employing logistic
regression, this variable was highly significant and indicated a 10 percentage point
16 For 75 percent of dropouts the difference between age of dropout and age receiving highest degree is 6 years or less.

20
increase of being a manager for each year in tertiary education. In the other
countries, this variable was not of importance.
It is difficult to explain country position without engaging in detail into the
linkage between labour market regulations and educational system of each country,
which is not the aim of this paper. Nevertheless, as discussed above, signalling
theory predicts an employment advantage for dropouts in internal labour markets like
Italy, Spain and France. For Italy we find higher employment chances for dropouts,
however not for France and Spain. At the same time, progression within the labour
market is not better for dropouts in these three countries. This might be explained by
the fact that a considerable part of training takes place within a firm in internal labour
markets, so that knowledge acquired during tertiary education attendance does not
improve progression chances. In the relative flexible labour market of the UK for
which human capital theory would predict an advantage of dropouts in terms of
labour market entry and progression only tertiary dropouts’ gain better employment
chances.
Labour market structures cannot help explain the positive impact of dropout
among upper secondary educated on career progression in the Czech Republic,
Poland, the Netherlands and Denmark, especially given that in Norway dropouts are
not in an advantage. Instead of focusing on labour markets alone, it might well be
assumed that the vocational structure of the education system is of importance. We
hypothesised above that dropouts outperform other upper secondary educated in
countries with a high vocational pathway within the school systems. This is indeed
the case in the Netherlands, the Czech Republic and Poland where tertiary dropouts
fare so much better in acquiring professional jobs. However, we would equally
suspect to find a similar advantage for dropouts in Italy as another country with a
school-based vocational pathway. In addition, Denmark, where dropouts fare better
too, is relatively similar to the UK in its distribution of upper secondary students to
general and vocational pathways (OECD 2000, Table 2.2), but differs considerably in
terms of dropouts’ career advantages.
Given the great importance of the gender dummy in the models as well as the
clearly lower dropout rate for females, we also used female dropout interaction
variables within our logistic regression modelling. In France and Poland the risk of
not being in employment was higher for female upper secondary educated dropouts

21
compared to males. For all other countries, the female interaction coefficient was not
significant.
7 Conclusion Tertiary dropout is generally discussed as a negative outcome in terms of wasting
educational resources at the individual and societal level. This view contradicts
economic theories: i.e. the human capital theory predicts that with or without degree
every year in tertiary education is a gain for labour market chances. The signalling
theory suggests that even without degree dropouts are better off than equally
educated. Only credentialism predicts that tertiary dropouts do not gain from
enrolment. Once the focus is on education systems, we also hypothesised that
dropout experience might improve labour market chances in these countries, where
vocational pathways are overrepresented during upper secondary schooling thereby
decreasing their value compared to general education. Hence, from a theoretical
point of view hypotheses predicting an advantage of adults with dropout experience
prevail.
Surprisingly however, there is a lack of literature that examines tertiary
dropouts’ career prospects. Using PIAAC data on adults’ self-reported withdrawal
from tertiary education this paper therefore examined whether dropout is indeed just
a negative experience without any beneficial impact on employment chances and
professional status in an international context.
The self-reported measure in this paper yields similar results to published
OECD dropout figures based on student cohorts for 7 out of 15 countries.
In contrast to a considerable part of literature treating dropout to be a
permanent decision, the paper shows that on average across countries almost 40
per cent of tertiary dropouts acquire tertiary education later in their life.
Withdrawal from tertiary education is highest in Italy and lowest in the UK and
Germany. Scandinavian countries display low dropout once we focus only on those
tertiary dropouts who did not attain tertiary education later in their life.
For almost all EU countries examined women drop out less than men
whereby percentage point differences are huge between genders in the countries
Poland, Spain, Czech Republic, Italy and Finland. Tertiary educated dropouts have
higher socio-economic background and cognitive skills than equally educated
counterparts. The same is true for upper secondary educated. Given the positive

22
association between skills and socio-economic background with labour market
chances, unconditional results on labour market success mask that dropouts are a
positively selected group among individuals holding the same educational degree.
Employing logistic regression analysis and propensity score matching the
study compared the probability of being employed or in professional jobs between
dropouts and equally educated adults conditional on socio-economic and
demographic background and cognitive skills. We found interesting common country
patterns. In general, tertiary educated dropouts have similar chances of employment
and progressing to professional positions as non-dropouts. Only in Germany and
Belgium they seem to be penalised with lower prospects of obtaining high level
positions in the labour market.
Once we focused on adults with upper secondary education, logistic
regression and propensity score matching results showed consistently that dropouts
are in more favourable positions than their counterparts in terms of holding
professional positions in half the countries examined. There is no clear disadvantage
for dropouts in terms of employment chances. However, in general country patterns
are difficult to explain.
In sum and in contrast to the negative connotation attached to tertiary dropout
in retention studies results presented here show generally that dropout can very well
be a ‘positive’ indicator in the labour market. This is first due to the fact that the
dropout decision is in many cases not a permanent one which is largely not taken
into account in existing research. Those dropout adults who obtained their degree
later fare similar to tertiary educated who never experienced dropout. Second, for all
countries examined and conditional on demographic, socio-economic background
and cognitive skills on average those individuals who attended but dropped out of
tertiary education fare often better and never worse in terms of career progression
than those who never enrolled. This result asks for a revision of the purely negative
view associated with tertiary dropout.
Future research could link countries’ labour market regulations with their
educational systems in order to unveil mechanisms for dropouts’ success and use a
multi-dimensional measure of career pathways.

23
Tables and Figures
Table 1: 25 to 64 year old adults who report tertiary dropout as per cent of adults ever enrolled in tertiary education by education attained
Total drop out Upper
secondary educated
Tertiary educat
ed
% of dropouts holding tertiary
education % se % % Italy 34.1 1.3 32.0 2.1 6.1 Netherlands 28.3 1.0 15.4 12.9 45.6 Czech Republic 27.8 1.6 18.9 8.9 31.9 Spain 24.2 1.1 14.9 9.3 38.5 Denmark 23.5 0.9 9.9 13.6 57.9 Belgium 22.8 1.1 12.8 10.0 43.9 Ireland 21.5 1.2 13.3 8.2 38.1 Sweden 21.2 1.2 8.9 12.3 58.2 Poland 20.0 1.2 12.6 7.4 37.2 Slovak Republic 18.6 1.5 16.0 2.6 14.1 Finland 18.5 0.9 10.1 8.5 45.7 France 17.9 0.8 9.3 8.6 47.9 Norway 17.4 0.9 8.1 9.2 53.1 United Kingdom 16.3 0.9 10.8 5.5 33.8 Germany 14.7 0.9 9.2 5.5 37.7 All 21.8 0.5 13.5 8.3 38.2
Note: countries are ordered by per cent of adults ever enrolled in tertiary education reporting tertiary dropout. Individual with less than upper secondary education, in education during the interview or having attained tertiary education abroad are excluded. Adults reporting tertiary dropout only after having already obtained a tertiary degree are not considered to be tertiary dropouts.
24
Table 2: Adults reporting tertiary dropout expressed as percentage of all adults having attended tertiary education by gender
Women Men Poland 14.9 26.3 -11.4Italy 29.1 39.7 -10.6Finland 14.6 23.6 -9.0Norway 13.8 21.1 -7.3Sweden 18.0 25.1 -7.1Denmark 20.4 27.2 -6.8Spain 21.2 27.3 -6.1Czech Republic 24.6 30.7 -6.1Slovak Republic 15.9 21.6 -5.7Belgium 20.5 25.2 -4.7Ireland 19.5 23.9 -4.4Netherlands 26.2 30.2 -4.0Germany 12.4 16.4 -3.9France 18.0 17.8 0.2United Kingdom 16.9 15.6 1.4
Note: bold printed figures indicate a significant difference in dropout rates between women and men at the 1 per cent level.
25
Table 3: Per cent individuals having at least one parent with tertiary education by education and dropout status
Tertiary educated Upper secondary educated
Country Drop out
Never dropped
out Difference
Drop out
Not enrolled tertiary
Difference Norway 59.2 43.6 15.6 45.4 18.4 27.0 Belgium 49.1 37.6 11.5 32.6 10.1 22.5 Germany 67.7 50.0 17.7 43.6 21.6 22.0 Ireland 36.7 35.0 1.7 30.2 9.3 20.9 Sweden 61.9 45.6 16.3 44.8 24.2 20.6 Netherlands 41.3 36.1 5.2 30.0 12.1 17.9 France 44.6 34.0 10.6 21.1 6.3 14.8 Czech Republic 46.5 36.6 9.9 21.1 6.8 14.3 Slovak Republic 35.4 31.7 3.7 18.4 4.2 14.2 Finland 32.0 20.6 11.4 21.1 8.2 12.9 United Kingdom 42.8 38.5 4.3 23.2 10.6 12.6 Denmark 52.0 43.4 8.6 26.4 15.9 10.5 Poland 28.2 28.5 -0.3 10.3 4.2 6.1 Italy 24.0 21.2 2.8 7.5 2.5 5.0 Spain 31.6 22.1 9.5 11.9 8.5 3.4 Average 41.8 33.9 7.9 24.6 10.1 14.5
Note: bold printed figures indicate significance at the 1 % level.

26
Table 4: Cognitive skill differences in literacy between adults with and without dropout experience by education
Tertiary educated Upper secondary educated
Country Drop outNever
dropped out Difference
Drop outNot
enrolled tertiary Difference
Czech Republic 308 301 6 297 266 31Denmark 300 292 8 283 260 22Finland 323 307 16 296 271 25France 300 293 6 285 256 29Germany 315 292 23 295 259 36Ireland 299 291 7 282 263 19Italy 290 280 10 276 259 17Netherlands 321 308 13 305 278 27Belgium 316 301 15 292 262 30Norway 313 301 13 283 269 14Poland 295 296 -1 276 252 24Slovak Republic 305 295 10 288 272 16Spain 291 278 12 264 253 12Sweden 321 305 16 298 272 27United Kingdom 304 294 9 292 265 27Average 306 296 10 287 264 23
Note: bold printed figures indicate significance at the 1 % level.

27
Table 5: Per cent of working age adults being in employment by tertiary dropout status, tertiary and upper secondary education and per cent point differences
Tertiary educated Upper secondary educated
Drop out
Never dropped
out Difference
Drop out
Not enrolled tertiary Difference
Italy 79.7 83.3 -3.6 83.7 69.3 14.4Ireland 85.6 82.6 3.0 76.8 65.4 11.4Belgium 92.4 89.9 2.5 87.1 78.3 8.8Czech Republic 84.4 84.9 -0.5 82.6 74.0 8.6Poland 92.7 87.8 4.9 70.5 62.1 8.4France 79.0 86.2 -7.2 79.5 73.2 6.3Slovak Republic 85.3 86.8 -1.5 74.8 69.3 5.5Sweden 95.1 92.2 2.9 88.7 85.0 3.7Finland 88.5 88.5 0.0 79.5 76.5 3.0Spain 77.7 80.2 -2.5 69.3 67.0 2.3Netherlands 87.8 88.4 -0.6 83.6 81.5 2.1United Kingdom 92.0 83.7 8.3 75.5 74.1 1.4Norway 94.3 92.2 2.1 82.3 83.3 -1.0Germany 91.4 90.0 1.4 76.8 80.3 -3.5Denmark 84.3 89.0 -4.7 70.8 77.9 -7.1
Note: bold figures for percentage point differences are significant at the 5 per cent level. Countries are ordered by the size of the per cent point differences of employment between upper secondary educated with and without tertiary dropout experience.
28
Table 6: Per cent employed working in professional positions by tertiary dropout status, tertiary and upper secondary education and per cent point differences
Tertiary educated Upper secondary educated
Drop out Never
dropped out Difference
Drop outNot
enrolled tertiary Difference
Netherlands 70.5 69.8 0.7 39.1 21.2 17.9Slovak Republic 69.3 66.2 3.1 31.2 13.9 17.3Czech Republic 67.4 57.3 10.1 25.5 8.8 16.7Denmark 65.5 66.3 -0.8 29.2 13.7 15.5Belgium 54.4 64.5 -10.1 25.8 11.1 14.7Germany 49.2 55.1 -5.9 13.5 3.8 9.7Poland 59.2 61.8 -2.6 16.3 8.2 8.1United Kingdom 48.3 50.2 -1.9 22.2 15.1 7.1Italy 54.4 57.0 -2.6 15.8 10.1 5.7France 51.4 52.4 -1.0 12.1 6.5 5.6Norway 62.9 61.3 1.6 16.1 13.9 2.2Spain 58.4 48.3 10.1 14 13.9 0.1
Note: bold figures of percentage point differences denote significance at the 5 per cent level. Professional positions refer to individuals’ current work, as a consequence unemployed or people out of the labour force are excluded. Countries are ordered by the size of the per cent point differences of being in professional jobs between upper secondary educated with and without tertiary dropout experience.

29
Table 7: Selection of logistic regression coefficients for adults with dropout experience by education
Education of
dropout
Dependent variable: in employment Dependent variable: in professional position
(Model 1) (Model 2) (Model 3) n (Model 1) (Model 2) (Model 3) nBelgium tertiary 0.303 -0.0759 -0.131 -0.425** -0.458** -0.506*** secondary 0.625*** 0.548* 0.428 3,035 1.024*** 0.934*** 0.804*** 2,478Czech tertiary -0.0369 -0.238 -0.267 0.431 0.410 0.385 secondary 0.508* 0.504 0.352 3,874 1.261*** 1.295*** 1.089*** 2,828Denmark tertiary -0.407** -0.455** -0.573*** -0.0360 -0.0802 -0.141 secondary -0.376** -0.452** -0.664*** 4,719 0.958*** 0.952*** 0.785*** 3,837Finland tertiary -0.00435 -0.265 -0.269 secondary 0.180 -0.00516 -0.127 3,399 France tertiary -0.509*** -0.387* -0.384 -0.0380 -0.0994 -0.0794 secondary 0.352* 0.134 -0.0231 4,110 0.692*** 0.759*** 0.492* 3,240Germany tertiary 0.167 -0.000763 -0.257 -0.235 -0.394 -1.067*** secondary -0.207 -0.414 -0.723** 3,655 1.361*** 1.120*** 0.266 3,081Ireland tertiary 0.226 0.132 0.112 secondary 0.563*** 0.467** 0.396* 3,603 Italy tertiary -0.233 -0.479 -0.654 -0.109 -0.168 -0.251 secondary 0.819*** 0.694*** 0.586*** 2,389 0.512** 0.394* 0.266 1,857Netherlands tertiary -0.0599 -0.268 -0.281 0.0324 0.00533 -0.0651
secondary 0.148 0.0408 -0.00871 2,642 0.869*** 0.907*** 0.729*** 2,270Norway tertiary 0.339 0.144 0.0167 0.0713 0.0749 0.0102 secondary -0.0711 -0.229 -0.261 3,124 0.170 0.335 0.147 2,414Poland tertiary 0.559 0.209 0.246 -0.105 0.0603 0.0801 secondary 0.380* 0.143 -0.0577 3,956 0.776*** 1.058*** 0.918*** 2,756Slovak Rep tertiary -0.127 -0.378 -0.550 0.141 0.088 0.039
secondary 0.271 0.234 -0.0897 3,808 1.027*** 1.012*** 0.806*** 2733 Spain tertiary -0.149 -0.245 -0.239 0.406* 0.332 0.241 secondary 0.102 0.0244 -0.0185 2,221 0.00247 -0.0867 -0.192 1,674Sweden tertiary 0.485 0.351 0.270 secondary 0.332 0.306 -0.0982 2,825 UK tertiary 0.814** 0.785** 0.859** -0.0755 -0.0421 -0.0770 secondary 0.0775 0.139 0.0194 5,601 0.466* 0.426 0.105 4,137
Note: Model 1 controls only for educational background, Model 2 controls for gender, migration background, young children living in the household, whether individual lives in a partnership, whether the partner is employed, highest parental education, age and age square. Model 3 takes work experience measured in years and cognitive ability in terms of numeracy and literacy into account. *** denotes p<0.01, ** p<0.05 and * p<0.1. Grey shaded cells show significance of regression coefficient.

30
Table 8: Percent point difference for employment and holding professional positions between dropouts and non-dropouts by education and counterfactual impact evaluation method applied
Education of
dropout
Dependent variable: in employment
Dependent variable: in professional position
Logistic regression
PSM caliper
PSM kernel
Logistic regression
PSM caliper
PSM kernel
Belgium tertiary -0.9 5.0 0.4 -12.4 ** -11.9 * -11.5 *** secondary 4.3 * 8.8 * 5.2 * 11.7 *** 12.2 ** 11.6 *** Czech tertiary -3.4 -8.6 -2.0 9.6 1.2 2.8 secondary 5.0 2.3 2.5 14.0 ** 11.0 ** 13.6 *** Denmark tertiary -5.6 * -4.0 -3.7 * -3.4 -1.7 -2.3 secondary -10.5 ** -11.0 ** -4.5 12.8 *** 11.8 ** 10.8 *** Finland tertiary -2.6 -4.1 0.1 secondary -1.6 -3.7 -2.9 France tertiary -4.9 -2.5 -4.3 2.0 3.9 -2.6 secondary -0.4 4.1 3.8 3.8 4.2 4.1 Germany tertiary -2.3 -6.3 -1.0 -22.0 -23.0 *** -13.5 ** secondary -10.6 ** -7.7 -5.8 1.2 9.8 * 3.7 Ireland tertiary 1.5 0.1 -0.1 secondary 7.7 ** 3.3 3.1 Italy tertiary -9.7 na na -6.2 na -9.4 secondary 9.5 *** 4.1 6.5 ** 2.6 4.8 * 4.0 Netherlands tertiary -2.5 -2.6 -3.3 -1.4 2.4 -1.0 secondary -0.1 3.8 2.8 15.2 *** 16.3 *** 18.5 *** Norway tertiary 0.1 -1.9 0.1 0.2 1.6 1.8 secondary -2.9 -3.5 -1.0 1.9 -1.2 1.9 Poland tertiary 2.2 1.0 0.2 2.0 2.3 0.1 secondary -1.3 4.7 1.8 9.7 ** 5.8 9.9 *** Slovak Rep tertiary -7.6 na -1.8 0.9 na na secondary -1.6 -2.0 0.0 13.1 *** 11.9 * 16.0 *** Spain tertiary -4.0 -5.9 -4.7 6.1 3.0 9.7 * secondary -0.4 -7.0 0.0 -2.4 -4.2 -1.0 Sweden tertiary 1.6 -1.9 0.1 secondary -0.9 5.2 3.3 UK tertiary 8.0 *** 3.4 5.4 ** -1.9 0 -2.6 secondary 0.3 -2.6 1.8 1.5 2.1 -1.0
Note: this table presents percent point differences in being in employment (column 1 to 3) and holding professional positions (column 4 to 6) between upper secondary educated adults with and without dropout experience (second row each country) and tertiary educated adults with and without dropout experience (first row each country) by method used. Shaded cells denote significance, *** denotes p<0.01, ** p<0.05 and * p<0.1. All results are conditioned on socio-economic and demographic background, work experience and cognitive skills (model 3 pervious Table). For three countries (Sweden, Ireland and Finland) information on profession were not available. ‘na’ denotes that the propensity score matching resulted in an average mean bias across coefficients bigger than 8 percent.

31
Figure 1: Self-reported dropout rates by working-age adults from PIAAC and dropout rates from student population cross-cohorts and panel data
Note: Belgium refers to the Flemish speaking part only for both measures. Correlation coefficient is 0.41 including the OECD countries Korea and Japan and 0.0 without. If the three countries with highest dropout rates using the OECD measure are excluded (Poland, Norway and Sweden), the coefficient is 0.71. Source: OECD 2013, for Korea and Spain OECD 2010 and for Germany OECD 2008, author’s calculations.
32
Figure 2: Percentage of population having attained tertiary education and percentage of students having ever been enrolled in tertiary education who dropped out of tertiary education
Note: Adults are aged 25 to 64, individuals in education are excluded. Using all countries the correlation coefficient is -0.54. Excluding Italy from the correlation increases the coefficient to -0.25, excluding in addition the Czech Republic leads to a correlation of 0.
33
Figure 3: Percentage of tertiary enrolled students dropping out of education and percentage of dropout students having attained tertiary education after drop out
Note: correlation coefficient is 0.09. Excluding Italy form the calculation increases the correlation coefficient to 0.45.
34
Figure 4: Adults reporting tertiary drop out expressed as percentage of all adults having enrolled in tertiary education by age group
Note: Differences between age groups are significant at the 5 per cent level for the following countries: Czech Republic, Italy, Belgium, Spain, Finland, Denmark and Norway. Countries are ordered by percentage point difference in dropout between age groups.
35
References
Angrist, J. and Pischke, J.S. (2008), Mostly Harmless Econometrics: An Empiricist’s
Companion, Princeton University Press.
Araque, F., Roldan, C. and Salguero, A. (2009), Factors influencing university drop
out rates, Computers & Education, 53, 563-574.
Arrow, K.J. (1973), Higher education as a filter. Journal of Public Economics, 2, 193-
216.
Aubyn, M., Pina, A., Garcia, F. and Pais, J. (2009), Study on the efficiency and
effectiveness of public spending on tertiary education, European Commission
Economic Papers.
Becker, G. S. (1962), Investment in in human capital: a theoretical analysis, The
Journal of Political Economy, 70, 9-49.
Bennet, R. (2003), Determinants of undergraduate student dropout out rates in
university business studies department, Journal of Further and Higher
Education, 27(2), 123-141.
Bound, J. and Turner, S. (2007), Cohort crowding: how resources affect collegiate
attainment, Journal of Public Economics, 91(5-6): 877-899.
Buchner, C., Smits, W. and Velden, R. van der, 2012, Education, cognitive skills and
earnings of males and females, Research Memoranda 010, Maastricht :
METEOR, Maastricht Research School of Economics of Technology and
Organization.
Cataldi, E., Laird, J and KewalRamani, A. (2009), High School Dropout and
Completion Rates in the United States: 2007,National Center for Education
Statistics, U.S. Department of Education, Wasington, DC.
http://nces.ed.gov/pubsearch/pubsinfo.asp?pubid=2009064.
Cingano, F. and Cipollone, P. (2007), University drop-out: The case of Italy, Banca
D’Italia, Economic Department Discussion paper No. 626.
Davies, R. and Elias, P. (2003), Dropping out: A study of early leavers from higher
education, Research Report RR386, Norwich: Department for Education and
Skills.
Flores-Lagunes, A. and Light, A. (2007), Interpreting sheepskin effects in the returns
to education, University of Arizona Economic Working Paper Series, 07-07.

36
Heublein, U., Richter, R., Schmelzer, R. and Sommer, D., Die Entwicklung der
schwund- und Studienabbruchquoten an den deutschen Hochschulen, HIS:
Forum Hochschule, 3/2012, http://www.his.de/pdf/pub_fh/fh-201203.pdf
Jones, J. and McNabb, R. (2004), Never give up on the good times: student attrition
in the UK. Oxford Bulletin of Economics and Statistics, 66, 23-47.
Kupfer, Meyer and Schnepf (2014), How can international tertiary education dropout
be explained?, S3RI Applications and Policy paper, forthcoming.
Manski, C. (1989), Schooling as experimentation: a reappraisal of the postsecondary
dropout phenomenon, Economics of Education Review 8(4), 305-312.
Matkovic, T. and Kogan I. (2012), All or Nothing? The Consequences of Tertiary
Education Non-Completion in Croatia and Serbia, European Sociological
Review 28 (6).
Mincer, J. (1974), Schooling, Experience, and Earnings, New York: NBER.
Montmarquette, C., Mahsweredjian, S. and Houle, R. (2001), The determinants of
university dropouts: a bivariate probability model with sample selection,
Economics of Education Review, 20(5), 475-484.
NCIHE (1997), The national Committee of Inquiry into Higher Education,
http://www.leeds.ac.uk/educol/ncihe/
OECD (2000), From Initial Education to Working Life, Making Transitions Work,
OECD, Paris.
OECD (2013a), Education at a Glance
OECD (2013b), Technical Report of the Survey of Adult Skills (PIAAC), http://www.oecd.org/site/piaac/_Technical%20Report_17OCT13.pdf
OECD (2013c), Background questionnaire, www.oecd.org/edu/48442549.pdf (previous
a ‐ channge)
OECD (2011), Education at a Glance, www.oecd.org/dataoecd/61/2/48631582.pdf
OECD (2010a), PIAAC Technical Standards and Guidelines, http://www.oecd.org/site/piaac/PIAAC‐
OECD (2010b), Education at a Glance, www.oecd.org/dataoecd/45/39/45926093.pdf
OECD (2008), Education at a Glance, http://www.oecd.org/education/skills‐beyond‐
school/41284038.pdf
OECD (1999), Classifying Educational Programmes. Manual for ISCED-97
Implementation in OECD Countries, http://www.oecd.org/edu/1841854.pdf
37
Powdthavee, N and Vignoles, A (2009), The socio-economic gap in university
dropout, http://powdthavee.co.uk/resources/socio_econ_edu_powdthavee_vignoles.pdf
Schofer, E and Meyer J. (2005), The Worldwide Expansion of Higher Education in
the Twentieth Century, American Sociological Review, 70(6), 898-920.
Smith, J. and Naylor, R. (2001) Dropping out of university: a statistical analysis of the
probability of withdrawal for UK university students, Journal of Royal
Statistical Society, 164, 389-405.
Stinebrickner, R. and Stinbrickner, T. (2013), A Major in Science? Initial Beliefs and
Final Outcomes for College Major and Dropout,
www.ecfonomics.uwo.ca/people/stinebrickner_docs/amajorinscience-
july13.pdf
Stratton, L., O’Toole, D. and Wetzel, J. (2007): A multinomial logit model of college
stopout and dropout behaviour, Economics of Education Review 27: 319-331.
Tinto,V. (1975), Dropout from Higher Education: A Theoretical Synthesis of Recent
Research, Review of Educational Research, 45, 89-125.
Wolbers, M. (2007): patterns of Labour market Entry: A Comparative Perspective on
School-to-Work Transitions in 11 European Countries, Acta Sociologica, 50:
189-211.