do strategic partnerships create value? ''the empirical
TRANSCRIPT

HAL Id: halshs-01068783https://halshs.archives-ouvertes.fr/halshs-01068783
Submitted on 26 Sep 2014
HAL is a multi-disciplinary open accessarchive for the deposit and dissemination of sci-entific research documents, whether they are pub-lished or not. The documents may come fromteaching and research institutions in France orabroad, or from public or private research centers.
L’archive ouverte pluridisciplinaire HAL, estdestinée au dépôt et à la diffusion de documentsscientifiques de niveau recherche, publiés ou non,émanant des établissements d’enseignement et derecherche français ou étrangers, des laboratoirespublics ou privés.
Do strategic partnerships create value? ”The empiricalcase of SBF 250 firms”
Fateh Saci, Boualem Aliouat
To cite this version:Fateh Saci, Boualem Aliouat. Do strategic partnerships create value? ”The empirical case of SBF250 firms”. 5th International Research Meeting in Business Management (IRMBAM 2014), Jul 2014,Nice, France. �halshs-01068783�

Do strategic partnerships create value?
“The empirical case of SBF 250 firms”
By Fateh SACI
PhD in Management Sciences, University of Nice Sophia Antipolis
4 Avenue du petit Fabron, 06200 Nice, France
GREDEG, CNRS-UNS, University of Nice Sophia Antipolis
250 rue Albert Einstein - Bâtiment 2, 06560 Valbonne, Nice, France
Tél. Fr. +33 (0) 6 52 00 78 55
Boualem ALIOUAT
Professor in Management Sciences, University of Nice Sophia Antipolis
GREDEG, CNRS-UNS, University of Nice Sophia Antipolis
250 rue Albert Einstein - Bâtiment 2, 06560 Valbonne, Nice, France
Tél. Fr. +33 (0) 6 61 41 39 63
Abstract
Strategic partnerships are theoretically now considered as real levers of value creation. This
value creation takes different forms1. The objective of our research, after analyzing the results
of empirical works focused on the acquisitions announcements impact on the stock market
performance and also their actual value creation in the long-term, is to check if strategic
partnerships create market value and the actual value. Our final results show that in the short
term the announcement of a strategic partnership has a negative impact on performance as
opposed to the announcement of a merger-acquisition, while other hand on the long-term,
there is no positive impact (neutral impact) of strategic partnerships on financial performance.
We explain this result by the phenomenon of "creation of compensatory value" in the context
of a strategic and financial plan
Keywords
Strategic partnerships, market value, compensatory value
1 This value creation takes different forms, essentially strategic value, substantial value, institutional value and
financial value (including shareholders).

2
Introduction
Since the 1980s, regardless of their size or their business sectors, companies grow
increasingly by acquisitions, mainly by strategic partnerships (PS) (Paturel, 1990). These have
multiplied to the point of looking like a fairly common form in strategic business options.
This trend is explained by several reasons relating to the intentions of stakeholders concerned
whether, as noted by some authors, to financial motivations of shareholders, substantial or
institutional (Aliouat and Taghzouti 2009).
(Jacquot and Koehl, 1998) have made the same goals and motivations in the case of
cooperation in general. For both authors, the motivations are often provided by environmental
explanations (increased competition, market globalization, technological change,
internationalization of markets, etc..), economic interpretations (economic and organizational
efficiency) or cultural interpretations and cognitive (socio-cultural factors, plans of
interpretation of the actors, vision, ...).
Today, with the new economic situation and the multiplication of financial crises, external
growth strategies including strategic partnerships2 and mergers and acquisitions
3 have become
two of the most appropriate ways to deal with any internal or external crisis but also to cope
with intense competition, integrate a new market, reduce or minimize costs, maximize profits,
a complete range, expand into new markets, acquire technology or know-how to obtain scarce
resources, maintain certain resources, innovation, etc.. (Jacquot and Koehl, 1998). In short,
preservation strategies, capture, creation or production of the current or new value according
to (Paturel, 2011).
2 The success of a partnership based on respect for different steps (Wahyuni, Ghauri, Karsten, 2007)
3 Despite the crisis of 2007, the same year the number of M & A has peaked and it is from these data that one
can reasonably conclude that the F & A may be responses to address a crisis or rather an opportunity intended to
benefit fragile business targets. According to final figures provider Thomson Financial data published Thursday,
January 3, 2008.

3
However, with financial globalization, firms are more focused on shareholder wealth, while
the latter have experienced strong growth in liquidity and increase profits. This is why
practitioners and researchers interested more in this area.
The search for the maximization of shareholder wealth which is central focus of this
competition to the large size as specified (Albouy, 2006) In his article, Theory, Applications
and limitations of measuring value creation: "not very long ago, the main objective was racing
for turnover, critical size, market share, even in annual net profit. (…).The creation of
shareholder value would not be a fashion or a matter of communication as many subjects of
management? ".
1. Literature review on strategic partnerships
The analysis of work on the subject of our research enabled us to notice a real dissonance
between the results of previous work. Especially with those who argue for the creation of real
financial value, and those who advocate for the perception of value.
Our research focuses on measuring the creation of financial value and shareholder value even
though some authors as (Pesqueux, 1990), (Hoareau and Teller, 2001) and (Caby Hyrigoyen,
2001) consider that the accounting and financial information is based on utilitarian references
that emphasize market values at the expense of existential values (partnership values).
But despite these criticisms on quantitative criteria of performance measurement, we must not
forget that the survival of a company can only be a consequence of the financial results
effectively measured, that is (Gilbert & al., 2004) affirmed.
So this is what motivated us to focus more on studies carried out on the measurement of
value creation on quantitative criteria, but after examining them, we have noticed that there
are few studies which were conducted on the actual financial performance of external growth
strategy, including strategic alliances and also few comparative studies on these two types of
acquisitions where the primary focus of our research which contributes to a better

4
understanding of questions concerning the motivations to conclude strategic alliances and
mergers and acquisitions, and to conduct a comparative study.
The results so far are controversial and uncertain, therefore, the interest in identifying the
nature of the impact of strategic alliances and mergers and acquisitions on the financial
performance where the second interest is to measure the impact strategic alliances and
mergers and acquisitions on financial performance (reduced to the creation of financial value).
The choice of this thesis is not a coincidence, but rather a motivation to answer questions of
(Aliouat, 1996). Aliouat, after analyzing the results of empirical studies on the impact of
acquisitions announcements on market value where he has seen the impact was positive, made
the following two questions:
- For a more or less distant horizon, would the market performance of acquisitions
coincide with the actual performance?
- Does the confirmation of hypotheses formulated and verified by the authors remain
valid for the case of alliances?
Hence the formulation of the following problem:
What is the impact of a strategic partnership on the financial performance of the company?
The answer to this problem requires the response to the two following research questions:
- Does the announcement of a strategic partnership have an impact on the market
valuation?
- Does the conclusion of a strategic partnership have an impact on the real financial
value in the long term?
1.1. Theoretical framework
To answer our two research questions we absolutely must refer to some particular theoretical
current, the theory of market efficiency, the agency theory, the theory of transaction costs and
the theory of resources.

5
We have formulated 1 hypothesis on the impact of the announcement on the stock market
valuation from the theory of market efficiency (Fama, 1965) and agency theory (Jensen and
Ruback effect, 1983). And for H2 to H6 assumptions based on the theory of transaction costs
(Coase, 1937, Williamson, 1985) and the theory of resources (RBV) (Penrose, 1959);
(Wernerfelt, 1984) and (Barney, 1991). These two theoretical currents meet competitive
strategy described by (Batsch, 1999).
1.2. Previous empirical work
Given that there is little practically few research on the financial performance of strategic
partnerships, our research builds on previous studies including strategic alliances and mergers
and acquisitions that show positive and negative effects.
Regarding work on the market performance, in the case of M & A either in France or beyond,
we notice a positive impact in contrast to strategic alliances. For work on actual financial
performance, the results are rather mixed either for Strategic Alliances (SA) or Mergers and
Acquisitions (M & A).
The following tables list the main previous research:

6
Results References on the market performance
Mergers and Acquisitions
(M & A)
Positif impact
In France: (Saci, 2013) ; (Hubler and Meschi, 2000)
Anglo-xaxons works : (Dodd, 1980) ; (Travlos, 1987) ;
(Huang and Walkling, 1987) ; (Doukas and Travlos,
1988); (Jennings and Mazzeo, 1991) ; (Markides and
Oyon, 1998)
Strategic Alliances (SA)
Negative impact or neutral
In France: (Saci, 2013) ; (Hubler and Meschi, 2000)
Anglo-xaxons works : (Mac Connel and Nontell, 1985) ;
(Finnerty and All, 1986) ; (Lee and Wyatt, 1990); (Koh
and Venkatramen, 1991) ; (Reuer and Miller, 1997) ;
(Jacquot and Koehl, 1998) ; (Das and al, 1998)
Results References on the actual financial performance
Mergers and Acquisitions
(M & A)
Mixed results
(Saci, 2013) ; (Paik, 2005); (Camerlynck Ooghe and De
Langhe, 2005); (Yook, 2004); (Park, 2003); (Silhan and
Howard, 1986) ; (Perdreau, 1998); (Harrison and al.,
1991);
Strategic Alliances (SA)
Mixed results
(Saci, 2013) ; (Paik, 2005); (Combs and Ketchen, 1999) ;
(Lorenzoni and Lipparini, 1999) ; (Reuer and Miller,
1997) ; (Deeds and Hill, 1996) ; (Park, 1997); (Baum and
al., 2000) ; (Park and Dong-Sung, 1997)

7
1.3. Research model, assumptions and definition of variables
1.3.1. Research model
We adopt the following model:
Financial Performance = creation of financial value = constant + variable Strategic
Partnership (PS) + control variables
Hence the following linear regression for the Strategic Partnership (PS):
PFit = ß0+ ß1*APSP + ß2* OpPrMargin + ß3* CostGS + ß4* Fsales + ß5* Sales + ß6
Fsales_Sales + ß7 NPART + ß8N + ß9S +ε.
Therefore, these findings led to the following hypothesis.
1.3.2. Assumptions or hypothesis
H1: There is a positive relationship between the announcement effect of a strategic
partnership and market value.
H2: The increase in the margin on operating income has a positive impact on financial
performance in a strategic partnership.
H3: The increase in turnover realized abroad has a positive impact on financial performance
in a strategic partnership.
H4: The increase in annual sales (turnover) has a positive impact on financial performance
in a strategic partnership.
H5: Increased variation sales abroad to total sales has a positive impact on financial
performance in a strategic partnership.

8
H6: The increase in the number of employees has a negative impact on financial
performance in a strategic partnership.
1.3.3. Definition of variables
The choice of variables is done referring to the work of some authors as (Saci, 2013) and
(Meschi and Hubler, 2000) to measure the market performance where they chose the RAM as
dependent variable and the presence / absence as explanatory variable and the research work
of (Saci, 2013) who has chosen ROA, ROE, PBR as dependent variable and the operating
profit margin on the sales realized abroad, the change in turnover realized abroad as
compared to total turnover and number of employees as explanatory variables and the work of
(Harrison and al., 1991) where they chose ROA as dependent variable and capital, debt, the
intensity of research and development and general and administrative expenses of sale, as
explanatory variable.
Dependent variables Explanatory variables Control variables
- AR: abnormal return
- CAR: cumulative abnormal
return
- AAR: average abnormal return
(test de Student)
- ACAR: average cumulative
abnormal return
- ROA: return on asset
- ROE: return on equity
- PBR : Price to book ratio
- APPS: absence/presence
of SP
- OPPRMAR : Operating
Profit Margin
- CostGS: Cost Of Goods
Sold
- Fsales : Foreign Sales
- Sales
- Variation Fsales/Sales
- N : number of employees
- S : sectors
- NPART : number
of partners
9
2. Sample and research methodology
2.1. Construction of the sample, data selection and descriptive statistics
In the case of our study, we have used accounting and financial data (secondary data),
including Thomson One Banker, Datastream, Diane; reference documents of companies
(published and updated on the website of the Autorité des marchés financiers (AMF)); the
companies' annual reports (available on their website); economic and trade press (including
"les Echos" years between 1997 and 2011, Boursier.com, Capital.fr, Usine Nouvelle,
Expansion, Le Figaro, the Point.fr ...), websites (via Google).
We have also used our personal network and that of the laboratory. In this respect, we
contacted several researchers and specialists.
We have established a sample of 48 strategic partnerships selected from the SBF 250 French
companies (on Euronext Paris) and we used historical market and financial data between 1997
and 2012. For our study is made on a longitudinal period of seven (07) years, three (03) years
before the strategic partnership, the year of the strategic partnership and three (03) years after
the strategic partnership, (Cornett and Tehranian, 1992).
Descriptive statistics
Ranking of strategic partnerships (SP) according to current nomenclature of NYSE Euronext
Paris:
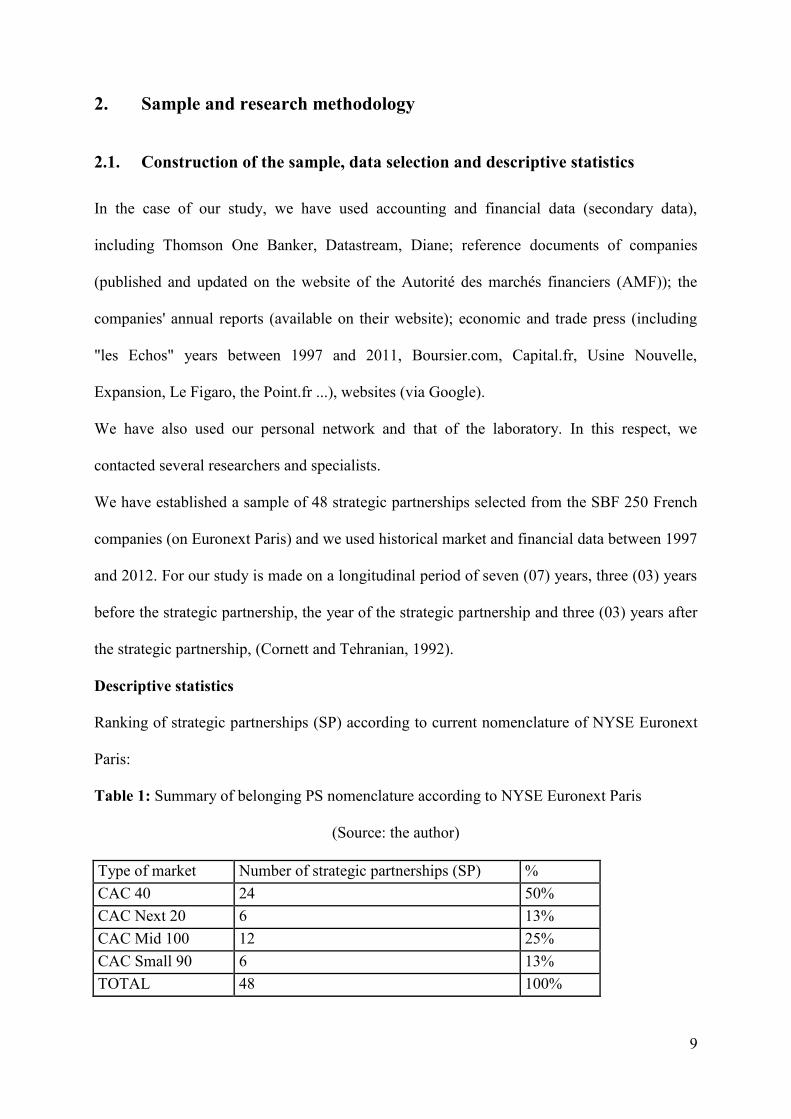
Table 1: Summary of belonging PS nomenclature according to NYSE Euronext Paris
(Source: the author)
Type of market Number of strategic partnerships (SP) %
CAC 40 24 50%
CAC Next 20 6 13%
CAC Mid 100 12 25%
CAC Small 90 6 13%
TOTAL 48 100%

10
Table 2: Number of PS operations by business segment (sectors)
Code
Sector
Number PS
%
Amount turnover
in M €
%
1 Automobile 2 4% 483,403163 2%
2 Pharmaceutical and
chemistry 1 2% 2332,62614 8%
3 Aerospace end transport 5 10% 1560,18239 5%
4
Telecom, Internet,
Electronics, IT and services 17 35% 5882,51112 19%
5 Banking and insurance 6 13% 16345,2892 53%
6 Energy and construction 3 6% 2446,81391 8%
7 Tourism 3 6% 976,602792 3%
8 Distribution et Industry 11 23% 959,124617 3%
TOTAL 48 100% 30986,5533 100%
It is very important to analyze accounting data and financial ratios before to calculating their
variation. This allows us to have an overview of the characteristics of our sample noting that
ROA, ROE and PBR variables are in percent (%), variables, OPPRMAR, COSTGS,
FSALES, SALES are in millions of euros (€) FSALES_SALES as coefficient and N is the
number of employees.
2.2. Methodology and data analysis
To answer to our problem, our choice is based on epistemological positivism based on a
quantitative approach by adopting a hypothetical-deductive approach (assumptions, tests).
To analyze the data, we used the Student4 test for the study of events and tests on panel data
estimation on STATA and RATS.
In our work, the study of the measure of value creation relates only to the extent of creating
financial value. We then propose the results of the correlation study and those of the three
regressions models developed for measuring the creation of real value.
4 The Student test was performed on the results calculated using the market model

11
In order to have a solid basis for our analysis, we referred to earlier work (Saci, 2013);
(Barber and Lyon, 1997) and (Meschi and Hubler, 2000) for measuring the market value
creation and work of (Saci, 2013); (Park, 2003); (Yook, 2004); (Harrison and al., 1991);
(Camerlynck Ooghe and De Langhe, 2005), and the use of databases DATASTREAM,
Thomson One Banker and Diane to collect as much data about the companies in our sample.
Triangulation of methods allows the confirmation of the empirical contribution of our thesis.
Using the method of event study and regression method for estimating panel data, analyzing
different data highlights this triangulation methods.
These different ways of triangulation, namely theoretical triangulation, triangulation of data
sources and triangulation methods allow to increase the validity and reliability of the analysis
(Miles and Huberman, 2003). They are intended to ensure a better quality of analysis by
crossing data and studies.
2.2.1. Correlation tests
Table 3 shows the pairwise correlations of the variables in our study. These measures show
the quality of our model and the absence of collinearity problems of independent variables.
Table 3: Correlations
ROA ROE PBR Opprmar Costgs Fsales Sales FSales-
sales
N
ROA 1.0000
ROE 0.6163 1.0000
PBR 0.3094 0.2380 1.0000
Opprmar 0.6514 0.3733 0.1734 1.0000
Costgs 0.1053 0.1050 0.0419 0.0001 1.0000
FSales 0.2443 0.2908 0.1790 0.1966 0.3160 1.0000
Sales 0.2710 0.3044 0.1790 0.2635 0.3412 0.7607 1.0000
FSales_sal
es
-0.0802 -0.0302 -0.0316 -0.0854 -0.0033 0.0096 -0.0057 1.0000
N 0.1396 0.2097 0.1588 0.0937 0.3680 0.4955 0.6335 0.0050 1.000
0
12
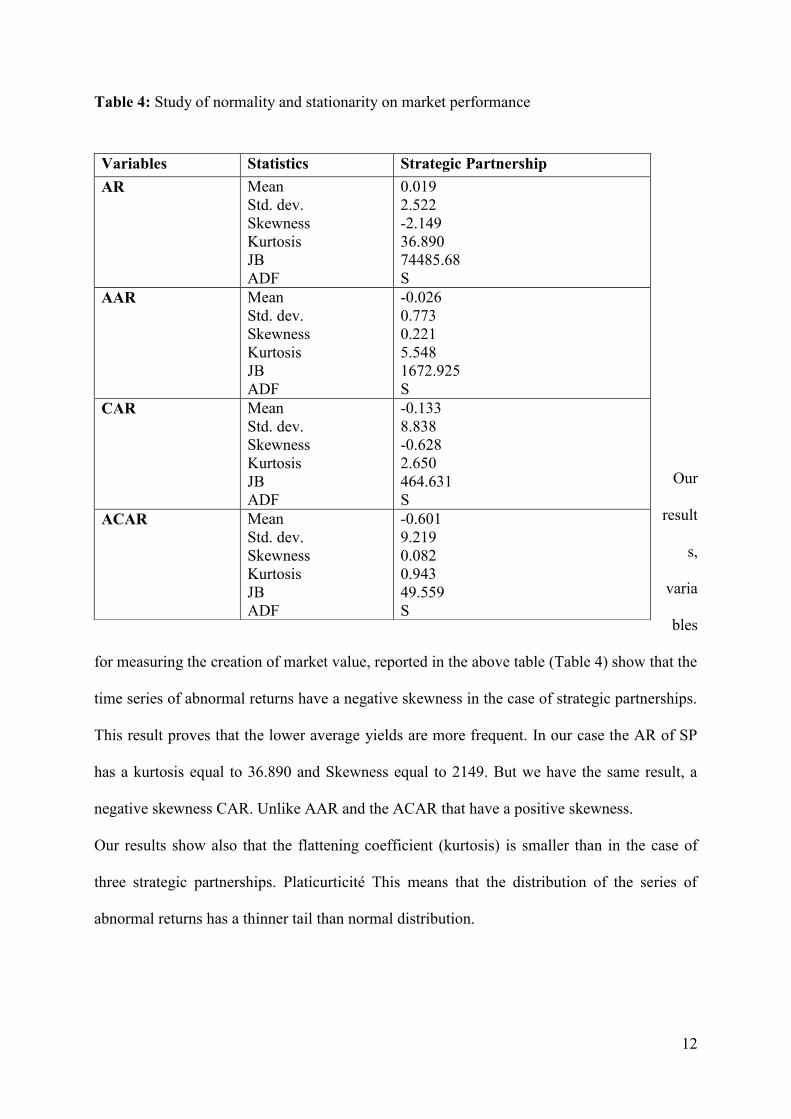
Table 4: Study of normality and stationarity on market performance
Our
result
s,
varia
bles
for measuring the creation of market value, reported in the above table (Table 4) show that the
time series of abnormal returns have a negative skewness in the case of strategic partnerships.
This result proves that the lower average yields are more frequent. In our case the AR of SP
has a kurtosis equal to 36.890 and Skewness equal to 2149. But we have the same result, a
negative skewness CAR. Unlike AAR and the ACAR that have a positive skewness.
Our results show also that the flattening coefficient (kurtosis) is smaller than in the case of
three strategic partnerships. Platicurticité This means that the distribution of the series of
abnormal returns has a thinner tail than normal distribution.
Variables Statistics Strategic Partnership
AR Mean
Std. dev.
Skewness
Kurtosis
JB
ADF
0.019
2.522
-2.149
36.890
74485.68
S
AAR Mean
Std. dev.
Skewness
Kurtosis
JB
ADF
-0.026
0.773
0.221
5.548
1672.925
S
CAR Mean
Std. dev.
Skewness
Kurtosis
JB
ADF
-0.133
8.838
-0.628
2.650
464.631
S
ACAR Mean
Std. dev.
Skewness
Kurtosis
JB
ADF
-0.601
9.219
0.082
0.943
49.559
S
13
In summary, from the results of Jarque Bera (1980), we find a negative impact of the
announcement of a strategic partnership. These results will be logically confirmed with the
study of the Student test below.
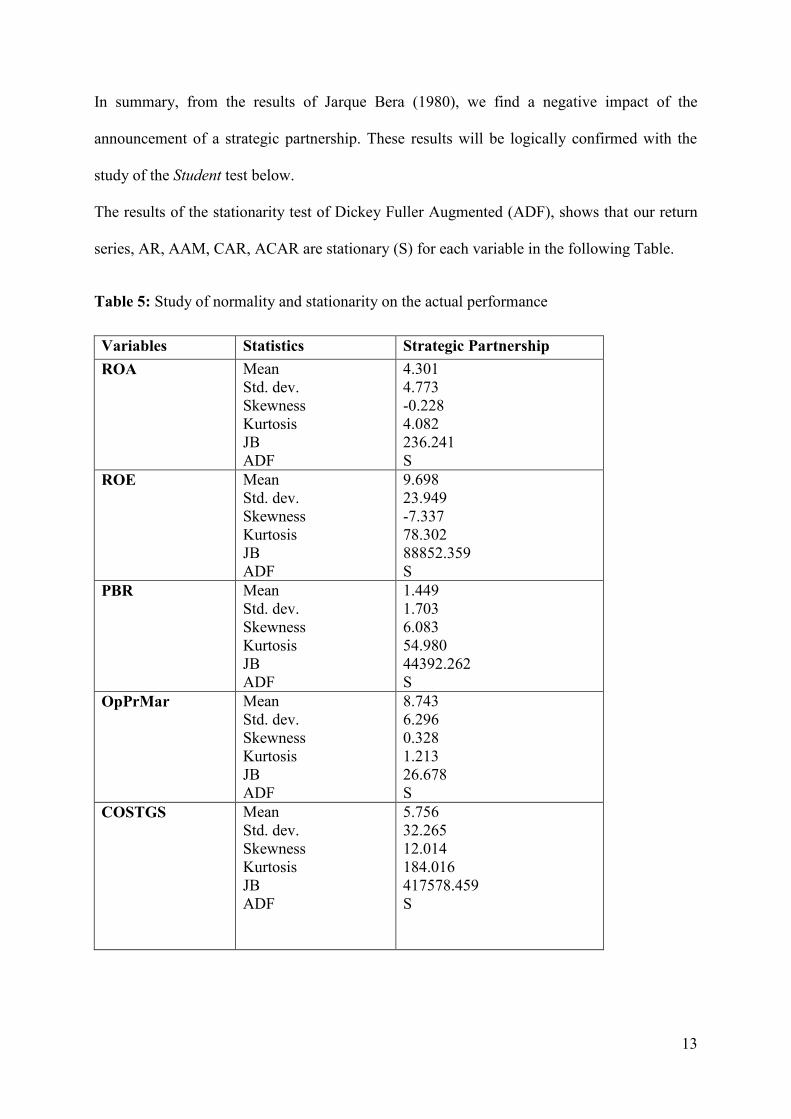
The results of the stationarity test of Dickey Fuller Augmented (ADF), shows that our return
series, AR, AAM, CAR, ACAR are stationary (S) for each variable in the following Table.
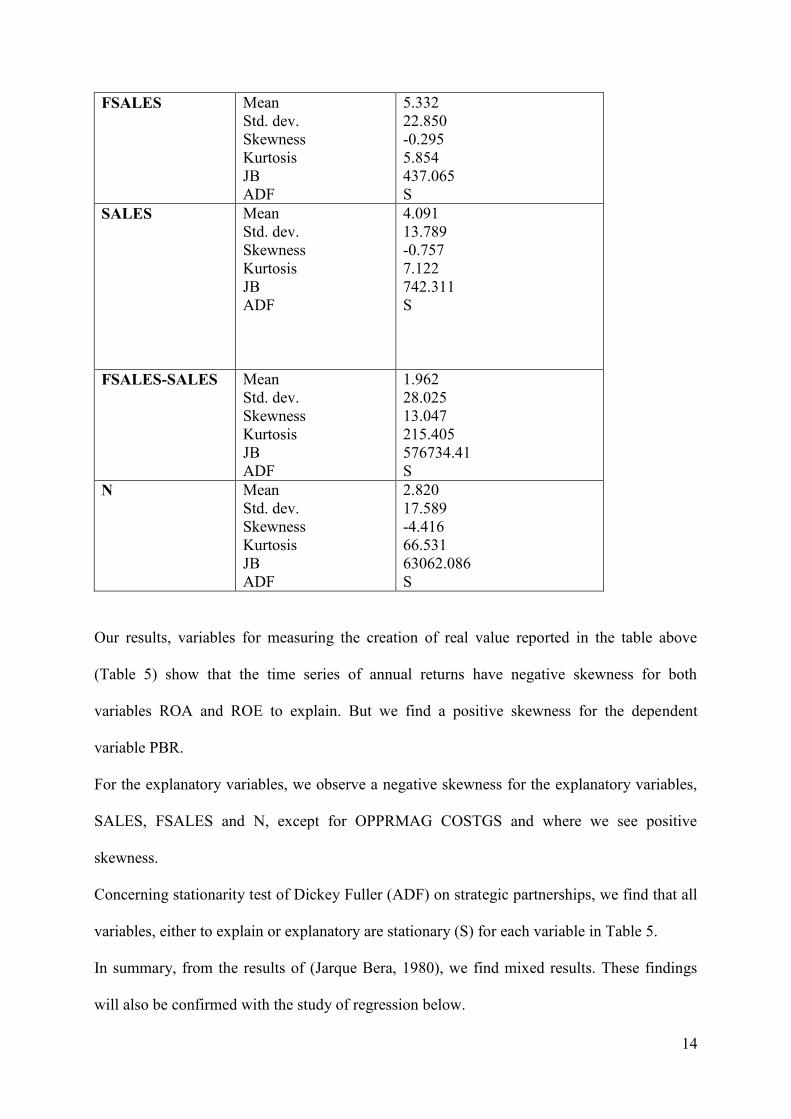
Table 5: Study of normality and stationarity on the actual performance
Variables Statistics Strategic Partnership
ROA Mean
Std. dev.
Skewness
Kurtosis
JB
ADF
4.301
4.773
-0.228
4.082
236.241
S
ROE Mean
Std. dev.
Skewness
Kurtosis
JB
ADF
9.698
23.949
-7.337
78.302
88852.359
S
PBR Mean
Std. dev.
Skewness
Kurtosis
JB
ADF
1.449
1.703
6.083
54.980
44392.262
S
OpPrMar
Mean
Std. dev.
Skewness
Kurtosis
JB
ADF
8.743
6.296
0.328
1.213
26.678
S
COSTGS Mean
Std. dev.
Skewness
Kurtosis
JB
ADF
5.756
32.265
12.014
184.016
417578.459
S
14
FSALES Mean
Std. dev.
Skewness
Kurtosis
JB
ADF
5.332
22.850
-0.295
5.854
437.065
S
SALES Mean
Std. dev.
Skewness
Kurtosis
JB
ADF
4.091
13.789
-0.757
7.122
742.311
S
FSALES-SALES
Mean
Std. dev.
Skewness
Kurtosis
JB
ADF
1.962
28.025
13.047
215.405
576734.41
S
N Mean
Std. dev.
Skewness
Kurtosis
JB
ADF
2.820
17.589
-4.416
66.531
63062.086
S
Our results, variables for measuring the creation of real value reported in the table above
(Table 5) show that the time series of annual returns have negative skewness for both
variables ROA and ROE to explain. But we find a positive skewness for the dependent
variable PBR.
For the explanatory variables, we observe a negative skewness for the explanatory variables,
SALES, FSALES and N, except for OPPRMAG COSTGS and where we see positive
skewness.
Concerning stationarity test of Dickey Fuller (ADF) on strategic partnerships, we find that all
variables, either to explain or explanatory are stationary (S) for each variable in Table 5.
In summary, from the results of (Jarque Bera, 1980), we find mixed results. These findings
will also be confirmed with the study of regression below.
15
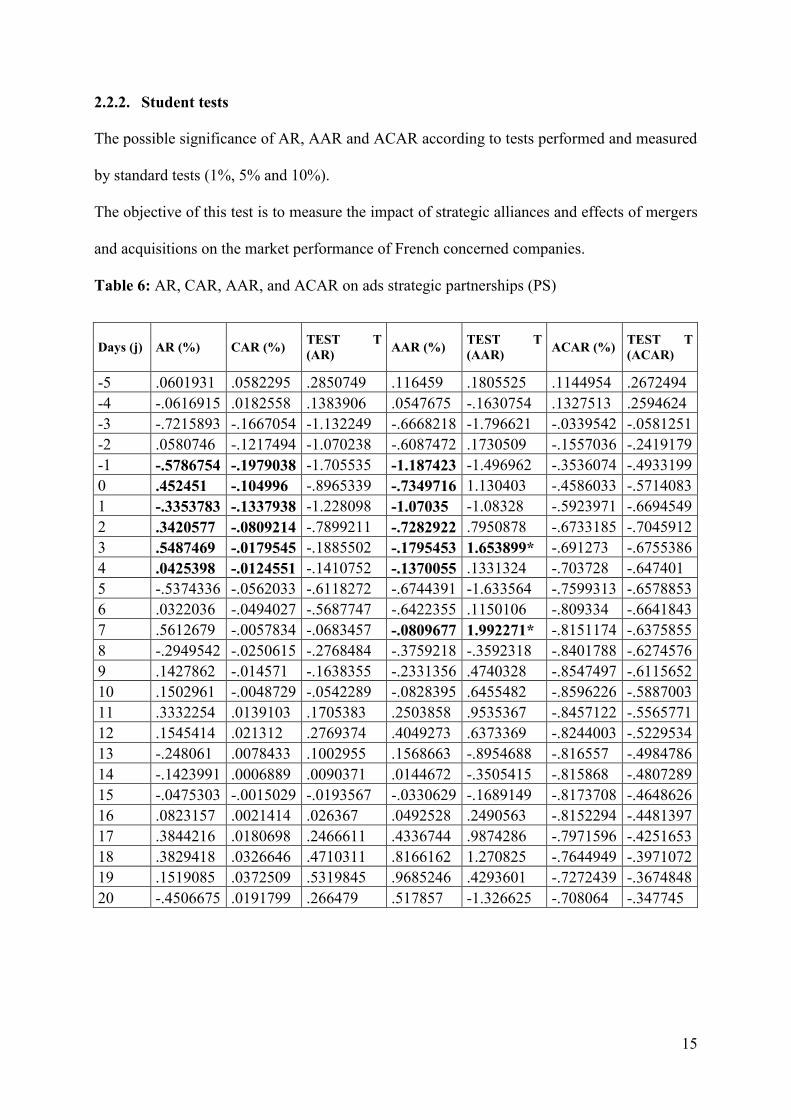
2.2.2. Student tests
The possible significance of AR, AAR and ACAR according to tests performed and measured
by standard tests (1%, 5% and 10%).
The objective of this test is to measure the impact of strategic alliances and effects of mergers
and acquisitions on the market performance of French concerned companies.
Table 6: AR, CAR, AAR, and ACAR on ads strategic partnerships (PS)
Days (j) AR (%) CAR (%) TEST T
(AR) AAR (%)
TEST T
(AAR) ACAR (%)
TEST T
(ACAR)
-5 .0601931 .0582295 .2850749 .116459 .1805525 .1144954 .2672494
-4 -.0616915 .0182558 .1383906 .0547675 -.1630754 .1327513 .2594624
-3 -.7215893 -.1667054 -1.132249 -.6668218 -1.796621 -.0339542 -.0581251
-2 .0580746 -.1217494 -1.070238 -.6087472 .1730509 -.1557036 -.2419179
-1 -.5786754 -.1979038 -1.705535 -1.187423 -1.496962 -.3536074 -.4933199
0 .452451 -.104996 -.8965339 -.7349716 1.130403 -.4586033 -.5714083
1 -.3353783 -.1337938 -1.228098 -1.07035 -1.08328 -.5923971 -.6694549
2 .3420577 -.0809214 -.7899211 -.7282922 .7950878 -.6733185 -.7045912
3 .5487469 -.0179545 -.1885502 -.1795453 1.653899* -.691273 -.6755386
4 .0425398 -.0124551 -.1410752 -.1370055 .1331324 -.703728 -.647401
5 -.5374336 -.0562033 -.6118272 -.6744391 -1.633564 -.7599313 -.6578853
6 .0322036 -.0494027 -.5687747 -.6422355 .1150106 -.809334 -.6641843
7 .5612679 -.0057834 -.0683457 -.0809677 1.992271* -.8151174 -.6375855
8 -.2949542 -.0250615 -.2768484 -.3759218 -.3592318 -.8401788 -.6274576
9 .1427862 -.014571 -.1638355 -.2331356 .4740328 -.8547497 -.6115652
10 .1502961 -.0048729 -.0542289 -.0828395 .6455482 -.8596226 -.5887003
11 .3332254 .0139103 .1705383 .2503858 .9535367 -.8457122 -.5565771
12 .1545414 .021312 .2769374 .4049273 .6373369 -.8244003 -.5229534
13 -.248061 .0078433 .1002955 .1568663 -.8954688 -.816557 -.4984786
14 -.1423991 .0006889 .0090371 .0144672 -.3505415 -.815868 -.4807289
15 -.0475303 -.0015029 -.0193567 -.0330629 -.1689149 -.8173708 -.4648626
16 .0823157 .0021414 .026367 .0492528 .2490563 -.8152294 -.4481397
17 .3844216 .0180698 .2466611 .4336744 .9874286 -.7971596 -.4251653
18 .3829418 .0326646 .4710311 .8166162 1.270825 -.7644949 -.3971072
19 .1519085 .0372509 .5319845 .9685246 .4293601 -.7272439 -.3674848
20 -.4506675 .0191799 .266479 .517857 -1.326625 -.708064 -.347745

16
Figure 1: AAC5 and ACAR
6 on ads strategic partnerships (PS)
Figure 2: AAR and ACAR on ads strategic partnerships (PS) by sectors (s)
5 AAC in the Figure 1 and Figure 2 is RAM in French
6 ACAR in the Figure 1 and Figure 2 is RAMC in French
AAR ACAR
AAR ACAR

17
The announcements of strategic partnerships in general, the analysis of the AAR shows a
significant and negative impact on the third and seventh day after the announcement (-0.197
and -0.080, respectively), but actually the reactions are positive, since the AAR increases.
Throughout the event window, we note that the average abnormal returns (AAR) down to -5 j
= j = -1, with j = 0, a positive market reaction is noted (the passage of RA -0.57 to 0.45
between j = -1 and j = 0). From j = 0 to j = 7, we notice positive reactions in general. Then,
we notice some positive reactions, sometimes negative.
If a negative impact on stock prices is associated with strategic partnerships, it seems that this
is the form of partnership it himself that his announcement is the consequent of the market
reaction.
AAR ACAR

18
Anticipating the stock market annones of strategic partnerships is indeed on seeing the results
of our research. A significant negative impact is recorded days (03) days after the
announcement, and average abnormal returns (AAR) increases.
Referring to the research of (Saci, 2013) and (Hubler and Meschi, 2000) and the conclusion of
our results, we can say that the information on the outcome of strategic partnerships managed
gradually to large financial players part before the actual announcement to the public by the
press. And therefore the information is already taken by financial actors to calculate stock
prices and this is why we see just a single positive market reaction on the day (j = 3) (0.548%)
for AR contrary to the results of mergers and acquisitions, we find average abnormal returns
are generally positive.
We have kept the advice of (Hubler and Meschi, 2000) on the enlargement of the event
window to see if average cumulative abnormal returns continue to be degraded, and noting
that (Hubler and Meschi, 2000) chose an event window [j – 10, j +10].
For this, we chose to expand our event window to j+20 after the announcement of the event to
see the evolution of the average cumulative abnormal returns. We find that the average
cumulative abnormal returns (ACAR) are read in less stable.
After analyzing our results by sector of activity, we find positive reactions to Sector 1 and 7,
respectively automotive and tourism sector.
2.2.3. Regression tests
Table 7: Results of regressions PS (before the strategic partnership)

19
PFit = ß0+ ß1*APPS + ß2* OpPrMargin + ß3* CostGS + ß4* Fsales + ß5* Sales + ß6
Fsales_Sales + ß7 NPART + ß8N + ß9S +ε.
ROA ROE PBR
Coeff P- value Coeff P- value Coeff P- value
OpPrMargi
n
.6431136 0.000*** 2.103043 0.000*** .1977354 0.001***
CostGS .0351271 0.001*** .1138987 0.004*** .0089347 0.079*
Fsales .0028346 0.904 -.0126309 0.884 -.0049775 0.664
Sales -.1317093 0.009*** -.2774761 0.130 -.0783795 0.002***
Fsales_Sale
s
.0189309 0.383 .0543708 0.495 .0061488 0.561
N .0352519 0.245 .0395938 0.721 .0083583 0.571
Table 8: Results of regressions PS (after the strategic partnership)
PFit = ß0+ ß1*APSP + ß2* OpPrMargin + ß3* CostGS + ß4* Fsales + ß5* Sales + ß6
Fsales_Sales + ß7 NPART + ß8N + ß9S +ε.
ROA ROE PBR
Coeff P- value Coeff P- value Coeff P- value
OpPrMargin .7976695 0.000*** 2.350536 0.001*** .0178243 0.202
CostGS .0890309 0.041 ** .5488935 0.172 -.0064289 0.406
Fsales -.0216294 0.152 -.148948 0.286 .0034776 0.198
Sales -.0804934 0.105* -.3245798 0.479 .0005398 0.951
Fsales_Sales -.0047397 0.451 -.0095313 0.870 .000214 0.849
N -.0204002 0.142 -.0681197 0.595 .0008943 0.718
In case in which the company enters into a strategic partnership, reading linear regressions
before and after the strategic partnership shows that there are some effects more or less
significant after the partnership by making a comparison between the two tables of
regressions before and after the strategic partnership.
We find for the dependent variable ROA, a significant positive impact for OpPrMargin,
CostGS and Sales with significance levels respectively 1%, 5% and 10%.
Another significant positive impact for the predictor variable OpPrMargin to explain ROE
(coefficient = 2.350) for a significance level of 1.
Finally, for the dependent variable PBR, we are not seeing any impact of the explanatory
variables.

20
3. Analysis of the results (Student's t test and estimation of panel data)
3.1. In the short term
Negative impact of a strategic partnership on market performance. We note that our results on
the market performance of strategic partnerships are consistent with those of (Saci, 2013) and
(Hubled and Meschi, 2000) on the stock market performance of strategic alliances.
3.2. In the long term
Strategic partnerships (SP) have no impact on creating real financial value of the company.
Compared to our assumptions, we reject the hypothesis suggesting the existence of a positive
relationship between the conclusion of the Strategic partnership and the creation of financial
value, because we have only H2 is validated.
4. Discussion
4.1. Discussion of results on the creation of market value
Our results, in which market quotations are used to measure short-term performance, suggest
throughout that the financial markets seem to be indifferent to announcements of strategic
partnerships. However, in large part, mergers and acquisitions are seen as good news by the
financial actors (Saci, 2013) and (Hubler & Meschi, 2000).
Strategic partnerships are not seen as good news in general if we refer to the logic of (Hubler
and Meschi, 2000).
However, when we analyzed our results by sector, we found that for the automotive sector
(1), the impact of the announcements on the SP market value is positive and significant. The
same results are observed, but with less importance in the aerospace and transportation sectors
(3) tourism (7) and the distribution and industry sector (8).

21
Which is difficult to explain without further details. (Koh and Venkataraman, 1991) have
observed weak positive market reactions (but not statistically significant) to the
announcement of strategic alliances, but provided no explanation for this observation, and it
may also be due to the business. Similarly, (Das and Seng, 1988) in their work "Impact of
Strategic Alliances on firm valuation", have found a positive impact on the technological
alliances ads, while marketing alliances are seen as neither good, nor bad.
4.2. Discussion of results on the creation of real value
The comparative reading of the theoretical literature and the empirical one shows that
strategic partnerships are practices that can generate both positive and negative effects. This
observation led us to assume that the combined effect of the alignment of interests and
inefficiencies own strategic partnerships is likely to create a net neutral effect on creating
financial value of the company.
Through empirical studies cited below concerning external growth strategies, including
strategic alliances and mergers and acquisitions, we find notice in one hand, the impact of
strategic partnerships on creating financial value is neutral on the other hand, the results of
(Saci, 2013) and that of (Yook, 2004), who has worked on the development of the EVA after
the acquisitions operations indicate that the improved operating performance is ruined by the
costs capital of large premiums paid to the target company, and therefore, acquisitions do not
create real economic gains for shareholders of the acquiring company.
We stipulate that strategic partnerships create financial value, but it is destroyed in part by the
costs incurred by them as well as other negative effects (Yook, 2004).
In conclusion, the absence of the impact of the strategic partnership (SP) on financial
performance can be explained as follows:
- The impact of strategic partnership (SP) may be combined to give a total net neutral
effect on performance;
22
- The negative effects absorb the potential gains from strategic partnership (SP)
(creating compensatory value);
- As we integrated the different costs, we can explain this neutrality of the performance
by what may call the creation of compensatory value: companies anticipate a decrease
in their income (due to the loss of a contract for example) will result in lower revenues
or a possible new charge and to compensate for these losses, the companies are opting
for strategic alliances and mergers and acquisitions (financial and strategic intent);
- Intentions to use strategic partnerships (SP) are ultimately intentions other than
financial intentions, as our results show that the creation of financial value is minimal,
or even neutral (financial intent minima).
Conclusion
The analysis of the problem of measuring the financial value creation through strategic
partnerships (SP) remains a field of study rarely treated in a French context, including the
extent of creating long-term value. This finding is one of the main interests that motivated this
research whose objective was to contribute to a better understanding of the financial value
creation of strategic partnerships (PS) of French listed companies.
The contributions of our research: On the theoretical contributions. We have conducted a
study on the actual performance of strategic partnerships (PS); we proposed a research model
with new variables and finally a theoretical framework with four streams. In terms of
methodological contributions: We conducted a study on two different periods and with an
econometric approach based on two types of tests.
Search terms: sample and limited period of study; unavailability of details of the financial
statements and the absence of moderating variables.

23
Research perspectives:
- A study with other variables to explain and more explanatory variables (out, R & D
costs, longevity, patents, etc..) to refine the analysis of the financial impact;
- A two-dimensional study taking into account the two levels of analysis within a single
empirical study (complete our study with interviews with managers of the companies
in our sample);
- A study to ascertain possible causal relationship between a strategic partnership (SP)
and the creation of financial value realized (effect on sequence comparisons).
References
Albouy, M. (2006). Théorie, applications et limites de la mesure de la création de valeur.
Revue Française de Gestion, 32, 160-175.
Aliouat, B., & Taghzouti, A. (2009). Vers un pilotage des alliances stratégiques par des
méthodes perceptives de la valeur. 18ième
Conférence AIMS, Grenoble, 3-4-5 Juin.
Aliouat, B. (1996). Les stratégies de coopération industrielle, Economica, Paris.
Anand, B.N., & Khanna T. (2000). Do Firms Learn to Create Value? The Case of Alliances.
Strategic Management Journal, 21, 295-315.
Barber, B.M., & Lyon J.D. (1997). Detecting Long-Run Abnormal Stock Returns: The
Empirical Power and Specification of Test Statistics. Journal of Financial Economics, 43,
341-372.
Barney, G.B. (1991). Firm Resource and Sustainable Competitive Advantage. Journal of
Management, 17, 99-120.
Batsch, L. (1999). Finance et stratégie. Economica.
Caby, J., & Hirigoyen G. (2001). La création de valeur de l’Entreprise. Economica.

24
Camerlynck, J., Ooghe, H., & De Langhe, T. (2005). Pre-Acquisition Profile of Privately
Held Companies Involved in Take-Overs: An Empirical Study. Small Business Economics,
24(2), 169-186.
Coase, R.H. (1937). The nature of the firm. Economica (New Series), IV (13-16), November,
386-405.
Combs, J. G., & Ketchen, D.J. (1999). Explaining Interfirm Cooperation and Performance:
Toward a Reconciliation of Predictions from The Resource-based View and Organizational
Economics. Strategic Management Journal, 20(9), 867- 888.
Das, S., & Sen, P.K., & Sengupta, S. (1998). Impact of Strategic Alliances on Firm Valuation.
Academy of Management Journal, 41(1), 27-41.
Doukas, J., Travlos, N.G. (1998). The Effect of Corporate Multinationalism on Shareholders’
Wealth: Evidence from International Acquisitions. The Journal of Finance, 43, 161-175.
Fama, E.F., Fisher, L., Jensen, M., & Roll, R. (1969). The Adjustment of Stock Prices to New
Information. International Economic Review, 10(1), 1-21.
Gilbert, P., & Charpentier, M. (2004). « Comment évaluer la performance RH ? Question
universelle, réponses contingentes. Cahier de recherche GREGOR.
Hitt, M.A, Hoskisson, R.E., Ireland, R.D., & Harrison, J.S. Effects of Acquisitions on R&D
Inputs and Outputs. Academy of Management Journal, 34, 693-706.
Hoarau, C., & Teller R. (2001). Création de valeur et management de l’entreprise. Vuibert,
Paris.
Hubler, J., & Meschi, P-X. (2000). « Alliances, acquisitions et valorisation boursière ». Revue
Français de Gestion, 131, 85-97.
Koh, J., & Venkataramn, N. (1991). Joint Venture Formation and Stock Market Reaction: an
Essessment in The Information Technologiy Sector. Academy of Management Journal, 34(4),
869-892.

25
Miles, M. B., & Huberman A. M. (2003). Analyse des données qualitatives (2ème édition).
De Boeck.
Paik, Y. (2007). Risk Management of Strategic Alliances and Acquisitions between Western
MNCs and Companies in Central Europe. Thunderbird International Business Review, 47(4),
489–511.
Park, C. (2003). Prior Performance Characteristics Of Related And Unrelated Acquirers.
Strategic Management Journal, 24, 471-480.
Park, N.K., & Cho, D.S. (1997). The Effect of Strategic alliances on Performance; A Study of
International Airline Industry. Journal of Air Transport Management, 3(3), 155-164.
Paturel, R. (2011). Pour une refonte du paradigme de la création de valeur. Business
Management Review, 1(2), 14-23.
Paturel, R. (1990). Stratégie de croissance externe. Encyclopédie du Management, Tome 1
Vuibert, 407-418.
Pesqueux, Y. (1991). La comptabilité et les problèmes méthodologiques de sa prétention à
être une science. In Economies et Sociétés, Série Sciences de Gestion, n°16, novembre.
Perret, V., & Séville, M. (2007). Fondement épistémologique de la recherché, In Méthodes de
recherche en management, Thiètard. Ed.nDunod, 13-33.
Saci, F. (2013). La création de valeur des alliances stratégiques et des fusions-acquisitions :
justification comparative par le modèle de mesure de la valeur financière « cas des sociétés du
SBF 250 ». Thèse de doctorat en sciences de gestion, IAE, Nice Sophia Antipolis.
Yook, K.C. (2004). The Measurement of Post-Acquisition Performance Using EVA.
Quarterly Journal of Business & Economics, 42(3) & (4).
Wernerfelt, B. (1984). A Resource-based View of The Firm. Strategic Management Journal,
5(3), 171-180.

26
Wahyuni, S., Ghauri, P., & Karsten, L. (2007). Managing international strategic alliance
relationships. Thunderbird International Business Review, 49(6), 671–687.
Williamson, O.E. (1979). Transaction-cost economics: The governance of contractual
relations. Journal of Law and Economics, 22(2), 233-261.