do solar lamps help children study? - brown university solar lamps help children study? contrary...
TRANSCRIPT
Do Solar Lamps Help Children Study?Contrary Evidence from a Pilot Study in Uganda
Chishio Furukawa†
First Draft: July 2012 This Draft: January 2013
Abstract
Over half a billion children lack adequate lighting and rely on dim,smoky, and dangerous kerosene-based lighting for their evening studies.This paper examines if the brighter, clean, safe, and zero-marginal-costlight of solar lamps enhances children’s learning outcomes. In a ran-domized field experiment, unexpectedly, solar lamps lowered test scoresby 5 points. Given that solar lamps increased reported study time byapproximately 30 minutes, this may be due to flickering from lack of fullcharge that lowered their productivity. The nationwide learning assess-ment survey suggests that solar lamps likely have insignificant effect oneducational attainment.
JEL Classifications: I25, O14, Q55*Special thanks to Andrew Foster for his guidance in economic analysis. I also thank Sriniketh Nagavarapuand David Weil for inspiring this study, and Daniel Prinz for detailed feedback. Hisashi Noma at the Institutefor Statistical Mathematics advised statistical analysis. Uwezo Uganda generously shared their data fromLearning Assessment Surveys. The Brown International Scholars Program 2011-12; and the Barbara AntonInternship Grant from the Pembroke Center for Teaching and Research on Women; and the Center ofEnvironmental Studies at Brown University provided funding for this research. I am indebted to RuthNanteza, Abdulrazaq Nassir, John Ssebayigga, Miho Shinke, and Abdulwahid Ngobya, for their assistancein the fieldwork in Kyannamukaaka, and above all, to the office of Barefoot Power Uganda Ltd., Dirk Kam,Benard Kalyango, Frank Yiga, Joyce Demucci, Annet Nalumansi, and Francis Ejuku, who provided guidanceand supplied the solar lamps. Without their support and co-operation from students, parents, and teachersof the Kyannamukaaka community, this research could not have been completed. All errors are mine.
†Brown University Class of 2012.5, Sc.B. Applied Mathematics-Economics and A.B. Environmental Studies;
Email: [email protected]
1

1 Introduction
Lack of adequate lighting critically undermines children’s ability to study inthe evening and consequently inhibits their performance in the classrooms. Alarge fraction of studies on educational policy interventions has focused on im-proving school environments and student attendance, but not on the householdstudy environment. Previous research has examined, among other things, theimpact of merit scholarship (Kremer et al. 2009) [1], textbooks (Glewwe et al.2009) [2], teacher attendance (Glewwe et al. 2003) [3], midday meals (Vermeer-sch and Kremer 2004, McEwan 2010) [4, 5] deworming (Kremer and Miguel2001), eyeglasses provision (Glewwe et al. 2006) [6], and information on thebenefits of schooling (Jensen 2010) [7]. This paper examines the educationalbenefits of introducing solar panel-charged LED lamps for non-electrified ruralhouseholds.
The Lighting Africa program of the World Bank and the InternationalFinance Cooperation as well as various solar light enterprises advocate forthe provision of solar lamps. They believe that the bright and clean lightcan enhance learning of children who use kerosene-based lighting for theirhomework. Today, approximately 800 million children1 lack access to reliablelighting and rely on dim kerosene candles as their main source of lighting,which inhibits their study through dimness, indoor air pollution, fire risks,and high marginal cost of usage that makes parents unwilling to provide amplekerosene. An abundance of qualitative evidence suggests that solar lamps canbe a potential solution to improving the poor household study environmentsprevalent in Africa and South Asia where electricity is scarce and unreliable.
Using experimental and observational evidence from Uganda, however, thispaper finds no support for this hypothesis. A pilot randomized field exper-iment with 204 participants (including siblings) conducted over a period of
1International Energy Agency [8] reports that there are approximately 2 billion peoplewho do not have access to reliable energy. Given the population composition in developingcountries where those with age under 15 has about 40 percent of the entire population, aback-of-the-envelop would give 800 million. Since not all the children go to schools, thenumber of children who actually study in the evening would be smaller than 800 million.
2

5 months with the most affordable model of solar lamp finds not only noevidence for improvement but also modest evidence for solar lamps loweringchildren’s test scores. Point estimates are approximately -5 for both Englishand mathematics and -16 when specified to students in the top quantile atthe baseline. In this way, the magnitude is much larger for girls, consistentwith results from other studies that girls’ learning achievements depend ontheir study and efforts more than boys’, and for the students with originallyhigh performance, consistent with the explanation that solar lamps affectedthose who study hard. An even more perplexing result is that children withsolar lamps report an average study time of 30 minutes longer per day thanthose left with kerosene – while the estimate is much lower than theirs, alsoconsistent with previous field studies reporting longer study time for childrenwho received solar lightings. There are three possible explanations for thesecontradictory results: (i) significant reporting bias of study time as childrendo not have a watch or clock at home; (ii) decrease in productivity of studydue to the flickering of light when the recharge is done inadequately and thebatteries are low; and (iii) additional factors, such as intra-household dynam-ics that inhibit children from using the lamp that may have led to decrease intest scores. The nationally representative Uwezo Uganda Learning AssessmentSurvey also suggests that children with solar lamps improved their literacy andnumeracy only at similar speed as those with kerosene, failing to support thenotion that solar lamps can help children study.
Nevertheless, these results are far from implying that solar lamps cannothelp in an ideal condition. This study has a number of limitations, includingrelatively small sample size and short observation time. Furthermore, the solarlamps used in this experiment have already been phased out and replaced bythose with brighter LED bulbs and batteries of higher quality. These results,however, do imply three important lessons: first, merely providing solar lampswithout thorough training of users for recharge and maintenance is highlylikely to be ineffective; second, market distribution has likely been contribut-ing to positive selection where only those who are careful and can learn howto use solar lamps actually adopt the technology, implying that scaling up
3

may eventually face a limit; and third, field experiments, in addition to well-controlled laboratory experiments, and measurement of actual outputs (testscores), in addition to inputs (study time), are necessary in order to makeaccurate prediction of robustness and effectiveness of new technologies.
This paper proceeds as follows: section 2 will discuss the background andreview previous literatures; section 3 will explain the details of randomizedevaluation and the learning assessment data; section 4 will present the re-sults from the randomized evaluationand the learning assessment survey; andsection 5 will include some concluding remarks.
2 Lighting and Learning
2.1 Lighting Sources in Rural Uganda
According to the Uwezo Uganda Learning Assessment Survey, over 70 percentof Ugandan households use simple wick kerosene candles, which are the leastcostly source of lighting in the short-run, but provide only around one lumenof light. In contrast, 2 percent use solar lighting, which requires relatively highcapital investment, but provide brighter light of 15 lumens for some options.Electricity users remain as few as 5 percent, and many of them do not haveaccess to a reliable source. (Appendix Table 1)
There are three important pathways through which the use of kerosenecandles can limit students’ study at home. First, the dimness of light canmake children inefficient and less focused on their work. Second, serious airpollution emitted from kerosene candles harms children’s visionary and airquality-related health. Fire risks posed by kerosene candles discourage childrenfrom continuing to study. In a related study (Furukawa 2012) [9], I find thatthe health and safety consequences of using kerosene candles are substantial.Third, the high marginal cost of burning kerosene makes parents unwilling toprovide enough kerosene for children to continue their studies. In a survey ofchildren, “no more kerosene left” (45.74 percent) and “parents told to stop”(21.28 percent) were the second and the third most common reasons for going
4

to bed without completing their homework, after the top reason, being “tootired” (46.81 percent)2.
Until today, there have been few studies that have examined the impact ofsolar lamp provision on the hours of study and found positive impacts. Giventhese results, the World Bank Lighting Africa program suggests “facilities canextend to other potential grants/funds aimed at supporting the health, edu-cation, etc. impact of solar portable lights.” Agoramoorthy and Hsu (2009)report that by using a 5-7 W panel that costs 87.5USD they were able toincrease the average number of study hours per night from 1.47 to 2.71. [10]Although they claim that “this increase in study hours has had a positive in-fluence on students’ performance at school,” they do not present any evidenceof such an improvement. This study furthers these previous studies, first, byusing 1W3 panels costing about 15USD, which is more affordable and scalable,and second, by collecting the students’ test scores.
2.2 What Improves Learning Outcomes
What are the most effective ways to improve children’s learning outcomes?This is the central question that a number of education economists have beenasking in the past decade, both in the context of developing and developedcountries. There are three important pieces of evidence especially relevant toanalyzing the impact of solar lamps on children’s educational outcomes:
First, there is some evidence confirming the causal impact of increasedstudy time on school achievement. The correlation between the two is notentirely driven by omitting variables such as attitude and ability, but thereis likely a significant causality. Using the probability of being paired with aroommate with video games as an instrument, Stinebrickner and Stinebrickner(2007) estimate a large impact of study time and efforts on students’ achieve-ment. [11] Although this paper is concerned with upper primary school stu-
2This survey asked up to three reasons that they stopped studying without completinghomework.
3The study only used 0.5W panels in the first month. However, given that rainy seasoncould be a serious concern for solar lamps’ function, the researchers provided 1W panel lateron.
5

dents, it is likely that students’ study plays a significant role in determiningtheir school learning outcomes.
Second, girls’ achievement is generally more dependent on their study en-vironments and incentives than boys’. In a certification reward randomizedtrial in Israel, Angrist and Lavy (2009) find substantial impact for girls, butnot for boys. [12] This result is consistent with the finding of Anderson (2008)that an early childhood intervention had a substantial impact for girls in bothshort- and long-term, but no effect for boys for long-term. [13] By comparingthe magnitude of effect for girls and boys, this paper aims to further examineif the effect of introducing solar lamps reflects such gender differences.
Third, providing higher incentives is generally more effective than providingbetter study environments in improving children’s learning outcomes. Someof the most successful programs in improving children’s learning outcomesare merit scholarships (Kremer et al. 2004) [1] and financial incentives forinputs (Fryer 2010) [14]. On the other hand, some other programs such asproviding textbooks or midday meals showed positive impact on achievementonly among the subgroup that were more capable of harnessing such resources;only the top quarter improved their test scores from provision of textbooks,and only schools with experienced teachers improved their test scores frommidday meals (Vermeersch and Kremer 2004). [4] At the same time, McEwan(2010) found no evidence of improvement in test scores for midday mealsprovision using a regression discontinuity approach. [5] Deworming program inKenya substantially increased children’s school participation, but had a limitedimpact on their achievements(Miguel and Kremer 2001). [15] Consideringthese pieces of evidence, ex ante, it can be expected that provision of solarlamp may actually have limited impact on children’s achievement.
6

3 Data
This paper combines experimental and observational data from Uganda. Theexperimental data is from a 5-month pilot randomized field experiment byBarefoot Power Uganda Ltd 4 in seven primary schools in Kyannamukaaka,rural Uganda. The observational data is from the Uwezo Uganda LearningAssessment Survey 2011.
3.1 Randomized Evaluation in rural Uganda, 2011
This pilot randomized evaluation was designed to assess if the most affordablesolar lamps can enhance children’s study efforts and increase their test scoresin relatively high maintenance services5. Although it would have been ideal touse a brighter lighting source in order to test the maximum possible benefitof introducing the technology as a pilot study, the $10 solar lamp was chosenbecause it is more scalable and suitable given the funding for this study.
3.1.1 Participants
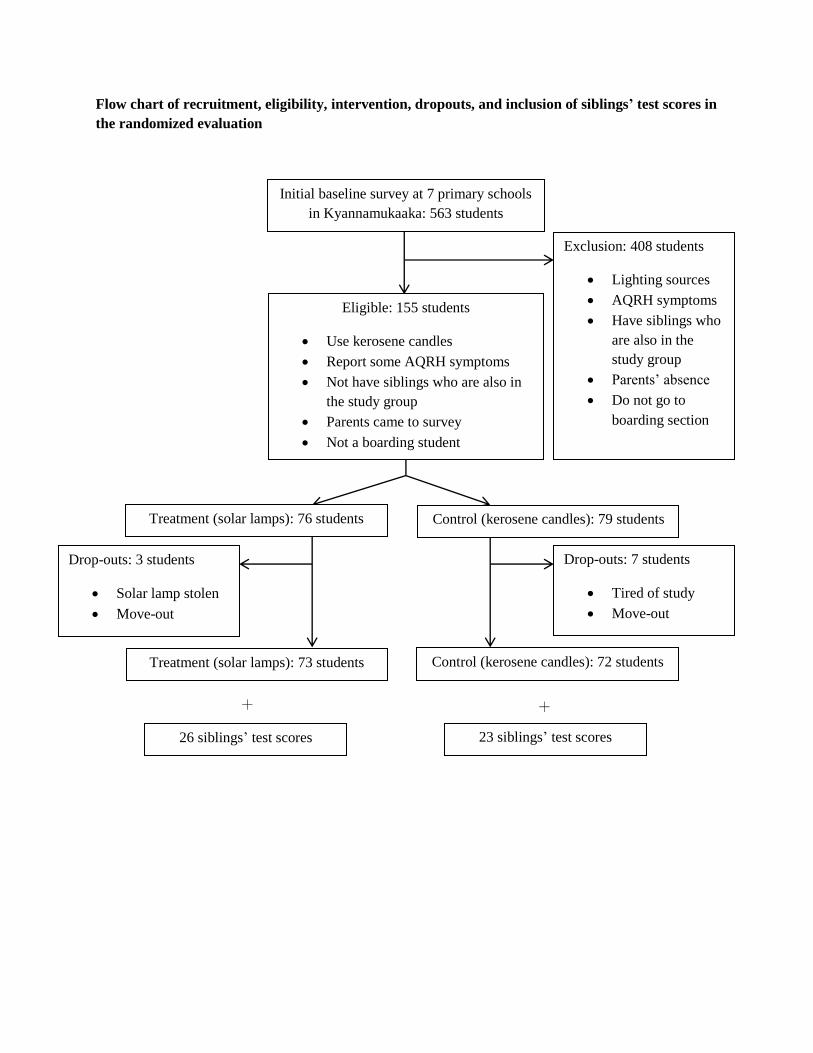
The research team recruited 155 upper primary school students between grades5 and 7. Since this trial also assessed the impact on children’s health, it tar-geted those who reported some respiratory symptoms, like coughing, chestpain, and difficulty breathing during the baseline survey. As a pilot experi-ment, we were not able to conduct any power calculations that would reachstatistical significance. However, to increase the sample size and draw im-plications for the intra-household dynamics of solar lamp usage, the researchteam also collected test scores from siblings of students reported (29 additionalobservations).
4Barefoot Power Uganda Ltd. is a solar lamp enterprise that designs and distributessolar lighting in Uganda. Its major products include the Firefly series, which has variousdegrees of lighting, and the larger-scale PowaPack series. The company received LightingAfrica 2010 Outstanding Product Award. (http://barefootpoweruganda.com/)
5During the resurveys, the surveyors asked if the lamps were functioning well. If thestudent said no, they replaced the students’ lamps with the properly functioning lamps.
7

The additional inclusion criteria included day school students, the usageof kerosene candles as a main lighting source, parents’ participation in thebaseline survey, absence of elder siblings in the study group to avoid within-household spillover effect. (Appendix Figure 1) There was no previous study,thus, power calculation could not be conducted.
3.1.2 Interventions
This research used Firefly 56, which has 5 LED bulbs that collectively pro-vide 15 lumens. Through a public lottery of a coin toss at each school, theteam distributed the lamps to half of the participants (73). One of the researchteam members was officially trained by the Barefoot Power Uganda Microfran-chise Training Program and learned how to teach the users how to charge thelamps. The research team provided training regarding how to use the lamps;demonstrating to put it on the roof or on the ground so that sunrays can hitperpendicularly and conveying to be careful of relatively vulnerable parts suchas the button and the neck. Realizing that a 0.5W panel may not be sufficientfor adequate recharge during the rainy season, the research team supplied 1Wpanels a month after the intervention. For ethical consideration, students inthe control group were also given solar lamps in December upon the conclusionof the study. Since reselling was a potential threat that increases dropouts, theparticipating schools kept the panels at school for the first two weeks so thatchildren would have to bring back the lamps every morning for recharge. Aspanels and lamps were given separately, reselling did not become a large con-cern. To further encourage compliance, the research team replaced the lampswith any faultiness every month after the intervention. About 20 lamps werereplaced in the first month, but after introducing the 1W panels, this came tono more than 10 lamps.
6Firefly 5 is the cheapest option at only $10.
8

3.1.3 Assessments
This research aimed to assess children’s effort level, proxied by reported studytime, and their actual school achievement, proxied by test scores. Students’test scores were reported by school teachers, and their siblings’ test scores werereported by the students themselves, as some siblings were in different schools.There were four periods of test scores reported: the 1st semester’s final examas baseline, the 2nd semester’s final that was 2 months after the intervention,the 3rd semester’s mid-term, which only some schools had, and the end-of-academic year final that grade 7 pupils took at the national level, and grade 5and grade 7 pupils took at each of their schools. Since the nation-wide examwas marked on a scale of 10, it was multiplied by 10 to make the range of testscores consistent.
3.1.4 Limitations: Threats to Internal Validity
There are five major threats to the internal validity of this research: validityof randomization, lack of full recharge, sensitization, differential dropouts, andincome effects. These factors altogether may have underestimated the efficacyand benefits in the ideal situation of solar lamp provision.
1. Validity of Randomization: Table 17 checks the extent to whichrandomization was valid with respect to various underlying household char-acteristics. It confirms that the treatment and control group have jointlyinsignificant differences (F-statistic=0.91) from one another. A few variablesthat show statistically significant differences are uniform ownership, cookingtime, and number of children under 18 living together. However, these do notshow any systematic biases.
2. Lack of Full Recharge: When the solar lamps could not be chargedfully, they shed light only for short periods of time (47 percent report a short-age of light) and experience flickering problems (45 percent report flickeringof light). In these times, some children in the treatment group decided touse kerosene candles again. There was a rainy season between October and
7This table is exactly the same as a related paper (Furukawa 2012).
9

December, which may have further inhibited the recharge process.3. Attenuation (Sensitization among kerosene candle users): After
hearing that kerosene candles were not good for health, some households in thecontrol group purchased electric torches or kerosene lanterns, which providebetter lighting. There were 24 students who reported that they purchasedtorches. This leads to underestimation of positive results and overestimationof negative results.
4. Attrition: There were a few cases of dropouts from the study. One stu-dent in the control group had her best friend who was in the treatment group,and thus, they studied together using solar lighting. One student had his lampstolen. Nevertheless, they were included as the Intention-to-Treat estimationwould be more appropriate than the Treatment-on-Treated estimation.
5. Siblings’ Selection Bias: Since siblings’ test scores depended onstudents’ ability to recall their siblings’ test scores, there is a significant biaswhere siblings’ average test scores were 34.58 point higher than the studentsthemselves. (t=20.7) This difference may be due to reporting or recalling bias.Nevertheless, inclusion or exclusion of the siblings’ test scores did not alter theregression results.
3.2 Uwezo Uganda Learning Assessment Survey 2011
Uwezo Uganda conducts nationwide learning assessment surveys in literacyand numeracy every year since 2009, in order to evaluate the extent to whichchildren are actually learning. They designed primary school level Mathemat-ics and English tests, and collected data from approximately 48,000 householdsin 2011. The survey contains a wealth index, which includes asset informationand basic living conditions, and most importantly, lighting sources.
One limitation is that the survey does not ask the type of solar lamps eachhousehold uses. Therefore, it is difficult to examine if the solar lamps theyuse were the most affordable type or rather the expensive type that has largerpanels and brighter light than the most affordable options.
10

4 Results
4.1 Randomized Evaluation
4.1.1 Test Scores
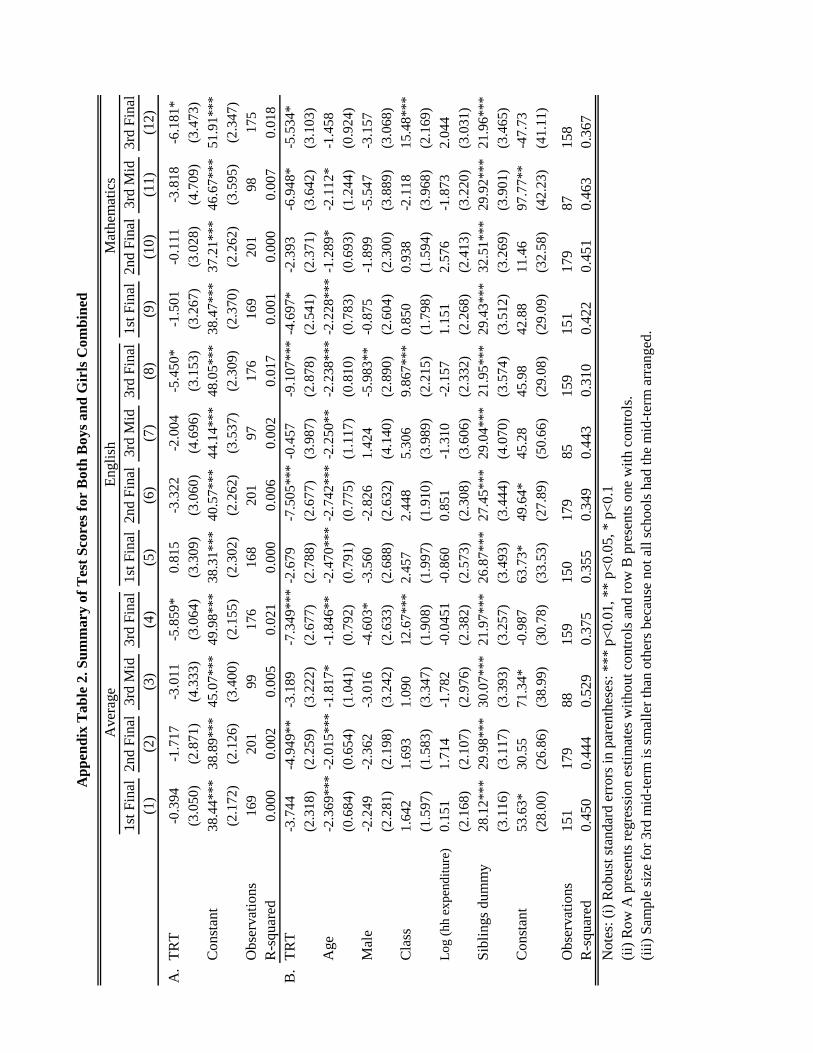
Table 2 presents the summary regression results with respect to each timeperiod as in Equation (1). The control variables are age, gender, class, siblingdummy, and imputed log of household expenditure8.
TestScoreit = α0 + α1TRTit + α2Xit + εit (1)
Since the trial was randomized, the test score before the solar lamp distri-bution is not statistically significantly different. Nevertheless, it is importantto note that there was a large difference of (-3.7) when the control variableswere added. This raises a concern of failure to randomize; the treatment wasweakly correlated with the underlying characteristics so that the point esti-mate also changed. This is due to a small sample size. However, for averagetest scores both with and without controls, the solar lamp group performslower and lower over time, making the difference in test scores of final examfor 3rd semester statistically significant at 90 percent and at 95 percent withcontrol variables.
The magnitude of α1 is -6.5 on a scale of 100, which should be consideredpractically significant. The magnitude of impact is larger for girls, which isconsistent with the previous findings that girls’ test scores depend on theirstudy more than boys’. For girls’ scores of mathematics, the point estimatewas -9.7 points, significant at the 95% confidence level. The results are notdriven entirely by Mathematics or entirely by English. This is also consistentwith a questionnaire that children find lack of lighting as a contributing factorinhibiting their study for both subjects. Given that the difference becomeslarger over time, regressions with a difference-in-difference specification as in
8Using the data from Uganda National Household Survey 2005/06, the income level wascomputed as follows:log(household expenditure) = 0.5679545×TVradio + 1.106305×bicycle +
0.3776105×motorcycle + 0.4172422×phone + 11.45439
11

Equation (2) can identify the statistical significance of the trend:
TestScoreit = β0 + β1TRTi + β2TRTi ∗ timet + β3Xi + ft + εit (2)
Here, the time fixed effect is appropriate because the test scores depend onoverall difficulty of tests that vary from time to time. The coefficient of interestis β2. Control variables (Xi) are included in order to reduce the standard error.They include age, class, gender, imputed log household expenditure,9 and asibling dummy. The time variable is omitted due to multicollinearity. Missingvalues are dummied out.
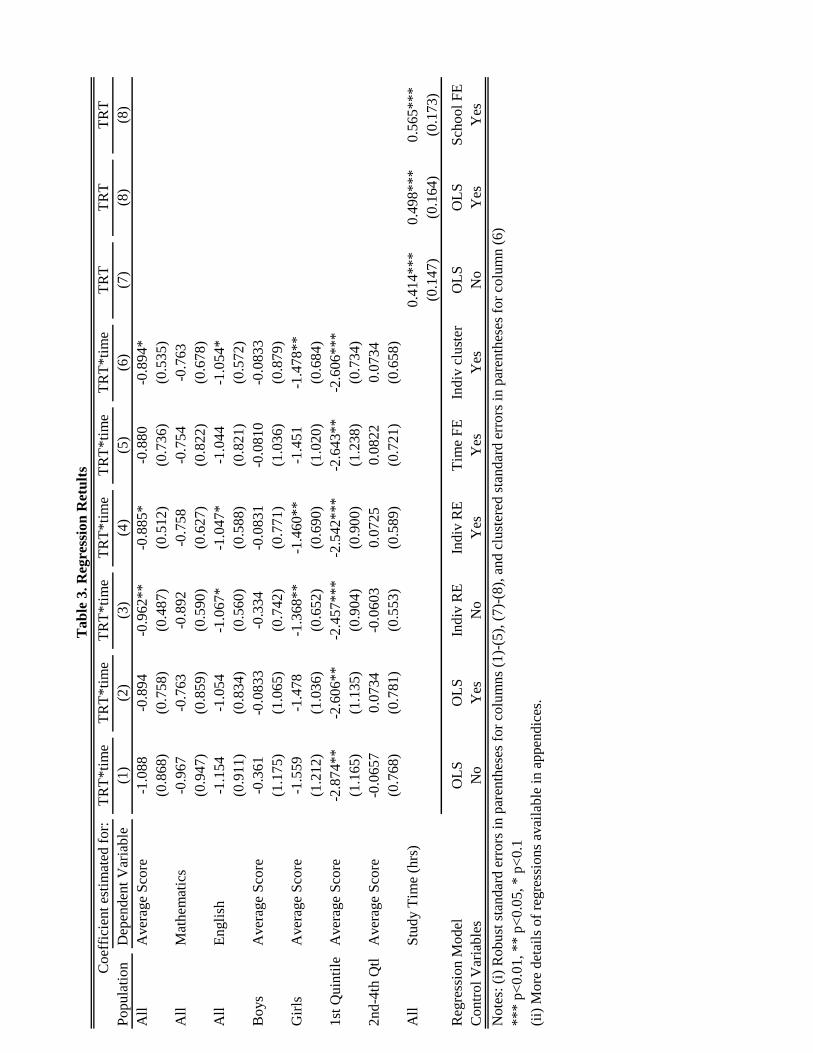
Table 3 shows that there are both statistically significant and insignificant(but consistently negative) coefficients depending on the exact specification.With all specifications, the β2 remains relatively constant. The p-values fromthe Hausman test were 0.003 for time fixed effect in Mathematics and the av-erage, indicating that the estimation from time random effect is inconsistent.Therefore, I report the specifications that give consistent estimators, exclud-ing time random effect. The β2 is about -0.9 to -1.1, which means that, onaverage, the test scores declined by about 1 point as the students with solarlamps took the next test. After the study period, this accumulated to about5 points in decline. The standard deviation changes with various specifica-tions: random effect and clustering at the individual levels have coefficients
9Since it was impossible to directly ask the wealth level, the questionnaire included someasset information that can help approximate the expenditure. Using the Uganda NationalHousehold Survey, I constructed the income variable with the following formula:Log(household expenditure)=-0.196×bednets+0.172×radioorTV+0.632×mobilephone+0.466×bicycle+0.0584×averagenumberofmeals+0.744×othertypesofstoves+1.456×improvedfirewoodstove+0.293×improvedcharcoalstove+0.39×traditionalmetalstove+0.611×gravityflowscheme+0.36×river,stream,lake,pond+0.15×protectedwell/spring+0.142×borehole-0.845×privatelyconnectedpipeline+0.568×cement-
1.148×earthandcowdung+0.215×othertypesofwall-0.156×burntbrickswithcement+0.0973×burntbrickswithmud+0.346×un-burntbricks-0.341×mudandpoles+-0.72×thatchandstraw+0.208×ironsheetroof-0.0355×asbestos+1.188×tiles-0.0606×othertypesofroof-0.0115×everychildhasblanket+11.64Here, I choose log expenditure because it is (i) less subject to seasonal variation compared
to income and (ii) log makes the distribution normal, which is less subject to extreme valuesthan log normal.
12

significant at 90 percent. The sub-group analysis shows that boys experiencedminimal effect whereas girls lost points considerably: β2 for girls is about -1.4.This variation is similar to the other studies discussed in the introduction.In addition, Mathematics has β1 of around -0.8 and English has β2 of about-1.0. These are not significantly different from one another, but just by cuttingthe threshold value, English has a few specifications that make its β2, at 90percent, significant. Given that many students reported that they feel a lackof lighting would affect their mathematics more, this result is not consistent.However, some may say that reading would require more bright light thanthinking about mathematics problems.
4.1.2 Reported Study Time
Another outcome of interest was study time: previously, it was reported thatsolar lamps can allow children to study for a longer time because of brighterlight, lack of health and fire risks, and lack of concern for kerosene runningout.
Table 3 confirms this result: students with solar lamps, on average, re-ported 0.43 hours longer study time (p<0.01). This holds with school fixedeffect. Furthermore, this increase was more significant for girls (0.52 hourswith p=0.008) than for boys (0.34 hours with p=0.102), and more significantfor the participants themselves than for their siblings.
4.1.3 Sub-group Analysis for Top Quintile Students
A study on the impact of textbooks (Glewwe et al. 2007) conducts a sub-groupanalysis for top quintile students and finds significant impact among them.[2]They argue that this is because those who can study from English textbookscan benefit from textbook provision. They do not find such impact amongothers. In a similar way, it is helpful to check if the top students actuallyperformed especially lower compared to other students.
The summary statistics suggests that 52.5 point is the approximate quantilecut-off point. Table 3 presents the result of regression above and below the
13

52.5 points in the baseline. This analysis finds that the top quintile group hasa coefficient of -16.1 points while the others have coefficient of -0.9. To confirm,at the baseline, there was no difference between the two groups. This result isconsistent with the explanation that solar lamps affect children’s performancethrough their study – the large drop in test scores was driven by the topstudents who study, not by students who do not study. It is also possible that,depending on how the tests are designed and curved, it may be easier for topstudents to lose the points.
4.1.4 Discussion
It is perplexing that while reported study time increased, children felt encour-aged to study, and children’s health moderately improved, their test scoreswent down. A few potential explanations are:
a. Reporting Bias in Study TimeAlthough test scores are not subject to reporting bias because they are
given from the school teachers, study time may be subject to reporting bias.Those who received solar lamps may have felt that they were studying moreor were motivated to report longer study times out of a sense of gratitude. Infact, many households did not have a watch or a clock at home, thus, it wasdifficult for the students to know the precise length of their study.
b. Decrease in Study ProductivityIf the study time indeed increased but the test scores decreased, then it
must be the case that their study productivity dropped substantially. Whatcould explain such a drop in productivity?
• One significant concern of solar lighting is inappropriate recharge, whichleads to the flickering of light or a shortage of lighting time. To rechargethe battery fully, the panels must be exposed to the sun throughout theday at a right angle. Although the researchers informed the students howto recharge, this was particularly difficult for households to implement.Consequently, 47 percent of those who received solar lamps reportedthat they experienced flickering and 48 percent reported some shortage
14

of lighting. When the solar lamps stopped working, 34.7 percent saidthey gave up on their work and 48.6 percent said they switched backto kerosene candles. Nevertheless, if the households did not prepare thekerosene, then the children would be forced to stop. When the solarlamps start flickering, 64.6 percent said that they kept studying evenunder such light, 6.25 percent said that they stopped studying, and 29.17percent said that they switched to another lighting source.
• Another possible explanation is that the children actually did not get touse the solar lamps due to their parents’ or other siblings’ usage. Sincechildren generally have weak negotiation power within the households,other members who want to use the solar panel may have used them forthemselves.
It is also important to note that 96 percent of the students who participated inthis study and received the solar lamps reported that their quality of study im-proved after receiving the lamps. This critical contradiction between the qual-itative and quantitative evidence suggests that the test score results are eitherlargely subject to the error or that the direct question from the researchersregarding the benefit of intervention is often unreliable due to reporting biasesout of the participants’ sense of gratitude.
4.1.5 Empirical Tests for Hypotheses
Which of these explanations match the data? The first hypothesis of report-ing bias is difficult to test, but is likely to be true given that 48 percent ofthose who received solar lamps said that they experienced some shortages oflighting. Although positive, the correlation between study time and test scoreis not statistically significant. (Appendix Table5) The second hypothesis maycontribute to the decline in test scores because 47 percent report that theyexperienced flickering, but it may still not be the driving force. The third hy-pothesis is unlikely to be very significant because children seem to have beenusing the solar lamps for themselves. In a follow-up questionnaire, 77 percent
15

of the students reported that they had no conflict using the solar lamps withother siblings and only 19 percent said they did.
All in all, none of these three explanations seem to match the data perfectly:perhaps it is a combination of these factors and some noise due to the relativelysmall sample size that caused these results.
Lastly, I would like to note the possibility that this study may have un-derestimated the negative impact of solar lamps on education due to the ex-perimental effect: evidence suggests that those who received solar lamps feltencouraged to study10 whereas 61 percent (34/55) of those who were left withkerosene felt discouraged to study.11 Overall, the direction of bias is ambiguousbecause attenuation could have led to an overestimation of negative results,but encouragement effect could have led to their underestimation.
4.2 Learning Assessment Survey
It is helpful to check if the results of the randomized trial are consistent withthe observational data.
4.2.1 Endogenous Regression
Table 4 presents the endogenous regression results of test scores on the choiceof lighting sources as in Equation (3):
TestScoreij = γ0 + γ1Lightij + γ2Xij + εij (3)
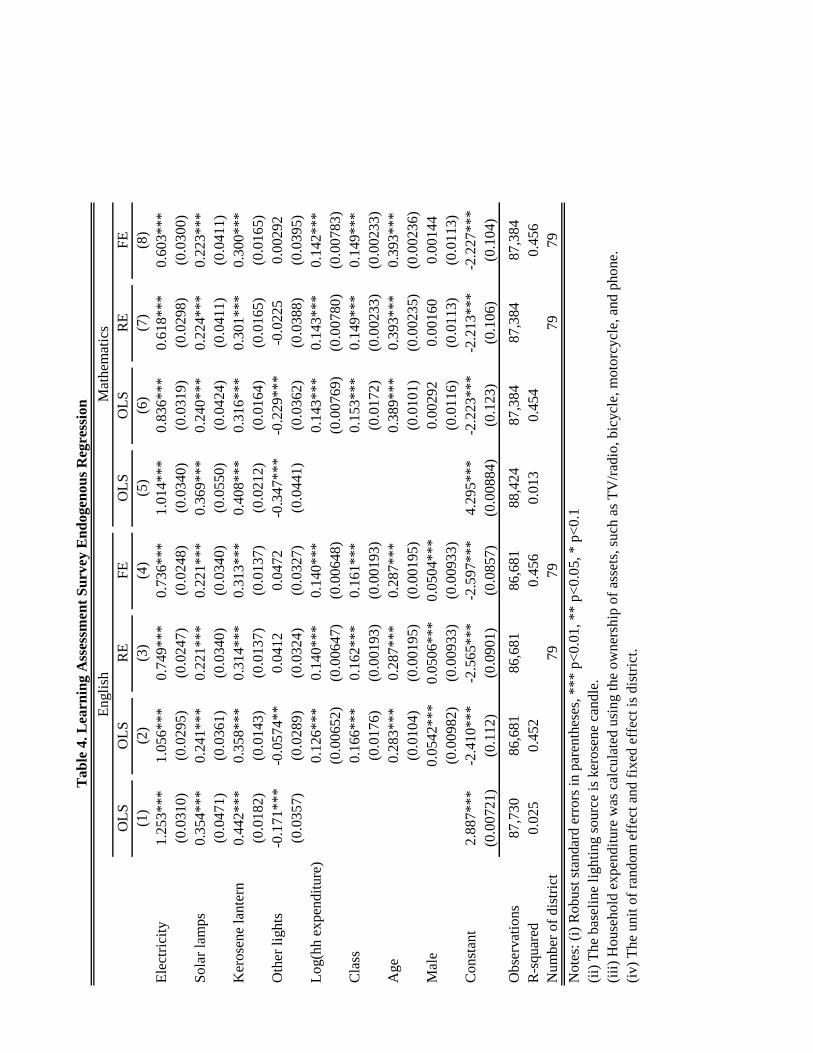
Compared to kerosene candle group, electricity, kerosene lantern, and solarlamp group perform significantly higher, even after controlling for underlyingfeatures. At the same time, the magnitude of coefficient drops as more andmore control variables are added. this is only an endogenous regression withsignificant omitted variable bias, such as preference for education and access
10Among 55 students with solar who were surveyed, all of them answered that they were“very encouraged” to study when asked “Do you feel encouraged to study?”
11In contrast, 17 percent (7/41) of those who received the solar lamps reported that theyfelt discouraged to study.
16

to the market; no causation can be claimed from this analysis. Nevertheless,the observation that kerosene lanterns’ coefficients are generally and slightlyhigher than the solars’ was unexpected. Since the exact types of solar lampsand kerosene lanterns are not reported, it is impossible to make a comparisonbetween the two in a precise way.
4.2.2 Cross Sectional Endogenous Analysis
One way to check if this difference in learning outcome comes from the pathwayof interest – differential productivity due to provision of brighter, safer, andhealthier light with zero marginal cost – is to see whether the improvementin test scores is faster for those with solar lamps as compared to those withkerosene candles. Figure 2 presents the change in average test scores over age.While this largely depends on test design, if everything is held constant andsolar lamps do help children study, then there should be a steeper increase intest scores over age.
Nevertheless, this is not what is observed. The difference in learning attain-ment is observed just from age 6 (Primary 1) and the difference remains moreor less unchanged until age 10. Note that the questions were set at the levelof primary 2. Therefore, beyond age 9 or 10, the improvement in children’slearning outcome is no longer reflected in an increase in test scores. In thisway, focusing on the age range of 6 to 9 or 10 would likely give more accurateanalysis. It is likely that solar lamps is no better improvement than kerosenelanterns, and even compared to kerosene candles, the impact is practicallyinsignicant.
Here, the primary concern is that a significant selection bias that mayhave led to the overestimation of the effect: choice of better lighting is mostlikely positively correlated with the ability to learn faster. This is analogous toother studis that found positive impact with observational data, but no impactwith experimental ones. (Kremer 2003) [16] Even with this omitted variablethat would give positive selection bias, there does not seem to be any positiveimpact. Therefore, it is likely that the effect of solar lamps is insignificant.
17

4.2.3 Discussion on External Validity of the Randmoized Evalua-tion
A valid instrument for the adoption of solar lamps is, in fact, very difficult tofind. Possible candidates are geographic variation of (i) rain and (ii) insola-tion. Rainfall fails to satisfy the instrument validity because it affects solarlamp adoption in two main ways: it discourages solar lamp adoption becausepanels can become spoiled after continuous exposure to the rain, and it alsoencourages adoption because it produces higher seasonal income, which allowshouseholds to purchase them. Moreover, these factors contribute to solar lampadoption and function in the long-run, which no longer have a significant id-iosyncratic variation like they do in the short-term, and thus, be correlatedwith the underlying factors such as agricultural productivity, income, and so-cioeconomic well-being. Insolation, intuitively, may seem to affect children’slearning outcome only through the adoption and functionality of solar lamps.However, again, insolation is correlated with rainfall, making the exogenietycondition unsatisfied.
Does this result indicate that the distribution of solar lamps actually hin-ders children’s study? The probable answer is no, because households typicallystopped using solar lamps after observing that they did not improve the qual-ity of lighting. The experimental effect of encouraging these children to keepusing the solar lamp may have played a significant role in making them studyeven under the flickering light of solar lamps.
Researchers conducted a resurvey in June 2012, six months after the studywas complete. Many students changed schools, and response rate was 47 per-cent. Among them, only 33 percent kept using the solar lamps and over 60percent returned to using kerosene candles. After active checking of usagestopped and maintenance service became unavailable, many children were un-able to keep using the solar lamps. Nevertheless, 56 percent said that thehousehold was planning to purchase another solar lamp, 80 percent said theywould be willing to pay for repair, and 84 percent said that the lamps mettheir expectation. Therefore, despite the limitations that the solar lamps mayhave had, households still seem to be willing to invest in the new technology.
18

Furthermore, there is a sign that the users are able to learn how to recharge thelamps appropriately over time: all of those who were resurveyed said they puttheri panels either on the roof or on the ground while there used to be thosewho hang them on the wall (Figure 4 in Appendix), which is an inefficient wayto recharge the batteries.
5 Conclusion
Solar lamps are seen as some of the most robust alternative energy sources forbringing modern lighting to developing countries and thereby improving theeducational environment, health, and safety of rural households. However, thisstudy shows that benefits of solar lamps are mixed: while health and safetyshow evidence of improvement, children’s learning outcomes show no suchevidence; in fact, those who received the solar lamps performed, on average,5 points lower compared to those who kept using kerosene candles after fivemonths. The exact reason for this unexpected result remains unclear; it maybe an error due to relatively small sample size (n=204), shortage or flickeringof light that made the lamps provide unstable light due to lack of full recharge,or intra-household mechanisms that prevented children from using the lamps.
Currently, the World Bank Lighting Africa program rewards OutstandingProduct Award to the lamps that were identified as reliable and user-friendly.Although the lamps used in this project came from the same series of solarlamps that received the award, they still experienced signicant challenges inthe field. This study highlights the importance of long-term field evaluation ofdurability of the products. Since the result largely contradicts anecdotal evi-dence, it is critical to examine whether the same results hold for future trials.Although the technologies themselves may appear to provide clear benefits,technologies combined with inappropriate usage may inhibit such benefits or,even diminish the quality of life. Given the importance and potential of thistechnology, future efforts and research should explore possible solutions suchas (i) local maintenance mechanisms that households can rely on; (ii) thoroughusers training programs that reinforce appropriate usages; and (iii) reconsid-
19

eration of the balance between the brightness of LED bulbs and the size ofsolar panels to ensure the long-term functioning.
20

References
[1] Michael Kremer, Rebecca T. Edward Miguel M. Edward Miguel: In-centives to Learn. In: The Review of Economics and Statistics 91 (2009),S. 437–456
[2] Paul Glewwe, Michael K. ; Moulin, Sylvie: Many Children LeftBehind? Textbooks and Test Scores in Kenyal. In: American EconomicJournal: Applied Economics 1 (2009), S. 112–35)
[3] Paul Glewwe, Nauman I. ; Kremer, Michael: Teacher Incentives. In:NBER Working Paper (2003)
[4] Vermeersch, Christel ; Kremer, Michael: School Meals, EducationalAchievement and School Competition: Evidence from a RandomizedEvaluation. In: World Bank Policy Research Working Paper (2004)
[5] McEwan, Patrick: The Impact of School Meals on Education Outcomes:Discontinuity Evidence from Chile. (2011)
[6] Paul Glewwe, Meng Z. Albert Park P. Albert Park: The impact ofeyeglasses on the academic performance of primary school students: Evi-dence from a randomized trial in rural China. In: Working Paper (2006)
[7] Jensen, Robert: The (Perceived) Returns to Education and the Demandfor Schooling. In: The Quarterly Journal of Economics 125 (2010), S.515–548
[8] International Energy Agency: Energy for all: Financing access forthe poor. (2011)
[9] Author: Health and Safety Benefits of Replacing Kerosene Candles bySolar Lamps: Evidence from Uganda. In: Brown University Manuscript(2012)
[10] Agoramoorthy ; Hsu: Lighting the Lives of the Impoverished in In-dia’s Rural and Tribal Drylands. In: Human Ecology 37 (2009), S. 513–517
21

[11] Stinebrickner, Todd ; Stinebrickner, Ralph: The Causal Effect ofStudying on Academic Performance. In: NBER Working Paper (2007)
[12] Angrist, Joshua ; Lavy, Victorr: The Effects of High Stakes HighSchool Achievement Awards: Evidence from a Randomized Trial. In:The American Economic Review 99 (2009), S. 301–331
[13] Anderson, Michael: Multiple Inference and Gender Differences in theEffects of Early Intervention: A Reevaluation of the Abecedarian, PerryPreschool, and Early Training Projectsl. In: Journal of the AmericanStatistical Association 103 (2008), S. 1481–95
[14] Fryer, Roland: Financial incentives and student achievement: Evidencefrom randomized trials. In: The NBER Working Paper (2010)
[15] Kremer, Michael ; Miguel, Edward: Worms: Education and HealthExternalities in Kenya. In: The Poverty Action Lab Paper (2001)
[16] Kremer, Michael: Randomized Evaluations of Educational Programsin Developing Countries: Some Lessons. In: The American EconomicReview 93 (2003), S. 102–106
22

A. Figures and Tables
Figure 1: Difference in Average Test Scores
23

Figure 2: Uwezo Uganda Learning Assessment Survey Change in Literacy andNumeracy
24

Difference
Mean Observations Mean Observations Mean
Household characteristics (1) (2) (3) (4) (5)
Household head is father .5 74 .5072 69 -0.007
(.5034) (.5036) (0.084)
Household head is farmer .8108 74 .8551 69 -0.044
(.3943) (.3546) (0.063)
Household head's years of education 6.8571 70 6.0484 62 0.809
(3.0988) (3.0911) (0.540)
Main dwelling is permanent .5 74 .5072 69 -0.007
(.5034) (.5036) (0.084)
Num. of kerosene candles at home 1.9444 72 1.9032 62 0.041
(.6897) (.6945) (0.120)
Num. children below 18 living together 5.2394 71 4.3676 68 0.872**
(2.728) (2.4671) (0.441)
Num. older children living together 2.4058 69 2.2698 63 0.136
(2.6696) (2.1191) (0.418)
Cookstove if 3-stone stove .527 74 .6377 69 -0.111
(.5027) (.4842) (0.083)
Num. rooms in main dwelling 3.9054 74 4.0294 68 -0.124
(1.2405) (1.486) (0.231)
Each child owns blanket at home .5811 74 .6029 68 -0.022
(.4967) (.4929) (0.083)
Each member has at least two clothes .5405 74 .6029 68 -0.062
(.5018) (.4929) (0.084)
Floor made of cement .2838 74 .2754 69 0.008
(.4539) (.45) (0.076)
Wall made of bricks .6757 74 .6957 69 -0.020
(.4713) (.4635) (0.078)
Water comes from unclean sources .5921 76 .5443 79 0.048
(.4947) (.5012) (0.080)
Note: robust standard errors in parenthesis.
There are few missing values due to missing entries in the survey.
"Water comes from unclean sources" means that water sources are either unprotected well or river.
Treatment
Table 1. Baseline Descriptive Statistics
Control

DifferenceMean Observations Mean Observations Mean
Individual characteristics (1) (2) (3) (4) (5)Gender (male) 0.3947 76 .4937 79 -0.099
(0.492) (.5032) (0.080)Grade (either P5, P6, or P7) 5.7237 76 5.8101 79 -0.086
(.7411) (.7524) (0.120)Age 12.942 69 13.1452 62 -0.203
(1.5707) (1.7727) (0.294)Wear uniform .7027 74 .5588 68 0.144*
(.4602) (.5002) (0.081)Wear shoes .2568 74 .2941 68 -0.037
(.4398) (.459) (0.076)Have registered lunch at school .6757 74 .6029 68 0.073
(.4713) (.4929) (0.081)Use bed net last night 0.257 74 0.25 68 0.007
(0.525) (0.436) (0.081)Sleeping with kerosene candles on .1831 71 .0984 61 0.085
(.3895) (.3003) (0.060)Did homework in the past 7 days .662 71 .6613 62 0.001
(.4764) (.4771) (0.083)Time students cooked 1.9571 70 2.803 66 -0.846**
(1.7729) (2.4001) (0.364)Experienced illness or injury in 30 days .7397 73 .8182 66 -0.078
(.4418) (.3887) (0.070)Num. days suffered from illness or injury 3.5139 72 4.8462 65 -1.332
(3.3651) (5.8769) (0.830)
F-Statistics: Difference Jointly Significant=0.91p -value=0.59
Treatment Control
Table 1. Baseline Descriptive Statistics continued

1st
Fin
al2nd F
inal
3rd
Mid
3rd
Fin
al1st
Fin
al2nd F
inal
3rd
Mid
3rd
Fin
al1st
Fin
al2nd F
inal
3rd
Mid
3rd
Fin
al
(1)
(2)
(3)
(4)
(5)
(6)
(7)
(8)
(9)
(10)
(11)
(12)
(i)
Boys
and g
irls
A.
TR
T-0
.394
-1.7
17
-3.0
11
-5.8
59*
0.8
15
-3.3
22
-2.0
04
-5.4
50*
-1.5
01
-0.1
11
-3.8
18
-6.1
81*
(3.0
50)
(2.8
71)
(4.3
33)
(3.0
64)
(3.3
09)
(3.0
60)
(4.6
96)
(3.1
53)
(3.2
67)
(3.0
28)
(4.7
09)
(3.4
73)
Obse
rvat
ions
169
201
99
176
168
201
97
176
169
201
98
175
R-s
quar
ed0.0
00
0.0
02
0.0
05
0.0
21
0.0
00
0.0
06
0.0
02
0.0
17
0.0
01
0.0
00
0.0
07
0.0
18
B.
TR
T-3
.744
-4.9
49**
-3.1
89
-7.3
49***
-2.6
79
-7.5
05***
-0.4
57
-9.1
07***
-4.6
97*
-2.3
93
-6.9
48*
-5.5
34*
(2.3
18)
(2.2
59)
(3.2
22)
(2.6
77)
(2.7
88)
(2.6
77)
(3.9
87)
(2.8
78)
(2.5
41)
(2.3
71)
(3.6
42)
(3.1
03)
Obse
rvat
ions
151
179
88
159
150
179
85
159
151
179
87
158
R-s
quar
ed0.4
50
0.4
44
0.5
29
0.3
75
0.3
55
0.3
49
0.4
43
0.3
10
0.4
22
0.4
51
0.4
63
0.3
67
(ii)
Boys
A.
TR
T-2
.650
-2.8
89
-3.4
07
-4.0
45
-1.1
24
-5.1
87
1.3
57
-5.3
99
-4.1
77
-0.5
90
-6.7
86
-2.4
32
(4.0
17)
(3.6
42)
(6.9
20)
(4.5
95)
(4.7
79)
(4.0
11)
(8.3
64)
(4.4
48)
(4.1
01)
(3.8
64)
(7.2
19)
(5.5
83)
Obse
rvat
ions
70
84
34
74
70
84
32
74
70
84
33
73
R-s
quar
ed0.0
06
0.0
07
0.0
07
0.0
11
0.0
01
0.0
20
0.0
01
0.0
19
0.0
13
0.0
00
0.0
25
0.0
03
B.
TR
T-6
.484*
-5.1
55*
-1.2
96
-8.1
59*
-5.3
77
-8.5
49**
2.2
94
-9.5
79**
-7.5
91*
-1.7
62
-5.4
35
-6.6
48
(3.2
45)
(2.9
49)
(6.2
02)
(4.4
42)
(3.6
80)
(3.5
82)
(7.9
96)
(4.6
90)
(4.0
02)
(3.1
63)
(7.2
05)
(5.1
44)
Obse
rvat
ions
64
76
31
66
64
76
28
66
64
76
30
65
R-s
quar
ed0.5
06
0.4
43
0.5
10
0.3
15
0.5
12
0.3
18
0.4
67
0.2
66
0.3
30
0.4
55
0.4
13
0.2
97
(iii
) G
irls
A.
TR
T-0
.089
-2.2
27
-3.5
83
-8.6
41**
0.5
31
-3.4
15
-3.4
23
-7.5
78*
-0.5
85
-1.0
38
-3.7
44
-9.7
04**
(4.3
10)
(4.2
30)
(5.5
60)
(4.2
14)
(4.4
80)
(4.4
43)
(5.7
11)
(4.3
45)
(4.7
08)
(4.4
63)
(6.1
01)
(4.7
20)
Obse
rvat
ions
99
117
65
102
98
117
65
102
99
117
65
102
R-s
quar
ed0.0
00
0.0
02
0.0
07
0.0
41
0.0
00
0.0
05
0.0
06
0.0
30
0.0
00
0.0
00
0.0
06
0.0
41
B.
TR
T-2
.738
-5.6
72
-4.0
02
-7.1
33*
-2.1
83
-7.7
96*
-1.7
10
-9.4
40**
-3.2
43
-3.5
47
-6.2
94
-4.8
26
(3.5
34)
(3.4
87)
(4.4
27)
(3.7
63)
(4.2
51)
(4.0
51)
(5.4
75)
(4.2
27)
(3.4
21)
(3.6
63)
(4.7
35)
(4.2
30)
Obse
rvat
ions
87
103
57
93
86
103
57
93
87
103
57
93
R-s
quar
ed0.4
38
0.4
53
0.5
72
0.4
17
0.3
02
0.3
77
0.4
87
0.3
34
0.4
88
0.4
54
0.5
01
0.4
24
Note
s: (
i) R
obust
sta
ndar
d e
rrors
in p
aren
thes
es:
*** p
<0.0
1, ** p
<0.0
5, * p
<0.1
(ii)
Row
A p
rese
nts
reg
ress
ion e
stim
ates
wit
hout
contr
ols
and r
ow
B p
rese
nts
one
wit
h c
ontr
ols
.
(iii
) S
ample
siz
e fo
r 3rd
mid
-ter
m i
s sm
alle
r th
an o
ther
s bec
ause
not
all
schools
had
the
mid
-ter
m a
rran
ged
.
Engli
shM
athem
atic
sA
ver
age
Tab
le 2
. S
um
mary
of
Tes
t S
core
s
Coef
fici
ent
esti
mat
ed f
or:
TR
T*ti
me
TR
T*ti
me
TR
T*ti
me
TR
T*ti
me
TR
T*ti
me
TR
T*ti
me
TR
TT
RT
TR
T
Popula
tion
Dep
enden
t V
aria
ble
(1)
(2)
(3)
(4)
(5)
(6)
(7)
(8)
(8)
All
Aver
age
Sco
re-1
.088
-0.8
94
-0.9
62**
-0.8
85*
-0.8
80
-0.8
94*
(0.8
68)
(0.7
58)
(0.4
87)
(0.5
12)
(0.7
36)
(0.5
35)
All
Mat
hem
atic
s-0
.967
-0.7
63
-0.8
92
-0.7
58
-0.7
54
-0.7
63
(0.9
47)
(0.8
59)
(0.5
90)
(0.6
27)
(0.8
22)
(0.6
78)
All
Engli
sh-1
.154
-1.0
54
-1.0
67*
-1.0
47*
-1.0
44
-1.0
54*
(0.9
11)
(0.8
34)
(0.5
60)
(0.5
88)
(0.8
21)
(0.5
72)
Boys
Aver
age
Sco
re-0
.361
-0.0
833
-0.3
34
-0.0
831
-0.0
810
-0.0
833
(1.1
75)
(1.0
65)
(0.7
42)
(0.7
71)
(1.0
36)
(0.8
79)
Gir
lsA
ver
age
Sco
re-1
.559
-1.4
78
-1.3
68**
-1.4
60**
-1.4
51
-1.4
78**
(1.2
12)
(1.0
36)
(0.6
52)
(0.6
90)
(1.0
20)
(0.6
84)
1st
Quin
tile
Aver
age
Sco
re-2
.874**
-2.6
06**
-2.4
57***
-2.5
42***
-2.6
43**
-2.6
06***
(1.1
65)
(1.1
35)
(0.9
04)
(0.9
00)
(1.2
38)
(0.7
34)
2nd-4
th Q
tlA
ver
age
Sco
re-0
.0657
0.0
734
-0.0
603
0.0
725
0.0
822
0.0
734
(0.7
68)
(0.7
81)
(0.5
53)
(0.5
89)
(0.7
21)
(0.6
58)
All
Stu
dy T
ime
(hrs
)0.4
14***
0.4
98***
0.5
65***
(0.1
47)
(0.1
64)
(0.1
73)
Reg
ress
ion M
odel
OL
SO
LS
Indiv
RE
Indiv
RE
Tim
e F
EIn
div
clu
ster
OL
SO
LS
Sch
ool
FE
Contr
ol
Var
iable
sN
oY
esN
oY
esY
esY
esN
oY
esY
es
Note
s: (
i) R
obust
sta
ndar
d e
rrors
in p
aren
thes
es f
or
colu
mns
(1)-
(5),
(7)-
(8),
and c
lust
ered
sta
ndar
d e
rrors
in p
aren
thes
es f
or
colu
mn (
6)
*** p
<0.0
1, ** p
<0.0
5, * p
<0.1
(ii)
More
det
ails
of
regre
ssio
ns
avai
lable
in a
ppen
dic
es.
Tab
le 3
. R
egre
ssio
n R
etu
lts
OL
SO
LS
RE
FE
OL
SO
LS
RE
FE
(1)
(2)
(3)
(4)
(5)
(6)
(7)
(8)
Ele
ctri
city
1.2
53***
1.0
56***
0.7
49***
0.7
36***
1.0
14***
0.8
36***
0.6
18***
0.6
03***
(0.0
310)
(0.0
295)
(0.0
247)
(0.0
248)
(0.0
340)
(0.0
319)
(0.0
298)
(0.0
300)
Sola
r la
mps
0.3
54***
0.2
41***
0.2
21***
0.2
21***
0.3
69***
0.2
40***
0.2
24***
0.2
23***
(0.0
471)
(0.0
361)
(0.0
340)
(0.0
340)
(0.0
550)
(0.0
424)
(0.0
411)
(0.0
411)
Ker
ose
ne
lante
rn0.4
42***
0.3
58***
0.3
14***
0.3
13***
0.4
08***
0.3
16***
0.3
01***
0.3
00***
(0.0
182)
(0.0
143)
(0.0
137)
(0.0
137)
(0.0
212)
(0.0
164)
(0.0
165)
(0.0
165)
Oth
er l
ights
-0.1
71***
-0.0
574**
0.0
412
0.0
472
-0.3
47***
-0.2
29***
-0.0
225
0.0
0292
(0.0
357)
(0.0
289)
(0.0
324)
(0.0
327)
(0.0
441)
(0.0
362)
(0.0
388)
(0.0
395)
Log(h
h e
xpen
dit
ure
)0.1
26***
0.1
40***
0.1
40***
0.1
43***
0.1
43***
0.1
42***
(0.0
0652)
(0.0
0647)
(0.0
0648)
(0.0
0769)
(0.0
0780)
(0.0
0783)
Cla
ss0.1
66***
0.1
62***
0.1
61***
0.1
53***
0.1
49***
0.1
49***
(0.0
176)
(0.0
0193)
(0.0
0193)
(0.0
172)
(0.0
0233)
(0.0
0233)
Age
0.2
83***
0.2
87***
0.2
87***
0.3
89***
0.3
93***
0.3
93***
(0.0
104)
(0.0
0195)
(0.0
0195)
(0.0
101)
(0.0
0235)
(0.0
0236)
Mal
e0.0
542***
0.0
506***
0.0
504***
0.0
0292
0.0
0160
0.0
0144
(0.0
0982)
(0.0
0933)
(0.0
0933)
(0.0
116)
(0.0
113)
(0.0
113)
Const
ant
2.8
87***
-2.4
10***
-2.5
65***
-2.5
97***
4.2
95***
-2.2
23***
-2.2
13***
-2.2
27***
(0.0
0721)
(0.1
12)
(0.0
901)
(0.0
857)
(0.0
0884)
(0.1
23)
(0.1
06)
(0.1
04)
Obse
rvat
ions
87,7
30
86,6
81
86,6
81
86,6
81
88,4
24
87,3
84
87,3
84
87,3
84
R-s
quar
ed0.0
25
0.4
52
0.4
56
0.0
13
0.4
54
0.4
56
Num
ber
of
dis
tric
t79
79
79
79
Note
s: (
i) R
obust
sta
ndar
d e
rrors
in p
aren
thes
es, *** p
<0.0
1, ** p
<0.0
5, * p
<0.1
(ii)
The
bas
elin
e li
ghti
ng s
ourc
e is
ker
ose
ne
candle
.
(iii
) H
ouse
hold
expen
dit
ure
was
cal
cula
ted u
sing t
he
ow
ner
ship
of
asse
ts, su
ch a
s T
V/r
adio
, bic
ycl
e, m
oto
rcycl
e, a
nd p
hone.
(iv)
The
unit
of
random
eff
ect
and f
ixed
eff
ect
is d
istr
ict.
Engli
shM
athem
atic
s
Tab
le 4
. L
earn
ing A
sses
smen
t S
urv
ey E
nd
ogen
ou
s R
egre
ssio
n

B. Appendix
B1 Correlation between Test Scores and Reported Study
Time
Although this analysis can only get at correlation, it is important to checkhow noisy the reported study time may be. Appendix Table 5 presents theregression as in Equation (4):
TestScorei = δ0 + δ1StudyT imei + δ2Xi + εi (4)
The reported study time is positively correlated with test scores, but notstatistically significant at 90 percent. Furthermore, adding more controls de-creases the coefficient, indicating that omitted variable bias is certainly sig-nificant. This shows that, although study time may be somewhat noisy, it islikely still reflective of true study time.
30

Figure 3: (A) A child studying by a kerosene candle / (B) A child studyingby a solar lamp
31

Figure 4: Improper charging practice of solar lamps
32
Flow chart of recruitment, eligibility, intervention, dropouts, and inclusion of siblings’ test scores in
the randomized evaluation
Initial baseline survey at 7 primary schools
in Kyannamukaaka: 563 students
Exclusion: 408 students
Lighting sources
AQRH symptoms
Have siblings who
are also in the
study group
Parents’ absence
Do not go to
boarding section
Eligible: 155 students
Use kerosene candles
Report some AQRH symptoms
Not have siblings who are also in
the study group
Parents came to survey
Not a boarding student
Treatment (solar lamps): 76 students Control (kerosene candles): 79 students
Control (kerosene candles): 72 students Treatment (solar lamps): 73 students
Drop-outs: 7 students
Tired of study
Move-out
Drop-outs: 3 students
Solar lamp stolen
Move-out
23 siblings’ test scores 26 siblings’ test scores
+ +

Frequency Percentage Frequency Percentage
(1) (2) (3) (4)
Electricity 12,419 4.82 2,357 5.22
Solar 5,266 2.04 891 1.97
Generator 618 0.24 105 0.23
Lantern 38,244 14.84 6,610 14.64
Tadoba/candle 189,068 73.39 33,137 73.4
Other 12,022 4.67 2,048 4.54
Total 257,637 45,148
Note: (i) Generator is classified under electricity in the regression.
(ii) Data are from Uwezo Uganda Learning Assessment Survey 2011.
Individual level Household level
Appendix Table 1. Lighting Sources in Uganda (2011)
1st
Fin
al2nd F
inal
3rd
Mid
3rd
Fin
al1st
Fin
al2nd F
inal
3rd
Mid
3rd
Fin
al1st
Fin
al2nd F
inal
3rd
Mid
3rd
Fin
al
(1)
(2)
(3)
(4)
(5)
(6)
(7)
(8)
(9)
(10)
(11)
(12)
A.
TR
T-0
.39
4-1
.71
7-3
.01
1-5
.85
9*
0.8
15
-3.3
22
-2.0
04
-5.4
50
*-1
.50
1-0
.11
1-3
.81
8-6
.18
1*
(3.0
50
)(2
.87
1)
(4.3
33
)(3
.06
4)
(3.3
09
)(3
.06
0)
(4.6
96
)(3
.15
3)
(3.2
67
)(3
.02
8)
(4.7
09
)(3
.47
3)
Const
ant
38
.44
***
38
.89
***
45
.07
***
49
.98
***
38
.31
***
40
.57
***
44
.14
***
48
.05
***
38
.47
***
37
.21
***
46
.67
***
51
.91
***
(2.1
72
)(2
.12
6)
(3.4
00
)(2
.15
5)
(2.3
02
)(2
.26
2)
(3.5
37
)(2
.30
9)
(2.3
70
)(2
.26
2)
(3.5
95
)(2
.34
7)
Obse
rvat
ions
16
92
01
99
17
61
68
20
19
71
76
16
92
01
98
17
5
R-s
quar
ed0
.00
00
.00
20
.00
50
.02
10
.00
00
.00
60
.00
20
.01
70
.00
10
.00
00
.00
70
.01
8
B.
TR
T-3
.74
4-4
.94
9**
-3.1
89
-7.3
49
***
-2.6
79
-7.5
05
***
-0.4
57
-9.1
07
***
-4.6
97
*-2
.39
3-6
.94
8*
-5.5
34
*
(2.3
18
)(2
.25
9)
(3.2
22
)(2
.67
7)
(2.7
88
)(2
.67
7)
(3.9
87
)(2
.87
8)
(2.5
41
)(2
.37
1)
(3.6
42
)(3
.10
3)
Age
-2.3
69
***
-2.0
15
***
-1.8
17
*-1
.84
6**
-2.4
70
***
-2.7
42
***
-2.2
50
**
-2.2
38
***
-2.2
28
***
-1.2
89
*-2
.11
2*
-1.4
58
(0.6
84
)(0
.65
4)
(1.0
41
)(0
.79
2)
(0.7
91
)(0
.77
5)
(1.1
17
)(0
.81
0)
(0.7
83
)(0
.69
3)
(1.2
44
)(0
.92
4)
Mal
e-2
.24
9-2
.36
2-3
.01
6-4
.60
3*
-3.5
60
-2.8
26
1.4
24
-5.9
83
**
-0.8
75
-1.8
99
-5.5
47
-3.1
57
(2.2
81
)(2
.19
8)
(3.2
42
)(2
.63
3)
(2.6
88
)(2
.63
2)
(4.1
40
)(2
.89
0)
(2.6
04
)(2
.30
0)
(3.8
89
)(3
.06
8)
Cla
ss1
.64
21
.69
31
.09
01
2.6
7***
2.4
57
2.4
48
5.3
06
9.8
67
***
0.8
50
0.9
38
-2.1
18
15
.48
***
(1.5
97
)(1
.58
3)
(3.3
47
)(1
.90
8)
(1.9
97
)(1
.91
0)
(3.9
89
)(2
.21
5)
(1.7
98
)(1
.59
4)
(3.9
68
)(2
.16
9)
Lo
g (
hh e
xp
end
iture
)0
.15
11
.71
4-1
.78
2-0
.04
51
-0.8
60
0.8
51
-1.3
10
-2.1
57
1.1
51
2.5
76
-1.8
73
2.0
44
(2.1
68
)(2
.10
7)
(2.9
76
)(2
.38
2)
(2.5
73
)(2
.30
8)
(3.6
06
)(2
.33
2)
(2.2
68
)(2
.41
3)
(3.2
20
)(3
.03
1)
Sib
lings
dum
my
28
.12
***
29
.98
***
30
.07
***
21
.97
***
26
.87
***
27
.45
***
29
.04
***
21
.95
***
29
.43
***
32
.51
***
29
.92
***
21
.96
***
(3.1
16
)(3
.11
7)
(3.3
93
)(3
.25
7)
(3.4
93
)(3
.44
4)
(4.0
70
)(3
.57
4)
(3.5
12
)(3
.26
9)
(3.9
01
)(3
.46
5)
Const
ant
53
.63
*3
0.5
57
1.3
4*
-0.9
87
63
.73
*4
9.6
4*
45
.28
45
.98
42
.88
11
.46
97
.77
**
-47
.73
(28
.00
)(2
6.8
6)
(38
.99
)(3
0.7
8)
(33
.53
)(2
7.8
9)
(50
.66
)(2
9.0
8)
(29
.09
)(3
2.5
8)
(42
.23
)(4
1.1
1)
Obse
rvat
ions
151
179
88
159
150
179
85
159
151
179
87
158
R-s
quar
ed0.4
50
0.4
44
0.5
29
0.3
75
0.3
55
0.3
49
0.4
43
0.3
10
0.4
22
0.4
51
0.4
63
0.3
67
Note
s: (
i) R
obust
sta
ndar
d e
rrors
in p
aren
thes
es:
*** p
<0.0
1, ** p
<0.0
5, * p
<0.1
(ii)
Row
A p
rese
nts
reg
ress
ion e
stim
ates
wit
hout
contr
ols
and r
ow
B p
rese
nts
one
wit
h c
ontr
ols
.
(iii
) S
ample
siz
e fo
r 3rd
mid
-ter
m i
s sm
alle
r th
an o
ther
s bec
ause
not
all
schools
had
the
mid
-ter
m a
rran
ged
.
Aver
age
Engli
shM
athem
atic
s
Ap
pen
dix
Tab
le 2
. S
um
mary
of
Tes
t S
core
s fo
r B
oth
Boys
an
d G
irls
Com
bin
ed

OL
SO
LS
Indiv
RE
Indiv
RE
Tim
e
FE
Mix
ed
Eff
ect
Mix
ed
Indiv
Mix
ed
Tim
e
Mix
ed
Indiv
/Tim
e
Indiv
Clu
ster
Indiv
Clu
ster
(1)
(2)
(3)
(4)
(5)
(6)
(7)
(8)
(9)
(10)
(11)
TR
T0.4
40
-2.0
39
0.1
85
-2.0
65
-2.0
83
-1.2
91
-0.9
08
-1.2
91
-0.9
08
0.4
40
-2.0
39
(2.3
59)
(1.9
57)
(2.4
40)
(2.1
32)
(1.9
87)
(2.2
11)
(2.2
01)
(2.2
11)
(2.2
01)
(2.6
05)
(2.1
29)
Tim
e2.3
64***
1.9
10***
2.1
22***
1.8
87***
-1.9
09***
1.9
07***
1.9
09***
1.9
07***
2.3
64***
1.9
10***
(0.6
30)
(0.5
44)
(0.3
47)
(0.3
76)
-(0
.419)
(0.4
19)
(0.4
19)
(0.4
19)
(0.3
42)
(0.3
92)
TR
T*T
ime
-1.0
88
-0.8
94
-0.9
62**
-0.8
85*
-0.8
80
-0.8
93
-0.8
92
-0.8
93
-0.8
92
-1.0
88**
-0.8
94*
(0.8
68)
(0.7
58)
(0.4
87)
(0.5
12)
(0.7
36)
(0.5
70)
(0.5
70)
(0.5
70)
(0.5
70)
(0.5
16)
(0.5
35)
Age
-1.2
58***
-1.2
48**
-1.2
41***
-0.9
99*
-0.9
84*
-0.9
99*
-0.9
84*
-1.2
58**
(0.3
46)
(0.5
81)
(0.3
57)
(0.5
84)
(0.5
83)
(0.5
84)
(0.5
83)
(0.5
86)
Cla
ss3.6
80***
3.6
26**
3.5
90***
3.9
05***
4.1
39***
3.9
05***
4.1
39***
3.6
80***
(0.8
51)
(1.4
16)
(0.8
76)
(1.3
57)
(1.3
48)
(1.3
57)
(1.3
48)
(1.1
61)
Mal
e-2
.881***
-2.9
03
-2.9
17***
-2.3
57
-2.2
21
-2.3
57
-2.2
21
-2.8
81*
(1.0
81)
(1.8
21)
(1.1
18)
(1.8
35)
(1.8
21)
(1.8
35)
(1.8
21)
(1.6
93)
Sib
lings
dum
my
25.0
3***
25.1
8***
25.2
8***
25.8
1***
25.8
3***
25.8
1***
25.8
3***
25.0
3***
(1.6
02)
(2.0
87)
(1.3
21)
(1.1
66)
(1.1
65)
(1.1
66)
(1.1
65)
(2.9
04)
Log(h
h e
xpen
dit
ure
)0.3
44
0.3
36
0.3
31
0.5
69
0.3
95
0.5
69
0.3
95
0.3
44
(0.9
11)
(1.3
46)
(0.8
25)
(1.4
06)
(1.3
82)
(1.4
06)
(1.3
82)
(1.5
58)
Mis
sing
-42.1
3***
-36.2
8***
-35.5
2***
-35.6
0***
-35.1
4***
-36.2
4***
-36.1
8***
-36.2
4***
-36.1
8***
-42.1
3***
-36.2
8***
(0.8
58)
(1.0
04)
(1.0
33)
(1.0
90)
(1.6
18)
(1.1
81)
(1.1
79)
(1.1
81)
(1.1
79)
(1.4
35)
(1.4
72)
Const
ant
37.2
4***
24.8
0**
36.3
8***
24.9
629.2
7***
16.7
316.8
216.7
316.8
237.2
4***
24.8
0
(1.7
52)
(11.8
7)
(1.7
34)
(18.0
4)
(11.0
5)
(18.6
8)
(18.2
4)
(18.6
8)
(18.2
4)
(2.0
53)
(19.4
4)
Obse
rvat
ions
812
696
812
696
696
696
696
696
696
812
696
R-s
quar
ed0.4
71
0.6
65
0.6
37
0.4
71
0.6
65
Num
ber
of
gro
ups
131
131
131
131
Num
ber
of
indiv
idual
iden
tifi
ers
203
174
Num
ber
of
tim
e4
No
tes:
(i)
Ro
bu
st s
tan
dar
d e
rro
rs i
n p
aren
thes
es f
or
colu
mn
s (1
)-(9
), a
nd
clu
ster
ed s
tan
dar
d e
rro
rs i
n p
aren
thes
es f
or
colu
mn
s (1
0)
amd
(1
1)
(ii)
Co
effi
cien
t o
n t
ime
var
iab
le i
s d
rop
ped
in
Co
lum
n (
5)
du
e to
mu
ltic
oll
inea
rity
wit
h t
he
Tim
e F
ixed
Eff
ect.
Ap
pen
dix
Tab
le 3
. R
egre
ssio
n o
f A
ver
age
Tes
t S
core
s fo
r A
ll S
tud
ents

Dependent Variable:
Regression Form: OLS OLS School-RE School-FE OLS OLS
(1) (2) (3) (4) (5) (6)
TRT 0.414*** 0.498*** 0.498*** 0.565*** 0.024 0.050
(0.147) (0.164) (0.164) (0.173) (0.131) (0.143)
Age 0.0414 0.0414 0.0530 0.028
(0.0496) (0.0574) (0.0581) (0.049)
Class 0.220 0.220 0.188 -0.019
(0.181) (0.169) (0.178) (0.103)
Male -0.113 -0.113 -0.0917 0.046
(0.173) (0.166) (0.179) (0.156)
Log(hh expenditure) 0.0608 0.0608 0.0518 0.083
(0.129) (0.123) (0.131) (0.112)
Constant 1.419*** -1.084 -1.084 -0.991 1.410*** 0.105
(0.0871) (1.553) (1.623) (1.848) (0.083) (1.526)
Observations 61 53 53 53 129 117
R-squared 0.120 0.207 0.222 0 0.012
Number of school 4 4
Notes: (i) Robust standard errors in parentheses: *** p<0.01, ** p<0.05, * p<0.1
(ii) There are only four schools reported due to data limitation.
Appendix Table 4. Regression on Study Time (hours)
Study Time at Completion of Study Study Time at Baseline

OLS OLS(1) (2)
Hours of Study 0.553 2.832(3.089) (3.509)
Age -1.017(1.114)
Class 3.800(3.921)
Male 1.584(3.316)
Log(hh expenditure) 0.733(3.341)
Constant 23.78*** 3.087(5.108) (39.72)
Observations 47 39R-squared 0.001 0.073
Notes: (i) Robust standard errors in parentheses: *** p<0.01, ** p<0.05, * p<0.1
(ii) The dependent variable is the average test score of 1st Final.
Appendix Table 5. Correlation between Test Scores and Reported Study Time