do sober eyewitnesses outperform alcohol intoxicated...
TRANSCRIPT
The European Journal of Psychology Applied to Legal Context, 2013, 5(1): 23-47
www.usc.es/sepjf
Correspondence: Angelica Hagsand. Research unit for Criminal, Legal and Investigative Psychology,
Department of Psychology, University of Gothenburg, P.O. Box 500. SE 405 30 Gothenburg, Sweden.
E-mail: [email protected]
ISSN 1889-1861 © The European Journal of Psychology Applied to Legal Context
DO SOBER EYEWITNESSES OUTPERFORM ALCOHOL
INTOXICATED EYEWITNESSES IN A LINEUP?
Angelica Hagsand*, Emma Roos-af-Hjelmsäter*, Pär Anders Granhag*, Claudia Fahlke*, and
Anna Söderpalm-Gordh**
* Department of Psychology, University of Gothenburg (Sweden)
** Section of Psychiatry and Neurochemistry, Institute of Neuroscience and Physiology, Sahlgrenska
Academy, University of Gothenburg (Sweden)
(Received 9 March 2012; revised 24 September 2012; accepted 28 September 2012)
Abstract Although alcohol intoxicated eyewitnesses
are common, there are only a few studies in the
area. The aim of the current study is to investigate
how different doses of alcohol affect eyewitness
lineup identification performance. The
participants (N = 123) were randomly assigned to
a 3 [Beverage: control (0.0 g/kg ethanol) vs.
lower (0.4 g/kg ethanol) vs. higher alcohol dose
(0.7 g/kg ethanol)] X 2 (Lineup: target-present vs.
target-absent) between-subject design. Participants consumed two glasses of beverage at
an even pace for 15 minutes. Five minutes after
consumption the participants witnessed a film
depicting a staged kidnapping. Seven days later,
the participants returned to the laboratory and
were asked to identify the culprit in a
simultaneous lineup. The result showed that
overall, the participants performed better than
chance; however, their lineup performance was
poor. There were no significant effects of alcohol
intoxication with respect to performance, neither
in target-present nor target-absent lineups. The
study’s results suggest that eyewitnesses who
have consumed a lower (0.4 g/kg ethanol) or a
higher (0.7 g/kg ethanol) dose of alcohol perform
at the same level as sober eyewitnesses in a
lineup. The results are discussed in relation to the alcohol myopia theory and suggestions for future
research are made.
Keywords: alcohol intoxicated; eyewitness
memory; person identification; lineup; alcohol
myopia theory.
Resumen Aunque los testigos presenciales con
intoxicación alcohólica son frecuentes, sólo
contamos con unos pocos estudios en esta área. El
objetivo del presente estudio fue investigar cómo
diferentes dosis de alcohol afectan la ejecución
del testigo presencial en una rueda de
identificación. Los participantes (N = 123) fueron
asignados al azar a una de las condiciones de un
diseño inter-sujetos 3 [Ingesta de alcohol: grupo
control (0.0 g/kg etanol) vs. una dosis pequeña de alcohol (0.4 g/kg etanol) vs. una alta (0.7 g/kg
etanol)] X 2 (Rueda de identificación: sospechoso
presente vs. sospechoso ausente). Cinco minutos
después de la ingesta, los participantes vieron una
película que versaba sobre un secuestro. Siete días
después, los participantes volvieron al laboratorio
y se les pidió que identificaran al culpable en una
rueda de identificación en formato de
presentación simultáneo. Aunque la tasa de
identificación era realmente pobre, los resultados
mostraron que, en general, los testigos
identificaban por encima al azar. No se encontró
un efecto significativo del alcohol en la ejecución,
tanto en ruedas como con el sospechoso presente
como ausente. Estos resultados sugieren que los
testigos presenciales que han consumido una tasa
baja (0.4 g/kg etanol) o alta (0.7 g/kg etanol) de alcohol rinden al mismo nivel en una rueda de
identificación que testigos sobrios. Se discuten los
resultados en relación con la teoría de la miopía
del alcohol y se sugieren futuras líneas de
investigación.
Palabras clave: intoxicación alcohólica; memoria
de testigos; identificación de personas; rueda de
identificación; teoría de la miopía por alcohol.
A. Hagsand et al.
The European Journal of Psychology Applied to Legal Context, 2013, 5(1): 23-47
24
Introduction
Alcohol related crimes are common in western society, meaning that the
offender, victim or eyewitness is intoxicated at the time of the crime. For instance, in
one survey, more than 70% of American law enforcement officers reported that it was
common or very common to be in contact with intoxicated eyewitnesses, and
approximately 20% had conducted a lineup with a witness who had been intoxicated at
the time of the crime (Evans, Schreiber Compo, & Russano, 2009). Considering that the
alcohol consumption in many western countries has increased during recent years, it is
likely that alcohol related crimes will continue to rise (Swedish Council for Information
on Alcohol and other Drugs, 2008). Despite the prevalence of alcohol related crimes,
there is a considerable lack of research on the specific effects of alcohol on eyewitness
memory. Therefore, the present study examined how alcohol affects eyewitness ability
to identify the culprit in a lineup.
This research is important considering the significance of eyewitnesses in many
criminal cases. Identifying the culprit is a difficult task, and errors may occur (Sharps,
Janigian, Hess, & Hayward, 2009). For example, studies have found that approximately
75% of wrongful convictions have been due to erroneous eyewitness identifications
(Wise, Pawlenko, Safer, & Meyer, 2009). Many criminal cases lack technical evidence,
making eyewitnesses an important source of information. Alcohol-related crimes and
intoxicated eyewitnesses are common and there is a lack of research and standard
procedures on how the legal system should value the accuracy of a lineup identification
made by an intoxicated eyewitness (Evans et al., 2009; Malpass et al., 2008).
Knowledge about how alcohol affects eyewitness memory may help the police in their
practical work and is therefore important.
Alcohol disturbs cognitive functions (Giancola & Corman, 2007) including
memory. Alcohol intoxication affect all stages of the encoding process, but primarily
the transition of temporary memories from short term memory to the long term memory
(Mintzer, 2007). Alcohol-induced blackout is caused by a rapid consumption of alcohol
which leads to a high blood alcohol concentration (BAC). The level of the blackout can
vary to either a total memory loss (blackout) or more commonly, a fragmentary loss
(grayout) from the time of intoxication (Lee, Roh, & Kim, 2009).
One theory of relevance is the alcohol myopia theory, which suggests that
intoxicated individuals are cognitively impaired such that they cannot a) pay attention to
Alcohol intoxication and lineup performance 25
The European Journal of Psychology Applied to Legal Context, 2013, 5(1): 23-47
as many stimuli as sober counterparts, and/or b) understand the stimuli to a full extent.
This leads to that a smaller amount of information is encoded compared to sober
individuals. For this reason it is thought that intoxicated individuals will tend to encode
mostly central details, at the expense of peripheral ones (Josephs & Steele, 1990; Steele
& Josephs, 1990). Several studies support the alcohol myopia theory (e.g., Clifasefi,
Takarangi, & Bergman, 2006; MacDonald, MacDonald, Zanna, & Fong, 2000;
Schreiber Compo et al., 2011), while others do not (e.g., van Oorsouw & Merckelbach,
2012). It has therefore been proposed that intoxicated eyewitnesses will have enough
central information about the culprit to make a correct identification in a target-present
lineup (TP condition), with comparable accuracy to sober eyewitnesses. However, due
to their inferior encoding of peripheral information, intoxicated eyewitnesses’ ability to
distinguish a culprit from a foil may be impaired, making them less likely to reject a
target- absent lineup (TA condition), compared with sober individuals (Dysart, Lindsay,
MacDonald, & Wicke, 2002).
To our knowledge, there are only two published studies on the effects of alcohol
on eyewitness lineup performance. In a study by Yuille and Tollestrup (1990),
participants were divided into one of three groups; experimental (alcohol), control or
placebo. The alcohol group received three drinks, with a 30 minute consumption period.
The alcohol dose was 1.32 ml/kg and resulted, 20 minutes after consumption, in a BAC
ranging between 0.06- 0.12%, with a mean of 0.10%. All participants then watched a
staged theft in an office. One week later, they were asked to identify the culprit in a
simultaneous lineup. The response alternative was forced choice (e.g., the culprit is
number X or a not there response). The results showed that alcohol intoxication did not
have an effect on identification accuracy, either in the TP condition or the TA condition.
Although not significant, the intoxicated participants made more foil identifications in
the TA condition compared to the control groups, giving partial support for alcohol
myopia theory.
Dysart et al. (2002) recruited participants in a bar. Those who agreed to
participate were taken to a separate room and BAC measurements were taken.
Participants who had a lower blood alcohol level had a BAC that ranged from 0.00% to
0.04% with a mean of 0.02% (SD = 0.02%). In the high blood alcohol level group,
participants’ BAC ranged from 0.04% to 0.20% with a mean of 0.09% (SD = 0.04%).
Each participant was then asked to identify the recruiter in a show-up (single photo),
with a retention interval of only a few minutes. The response alternative was
A. Hagsand et al.
The European Journal of Psychology Applied to Legal Context, 2013, 5(1): 23-47
26
dichotomous (yes or no response). It was found that the level of intoxication did not
have a significant effect on performance in the TP lineup, but as the level of intoxication
increased, participants in the TA lineup made fewer rejections, which gives support for
alcohol myopia theory.
Additional variables examined in the present study were confidence ratings and
sex. Eyewitnesses who are confident in their lineup decision have sometimes been
found to make more correct identifications of the culprit than eyewitnesses who are less
confident (e.g., Brewer, Weber, Clark, & Wells, 2008). The effects of alcohol on
eyewitness confidence has, however, produced equivocal results (compare Yuille &
Tollestrup, 1990 with Dysart et al., 2002), begging the need for further research. With
respect to sex differences, women have been found to outperform men in face
recognition tasks, especially if the face seen is another woman (Lovén et al., 2012;
Lovén, Herlitz, & Rehnman, 2011). Moreover, alcohol may affect memory differently
for men and women (Mumenthaler, Taylor, O’Hara, & Yesavage, 1999). It is unknown
whether a sex difference also occurs when the event in question is something that may
affect arousal levels, for example a crime event (Colley, Ball, Kirby, Harvey, &
Vingelen, 2002; Lindholm & Christianson, 1998). The studies in the alcohol and lineup
area has either not found any sex differences (Dysart et al., 2002), or not analyzed sex
differences (Yuille & Tollestrup, 1990).
An eyewitness lineup choice depends on the match between the faces in the
lineup and the eyewitness’ memory of the culprit’s face (Clark, 2003). Previous
research on alcohol intoxicated eyewitnesses has used either a forced or dichotomous
lineup response, which may lead to a higher number of false identifications than in a
real life setting. New research has shown that both eyewitnesses with a poor memory of
the culprit, and eyewitnesses with a good memory, can be uncertain and benefit by the
inclusion of a don’t remember (or not sure) response alternative during the lineup.
Including such a response option may, for example, decrease the number of false
identifications and moderate the outcome of the lineup (Steblay & Phillips, 2011;
Weber & Perfect, 2011).
In order to reduce the gap in knowledge as discussed above, the present study
was designed to examine how alcohol affects eyewitness ability to identify the culprit in
a lineup, in both target-present and target-absent conditions. The current study advances
previous research on several accounts. First, two different doses of alcohol were used, a
lower (0.4 g/kg ethanol) and a higher alcohol dose (0.7 g/kg ethanol) in a controlled
Alcohol intoxication and lineup performance 27
The European Journal of Psychology Applied to Legal Context, 2013, 5(1): 23-47
laboratory environment. These doses are often referred, in alcohol research experiments,
to as a lower to moderate level of alcohol intoxication (e.g., Dougherty, Marsh, Moeller,
Chokshi, & Rosen, 2000; Holdstock, Penland, Morrow, & de Wit, 2006; King, Houle,
de Wit, Holdstock, & Schuster, 2002). Second, with the aim of increased ecological
validity, the stimulus material was a film showing a staged violent kidnapping, with a
scene where the culprit pointed a weapon towards the witness. Third, as suggested by
previous research (Steblay & Phillips, 2011; Weber & Perfect, 2011) a not sure
response was included. A fourth aim was to examine how alcohol affects eyewitness
lineup performance with respect to sex.
In line with the alcohol myopia theory, it was hypothesized that in the target-
present condition, blood alcohol concentration would not have a significant effect on
lineup performance (Hypothesis 1). In the target-absent condition, a higher degree of
alcohol intoxication was expected to result in a poorer lineup performance (Hypothesis
2).
Method
Participants
The participants were non-problem social drinkers recruited through
announcement boards at the University of Gothenburg, Sweden. Of the total number of
participants (N = 133) at the first session, 10 did not conduct the lineup one week later.
The statistical analyses were performed on data from the participants who completed the
follow up (N = 123, 60.2% women and 39.8% men). The participants were distributed
over a) a control group (N= 41), b) a lower alcohol dose group (N = 42) and c) a higher
alcohol dose group (N = 40). The proportion of men and women did not differ between
the three groups, χ²(2, N = 123) = 2.19, ns. The participants were students (97.6 %
Caucasian) with a mean age of 25.07 (SD = 3.45) and mean weight of 69.98 kg (SD =
12.61).
Design
Participants were randomly assigned to a 3 (Beverage: 0.0 g/kg ethanol [i.e.
control] vs. 0.4 g/kg ethanol [i.e. a lower alcohol dose] vs. 0.7 g/kg ethanol [i.e. a higher
alcohol dose]) x 2 (Lineup: target-present vs. target-absent) between-subject design. The
dependent measures were lineup performance and confidence ratings.
A. Hagsand et al.
The European Journal of Psychology Applied to Legal Context, 2013, 5(1): 23-47
28
Materials and measures
Laboratory environment
The study took place in a laboratory located at the Addiction Biology Unit
(Section of Psychiatry and Neurochemistry, Institute of Neuroscience and Physiology),
of the Sahlgrenska Academy at the University of Gothenburg (Sweden). It is an
established laboratory for clinical alcohol experiments and is furnished and decorated as
a living room (with couch, chairs, table, lamps, window, curtain, paintings and TV), in
order to create a relaxed environment. During the experiment phase the participants
were not allowed to use tobacco or to use their mobile phones, music players, laptops,
watch TV, or to study or read magazines. All participants had the same viewing
distance to the large TV screen, approximately 3 to 4 meters.
Beverage
Alcohol (Absolute Vodka 40%) was mixed with orange juice (pulp free). The
target alcohol doses were 0.4 g/kg ethanol and 0.7 g/kg ethanol; this means that the
doses were adjusted for body weight. The target BAC was 0.04% and 0.07%, which is
above the Swedish legal driving limit at 0.02%. This degree of intoxication typically
results in behavior changes such as extraversion, joyfulness, and talkativeness, but also
cognitive impairments of concentration, reasoning, perception, and peripheral vision.
The participants in the alcohol groups knew that they were consuming alcohol, but they
were unaware of whether they received the lower or higher alcohol dose. The control
group knew that they only received orange juice and this was administrated in the same
volume as the total amount of liquid that the higher alcohol dose group received. The
beverage in all groups was served cold in two glasses with a total consumption time of
15 minutes (7 minutes and 30 seconds per glass).
Objective measure
The objective measure was breath alcohol concentration (BAC). The BACs were
estimated from blood alcohol level (BAL) using the portable breathalyzer Alert J5
(Alcohol Countermeasure Systems Corp, 2006). One breathalyzer was used for each
session and was calibrated when necessary. The objective measure was taken while
participants were seated.
Alcohol intoxication and lineup performance 29
The European Journal of Psychology Applied to Legal Context, 2013, 5(1): 23-47
Subjective measure
The Biphasic Alcohol Effects Scale (BAES) (Martin, Earleywine, Musty,
Perrine, & Swift, 1993) was used to measure the subjective effect of alcohol. The BAES
is a 14-item adjective rating scale consisting of two subscales that measure the
stimulative and sedative effects of alcohol. The participants rated the extent to which
they experienced each adjective on a 100-point scale from “not at all” (0) to
“extremely” (100). Each participant’s ratings were later combined into two measures:
one stimulative (summing scores for the adjectives “elated”, “energetic”, “excited”,
“stimulated”, “talkative”, “up” and “vigorous”) and one sedative (summing scores for
the adjectives “down”, “heavy head”, “inactive”, “difficulty concentrating”, “sedated”,
“slow thoughts” and “sluggish”). The BAES scale has good psychometric properties
that correspond to the ascending and descending limb of the blood alcohol curve (see:
Söderpalm-Gordh & Söderpalm, 2011).
Stimulus event
The stimulus event consisted of a film, shot from the perspective of an
eyewitness who sees two men kidnapping a woman at a bus stop. The film lasted 4
minutes and 50 seconds, with both culprits and the victim filmed from various angles.
Close views of the main culprit’s face were available for 31 seconds, the other culprit’s
face for 14 seconds, and the victim’s face for 53 seconds. The film has been used in a
number of previous studies (e.g., Allwood, Ask, & Granhag, 2005; Allwood, Granhag,
& Jonsson, 2006; Granhag, 1997).
The identification task
The lineup was simultaneous and presented via a computer monitor. This
presenting method has been used in previous research (e.g., Lindsay, Semmler, Weber,
Brewer, & Lindsay, 2008; Sauer, Brewer, & Wells, 2008) and has several advantages,
for instance double blind administration. Double blind administration has been shown to
be very important in order to not influence the witness decision (Rodriguez & Berry,
2012). The lineup was constructed and presented using the online survey software
program Unipark. In order to achieve high ecological validity, the retention interval
between the crime and the lineup was set to seven days, which has been used in one
previous study about alcohol intoxicated eyewitnesses lineup performance (see Yuille &
Tollestrup, 1990).
A. Hagsand et al.
The European Journal of Psychology Applied to Legal Context, 2013, 5(1): 23-47
30
The lineup consisted of three consecutive separate pages; instructions, the
identification task, and confidence ratings. The unbiased instructions explained the task
to identify the main culprit (the man with the gun in the film) from photos. In line with
lineup guidelines there was also a warning that “a photo of the culprit may or may not
be present in the lineup”. The simultaneous lineup consisted of eight color photos.
Seven photos were of foils and one photo of the culprit (target-present condition) or the
culprit’s replacement (target-absent condition). Foils consisted of color photos of
inmates and were downloaded from the Arkansas Department of Corrections Web site
and from Florida’s Department of Corrections Web site, which also previous
researchers has done (Zarkadi, Wade, & Stewart, 2009). The photos provided a front
view of the foils from the chest up and were edited by a professional photographer in
order to be similar in terms of size (6.5 cm x 7.1 cm), background, and sharpness. Both
foils and target replacement were chosen, by the main authors, in order to be of average
similarity in physical appearance to the culprit with regard to age, sex, ethnicity, glasses
and hairstyle. The position of the target and the target replacement was varied randomly
to appear an equal number of times at all eight positions in the lineup. Under the photos,
the following question was posed; “Is the culprit present in the photos shown above?”
The response alternatives were “Yes” and then the number of the photo, “No, the culprit
is not present”, and “Do not remember”. Following this, the participants were required
to explain in their own words how they had reached their decision. The third and final
page asked the participants to rate how confident they were about the correctness of
their decision. The scale was an 11 point likert scale which ranged from 1 (Not at all
confident) to 11 (Completely confident). The participants expressed their confidence by
clicking on one of the 11 on-screen buttons. Participants who had provided a don’t
remember answer did not view the confidence rating scale page.
Procedure
Recruitment and screening of participants
The participants were screened for initial eligibility by a research nurse via
telephone. Potential participants were invited to the laboratory for a physical
examination by a medical doctor. They also completed the Psychiatric Symptom
Checklist (Derogatis, 1983) and the Alcohol Use Disorder Identification Test (AUDIT;
Babor, Higgins-Biddle, Saunders, & Monteiro, 2001). A health questionnaire with
sections about current and lifetime drug was used. This questionnaire was a Swedish
Alcohol intoxication and lineup performance 31
The European Journal of Psychology Applied to Legal Context, 2013, 5(1): 23-47
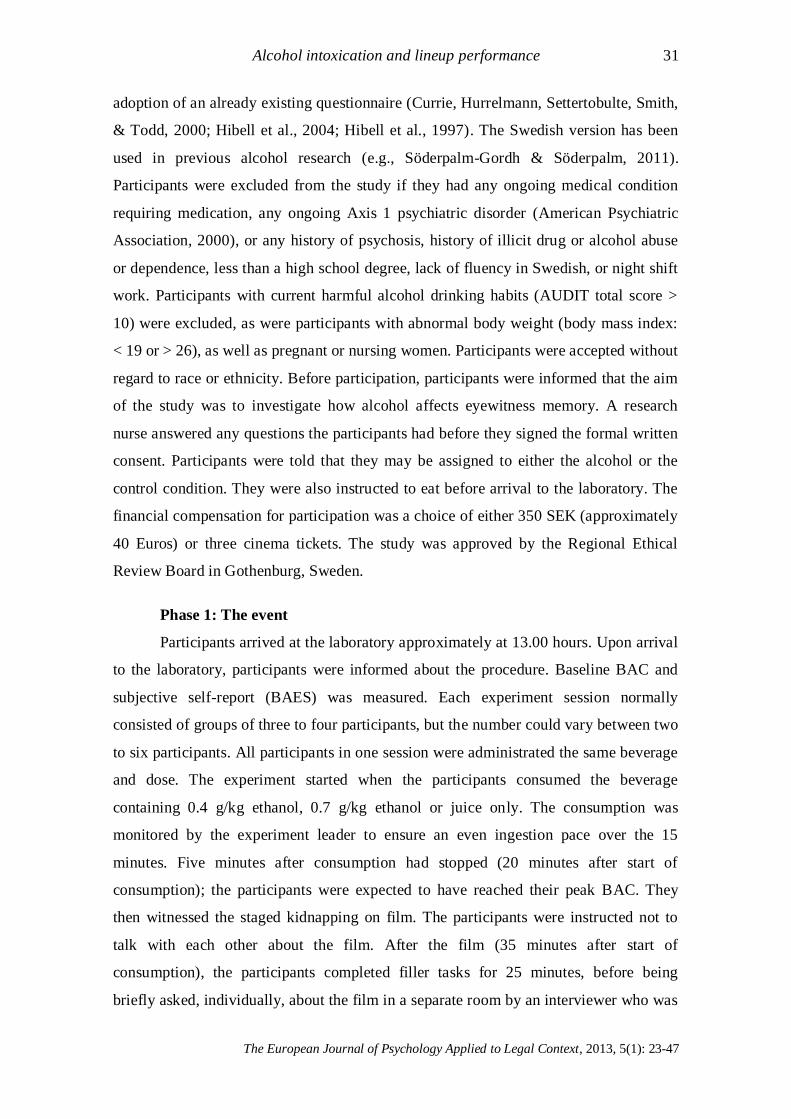
adoption of an already existing questionnaire (Currie, Hurrelmann, Settertobulte, Smith,
& Todd, 2000; Hibell et al., 2004; Hibell et al., 1997). The Swedish version has been
used in previous alcohol research (e.g., Söderpalm-Gordh & Söderpalm, 2011).
Participants were excluded from the study if they had any ongoing medical condition
requiring medication, any ongoing Axis 1 psychiatric disorder (American Psychiatric
Association, 2000), or any history of psychosis, history of illicit drug or alcohol abuse
or dependence, less than a high school degree, lack of fluency in Swedish, or night shift
work. Participants with current harmful alcohol drinking habits (AUDIT total score >
10) were excluded, as were participants with abnormal body weight (body mass index:
< 19 or > 26), as well as pregnant or nursing women. Participants were accepted without
regard to race or ethnicity. Before participation, participants were informed that the aim
of the study was to investigate how alcohol affects eyewitness memory. A research
nurse answered any questions the participants had before they signed the formal written
consent. Participants were told that they may be assigned to either the alcohol or the
control condition. They were also instructed to eat before arrival to the laboratory. The
financial compensation for participation was a choice of either 350 SEK (approximately
40 Euros) or three cinema tickets. The study was approved by the Regional Ethical
Review Board in Gothenburg, Sweden.
Phase 1: The event
Participants arrived at the laboratory approximately at 13.00 hours. Upon arrival
to the laboratory, participants were informed about the procedure. Baseline BAC and
subjective self-report (BAES) was measured. Each experiment session normally
consisted of groups of three to four participants, but the number could vary between two
to six participants. All participants in one session were administrated the same beverage
and dose. The experiment started when the participants consumed the beverage
containing 0.4 g/kg ethanol, 0.7 g/kg ethanol or juice only. The consumption was
monitored by the experiment leader to ensure an even ingestion pace over the 15
minutes. Five minutes after consumption had stopped (20 minutes after start of
consumption); the participants were expected to have reached their peak BAC. They
then witnessed the staged kidnapping on film. The participants were instructed not to
talk with each other about the film. After the film (35 minutes after start of
consumption), the participants completed filler tasks for 25 minutes, before being
briefly asked, individually, about the film in a separate room by an interviewer who was
A. Hagsand et al.
The European Journal of Psychology Applied to Legal Context, 2013, 5(1): 23-47
32
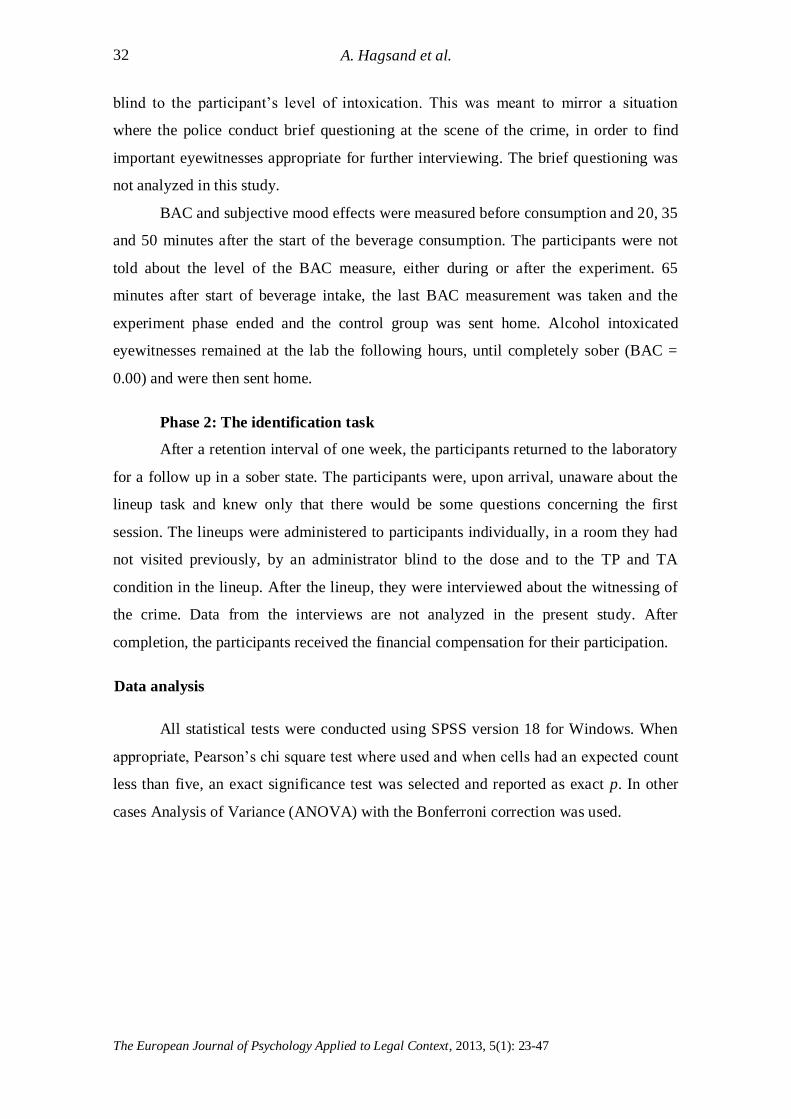
blind to the participant’s level of intoxication. This was meant to mirror a situation
where the police conduct brief questioning at the scene of the crime, in order to find
important eyewitnesses appropriate for further interviewing. The brief questioning was
not analyzed in this study.
BAC and subjective mood effects were measured before consumption and 20, 35
and 50 minutes after the start of the beverage consumption. The participants were not
told about the level of the BAC measure, either during or after the experiment. 65
minutes after start of beverage intake, the last BAC measurement was taken and the
experiment phase ended and the control group was sent home. Alcohol intoxicated
eyewitnesses remained at the lab the following hours, until completely sober (BAC =
0.00) and were then sent home.
Phase 2: The identification task
After a retention interval of one week, the participants returned to the laboratory
for a follow up in a sober state. The participants were, upon arrival, unaware about the
lineup task and knew only that there would be some questions concerning the first
session. The lineups were administered to participants individually, in a room they had
not visited previously, by an administrator blind to the dose and to the TP and TA
condition in the lineup. After the lineup, they were interviewed about the witnessing of
the crime. Data from the interviews are not analyzed in the present study. After
completion, the participants received the financial compensation for their participation.
Data analysis
All statistical tests were conducted using SPSS version 18 for Windows. When
appropriate, Pearson’s chi square test where used and when cells had an expected count
less than five, an exact significance test was selected and reported as exact p. In other
cases Analysis of Variance (ANOVA) with the Bonferroni correction was used.
Alcohol intoxication and lineup performance 33
The European Journal of Psychology Applied to Legal Context, 2013, 5(1): 23-47
Results
Manipulation check
Objective measure
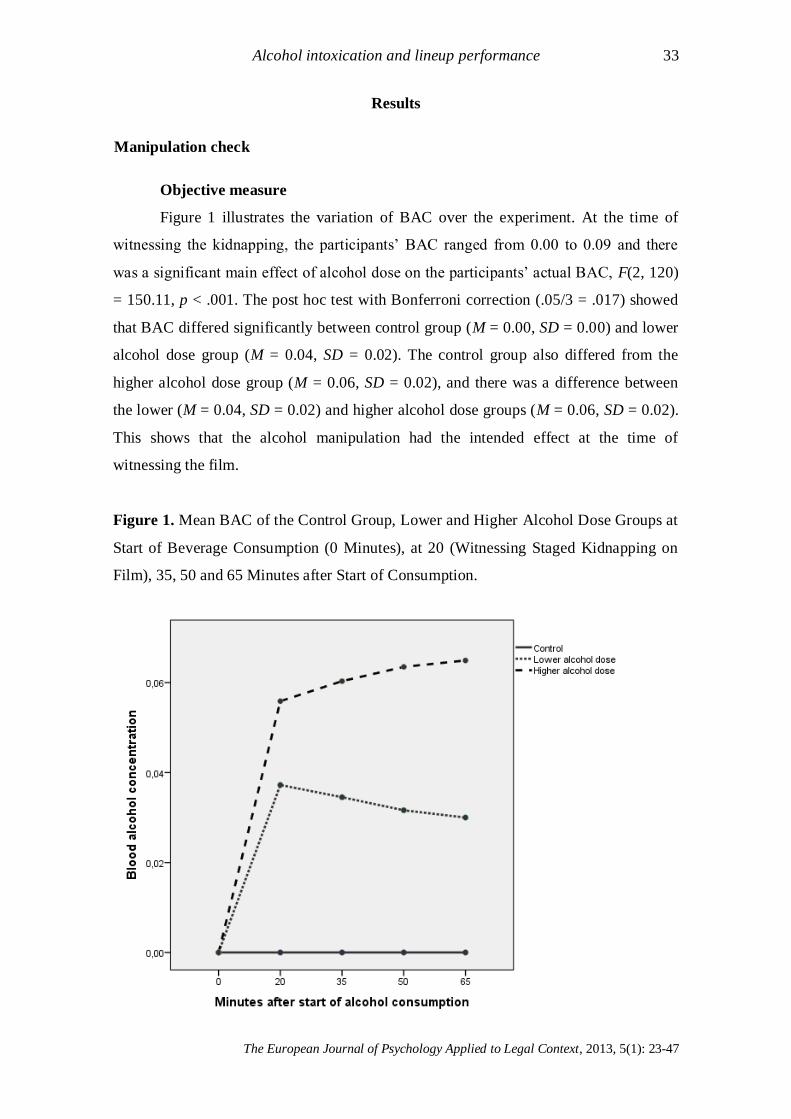
Figure 1 illustrates the variation of BAC over the experiment. At the time of
witnessing the kidnapping, the participants’ BAC ranged from 0.00 to 0.09 and there
was a significant main effect of alcohol dose on the participants’ actual BAC, F(2, 120)
= 150.11, p < .001. The post hoc test with Bonferroni correction (.05/3 = .017) showed
that BAC differed significantly between control group (M = 0.00, SD = 0.00) and lower
alcohol dose group (M = 0.04, SD = 0.02). The control group also differed from the
higher alcohol dose group (M = 0.06, SD = 0.02), and there was a difference between
the lower (M = 0.04, SD = 0.02) and higher alcohol dose groups (M = 0.06, SD = 0.02).
This shows that the alcohol manipulation had the intended effect at the time of
witnessing the film.
Figure 1. Mean BAC of the Control Group, Lower and Higher Alcohol Dose Groups at
Start of Beverage Consumption (0 Minutes), at 20 (Witnessing Staged Kidnapping on
Film), 35, 50 and 65 Minutes after Start of Consumption.

A. Hagsand et al.
The European Journal of Psychology Applied to Legal Context, 2013, 5(1): 23-47
34
Subjective measure
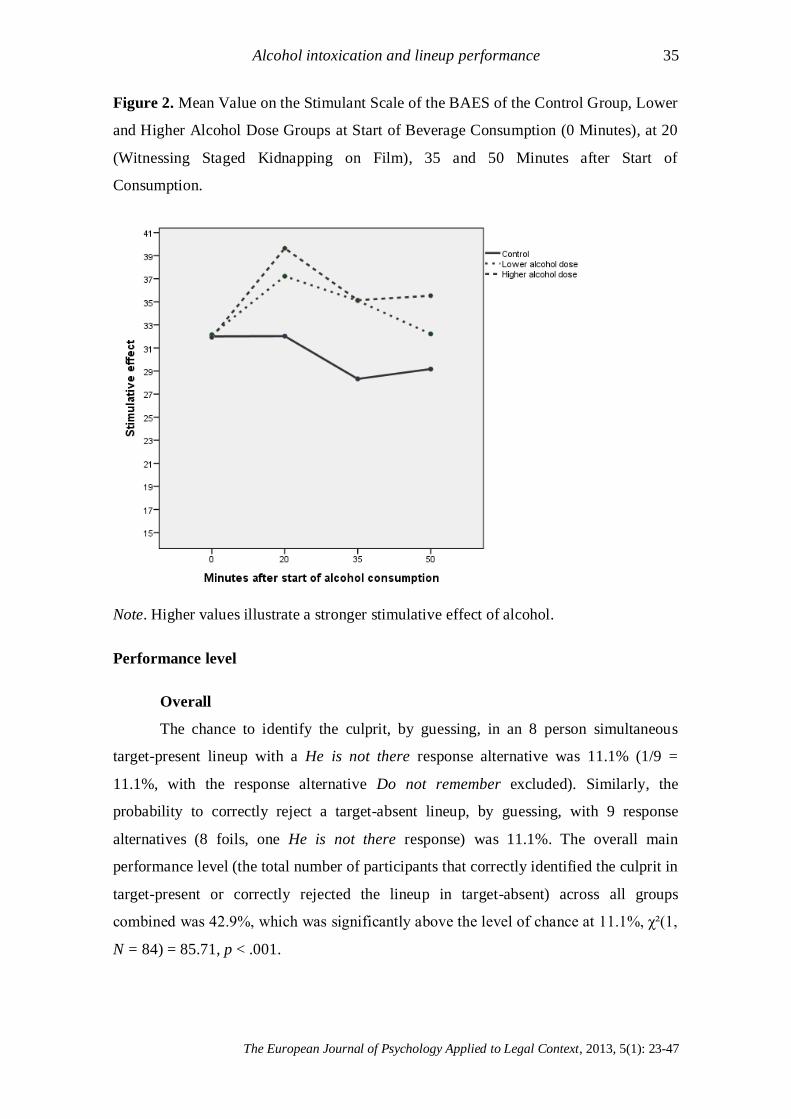
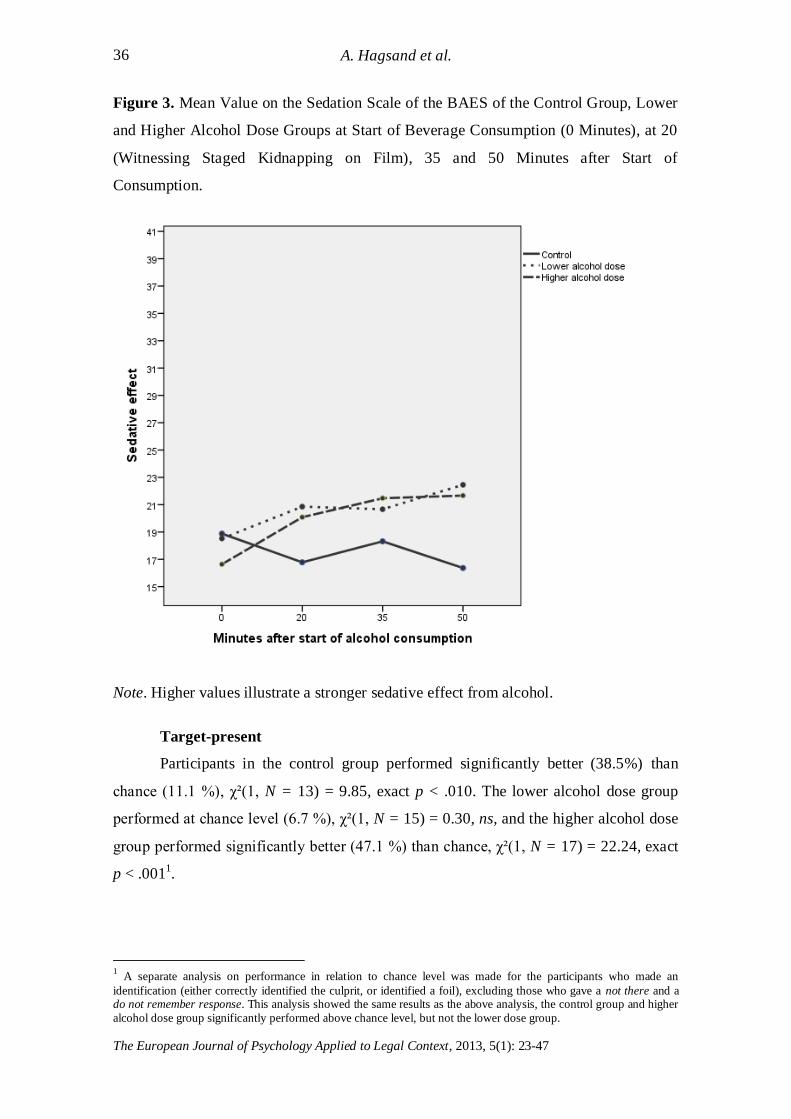
By the time when the staged kidnapping was shown, the participants reported a
stimulative effect of alcohol (see Figure 2), while they did not yet experience a large
sedative effects (Figure 3). This means that the participants were still alert when they
witnessed the kidnapping. The figures illustrate how the stimulant and sedation effect of
the alcohol developed over the experiment time which can be compared to the changes
in BAC in Figure 1. At the time of witnessing the staged kidnapping, there was a
significant effect of alcohol dose on the stimulant scale of the BAES, F(2, 116) = 5.39,
p < .01 (see Figure 2). A post hoc with Bonferroni correction showed a significant
difference between the control group (M = 32.02, SD = 8.64) and the higher alcohol
dose group (M = 39.64, SD = 11.76), with the higher alcohol dose group experiencing
more stimulation. There was no significant difference in stimulation between the
participants in the control group (M = 32.02, SD = 8.64) and the lower alcohol dose
group (M = 37.21, SD = 10.96), or between the lower (M = 37.21, SD = 10.96) and
higher alcohol dose groups (M = 39.64, SD = 11.76). There was no significant main
effect of alcohol dose on the sedation scale of the BAES, F(2, 116) = 1.97, ns, at the
time of witnessing the film, control group (M = 16.78, SD = 7.49), lower alcohol dose
group (M = 20.86, SD = 10.61) and higher alcohol dose group (M = 20.08, SD = 11.27)
(see Figure 3).
Alcohol intoxication and lineup performance 35
The European Journal of Psychology Applied to Legal Context, 2013, 5(1): 23-47
Figure 2. Mean Value on the Stimulant Scale of the BAES of the Control Group, Lower
and Higher Alcohol Dose Groups at Start of Beverage Consumption (0 Minutes), at 20
(Witnessing Staged Kidnapping on Film), 35 and 50 Minutes after Start of
Consumption.
Note. Higher values illustrate a stronger stimulative effect of alcohol.
Performance level
Overall
The chance to identify the culprit, by guessing, in an 8 person simultaneous
target-present lineup with a He is not there response alternative was 11.1% (1/9 =
11.1%, with the response alternative Do not remember excluded). Similarly, the
probability to correctly reject a target-absent lineup, by guessing, with 9 response
alternatives (8 foils, one He is not there response) was 11.1%. The overall main
performance level (the total number of participants that correctly identified the culprit in
target-present or correctly rejected the lineup in target-absent) across all groups
combined was 42.9%, which was significantly above the level of chance at 11.1%, χ²(1,
N = 84) = 85.71, p < .001.
A. Hagsand et al.
The European Journal of Psychology Applied to Legal Context, 2013, 5(1): 23-47
36
Figure 3. Mean Value on the Sedation Scale of the BAES of the Control Group, Lower
and Higher Alcohol Dose Groups at Start of Beverage Consumption (0 Minutes), at 20
(Witnessing Staged Kidnapping on Film), 35 and 50 Minutes after Start of
Consumption.
Note. Higher values illustrate a stronger sedative effect from alcohol.
Target-present
Participants in the control group performed significantly better (38.5%) than
chance (11.1 %), χ²(1, N = 13) = 9.85, exact p < .010. The lower alcohol dose group
performed at chance level (6.7 %), χ²(1, N = 15) = 0.30, ns, and the higher alcohol dose
group performed significantly better (47.1 %) than chance, χ²(1, N = 17) = 22.24, exact
p < .0011.
1 A separate analysis on performance in relation to chance level was made for the participants who made an
identification (either correctly identified the culprit, or identified a foil), excluding those who gave a not there and a do not remember response. This analysis showed the same results as the above analysis, the control group and higher
alcohol dose group significantly performed above chance level, but not the lower dose group.
Alcohol intoxication and lineup performance 37
The European Journal of Psychology Applied to Legal Context, 2013, 5(1): 23-47
Target-absent
In the target-absent condition, participants in all three groups performed better
than the 11.1% expected by chance: control group, 41.7%, χ²(1, N = 12) = 11.34, exact
p < .01; lower alcohol dose group, 72.7%, χ²(1, N = 11) = 42.28, exact p < .001; and
higher alcohol dose group, 56.3%, χ²(1, N = 16) = 33.01, exact p < .001.
Main results: The effect of Alcohol on Lineup Performance
Target-present
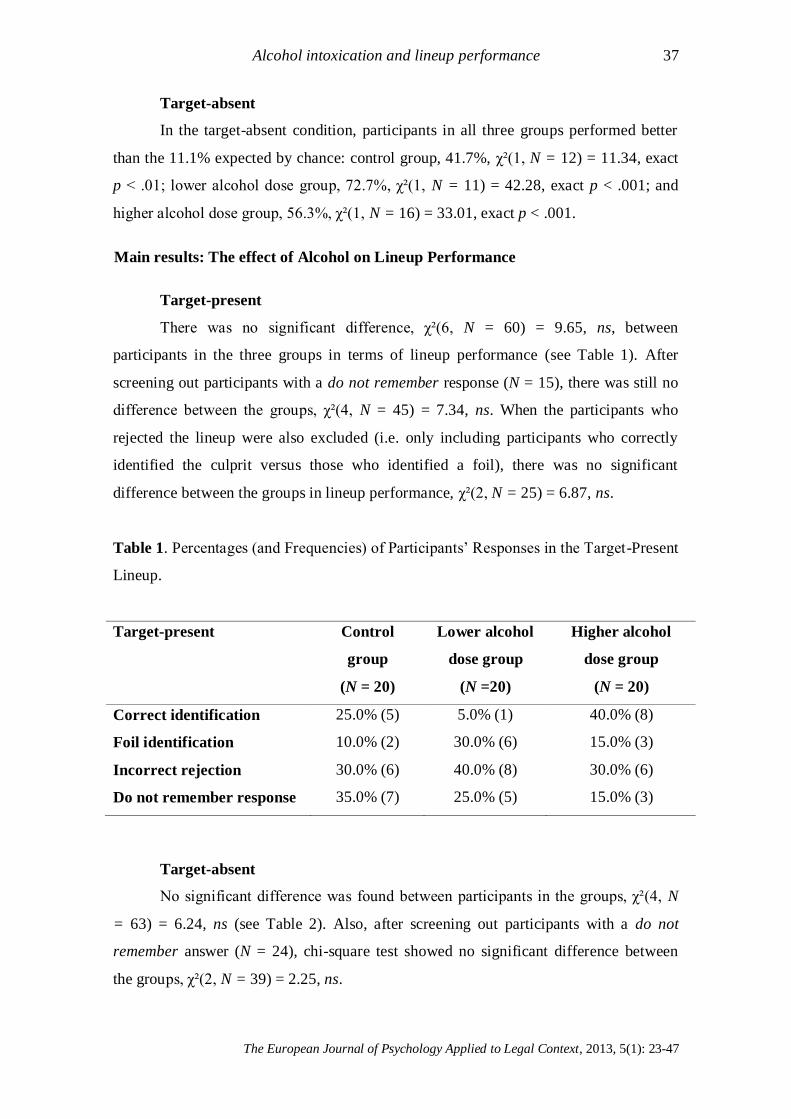
There was no significant difference, χ²(6, N = 60) = 9.65, ns, between
participants in the three groups in terms of lineup performance (see Table 1). After
screening out participants with a do not remember response (N = 15), there was still no
difference between the groups, χ²(4, N = 45) = 7.34, ns. When the participants who
rejected the lineup were also excluded (i.e. only including participants who correctly
identified the culprit versus those who identified a foil), there was no significant
difference between the groups in lineup performance, χ²(2, N = 25) = 6.87, ns.
Table 1. Percentages (and Frequencies) of Participants’ Responses in the Target-Present
Lineup.
Target-present Control
group
(N = 20)
Lower alcohol
dose group
(N =20)
Higher alcohol
dose group
(N = 20)
Correct identification 25.0% (5) 5.0% (1) 40.0% (8)
Foil identification 10.0% (2) 30.0% (6) 15.0% (3)
Incorrect rejection 30.0% (6) 40.0% (8) 30.0% (6)
Do not remember response 35.0% (7) 25.0% (5) 15.0% (3)
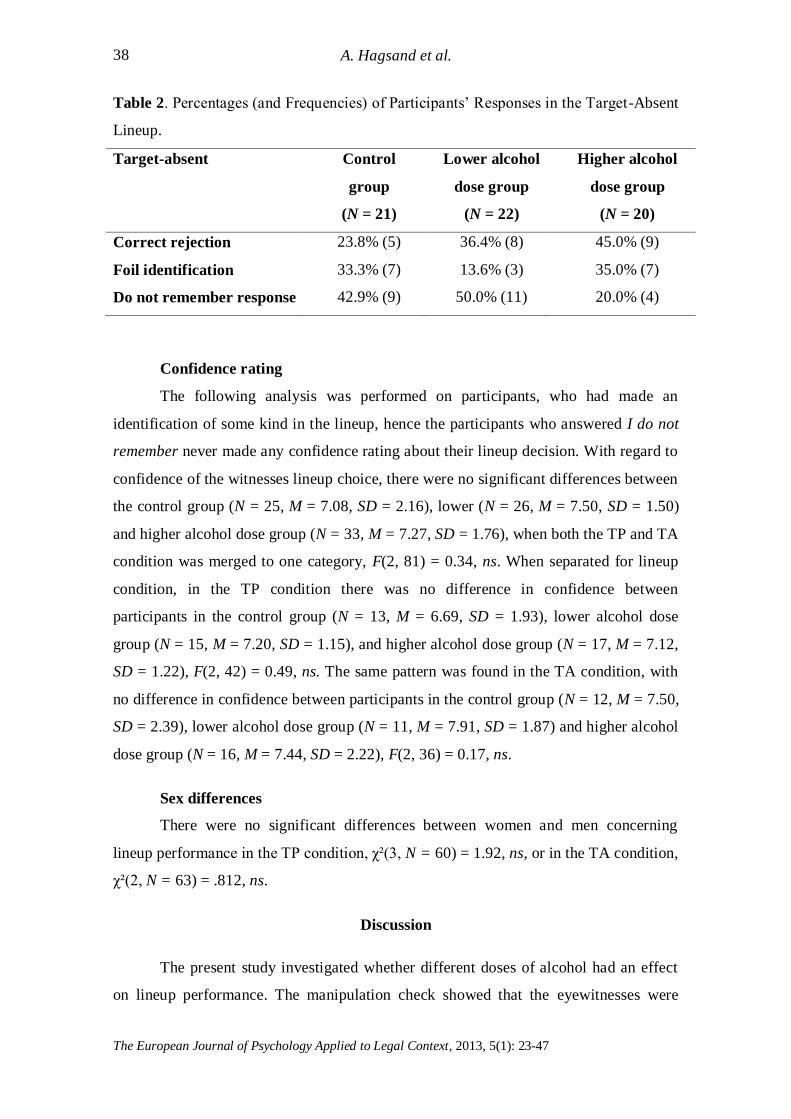
Target-absent
No significant difference was found between participants in the groups, χ²(4, N
= 63) = 6.24, ns (see Table 2). Also, after screening out participants with a do not
remember answer (N = 24), chi-square test showed no significant difference between
the groups, χ²(2, N = 39) = 2.25, ns.
A. Hagsand et al.
The European Journal of Psychology Applied to Legal Context, 2013, 5(1): 23-47
38
Table 2. Percentages (and Frequencies) of Participants’ Responses in the Target-Absent
Lineup.
Target-absent Control
group
(N = 21)
Lower alcohol
dose group
(N = 22)
Higher alcohol
dose group
(N = 20)
Correct rejection 23.8% (5) 36.4% (8) 45.0% (9)
Foil identification 33.3% (7) 13.6% (3) 35.0% (7)
Do not remember response 42.9% (9) 50.0% (11) 20.0% (4)
Confidence rating
The following analysis was performed on participants, who had made an
identification of some kind in the lineup, hence the participants who answered I do not
remember never made any confidence rating about their lineup decision. With regard to
confidence of the witnesses lineup choice, there were no significant differences between
the control group (N = 25, M = 7.08, SD = 2.16), lower (N = 26, M = 7.50, SD = 1.50)
and higher alcohol dose group (N = 33, M = 7.27, SD = 1.76), when both the TP and TA
condition was merged to one category, F(2, 81) = 0.34, ns. When separated for lineup
condition, in the TP condition there was no difference in confidence between
participants in the control group (N = 13, M = 6.69, SD = 1.93), lower alcohol dose
group (N = 15, M = 7.20, SD = 1.15), and higher alcohol dose group (N = 17, M = 7.12,
SD = 1.22), F(2, 42) = 0.49, ns. The same pattern was found in the TA condition, with
no difference in confidence between participants in the control group (N = 12, M = 7.50,
SD = 2.39), lower alcohol dose group (N = 11, M = 7.91, SD = 1.87) and higher alcohol
dose group (N = 16, M = 7.44, SD = 2.22), F(2, 36) = 0.17, ns.
Sex differences
There were no significant differences between women and men concerning
lineup performance in the TP condition, χ²(3, N = 60) = 1.92, ns, or in the TA condition,
χ²(2, N = 63) = .812, ns.
Discussion
The present study investigated whether different doses of alcohol had an effect
on lineup performance. The manipulation check showed that the eyewitnesses were
Alcohol intoxication and lineup performance 39
The European Journal of Psychology Applied to Legal Context, 2013, 5(1): 23-47
alcohol intoxicated (measured objectively by a breathalyzer), and they were also feeling
stimulated by the alcohol at the time of witnessing the crime (measured by the
subjective BAES).
In relation to the identification accuracy, there was no difference between
participants in the three groups in terms of lineup performance in the TP condition
(supporting Hypothesis 1), which is consistent with a previous study (Yuille &
Tollestrup, 1990). The present result held true even when excluding those participants
who gave a do not remember answer and never made a lineup choice. This analysis was
motivated by the new direction in lineup research which has shown that it is important
to have a do not remember response alternative in order to screen out eyewitnesses who
are unsure and to increase lineup accuracy (Steblay & Phillips, 2011; Weber & Perfect,
2011). If the do not remember response alternative had not been available, it is likely
that more participants would have identified a foil, and also that more eyewitnesses
would have made correct identifications by guessing. In our study, over both lineup
conditions, 31.7% of the participants gave a do not remember response and in the TP
condition 25.0% gave this response. The high frequency of do not remember responses
reflects reality in highlighting the difficulties eyewitnesses have in judging whether the
culprit is present or not, and who it might be. The result is similar to previous research
which had 27.0% not sure responses in a TP lineup (Steblay & Phillips, 2011). One
study showed that 19.3% of the participants gave a not sure response when this
response alternative was explicit, but only 2.2% of the participants came up with this
response on their own when it was not provided (Weber & Perfect, 2011).
For the TA condition, no significant difference was found between the groups
with respect to lineup performance, thus Hypothesis 2 was not supported. The results
correspond to a previous study with similar design (Yuille & Tollestrup, 1990). A large
amount (38.1%) of eyewitnesses gave a do not remember response in our study and no
differences between the groups were found when these participants were excluded from
the analyses. Even though there were no significant differences between the groups, the
performance levels were better than chance.
Overall, in the TP condition and the TA condition, all groups, except for the
lower dose in the TP condition, performed significantly better than chance. Nonetheless,
despite that the performance level was above chance, the identification rate of the
culprit was poor. In previous research, there is a wide range between studies in how
well eyewitnesses perform in a lineup task, which may be due to for example
A. Hagsand et al.
The European Journal of Psychology Applied to Legal Context, 2013, 5(1): 23-47
40
differences in stimuli, designs, and retention intervals. Two meta-analyses showed that
approximately 50% of participants succeed in identifying the culprit in the TP condition
(Steblay, Dysart, Fulero, & Lindsay, 2001; Steblay, Dysart, & Wells, 2011), but the
range varies considerably. Some studies, including the present, have an identification
rate in the lower range of approximately 25% (Brewer et al., 2008), while other studies
have an identification rate of 90% (Yuille & Tollestrup, 1990). In the TA condition,
meta-analysis has shown that the rate for correct rejection is 43-49% (Steblay et al.,
2001; Steblay et al., 2011), and the current outcome is in the lower part of the range,
while other studies are above with a correct rejection rate of 60-75% (Brewer et al.,
2008; Yuille & Tollestrup, 1990). In a practical context, it is important to remember that
eyewitnesses’ performance level varies considerably, making it difficult to determine
eyewitness accuracy in a certain case.
According to the alcohol myopia theory (Josephs & Steele, 1990; Steele &
Josephs, 1990), central features and stimuli will be encoded to the same degree among
intoxicated and sober individuals. From this one could infer that intoxicated
eyewitnesses will be able to identify the culprit in the TP condition to the same extent as
sober eyewitnesses. The alcohol myopia theory also predicts that non central details will
be more poorly encoded among intoxicated individuals and one could therefore assume
that intoxicated eyewitnesses will be comparatively more likely to conclude that a
similar looking foil is the culprit in the TA condition. The results of the study by Dysart
et al. (2002), which used a show-up immediately after a non-criminal event, supported
this theory. The results from the current study and that by Yuille and Tollestrup (1990),
who both used a simultaneous lineup one week after an event, showed support for the
alcohol myopia in the TP condition, but not in the TA condition. The different results
may be due to different levels of BAC between the studies. The participants’ BAC in
the present study was approximately in the same range (0.00-0.09%) as in study by
Yuille and Tollestrup (1990) (0.06-0.12%) and both studies support the alcohol myopia
theory in the TP condition, but not in the TA condition. In the study by Dysart et al.
(2002), BAC ranged from 0.00 to 0.21%, meaning that some participants were more
intoxicated than participants in the other two studies. This higher alcohol intoxication
level may be one factor explaining the support for the alcohol myopia theory. However,
it is important to highlight that the study by Dysart et al. (2002) also used a different
design and method (e.g., immediate show-up and no criminal event) and the participants
had a live target and were not asked to focus their attention on a specific film, as in our
Alcohol intoxication and lineup performance 41
The European Journal of Psychology Applied to Legal Context, 2013, 5(1): 23-47
study, where the whole film may have been perceived as a central stimulus. Although
not significant, the study by Yuille and Tollestrup (1990) showed that the intoxicated
eyewitnesses made more foil identifications in the TA condition compared to the
eyewitnesses in the control group. In our study, the level of foil identification in the TA
condition was approximately the same in the control and higher alcohol dose group (see
Table 2), which does not give support to the alcohol myopia theory. Overall, in the
context of simultaneous lineup identifications one week after an event, the prediction of
the alcohol myopia theory seems to hold for the TP condition, but not for the TA
condition. Thus, more studies are needed to examine to what extent the alcohol myopia
theory holds true for lineup contexts.
As for limitations and suggestions for future studies, this study was conducted in
a laboratory with a staged crime shown on a TV screen with students as participants.
Such an experimental setting carries some obvious limitations (Chae, 2010). For
example, in real life crime situations, it is likely that the level of arousal is affected, and
thus future studies should examine the effects of alcohol intoxication in situations with
higher arousal.
Moreover, the participants in the present study were high functioning university
students who had been included in the study after passing both medical and
psychological examinations. They may have had expectations about the study and tried
to be alert and sharpen their focus in order to perform well, which may have reduced the
difference between intoxicated and sober participants. Since long term memory declines
with increasing age (Bartlett, Leslie, Tubbs, & Fulton, 1989; Park & Gutchess, 2004),
the generalizability of the present results are limited to younger eyewitness, and further
studies may investigate how alcohol also affects older eyewitnesses’ lineup
performance.
Even though the overall performance level in the lineups was above chance, the
performance was poor for all groups, which may be due to several factors. Although the
film was realistic in the sense that there were several characters involved (two culprits,
one victim and some bystanders), this may have affected the identification performance
negatively due to divided attention (Chae, 2010; Palmer, Brewer, McKinnon, & Weber,
2010). Furthermore, there was a slight discrepancy between the culprit’s appearances in
the film and in the lineup. This coupled with the weeklong retention interval may also
help explain the poor identification rates. However, whether such aspects should be seen

A. Hagsand et al.
The European Journal of Psychology Applied to Legal Context, 2013, 5(1): 23-47
42
as limitations is debatable, as they reflect likely difficulties faced by real life
eyewitnesses, highlighting how difficult lineup identification situations are.
Future research may test the impact of a higher dose of alcohol on lineup
performance, in order to see if the alcohol myopia theory is more suitable with a higher
intoxication level. It is possible that the present study failed to reveal significant
differences between the groups because the higher alcohol dose used in our study was
actually too low to cause a true alcohol induced myopic state. Another important
question is if alcohol has an impact on the amount of details eyewitnesses are able to
report at a recall task. Some previous studies have shown that intoxicated eyewitnesses
have a poorer recall compared to sober eyewitnesses (Schreiber Compo et al., 2011;
Yuille & Tollestrup, 1990).
In conclusion, previous research has shown that eyewitnesses are discredited in
court if they were intoxicated at the time of witnessing the crime (Evans & Schreiber
Compo, 2010). Nonetheless, the present study showed that the intoxicated eyewitnesses
performed on the same level as their sober counterparts and although the performance
level was above chance, it is important to note that the actual performance levels in the
present study were rather poor, both for the sober and intoxicated eyewitnesses. At
present, it is too early to draw conclusions about the impact of alcohol intoxication on
eyewitnesses’ identification ability, thus more studies in this field are recommended.
References
Alcohol Countermeasure Systems Corp. (2006). Alert J5: Portable breath alcohol
tester. Mississauga, Ontario, Canada.
Allwood, C. M., Ask, K., & Granhag, P. A. (2005). The cognitive interview: Effects on
the realism in witnesses’ confidence in their free recall. Psychology, Crime &
Law, 11, 183-198. doi: 10.1080/10683160512331329943
Allwood, C. M., Granhag, P. A., & Jonsson, A. C. (2006). Child witnesses’
metamemory realism. Scandinavian Journal of Psychology, 47, 461-470. doi:
10.1111/j.1467-9450.2006.00530.x
American Psychiatric Association. (2000). Diagnostic and statistical manual of mental
disorders (4th ed. text rev.). Washington, DC: Author. doi:
10.1176/appi.books.9780890423349
Alcohol intoxication and lineup performance 43
The European Journal of Psychology Applied to Legal Context, 2013, 5(1): 23-47
Babor, T., Higgins-Biddle, J. C., Saunders, J. B., & Monteiro, M. G. (2001). AUDIT.
The Alcohol use disorders identification test: Guidelines for use in primary care
(2nd ed.). Geneva, Switzerland: World Health Organization.
Bartlett, J. C., Leslie, J. E., Tubbs, A., & Fulton, A. (1989). Aging and memory for
pictures of faces. Psycholy of Aging, 4, 276-283. doi: 10.1037/0882-7974.4.3.276
Brewer, N., Weber, N., Clark, A., & Wells, G. L. (2008). Distinguishing accurate from
inaccurate eyewitness identifications with an optional deadline procedure.
Psychology, Crime & Law, 14, 397-414. doi: 10.1080/10683160701770229
Chae, Y. (2010). Application of laboratory research on eyewitness testimony. Journal of
Forensic Psychology Practice, 10, 252-261. doi: 10.1080/15228930903550608
Clark, S. E. (2003). A memory and decision model for eyewitness identification.
Applied Cognitive Psychology, 17, 629-654. doi: 10.1002/acp.891
Clifasefi, S. L., Takarangi, M. K. T., & Bergman, J. S. (2006). Blind drunk: The effects
of alcohol on inattentional blindness. Applied Cognitive Psychology, 20, 697-704.
doi: 10.1002/acp.1222
Colley, A., Ball, J., Kirby, N., Harvey, R., & Vingelen, I. (2002). Gender-linked
differences in everyday memory performance: Effort makes the difference. Sex
Roles, 47, 577-582. doi: 10.1023/A:1022082023501
Currie, C., Hurrelmann, K., Settertobulte, W., Smith, R., & Todd, J. (2000). Health and
health behaviour among young people. WHO policy series: Health policy for
children and adolescents. Copenhagen, Denmark: World Health Organization.
Derogatis, L. (1983). SCL-90-R. Manual II. Towson, MD: Clinical Psychometric
Research.
Dougherty, D. M., Marsh, D. M., Moeller, F. G., Chokshi, R. V., & Rosen, V. C.
(2000). Effects of moderate and high doses of alcohol on attention, impulsivity,
discriminability, and response bias in immediate and delayed memory task
performance. Alcohol Clinical and Experimental Research, 24, 1702-1711. doi:
10.1111/j.1530-0277.2000.tb01972.x
Dysart, J. E., Lindsay, R. C., MacDonald, T. K., & Wicke, C. (2002). The intoxicated
witness: Effects of alcohol on identification accuracy from showups. Journal of
Applied Psychology, 87, 170-175. doi: 10.1037/0021-9010.87.1.170
Evans, J. R., & Schreiber Compo, N. (2010). Mock jurors’ perceptions of identifications
made by intoxicated eyewitnesses. Psychology, Crime & Law, 16, 191-210. doi:
10.1080/10683160802612890
A. Hagsand et al.
The European Journal of Psychology Applied to Legal Context, 2013, 5(1): 23-47
44
Evans, J. R., Schreiber Compo, N., & Russano, M. B. (2009). Intoxicated witnesses and
suspects: Procedures and prevalence according to law enforcement. Psychology,
Public Policy and Law, 15, 194-221. doi: 10.1037/A0016837
Giancola, P. R., & Corman, M. D. (2007). Alcohol and aggression: A test of the
attention-allocation model. Psychological Science, 18, 649-655. doi:
10.1111/j.1467-9280.2007.01953.x
Granhag, P. A. (1997). Realism in eyewitness confidence as a function of type of event
witnessed and repeated recall. Journal of Applied Psychology, 82, 599-613. doi:
10.1037/0021-9010.82.4.599
Hibell, B., Andersson, B., Bjarnason, T., Ahlström, S., Balakireva, O., & Morgan, M.
(2004). The ESPAD report 2003: Alcohol and other drug use among students in
35 European countries. Stockholm, Sweden: The Swedish Council for
Information on Alcohol and Other Drugs.
Hibell, B., Andersson, B., Bjarnson, B., Kokkevi, A., Morgan, M., & Narusk, A. (1997).
The 1995 ESPAD-report: Alcohol and other drug use among students in 26
European countries. Stockholm, Sweden: The Swedish Council for Information
on Alcohol and Other Drugs.
Holdstock, L., Penland, S. N., Morrow, A. L., & de Wit, H. (2006). Moderate doses of
ethanol fail to increase plasma levels of neurosteroid 3α-hydroxy-5α-pregnan-20-
one-like immunoreactivity in healthy men and women. Psychopharmacology,
186, 442-450.
Josephs, R. A., & Steele, C. M. (1990). The two faces of alcohol myopia: Attentional
mediation of psychological stress. Journal of Abnormal Psychology, 99, 115-126.
doi: 10.1037/0021-843X.99.2.115
King, A. C., Houle, T., de Wit, H., Holdstock, L., & Schuster, A. (2002). Biphasic
alcohol response differs in heavy versus light drinkers. Alcohol Clinical and
Experimental Research, 26, 827-835. doi: 10.1111/j.1530-0277.2002.tb02611.x
Lee, H., Roh, S., & Kim, D. J. (2009). Alcohol-induced blackout. International Journal
of Environmental Research and Public Health, 6, 2783-2792. doi:
10.3390/ijerph6112783
Lindholm, T., & Christianson, S. A. (1998). Gender effects in eyewitness accounts of a
violent crime. Psychology, Crime & Law, 4, 323-339. doi:
10.1080/10683169808401763
Alcohol intoxication and lineup performance 45
The European Journal of Psychology Applied to Legal Context, 2013, 5(1): 23-47
Lindsay, R. C. L., Semmler, C., Weber, N., Brewer, N., & Lindsay, M. R. (2008). How
variations in distance affect eyewitness reports and identification accuracy. Law
and Human Behavior, 32, 526-535. doi: 10.1007/s10979-008-9128-x
Lovén, J., Herlitz, A., & Rehnman, J. (2011). Women’s own-gender bias in face
recognition memory: The role of attention at encoding. Experimental Psychology,
58, 333-340. doi: 10.1027/1618-3169/A000100
Lovén, J., Rehnman, J., Wiens, S., Lindholm, T., Peira, N., & Herlitz, A. (2012). Who
are you looking at? The influence of face gender on visual attention and memory
for own- and other-race faces. Memory, 20, 321-331. doi:
10.1080/09658211.2012.658064
MacDonald, T. K., MacDonald, G., Zanna, M. P., & Fong, G. T. (2000). Alcohol,
sexual arousal, and intentions to use condoms in young men: Applying alcohol
myopia theory to risky sexual behavior. Health Psychology, 19, 290-298. doi:
10.1037/0278-6133.19.3.290
Malpass, R. S., Tredoux, C. G., Schreiber Compo, N., McQuiston-Surrett, D., Maclin,
O. H., Zimmerman, L. A., & Topp, L. D. (2008). Study space analysis for policy
development. Applied Cognitive Psychology, 22, 789-801. doi: 10.1002/Acp.1483
Martin, C. S., Earleywine, M., Musty, R. E., Perrine, M. W., & Swift, R. M. (1993).
Development and validation of the biphasic alcohol effects scale. Alcoholism-
Clinical and Experimental Research, 17, 140-146. doi: 10.1111/j.1530-
0277.1993.tb00739.x
Mintzer, M. Z. (2007). The acute effects of alcohol on memory: A review of laboratory
studies in healthy adults. International Journal on Disability and Human
Development, 6, 397-403. doi: 10.1515/IJDHD.2007.6.4.397
Mumenthaler, M. S., Taylor, J. L., O’Hara, R., & Yesavage, J. A. (1999). Gender
differences in moderate drinking effects. Alcohol Research & Health, 23, 55-64.
Palmer, M. A., Brewer, N., McKinnon, A. C., & Weber, N. (2010). Phenomenological
reports diagnose accuracy of eyewitness identification decisions. Acta
Psychologica, 133, 137-145. doi: 10.1016/j.actpsy.2009.11.002
Park, D., & Gutchess, A. (2004). Long-term memory and aging: A cognitive
neuroscience perspective. In R. Cabeza, L. Nyberg, & D. Park (Eds.), Cognitive
neuroscience of aging: Linking cognitive and cerebral aging (pp. 218-246). New
York: Oxford University Press, Inc.
A. Hagsand et al.
The European Journal of Psychology Applied to Legal Context, 2013, 5(1): 23-47
46
Rodriguez, D. N., & Berry, M. A. (2012). The effect of line-up administrator blindness
on the recording of eyewitness identification decisions. Legal and Criminological
Psychology. Advance online publication. doi: 10.1111/j.2044-8333.2012.02058.x
Sauer, J. D., Brewer, N., & Wells, G. L. (2008). Is there a magical time boundary for
diagnosing eyewitness identification accuracy in sequential line-ups? Legal and
Criminological Psychology, 13, 123-135. doi: 10.1348/135532506x159203
Schreiber Compo, N., Evans, J. R., Carol, R. N., Kemp, D., Villalba, D., Ham, L. S., &
Rose, S. (2011). Alcohol intoxication and memory for events: A snapshot of
alcohol myopia in a real-world drinking scenario. Memory, 19, 202-210. doi:
10.1080/09658211.2010.546802
Sharps, M. J., Janigian, J., Hess, A. B., & Hayward, B. (2009). Eyewitness memory in
context: Toward a taxonomy of eyewitness errors. Journal of Police and Criminal
Psychology, 24, 36-44. doi: 10.1007/s11896-008-9029-4
Steblay, N. K., Dysart, J., Fulero, S., & Lindsay, R. C. L. (2001). Eyewitness accuracy
rates in sequential and simultaneous lineup presentations: A meta-analytic
comparison. Law and Human Behavior, 25, 459-473. doi:
10.1023/A:1012888715007
Steblay, N. K., Dysart, J. E., & Wells, G. L. (2011). Seventy-two tests of the sequential
lineup superiority effect: A meta-analysis and policy discussion. Psychology,
Public Policy, and Law, 17, 99-139. doi: 10.1037/A0021650
Steblay, N. K., & Phillips, J. D. (2011). The not-sure response option in sequential
lineup practice. Applied Cognitive Psychology, 25, 768-774. doi:
10.1002/Acp.1755
Steele, C. M., & Josephs, R. A. (1990). Alcohol myopia. Its prized and dangerous
effects. American Psychologist, 45, 921-933. doi: 10.1037/0003-066X.45.8.921
Söderpalm-Gordh, A. H. V., & Söderpalm, B. (2011). Healthy subjects with a family
history of alcoholism show increased stimulative subjective effects of alcohol.
Alcoholism: Clinical and Experimental Research, 35, 1426-1434. doi:
10.1111/j.1530-0277.2011.01478.x
Swedish Council for Information on Alcohol and Other Drugs. (2008). Drogutveckling i
Sverige 2008. Rapport 113. [Drug trends in Sweden 2008. Report 113]. Retrived
from http://www.can.se/sv/Rapporter/Drogutvecklingen-i-Sverige-2008/
Alcohol intoxication and lineup performance 47
The European Journal of Psychology Applied to Legal Context, 2013, 5(1): 23-47
van Oorsouw, K., & Merckelbach, H. (2012). The effects of alcohol on crime related
memories: A field study. Applied Cognitive Psychology, 26, 82-90. doi:
10.1002/acp.1799
Weber, N., & Perfect, T. J. (2011). Improving eyewitness identification accuracy by
screening out those who say they don't know. Law and Human Behavior, 36, 28-
36. doi: 10.1037/h0093976
Wise, R. A., Pawlenko, N. B., Safer, M. A., & Meyer, D. (2009). What US prosecutors
and defence attorneys know and believe about eyewitness testimony. Applied
Cognitive Psychology, 23, 1266-1281. doi: 10.1002/acp.1530
Yuille, J. C., & Tollestrup, P. A. (1990). Some effects of alcohol on eyewitness
memory. Journal of Applied Psychology, 75, 268-273. doi: 10.1037/0021-
9010.75.3.268
Zarkadi, T., Wade, K. A., & Stewart, N. (2009). Creating fair lineups for suspects with
distinctive features. Psycholgical Science, 20, 1448-1453. doi: 10.1111/j.1467-
9280.2009.02463.x