do sba loans create jobs? - iabdoku.iab.de/fdz/events/2012/caed_presentation_earle_brown.pdf · do...
TRANSCRIPT
Do SBA Loans Create Jobs? Estimates from Universal Firm-Level Panel Data
and Longitudinal Matching Methods
J. David Brown
Center for Economic Studies
US Census Bureau
John S. Earle
George Mason University
Central European University
April 2012
Disclaimers
Any opinions and conclusions expressed herein are those of the
authors and do not necessarily reflect the views of the U.S.
Census Bureau. All results have been reviewed to ensure that
no confidential information on individual firms is disclosed.
However, the results in this presentation are still confidential and
preliminary; please comment but do not quote.
We thank the SBA for providing us with the loan recipient data.
2
Main Question
• Do credit constraints hinder small firm
growth?
– Small Business Administration (SBA) loan
programs focus on credit-constrained firms
Do small business loans create jobs?
• Conceptually ambiguous:
– Reduce cost of capital -> expansion
– Ameliorate credit rationing
– But: substitution, displacement, leaky bucket effects
– K-L substitution
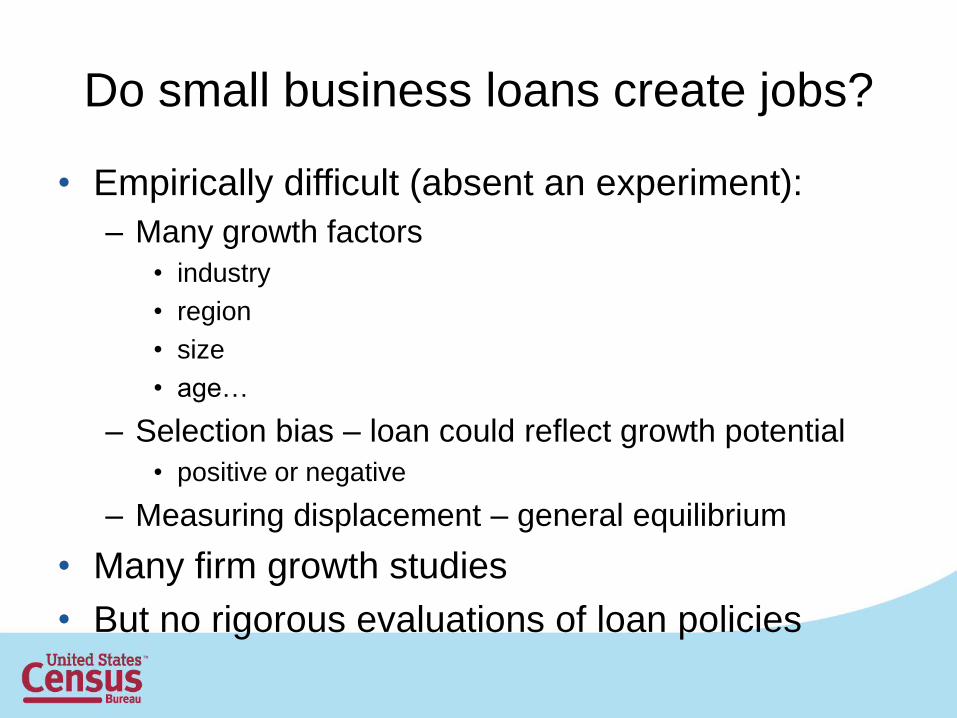
Do small business loans create jobs?
• Empirically difficult (absent an experiment):
– Many growth factors
• industry
• region
• size
• age…
– Selection bias – loan could reflect growth potential
• positive or negative
– Measuring displacement – general equilibrium
• Many firm growth studies
• But no rigorous evaluations of loan policies
How do Loan Effects Vary
with the Business Cycle?
• Firms are more credit constrained in recessions
• Opportunities for growth more limited in recessions

How do Loan Effects Vary by Age and Size?
• Haltiwanger, Jarmin, and Miranda (2012) suggest
firm age is more important determinant of job
creation than size
• Young and small firms more likely to be credit
constrained
– Young and small firms have higher exit rates
– Young firms have shorter credit history
– Young firms have less time to build up retained earnings
– Small firms have fewer assets to pledge
– Fixed costs of financing make it more expensive for small
firms
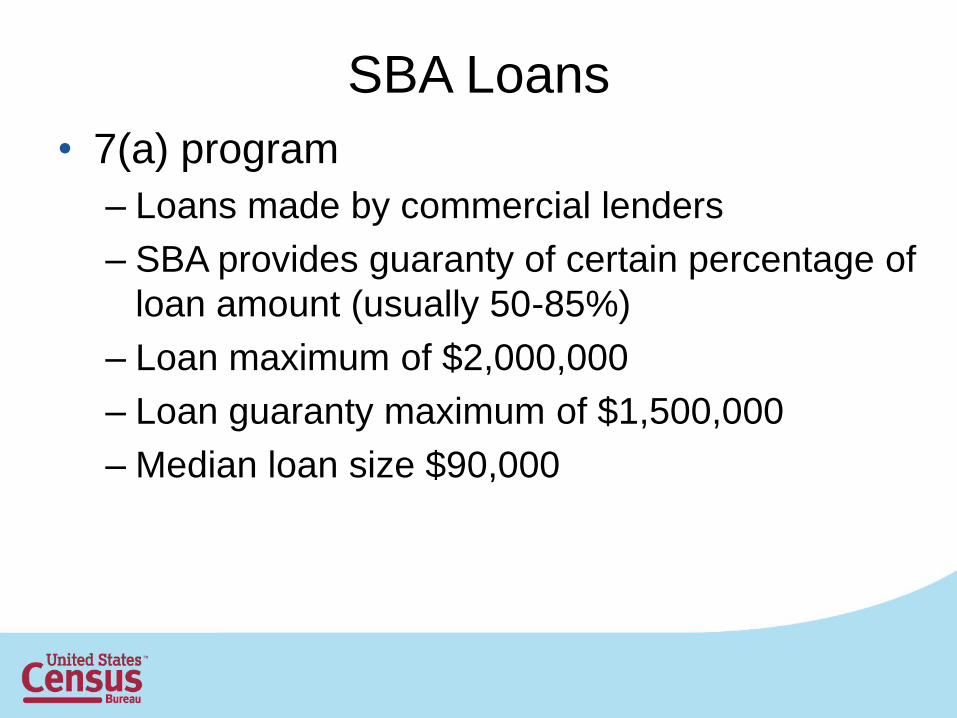
SBA Loans
• 7(a) program
– Loans made by commercial lenders
– SBA provides guaranty of certain percentage of
loan amount (usually 50-85%)
– Loan maximum of $2,000,000
– Loan guaranty maximum of $1,500,000
– Median loan size $90,000

SBA Loans
• 504 program
– Loan from private-sector lender covering up to
50% of project cost
– Loan from Certified Development Company
(CDC), backed 100% by SBA, covering up to
40% of cost
– Contribution of at least 10% equity from recipient
– CDC loan subordinate to private-sector lender
loan
– Median loan size $342,000
SBA Loans
• Lender must sign statement “Without the
participation of SBA to the extent applied for we
would not be willing to make this loan, and in our
opinion the financial assistance applied for is not
otherwise available on reasonable terms.”
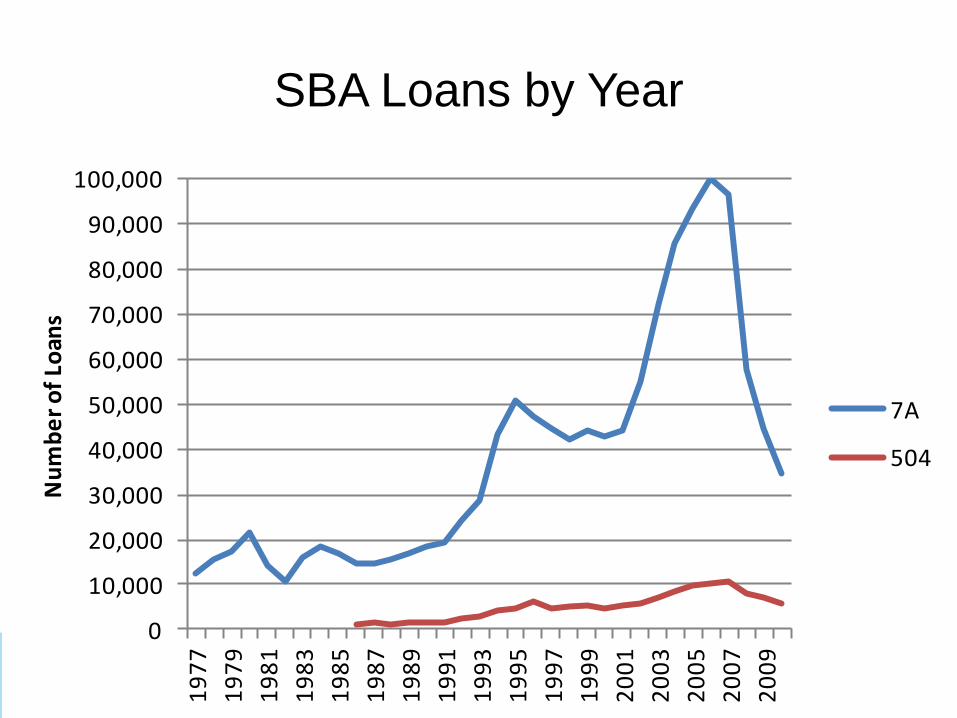
SBA Loans by Year
0
10,000
20,000
30,000
40,000
50,000
60,000
70,000
80,000
90,000
100,0001
97
7
19
79
19
81
19
83
19
85
19
87
19
89
19
91
19
93
19
95
19
97
19
99
20
01
20
03
20
05
20
07
20
09
Nu
mb
er
of
Loan
s
7A
504
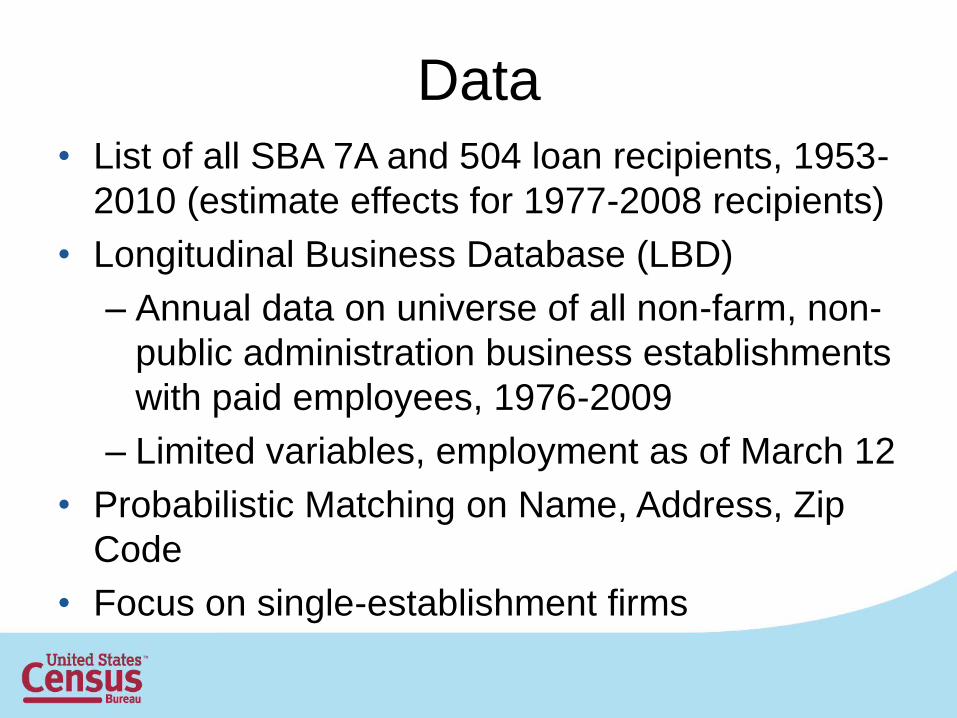
Data • List of all SBA 7A and 504 loan recipients, 1953-
2010 (estimate effects for 1977-2008 recipients)
• Longitudinal Business Database (LBD)
– Annual data on universe of all non-farm, non-
public administration business establishments
with paid employees, 1976-2009
– Limited variables, employment as of March 12
• Probabilistic Matching on Name, Address, Zip
Code
• Focus on single-establishment firms
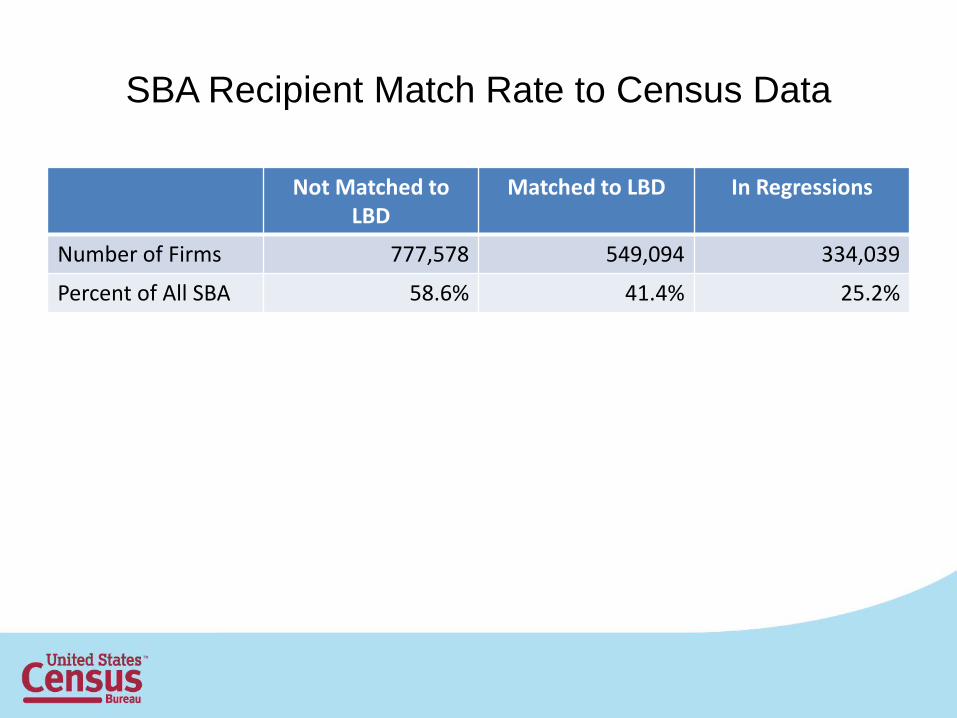
SBA Recipient Match Rate to Census Data
Not Matched to LBD
Matched to LBD In Regressions
Number of Firms 777,578 549,094 334,039
Percent of All SBA 58.6% 41.4% 25.2%
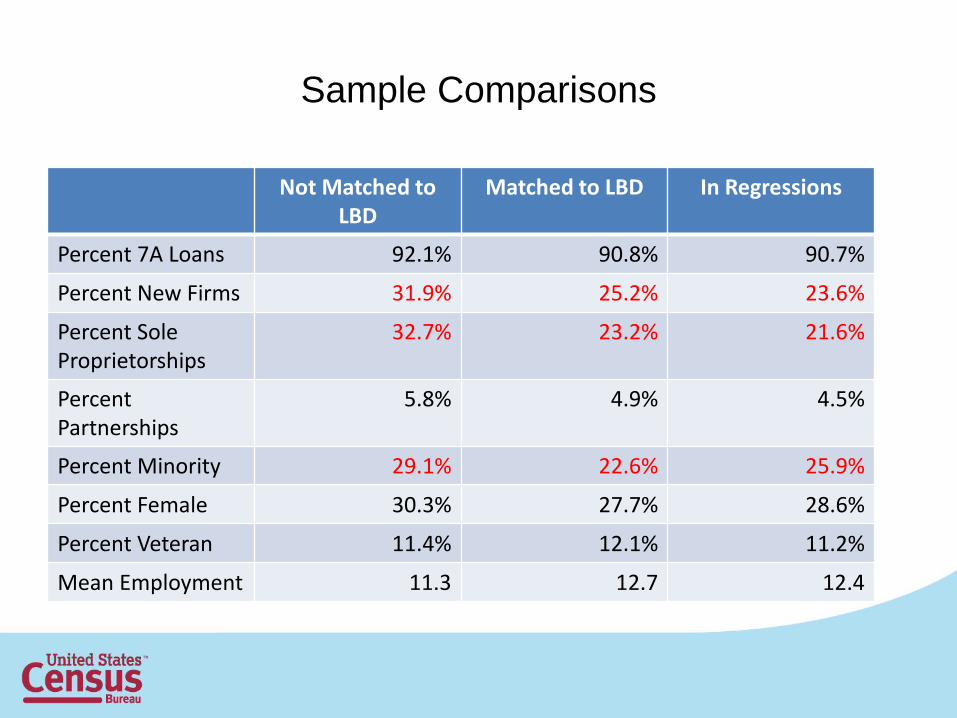
Sample Comparisons
Not Matched to LBD
Matched to LBD In Regressions
Percent 7A Loans 92.1% 90.8% 90.7%
Percent New Firms 31.9% 25.2% 23.6%
Percent Sole Proprietorships
32.7% 23.2% 21.6%
Percent Partnerships
5.8% 4.9% 4.5%
Percent Minority 29.1% 22.6% 25.9%
Percent Female 30.3% 27.7% 28.6%
Percent Veteran 11.4% 12.1% 11.2%
Mean Employment 11.3 12.7 12.4
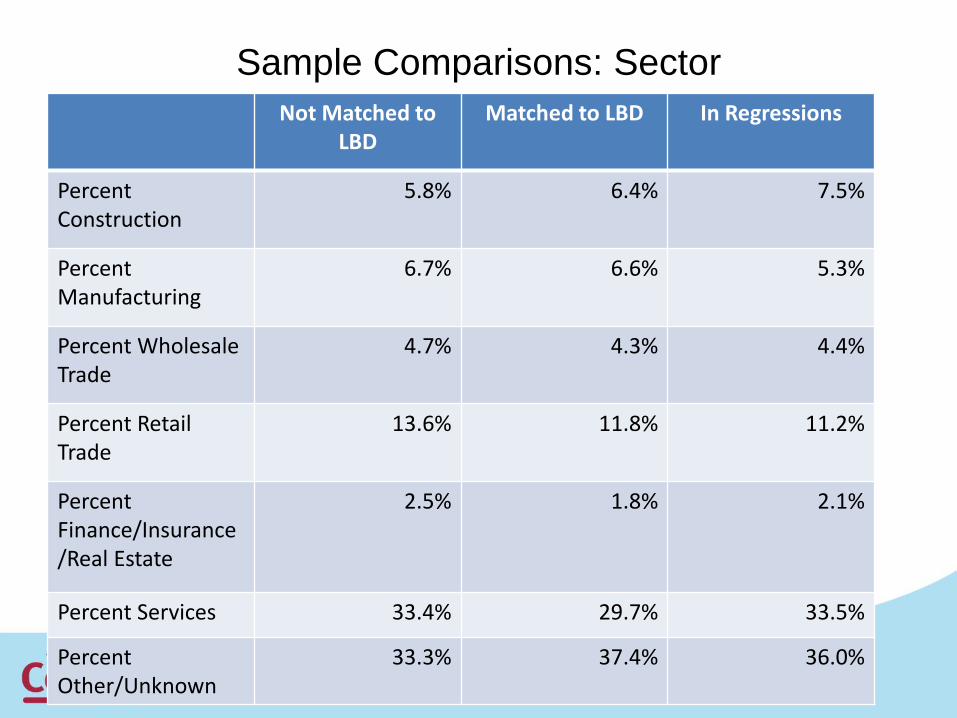
Sample Comparisons: Sector
Not Matched to LBD
Matched to LBD In Regressions
Percent Construction
5.8% 6.4% 7.5%
Percent Manufacturing
6.7% 6.6% 5.3%
Percent Wholesale Trade
4.7% 4.3% 4.4%
Percent Retail Trade
13.6% 11.8% 11.2%
Percent Finance/Insurance/Real Estate
2.5% 1.8% 2.1%
Percent Services 33.4% 29.7% 33.5%
Percent Other/Unknown
33.3% 37.4% 36.0%
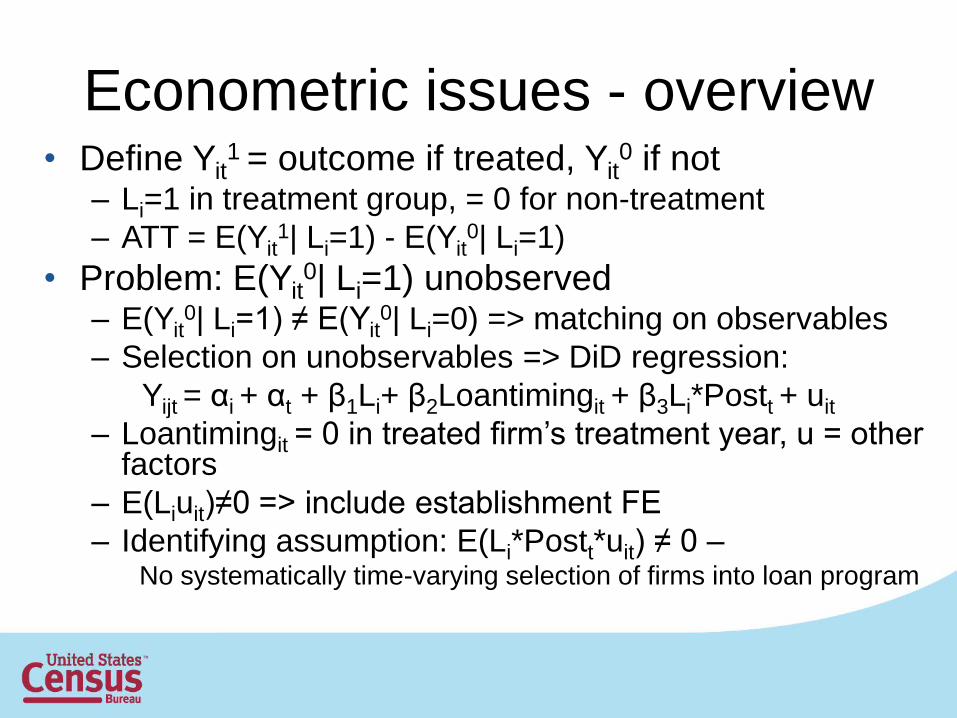
Econometric issues - overview • Define Yit
1 = outcome if treated, Yit0 if not
– Li=1 in treatment group, = 0 for non-treatment
– ATT = E(Yit1| Li=1) - E(Yit
0| Li=1)
• Problem: E(Yit0| Li=1) unobserved
– E(Yit0| Li=1) ≠ E(Yit
0| Li=0) => matching on observables
– Selection on unobservables => DiD regression:
Yijt = αi + αt + β1Li+ β2Loantimingit + β3Li*Postt + uit
– Loantimingit = 0 in treated firm’s treatment year, u = other factors
– E(Liuit)≠0 => include establishment FE
– Identifying assumption: E(Li*Postt*uit) ≠ 0 – No systematically time-varying selection of firms into loan program
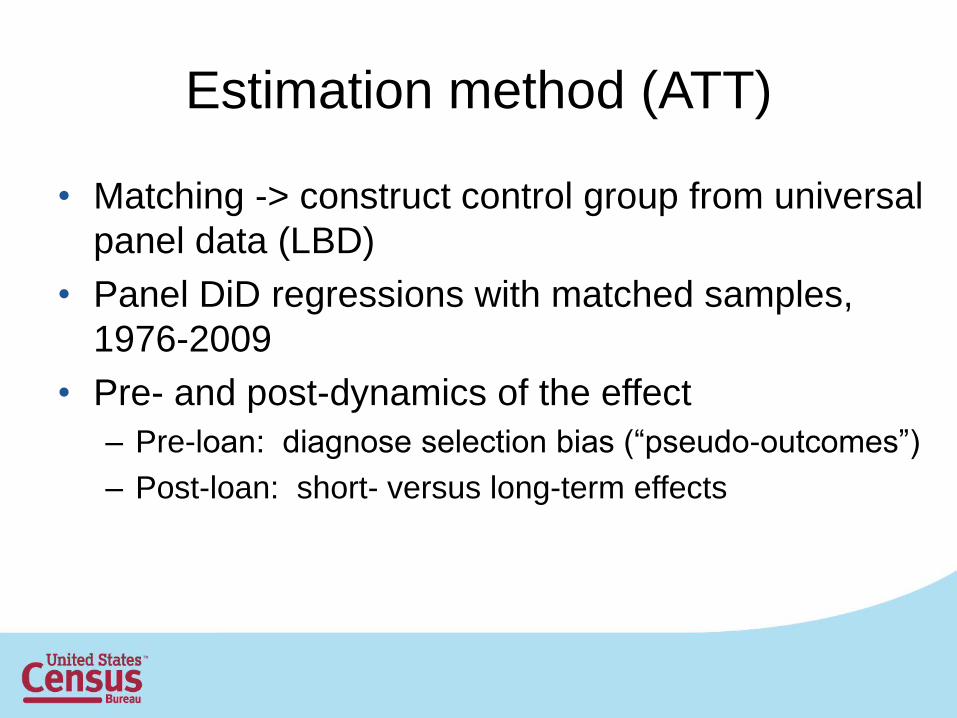
Estimation method (ATT)
• Matching -> construct control group from universal
panel data (LBD)
• Panel DiD regressions with matched samples,
1976-2009
• Pre- and post-dynamics of the effect
– Pre-loan: diagnose selection bias (“pseudo-outcomes”)
– Post-loan: short- versus long-term effects

Matching details
• Exclude establishments that ever receive SBA 7A, 504, or disaster loan from control group
• Focus on first SBA loan for treated group
• Exact match on loan year, 4-digit industry, county, age category (0, 1-2, 3-5, 6-10, >10), and previous year employment (+/- 10%)
• Propensity score matching – Lagged outcomes(to t-4), wage, exact age – Common support – 0.9 – 1.1 bandwidth – Kernel weights
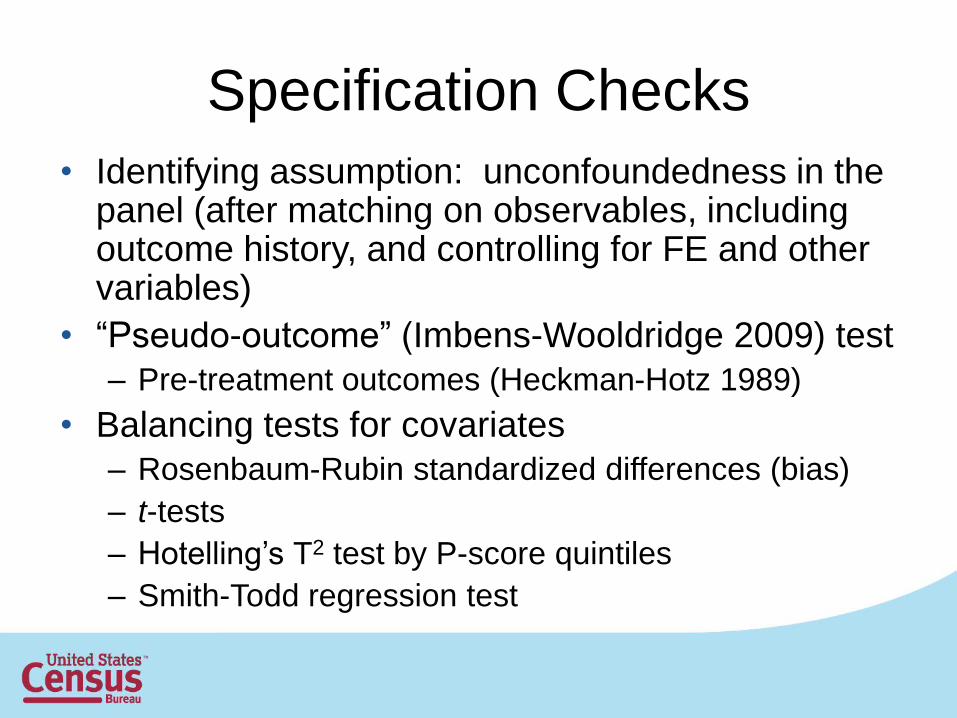
Specification Checks
• Identifying assumption: unconfoundedness in the panel (after matching on observables, including outcome history, and controlling for FE and other variables)
• “Pseudo-outcome” (Imbens-Wooldridge 2009) test
– Pre-treatment outcomes (Heckman-Hotz 1989)
• Balancing tests for covariates
– Rosenbaum-Rubin standardized differences (bias)
– t-tests
– Hotelling’s T2 test by P-score quintiles
– Smith-Todd regression test
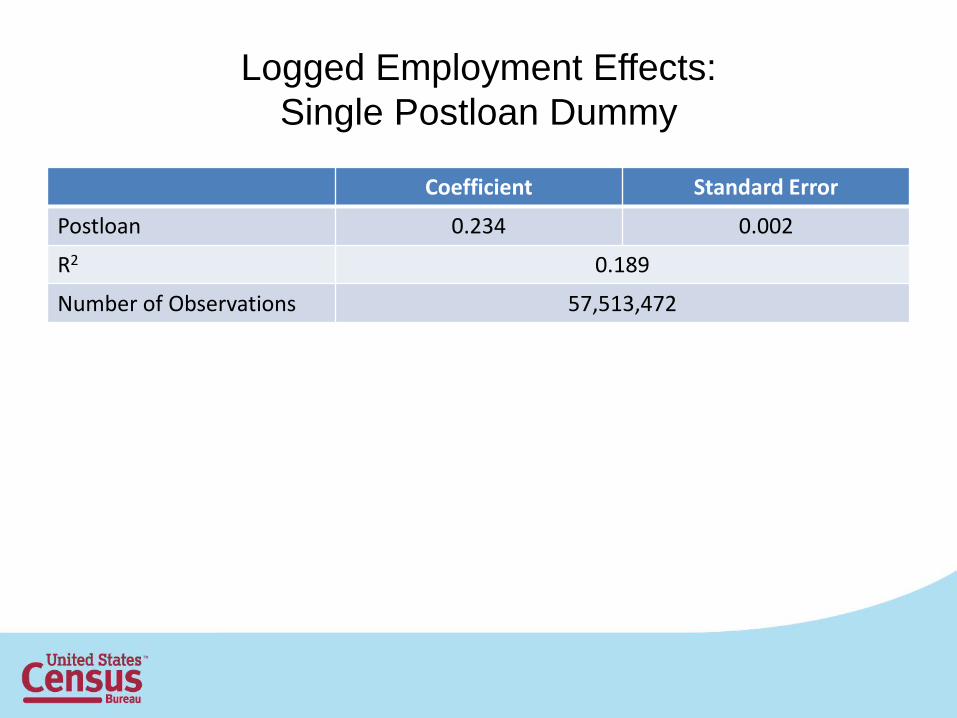
Logged Employment Effects:
Single Postloan Dummy
Coefficient Standard Error
Postloan 0.234 0.002
R2 0.189
Number of Observations 57,513,472
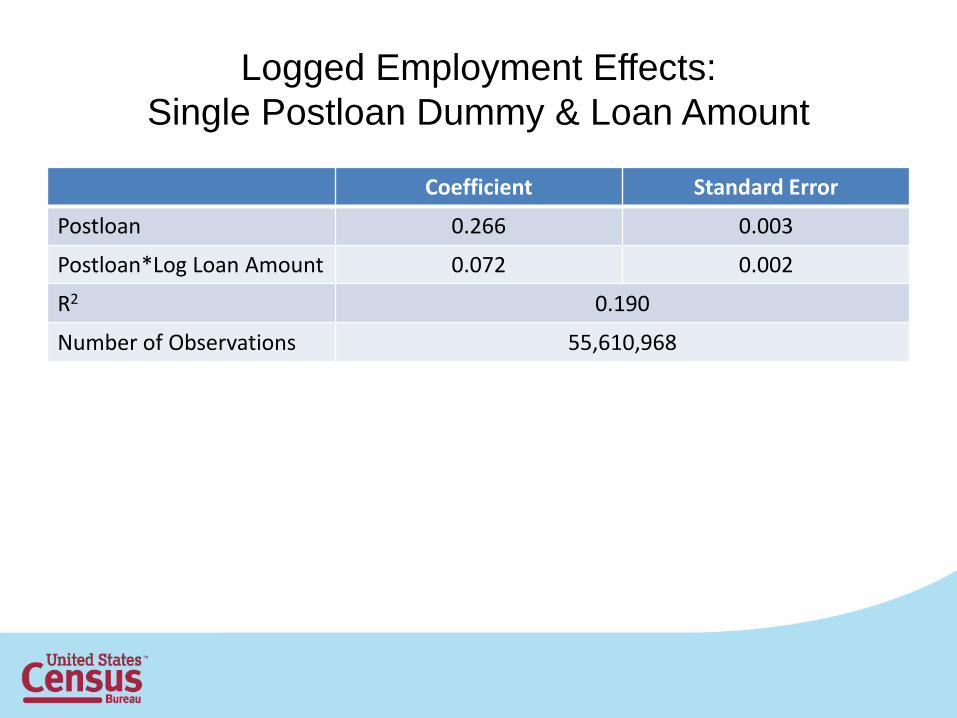
Logged Employment Effects:
Single Postloan Dummy & Loan Amount
Coefficient Standard Error
Postloan 0.266 0.003
Postloan*Log Loan Amount 0.072 0.002
R2 0.190
Number of Observations 55,610,968
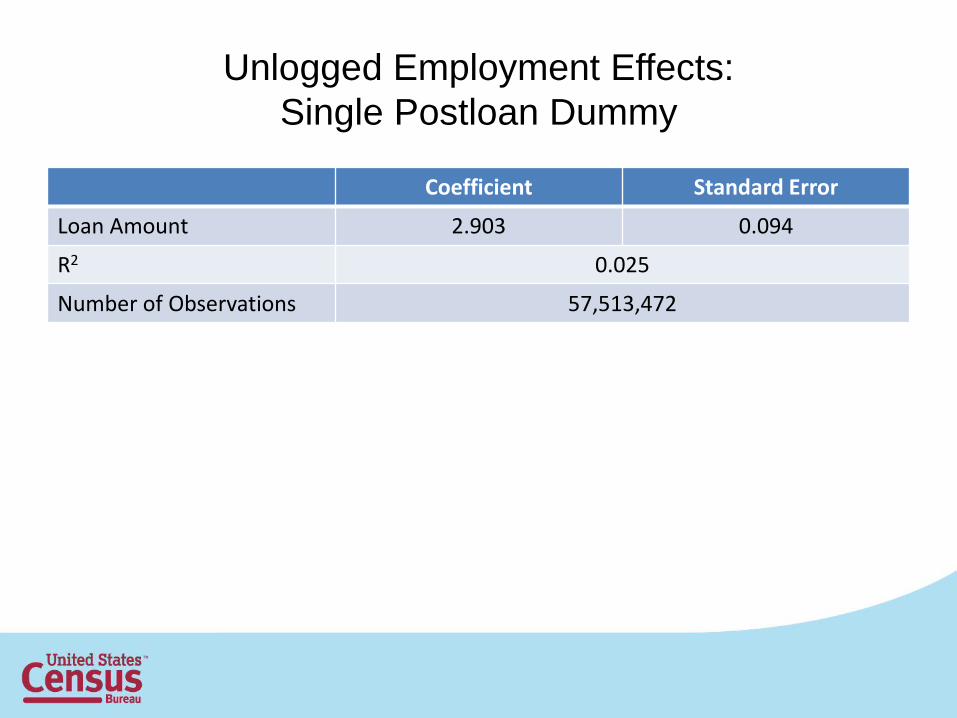
Unlogged Employment Effects:
Single Postloan Dummy
Coefficient Standard Error
Loan Amount 2.903 0.094
R2 0.025
Number of Observations 57,513,472

Unlogged Employment Effects:
Loan Amount ($1,000’s)
Coefficient Standard Error
Loan Amount 0.0092 0.0003
R2 0.025
Number of Observations 55,610,968
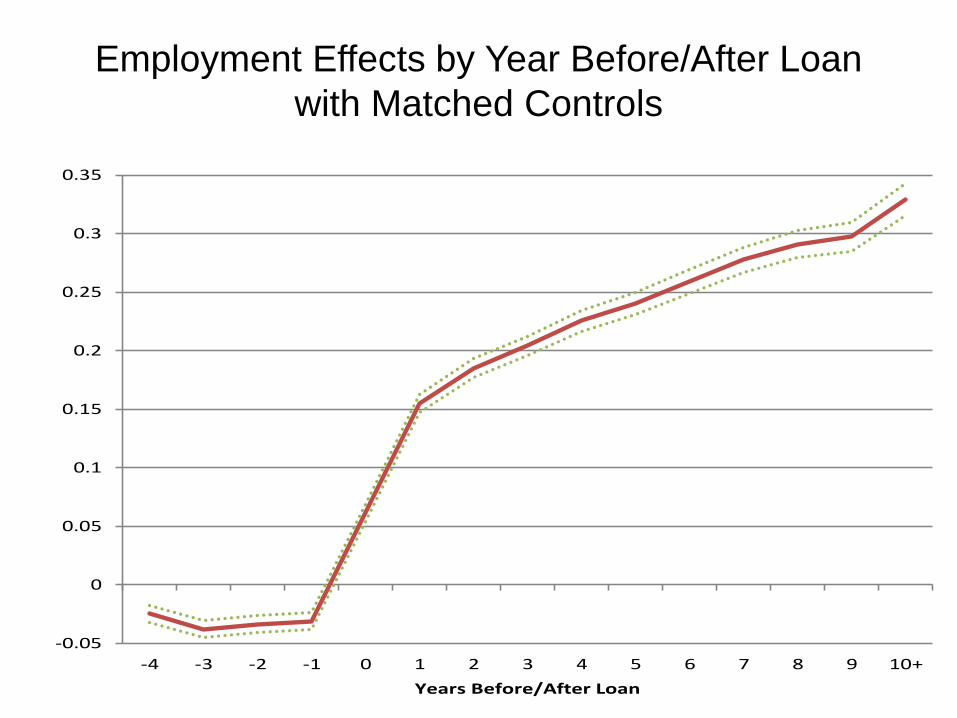
Employment Effects by Year Before/After Loan
with Matched Controls
-0.05
0
0.05
0.1
0.15
0.2
0.25
0.3
0.35
-4 -3 -2 -1 0 1 2 3 4 5 6 7 8 9 10+
Years Before/After Loan
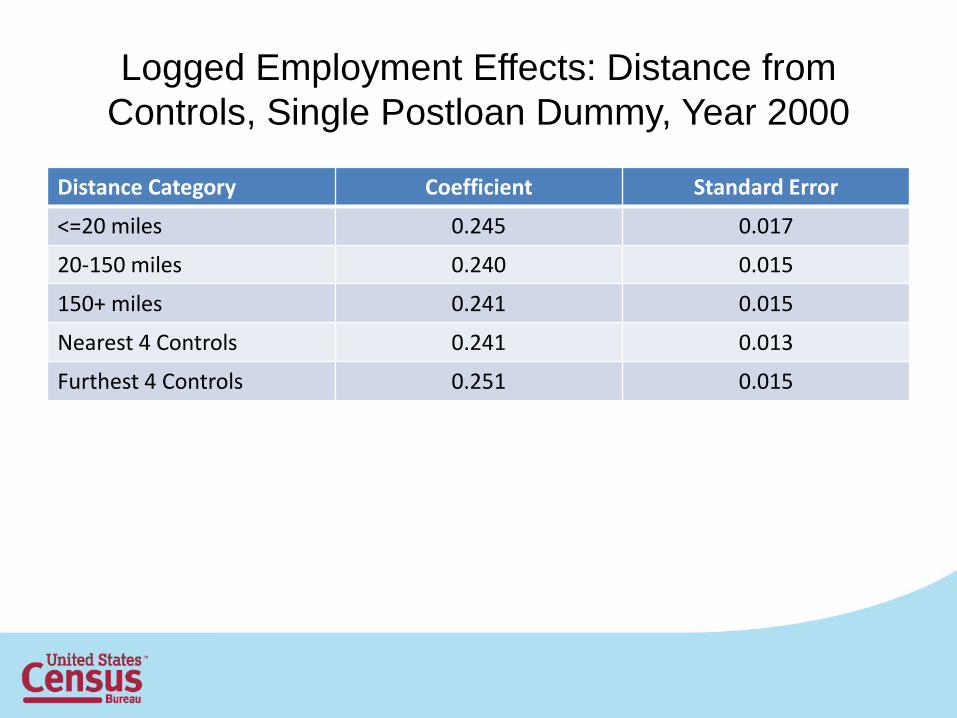
Logged Employment Effects: Distance from
Controls, Single Postloan Dummy, Year 2000
Distance Category Coefficient Standard Error
<=20 miles 0.245 0.017
20-150 miles 0.240 0.015
150+ miles 0.241 0.015
Nearest 4 Controls 0.241 0.013
Furthest 4 Controls 0.251 0.015
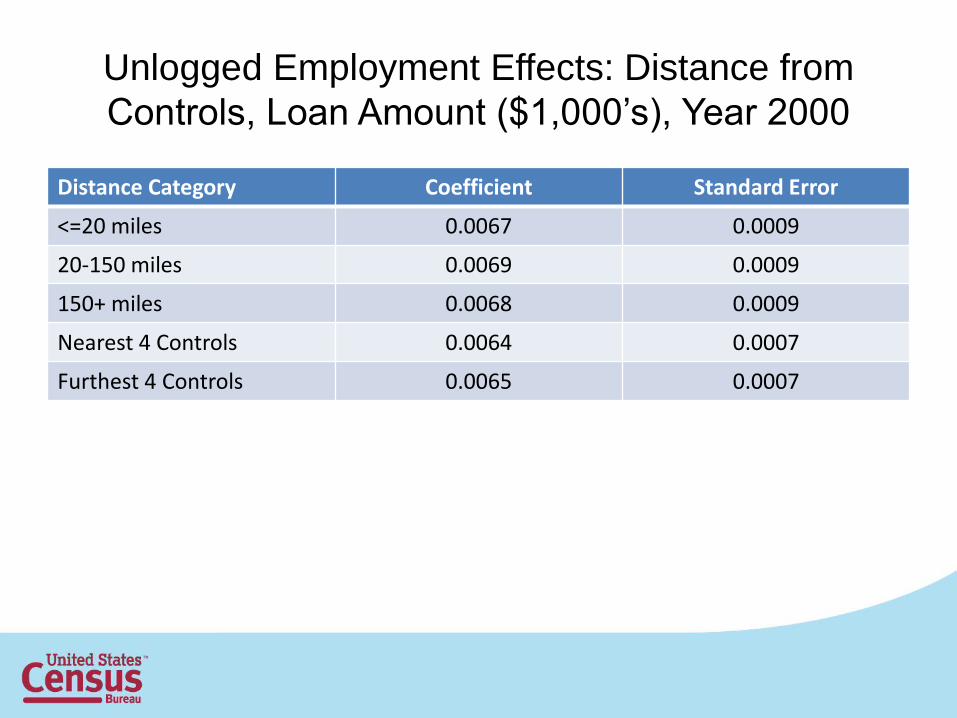
Unlogged Employment Effects: Distance from
Controls, Loan Amount ($1,000’s), Year 2000
Distance Category Coefficient Standard Error
<=20 miles 0.0067 0.0009
20-150 miles 0.0069 0.0009
150+ miles 0.0068 0.0009
Nearest 4 Controls 0.0064 0.0007
Furthest 4 Controls 0.0065 0.0007
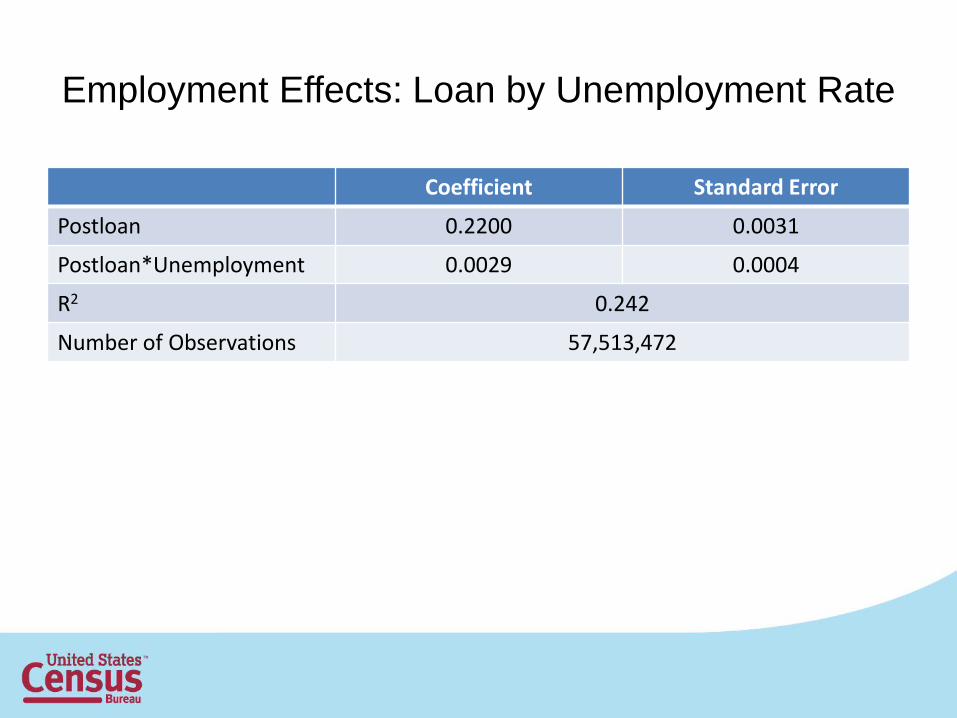
Employment Effects: Loan by Unemployment Rate
Coefficient Standard Error
Postloan 0.2200 0.0031
Postloan*Unemployment 0.0029 0.0004
R2 0.242
Number of Observations 57,513,472

Employment Effects by Pre-Loan Size
0
0.05
0.1
0.15
0.2
0.25
0.3
Emp 1 Emp 2-4 Emp 5-9 Emp 10-19 Emp 20-49 Emp 50-99 Emp 100-plus
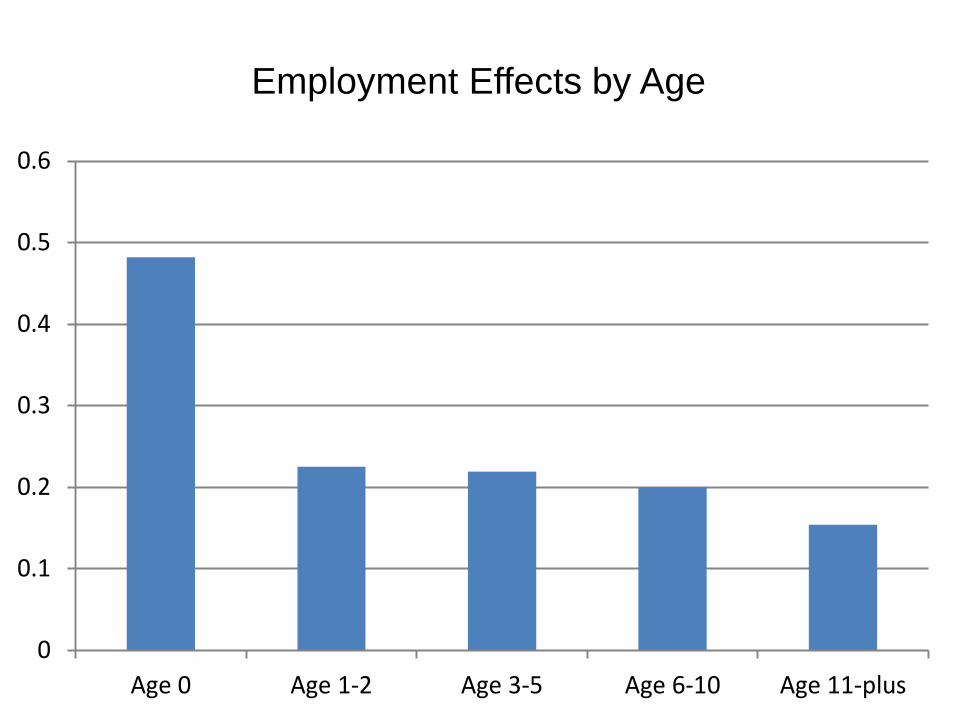
Employment Effects by Age
0
0.1
0.2
0.3
0.4
0.5
0.6
Age 0 Age 1-2 Age 3-5 Age 6-10 Age 11-plus
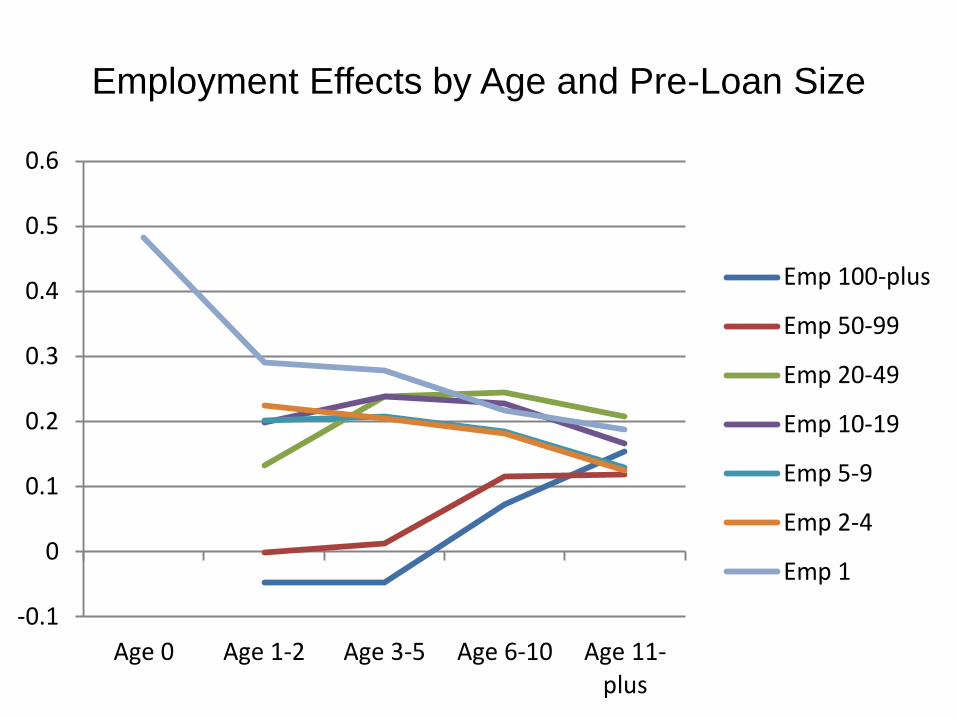
Employment Effects by Age and Pre-Loan Size
-0.1
0
0.1
0.2
0.3
0.4
0.5
0.6
Age 0 Age 1-2 Age 3-5 Age 6-10 Age 11-plus
Emp 100-plus
Emp 50-99
Emp 20-49
Emp 10-19
Emp 5-9
Emp 2-4
Emp 1
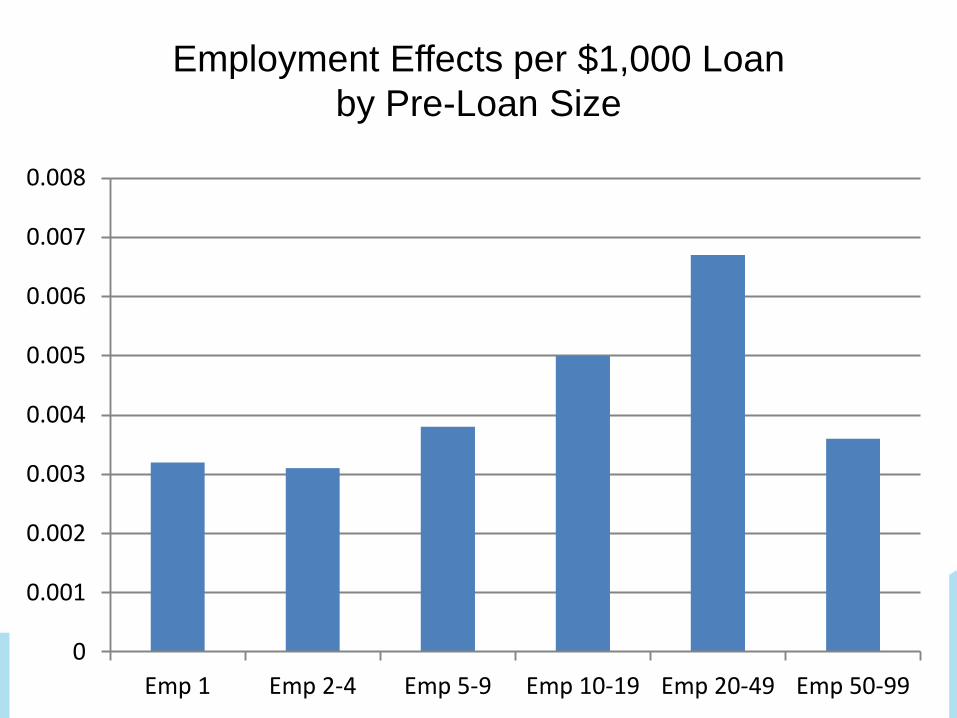
Employment Effects per $1,000 Loan
by Pre-Loan Size
0
0.001
0.002
0.003
0.004
0.005
0.006
0.007
0.008
Emp 1 Emp 2-4 Emp 5-9 Emp 10-19 Emp 20-49 Emp 50-99
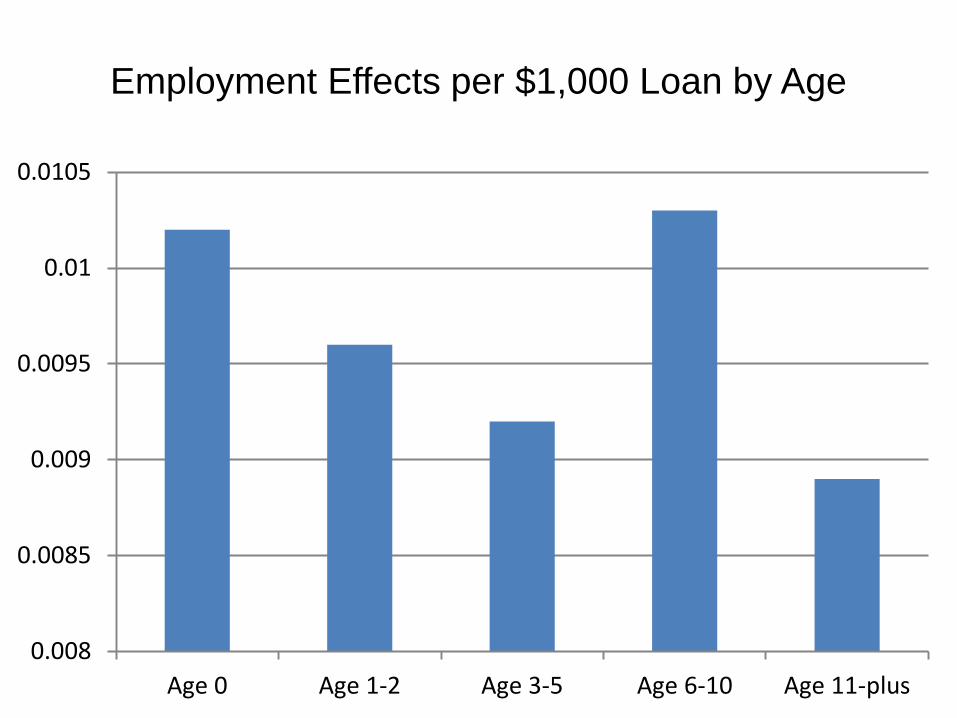
Employment Effects per $1,000 Loan by Age
0.008
0.0085
0.009
0.0095
0.01
0.0105
Age 0 Age 1-2 Age 3-5 Age 6-10 Age 11-plus

Employment Effects per $1,000 Loan
by Age and Pre-Loan Size
0
0.002
0.004
0.006
0.008
0.01
0.012
Age 0 Age 1-2 Age 3-5 Age 6-10 Age 11-plus
Emp 20-49
Emp 10-19
Emp 5-9
Emp 2-4
Emp 1
Preliminary Conclusions
• SBA loans associated with 23% employment
gain for incumbent firms
• Immediate and permanent effect
• No evidence of displacement effects
• Effects stronger in weak labor markets
Preliminary Conclusions
• Among smaller firms, the loan effect decreases
with age
• Among larger firms, the loan effect increases
with age
• Cost of creating a job decreases with size
• Among smaller firms, cost of creating a job
increases with age
• Among larger firms, cost of creating a job
decreases with age