do public health interventions crowd out private health ...uctppca/malariapaper_all.pdf · malaria...
TRANSCRIPT

Do Public Health Interventions Crowd Out Private HealthInvestments? Malaria Control Policies in EritreaI
Pedro Carneiroa, Alex Armandb, Andrea Locatellic, Selam Mihreteabd, Joseph Keatinge
aDepartment of Economics, University College London, Gower Street, WC1E 6BT, London, UK, Institutefor Fiscal Studies, CeMMAP ([email protected])
bUniversity of Navarra, NCID - Edificio de Bibliotecas, 31009 Pamplona, Spain ([email protected])cEconomic Research Unit, Bank of Italy, Bolzano branch, via Orazio 1/E, 39100 Bolzano, Italy
([email protected])dNational Malaria Control Program, P.O. Box 212, Ministry of Health, Asmara, Eritrea
([email protected] )eDepartment of Global Health Systems and Development, Tulane University School of Public Health andTropical Medicine, 1440 Canal Street, Suite 2200, New Orleans, La 70112 USA ([email protected])
Abstract
It is often argued that engaging in indoor residual spraying (IRS) in areas with high cov-erage of mosquito bed nets may discourage net ownership and use. This is just a case ofa public program having perverse incentives. We analyse new data from a randomisedcontrol trial conducted in Eritrea which surprisingly shows the opposite: IRS encouragednet acquisition and use. Our evidence points to the role of imperfect information. The in-troduction of IRS may have made the problem of malaria more salient, leading to a changein beliefs about its importance and to an increase in private health investments.
IThis research collaboration was initiated under Development Impact Evaluation’s (DIME’s) MalariaImpact Evaluation Program. We would like to thank especially Arianna Legovini and Edit V. Velenyi fortheir role in client engagement, research design, and securing funding for the study. We would also liketo thank officials at the Eritrean Ministry of Health, the National Malaria Control Program and the datacollection team at the Orotta School of Medicine in Asmara. Without them this research would not havebeen possible. This research was funded by a World Bank grant (as part of the HAMSET II project) throughthe Project Management Unit of the Eritrea Ministry of Health and a World Bank grant from DIME. Wethank Achyuta Adhvaryu, Noel Chisaka, Jean-Paul Clark, Pascaline Dupas, Costas Meghir, Petra Todd andseminar participants at UCL, IFS, the AEL Conference 2011, the 10th Arnoldshain Seminar, DIME-WorldBank, PSE, Uppsala, NOVAfrica, Centre for Global Development, and NEUDC Conference 2011 for helpfulcomments. Carneiro gratefully acknowledges the financial support from theWorld Bank, the Economic andSocial Research Council for the ESRC Centre for Microdata Methods and Practice (grant reference RES-589-28-0001), the support of the European Research Council through ERC-2009-StG-240910-ROMETAand ERC-2009-AdG-249612, and the hospitality of the World Bank Research Group.
Preprint submitted to Elsevier 16th March 2015

Keywords: Malaria, Bed nets, Indoor Residual Spray, Information, Beliefs, Behaviour.JEL: D12, D83, H42, I12.
1. Introduction
Most public programs induce behavioural responses in their target population. Theseresponses are often perverse, making programs less effective than what was originallyintended. This is a central concern in the design of public interventions across a variety ofareas, in rich and poor countries alike. In the particular case of malaria control programs,the introduction of indoor residual spraying1 (IRS) could have a negative impact on theuse of insecticide treated mosquito bed nets (ITN), if individuals believe IRS and ITN assubstitutes in the prevention of malaria (e.g. Lengeler, 2011).
In the standard model, the extent to which private investments crowd-out public in-vestments depends on the degree of substitutability between the two. However, outsidethe scope of this simple model are situations where the introduction of a program changesthe information set of individuals. For example, by introducing a health program in a com-munity, the public health authorities may be perceived to be especially concerned aboutthat particular health problem. This may then indicate to individuals that the problem maybe more serious than what they initially perceived it to be, inducing a change in their be-liefs about the returns to private health investments. A program could have an implicitinformation component even when it does not include an explicit information campaign.In this context, the standard crowding-out intuition breaks down and an increase in publichealth investments can lead to an increase in private health investments even when theyare substitutes.2
1Indoor residual spraying consists in spraying the interior walls of dwellings with insecticide to killresting mosquitoes.
2Some public reaction in the US to the recent Ebola outbreak has some similarities with the situation wejust described. There is limited public information about Ebola, which means that public perceptions of thedisease may be easier to change than in cases where there is a higher level of knowledge. The perception ofmassive government investments towards the prevention of Ebola in the US (both in the countries where theoutbreak originated from and in the US), may have lead some individuals to become very worried about thepossibility of an Ebola outbreak in the US. This change in perceptions lead individuals to act accordingly,either through their own health behaviours or by putting pressure on the politicians who represent them.
2

Although this is a simple point, and potentially relevant for many education and healthprograms in developing countries, it is often ignored. This paper presents experimentalevidence from Eritrea that an IRS campaign led to increases in ITN ownership and use.Our analysis suggests that the introduction of IRS may have made the problem of malariamore salient in treatment villages, causing a change in beliefs about the importance of thedisease in these areas, which resulted in an increase in private health investments.
The data used in our study comes from an experimental evaluation of the impact ofan IRS program organised by the Government of Eritrea in the most malarious region ofEritrea (Gash Barka). Fifty-eight (58) villages were randomly assigned to treatment and58 villages were randomly assigned to control. Between June and July 2009, before thestart of the malaria season, households in treatment villages were visited by governmentworkers carrying IRS equipment and were offered free IRS3. Households in control vil-lages did not receive publicly provided IRS and, at the same time, IRS is not privatelyprovided in this market. A household survey and malaria rapid diagnostic tests (RDT)were administered during the malaria season that followed (October 2009).
The prevalence of malaria parasite infection was found to be very low in this area, andour data shows that IRS had no detectable impact on it (Keating et al., 2011). However, itled to higher ownership and use of ITNs, in a setting where IRS and ITN are more likely tobe perceived as substitutes rather than complements. In addition, households in treatmentvillages became more aware of (and concerned with) malaria than in control villages. Inparticular, they were more likely to mention mosquitoes as a malaria vector and to mentionchildren as one of the groups most affected by malaria, than households in control villages.
A large literature debates the extent to which a variety of public programs discourages(or crowds-out) private investments in those goods or services that are provided by thepublic sector. Two examples (among many) are Peltzman (1973), who discusses the caseof higher education in the US, and Cutler and Gruber (1996), who study health insurancein the US. Examples of the importance of crowding-out effects for health programs in
3Teams visiting villages for IRS treatment were composed by social workers. It is unlikely in this situ-ation that IRS teams provided information about malaria, in addition to offering IRS treatment, to the house-holds living in treated villages. Within the National Malaria Control Program, information campaigns aremanaged by a communication team, which did not participate in the IRS campaign.
3
developing countries are much less common in the literature than for developed countries,perhaps because of lack of data. Some examples include Das et al. (2011), who analyseeducation subsidies in Zambia and India, and Bennett (2012), who studies the negativeeffect of the provision of piped water on household sanitary behaviour in the Philippines.
The standard presumption in these papers is that there is substitutability between privateand public expenditures, say, in health, and that individuals have perfect information aboutthe returns to their health investments. However, there is increasing evidence that decision-making by the poor is greatly affected by limited information (e.g. Bertrand et al. 2006;Banerjee and Duflo 2011; Dupas 2011b). This means that health programs have the po-tential to simultaneously deliver health services and induce changes in beliefs about thereturns to health investments in the populations they serve, which could even lead to areversal of potential crowding-out effects.
Beyond the literature on crowding-out effects of public programs, it is also import-ant to mention how our study fits into the literature on malaria control programs and oninformation and health in developing countries. Providing information about the returnsfrom using a technology can be an effective way to promote both take-up and use. Dupas(2011b) reviews several studies that show how the provision of information can effectivelyinfluence people’s health-seeking behaviour, when they are not already fully informedabout the health situation they face, when the source of information is credible and whenthey are able to process the new information. In other words policies may affect people’sbehaviour if they are able to change their beliefs. In a study of HIV in Malawi, De Paulaet al. (2011) do not find strong evidence that HIV testing consistently affects people’sbeliefs about their own HIV status (see also Delavande and Kohler, 2009), but they alsoshow that downward revisions in beliefs about HIV status increase risky behaviour, whilethe opposite occurs with upward revisions. In another study about HIV-related behaviour,Dupas (2011a) shows that providing information on the relative risk of HIV infection dis-aggregated by gender and age has a significant effect on teenage pregnancy. The role ofinformation in public health program and health behaviour in developing countries is alsokey in Madajewicz et al. (2007); Goldstein et al. (2008); Kremer et al. (2009).
Therefore, it is important to recognise how the availability of information about thebenefits of using one technology plays a central role in public health policies. Borrowing
4

from the literature in marketing and psychology, Dupas (2009) analyses how the framingof information on the benefits of ITN use affects ownership and use of ITNs. She comparestwo cases: one which stresses the financial gains from a reduction in missed work andanother highlighting the health gains from avoiding malaria. Using data from a randomisedcontrol trial (RCT) from Kenya, Dupas finds that neither take-up nor usage are affected byhow benefits are framed in a marketing campaign. As a possible explanation, she proposesthat the stakes are high and that liquidity constraints are probably the main barrier toinvestments in malaria prevention.
We also contribute to the understanding of ITN use, which is the main tool availableto households to prevent malaria infection. Several studies have investigated ways to pro-mote acquisition and usage of ITNs in malarious villages and attention has been focusedon the comparison between free-distribution and cost-sharing programs. One central paperon this topic is that by Cohen and Dupas (2010), who provide evidence in support of freedistribution. This aspect is further investigated by Tarozzi et al. (2013), who conducteda RCT in Orissa (India) and provided evidence on the effectiveness of micro-loans pro-moting ITN ownership. Finally, the way nets are used within household is investigatedby Hoffmann (2009), who, using a RCT in Rural Uganda, shows that, under free distribu-tion of nets, households tend to allocate them to specific members and, in that particularsetting, to children younger than 5 years old.
The remainder of the paper is organised as follows. In Section 2 we briefly describe thestudy area and the status quo in malaria eradication. In Section 3 we describe our datasetand we introduce our model in Section 4. We present and discuss our estimates in Section5. Section 6 concludes.
2. IRS in Eritrea and the Intervention
Malaria is transmitted to humans, mainly at night, from the bite of infected femalemosquitoes. Three main technologies are currently used to reduce transmission: ITNs,larval habitat management (LHM) and IRS. ITNs must be hung over the bed at nightto protect sleeping individuals from infectious mosquito bites; LHM includes activitiessuch as destroying the habitat of mosquitoes by draining stagnant water; IRS consists ofspraying the inside walls of dwellings with insecticide to kill resting mosquitoes.
5

Eritrea has been successful in greatly reducing malaria prevalence to relatively lowlevels. Malaria dramatically declined in the country over the past decade, from a nationalpeak of 260,000 clinical cases diagnosed in 1998 to just under 26,000 cases in 2008.4
In Eritrea, the costs of IRS are borne almost exclusively by the Government, which con-ducts spraying campaigns (there is no private market for IRS activities). Similarly, LHMcampaigns are organised out by the Government with the active involvement of local pop-ulations. In contrast, ITNs must be acquired by individuals and then set up above the bed.There exist periodic massive distribution campaigns for ITNs, but use and care of ITNsis still a private decision. Sleeping under a net is perceived as unpleasant, especially inwarm weather, and ITNs also need regular re-impregnation, if they are not coated withlong lasting insecticide.5
IRS is an expensive intervention, although generally perceived as effective. Neverthe-less, there are no studies of the added benefit of IRS in low-transmission settings over andabove ITN use, effective case management and LHM. As such, the National Malaria Con-trol Program (NMCP) decided to conduct an evaluation of the impact of IRS in the contextof the existing control program (which promotes LHM and ITN use) with the support ofthe World Bank. The results of this evaluation are presented in Keating et al. (2011).
The intervention was conducted in the Gash Barka region6, one of the six zones thatcompose the country and the most malarious zone in Eritrea. This zone registered morethan half of all diagnosed malaria cases and over 60 percent of all related deaths in thecountry, for the years of 2007 and 2008. The location of the zone is shown in FigureB1. Gash Barka is mostly a rural/agricultural area, inhabited by one fifth of the country’spopulation, which is estimated at 3.6 million. Altitudes range between 500 and 1,500
4The information about Malaria clinical cases is provided by the Eritrean National Malaria Control Pro-gram (NMCP).
5There is limited evidence on the barriers to mosquito net use in malaria-endemic regions (Pulford et al.,2011). However, discomfort, mainly related to heat, is among the main identified reasons for not using thenets.
6Gash Barka is composed by 14 sub-zones: Akurdet, Barentu, Dighe, Forto, Gogne, Goluj, Haykota,Laelay-Gash, Logo Anseba, Mensura, Mogolo, Mulki, Shambko and Tesseney. We surveyed only 13 ofthose sub-zones, because one of the sub-zones, Logo Anseba, was deemed to have a very low malariaprevalence attributable to higher altitude.
6

meters and temperatures are generally associated with hot and dry climatic conditions.Significant variation can be observed across the region in terms of precipitations, leading tomarked differences in vegetation and malaria prevalence. The rainy season is concentratedbetween July and September, while precipitations are scarce during the rest of the year. Asa result, malaria transmission is higher in the period from July to December, with a peakin September and October, following the rainy season.
A two-arm cluster-randomised controlled trial (using a post-test only design) was usedto evaluate the impact of IRS on malaria infection prevalence. Effectiveness was measuredas a single difference between treatment and control groups. One hundred and sixteen(116) villages in Gash Barka were selected for the study. Fifty-eight (58) villages wererandomly assigned to the treatment group and 58 villages were randomly assigned to serveas the control group. A geographic buffer was used to insure that treatment and controlvillages were at least 5 km apart. The NMCP verified the distance between treatment andcontrol villages, and villages that were within 5 km from another were replaced by theclosest village at least 5 km apart. In addition, further replacements were made in a fewcases where the originally chosen village had moved and could not be found or reached.Again, the closest eligible village was chosen as a replacement.7
In each treatment village, the intervention involved the control of adult mosquito pop-ulations using IRS with the insecticide dichlorodiphenyltrichloroethane (DDT), which isrecommended by the Eritrean NMCP. During the months of June-July 2009, dwellingswere sprayed according to the manufacturer’s recommended guidelines. The spraying tar-geted all households to ensure a minimum coverage of 80 percent, as recommended by theWorld Health Organisation (WHO). Treatment and control villages received similar levelsof ITNs, LHM and case management, per existing NMCP guidelines and policy. Furtherdetails on the study design and intervention are available in Keating et al. (2011).
7This procedure is documented in detail in the Online Supplementary Material that describes the proced-ures followed for treatment allocation.
7

3. Data
A household survey was conducted in October 2009,8 which corresponds to the periodright after the peak of the malaria season. Only one person per household was interviewedand the response rate was high at 94.23 percent, yielding a total sample size of 1,617households (corresponding to 7,895 individuals), of which 809 lived in treatment villagesand 808 resided in control villages. All present and consenting household members weretested for malaria using Carestart® RDTs and microscopy was used to validate positiveRDT results.9
Tables 1 and 2 present means and standard deviations for variables which are essen-tially pre-determined, and mean differences between the treatment and the control groups.Even though some of these variables could potentially respond to the intervention, it isunlikely that any response along these dimensions (household demographics and dwellingcharacteristics) took place between the time of the intervention (June-July 2009) and thetime of the survey (October 2009). Table 1 shows individual-level variables and Table 2shows household-level variables. All the characteristics of treatment and control villagesare balanced with one exception: the Tigre tribe is over represented in the treatment group.We take this into account in our analysis by including in all regressions an indicator vari-able that takes a value equal to 1 if household i belongs to the Tigre tribe and 0 otherwise.The exclusion of this variable does not affect our results.
Tables 1 and 2 also show joint tests that check the balance of several variables sim-ultaneously. We consider three different sets of variables: those available for the wholesample, those available for respondents only and those available only at the householdlevel. To conduct the test we run probit regressions of treatment assignment on the vari-ables in each group and we test whether the coefficients in the regressions are jointly equal
8A baseline survey was not collected because of budgetary constraints. Appendix C provides a detaileddescription of the data and of all the variables used in this paper.
9A total of 5,502 people were tested with RDT. 1,120 people were absent at the time of the survey andthey could not be tested. In addition, 651 people refused testing. Among those tested, 13 individuals testedpositive in the control group and 17 tested positive in the treatment group. The difference between the shareof positive RDTs in the two groups is 0.001 (st. err. = 0.003) and not significant (see Keating et al. 2011).Malaria prevalence was (unexpectedly) very low in the area under investigation. No other additional test,such as anaemia, was collected.
8
to zero. To be precise, let Ti denote an indicator that takes value 1 if household i belongsto a treatment village and 0 otherwise and let Xi be a vector of variables in each group.Then we estimate:
Pr (Ti = 1|Xi) = � (X
0i�) (1)
where � is the cumulative density function of the standard normal and we test whether� = 0 (where � is the vector of coefficients associated with each variable). Standarderrors are clustered at village level. We do not reject the null hypothesis of no differencebetween treatment and control for any of the three groups of variables, which means thatwe do not reject that these variables are jointly equal in the treatment and control groups.This provides additional evidence that randomisation was effective in achieving balancein the characteristics of treatment and control villages.10
Half the population in our sample consists of females, as shown in Table 1. Almost allhousehold members usually live in the house visited by the interviewer. The populationis quite young, with an average age of 22 and an average age of respondents of about 42.Average levels of education in our sample are low: only 19 percent of respondents everattended school and 76 percent of them attended only primary school. The proportion ofliterate respondents is equally low (20 percent). Almost all respondents are Muslim andmarried.
Table 2 shows that average household size in the sample is between 4 and 5, with morethan half of household members being below 18 years of age. Respondents living in thesevillages are very poor: only 43 percent of them has access to drinking water from a publictap, 6 percent has a toilet, 25 percent owns a radio, 95 percent uses firewood as the mainsource of fuel and the average number of rooms per house is well below 2.
Compliance with treatment was high, but not perfect. Table 3 shows that 6 percentof households living in control villages reported having their dwelling sprayed in the 5
10The list we originally used to randomly assign villages to treatment or control group included 116 vil-lages. Some names were changed at the time of the intervention or when the data collection was conductedand some villages had to be replaced because they were not found. A detailed analysis of the treatment alloc-ation is presented in the Online Supplementary Material. Our analysis provides evidence that randomisationwas effective.
9

months prior to the survey11. The spraying in control villages was not carried out by thegovernment. Most likely, households used simple insecticide sprays purchased from localshops, which have low effectiveness when compared to IRS, since the cost of replicatingthe IRS provided by the government would be too high for any of these poor households.12
Also, 25 percent of households in treatment villages reported not having received IRS13.This may have occurred because all household members were absent at the time of theintervention. Since participation was voluntary, it could also have happened because theresidents did not authorise spraying inside their home. In addition, there may have beenlack of sufficient insecticide to treat all houses, and some dwellings maybe have been loc-ated very far from the centre of the village so they were not reached by the IRS campaign14.
Throughout the paper we report simple comparisons between treatment and control vil-lages. Given that compliance with spraying was not perfect, we also report instrumentalvariable estimates of the impact of the program on various outcomes, where the propor-tion of households participating in spraying in the community is instrumented by the com-munity level treatment indicator. The reason why we focus on the community rather thanindividual level treatment variable in the main text is that the intervention is likely to affectthe beliefs and behaviours of all residents in the community, even those who did not havetheir house sprayed. Given that spraying was so widespread in each community, it will bevisible to everyone, not only to those who actually received spraying. We come back tothis issue below.
11This is roughly the period of time between treatment and the interviews, allowing for some recall error.12Respondents were asked whether anyone had sprayed the interior walls of their dwelling against mos-
quitoes over the previous 12 months. NMCP records report that no IRS campaigns was conducted in controlvillages over the 12 months prior to the survey. We can also exclude that other organisations conductedan IRS campaign in the region. Since the question did not specify “with DDT” or “by spraying teams”,respondents may have plausibly answered yes if they had engaged in personal spraying with commerciallybought insect repellant. The effect of such sprays is very limited compared to that of DDT.
13This percentage includes the respondents who reported not to remember whether the dwelling wassprayed.
14Spraying activity targeted all households in the village, to guarantee that at least 80% of the village wascovered (WHO guidelines).
10
4. Theoretical Framework
To guide our empirical analysis we present a simple model of behavioural response tothe introduction of IRS under perfect and imperfect information about the probability ofmalaria infection. In our setting, there are I identical workers, indexed by i = 1, 2, . . . , I ,and each worker has the same time endowment, timei = T . Labor supply is inelastic andall individuals work at wage w, which is exogenously determined, producing income Yi =
w · timei. Malaria affects the time endowment of worker i by reducing the time availablefor work by t > 0 (this is a simple way to introduce the cost of Malaria, which couldbe much more general; in our application below the concern with the costs of children’sinfection seems to be particularly relevant).
The probability that an infected mosquito finds and bite worker i is ⇡i ⌘ ⇡ � 0 and isassumed to be constant across workers. To reduce the risk of infection, workers can usemalaria preventive technologies, which, for simplicity, we assume are only two: ITNs andIRS. In the following, we refer to ITNs and IRS as N and S respectively. Technology N
is available to all workers and protects them from infection with probability p
N 2 (0, 1).However, its adoption causes a positive idiosyncratic disutility, di, which may arise fromthe need to hang the net over the bed every night, sleeping closer to other householdmembers to fit more people inside a net, a reduction in ventilation during the sleepinghours, or allergic reactions caused by contact with the insecticide on the net. On the otherhand, the adoption of technology S does not entail any disutility for workers and providesprotection with probability p
S 2 (0, 1).15
Suppose now that technology N is available to all who want it, and that technologyS may be introduced on top of N in an attempt to grant workers additional protectionfrom malaria. We therefore assume that using the two technologies jointly offers moreprotection than using either alone,16 i.e. max(p
N, p
S) < p
N[S , which is a very sensibleassumption. Workers are risk neutral and choose whether to adopt technology N by max-
15This difference in the costs of each technology is not essential to the point we make, but it is realistic inthis setting.
16Kleinschmidt et al. (2009) provides evidence that combined use of IRS and ITNs reduces the probabilityof malaria infection more than their individual use.
11

imising the expected value of their utility function given by Ui = Yi � �idi, where �i
is an indicator variable equal to 1 if worker i chooses to adopt the technology and zerootherwise (Yi will depend on whether the worker was infected or not, which happens withprobability ⇡).17
Under perfect information, all workers know the real probability of infection ⇡. If Sis not introduced, worker i will choose to use technology N only if the expected gainsfrom its adoption compensate the disutility incurred from its use. The decision of thegovernment to provide S would affect the probability of being infected and the choiceof N . The average use of N in the community when S is not introduced is denoted by✓
N ⌘ E(�
⇤i |S = 0), and when S is made available by the government we denote it by
✓
S ⌘ E(�
⇤i |S = 1). The latter is affected by the degree of complementarity between N
and S. If N and S are substitutes, then ✓
N � ✓
S , while in the case the two technologies arecomplements, ✓N ✓
S . See Appendix A for details of this result and the results below.In a more realistic setting, workers face uncertainty about the true value of ⇡. For
simplicity, suppose that ⇡ can only take two values, 0 or ⇡ > 0, and that each workeri is endowed with a prior Pi(⇡ = ⇡) about the real probability of infection. Workersbelieve that the government has perfect knowledge about ⇡ and they update their beliefsusing Bayes’ rule after observing the realisation of S. However, the mapping between thegovernment’s decision to spray and ⇡ is not deterministic, i.e. the government does notalways spray when ⇡ is high (for example, because of resource constraints) and it mayspray in some cases where ⇡ is zero (for example, because of different information or asa preventive measure). Our assumption is that individuals believe that the probability thatthe government sprays when the true risk of infection is zero cannot exceed the probabilitythat it does so when malaria poses a threat, i.e. Pr(S = 1|⇡ = ⇡) � Pr(S = 1|⇡ = 0).18
Under imperfect information, the use of N when S is introduced depends not only
17We do not account for any externalities which may arise from others’ use of ITNs. Even though theyare potentially important, our main point can be made without mentioning them. A discussion is availablein Appendix A.3.
18People are aware that the government has successfully managed to drastically reduce malaria in recentyears, and therefore they understand that it is committed to fight the disease. This makes the government“credible”.
12

on the degree of substitutability or complementarity between the two technologies, butalso on the posterior probabilities of infection, which influence the expected gains fromtechnology adoption. Having assumed that Pr(S = 1|⇡ = ⇡) � Pr(S = 1|⇡ = 0) impliesthat the workers’ posterior that the real probability of infection is ⇡ (and not 0) is largerwhen technology S is observed, i.e. Pi(⇡ = ⇡|S = 1) � Pi(⇡ = ⇡|S = 0). Therefore,under imperfect information, if agents perceive N and S to be complements, we againhave that ✓N ✓
S . It is however unlikely that the perception is one of complementaritybetween N and S. If there are no mosquitos in the house because of the spraying, then itmakes little sense to sleep under a net.
If workers perceive N and S to be substitutes, then ✓
S could be either larger or smallerthan ✓
N . This is in contrast with the analogous result for the perfect information case, forwhich the direction of the latter inequality was unambiguous. One one end, the substitut-ability between the two technologies leads to a reduction in ITN use. On the other end, anincrease in the subjective probability that infection is likely in the community leads to anincrease in ITN use.
5. Data Analysis
5.1. Main Results
In this section we analyse the impact of the IRS campaign on a set of behaviouraland socio-economic outcomes. In particular, we start by looking at the effect of sprayingon the ownership and use of mosquito bed nets. We then discuss possible mechanismsfor this effect by looking at the impact on: i) the level of information and awareness ofmalaria among the people of Gash Barka19; ii) other preventive behaviours; and iii) the
19We limit our analysis to information and awareness about malaria, since data about subjective expect-ations of the probability to be infected under different technologies are not available in this survey. To ourknowledge there is no study documenting subjective expectations in areas with current low malaria pre-valence, but high past prevalence. Mahajan et al. (2009) provide evidence of subjective expectations ofcontracting malaria, but in an area where prevalence was high at the time of the study (Orissa, India). Forthree scenarios (no net, net and ITN), they show that respondents believe that the use of nets has high returnsin terms of reduced risk. For adults, respondents report on average 9.0 chances out of 10 to contract malariawhen no net is used versus 4.6 when sleeping under a net and 0.6 when sleeping under a ITN. No data isavailable for the use of IRS technology.
13

intra-household allocation of net use. The impact of IRS on malaria prevalence was foundto be zero in our earlier work (Keating et al., 2011).
In Tables 4-7 we compare treatment and control villages across a variety of dimensions(ownership and use of mosquito bed nets, concern and knowledge of malaria, participationin LHM, and behaviours conducive to malaria elimination other than LHM). The first twocolumns of each Table present means and standard deviations for each variable, for con-trol and treatment villages. The remaining columns report differences (and correspondingstandard errors) between treatment and control villages using three different specifications(which, given our experimental design, we interpret as the impact of the program). Thefirst specification does not account for any control variables, and therefore correspondsto a simple difference in means between the two sets of villages. The second specifica-tion includes a set of control variables which includes all the variables we analysed in therandomisation checks (which we call Xi in the equations below) and village level charac-teristics V j .20 For this specification, we estimate the program impact using least squaresregression (2) of the outcome for individual/household i living in village j (we indicate itby Yij) on a treatment indicator Tj and control variables Xi:
Yij = ↵ + � Tj +X
0i� + V
0j � + ✏ij (2)
where ✏ij is an individual-specific error term. Standard errors are clustered at villagelevel.21 Across Tables, our estimates are almost identical for models with and withoutcontrols, so for the most part we will refer in the paper to the estimates with controls.
In the first two columns we rely on intent-to-treat estimates by comparing outcomesbetween treatment and control groups, independently from actual participation in thespraying campaign. However, given that compliance with spraying was not perfect, weadditionally report Instrumental Variable estimates of the impact of IRS in column 5 ofeach table, where each household’s participation in the IRS campaign is instrumented
20Village level controls include a set of sub-zone dummies, number of adults living in the village and theshare of women living in the village.
21For binary outcomes, the coefficients are robust to estimating the treatment effect using a probit andbivariate probit models, instead of OLS and IV, respectively. See Appendix B.4.
14

by the village level treatment indicator. In particular, we estimate the coefficient � inthe following equation using a linear regression model augmented with an endogenousbinary-treatment variable estimated by full maximum likelihood:
Yij = ↵ + � Spray5mi +X
0i� + V
0j � + ✏ij (3)
Pr(Spray5mi = 1 |Tj, Xi, Vj) = �
�✓1 + ✓2 Tj +X
0i✓3 + V
0j ✓4 + vij
�(4)
where Spray5mi is an indicator variable that takes value 1 if the dwelling of householdi was sprayed with insecticide in the five months before the survey, and 0 otherwise, andwhere � is the cumulative density function of the standard normal.22 Using linear probab-ility models and linear IV estimators gives us essentially the same results.
Table 4 reports information on ownership and use of bed nets.23 In this Section we drawa distinction between “ITNs” and “nets”: we restrict the former definition to include onlythose nets that were properly treated with insecticide at the time of the survey,24 while weuse the latter term to additionally include those nets that had not been properly re-treated.On average, there were about 1.58 nets and 1.28 ITNs per household in the control groupvillages. Furthermore, in the same villages, an average of 0.92 nets per household wereused the previous night and 0.58 nets were left unused. These figures are slightly higherin the treatment villages. A comparison of ownership figures for any nets versus ITNssuggests that the vast majority of owned bed nets were treated with insecticide at the timeof the survey.25 About 38 percent of all household members in control villages reportedly
22Including households who reported not to know whether the dwelling has been sprayed and computingprogram participation at village level, i.e. the share of households within each village who report that theirdwelling has been sprayed with insecticide in the previous five months, as endogenous regressor doesn’taffect the results. See Appendix B.4.1.
23Throughout the paper, we refer to the number of nets as the total number owned or observed per house-hold. In all estimations where controls are included household size is added as regressor to control forpotential unbalances. Estimating models 2 and 3 using the per capita number of nets leads to the sameconclusions. See Appendix B.5.
24We include in the definition of “ITNs” the following nets: all Long Lasting Insecticide treated Nets(LLINs), which were distributed in the area starting from 2006 and whose insecticide is effective for 3-5years; all ITNs acquired in the 3 years prior to the survey; all ITNs that were re-treated in the 12 monthsbefore the survey.
25We do not study explicitly households’ participation in net re-impregnation activities because LLINs
15

slept under a net (net use) the night before the survey.In Table 4 we also present the estimated program effects on ownership26 and use of bed
nets. Households living in treated villages own 0.256 more nets and 0.213 more ITNs thanhouseholds from control villages. The number of nets used the night before the surveywas 0.248 higher in treated villages, but there was no discernible difference in the numberof unused nets between treatment and control. We jointly test and reject (at the 10 percentlevel of significance) that there is no difference in these four variables between treatmentand control villages. The proportion of individuals reported to have used a net is higher intreatment than in control villages, but the difference is not statistically strong (this variableis not included in the joint test because it is at individual rather than at household level).These results show a clear difference in net ownership and use between treatment andcontrol villages.
IRS may affect bed net ownership through an increase in malaria awareness. To dis-cuss this channel, we build an index of awareness and knowledge of malaria using allavailable information on whether respondents believe malaria is a problem in the com-munity, whether they are aware of the main channel of transmission, and whether they areinformed of the categories of individuals that are most affected by the infection.27 Table5 shows that concern and knowledge of malaria is high in both treatment and control vil-lages. Despite the fairly low levels of parasite prevalence in the region28, malaria is still
have progressively replaced traditional ITNs since the NMCP discontinued its distribution in 2006. Anadditional reason for omitting an analysis of re-impregnation behaviour is that we include in the definitionof LLINs also all ITNs acquired in the 3 years before the survey and LLINs need not be re-impregnated.
26Whether households can acquire new bed nets if they want to do so or whether supply is determinedsolely by free distribution campaigns cannot be directly argued since information about whether nets areavailable for sale in rural villages and at what price is not available. Focusing on the control group, we seethat wealthier households do obtain a larger number of nets, e.g. by purchasing nets from a local market orfrom poorer households or they may possibly exploit their bargaining power to obtain more free nets duringdistribution campaigns. See Appendix B.3.
27We average 16 dummy variables representing answers to these questions. For each variable, the re-spondent scores 1 if the answer is in line with concern or correct knowledge of malaria and 0 if the answerindicates wrong (or absent) knowledge of malaria. The index is equal to 1 if the respondent is concerned andfully aware of malaria. R2 of a regression of the index on all village dummies is equal to 0.1480, showingthat there exist a significant within-village variation in concern and knowledge of malaria. We discuss theconstruction of the index in detail in Appendix B.2.
28Keating et al. (2011) document a prevalence rate below 1 percent (October, 2009).
16

(correctly) perceived as a problem in the community by a large majority of the populationand there is widespread knowledge that mosquitoes are an important transmission vector.
Finally, about half of the respondents were aware of information campaigns conduc-ted during the 6 months prior to the interview, concerning ITNs, early seeking behaviour(seeking timely treatment and proper diagnostic of malaria symptoms) and environmentalmanagement. However, there was no difference in this set of variables between treatmentand control villages.
Table 5 presents the estimated effect of the IRS campaign on concern and knowledgeof malaria. Our estimates suggest that treatment increased the index by 0.025. There ismore concern with malaria transmission in treatment than in control villages, suggestingthat IRS provision led individuals to update their beliefs about the importance of malaria intheir communities. The increased concern with the impact of malaria may have changedthe expected returns to malaria prevention behaviours such as ITN use29. It is also im-portant to report that, during the 6 months preceding the survey, respondents in treatmentvillages did not receive significantly more information on ITNs, early seeking behaviourand environmental management, compared to those in the control group. These variablesare not statistically different in treatment and control groups, either when we look at themindividually or jointly. Any changes in information and knowledge are likely to be a directconsequence of the IRS campaign.
Viewed from the perfect information model, and in light of the fact that ITN and IRSare much more likely to be substitutes than complements (if IRS kills the mosquitoesinside the house, individuals will feel less compelled to sleep under a net), it would be dif-ficult to explain our result that ITN ownership and use increased in treated villages. Ourresults are consistent with the model we developed in Section 4. In response to the intro-duction of IRS in a community, its inhabitants experience an increase in awareness andconcern about malaria (especially about the danger of mosquito bites), which affects theirownership and use of ITNs. More generally, by introducing a program in a community,
29The treatment effect is unaffected by introducing controls on average past exposure of malaria, proxiedby the 2000-2009 average Normalised Difference Vegetation Index (NDVI) across sub-zones. See AppendixB.2.
17

be it a health, education, or other type of program, a government potentially provides in-formation about its knowledge of the problem addressed by the program, or it just makesthe problem more salient in the minds of community members. When individuals haveimperfect information and face uncertainty about the importance of the particular problemat hand, such revelation of information may lead individuals to update their beliefs and, asa result, change their behaviours. These changes in behaviours are generally not expectedby those designing the program, while this section shows that they can be quite important.We recognise that our results on information can be seen as a bit tentative, but they arecertainly suggestive of the possible importance of the mechanism we emphasise.
In addition to using bed nets, in response to the IRS campaign, individuals can engagein other preventive behaviours to reduce the risk of malaria infection. For example, theycan keep any cattle away from home, cover any stored water and participate in environ-mental management campaigns, among others. Table 6 focuses on participation in LHMcampaigns and it shows that participation is fairly low across a variety of measures, aspointed out in Keating et al. (2011). Table 7, which includes the full range of mentionedways how respondents try to avoid mosquito bites, shows that households engage in awide variety of malaria prevention behaviours other than ITN use and LHM. We do notfind evidence that IRS affected private investment in any of those behaviours30 (Tables 6and 7 also report estimates of the impact of IRS on those behaviours). If anything, the IRScampaign had a positive effect, especially on the proportion of households who keep theirlivestock away from their dwelling, which increased by as much as 6.2 percent.31 How-ever, it is important to note that LHM is a rather different preventive policy compared toIRS, since it often requires coordination within the community in order to be implemented(this is definitely the case in Eritrea, where villages organise their households into shiftswhen it comes to LHM activities). In fact, LHM is more a programmatic intervention with
30Standard errors are relatively small in Tables 6 and 7, so we would have been able to detect a smallimpact of IRS on these sets of behaviours, had there been any. In addition, most coefficients have a positivesign, whereas a negative sign would hint to the presence of crowd-out.
31The observation that IRS has no effect on the use of coils and sprays might be related to the fact thatthese products are not necessarily used for malaria control, but rather nuisance mosquitoes which may biteearlier in the evening.
18
localised benefits, while ITN can be seen as a personal protection.
5.2. Intra-Household Allocation of Bed Nets
In the absence of IRS, net usage varies greatly by age, gender and employment status:32
children under 5 are the most likely to sleep under a bed net (50 percent), followed byunemployed and employed women of working age (44 and 40 percent), school age youths(36 percent), and finally employed and unemployed adult men (27 and 24 percent). Nosignificant gender differences were observed among children under five or among youngpeople. Among employed adults, women are much more likely to sleep under a bed net(13 percentage points more than men) and the same is true among the unemployed (20percentage points more than men).
In order to show how IRS influenced net use within the household, we divided thepopulation into six mutually exclusive categories (children under 5 years of age, school ageyouths (5-20 years old), employed adult (>20 years old) men and women, and unemployedadult men and women) and we analysed how the intervention affected net use in each ofthe groups.
We estimate the impact of the intervention on the intra-household allocation of bed netsusing regression (2) and (3), letting Y be an indicator variable for net use and restrictingthe sample to each of the selected socio-demographic category. Estimates are presentedin Table 8. For each socio-demographic group, the first two columns of Table 8 presentaverage bed net use in treatment and control villages with standard deviations in brackets.The remaining three columns present the impact of the intervention on the intra-householdallocation of bed nets, with the same sets of controls used in Tables 5-7.
Table 8 shows that treatment increased bed net use especially among workers, and wecan see in particular that 13 percent more male workers chose to sleep under a bed net.The estimated increase among female workers is about 12 percentage points. We notice,importantly, that the use of bed nets did not decline (estimated coefficients are positive butnon significant) among children under five, who are among the most vulnerable to malaria.
32Each respondent reports whether he/she is currently working using three options: unemployed, em-ployed, self-employed. We define as employed all those reporting to be either employed or self-employed.
19

Similarly, adult women were not negatively affected, irrespective of their employmentstatus33.
These results, which show an increase in net use among workers, and no decrease in netuse among other groups (namely children and women), are consistent with the previousfindings that information and awareness about malaria increased in the population andwith the idea that households became more sensitive to the importance of protecting theirbreadwinners, thereby adapting the intra-household allocation of nets.34 Increased net useamong workers may have resulted from the observed increase in net ownership or froma change in sleeping arrangements, with workers sharing more often sleeping space withtheir spouse and young children. Given the estimates in Table 5 one could have thoughtthat the largest increase in net use would be among children. However, it is possible that agreater awareness that malaria has a strong impact on children may just be a manifestationof a more general concern and awareness of the dangers of malaria.
6. Conclusions
The concern that government intervention crowds-out desirable private behaviour iscommon to several areas of public policy. The standard model predicts that this will hap-pen if private and public inputs are substitutes. This paper emphasises a new mechanismby which government intervention may encourage a higher provision of the private input,even when private and public inputs are substitutes. This can occur when individuals havelittle information about the returns to their actions and when the public intervention revealsinformation that may lead to an increase in their subjective expectations of the returns totheir actions. This is not only interesting, but also likely to be important in a variety of
33Adult women include pregnant women, a category that is very vulnerable to malaria. We do not havedata about pregnancy.
34This evidence is also in line with results presented in Appendix B.7, showing that malaria awarenessincreased especially among workers, who increased net use accordingly. In Appendix we present additionalresults describing how the impacts of the program vary with the level of vegetation in the sub-zone wherevillages are located. We also check heterogeneity in impacts according to several characteristics of therespondent: employment status, literacy, religion, tribe, female headship, family size and wealth. Regardingnet ownership, we observe that impacts of IRS are larger for families where the respondent is literate andthey are lower for families in the bottom quintile of the wealth distribution.
20

settings. We apply and illustrate the relevance of this idea to the study of a malaria controlprogram in Eritrea.
Several countries in Sub-Saharan Africa, including Eritrea, have successfully reducedthe malaria burden in their territory in recent years, using a combination of free ITN dis-tribution, LHM, case management, prompt and effective treatment, and information cam-paigns. Their governments are now contemplating strategies to eliminate the disease onceand for all, and in particular they are considering the introduction of regular IRS campaignsto achieve this goal, whereas IRS has so far been chiefly used in emergency response.
Public provision of IRS may crowd-out people’s private investment in the existingrisk mitigating technologies, possibly leading to a resurgence of the disease rather than toa sharp decrease and its eventual elimination. In a companion paper, we document that asingle IRS intervention is not sufficient to eradicate malaria completely in a policy-inducedlow-transmission setting like the one under investigation. It is therefore of paramountimportance that people consistently make use of the preventive available technologies toensure that malaria elimination can be achieved in the medium run (possibly with the helpof several IRS campaigns).
Our main result is that public IRS provision did not crowd-out private investment in anymalaria control policy in Eritrea in the short run: in fact, IRS did not induce a reductionin ownership or use of ITNs, nor did it have a negative impact on any of the other riskmitigating behaviours in which villagers are engaged. If anything, spraying led to anincrease in preventive behaviours. We show that IRS increased average ownership of ITNsand that it promoted net use among workers.
We explain this with a simple model of net use in a setting where individuals haveimperfect information about the risk of being infected by a mosquito carrying the malariaparasite, and update their beliefs about the level of malaria prevalence in their area ofresidence when they observe the introduction of a new intervention. This model proposesthat public health interventions may act as marketing campaigns, capable to promote take-up of the existing preventive technologies, and as an information campaign, that fostersactive use of the available risk mitigating tools. This can be true even when the originalgoal of the intervention was neither marketing nor the provision of information, such as inthe case of an IRS campaign. Both our empirical results and our interpretation are novel
21

in the literature.Regarding the external validity of our findings, it is not possible to argue that we will
find similar effects in other settings. After all, we are studying a very small experimentin a very special location. Nevertheless, we believe that the principles we uncovered arefairly general and could be at work in many other settings. It is likely that such a changein beliefs was observed in the study region because Malaria prevalence was so low. Insuch environments, populations may be more prone to change beliefs and behaviours con-cerning health when they notice any potential signs of alarm, and especially when they arevery visible.
We observe in our data a very high pre-intervention awareness about malaria, aboutthe mode of transmission of the disease and about who is at increased risk of being ill. Weshow that IRS provision promoted malaria awareness even further. Mosquito net owner-ship and use also increased after treatment. This increase in net use occurs mainly amonghousehold members who are currently working. We also show that net use among the mostvulnerable categories (including children under the age of five and pregnant women) wasnot negatively affected by the rise in use among workers.
22

Banerjee, A. V. and E. Duflo (2011). Poor Economics: A Radical Rethinking of the Wayto Fight Global Poverty. Public Affairs. 1
Bennett, D. (2012). Does clean water make you dirty? water supply and sanitation in thephilippines. Journal of Human Resources 47(1), 146–173. 1
Bertrand, M., S. Mullainathan, and E. Shafir (2006). Behavioral Economics and Market-ing in Aid of Decision Making among the Poor. Journal of Public Policy & Market-ing 25(1), 8–23. 1
Cohen, J. and P. Dupas (2010). Free Distribution or Cost-Sharing? Evidence from a Ran-domized Malaria Prevention Experiment. The Quarterly Journal of Economics 125(1),1–45. 1
Cutler, D. M. and J. Gruber (1996). Does public insurance crowd out private insurance?The Quarterly Journal of Economics 111(2), 391–430. 1
Das, J., S. Dercon, J. Habyarimana, P. Krishnan, K. Muralidharan, and V. Sundararaman(2011). School Inputs, Household Substitution, and Test Scores. National Bureau ofEconomic Research (NBER) Working Paper 16830. 1
De Paula, A., G. Shapira, and P. Todd (2011). How Beliefs about HIV Status AffectRisky Behaviors: Evidence from Malawi, Seventh Version. Penn Institute for EconomicResearch (PIER) Working Paper 11-033. 1
Delavande, A. and H.-P. Kohler (2009). Subjective Expectations in the Context ofHIV/AIDS in Malawi. Demographic Research 20, 817–874. 1
Dupas, P. (2009). What Matters (and What Does Not) in Households’ Decision to Investin Malaria Prevention? American Economic Review 99(2), 224–30. 1
Dupas, P. (2011a, January). Do teenagers respond to hiv risk information? evidence from afield experiment in kenya. American Economic Journal: Applied Economics (3), 1–34.1
23

Dupas, P. (2011b). Health Behavior in Developing Countries. Annual Review of Econom-ics 3(1), 425–449. 1
Gaudart, J., O. Toure, N. Dessay, A. l. Dicko, S. Ranque, L. Forest, J. Demongeot, andO. K Doumbo (2009). Modelling Malaria Incidence with Environmental Dependencyin a Locality of Sudanese Savannah Area, Mali. Malaria Journal 8, 61. 8
Goldstein, M., J. Graff Zivinz, J. Habyarimana, C. Pop-Eleches, and H. Thirumurthy(2008). Health worker absence, hiv testing and behavioral change: Evidence from west-ern kenya. Working paper. 1
Hoffmann, V. (2009). Intrahousehold allocation of free and purchased mosquito nets.American Economic Review: Papers & Proceedings 99:2, 236–241. 1
Keating, J., A. Locatelli, A. Gebremichael, T. Ghebremeskel, J. Mufunda, S. Mihreteab,D. Berhane, and P. Carneiro (2011). Evaluating Indoor Residual Spray for ReducingMalaria Infection Prevalence in Eritrea: Results from a Community Randomized Con-trol Trial. Acta Tropica 119(2-3), 107–113. 1, 2, 9, 5.1, 28, 5.1, B.1, 6
Kleinschmidt, I., C. Schwabe, M. Shiva, J. L. Segura, V. Sima, S. J. Mabunda, andM. Coleman (2009). Combining Indoor Residual Spraying and Insecticide-Treated NetInterventions. The American Journal of Tropical Medicine and Hygiene 81(3), 519–524.16
Kremer, M., E. Miguel, S. Mullainathan, C. Null, and A. Peterson Zwane (2009). Makingwater safe: Making water safe: Making water safe: Price, persuasion, peers, promoters,or product design? Working paper. 1
Lengeler, C. (2011). Optimal Choice of Vector Control Methods. Presentation at the 3rdMeeting of the Optimal Choice of Vector Control Methods Work Stream, IFRC, Geneva,Switzerland. 1
Madajewicz, M., A. Pfaff, A. van Geen, J. Graziano, I. Hussein, H. Momotaj, R. Sylvi,and H. Ahsan (2007). Can information alone change behavior? response to arsenic
24
contamination of groundwater in bangladesh. Journal of Development Economics 84(2),731–754. 1
Mahajan, A., A. Tarozzi, J. K. Yoong, and B. Blackburn (2009). Bednets, information andmalaria in orissa. Technical report, Duke University, Department of Economics. 19
Nihei, N., Y. Hashida, M. Kobayashi, and A. Ishii (2002). Analysis of Malaria EndemicAreas on the Indochina Peninsula Using Remote Sensing. Japanese Journal of Infec-tious Diseases 55(5), 160–66. 8
Peltzman, S. (1973). The Effect of Government Subsidies-in-Kind on Private Expendit-ures: The Case of Higher Education. Journal of Political Economy 81(1), 1–27. 1
Pulford, J., M. W. Hetzel, M. Bryant, P. M. Siba, and I. Mueller (2011). Reported reasonsfor not using a mosquito net when one is available: a review of the published literature.Malaria Journal 10:83. 5
Tarozzi, A., A. Mahajan, B. Blackburn, D. Kopf, L. Krishnan, and J. Yoong (2013). Micro-loans, bednets and malaria: Evidence from a randomized controlled trial. AmericanEconomic Review. 1
25

Table 1: Randomisation checks: Individual Variables
(1) (2) (3)Control Treatment Difference
All household members
1 - Female 0.521 0.517 -0.004[0.500] [0.500] (0.011)
2 - Age 21.997 22.343 0.346[19.184] [19.517] (0.492)
3 - Stayed here last night 0.953 0.967 0.014[0.212] [0.180] (0.009)
Respondents only
4 - Female 0.663 0.610 -0.052[0.473] [0.488] (0.037)
5 - Age 41.431 42.047 0.616[15.255] [15.006] (0.893)
6 - Ever attended school 0.186 0.193 0.007[0.389] [0.395] (0.034)
6a - Only primary school 0.782 0.745 -0.037[0.414] [0.437] (0.053)
7 - Literate 0.196 0.181 -0.015[0.397] [0.385] (0.032)
8 - Married 0.940 0.928 -0.013[0.237] [0.259] (0.013)
9 - Muslim 0.779 0.839 0.060[0.415] [0.368] (0.068)
10 - Tigre tribe 0.401 0.567 0.166*[0.490] [0.496] (0.084)
P-value [variables 1-3] 0.2417P-value [variables 4-10] 0.1634
Note: *** p<0.01, ** p<0.05, * p<0.1. Column (1) and Column (2) report sample means restricted tocontrol and treatment group, standard deviations in brackets. Column (3) reports the difference between (2)and (1) estimated using OLS regression of the correspondent outcome on the treatment indicator. Standarderrors clustered at village level are reported in parentheses. To control for joint significance, we run a probitregression of the treatment indicator on the selected groups of variables and we report p-values of an F-testfor the joint significance of the coefficients on the selected variables. Variable 6a is not used in the joint testsince it is conditional on having attended school.
26

Table 2: Randomisation checks: Household Variables
(1) (2) (3)Control Treatment Difference
11- Household size 4.793 4.978 0.184[2.275] [2.299] (0.156)
12- Household members under 5 0.824 0.845 0.021[0.941] [0.904] (0.057)
13- Household members 6-18 y.o. 1.575 1.654 0.078[1.530] [1.559] (0.098)
14- Access to public tap 0.432 0.422 -0.010[0.496] [0.494] (0.077)
15- Access to unprotected well 0.228 0.248 0.020[0.420] [0.432] (0.054)
16- Access to unprotected spring 0.140 0.125 -0.015[0.347] [0.331] (0.038)
17- Has any toilet 0.066 0.054 -0.011[0.248] [0.227] (0.023)
18- Has radio 0.244 0.252 0.008[0.430] [0.435] (0.032)
19- Firewood is main fuel 0.956 0.935 -0.021[0.204] [0.247] (0.018)
20- Has no window 0.319 0.324 0.005[0.466] [0.468] (0.066)
21- Number of separate rooms 1.833 1.855 0.022[1.199] [1.183] (0.105)
22- Number of sleeping rooms 1.380 1.382 0.002[0.819] [0.714] (0.051)
23- Number of sleeping spaces 4.608 4.444 -0.164[2.453] [2.347] (0.190)
P-value [variables 11-23] 0.7575P-value [variables 4-23] 0.5555
Note: Note: *** p<0.01, ** p<0.05, * p<0.1. Column (1) and Column (2) report sample means restricted tocontrol and treatment group, standard deviations in brackets. Column (3) reports the difference between (2)and (1) estimated using OLS regression of the correspondent outcome on the treatment indicator. Standarderrors clustered at village level are reported in parentheses. To control for joint significance, we run a probitregression of the treatment indicator on the selected groups of variables and we report p-values of an F-testfor the joint significance of the coefficients on the selected variables. Variable 6a is not used in the joint testsince it is conditional on having attended school.
27

Table 3: Programme compliance
Control group Treatment group TotalDwelling was sprayed in past 5 months 49 604 653
(0.075) (0.925)Dwelling was not sprayed in past 5 months 679 124 803
(0.846) (0.154)Missing information 80 81 161
(0.497) (0.503)Total 808 809 1617
Note. This Table shows the number of respondents reporting that someone sprayed the interior walls of theirdwelling against mosquitoes (without specifying whether it was carried out by IRS teams) in the 5 monthsprior to the survey or that no one did, in the control and in the treatment groups. In parenthesis is reportedthe share for treatment and control group of the total number of households in the corresponding line. Fivemonths corresponds approximately to the period of time between the IRS intervention and the survey. Whenthe household doesn’t know whether the dwelling was sprayed in the previous 5 months, we report it asmissing information.
28

Tabl
e4:
Ow
ners
hip
and
use
ofm
osqu
itobe
dne
ts
E(Y
|T=
1,X)�E(Y
|T=
0,X)
(1)
(2)
(3)
(4)
(5)
Con
trol
Trea
tmen
tO
LSO
LSIV
Hou
seho
ldle
vel
1.N
umbe
rofn
ets
owne
dby
hous
ehol
d1.
575
1.77
40.
200*
0.25
6***
0.27
9**
[1.2
07]
[1.2
79]
(0.1
10)
(0.0
85)
(0.1
09)
2.N
umbe
rofI
TNs
owne
dby
hous
ehol
d1.
278
1.44
40.
166*
0.21
3**
0.24
2**
[1.1
26]
[1.2
06]
(0.0
96)
(0.0
82)
(0.1
12)
3.N
umbe
rofo
bser
ved
nets
used
the
nigh
tbef
ore
0.92
01.
142
0.22
2**
0.24
8***
0.29
4**
[1.0
50]
[1.2
22]
(0.1
00)
(0.0
83)
(0.1
15)
4.N
umbe
rofo
bser
ved
nets
left
unus
edth
eni
ghtb
efor
e0.
581
0.55
8-0
.024
-0.0
00-0
.017
[0.9
38]
[0.9
38]
(0.0
65)
(0.0
54)
(0.0
77)
Indi
vidu
alle
vel
5.R
epor
ted
netu
se0.
380
0.42
90.
049
0.06
3**
0.06
8*[0
.486
][0
.495
](0
.035
)(0
.029
)(0
.038
)C
ontro
lsN
oYe
sYe
s
Join
ttes
tson
varia
bles
(with
com
para
ble
sam
ple
size
):1-
4p-
valu
es=
0.18
310.
0106
-
Not
e:**
*p<
0.01
,**
p<0.
05,*
p<0.
1.O
neob
serv
atio
npe
rho
useh
old
for
varia
bles
1-4,
one
obse
rvat
ion
per
indi
vidu
alfo
rva
riabl
e5.
Varia
ble
1an
d5
isse
lf-re
porte
d,w
hile
varia
bles
2-4
are
obse
rved
byth
ein
terv
iew
er.
“Net
s”re
fers
toan
ybe
dne
ts,i
rres
pect
ive
ofth
eir
treat
men
tsta
tus,
“ITN
s”in
clud
eson
lyLL
INs
and
prop
erly
treat
edIT
Ns.
Col
umns
(1)
and
(2)
repo
rtsa
mpl
em
eans
rest
ricte
dto
cont
rol
and
treat
men
tgro
up,s
tand
ard
devi
atio
nsin
brac
kets
.Col
umns
(3)a
nd(4
)rep
ortt
hedi
ffer
ence
betw
een
treat
men
tand
cont
rolg
roup
sus
ing
OLS
regr
essi
on(m
odel
2).
Col
umn
(5)
estim
ates
the
diff
eren
cebe
twee
nho
useh
olds
who
repo
rtto
have
rece
ived
the
spra
ying
cam
paig
nin
the
last
5m
onth
san
dth
ose
who
didn
’tby
inst
rum
entin
gpr
ogra
mpa
rtici
patio
nw
ithth
etre
atm
entg
roup
indi
cato
r(m
odel
3).
Stan
dard
erro
rscl
uste
red
atvi
llage
leve
lare
repo
rted
inpa
rent
hese
s.C
ontro
lsin
clud
ege
nder
,age
,edu
catio
nan
dm
arria
gest
atus
ofth
ere
spon
dent
,ho
useh
old
size
,trib
ean
dre
ligio
n,in
form
atio
nab
outa
cces
sto
wat
er,d
wel
ling
char
acte
ristic
s,su
b-zo
nedu
mm
iesa
ndvi
llage
char
acte
ristic
s(s
ize
and
shar
eof
wom
enliv
ing
inth
evi
llage
).To
cont
rolf
orjo
ints
igni
fican
ce,w
eru
na
prob
itre
gres
sion
ofth
etre
atm
enti
ndic
ator
onth
ese
lect
edgr
oups
ofva
riabl
esan
dw
ere
port
p-va
lues
ofan
F-te
stfo
rthe
join
tsig
nific
ance
ofth
eco
effic
ient
son
the
sele
cted
varia
bles
.
29

Tabl
e5:
Info
rmat
ion
and
know
ledg
eab
outm
alar
ia
E(Y
|T=
1,X)�E(Y
|T=
0,X)
(1)
(2)
(3)
(4)
(5)
Con
trol
Trea
tmen
tO
LSO
LSIV
1.C
once
rnan
dkn
owle
dge
ofm
alar
ia0.
804
0.84
10.
037*
**0.
025*
**0.
031*
**[0
.197
][0
.148
](0
.012
)(0
.009
)(0
.011
)
2.In
the
prev
ious
6m
onth
s,he
ard
orsa
wm
essa
ges
abou
t:
2a.I
TNs
0.46
90.
484
0.01
5-0
.015
-0.0
02[0
.499
][0
.500
](0
.042
)(0
.034
)(0
.044
)
2b.E
arly
seek
ing
beha
viou
r0.
501
0.53
70.
037
0.01
40.
022
[0.5
00]
[0.4
99]
(0.0
42)
(0.0
32)
(0.0
43)
2c.E
nviro
nmen
talm
anag
emen
t0.
387
0.45
00.
064
0.01
80.
040
[0.4
87]
[0.4
98]
(0.0
43)
(0.0
35)
(0.0
49)
Con
trols
No
Yes
Yes
Join
ttes
tson
varia
bles
(with
com
para
ble
sam
ple
size
):2a
-2c
0.44
620.
6232
-
Not
e:**
*p<
0.01
,**
p<0.
05,*
p<0.
1.O
neob
serv
atio
npe
rhou
seho
ld,d
ata
avai
labl
efo
rres
pond
ents
only
.C
olum
ns(1
)and
(2)r
epor
tsa
mpl
em
eans
rest
ricte
dto
cont
rola
ndtre
atm
entg
roup
,sta
ndar
dde
viat
ions
inbr
acke
ts.C
olum
ns(3
)and
(4)r
epor
tthe
diff
eren
cebe
twee
ntre
atm
enta
ndco
ntro
lgro
ups
usin
gO
LSre
gres
sion
(mod
el2)
.Col
umn
(5)e
stim
ates
the
diff
eren
cebe
twee
nho
useh
olds
who
repo
rtto
have
rece
ived
the
spra
ying
cam
paig
nin
the
last
5m
onth
san
dth
ose
who
didn
’tby
inst
rum
entin
gpr
ogra
mpa
rtici
patio
nw
ithth
etre
atm
entg
roup
indi
cato
r(m
odel
3).
Con
cern
and
know
ledg
eof
mal
aria
isan
inde
xco
mpu
ted
byav
erag
ing
16du
mm
yva
riabl
esre
pres
entin
gin
form
atio
non
whe
ther
resp
onde
nts
belie
vem
alar
iais
apr
oble
min
the
com
mun
ity,a
reac
know
ledg
edof
the
mal
aria
vect
oran
dar
ein
form
edof
the
cate
gorie
sof
indi
vidu
als
that
are
mos
taff
ecte
dby
the
infe
ctio
n.Th
ein
dex
iseq
ualt
o1
ifth
ere
spon
dent
isco
ncer
ned
and
fully
awar
eof
mal
aria
.W
edi
scus
sth
eco
nstru
ctio
nof
the
inde
xin
deta
ilin
App
endi
xB
.2.
Stan
dard
erro
rscl
uste
red
atvi
llage
leve
lare
repo
rted
inpa
rent
hese
s.C
ontro
lsin
clud
ege
nder
,age
,edu
catio
nan
dm
arria
gest
atus
ofth
ere
spon
dent
,hou
seho
ldsi
ze,t
ribe
and
relig
ion,
info
rmat
ion
abou
tacc
esst
ow
ater
,dw
ellin
gch
arac
teris
tics,
sub-
zone
dum
mie
sand
villa
gech
arac
teris
tics(
size
and
shar
eof
wom
enliv
ing
inth
evi
llage
).To
cont
rolf
orjo
ints
igni
fican
ce,w
eru
na
prob
itre
gres
sion
ofth
etre
atm
enti
ndic
ator
onth
ese
lect
edgr
oups
ofva
riabl
esan
dw
ere
port
p-va
lues
ofan
F-te
stfo
rthe
join
tsig
nific
ance
ofth
eco
effic
ient
son
the
sele
cted
varia
bles
.
30

Tabl
e6:
Parti
cipa
tion
inLa
rval
Hab
itatM
anag
emen
t(LH
M)
E(Y
|T=
1,X)�
E(Y
|T=
0,X)
(1)
(2)
(3)
(4)
(5)
Con
trol
Trea
tmen
tO
LSO
LSIV
1.R
espo
nden
tpar
ticip
ated
inLH
Min
the
last
6m
onth
s0.
282
0.32
20.
040
0.01
10.
018
[0.4
50]
[0.4
68]
(0.0
44)
(0.0
35)
(0.0
46)
2.D
ays
spen
tby
hous
ehol
din
LHM
inth
ela
stm
onth
0.61
80.
632
0.01
30.
020
0.03
2[1
.978
][2
.774
](0
.181
)(0
.172
)(0
.224
)
Parti
cipa
ted
inLH
Min
the
last
mon
th3a
.All
mem
bers
0.39
00.
456
0.06
60.
013
0.01
3[0
.898
][1
.007
](0
.077
)(0
.067
)(0
.099
)
3b.M
ale
mem
bers>
15y.
o.0.
125
0.16
70.
042
0.01
70.
023
[0.3
99]
[0.4
62]
(0.0
31)
(0.0
25)
(0.0
34)
3c.F
emal
em
embe
rs>
15y.
o.0.
219
0.21
5-0
.004
-0.0
17-0
.026
[0.4
83]
[0.4
70]
(0.0
38)
(0.0
34)
(0.0
49)
3d.M
embe
rs<
15ye
ars
old
0.04
60.
075
0.02
90.
014
0.01
2[0
.372
][0
.467
](0
.025
)(0
.027
)(0
.043
)C
ontro
lsN
oYe
sYe
s
Join
ttes
tson
varia
bles
(with
com
para
ble
sam
ple
size
):1,
2,3b
-3d
p-va
lues
=0.
3683
0.55
49-
Not
e:**
*p<
0.01
,**
p<0.
05,*
p<0.
1.O
neob
serv
atio
npe
rho
useh
old.
Col
umns
(1)
and
(2)
repo
rtsa
mpl
em
eans
rest
ricte
dto
cont
rol
and
treat
men
tgro
up,s
tand
ard
devi
atio
nsin
brac
kets
.Col
umns
(3)a
nd(4
)rep
ortt
hedi
ffer
ence
betw
een
treat
men
tand
cont
rolg
roup
sus
ing
OLS
regr
essi
on(m
odel
2).
Col
umn
(5)
estim
ates
the
diff
eren
cebe
twee
nho
useh
olds
who
repo
rtto
have
rece
ived
the
spra
ying
cam
paig
nin
the
last
5m
onth
san
dth
ose
who
didn
’tby
inst
rum
entin
gpr
ogra
mpa
rtici
patio
nw
ithth
etre
atm
entg
roup
indi
cato
r(m
odel
3).
Stan
dard
erro
rscl
uste
red
atvi
llage
leve
lare
repo
rted
inpa
rent
hese
s.C
ontro
lsin
clud
ege
nder
,age
,edu
catio
nan
dm
arria
gest
atus
ofth
ere
spon
dent
,ho
useh
old
size
,trib
ean
dre
ligio
n,in
form
atio
nab
outa
cces
sto
wat
er,d
wel
ling
char
acte
ristic
s,su
b-zo
nedu
mm
iesa
ndvi
llage
char
acte
ristic
s(s
ize
and
shar
eof
wom
enliv
ing
inth
evi
llage
).To
cont
rolf
orjo
ints
igni
fican
ce,w
eru
na
prob
itre
gres
sion
ofth
etre
atm
enti
ndic
ator
onth
ese
lect
edgr
oups
ofva
riabl
esan
dw
ere
port
p-va
lues
ofan
F-te
stfo
rthe
join
tsig
nific
ance
ofth
eco
effic
ient
son
the
sele
cted
varia
bles
.Th
ejo
intt
esto
mits
the
varia
ble
3asi
nce
itis
just
the
sum
of3b
,3c
and
3d.
31
Tabl
e7:
Beh
avio
urs
cond
uciv
eto
mal
aria
elim
inat
ion,
othe
rtha
nLH
M
E(Y
|T=
1,X)�E(Y
|T=
0,X)
(1)
(2)
(3)
(4)
(5)
Con
trol
Trea
tmen
tO
LSO
LSIV
1.H
ouse
hold
keep
sliv
esto
ck>
100m
from
hom
e0.
776
0.80
70.
031
0.06
2*0.
077*
*[0
.417
][0
.395
](0
.032
)(0
.032
)(0
.039
)
2.H
ouse
hold
cove
rsst
ored
wat
er0.
953
0.94
2-0
.011
-0.0
27-0
.044
[0.2
12]
[0.2
34]
(0.0
20)
(0.0
24)
(0.0
33)
3.R
espo
nden
tdoe
san
ythi
ngto
prev
entm
osqu
itobi
tes
0.80
40.
834
0.03
00.
014
0.01
5[0
.397
][0
.372
](0
.031
)(0
.026
)(0
.034
)
4.R
espo
nden
tmen
tions
usin
gne
t0.
649
0.67
80.
029
0.01
90.
022
[0.4
78]
[0.4
67]
(0.0
39)
(0.0
31)
(0.0
42)
5.R
espo
nden
tmen
tions
burn
ing
coils
0.21
00.
225
0.01
5-0
.001
-0.0
06[0
.408
][0
.418
](0
.035
)(0
.023
)(0
.028
)
6.R
espo
nden
tmen
tions
usin
gsp
ray
0.02
10.
025
0.00
40.
010
0.01
5[0
.143
][0
.156
](0
.009
)(0
.008
)(0
.010
)
7.R
espo
nden
tmen
tions
burn
ing
anim
aldu
ng0.
046
0.05
80.
012
0.00
50.
007
[0.2
09]
[0.2
34]
(0.0
14)
(0.0
13)
(0.0
16)
8.R
espo
nden
tmen
tions
burn
ing
herb
s0.
054
0.04
8-0
.006
-0.0
21-0
.028
[0.2
26]
[0.2
15]
(0.0
18)
(0.0
20)
(0.0
27)
9.R
espo
nden
tmen
tions
drai
ning
stag
nant
wat
er0.
120
0.10
6-0
.014
-0.0
22-0
.033
[0.3
25]
[0.3
09]
(0.0
21)
(0.0
18)
(0.0
23)
Con
trols
No
Yes
Yes
Join
ttes
tson
varia
bles
(with
com
para
ble
sam
ple
size
):3-
9p-
valu
es=
0.88
510.
5405
-
Not
e:**
*p<
0.01
,**
p<0.
05,*
p<0.
1.O
neob
serv
atio
npe
rho
useh
old.
Col
umns
(1)
and
(2)
repo
rtsa
mpl
em
eans
rest
ricte
dto
cont
rol
and
treat
men
tgro
up,s
tand
ard
devi
atio
nsin
brac
kets
.Col
umns
(3)a
nd(4
)rep
ortt
hedi
ffer
ence
betw
een
treat
men
tand
cont
rolg
roup
sus
ing
OLS
regr
essi
on(m
odel
2).
Col
umn
(5)
estim
ates
the
diff
eren
cebe
twee
nho
useh
olds
who
repo
rtto
have
rece
ived
the
spra
ying
cam
paig
nin
the
last
5m
onth
san
dth
ose
who
didn
’tby
inst
rum
entin
gpr
ogra
mpa
rtici
patio
nw
ithth
etre
atm
entg
roup
indi
cato
r(m
odel
3).
Stan
dard
erro
rscl
uste
red
atvi
llage
leve
lare
repo
rted
inpa
rent
hese
s.C
ontro
lsin
clud
ege
nder
,age
,edu
catio
nan
dm
arria
gest
atus
ofth
ere
spon
dent
,ho
useh
old
size
,trib
ean
dre
ligio
n,in
form
atio
nab
outa
cces
sto
wat
er,d
wel
ling
char
acte
ristic
s,su
b-zo
nedu
mm
iesa
ndvi
llage
char
acte
ristic
s(s
ize
and
shar
eof
wom
enliv
ing
inth
evi
llage
).To
cont
rolf
orjo
ints
igni
fican
ce,w
eru
na
prob
itre
gres
sion
ofth
etre
atm
enti
ndic
ator
onth
ese
lect
edgr
oups
ofva
riabl
esan
dw
ere
port
p-va
lues
ofan
F-te
stfo
rthe
join
tsig
nific
ance
ofth
eco
effic
ient
son
the
sele
cted
varia
bles
.Th
efir
sttw
ova
riabl
esar
eom
itted
from
the
join
ttes
tonl
ybe
caus
eth
esa
mpl
eof
non-
mis
sing
answ
ers
fort
hese
varia
bles
ism
uch
smal
lert
han
fort
here
mai
ning
varia
bles
inth
eTa
ble.
32
Tabl
e8:
Intra
-hou
seho
ldal
loca
tion
ofbe
dne
ts
Dep
ende
ntva
riabl
e:In
divi
dual
netu
sedu
ring
the
prev
ious
nigh
tE(Y
|T=
1,X)�
E(Y
|T=
0,X)
Sub-
sam
ple
(1)
(2)
(3)
(4)
(5)
Con
trol
Trea
tmen
tO
LSO
LSIV
Chi
ldre
nun
der5
0.49
70.
529
0.03
20.
032
0.01
0[0
.500
][0
.500
](0
.047
)(0
.036
)(0
.046
)
Yout
hag
ed5
to20
0.36
20.
411
0.04
80.
061*
*0.
067
[0.4
81]
[0.4
92]
(0.0
39)
(0.0
31)
(0.0
41)
Adu
ltm
ale
wor
kers
0.27
00.
352
0.08
2**
0.13
1***
0.17
5***
[0.4
44]
[0.4
78]
(0.0
41)
(0.0
43)
(0.0
64)
Adu
ltfe
mal
ew
orke
rs0.
403
0.50
00.
097*
0.11
8**
0.18
2**
[0.4
91]
[0.5
01]
(0.0
54)
(0.0
56)
(0.0
81)
Adu
ltm
ale
unem
ploy
ed0.
241
0.30
00.
059
0.06
90.
083
[0.4
29]
[0.4
59]
(0.0
56)
(0.0
54)
(0.0
72)
Adu
ltfe
mal
eun
empl
oyed
0.44
10.
471
0.03
10.
040
0.03
3[0
.497
][0
.500
](0
.045
)(0
.038
)(0
.052
)C
ontro
lsN
oYe
sYe
s
Not
e:**
*p<
0.01
,**
p<0.
05,*
p<0.
1.O
neob
serv
atio
npe
rind
ivid
uali
nth
ese
lect
edsu
b-sa
mpl
e.Th
eou
tcom
eva
riabl
eY
isan
indi
cato
rva
riabl
eeq
ualt
o1
ifth
ein
divi
dual
repo
rtedl
ysl
eptu
nder
abe
dne
tthe
nigh
tbef
ore
the
surv
eyan
dze
root
herw
ise.
Col
umns
(1)a
nd(2
)re
port
sam
ple
mea
nsre
stric
ted
toco
ntro
land
treat
men
tgro
up,s
tand
ard
devi
atio
nsin
brac
kets
.C
olum
ns(3
)and
(4)
repo
rtth
edi
ffer
ence
betw
een
treat
men
tand
cont
rolg
roup
susi
ngO
LSre
gres
sion
(mod
el2)
.Col
umn
(5)e
stim
ates
the
diff
eren
cebe
twee
nho
useh
olds
who
repo
rtto
have
rece
ived
the
spra
ying
cam
paig
nin
the
last
5m
onth
sand
thos
ew
hodi
dn’t
byin
stru
men
ting
prog
ram
parti
cipa
tion
with
the
treat
men
tgr
oup
indi
cato
r(m
odel
3).
Stan
dard
erro
rscl
uste
red
atvi
llage
leve
lare
repo
rted
inpa
rent
hese
s.C
ontro
lsin
clud
ege
nder
and
age
ofth
ein
divi
dual
,ed
ucat
ion,
age
and
mar
riage
stat
usof
the
resp
onde
nt,
hous
ehol
dsi
ze,
tribe
and
relig
ion,
info
rmat
ion
abou
tac
cess
tow
ater
,dw
ellin
gch
arac
teris
tics,
sub-
zone
dum
mie
san
dvi
llage
char
acte
ristic
s(s
ize
and
shar
eof
wom
enliv
ing
inth
evi
llage
).
33

Appendix to “Do Public Health Interventions Crowd Out Private HealthInvestments? Malaria Control Policies in Eritrea”
FOR ONLINE PUBLICATION ONLY
A. Theoretical Framework
This Section presents a detailed derivation of the model and the results presented inSection 4.
A.1. Perfect information
With exogenous wage w, workers are maximising their expected time endowmentE(timei), i.e. E(Ui) = E(w · timei � di · 1[Ni = 1]) where di is the disutility fromITN use. Under perfect information, all workers know that the probability of malaria in-fection, ⇡, is ⇡ > 0 if they do not use any preventive technology. The government makespreventive technology N freely available to all who want it. The expected time endowmentE(timei) of worker i depends on whether he uses N :
E(timei) = (1� ⇡)T + ⇡
⇥(T � t) +Nip
Nt
⇤= T � ⇡t
�1�Nip
N�
(A.1)
If worker i is not infected, he will have full time endowment T , irrespective of his useof N . If instead he is infected, he will lose time endowment t and will be left with T � t.Worker i will use technology N if and only if its use can increase his expected utility,which happens if the expected gains (net use would grant him protection with probabilityp
N ) can compensate for the disutility incurred from its use:
N
⇤i = 1 , E(Ui|Ni = 1) > E(Ui|Ni = 0)
, w⇡p
Nt > di (A.2)
Technology S becomes available to the government, who can decide whether to intro-duce it in addition to technology N . Workers can observe the decision of the government.If S is not introduced, the expected time available to worker i will remain unchanged and
1

so will his decision about net use, so that:
E(timei|S = 0) = T � ⇡t
�1�Nip
N�
(A.3)
If S = 0 then N
⇤i = 1 , w⇡tp
N> di (A.4)
If S is introduced by the government, the expected time available to worker i is instead:
E(timei|S = 1) = (1� ⇡)T + ⇡
((1�Ni)[(p
ST + (1� p
S)(T � t)]+
Ni[(pN[S
T + (1� p
N[S)(T � t)]
)
= T � ⇡t[1� (p
S)
1�Ni(p
N[S)
Ni] (A.5)
Worker i will use technology N if and only if its use can increase his expected utility:
If S = 1 then
N
⇤i = 1 , E(Ui|S = 1, Ni = 1) > E(Ui|S = 1, Ni = 0)
, w⇡t(p
N[S � p
S) > di (A.6)
Once IRS campaigns have been rolled out, workers will choose to sleep under an ITNif and only if the additional expected gains from its use can compensate for the disutilityincurred from use of the technology. This depends not only from the gain in terms of riskof being infected, but as well by how large is wage and how high is the cost in term of timeof malaria.
To assess the relationship between conditions (A.4) and (A.6), we need to make an ad-ditional assumption about the relationship between the protection offered by N alone, pN ,and the additional protection offered when S is also available, pN[S �p
S . The assumptionthat seems most sensible to us is that the additional protection offered by N when S is alsoavailable cannot exceed that granted when S is not offered, i.e. N and S are imperfectsubstitutes.
Assumption 1. pN[S p
N+ p
S
Proposition 1. If workers are perfectly informed about the probability of infection in ab-sence of any preventive technology, ⇡, and technologies N and S are imperfect substitutes,
2

then the average use of N when S is introduced (✓S) cannot be higher of the average useof N when S is not introduced (✓N ), i.e., Pr(✓S > ✓
N) = 0, where ✓
S ⌘ E(N
⇤i |S = 1)
and ✓
N ⌘ E(N
⇤i |S = 0).
Proof. We have shown that if S = 0 then N
⇤i = 1 if and only if w⇡tpN > di and that
if S = 1 then N
⇤i = 1 if and only if w⇡(pN[S � p
S)t > di. Assumption 1 implies that
p
N[S � p
S p
N . Notice now that condition (A.6) is stricter than (A.4), i.e. (A.6))(A.4)but (A.4)6)(A.6). Therefore, a worker who uses N when S is available, would havecertainly used it also in the absence of S. Therefore the average use of N cannot be higherwhen S is introduced compare to when it is not introduced, i.e. Pr(✓S > ✓
N) = 0.
Consider now the case in which technologies N and S are imperfect complements.
Assumption 2. pN[S � p
N+ p
S
Proposition 2. If workers are perfectly informed about the probability of infection in ab-sence of any preventive technology, ⇡, and technologies N and S are imperfect comple-ments, then the average use of N when S is introduced (✓S) cannot be lower of the averageuse of N when S is not introduced (✓N ), i.e. Pr(✓S < ✓
N) = 0.
Proof. Assumption 1 implies that pN[S � p
S � p
N . Therefore, a worker who uses N
when S is not available, would have certainly used it also in the presence of S. Thereforethe average use of N cannot be lower when S is introduced compare to when it is notintroduced, i.e. Pr(✓S < ✓
N) = 0.
A.2. Imperfect information
Suppose now that workers do not know the true value of ⇡ and that, for simplicity, ⇡can only take two values: 0 or ⇡ > 0. Each worker i is endowed with a prior pi ⌘ Pi(⇡ =
⇡) drawn from a Uniform(0, 1) distribution. Workers believe that the provider of S, i.e.the government, has perfect knowledge about ⇡. Therefore, it is reasonable to assume thatall individuals believe that the probability that the government provides S when the truerisk of infection is 0 cannot exceed the probability that it does so when malaria poses athreat:
3
Assumption 3. Pr(S = 1|⇡ = ⇡) � Pr(S = 1|⇡ = 0)
Assume that the government makes preventive technology N freely available to allwho want it, while technology S is not yet provided. The expected time available toworker i will be:
E(timei) = (1� pi)T + pi
"(1� ⇡)T + ⇡
((1�Ni)(T � t)+
Ni[(pNT + (1� p
N)(T � t)]
)#
= T � pi⇡t(1�NipN) (A.7)
Similarly to the perfect information case, worker i will use technology N if and only ifthe expected protection granted from its use can more than compensate from the disutilityincurred:
N
⇤i = 1 , E(Ui|Ni = 1) > E(Ui|Ni = 0) , piw⇡ p
Nt > di (A.8)
Assume now that technology S becomes available to the government, who is decidingwhether to introduce it in addition to technology N . Workers can observe the decision ofthe government and update their beliefs using Bayes’ rule after observing the realisationof S. Lemma 1 describes how workers update their beliefs if they observe that the gov-ernment has introduced S and Lemma 2 describes how workers update their beliefs if theyobserve that the government has not introduced S.
Lemma 1. If the government introduces S, the posterior probability of malaria infectionp
1i ⌘ Pi(⇡ = ⇡|S = 1) cannot be smaller than the prior probability of malaria infectionPi(⇡ = ⇡), i.e. p1i � pi.
When workers observe S, they update their beliefs using Bayes’ rule:
p
1i =
P (S = 1|⇡ = ⇡)pi
P (S = 1)
=
P (S = 1|⇡ = ⇡)pi
P (S = 1|⇡ = ⇡)P (⇡ = ⇡) + P (S = 1|⇡ = 0)P (⇡ = 0)
By Assumption 3, workers also know that P (S = 1|⇡ = ⇡) � P (S = 1|⇡ = 0).
4
Assuming by contradiction that p1i < pi implies
P (S = 1|⇡ = ⇡)pi
P (S = 1|⇡ = ⇡)P (⇡ = ⇡) + P (S = 1|⇡ = 0)P (⇡ = 0)
< pi
P (S = 1|⇡ = ⇡) < P (S = 1|⇡ = 0)
Lemma 2. If the government does not provide S, the posterior probability of malariainfection p
0i ⌘ Pi(⇡ = ⇡|S = 0) cannot be larger than the prior probability of malaria
infection Pi(⇡ = ⇡), i.e. p0i pi.
Workers update their beliefs using Bayes’ rule after observing that the Government hasnot introduced S:
p
0i =
P (S = 0|⇡ = ⇡)pi
P (S = 0)
=
P (S = 0|⇡ = ⇡)pi
P (S = 0|⇡ = ⇡)P (⇡ = ⇡) + P (S = 0|⇡ = 0)P (⇡ = 0)
Notice that Assumption 3 implies that: P (S = 0|⇡ = ⇡) P (S = 0|⇡ = 0). Assumingby contradiction that p0i > pi) implies
P (S = 0|⇡ = ⇡)pi
P (S = 0|⇡ = ⇡)P (⇡ = ⇡) + P (S = 0|⇡ = 0)P (⇡ = 0)
> pi
P (S = 0|⇡ = ⇡) > P (S = 0|⇡ = 0)
Lemma 1 (Lemma 2) shows that if the government chooses to provide (not to provide)S and the worker specific disutility di is left unchanged, workers may revise their beliefsthat ⇡ = ⇡ only upward (downward). More (fewer) workers may then choose to use N .
Lemma 3. Lemma 1 and Lemma 2 imply that p1i � p
0i .
Observation of the decision about the introduction of S has implications for the com-putation of the expected time available to worker i and for his optimal choice to use N . If
5

the government introduces technology S, the expected time available to worker i will be:
E(timei|S = 1) = (1� p
1i )T + p
1i
"(1� ⇡)T + ⇡
((1�Ni)[(p
ST + (1� p
S)(T � t)]+
Ni[(pN[S
T + (1� p
N[S)(T � t)]
)#
= T � p
1i⇡t[1� (p
S)
1�Ni(p
N[S)
Ni] (A.9)
Having updated their beliefs, workers will use N if and only if its use can increasetheir own expected utility, i.e. if S = 1 then
N
⇤i = 1 , E(Ui|S = 1, Ni = 1) > E(Ui|S = 1, Ni = 0)
, p
1iw⇡t(p
N[S � p
S) > di (A.10)
Similarly, if the government does not introduce technology S, the expected time avail-able to worker i will be:
E(timei|S = 0) = (1� p
0i )T + p
0i
"(1� ⇡)T + ⇡
((1�Ni)(T � t)+
Ni[(pNT + (1� p
N)(T � t)]
)#
= T � p
0i⇡t(1�Nip
N) (A.11)
Having updated their beliefs, workers will use N if and only if its use can increasetheir own expected utility, i.e. if S = 0 then
N
⇤i = 1 , E(Ui|S = 0, Ni = 1) > E(Ui|S = 0, Ni = 0)
, p
0iw⇡tp
N> di (A.12)
From Lemma 3 we know that Pi(⇡ = ⇡|S = 1) � Pi(⇡ = ⇡|S = 0). As in the perfectinformation case, the relationship between (p
N[S � p
S) and p
N depends on whether weassume that N and S are substitutes or complements.
Proposition 3. In the imperfect information setting, if workers are Bayesian updaters andif N and S are (imperfect) substitutes, i.e. pN[S p
N+ p
S , the share ✓
S of workers whochoose to use N once S is introduced, can be larger or smaller than the share ✓N of work-ers using N when S is not introduced. If instead N and S are (imperfect) complements,
6
i.e. if pN[S � p
N+ p
S , the share ✓S of workers who choose to use N once S is introducedcannot be smaller than the share ✓
N of workers using N when S is not introduced.
Proof. In the case in which N and S are (imperfect) substitutes, Lemma 3 and Assumption1 imply that (A.8) 6) (A.12) and (A.8) 6( (A.12). So it is possible that ✓S < ✓
N or that✓
S � ✓
N . Notice in particular that P (✓
S> ✓
N) > 0. This is in contrast with the analogous
result for the perfect information case, for which we showed that P (✓
S> ✓
N) = 0. If
instead N and S are (imperfect) complements, Pi(⇡ > 0|S = 1) � Pi(⇡ > 0) andp
N[S � p
N+ p
S imply that (A.8) ) (A.12) and (A.8) 6( (A.12). So it is possible that✓
S � ✓
N , but not that ✓S < ✓
N . In this case we obtain the same prediction as in the perfectinformation case, i.e. that P (✓
S> ✓
N) > 0.
A.3. Externalities
In our model, we have not accounted for any externalities which may arise from others’use of ITNs. First of all, the more people use nets, the less likely it is that mosquitoes willcarry the disease. Secondly, because ITNs are treated with insecticide, the more ITNs areused, the smaller the size of the mosquito population and the lower the need to sleep underan ITN. Thirdly, people may learn about the importance of using an ITN from their peersso that the larger the group of adopters within a certain network, the more people are likelyto follow their example.
However, it is unclear which of these arguments are most relevant to agents in theirdecision to adopt technology N . From the first two channels we see how increased ITNuse in the community may put downward pressure on agents’ individual ITN use. In theextreme case in which everyone else sleeps under an ITN, a person cannot benefit fromdoing so as the vector cannot bite at night anyone else who has malaria. If instead noone sleeps under an ITN, then a person benefits the most from doing so, because there aremany mosquitoes and they are very likely to carry the disease. Finally, in an intermediatesituation, such as the one we investigate in this paper, benefits from ITN use decline withthe share of net users in the village.
We notice that the information campaigns conducted in Eritrea explain to the peoplethat they can get malaria only from mosquito bites, that they should use ITNs to protectthemselves from mosquitoes and that the insecticide on ITNs can kill mosquitoes. As a
7

result of this information strategy, we believe that the people in our study area are not awarethat mosquitoes are solely a vector, rather than the source of malaria. If people understandthat the more ITNs are used, the smaller the size of the mosquito population, incentives fornet use will be small in villages with high usage rates. Having no data on the importanceand on the relative size of these channels, we prefer to exclude this consideration from ourmodel.
B. Additional Data Analysis
B.1. Malaria prevalence
To understand whether the introduction of IRS on top of the existing package of in-tegrated interventions was an effective strategy to eradicate malaria completely, we needto discuss two characteristics of the diffusion of the disease in Eritrea and how this relatesto the study. Firstly, malaria prevalence was extremely low in the area under investig-ation, but the study was conducted in an area where malaria prevalence was drasticallyreduced over the past decade. The number of clinical malaria cases declined sharply inEritrea over the past decade, from 260,000 in 1998 to 26,000 in 2008 (Figure B2, PanelA). Gash Barka, the zone where most cases are concentrated, witnessed a similar trend,recording 110,000 cases in 1998 and 18,000 cases in 2008. Secondly, malaria transmissionis typically seasonal: it extends from July until November-December and it reaches a peakbetween September and November, period during which the survey was conducted (Octo-ber). This pattern is shown in Panel B of Figure B2, which presents the average numberof malaria cases2 over the year in Gash Barka over the period 2002-2007.
At the time of the survey, all present and consenting household members were testedfor malaria using Carestart® rapid diagnostic tests (RDT) and microscopy was used to val-idate positive RDT results. Keating et al. (2011) shows that 5,502 people were tested withRDT, and among those 13 individuals tested positive in the control group and 17 testedpositive in the treatment group. The difference in the share of positive RDTs between thetwo groups is very small (and positive) and not significant.
2Figures include both IPD (in-patient department) and OPD (out-patient department) malaria cases.
8

These figures are in line with those provided by the NMCP of Eritrea. The total numberof malaria cases3 registered by NMCP in Gash Barka in 2008 was 20,320, which is about3% of the estimated population living in the region (670,000). We tested 5,502 people inthe survey, therefore the expected number of malaria cases among them over the wholeyear is 166, i.e. 3% of 5,502. Due to seasonality of malaria, the yearly share of malariacases occurred in September4 between 2002-2007 was 15%. Therefore the expected num-ber of positive RDTs at the beginning of October was 25, i.e., 15% of 166. The numberof positive RDTs in our sample is a bit larger than this, possibly because not all malariapatients report to health facilities.
B.2. Concern and knowledge of malaria
To compute a measure of concern and knowledge of malaria, we build an index byusing all available information on whether the respondent believe malaria is a concern inthe community, are acknowledged of the malaria vector and are informed of the categoriesof individuals that are most affected by the infection. We average 16 dummy variablesrepresenting answers to these questions. For each variable, the respondent scores 1 ifthe answer is in line with concern or correct knowledge of malaria and 0 if the answerindicates wrong (or absent) knowledge of malaria. Therefore, an index equal to 1 indicatesthat the individual is concerned and fully aware of malaria. The variables considered inthe construction of the index are presented in Tables B1 and B2.
The first set of dummy variables concerns knowledge about the vector (or the cause)of malaria. Table B1 presents the share of respondents in the control and treatment groupswho mentioned each vector/cause of malaria5 and the estimated effect of the IRS cam-paign. While there is widespread knowledge that mosquitoes are an important transmis-sion vector, there is quite large share of respondents mentioning wrong causes such asunhygienic surroundings, poor diet or fatigue. A second set of variables indicates whetherthe respondent believes malaria is a problem in the village. Table B2 shows that, in spite
3Sum of IPD (in patient department) and OPD (out patient department) cases.4Positive RDTs indicate a malaria infection that occurred in the month prior to the test. September is
roughly the month before the survey.5The respondent is allowed to report multiple answers to this question.
9

of the fairly low levels of parasite prevalence in the region6, malaria is still (correctly)perceived as a problem in the community by a large majority of the population, both intreatment and control villages. However, notice that around 30 percent of respondentsreport that malaria is not a problem in their community, despite the fact that our surveywas conducted in the most malarious villages in Eritrea.7 A third set of variables focus onwhether the respondent believes a certain category of individuals is most affected by mal-aria. Even though almost everyone agrees that children are especially at risk from malaria,only about a third of respondents believe that pregnant women suffer greatly from havingmalaria.
To check whether the index captures pre-existent differences in exposure to malaria, wecomplement our dataset with sub-zone level panel data on a vegetation index called Nor-malised Difference Vegetation Index (NDVI), which is obtained from the analysis of thecolour spectrum of satellite imagery and which generally measures the overall propensityof an area to harbour mosquito populations8. To build a measure of past exposure to mal-aria, for each sub-zone we counted the number of 2-week periods in which NDVI exceeded0.361 during the period 2000-2009 and we divided sub-zones into three different groups:“very limited vegetation (low past exposure)”, “some vegetation (middle past exposure)”and “significant vegetation (high past exposure)”. Table B3 shows that past exposure, asproxied by the NDVI index, is positively correlated with higher concern and knowledge ofmalaria. At the same time, the treatment effect of providing IRS is unaffected by introdu-cing controls on average past exposure.
6Keating et al. (2011) document a prevalence rate below 1 percent (October, 2009).7The Global Malaria Action Plan of the Roll Back Malaria initiative (http://www.rbm.who.int/gmap/)
explains that the situation whereby villagers lose interest in malaria and in prevention, in areas where malariahas been dramatically reduced by successful control efforts, is referred to as “malaria fatigue”. It can leadthe public to reduce use of available preventive and treatment measures.
8For Sudan, Gaudart et al. (2009) find that the seasonal pattern of P. falciparum incidence is significantlyexplained by NDVI from 1981-2006 and they identify a threshold NDVI value of 0.361, above which anincrease in the incidence of parasitemia is predicted. Similarly, for Indochina Peninsula, Nihei et al. (2002)find that P. falciparum Malaria is most prevalent in regions with NDVI >0.4 for at least 6 consecutivemonths.
10
B.3. Use of bed nets in the absence of IRS
Table B6 shows that, in the absence of IRS (in control villages), net usage varies greatlyby age and employment status: children under 5 are the most likely to sleep under abed net (50%), followed by school age youths (36%), unemployed and employed womenin working age (44 and 40%) and finally by employed and unemployed adult men (27and 24%). No significant gender differences were observed among children under fiveor among young people. Among employed adults, women are much more likely to sleepunder a bed net (+13%) and the same is true among the unemployed (+20%).
B.4. Estimation method
B.4.1. Endogenous participation and missing values
In Section 5 we presented IV estimation to take into account the imperfect take up ofthe spraying campaign. To measure take up we rely on self-reported participation in theprogramme and we use information about whether the respondent reports that his dwellingwas sprayed during the 5 months previous to the survey. The self-reported participation ishowever affected by households who reported that they didn’t know whether their dwellinghad been sprayed. We can construct endogenous participation by computing the share ofhouseholds within each village who have reported to have participated in the sprayingcampaign out of the overall population. Table B4 presents first stage regressions usingboth variables measuring endogenous participation. In addition, we present a comparisonbetween different IV strategies for estimating the effect on net ownership: Table B5 showsthat using endogenous participation at individual or at village level is not significantlyaffecting the coefficients.
B.4.2. Non-linear methods for binary outcomes
In the main text, we present for all variables estimates of treatment effects based onleast squares regression and on a linear regression model augmented with an endogenousbinary-treatment variable (estimated by full maximum likelihood). For binary outcomes,in order to show robustness of the coefficients to non-linear models, we present in thissection estimates of the treatment effect using a probit model and, for IV estimation, a
11

maximum-likelihood two-equation probit model. In other words, we estimate the follow-ing model
Pr(Yij = 1 |T j, Xi, Vj) = �
�↵ + � Tj +X
0i� + V
0j � + ✏ij
�(B.1)
where Tj is the treatment indicator, Xi is a vector of individual and household char-acteristics, V j is a vector of village characteristics, ✏ij is an individual specific error termand � is the cumulative distribution function of a standard normal distribution. When con-sidering the imperfect compliance to the program, we estimate the following two-equationmodel using maximum-likelihood:
Pr(Yij = 1 |Spray5mi, Xi, Vj) = �
�↵ + � Spray5mi +X
0i� + V
0j � + ✏ij
�(B.2)
Pr(Spray5mi = 1 |Tj, Xi, Vj) = �
�✓1 + ✓2 Tj +X
0i✓3 + V
0j ✓4 + vij
�(B.3)
where Spray5mi is an indicator variable that takes value 1 if the dwelling of householdi was sprayed with insecticide in the five months before the survey and 0 otherwise.
Tables B7 and B8 present the results for the binary outcomes presented in Tables 5, 4and 8 in the main text, but using non-linear estimation methods. Results provide evidenceon the robustness of the treatment effect coefficients for binary outcomes to non-linearestimations methods.
B.5. Per capita net ownership
Throughout the paper, we refer to the number of nets as the total number owned orobserved per household. In all estimations where controls are included household size isadded as regressor to control for potential unbalances in household size between treatmentand control group. In this Section we check whether results differ when we look at percapita nets (e.g. dividing the total number of nets by the number of household members)instead of total number of nets. Table B9 presents estimates of treatment effect usingmodel 2 and model 3 on the per-capita ownership of mosquito bed nets. We can observethat, similarly to analysing the total number of nets, a significant effect is found for thenumber of nets owned (both for self-reported and observed data).
12

B.6. Stock of nets over time
The information about how and when the observed bed nets have been acquired was notdirectly observable by the enumerators conducting the interviews. We have to rely on self-reported information to provide evidence that net ownership is recent. For each observedbed net, the question “How long ago (in months) did your household obtain the mosquitonet?” was asked to the respondent. However we need to note that self-reported data mightpresent very large measurement error in this case. Firstly, the information is reported byone person only within the household, the respondent, who might have limited informationabout the time in which the bed net was acquired. Secondly, we request information aboutthe acquisition for each observed net, which means recalling information for multiple nets.Thirdly, we find evidence of rounding for the responses “6 months ago”, “12 months ago”and “24 months ago”. Fourthly, we ask only about the nets that are currently observed inthe household and we don’t ask information about nets that were used in the past and arecurrently not observed in the dwelling.
We make use of the reported information to construct the stock of nets (conditionalon having the net being observed at the time of the interview) for each household foreach month before the interview. This allows comparing the average stock of nets for thetreatment and control group to check for significant differences. Table B10 presents theaverage number of nets for the control and treatment group 3, 6 and 12 months before theinterview and the estimated difference using models (2) and (3). Results show evidencethat bed nets were acquired recently, but we cannot draw clear conclusions due to theweaknesses of the information.
B.7. Heterogeneous treatment effects
It is possible that the impact of IRS varied across groups of individuals or households.In this section, we analyse heterogeneity in treatment effect by looking at malaria risk(proxied by a vegetation index), employment status, other individual characteristics of therespondent and household wealth.
Households residing in more arid areas may have reacted differently from those livingin villages with more vegetation, either because the direct impact of spraying is differentacross areas or because the role of information and perceptions varies. We analysed this
13
possibility for the case of the malaria awareness. Tables B11 report in Column 1 theestimates of heterogeneous treatment effects obtained from OLS regressions where thetreatment status is interacted with dummy variables indicating the Normalised DifferenceVegetation Index category9. Our estimates in Table B11 suggest that malaria awarenessdid not change on average in any vegetation area.
Workers may have been impacted by IRS campaign differently compared to unem-ployed adults10, because the marginal cost of being infected might be higher. Similarly,for malaria awareness, Columns 2-4 in Table B11 report estimates of heterogeneous treat-ment effects obtained from OLS regressions where the treatment status is interacted withthe employment status of the respondent11. Estimates show a significant 13% increaseamong workers (Column 2). In Columns 3 and 4, we restrict the sample to men and wo-men and we find similar estimates and particularly significant for women.
In addition we present heterogeneous treatment effects estimates on net ownershiplooking at other individual characteristics: unemployment and literacy status, religion andtribe, gender of household head, household size. Table B12 shows that households withunemployed respondents did not significantly differ from the ones with an employed re-spondent. When looking at literacy, literate respondents12 acquired more nets than thosewith an illiterate head (even if the difference is not statistically significant). We don’tobserve significant difference among muslim and among tribes different than the Tigretribe. The treatment effect was only slightly larger in male-headed households than infemale-headed ones. We observe a larger effect in households in the first and third tercile
9Normalised Difference Vegetation Index (NDVI) is a vegetation index computed using satellite images.We divided villages in the following categories: 0 hints to “very limited vegetation”, 1 stands for “somevegetation” and 2 means “with significant vegetation”. A detailed presentation of the index is presented inthe Online Supplementary Material.
10Our definition of unemployed includes those adults (>20 years old) who are out of the labor force aswell as those who are enrolled in National Service, which is compulsory for some years for all young peopleof the country, for men and women alike. The salary provided to people in National Service is very low.
11The variable work is an indicator variable equal to 1 if the respondent is employed or self-employedand zero otherwise.
12This information is available for all respondents, but not for all households heads. 62% of respondentswere household heads and 34% of respondents were partners of the head. We replicated these regressionsincluding and excluding respondents who are not the head or the spouse. Their inclusion does not affect theestimates, so we use the unrestricted sample.
14

of household size distribution.To conclude, we estimate heterogenous treatment effects depending on household
wealth13. Column 3 of Table B13 shows the coefficient on the interaction between thetreatment status and the dummy variables indicating whether the household in the x � th
tercile of the asset distribution. We observe that the poorest households did not increasetheir stock of nets, while an increase of about 0.24 units is observed in the second wealthquintiles. This reinforces the finding that there is a relationship between net ownershipand household wealth even if nets are distributed for free.
13We computed a wealth index with Principal Component Analysis using information on household assetownership. A detailed presentation of the index is presented in the Online Supplementary Material.
15

Figure B1: Location of Zone Gash Barka in Eritrea and selected sub-zones
A. Zone selected B. Sub-zones selected
Note: Panel A shows the administrative division of Eritrea in the following Zones: A. Anseba, B. Derub,C. Debubawi Keyih Bahri, D. Gash Barka, E. Makel, F. Semenawi Keyih Bahri. The zone selected for thestudy (Gash Barka) is highlighted in darker colour. Panel B presents the division of Gash Barka into itsadministrative sub-zones: 1. Akordat, 2. Barentu, 3. Dghe, 4. Forto, 5. Gogne, 6. Haykota, 7. La’ElayGash, 8. Logo Anseba, 9. Mansura, 10. Mogolo, 11. Omhajer (Guluj), 12. Shemboko (Shambuko) andMolki, 13. Tesseney. The sub-zones highlighted in darker colour were the one selected for the study.
Figure B2: Clinical malaria cases in Eritrea and Gash Barka
A. Yearly cases, Eritrea (1998-2008) B. Monthly cases, Gash Barka (2002-2007)
Note: Panel A presents the number of yearly cases of malaria in Eritrea in the period 1998-2008. Panel Bpresents the monthly average number of malaria cases in Gash Barka for the period 2002-2007. Sources:Eritrea Malaria Five Year Strategic Plan; NMCP Eritrea Annual Report 2008.
16
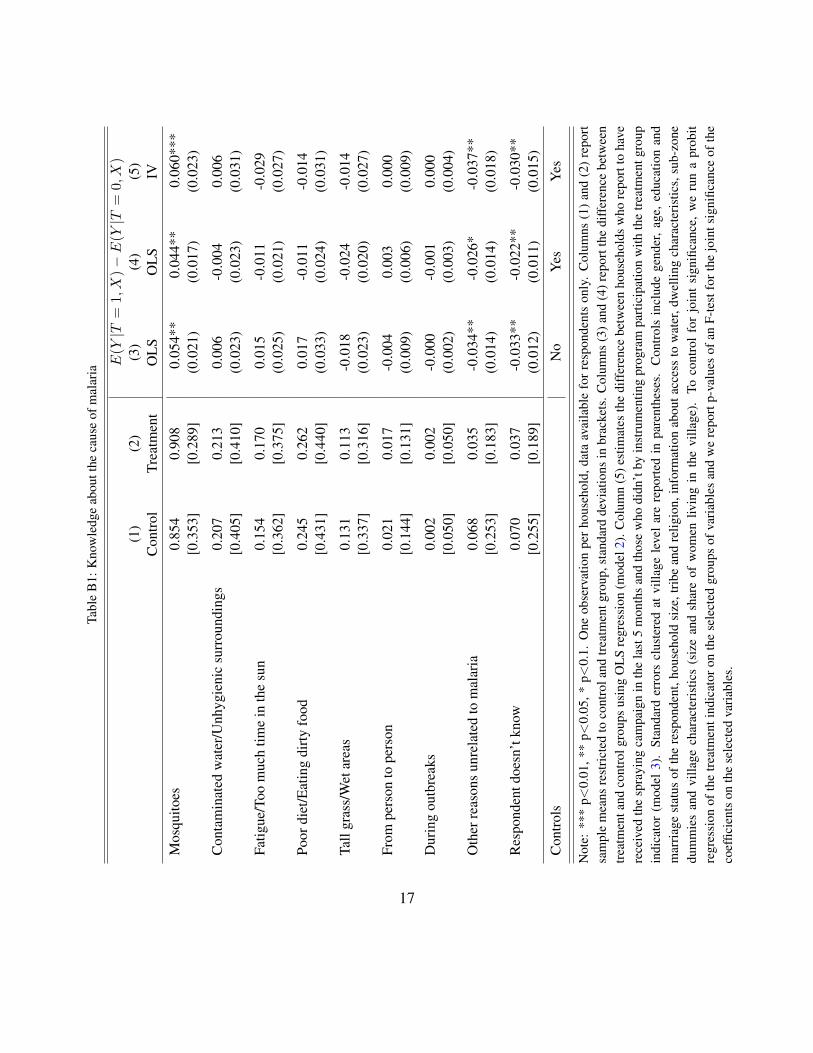
Tabl
eB
1:K
now
ledg
eab
outt
heca
use
ofm
alar
ia
E(Y
|T=
1,X)�E(Y
|T=
0,X)
(1)
(2)
(3)
(4)
(5)
Con
trol
Trea
tmen
tO
LSO
LSIV
Mos
quito
es0.
854
0.90
80.
054*
*0.
044*
*0.
060*
**[0
.353
][0
.289
](0
.021
)(0
.017
)(0
.023
)
Con
tam
inat
edw
ater
/Unh
ygie
nic
surr
ound
ings
0.20
70.
213
0.00
6-0
.004
0.00
6[0
.405
][0
.410
](0
.023
)(0
.023
)(0
.031
)
Fatig
ue/T
oom
uch
time
inth
esu
n0.
154
0.17
00.
015
-0.0
11-0
.029
[0.3
62]
[0.3
75]
(0.0
25)
(0.0
21)
(0.0
27)
Poor
diet
/Eat
ing
dirty
food
0.24
50.
262
0.01
7-0
.011
-0.0
14[0
.431
][0
.440
](0
.033
)(0
.024
)(0
.031
)
Tall
gras
s/W
etar
eas
0.13
10.
113
-0.0
18-0
.024
-0.0
14[0
.337
][0
.316
](0
.023
)(0
.020
)(0
.027
)
From
pers
onto
pers
on0.
021
0.01
7-0
.004
0.00
30.
000
[0.1
44]
[0.1
31]
(0.0
09)
(0.0
06)
(0.0
09)
Dur
ing
outb
reak
s0.
002
0.00
2-0
.000
-0.0
010.
000
[0.0
50]
[0.0
50]
(0.0
02)
(0.0
03)
(0.0
04)
Oth
erre
ason
sun
rela
ted
tom
alar
ia0.
068
0.03
5-0
.034
**-0
.026
*-0
.037
**[0
.253
][0
.183
](0
.014
)(0
.014
)(0
.018
)
Res
pond
entd
oesn
’tkn
ow0.
070
0.03
7-0
.033
**-0
.022
**-0
.030
**[0
.255
][0
.189
](0
.012
)(0
.011
)(0
.015
)C
ontro
lsN
oYe
sYe
s
Not
e:**
*p<
0.01
,**
p<0.
05,*
p<0.
1.O
neob
serv
atio
npe
rhou
seho
ld,d
ata
avai
labl
efo
rres
pond
ents
only
.C
olum
ns(1
)and
(2)r
epor
tsa
mpl
em
eans
rest
ricte
dto
cont
rola
ndtre
atm
entg
roup
,sta
ndar
dde
viat
ions
inbr
acke
ts.C
olum
ns(3
)and
(4)r
epor
tthe
diff
eren
cebe
twee
ntre
atm
enta
ndco
ntro
lgro
ups
usin
gO
LSre
gres
sion
(mod
el2)
.Col
umn
(5)e
stim
ates
the
diff
eren
cebe
twee
nho
useh
olds
who
repo
rtto
have
rece
ived
the
spra
ying
cam
paig
nin
the
last
5m
onth
san
dth
ose
who
didn
’tby
inst
rum
entin
gpr
ogra
mpa
rtici
patio
nw
ithth
etre
atm
entg
roup
indi
cato
r(m
odel
3).
Stan
dard
erro
rscl
uste
red
atvi
llage
leve
lare
repo
rted
inpa
rent
hese
s.C
ontro
lsin
clud
ege
nder
,age
,edu
catio
nan
dm
arria
gest
atus
ofth
ere
spon
dent
,hou
seho
ldsi
ze,t
ribe
and
relig
ion,
info
rmat
ion
abou
tacc
ess
tow
ater
,dw
ellin
gch
arac
teris
tics,
sub-
zone
dum
mie
san
dvi
llage
char
acte
ristic
s(s
ize
and
shar
eof
wom
enliv
ing
inth
evi
llage
).To
cont
rol
for
join
tsi
gnifi
canc
e,w
eru
na
prob
itre
gres
sion
ofth
etre
atm
enti
ndic
ator
onth
ese
lect
edgr
oups
ofva
riabl
esan
dw
ere
port
p-va
lues
ofan
F-te
stfo
rthe
join
tsig
nific
ance
ofth
eco
effic
ient
son
the
sele
cted
varia
bles
.
17

Tabl
eB
2:C
once
rnab
outm
alar
ia
E(Y
|T=
1,X)�
E(Y
|T=
0,X)
(1)
(2)
(3)
(4)
(5)
Con
trol
Trea
tmen
tO
LSO
LSIV
1.M
alar
iais
apr
oble
min
the
villa
geYe
s0.
655
0.71
10.
056
0.01
60.
027
[0.4
76]
[0.4
54]
(0.0
45)
(0.0
33)
(0.0
44)
Res
pond
entd
oesn
’tkn
ow0.
022
0.02
1-0
.001
0.00
50.
001
[0.1
48]
[0.1
44]
(0.0
09)
(0.0
08)
(0.0
11)
2.M
osta
ffec
ted
bym
alar
ia:
Chi
ldre
n0.
804
0.86
60.
062*
*0.
038*
*0.
052*
*[0
.397
][0
.341
](0
.025
)(0
.018
)(0
.025
)
Preg
nant
wom
en0.
372
0.36
8-0
.004
-0.0
07-0
.023
[0.4
84]
[0.4
83]
(0.0
41)
(0.0
28)
(0.0
37)
Chi
ldre
nan
dpr
egna
ntw
omen
0.29
30.
313
0.02
00.
009
0.00
0[0
.455
][0
.464
](0
.035
)(0
.025
)(0
.033
)
Adu
ltm
en0.
029
0.03
50.
006
-0.0
01-0
.012
[0.1
68]
[0.1
83]
(0.0
11)
(0.0
12)
(0.0
14)
Adu
ltw
omen
0.03
40.
033
-0.0
01-0
.007
-0.0
12[0
.182
][0
.180
](0
.009
)(0
.008
)(0
.011
)
Res
pond
entd
oesn
’tkn
ow0.
115
0.06
7-0
.048
**-0
.019
-0.0
19[0
.319
][0
.250
](0
.022
)(0
.015
)(0
.022
)C
ontro
lsN
oYe
sYe
s
Not
e:**
*p<
0.01
,**
p<0.
05,*
p<0.
1.O
neob
serv
atio
npe
rhou
seho
ld,d
ata
avai
labl
efo
rres
pond
ents
only
.C
olum
ns(1
)and
(2)r
epor
tsa
mpl
em
eans
rest
ricte
dto
cont
rola
ndtre
atm
entg
roup
,sta
ndar
dde
viat
ions
inbr
acke
ts.C
olum
ns(3
)and
(4)r
epor
tthe
diff
eren
cebe
twee
ntre
atm
enta
ndco
ntro
lgro
ups
usin
gO
LSre
gres
sion
(mod
el2)
.Col
umn
(5)e
stim
ates
the
diff
eren
cebe
twee
nho
useh
olds
who
repo
rtto
have
rece
ived
the
spra
ying
cam
paig
nin
the
last
5m
onth
san
dth
ose
who
didn
’tby
inst
rum
entin
gpr
ogra
mpa
rtici
patio
nw
ithth
etre
atm
entg
roup
indi
cato
r(m
odel
3).
Stan
dard
erro
rscl
uste
red
atvi
llage
leve
lare
repo
rted
inpa
rent
hese
s.C
ontro
lsin
clud
ege
nder
,age
,edu
catio
nan
dm
arria
gest
atus
ofth
ere
spon
dent
,hou
seho
ldsi
ze,t
ribe
and
relig
ion,
info
rmat
ion
abou
tacc
ess
tow
ater
,dw
ellin
gch
arac
teris
tics,
sub-
zone
dum
mie
san
dvi
llage
char
acte
ristic
s(s
ize
and
shar
eof
wom
enliv
ing
inth
evi
llage
).To
cont
rol
for
join
tsi
gnifi
canc
e,w
eru
na
prob
itre
gres
sion
ofth
etre
atm
enti
ndic
ator
onth
ese
lect
edgr
oups
ofva
riabl
esan
dw
ere
port
p-va
lues
ofan
F-te
stfo
rthe
join
tsig
nific
ance
ofth
eco
effic
ient
son
the
sele
cted
varia
bles
.
18

Table B3: Concern and knowledge of malaria and past exposure
Dependent variable: Concern and knowledge of malaria(1) (2) (3) (4)
OLS OLS IV IVTreatment 0.025*** 0.025*** 0.031*** 0.031***
(0.009) (0.009) (0.011) (0.011)
Some vegetation (middle past exposure) 0.044** 0.041*(0.021) (0.021)
Significant vegetation (high past exposure) 0.094*** 0.097***(0.023) (0.023)
Controls Yes Yes Yes YesObservations 1486 1486 1351 1351
Note: *** p<0.01, ** p<0.05, * p<0.1. One observation per household. Concern and knowledge of malariais an index computed by averaging 16 dummy variables representing information on whether respondentsbelieve malaria is a problem in the community, are acknowledged of the malaria vector and are informed ofthe categories of individuals that are most affected by the infection. The index is equal to 1 if the respondentis concerned and fully aware of malaria. Columns (1) and (2) report the difference between treatmentand control groups using OLS regression (model 2). Column (3) and (4) estimate the difference betweenhouseholds who report to have received the spraying campaign in the last 5 months and those who didn’tby instrumenting program participation with the treatment group indicator (model 3). Some vegetation andSignificant vegetation are dummy variables indicating the vegetation level at sub-zone level in the period2000-2009. Standard errors clustered at village level are reported in parentheses. All specifications includecontrols for gender, age, education and marriage status of the respondent, household size, tribe and religion,information about access to water, dwelling characteristics, sub-zone dummies and village characteristics(size and share of women living in the village).
19

Table B4: First stage regression of program participation on treatment status
Dwelling sprayed Share of dwellings sprayed(1) (2) (3) (4)
Probit Probit OLS OLSTreatment 0.762*** 0.782*** 0.758*** 0.758***
(0.0325) (0.0334) (0.0346) (0.0355)
Controls No Yes No Yes
Observations 1456 1364 1617 1503
Note: *** p<0.01, ** p<0.05, * p<0.1. One observation per household. In Columns (1) and (2) thedependent variable is a dummy variable equal to 1 if the household reported that their dwelling has beensprayed with IRS in the last 5 months and zero otherwise. In Columns (3) and (4) the dependent variable isthe share of households in the village who reported their dwelling has been sprayed. Independent variableis equal to one if the household is in the treatment group or zero otherwise. Columns (1) and (2) reportmarginal effects. Standard errors clustered at village level are reported in parentheses. Controls includegender, age, education and marriage status of the respondent, household size, tribe and religion, informationabout access to water, dwelling characteristics, sub-zone dummies and village characteristics (size and shareof women living in the village).
20

Tabl
eB
5:Pe
r-ca
pita
owne
rshi
pof
mos
quito
bed
nets
Endo
geno
usre
gres
sor:
Dw
ellin
gsp
raye
dSh
are
ofdw
ellin
gssp
raye
dA
ssum
ptio
n:A
BC
DD
(1)
(2)
(3)
(4)
(5)
IVIV
IVIV
IVH
ouse
hold
leve
l1.
Num
bero
fnet
sow
ned
byho
useh
old
0.27
9**
0.41
3***
0.35
0***
0.26
3*0.
337*
**(0
.109
)(0
.116
)(0
.122
)(0
.143
)(0
.111
)
2.N
umbe
rofI
TNs
owne
dby
hous
ehol
d0.
242*
*0.
345*
**0.
327*
**0.
218*
0.28
1**
(0.1
12)
(0.1
13)
(0.1
22)
(0.1
26)
(0.1
07)
3.N
umbe
rofo
bser
ved
nets
used
the
nigh
tbef
ore
0.29
4**
0.38
5***
0.36
8***
0.29
3**
0.32
6***
(0.1
15)
(0.1
19)
(0.1
27)
(0.1
31)
(0.1
10)
4.N
umbe
rofo
bser
ved
nets
left
unus
edth
eni
ghtb
efor
e-0
.017
0.01
20.
016
-0.0
31-0
.000
(0.0
77)
(0.0
78)
(0.0
84)
(0.0
86)
(0.0
71)
Indi
vidu
alle
vel
5.R
epor
ted
netu
se0.
068*
0.09
4**
0.09
4**
0.06
40.
083*
*(0
.038
)(0
.040
)(0
.043
)(0
.046
)(0
.038
)C
ontro
lsYe
sYe
sYe
sN
oYe
s
Not
e:**
*p<
0.01
,**
p<0.
05,*
p<0.
1.O
neob
serv
atio
npe
rho
useh
old.
“Net
s”re
fers
toan
ybe
dne
ts,i
rres
pect
ive
ofth
eir
treat
men
tst
atus
,“IT
Ns”
incl
udes
only
LLIN
san
dpr
oper
lytre
ated
ITN
s.C
olum
ns(1
)-(3
)is
estim
ated
usin
ga
linea
rre
gres
sion
mod
elau
gmen
ted
with
anen
doge
nous
bina
ryva
riabl
es(m
odel
3).C
olum
ns(4
)and
(5)i
ses
timat
edus
ing
2SLS
.Sta
ndar
der
rors
clus
tere
dat
villa
gele
vela
rere
porte
din
pare
nthe
ses.
Con
trols
incl
ude
gend
er,a
ge,e
duca
tion
and
mar
riage
stat
usof
the
resp
onde
nt,h
ouse
hold
size
,trib
ean
dre
ligio
n,in
form
atio
nab
outa
cces
sto
wat
er,d
wel
ling
char
acte
ristic
s,su
b-zo
nedu
mm
ies
and
villa
gech
arac
teris
tics
(siz
ean
dsh
are
ofw
omen
livin
gin
the
villa
ge).
InA
ssum
ptio
nA
mis
sing
valu
esfo
rthe
ques
tion
whe
ther
the
hous
ehol
dre
porte
dto
have
thei
rhou
sesp
raye
din
the
prev
ious
5m
onth
sar
ere
mov
ed.I
nA
ssum
ptio
nB
,mis
sing
valu
esar
eta
king
valu
e1
(spr
ayed
).In
Ass
umpt
ion
C,m
issi
ngva
lues
are
taki
ngva
lue
0(n
otsp
raye
d).
InA
ssum
ptio
nD
,mis
sing
valu
esar
eke
ptfo
rthe
com
puta
tion
ofth
evi
llage
aver
age,
i.e.
the
shar
eof
dwel
lings
spra
yed
isde
fined
asth
esh
are
ofre
spon
dent
sin
the
villa
gew
hore
porte
dto
have
thei
rdw
ellin
gsp
raye
din
the
prev
ious
5m
onth
sou
toft
hevi
llage
popu
latio
n.
21

Table B6: Average use of bed nets in different demographic groups in the absence of IRS
Subsample: All Men Women DifferenceChildren under 5 0.50 0.51 0.48 -0.03
(0.50) (0.50) (0.50) (0.03)Youth aged 5-20 0.36 0.34 0.38 0.05
(0.48) (0.47) (0.49) (0.03)Adult workers 0.31 0.27 0.40 0.13***
(0.46) (0.44) (0.49) (0.03)Adult unemployed 0.39 0.24 0.44 0.20***
(0.49) (0.43) (0.50) (0.03)
Note: “Nets” refers to any bed nets, irrespective of their treatment status. Sample restricted to the controlgroup. Columns 1-3 report average net use, with standard deviations in brackets. Sample restricted tomale individuals in Column 2. Sample restricted to female individuals in Column 3. Column 4 reports thedifference in average net use between women and men estimated using LS regression; robust standard errorsare reported in parentheses. Observations are clustered at village level. *** p<0.01, ** p<0.05, * p<0.1.
22
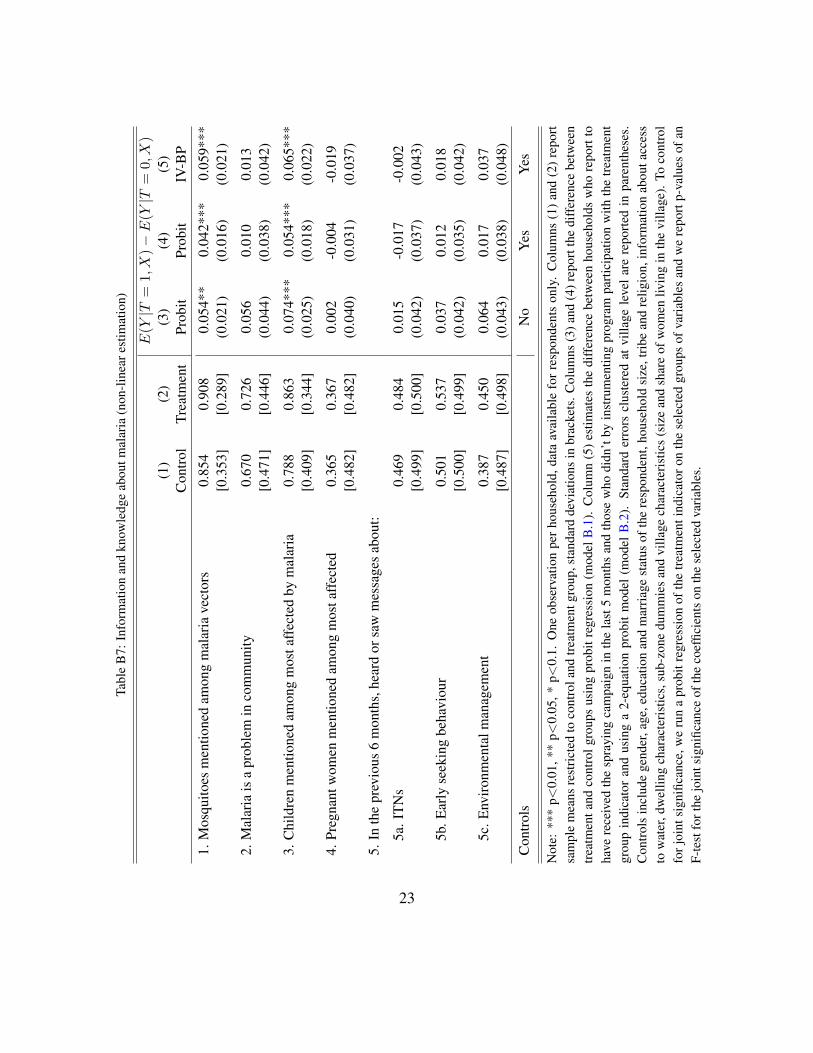
Tabl
eB
7:In
form
atio
nan
dkn
owle
dge
abou
tmal
aria
(non
-line
ares
timat
ion)
E(Y
|T=
1,X)�E(Y
|T=
0,X)
(1)
(2)
(3)
(4)
(5)
Con
trol
Trea
tmen
tPr
obit
Prob
itIV
-BP
1.M
osqu
itoes
men
tione
dam
ong
mal
aria
vect
ors
0.85
40.
908
0.05
4**
0.04
2***
0.05
9***
[0.3
53]
[0.2
89]
(0.0
21)
(0.0
16)
(0.0
21)
2.M
alar
iais
apr
oble
min
com
mun
ity0.
670
0.72
60.
056
0.01
00.
013
[0.4
71]
[0.4
46]
(0.0
44)
(0.0
38)
(0.0
42)
3.C
hild
ren
men
tione
dam
ong
mos
taff
ecte
dby
mal
aria
0.78
80.
863
0.07
4***
0.05
4***
0.06
5***
[0.4
09]
[0.3
44]
(0.0
25)
(0.0
18)
(0.0
22)
4.Pr
egna
ntw
omen
men
tione
dam
ong
mos
taff
ecte
d0.
365
0.36
70.
002
-0.0
04-0
.019
[0.4
82]
[0.4
82]
(0.0
40)
(0.0
31)
(0.0
37)
5.In
the
prev
ious
6m
onth
s,he
ard
orsa
wm
essa
ges
abou
t:
5a.I
TNs
0.46
90.
484
0.01
5-0
.017
-0.0
02[0
.499
][0
.500
](0
.042
)(0
.037
)(0
.043
)
5b.E
arly
seek
ing
beha
viou
r0.
501
0.53
70.
037
0.01
20.
018
[0.5
00]
[0.4
99]
(0.0
42)
(0.0
35)
(0.0
42)
5c.E
nviro
nmen
talm
anag
emen
t0.
387
0.45
00.
064
0.01
70.
037
[0.4
87]
[0.4
98]
(0.0
43)
(0.0
38)
(0.0
48)
Con
trols
No
Yes
Yes
Not
e:**
*p<
0.01
,**
p<0.
05,*
p<0.
1.O
neob
serv
atio
npe
rhou
seho
ld,d
ata
avai
labl
efo
rres
pond
ents
only
.C
olum
ns(1
)and
(2)r
epor
tsa
mpl
em
eans
rest
ricte
dto
cont
rola
ndtre
atm
entg
roup
,sta
ndar
dde
viat
ions
inbr
acke
ts.C
olum
ns(3
)and
(4)r
epor
tthe
diff
eren
cebe
twee
ntre
atm
enta
ndco
ntro
lgro
ups
usin
gpr
obit
regr
essi
on(m
odel
B.1
).C
olum
n(5
)est
imat
esth
edi
ffer
ence
betw
een
hous
ehol
dsw
hore
port
toha
vere
ceiv
edth
esp
rayi
ngca
mpa
ign
inth
ela
st5
mon
ths
and
thos
ew
hodi
dn’t
byin
stru
men
ting
prog
ram
parti
cipa
tion
with
the
treat
men
tgr
oup
indi
cato
ran
dus
ing
a2-
equa
tion
prob
itm
odel
(mod
elB
.2).
Stan
dard
erro
rscl
uste
red
atvi
llage
leve
lare
repo
rted
inpa
rent
hese
s.C
ontro
lsin
clud
ege
nder
,age
,edu
catio
nan
dm
arria
gest
atus
ofth
ere
spon
dent
,hou
seho
ldsi
ze,t
ribe
and
relig
ion,
info
rmat
ion
abou
tacc
ess
tow
ater
,dw
ellin
gch
arac
teris
tics,
sub-
zone
dum
mie
san
dvi
llage
char
acte
ristic
s(s
ize
and
shar
eof
wom
enliv
ing
inth
evi
llage
).To
cont
rol
forj
oint
sign
ifica
nce,
we
run
apr
obit
regr
essi
onof
the
treat
men
tind
icat
oron
the
sele
cted
grou
psof
varia
bles
and
we
repo
rtp-
valu
esof
anF-
test
fort
hejo
ints
igni
fican
ceof
the
coef
ficie
nts
onth
ese
lect
edva
riabl
es.
23

Tabl
eB
8:N
etus
ean
din
tra-h
ouse
hold
allo
catio
nof
bed
nets
(non
-line
ares
timat
ion)
Y=
1(N
etU
se)
E(Y
|T=
1,X)�
E(Y
|T=
0,X)
Sub-
sam
ple
(1)
(2)
(3)
(4)
(5)
Con
trol
Trea
tmen
tPr
obit
Prob
itIV
-BP
All
mem
bers
0.38
00.
429
0.04
90.
072*
*0.
071*
[0.4
86]
[0.4
95]
(0.0
35)
(0.0
31)
(0.0
38)
Chi
ldre
nun
der5
0.49
70.
529
0.03
20.
036
0.01
1[0
.500
][0
.500
](0
.047
)(0
.039
)(0
.046
)
Yout
hag
ed5
to20
0.36
20.
411
0.04
80.
072*
*0.
074*
[0.4
81]
[0.4
92]
(0.0
39)
(0.0
33)
(0.0
41)
Adu
ltm
ale
wor
kers
0.27
00.
352
0.08
2**
0.14
1***
0.17
3***
[0.4
44]
[0.4
78]
(0.0
41)
(0.0
45)
(0.0
61)
Adu
ltfe
mal
ew
orke
rs0.
403
0.50
00.
097*
0.14
1**
0.17
7**
[0.4
91]
[0.5
01]
(0.0
54)
(0.0
59)
(0.0
70)
Adu
ltm
ale
unem
ploy
ed0.
241
0.30
00.
059
0.08
50.
088
[0.4
29]
[0.4
59]
(0.0
56)
(0.0
56)
(0.0
69)
Adu
ltfe
mal
eun
empl
oyed
0.44
10.
471
0.03
10.
045
0.03
2[0
.497
][0
.500
](0
.045
)(0
.042
)(0
.052
)C
ontro
lsN
oYe
sYe
s
Not
e:**
*p<
0.01
,**
p<0.
05,*
p<0.
1.O
neob
serv
atio
npe
rind
ivid
uali
nth
ese
lect
edsu
b-sa
mpl
e.Th
eou
tcom
eva
riabl
eY
isan
indi
cato
rva
riabl
eeq
ualt
o1
ifth
ein
divi
dual
repo
rtedl
ysl
eptu
nder
abe
dne
tthe
nigh
tbef
ore
the
surv
eyan
dze
root
herw
ise.
Col
umns
(1)a
nd(2
)re
port
sam
ple
mea
nsre
stric
ted
toco
ntro
land
treat
men
tgro
up,s
tand
ard
devi
atio
nsin
brac
kets
.C
olum
ns(3
)and
(4)
repo
rtth
edi
ffer
ence
betw
een
treat
men
tand
cont
rolg
roup
sus
ing
prob
itre
gres
sion
(mod
elB
.1).
Col
umn
(5)e
stim
ates
the
diff
eren
cebe
twee
nho
useh
olds
who
repo
rtto
have
rece
ived
the
spra
ying
cam
paig
nin
the
last
5m
onth
san
dth
ose
who
didn
’tby
inst
rum
entin
gpr
ogra
mpa
rtici
patio
nw
ithth
etre
atm
entg
roup
indi
cato
ran
dus
ing
a2-
equa
tion
prob
itm
odel
(mod
elB
.2).
Stan
dard
erro
rscl
uste
red
atvi
llage
leve
lare
repo
rted
inpa
rent
hese
s.C
ontro
lsin
clud
ege
nder
and
age
ofth
ein
divi
dual
,edu
catio
n,ag
ean
dm
arria
gest
atus
ofth
ere
spon
dent
,hou
seho
ldsi
ze,t
ribe
and
relig
ion,
info
rmat
ion
abou
tacc
ess
tow
ater
,dw
ellin
gch
arac
teris
tics,
sub-
zone
dum
mie
san
dvi
llage
char
acte
ristic
s(s
ize
and
shar
eof
wom
enliv
ing
inth
evi
llage
).
24

Tabl
eB
9:Pe
r-ca
pita
owne
rshi
pof
mos
quito
bed
nets
E(Y
|T=
1,X)�E(Y
|T=
0,X)
(1)
(2)
(3)
(4)
(5)
Con
trol
Trea
tmen
tO
LSO
LSIV
Num
bero
fnet
sow
ned
0.36
70.
400
0.03
30.
055*
**0.
064*
*[0
.309
][0
.312
](0
.025
)(0
.020
)(0
.027
)
Num
bero
fITN
sow
ned
0.29
50.
323
0.02
80.
041*
*0.
048*
[0.2
84]
[0.2
79]
(0.0
24)
(0.0
20)
(0.0
29)
Num
bero
fobs
erve
dne
tsus
edth
eni
ghtb
efor
e0.
218
0.24
90.
030
0.03
6*0.
039
[0.2
58]
[0.2
67]
(0.0
22)
(0.0
19)
(0.0
26)
Num
bero
fobs
erve
dne
tsno
tuse
dth
eni
ghtb
efor
e0.
139
0.13
3-0
.006
0.00
70.
007
[0.2
48]
[0.2
44]
(0.0
17)
(0.0
13)
(0.0
16)
Con
trols
No
Yes
Yes
Join
ttes
tson
varia
bles
(with
com
para
ble
sam
ple
size
):1-
4p-
valu
es=
0.63
940.
1617
-
Not
e:**
*p<
0.01
,**
p<0.
05,
*p<
0.1.
One
obse
rvat
ion
per
hous
ehol
d.N
umbe
rof
nets
isno
rmal
ised
byth
enu
mbe
rof
hous
ehol
dm
embe
rs.
“Net
s”re
fers
toan
ybe
dne
ts,i
rres
pect
ive
ofth
eir
treat
men
tsta
tus,
“ITN
s”in
clud
eson
lyLL
INs
and
prop
erly
treat
edIT
Ns.
Col
umns
(1)
and
(2)
repo
rtsa
mpl
em
eans
rest
ricte
dto
cont
rol
and
treat
men
tgr
oup,
stan
dard
devi
atio
nsin
brac
kets
.C
olum
ns(3
)an
d(4
)re
port
the
diff
eren
cebe
twee
ntre
atm
ent
and
cont
rol
grou
psus
ing
OLS
regr
essi
on(m
odel
2).
Col
umn
(5)
estim
ates
the
diff
eren
cebe
twee
nho
useh
olds
who
repo
rtto
have
rece
ived
the
spra
ying
cam
paig
nin
the
last
5m
onth
sand
thos
ew
hodi
dn’t
byin
stru
men
ting
prog
ram
parti
cipa
tion
with
the
treat
men
tgro
upin
dica
tor(
mod
el3)
.St
anda
rder
rors
clus
tere
dat
villa
gele
vela
rere
porte
din
pare
nthe
ses.
Con
trols
incl
ude
gend
er,a
ge,e
duca
tion
and
mar
riage
stat
usof
the
resp
onde
nt,h
ouse
hold
size
,trib
ean
dre
ligio
n,in
form
atio
nab
outa
cces
sto
wat
er,
dwel
ling
char
acte
ristic
s,su
b-zo
nedu
mm
ies
and
villa
gech
arac
teris
tics
(siz
ean
dsh
are
ofw
omen
livin
gin
the
villa
ge).
Toco
ntro
lfor
join
tsi
gnifi
canc
e,w
eru
na
prob
itre
gres
sion
ofth
etre
atm
enti
ndic
ator
onth
ese
lect
edgr
oups
ofva
riabl
esan
dw
ere
port
p-va
lues
ofan
F-te
stfo
rth
ejo
ints
igni
fican
ceof
the
coef
ficie
nts
onth
ese
lect
edva
riabl
es.
25
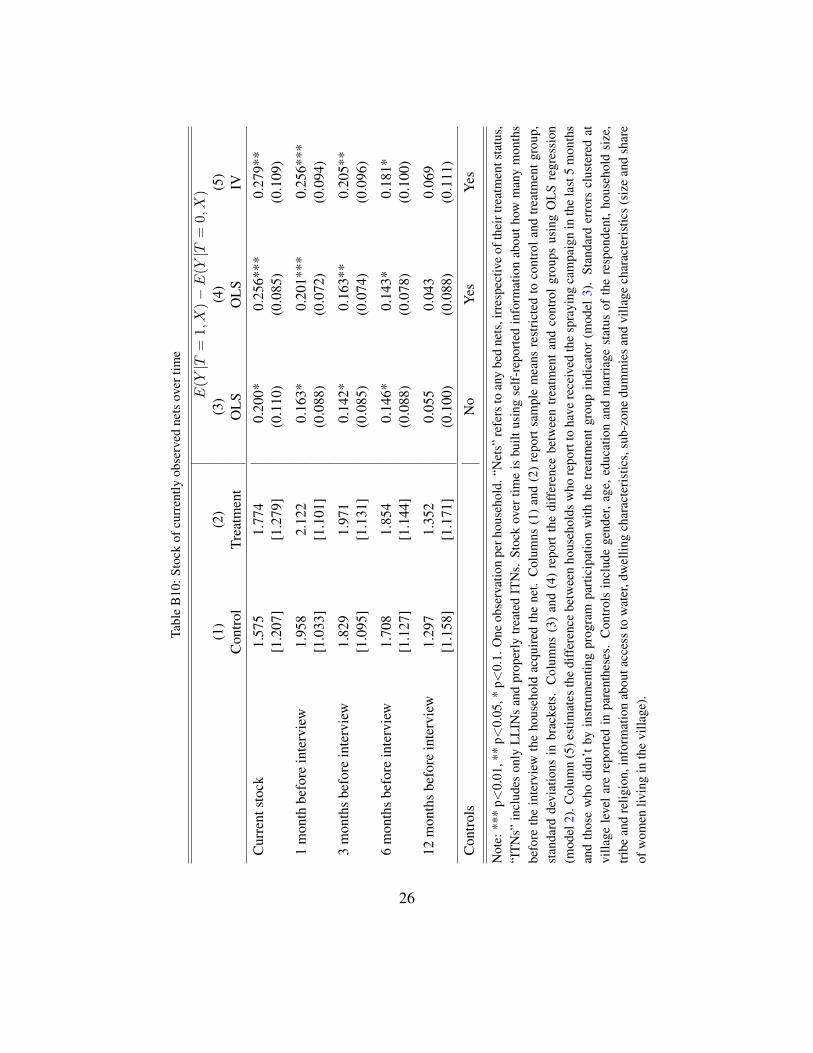
Tabl
eB
10:S
tock
ofcu
rren
tlyob
serv
edne
tsov
ertim
e
E(Y
|T=
1,X)�
E(Y
|T=
0,X)
(1)
(2)
(3)
(4)
(5)
Con
trol
Trea
tmen
tO
LSO
LSIV
Cur
rent
stoc
k1.
575
1.77
40.
200*
0.25
6***
0.27
9**
[1.2
07]
[1.2
79]
(0.1
10)
(0.0
85)
(0.1
09)
1m
onth
befo
rein
terv
iew
1.95
82.
122
0.16
3*0.
201*
**0.
256*
**[1
.033
][1
.101
](0
.088
)(0
.072
)(0
.094
)
3m
onth
sbe
fore
inte
rvie
w1.
829
1.97
10.
142*
0.16
3**
0.20
5**
[1.0
95]
[1.1
31]
(0.0
85)
(0.0
74)
(0.0
96)
6m
onth
sbe
fore
inte
rvie
w1.
708
1.85
40.
146*
0.14
3*0.
181*
[1.1
27]
[1.1
44]
(0.0
88)
(0.0
78)
(0.1
00)
12m
onth
sbe
fore
inte
rvie
w1.
297
1.35
20.
055
0.04
30.
069
[1.1
58]
[1.1
71]
(0.1
00)
(0.0
88)
(0.1
11)
Con
trols
No
Yes
Yes
Not
e:**
*p<
0.01
,**
p<0.
05,*
p<0.
1.O
neob
serv
atio
npe
rhou
seho
ld.“
Net
s”re
fers
toan
ybe
dne
ts,i
rres
pect
ive
ofth
eirt
reat
men
tsta
tus,
“ITN
s”in
clud
eson
lyLL
INs
and
prop
erly
treat
edIT
Ns.
Stoc
kov
ertim
eis
built
usin
gse
lf-re
porte
din
form
atio
nab
outh
owm
any
mon
ths
befo
reth
ein
terv
iew
the
hous
ehol
dac
quire
dth
ene
t.C
olum
ns(1
)an
d(2
)re
port
sam
ple
mea
nsre
stric
ted
toco
ntro
land
treat
men
tgro
up,
stan
dard
devi
atio
nsin
brac
kets
.C
olum
ns(3
)an
d(4
)re
port
the
diff
eren
cebe
twee
ntre
atm
enta
ndco
ntro
lgro
ups
usin
gO
LSre
gres
sion
(mod
el2)
.Col
umn
(5)e
stim
ates
the
diff
eren
cebe
twee
nho
useh
olds
who
repo
rtto
have
rece
ived
the
spra
ying
cam
paig
nin
the
last
5m
onth
san
dth
ose
who
didn
’tby
inst
rum
entin
gpr
ogra
mpa
rtici
patio
nw
ithth
etre
atm
entg
roup
indi
cato
r(m
odel
3).
Stan
dard
erro
rscl
uste
red
atvi
llage
leve
lare
repo
rted
inpa
rent
hese
s.C
ontro
lsin
clud
ege
nder
,age
,edu
catio
nan
dm
arria
gest
atus
ofth
ere
spon
dent
,hou
seho
ldsi
ze,
tribe
and
relig
ion,
info
rmat
ion
abou
tacc
ess
tow
ater
,dw
ellin
gch
arac
teris
tics,
sub-
zone
dum
mie
san
dvi
llage
char
acte
ristic
s(s
ize
and
shar
eof
wom
enliv
ing
inth
evi
llage
).
26

Table B11: Heterogeneous treatment effect on malaria awareness
Dependent variable: Y = 1(Malaria is a problem)(1) (2) (3) (4)
OLS OLS OLS OLSSub-sample All All Male FemaleTreatment 0.045 -0.035 0.008 -0.054
(0.065) (0.047) (0.076) (0.046)
Treatment x ndvi = 1 -0.064(0.078)[0.668]
Treatment x ndvi = 2 -0.005(0.093)[0.516]
Treatment x work = 1 0.127** 0.053 0.166**(0.058) (0.097) (0.073)[0.041] [0.285] [0.075]
Work -0.020 0.029 -0.037(0.049) (0.083) (0.056)
ndvi = 1 0.277***(0.101)
ndvi = 2 0.286**(0.140)
Observations 1499 1273 535 876
Note: *** p<0.01, ** p<0.05, * p<0.1. One observation per household. The dependent variable is anindicator variable equal to 1 if the respondent reported that malaria is an issue in their community and zerootherwise. Columns (1)-(4) report the difference between treatment and control groups using OLS regression(model 2) and the coefficients on interactions between the treatment status and vegetation index dummiesin Column (1) and between the treatment status and the employment status in Columns (2)-(4). Standarderrors clustered at village level are reported in parentheses. All specifications include controls for gender,age, education and marriage status of the respondent, household size, tribe and religion, information aboutaccess to water, dwelling characteristics, sub-zone dummies and village characteristics (size and share ofwomen living in the village). The p-value for the F-test of treatment + tinteraction = 0 is reported insquare brackets.
27
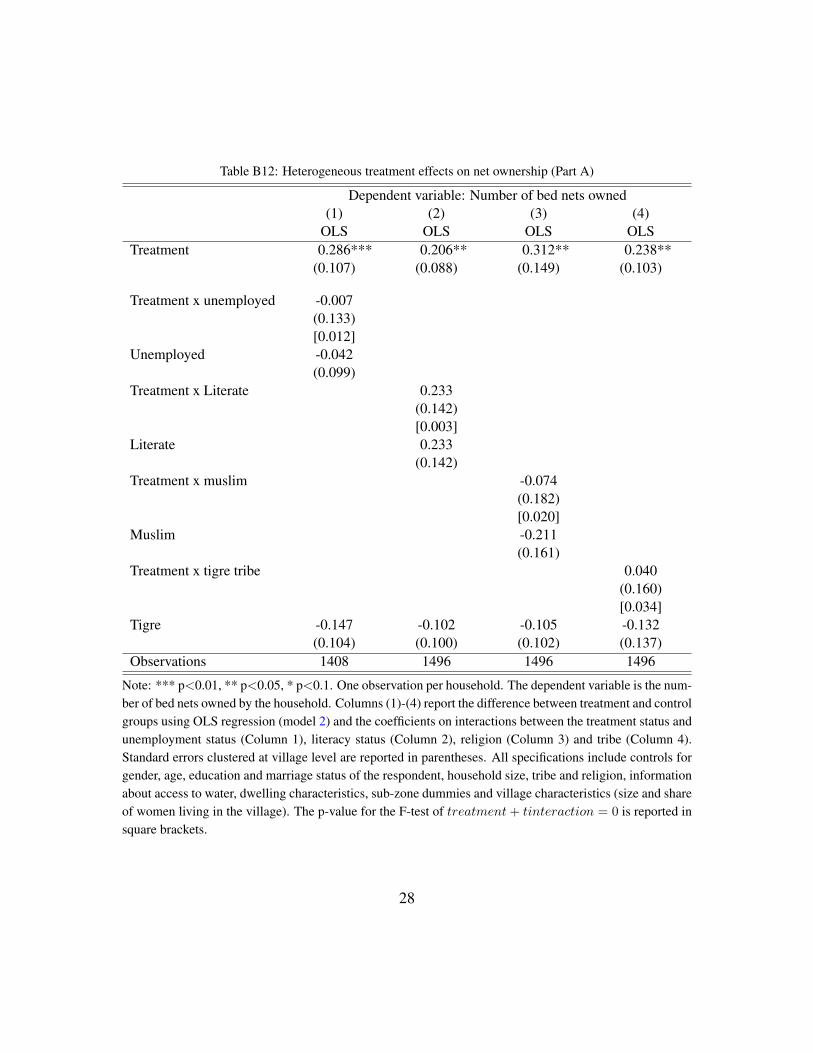
Table B12: Heterogeneous treatment effects on net ownership (Part A)
Dependent variable: Number of bed nets owned(1) (2) (3) (4)
OLS OLS OLS OLSTreatment 0.286*** 0.206** 0.312** 0.238**
(0.107) (0.088) (0.149) (0.103)
Treatment x unemployed -0.007(0.133)[0.012]
Unemployed -0.042(0.099)
Treatment x Literate 0.233(0.142)[0.003]
Literate 0.233(0.142)
Treatment x muslim -0.074(0.182)[0.020]
Muslim -0.211(0.161)
Treatment x tigre tribe 0.040(0.160)[0.034]
Tigre -0.147 -0.102 -0.105 -0.132(0.104) (0.100) (0.102) (0.137)
Observations 1408 1496 1496 1496
Note: *** p<0.01, ** p<0.05, * p<0.1. One observation per household. The dependent variable is the num-ber of bed nets owned by the household. Columns (1)-(4) report the difference between treatment and controlgroups using OLS regression (model 2) and the coefficients on interactions between the treatment status andunemployment status (Column 1), literacy status (Column 2), religion (Column 3) and tribe (Column 4).Standard errors clustered at village level are reported in parentheses. All specifications include controls forgender, age, education and marriage status of the respondent, household size, tribe and religion, informationabout access to water, dwelling characteristics, sub-zone dummies and village characteristics (size and shareof women living in the village). The p-value for the F-test of treatment+ tinteraction = 0 is reported insquare brackets.
28

Table B13: Heterogeneous treatment effects on net ownership (Part B)
Dependent variable Number of bed nets owned(1) (2) (3)
OLS OLS OLSTreatment 0.233** 0.255*** 0.021
(0.095) (0.085) (0.123)Treatment x male household head 0.032
(0.119)[0.012]
Male household head 0.161*(0.091)
Treatment x 2nd household size tercile -0.091(0.126)[0.192]
Treatment x 3rd household size tercile 0.100(0.166)[0.030]
2nd household size tercile -0.104(0.113)
3rd household size tercile -0.312(0.194)
Treatment x 2nd wealth tercile 0.235(0.144)[0.002]
Treatment x 3rd wealth tercile 0.108(0.173)[0.118]
2nd wealth tercile -0.010(0.120)
3rd wealth tercile 0.370**(0.159)
Observations 1496 1496 1495
Note: *** p<0.01, ** p<0.05, * p<0.1. One observation per household. The dependent variable is thenumber of bed nets owned by the household. Columns (1)-(4) report the difference between treatment andcontrol groups using OLS regression (model 2) and the coefficients on interactions between the treatmentstatus and the gender of the household head (Column 1), household size terciles (Column 2) and wealthtercile (Column 3). Standard errors clustered at village level are reported in parentheses. All specificationsinclude controls for gender, age, education and marriage status of the respondent, household size, tribeand religion, information about access to water, dwelling characteristics, sub-zone dummies and villagecharacteristics (size and share of women living in the village). The p-value for the F-test of treatment +
tinteraction = 0 is reported in square brackets.
29

C. Data
The following table presents a detailed description of the variables used in the paper.
Variable Level DescriptionFemale Individual Indicator variable equal to 1 if person is a female, and zero other-
wise.Usually lives here Individual Indicator variable equal to 1 if person reportedly normally lives in
the dwelling where the interview was conducted and zero otherwise.Stayed here last night Individual Indicator variable equal to 1 if person reportedly spent the night be-
fore the interview in the dwelling where the interview was conduc-ted and zero otherwise.
Age Individual Age in years of the person, zero if less than 1 year old.Ever attended school Respondent Indicator variable equal to 1 if respondent reportedly ever attended
school, and zero otherwise.Only primary school Respondent Indicator variable equal to 1 if respondent reportedly has some
schooling but did not progress to secondary school; zero if respond-ent has some schooling and progressed to secondary school; missingif respondent has no schooling, or if respondent has some schoolingbut educational achievement is not recorded in the data.
Literate Respondent Indicator variable equal to 1 if respondent reportedly can read andwrite in one language without any difficulty, and zero otherwise.
Muslim Respondent Indicator variable equal to 1 if respondent is Muslim, and zero oth-erwise.
Tigre Respondent Indicator variable equal to 1 if respondent belongs to the Tigre tribe,and zero otherwise.
Married Respondent Indicator variable equal to 1 if respondent is married, and zero oth-erwise.
Household size Household Number of members of the household at the time of the survey, in-cluding all people who normally eat and sleep together in the samedwelling.
Household members un-der 5
Household Number of household members whose age was not greater than 5years.
Household members un-der 18
Household Number of household members whose age was not greater than 18years.
Public tap Household Indicator variable equal to 1 if the main source of drinking water ofthe household was a public tap, and zero otherwise.
30
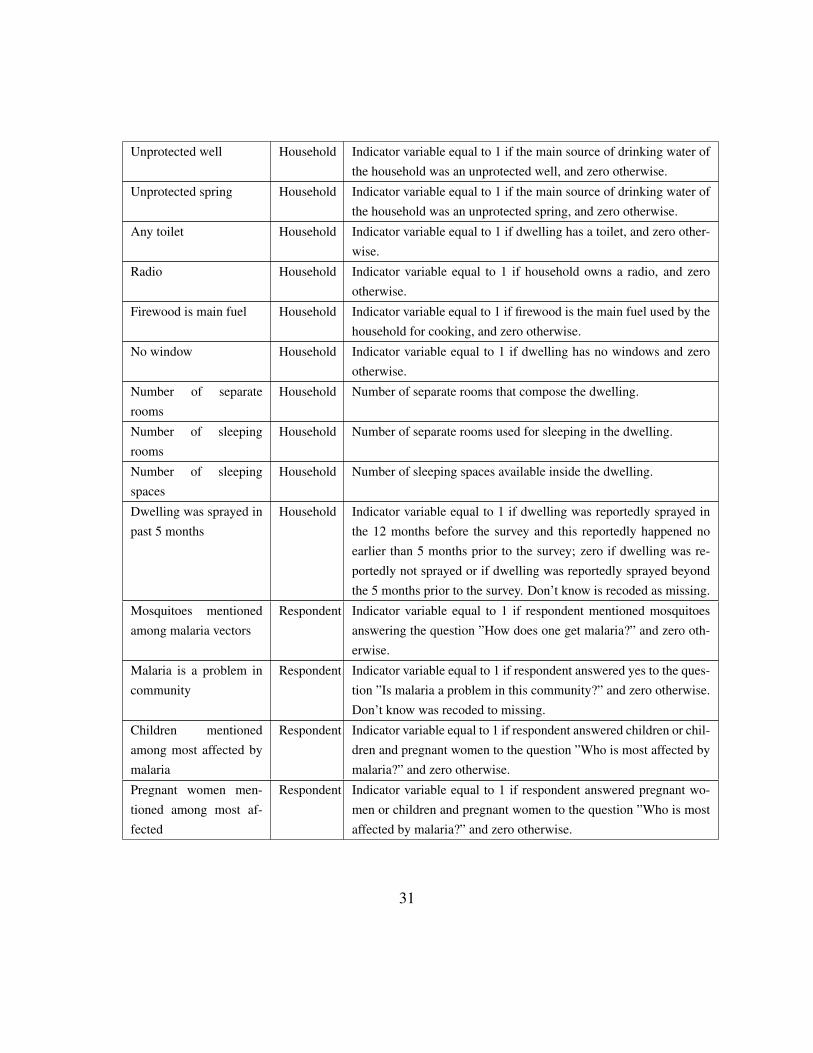
Unprotected well Household Indicator variable equal to 1 if the main source of drinking water ofthe household was an unprotected well, and zero otherwise.
Unprotected spring Household Indicator variable equal to 1 if the main source of drinking water ofthe household was an unprotected spring, and zero otherwise.
Any toilet Household Indicator variable equal to 1 if dwelling has a toilet, and zero other-wise.
Radio Household Indicator variable equal to 1 if household owns a radio, and zerootherwise.
Firewood is main fuel Household Indicator variable equal to 1 if firewood is the main fuel used by thehousehold for cooking, and zero otherwise.
No window Household Indicator variable equal to 1 if dwelling has no windows and zerootherwise.
Number of separaterooms
Household Number of separate rooms that compose the dwelling.
Number of sleepingrooms
Household Number of separate rooms used for sleeping in the dwelling.
Number of sleepingspaces
Household Number of sleeping spaces available inside the dwelling.
Dwelling was sprayed inpast 5 months
Household Indicator variable equal to 1 if dwelling was reportedly sprayed inthe 12 months before the survey and this reportedly happened noearlier than 5 months prior to the survey; zero if dwelling was re-portedly not sprayed or if dwelling was reportedly sprayed beyondthe 5 months prior to the survey. Don’t know is recoded as missing.
Mosquitoes mentionedamong malaria vectors
Respondent Indicator variable equal to 1 if respondent mentioned mosquitoesanswering the question ”How does one get malaria?” and zero oth-erwise.
Malaria is a problem incommunity
Respondent Indicator variable equal to 1 if respondent answered yes to the ques-tion ”Is malaria a problem in this community?” and zero otherwise.Don’t know was recoded to missing.
Children mentionedamong most affected bymalaria
Respondent Indicator variable equal to 1 if respondent answered children or chil-dren and pregnant women to the question ”Who is most affected bymalaria?” and zero otherwise.
Pregnant women men-tioned among most af-fected
Respondent Indicator variable equal to 1 if respondent answered pregnant wo-men or children and pregnant women to the question ”Who is mostaffected by malaria?” and zero otherwise.
31
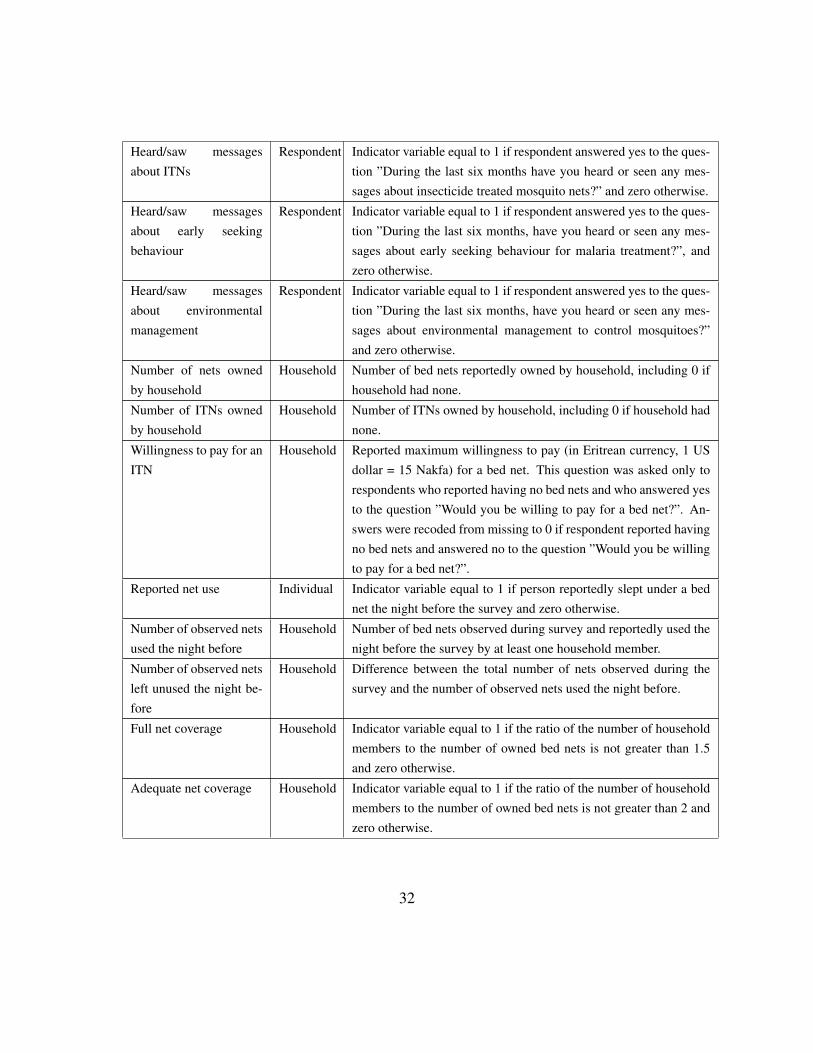
Heard/saw messagesabout ITNs
Respondent Indicator variable equal to 1 if respondent answered yes to the ques-tion ”During the last six months have you heard or seen any mes-sages about insecticide treated mosquito nets?” and zero otherwise.
Heard/saw messagesabout early seekingbehaviour
Respondent Indicator variable equal to 1 if respondent answered yes to the ques-tion ”During the last six months, have you heard or seen any mes-sages about early seeking behaviour for malaria treatment?”, andzero otherwise.
Heard/saw messagesabout environmentalmanagement
Respondent Indicator variable equal to 1 if respondent answered yes to the ques-tion ”During the last six months, have you heard or seen any mes-sages about environmental management to control mosquitoes?”and zero otherwise.
Number of nets ownedby household
Household Number of bed nets reportedly owned by household, including 0 ifhousehold had none.
Number of ITNs ownedby household
Household Number of ITNs owned by household, including 0 if household hadnone.
Willingness to pay for anITN
Household Reported maximum willingness to pay (in Eritrean currency, 1 USdollar = 15 Nakfa) for a bed net. This question was asked only torespondents who reported having no bed nets and who answered yesto the question ”Would you be willing to pay for a bed net?”. An-swers were recoded from missing to 0 if respondent reported havingno bed nets and answered no to the question ”Would you be willingto pay for a bed net?”.
Reported net use Individual Indicator variable equal to 1 if person reportedly slept under a bednet the night before the survey and zero otherwise.
Number of observed netsused the night before
Household Number of bed nets observed during survey and reportedly used thenight before the survey by at least one household member.
Number of observed netsleft unused the night be-fore
Household Difference between the total number of nets observed during thesurvey and the number of observed nets used the night before.
Full net coverage Household Indicator variable equal to 1 if the ratio of the number of householdmembers to the number of owned bed nets is not greater than 1.5and zero otherwise.
Adequate net coverage Household Indicator variable equal to 1 if the ratio of the number of householdmembers to the number of owned bed nets is not greater than 2 andzero otherwise.
32
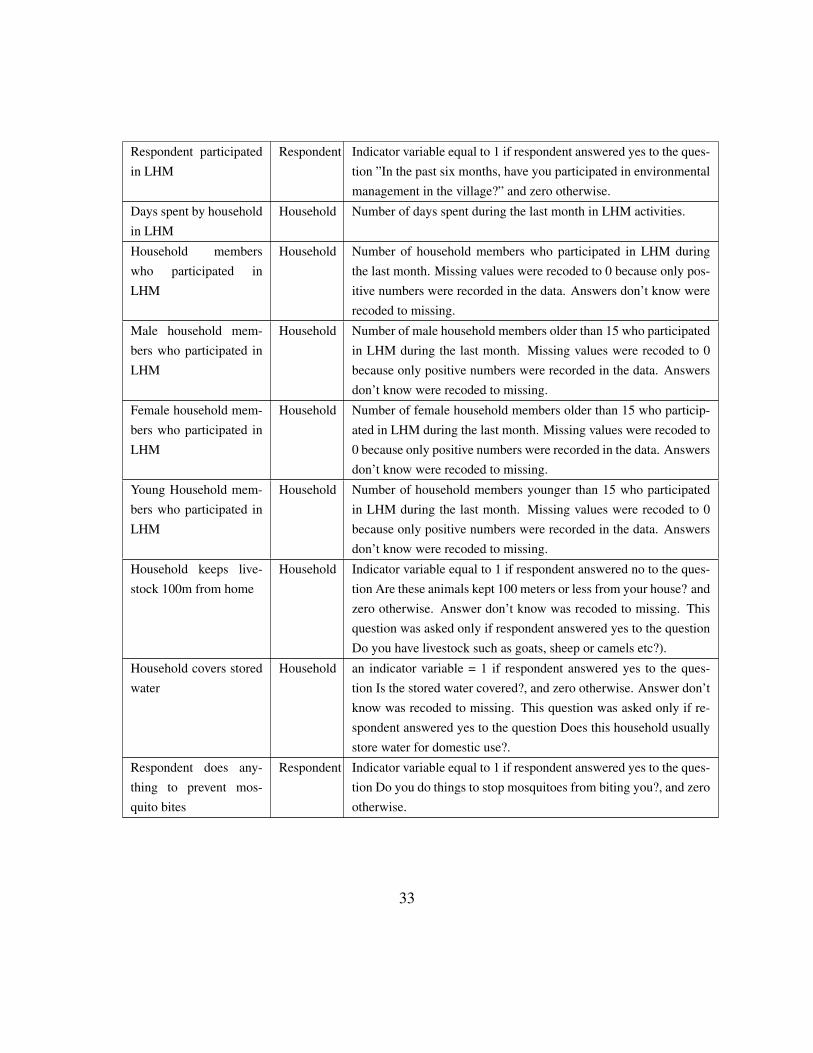
Respondent participatedin LHM
Respondent Indicator variable equal to 1 if respondent answered yes to the ques-tion ”In the past six months, have you participated in environmentalmanagement in the village?” and zero otherwise.
Days spent by householdin LHM
Household Number of days spent during the last month in LHM activities.
Household memberswho participated inLHM
Household Number of household members who participated in LHM duringthe last month. Missing values were recoded to 0 because only pos-itive numbers were recorded in the data. Answers don’t know wererecoded to missing.
Male household mem-bers who participated inLHM
Household Number of male household members older than 15 who participatedin LHM during the last month. Missing values were recoded to 0because only positive numbers were recorded in the data. Answersdon’t know were recoded to missing.
Female household mem-bers who participated inLHM
Household Number of female household members older than 15 who particip-ated in LHM during the last month. Missing values were recoded to0 because only positive numbers were recorded in the data. Answersdon’t know were recoded to missing.
Young Household mem-bers who participated inLHM
Household Number of household members younger than 15 who participatedin LHM during the last month. Missing values were recoded to 0because only positive numbers were recorded in the data. Answersdon’t know were recoded to missing.
Household keeps live-stock 100m from home
Household Indicator variable equal to 1 if respondent answered no to the ques-tion Are these animals kept 100 meters or less from your house? andzero otherwise. Answer don’t know was recoded to missing. Thisquestion was asked only if respondent answered yes to the questionDo you have livestock such as goats, sheep or camels etc?).
Household covers storedwater
Household an indicator variable = 1 if respondent answered yes to the ques-tion Is the stored water covered?, and zero otherwise. Answer don’tknow was recoded to missing. This question was asked only if re-spondent answered yes to the question Does this household usuallystore water for domestic use?.
Respondent does any-thing to prevent mos-quito bites
Respondent Indicator variable equal to 1 if respondent answered yes to the ques-tion Do you do things to stop mosquitoes from biting you?, and zerootherwise.
33