do physics online from quanta to quarks emission & absorption
TRANSCRIPT
9.8.1 t8_spectra 1
DO PHYSICS ONLINE
FROM QUANTA TO QUARKS EMISSION & ABSORPTION SPECTRA
Video web search: flame test What is a flame test? How is a flame test performed? What important information do they provide?
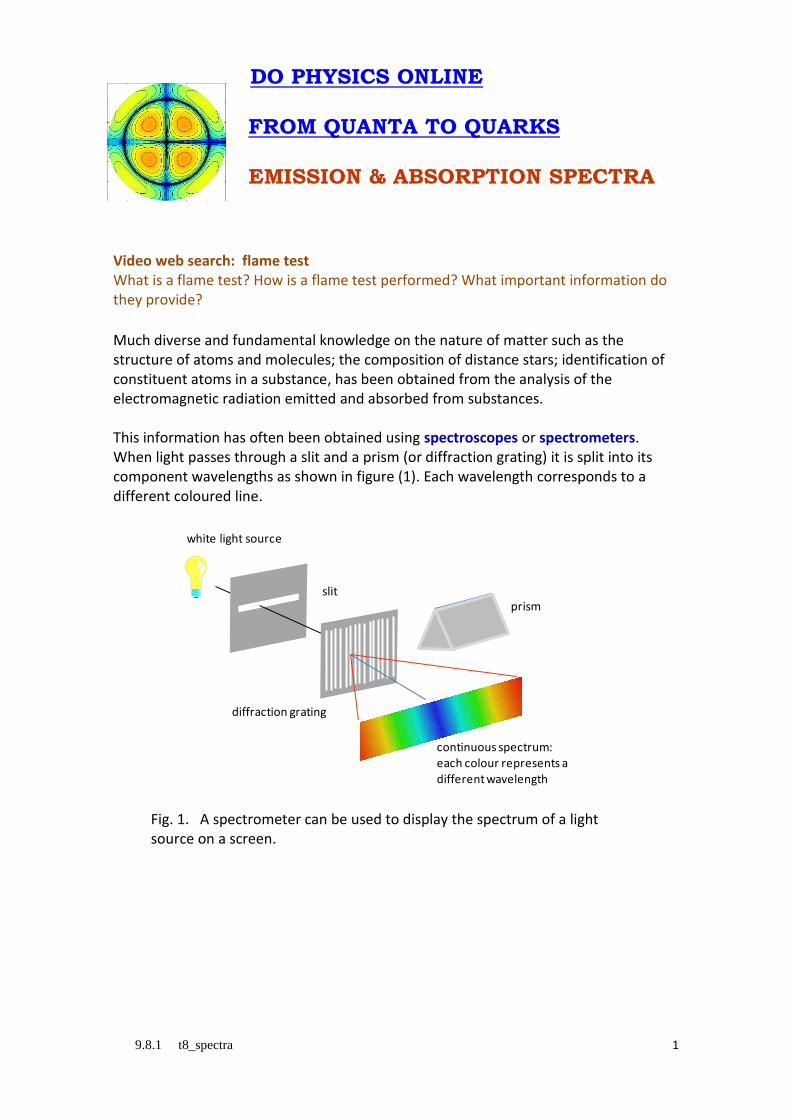
Much diverse and fundamental knowledge on the nature of matter such as the structure of atoms and molecules; the composition of distance stars; identification of constituent atoms in a substance, has been obtained from the analysis of the electromagnetic radiation emitted and absorbed from substances. This information has often been obtained using spectroscopes or spectrometers. When light passes through a slit and a prism (or diffraction grating) it is split into its component wavelengths as shown in figure (1). Each wavelength corresponds to a different coloured line.
Fig. 1. A spectrometer can be used to display the spectrum of a light
source on a screen.
prism
diffraction grating
slit
white light source
continuous spectrum:each colour represents a different wavelength

9.8.1 t8_spectra 2
Emission spectra are continuous images when many of the wavelengths overlap. Line spectra occur when only certain specific wavelengths are emitted by excited atoms. An absorption spectrum is when dark lines appear in a continuous spectrum.
Fig. 2. Emission and absorption spectra. The solar visible spectrum corresponds to the continuous spectrum in the visible part of the electromagnetic spectrum from blue to red light. A number of dark lines are seen in the solar spectrum because some of the light from the very hot interior of the Sun is absorbed by the cooler gases of its outer layers.
Fig. 3. Solar spectrum showing many absorption lines.
Continuous Spectrum
Emission Spectrum
Absorption Spectrum
400 450 500 550 600 650 700 750
wavelength (nm)
ultraviolet infrared
9.8.1 t8_spectra 3
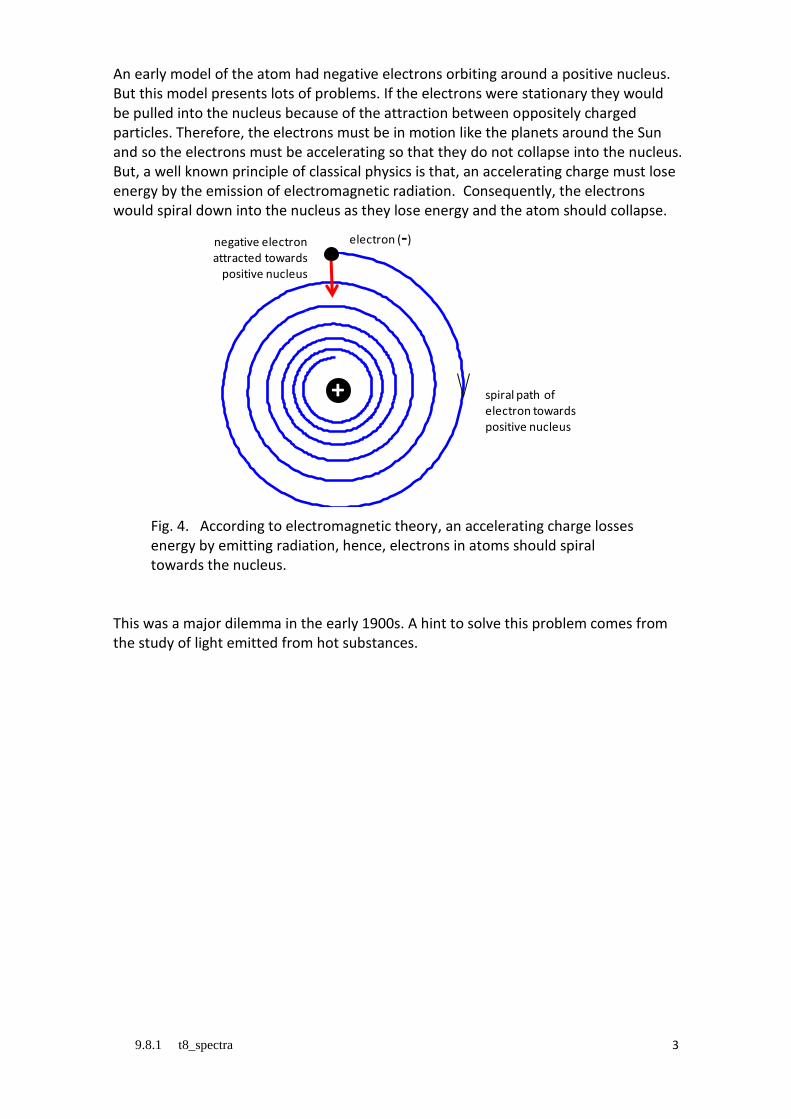
An early model of the atom had negative electrons orbiting around a positive nucleus. But this model presents lots of problems. If the electrons were stationary they would be pulled into the nucleus because of the attraction between oppositely charged particles. Therefore, the electrons must be in motion like the planets around the Sun and so the electrons must be accelerating so that they do not collapse into the nucleus. But, a well known principle of classical physics is that, an accelerating charge must lose energy by the emission of electromagnetic radiation. Consequently, the electrons would spiral down into the nucleus as they lose energy and the atom should collapse.
Fig. 4. According to electromagnetic theory, an accelerating charge losses
energy by emitting radiation, hence, electrons in atoms should spiral towards the nucleus.
This was a major dilemma in the early 1900s. A hint to solve this problem comes from the study of light emitted from hot substances.
electron (-)
spiral path of electron towards positive nucleus
+
negative electron attracted towards
positive nucleus

9.8.1 t8_spectra 4
A hot object such as the Sun emits a continuous spectrum, and this type of spectrum is called a blackbody spectrum. Fig. 3. The Sun behaves as a blackbody with a surface temperature ~ 5800 K. To explain the shape of the blackbody radiation curve, Max Planck (1858 - 1947) assumed that the atoms comprising molecules acts as oscillates and modes of vibration were quantised (like those of a vibrating string) and the energy of any
molecular vibration mode could only be an integer multiple of h f
1, 2, 3, E nh f n
where E total energy of oscillator f frequency of oscillator h Planck’s constant h = 6.626x10⁻³⁴ J.s
For molecular vibrations, the energies can be ,2 ,3 ,h f h f h f but not any values
in between these values. This is referred to as Planck’s quantum hypothesis. When solids are heated to incandescence continuous spectra are obtained. The role of individual electrons and atoms becomes irrelevant as the collective behaviour of a great many atoms and electrons dominate the radiation emitted from the hot substance. When a molecular gas at low pressure is excited, the spectrum emitted consist of many individual lines very close together which are referred to as bands. The bands arise from the interactions between atoms and electrons in each molecule. These spectral bands do not provide much insight into atomic structure. Atoms and molecules in rarefied gases are far apart and can be considered non-interacting. Radiation emitted reflects the properties of individual atoms and molecules that are present. When a salt is vaporised in a flame, a line spectrum is produced. Since each line corresponds to light of a definite energy, the existence of a

9.8.1 t8_spectra 5
line spectrum implies that atoms can radiate only at certain energies – that is, only discrete quantities of energy are emitted. When the spectra of different compounds are investigated, it is found that each element has its own unique line spectrum. This fact is used to identify the elements present in compounds by heating the compound and investigating the spectrum of the light emitted from it. Unexcited gases do not radiate their characteristic spectral lines, however, they absorb light of those particular wavelengths when white light is passed through them. Thus, the absorption and emission spectra are the same:
Emission spectra – bright lines on a dark background
Absorption spectra – dark lines on a bright background
In 1913, Niels Bohr (Danish physicist) proposed a theory to account for why atoms do not collapse and when heated, why line spectra are observed. His theory gave predictions for the wavelengths of the numerous lines in the emission spectrum of hot hydrogen atoms that agreed with the wavelengths measured using a spectrometer. But, his theory was based upon ad-hoc assumptions and his theory for line spectra could not be applied to more complex atoms other than hydrogen.

9.8.1 t8_spectra 6
HYDROGEN SPECTRUM The radiation emitted by individual atoms consists of a discrete set of wavelengths and its spectrum is a characteristic of that element. This phenomenon was used as early as 1860 by Kirchhoff and Bunsen to identify new elements. The simplest atom, hydrogen, produces the simplest emission spectrum when the hydrogen atoms are excited. The spectral lines of hydrogen appear in the visible, near infrared and near ultraviolet regions. The spectral lines are closely spaced in the near ultraviolet region and converge towards a short wavelength limit. This is a feature of all atoms with the short wavelength limit dependent upon the type of atom (figure 4). Many attempts were made to find a numerical relationship between the magnitudes of the wavelengths for the spectral lines for hydrogen. Eventually, in 1885 Johann Jakob Balmer (1825 - 1898) showed that the wavelength of each spectral line in the Balmer series to a high degree of accuracy for is given by equation (1)
(1) 2 2
1 1 1
2 i
Rn
wavelength of emitted electromagnetic radiation
R Rydberg constant R = 1.097107 m-1
ni quantum number for initial state ( integer ni = 3, 4, 5, … )
Equation (1) was only an empirical relationship and had no theoretical basis. The formula was simply one which defined the relationships between the observable spectral lines.
Fig 4. The emission spectrum of atomic hydrogen – Balmer series. Janne Rydberg (1854–1919) modify Balmer’s equation to give a more general relationship between spectral lines
(2) 2 2
1 1 1
f i
Rn n
nf quantum number for final state ( ni > nf ) Equation (2) is known as the Rydberg equation.
350 400 450 500 550 600 650 7000
0.1
0.2
0.3
0.4
0.5
0.6
0.7
0.8
0.9
1
wavelength (nm)
short wavelength limit

9.8.1 t8_spectra 7
Fig. 5. Balmer series for hydrogen. Equation (2) represents nothing more than a curious and convenient mathematical formula. However, it can be converted into an energy equation using the Planck relationship for the energy of a photon
(3) hc
E h f
(4) 2 2
1 1
f i
E h c Rn n
Equation (4) gives the energy of a photon of wavelength emitted by an a hydrogen
atom in the transition from energy level ni to nf .
The short wavelength limit and hence greatest energy of an emitted photon occurs
when in
short wavelength limit
2
min
fn
R
maximum energy of photon max 2
f
hc RE
n
The lowest energy level or the ground state of hydrogen is the state with nf = 1. The values for the short wavelength limit and maximum photon energy for the transitions
from in to 1fn are
2
min
191 nm
R and max 21
hc RE 2.18x10⁻¹⁸ J = 13.6 eV
Use your calculator to check these numerical values.
H
Balmer Series of hydrogen
H HH
656.3 486.1 434.1 410.2 nm
n
2
3
4
5
6
HH H
H
2fn
9.8.1 t8_spectra 8
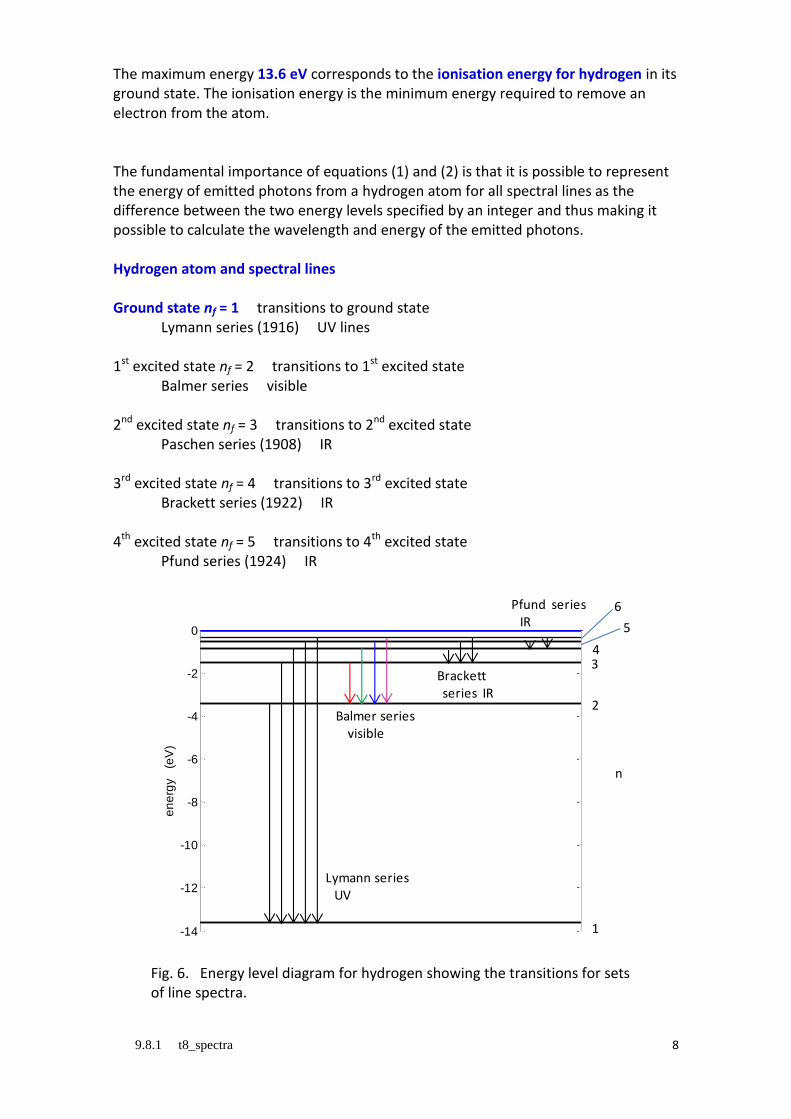
The maximum energy 13.6 eV corresponds to the ionisation energy for hydrogen in its ground state. The ionisation energy is the minimum energy required to remove an electron from the atom. The fundamental importance of equations (1) and (2) is that it is possible to represent the energy of emitted photons from a hydrogen atom for all spectral lines as the difference between the two energy levels specified by an integer and thus making it possible to calculate the wavelength and energy of the emitted photons. Hydrogen atom and spectral lines Ground state nf = 1 transitions to ground state Lymann series (1916) UV lines 1st excited state nf = 2 transitions to 1st excited state Balmer series visible 2nd excited state nf = 3 transitions to 2nd excited state Paschen series (1908) IR 3rd excited state nf = 4 transitions to 3rd excited state Brackett series (1922) IR 4th excited state nf = 5 transitions to 4th excited state Pfund series (1924) IR
Fig. 6. Energy level diagram for hydrogen showing the transitions for sets
of line spectra.
0 0.2 0.4 0.6 0.8 1-14
-12
-10
-8
-6
-4
-2
0
en
erg
y (
eV
)
1
2
34
5
6
n
Lymann seriesUV
Balmer seriesvisible
Brackettseries IR
Pfund seriesIR

9.8.1 t8_spectra 9
EMISSION AND ABSORPTION SPECTRA The emission and absorption of light (transfer of energy & momentum) takes place in a particular manner. All forms of electromagnetic radiation interact with matter in the process of emission and absorption. The radiation propagates in a wavelike fashion but in an interaction the radiation behaves as a concentration of energy (photons) moving at the speed of light. Each photon carries very little energy. However, even an ordinary torch beam is a torrent of ~1017 photons.s-1. When we ‘see’ light, what we observe by eye or on film is the average energy per unit area per time arriving. Most of the chemical and optical properties of a substance are dependent upon the outer most bound electrons in atoms. Each electron is usually in its ground state (the lowest energy state). Only when an atom absorbs sufficient and specific energy can the atom absorb the energy and the electron move to a well defined higher energy state (excited state). The electrons and nucleus of an atom form a system with total energy E. The total energy for an individual electron is simply the sum of its kinetic energy and the potential energy of the system of the electron bound to the nucleus. The total energy has a set of discrete energy levels and so emission and absorption can only take place when the change in energy is equal to the difference between two energy levels. Figure (7) shows a schematic diagram of a set of discrete electronic energy levels for an electron bound to an atom.
Fig. 7. Energy level diagram for an atom.
ground state
excited states
energy
absorption
emission
1
2
3
4
5
quantum number
9.8.1 t8_spectra 10
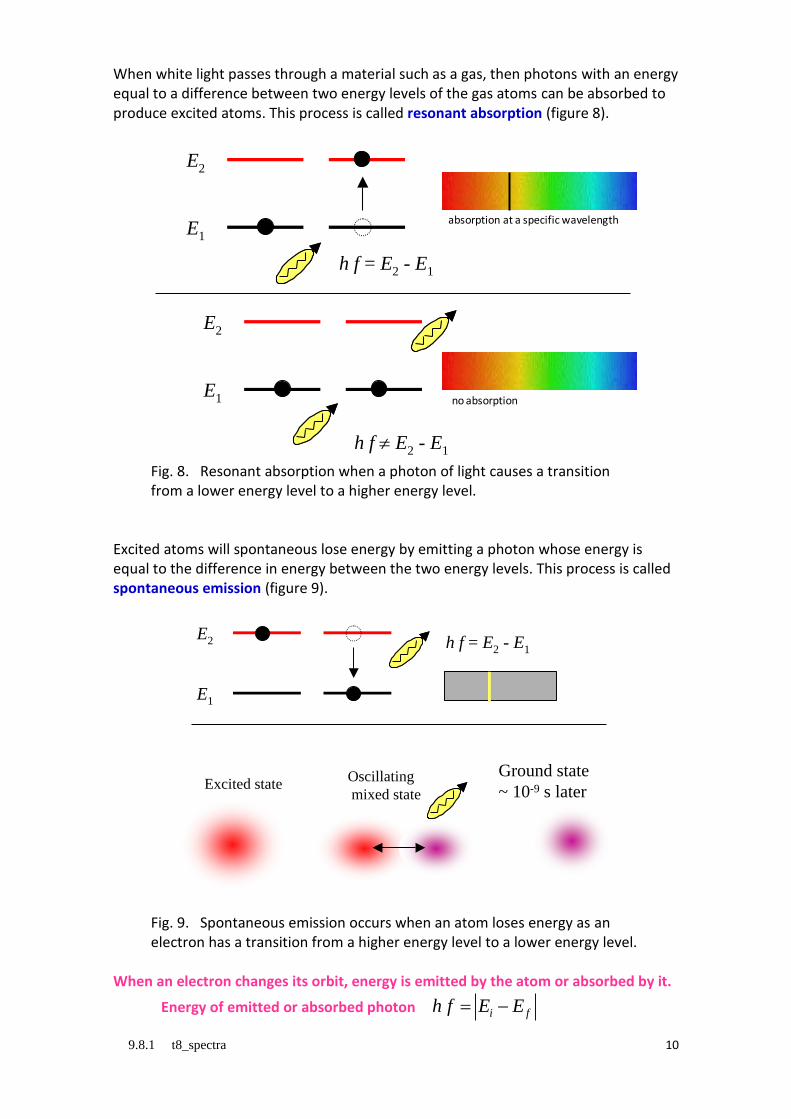
When white light passes through a material such as a gas, then photons with an energy equal to a difference between two energy levels of the gas atoms can be absorbed to produce excited atoms. This process is called resonant absorption (figure 8).
Fig. 8. Resonant absorption when a photon of light causes a transition
from a lower energy level to a higher energy level. Excited atoms will spontaneous lose energy by emitting a photon whose energy is equal to the difference in energy between the two energy levels. This process is called spontaneous emission (figure 9).
Fig. 9. Spontaneous emission occurs when an atom loses energy as an
electron has a transition from a higher energy level to a lower energy level. When an electron changes its orbit, energy is emitted by the atom or absorbed by it.
Energy of emitted or absorbed photon i fh f E E
E1
E2
h f = E2 - E1
E1
E2
h f E2 - E1
absorption at a specific wavelength
no absorption
E1
E2 h f = E2 - E1
Excited stateOscillating
mixed state
Ground state
~ 10-9 s later
9.8.1 t8_spectra 11
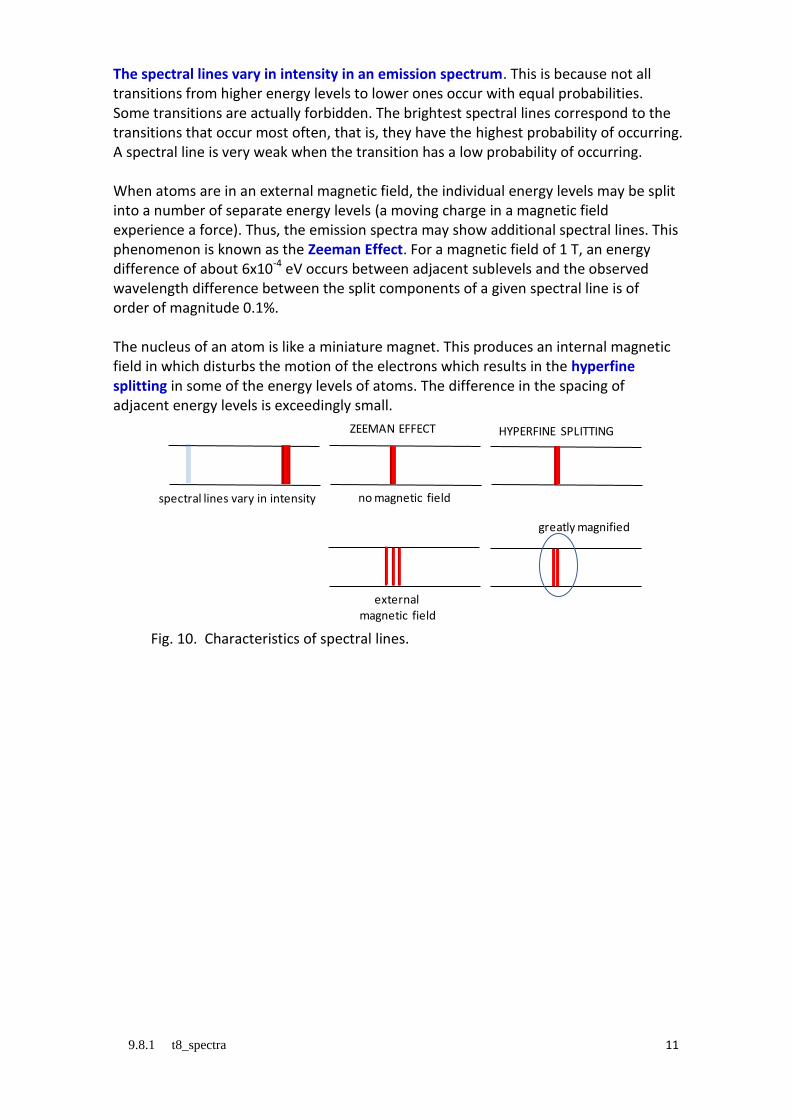
The spectral lines vary in intensity in an emission spectrum. This is because not all transitions from higher energy levels to lower ones occur with equal probabilities. Some transitions are actually forbidden. The brightest spectral lines correspond to the transitions that occur most often, that is, they have the highest probability of occurring. A spectral line is very weak when the transition has a low probability of occurring. When atoms are in an external magnetic field, the individual energy levels may be split into a number of separate energy levels (a moving charge in a magnetic field experience a force). Thus, the emission spectra may show additional spectral lines. This phenomenon is known as the Zeeman Effect. For a magnetic field of 1 T, an energy difference of about 6x10⁻⁴ eV occurs between adjacent sublevels and the observed wavelength difference between the split components of a given spectral line is of order of magnitude 0.1%. The nucleus of an atom is like a miniature magnet. This produces an internal magnetic field in which disturbs the motion of the electrons which results in the hyperfine splitting in some of the energy levels of atoms. The difference in the spacing of adjacent energy levels is exceedingly small.
Fig. 10. Characteristics of spectral lines.
spectral lines vary in intensity no magnetic field
externalmagnetic field
HYPERFINE SPLITTING
greatly magnified
ZEEMAN EFFECT
9.8.1 t8_spectra 12
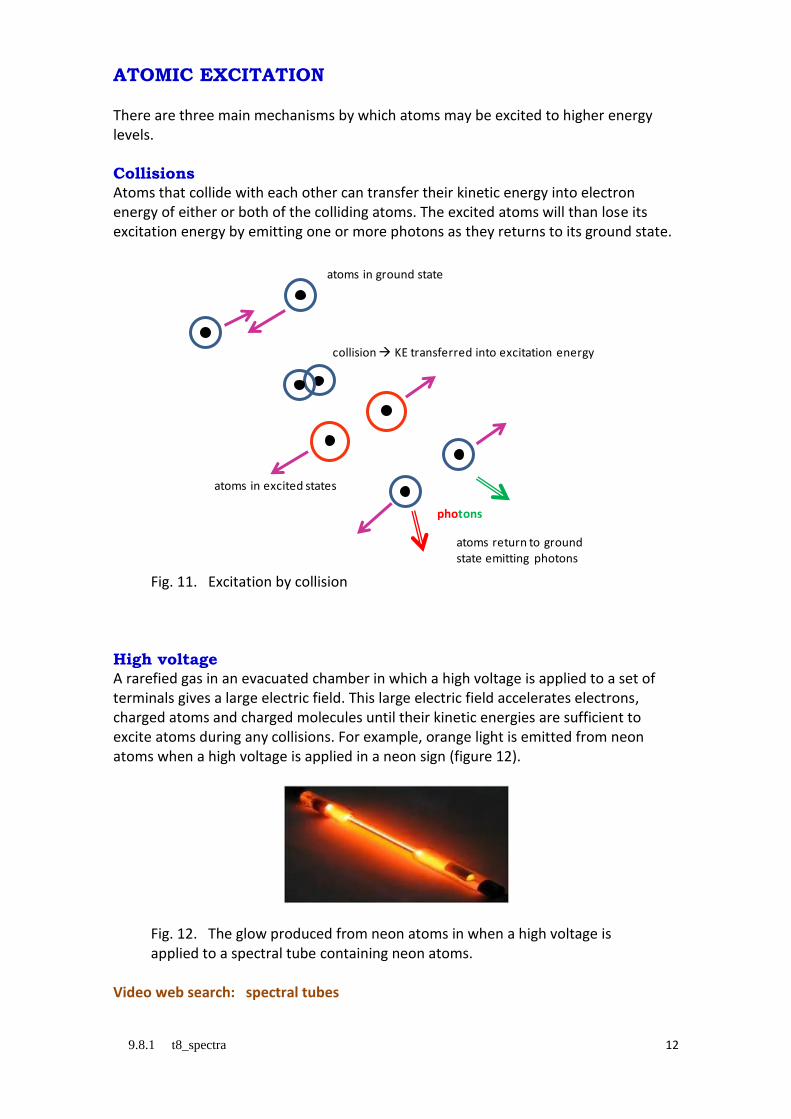
ATOMIC EXCITATION There are three main mechanisms by which atoms may be excited to higher energy levels. Collisions
Atoms that collide with each other can transfer their kinetic energy into electron energy of either or both of the colliding atoms. The excited atoms will than lose its excitation energy by emitting one or more photons as they returns to its ground state.
Fig. 11. Excitation by collision High voltage
A rarefied gas in an evacuated chamber in which a high voltage is applied to a set of terminals gives a large electric field. This large electric field accelerates electrons, charged atoms and charged molecules until their kinetic energies are sufficient to excite atoms during any collisions. For example, orange light is emitted from neon atoms when a high voltage is applied in a neon sign (figure 12).
Fig. 12. The glow produced from neon atoms in when a high voltage is
applied to a spectral tube containing neon atoms. Video web search: spectral tubes
photons
atoms in ground state
collision KE transferred into excitation energy
atoms in excited states
atoms return to ground state emitting photons

9.8.1 t8_spectra 13
Resonant absorption
The absorption by an atom of a photon of light whose energy is equal to the energy required to raise an electron to a higher energy state as shown in figure (8). When white light (all wavelengths in visible spectrum present) passes through hydrogen gas, the photons whose energy corresponds to the difference in energy levels of hydrogen are absorbed. The excited hydrogen atoms immediately lose energy by radiating energy in random directions. This gives the absorption spectra where dark bands appear on a bright background.
Fig. 13. The absorption of energy and subsequent emission of radiation in
random directions as white light passes through a gas.
white lighttransmitted light
gas
absorbed (excitation) energy emission in random directions at specific wavelengths

9.8.1 t8_spectra 14
FRANCK-HERTZ EXPERIMENT The Frank-Hertz experiment was one of the first to show that atoms can only accept energy in a packet or quantum, i.e., there exist discrete energy levels within atoms. The Franck-Hertz experiment investigated the collision of electrons and mercury atoms in a glass tube filled with mercury vapour at reduced pressure. The apparatus which they used is shown in figure (14).
Fig. 14. Schematic diagram of Frank Hertz experimental apparatus. The filament is heated to produce thermionic electrons. These electrons are attracted to the wire mesh electrode by a variable positive voltage. Many of the electrons moving under the influence of this electric field pass through the wire mesh electrode and reach the collecting electrode. The collecting electrode is connected to a sensitive galvanometer and hence one can measure the current due to electrons reaching the collecting electrode. These electrons in travelling from the heater filament collide with the mercury atoms. By applying a small reverse voltage to the collecting electrode, the number of electrons reaching it can be controlled. This retarding voltage is kept constant and the accelerating voltage between the heater filament and the wire mesh electrode is slowly increased from zero. The number of electrons reaching the collecting electrode is zero when this accelerating voltage is less than the retarding voltage, hence the current is zero. As the accelerating voltage increases above the retarding voltage the current simultaneously increases. The collisions between the massive mercury atoms and the electrons are elastic and no energy is transferred to the mercury atoms. The electrons behave as if there is no gas present. However, when the accelerating voltage reaches 4.9 V, the current, suddenly drops to some small value. This means that the electrons must now have insufficient energy to cross the gap from the wire mesh to the collecting electrode against the retarding potential. This sudden change is due to the electrons having acquired just the right amount of energy to excite the mercury atoms. That is, the collisions between the electrons and mercury atoms are inelastic. An electron in colliding with a mercury atom gives up its energy to raise an electron in the mercury atoms from one energy level to a higher energy level.
G
heaterfilament
variable acceleratingvoltage
meshelectrode
collectingelectrode
retardingvoltage
9.8.1 t8_spectra 15
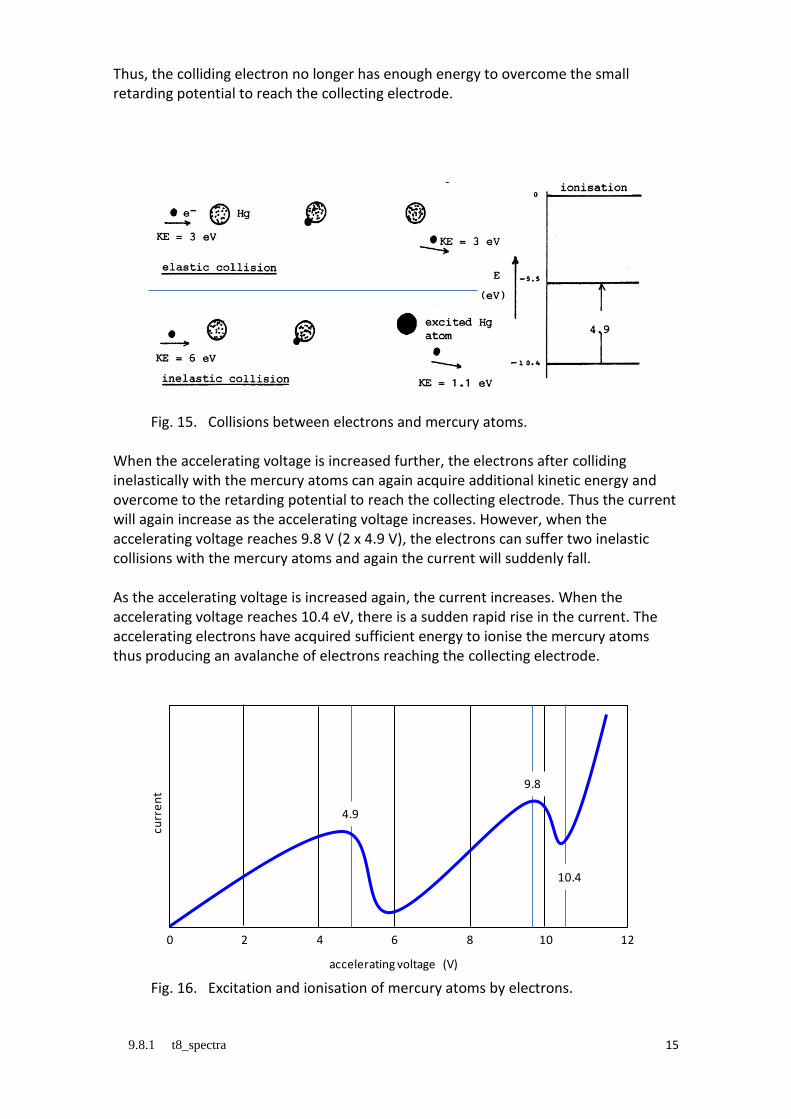
Thus, the colliding electron no longer has enough energy to overcome the small retarding potential to reach the collecting electrode.
Fig. 15. Collisions between electrons and mercury atoms. When the accelerating voltage is increased further, the electrons after colliding inelastically with the mercury atoms can again acquire additional kinetic energy and overcome to the retarding potential to reach the collecting electrode. Thus the current will again increase as the accelerating voltage increases. However, when the accelerating voltage reaches 9.8 V (2 x 4.9 V), the electrons can suffer two inelastic collisions with the mercury atoms and again the current will suddenly fall. As the accelerating voltage is increased again, the current increases. When the accelerating voltage reaches 10.4 eV, there is a sudden rapid rise in the current. The accelerating electrons have acquired sufficient energy to ionise the mercury atoms thus producing an avalanche of electrons reaching the collecting electrode.
Fig. 16. Excitation and ionisation of mercury atoms by electrons.
0 2 4 6 8 10 12
curr
en
t
accelerating voltage (V)
4.9
9.8
10.4
9.8.1 t8_spectra 16
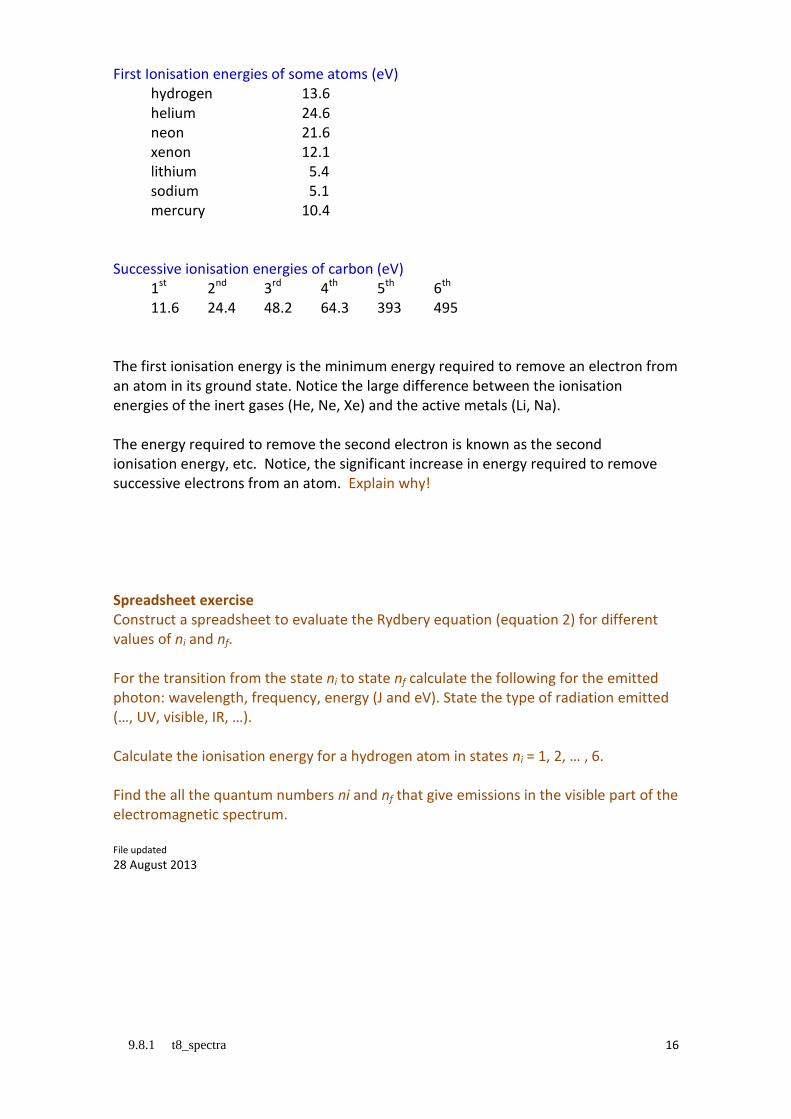
First Ionisation energies of some atoms (eV) hydrogen 13.6 helium 24.6 neon 21.6 xenon 12.1 lithium 5.4 sodium 5.1 mercury 10.4 Successive ionisation energies of carbon (eV) 1st 2nd 3rd 4th 5th 6th 11.6 24.4 48.2 64.3 393 495 The first ionisation energy is the minimum energy required to remove an electron from an atom in its ground state. Notice the large difference between the ionisation energies of the inert gases (He, Ne, Xe) and the active metals (Li, Na). The energy required to remove the second electron is known as the second ionisation energy, etc. Notice, the significant increase in energy required to remove successive electrons from an atom. Explain why! Spreadsheet exercise Construct a spreadsheet to evaluate the Rydbery equation (equation 2) for different values of ni and nf. For the transition from the state ni to state nf calculate the following for the emitted photon: wavelength, frequency, energy (J and eV). State the type of radiation emitted (…, UV, visible, IR, …). Calculate the ionisation energy for a hydrogen atom in states ni = 1, 2, … , 6. Find the all the quantum numbers ni and nf that give emissions in the visible part of the electromagnetic spectrum. File updated
28 August 2013