do people with chronic pain have impaired executive function? a meta-analytical review
TRANSCRIPT
�������� ����� ��
Do people with chronic pain have impaired executive function? A meta-analytical review
Carolyn Berryman, Tasha R. Stanton, K. Jane Bowering, Abby Tabor,Alexander McFarlane, G. Lorimer Moseley
PII: S0272-7358(14)00132-9DOI: doi: 10.1016/j.cpr.2014.08.003Reference: CPR 1396
To appear in: Clinical Psychology Review
Received date: 8 January 2014Revised date: 3 July 2014Accepted date: 14 August 2014
Please cite this article as: Berryman, C., Stanton, T.R., Bowering, K.J., Tabor, A.,McFarlane, A. & Moseley, G.L., Do people with chronic pain have impaired exec-utive function? A meta-analytical review, Clinical Psychology Review (2014), doi:10.1016/j.cpr.2014.08.003
This is a PDF file of an unedited manuscript that has been accepted for publication.As a service to our customers we are providing this early version of the manuscript.The manuscript will undergo copyediting, typesetting, and review of the resulting proofbefore it is published in its final form. Please note that during the production processerrors may be discovered which could affect the content, and all legal disclaimers thatapply to the journal pertain.
ACC
EPTE
D M
ANU
SCR
IPT
ACCEPTED MANUSCRIPT
Title: Do people with chronic pain have impaired executive function? A meta-analytical review.
Carolyn Berrymana Tasha R Stantona,b K Jane Boweringa Abby Tabora,c Alexander McFarlaned G
Lorimer Moseleya,b
a Sansom Institute for Health Research, Adelaide & PainAdelaide, University of South Australia,
Adelaide, Australia; bNeuroscience Research Australia, Sydney, Australia; cSchool of Biomedical
Sciences, King’s College, London, United Kingdom; dCentre for Traumatic Stress Studies, University of
Adelaide, Adelaide, Australia.
Address Correspondence:
Prof Lorimer Moseley, Sansom Institute for Health Research, University of South Australia, GPO Box
2471, Adelaide 5001, Australia T: +61 8 83022454 E: [email protected]
Number of Text Pages (31)
Number of Figures in Manuscript (3)
Number of Tables in Manuscript (4)
Number of Appendices (2: A - 1 file, B - 2 tables)
Supplementary Online Files (5: Figures 4 – 8, sensitivity analyses)

ACC
EPTE
D M
ANU
SCR
IPT
ACCEPTED MANUSCRIPT
Abstract
A widely held belief within the clinical community is that chronic pain is associated with cognitive
impairment, despite the absence of a definitive systematic review or meta-analysis on the topic. The
current systematic review and meta-analysis aimed to establish the current evidence concerning the
difference in executive function between people with chronic pain and healthy controls. Six
databases were searched for citations related to executive function and chronic pain from inception
to June 24, 2013. Two reviewers independently assessed studies for eligibility and extracted relevant
data according to Cochrane Collaboration and Preferred Reporting Items for Systematic Reviews and
Meta-Analyses guidelines. Twenty five studies were included in the review and twenty two studies in
the meta-analysis. A small to moderate impairment in executive function performance was found in
people with chronic pain across cognitive components, although all studies had a high risk of bias.
The current evidence suggests impairment of executive function in people with chronic pain,
however, important caveats exist. First, executive function involves many cognitive components and
there is no standard test for it. Second, moderators of executive function, such as medication and
sleep, were seldom controlled for in studies of executive function performance.
Word count (195)
Key Words: Executive function, systematic review, chronic pain, meta-analysis, Stroop

ACC
EPTE
D M
ANU
SCR
IPT
ACCEPTED MANUSCRIPT
Introduction
Executive function is the overarching term used to describe the outcome of that goal-directed,
coordinated activation of multiple cognitive processes that allows us to respond to a non-routine
situation in an effective, adaptable manner (Banich, 2009; Elliot, 2003; Funahashi, 2001). It is often
described by the cognitive processes that contribute to the outcome, such as planning, attention,
cognitive flexibility, and decision making, but it is rarely defined. Indeed, executive function is clearly
difficult to define (Jurado & Rosselli, 2007, pp. 214, Table 1). To what extent executive function test
outcomes reflect activation of one underlying neural network, thereby making executive function a
unitary concept, remains a contentious issue in the literature (Duncan, Johnson, Swales, & Freer,
1997; Duncan & Owen, 2000; Jurado & Rosselli, 2007). A further confounding factor is task impurity,
or the understanding that executive function draws on the use of non-executive cognitive processes.
For example, long-term memory and word recall are not considered executive function, but one or
other process might be critical to the performance of the task that is being used to evaluate
executive function. Due to such complexities, most tasks of executive function suffer from poor
construct validity and reliability (Hughes & Graham, 2002; Miyake, Friedman, et al., 2000), and it is
difficult to extract comparable outcomes across conditions.
An accepted framework that reflects the cognitive and biological underpinnings of executive
function, and overcomes these problems to some extent, is the unity and diversity framework
(Hofmann, Schmeichel, & Baddeley, 2012; Miyake & Friedman, 2012; Miyake, Friedman, et al.,
2000). This framework provides the theoretical rationale to consider executive function test
outcomes under four distinguishable cognitive components: Response Inhibition, Complex Executive
Function, Set Shifting and Updating. The current review specifically reports the evidence for
executive function impairment in people with chronic pain under the first three cognitive
components; we do not report Updating, because it has been well-covered by an earlier review and
meta-analysis by our group (Berryman, et al., 2013).
ACC
EPTE
D M
ANU
SCR
IPT
ACCEPTED MANUSCRIPT
Chronic pain has been defined by the International Association for the study of Pain (IASP) as “…pain
that persists beyond normal healing time…”, for which three months is the conventional duration
assigned to normal healing time (International Association for the Study of Pain, 1986, p. S5). It is
widely believed within the clinical community, and throughout clinical texts and patient resources,
that chronic pain is associated with impaired cognitive performance (Fisher, 2002; Kaye & Urman,
2011; Turk & Gatchell, 2002). Although there has been no systematic review of the evidence for this
association, it seems theoretically plausible. Compelling evidence exists that regardless of the
circumstances of the initial onset of the pain state, the ultimate manifestation of chronic pain is in
structural, functional and chemical changes within the brain and central nervous system (Apkarian,
Baliki, & Geha, 2009; Farmer, Baliki, & Apkarian, 2012; Farmer, et al., 2011; Moseley & Flor, 2012;
Tracey & Bushnell, 2009; Wand, Parkitny, O’Connell, et al., 2011). Moreover, these changes have
been observed in neural networks common to both pain and cognitive performance, including those
involved in executive function (Elliot, 2003; Seminowicz & Davis, 2007; Wiech, et al., 2005). Also
noted in the literature is that pain disrupts attention and consumes resources otherwise directed to
cognitive performance (Crombez, Eccleston, Baeyens, Van Houdenhove, & Van den Broeck, 1999;
Crombez, Van Ryckeghem, Eccleston, & Van Damme, 2013; Legrain, Perchet, & Garcia-Larrea, 2009;
Van Daame, Legrain, Vogt, & Crombez, 2010). Legrain et al. (2009) summarised this literature into a
Neurocognitive Model of Attention to Pain, where executive function is the result of the interplay
between the attention paid to peripheral input and the goal-directed activity of the brain. Together,
these observations provide plausible mechanisms to underpin and encourage the widespread belief
amongst the clinical community that chronic pain is associated with impaired executive function.
Within the context of chronic pain, gaining a better understanding of executive function
performance, and the processes that underpin it, may provide additional information relevant to the
etiology and maintenance of symptoms (Nes, Roach, & Segerstrom, 2009). This information, in turn,
may assist the process of choosing the right type of intervention for a particular client (Eccleston,
Morley, & Williams, 2013). The success of any well-conceived, popular and evidence-based
ACC
EPTE
D M
ANU
SCR
IPT
ACCEPTED MANUSCRIPT
treatment, such as cognitive behavioural therapy (Dear, et al., 2013; Morley, Eccleston, & Williams,
1999; Williams, Eccleston, & Morley, 2012), acceptance commitment therapy (Hayes & Strosahl,
1999; McCracken & Eccleston, 2005), mindfulness (Holzel, et al., 2011) and pain biology education
(so called Explaining Pain; Butler & Moseley, 2003; Moseley, 2003) is thought more likely when it
incorporates theory and research as well as a shared understanding between client and clinician of
the presenting issues (Dudley, Kuyken, & Padesky, 2011; Jensen, 2011).
Thus, there is a compelling need to clarify whether and to what extent chronic pain is associated
with a loss of executive function. The current dominant view is clearly influenced by the clinical
observation that people with chronic pain often report poor concentration and memory, but also by
mounting evidence of functional and structural cortical changes (Farmer, et al., 2011; Moseley &
Flor, 2012; Wand, Parkitny, O'Connell, et al., 2011) and attentional disruption (Eccleston & Crombez,
1999). Further, the conclusion that the efficacy of cognitive behavioural interventions in people with
chronic pain have reached a plateau and further advancements need new information (Eccleston, et
al., 2013; Williams, et al., 2012), adds weight to this observation. Remarkably, however, despite over
two decades of research, and the widely held belief within the clinical community of the idea, there
has to date, been no attempt to systematically review and appraise the literature. We aimed to fill
this substantial gap by determining the current evidence for impaired executive function in people
with chronic pain.
Methods
Data sources
This systematic review was conducted following the Cochrane Collaboration (The Nordic Cochrane
Centre, 2011) and Preferred Reporting Items for Systematic Reviews and Meta-Analyses (“PRISMA”)
Statement guidelines (Moher, Liberati, Tetzlaff, & Altman, 2009). A sensitive search strategy was
performed in the following databases (up to June 24, 2013): Medline (via OvidSP), EMBASE (via

ACC
EPTE
D M
ANU
SCR
IPT
ACCEPTED MANUSCRIPT
OvidSP), PsychINFO (via EBSCOhost), Cinahl (via EBSCOhost), Amed (via OvidSP), and Scopus (via
EBSCOhost). Search results were limited to studies with human participants. There was no restriction
on the language of articles (see Appendix A, File A1 for our Medline search terms). Studies relating
to executive function and chronic pain were exported to citation management software, Refworks
(RefWorks).Retrieved full text articles and review articles published in the area of chronic pain and
cognitive function, identified through background reading and systematic searching, were hand-
searched for citations containing original data. Figure 1 shows the flow of articles through the
process.
Study Selection
To be included in this review, studies had to evaluate executive function performance in a sample of
people with chronic pain and compare their performance with that of a healthy control group or a
normative sample. Studies were included if they explicitly stated they were evaluating executive
function, or if they used tests that are generally accepted to be a measure of executive function, for
example – the Stroop Test (Banich, 2009; Hofmann, et al., 2012; Lezak, Howieson, & Loring, 2004).
Studies that used an attentional bias paradigm were excluded because this test was considered to
investigate the effect of pain-relevant cues on attentional capture, not executive function (Crombez,
et al., 2013; McLeod, Mathews, & Tata, 1986). Other exclusion criteria were: studies with more than
15% of participants < 18 years old; studies that included participants with traumatic brain injury,
Alzheimer’s disease or any event-related or disease-related change that would be expected to impair
cognition. Commentaries, abstracts, editorials, and letters to the editor were only included if we
could obtain full data from the author(s).
Study inclusion
Titles and abstracts were screened by two independent reviewers. Clearly irrelevant citations were
removed. Full text of potentially eligible studies were retrieved and then formally assessed for
ACC
EPTE
D M
ANU
SCR
IPT
ACCEPTED MANUSCRIPT
eligibility by the two reviewers, using a previously piloted inclusion form (see Berryman, et al., 2013).
Decisions about inclusion were cross-checked between reviewers and disagreements were resolved
first through discussion, if still unresolved, through consultation with a third reviewer.
Risk of Bias Assessment
Risk of bias was assessed by two independent reviewers, using a customised risk of bias form. The
form was developed a priori, and based on relevant items from the Cochrane Collaboration risk of
bias tool, and on the STrengthening the Reporting of OBservational studies in Epidemiology
(STROBE) checklist (www.strobe-statement.org) for reports of observational studies. Any differences
were resolved by discussion between reviewers.
Data Extraction
Two independent reviewers used a previously piloted (Berryman, et al., 2013), customised form to
extract data. Results were compared for accuracy. We extracted: group-specific data (type of chronic
pain, definition of chronic pain and/or healthy control, sample size in each group, gender, and mean
and standard deviation for age and pain scores); statistical method data (variables used to match
groups, covariates used in the analysis); cognitive test data (name of cognitive test, for example the
Stroop Test), cognitive process evaluated (where it is specified), type of outcome measure of test
(for example number of answers correct), interpretation of test; and group-specific outcomes on
cognitive tests (mean and standard deviation for each group, z-scores, statistical test results; for
example mean differences). If more information were required than that contained in the source
paper, three attempts were made to contact the authors. If all three attempts were unsuccessful,
the missing information was considered un-retrievable.
Data synthesis
The outcome data were first subdivided according to type of outcome measure: (i) the number or
sum of correct answers, and (ii) response time. They were then subdivided by cognitive component
ACC
EPTE
D M
ANU
SCR
IPT
ACCEPTED MANUSCRIPT
according to the unity and diversity framework (Miyake, Friedman, et al., 2000): (i) Response
Inhibition; (ii) Complex Executive Function; and (iii) Set Switching. The outcome data were allocated
to a group by using generally accepted descriptions and/or author report. For example, the Stroop
Test is generally accepted as a test of response inhibition (Hofmann, et al., 2012; Jurado & Rosselli,
2007; Logue & Gould, 2013; McAlonon & Brown, 2003; Miyake, Friedman, et al., 2000) and the Trail-
making B Test is generally accepted as a test of set shifting (Birrell & Brown, 2000; Bowie & Harvey,
2006; Jurado & Rosselli, 2007; Logue & Gould, 2013), and so forth. Of interest, we included the
percent of perseverative errors (transformed into percent correct) outcome of the Wisconsin Card
Sorting Test (Suhr, 2003; Verdejo-García, López-Torrecillas, Calandre, Delgado-Rodríguez, &
Bechara, 2009) in Set Shifting, because it is an outcome score generally accepted to represent
mental flexibility (Jurado & Rosselli, 2007; Kaplan, Sengor, Gurvit, Genc, & Guzelis, 2006). The
remaining outcomes from the test were included in Complex Executive Function. For each group, the
mean and pooled standard deviations of the outcome data were used to calculate the standardised
mean difference (Hedge’s g: SMD). Interference scores were calculated for all instances of the
Stroop Test, the Multisource Interference Test and an Interference Card Test (see Appendix B, Table
B1).
Data Pooling
Data were pooled when at least two studies evaluated the same cognitive component or when one
study performed at least two versions of the task, or two separate tasks that tested one cognitive
component. Because numerous studies provided results from several tests under one cognitive
component (for example, Eccleston, 1995, Interference Card Test) all results were included in the
forest plot, but subject numbers (sample size) were reduced to reflect the number of times the study
appeared in that group.
Data Analysis

ACC
EPTE
D M
ANU
SCR
IPT
ACCEPTED MANUSCRIPT
Data were analysed using Review Manager Revman (Version 5.1, The Nordic Cochrane Centre,
2011). If sufficient data were not reported and could not be obtained from the authors, the study
was not included in the analysis. Studies in which the mean and standard deviation values could not
be estimated from group-level statistics were excluded from the meta-analysis. Heterogeneity was
deemed significant on the basis of Χ2 p < .10 and substantial on the basis of I2 > 60% (Higgins &
Green, 2008). Interpretation of effect estimates was based on Cohen (1998): small (0.20), medium
(0.5) or large (≥ 0.8). To explore potential differences of interest in effect estimates within groups
and between studies, post hoc sensitivity analyses were completed. All figures for the sensitivity
analyses are included in the form of Supplemental Online Files (Figures 4 to 8).
Results
Two thousand and thirty records were identified. Full text was retrieved for 217 studies (see Figure
1). The two independent reviewers agreed that 21 studies met the inclusion criteria. The reviewers
disagreed over nine studies (Andersson & Haldrup, 2003; Asmundson, Carleton, & Ekong, 2005a;
Grisart, Van der Linden, & Bastin, 2007; Grisart, Van der Linden, & Masquelier, 2002; Luoto, Taimela,
Hurri, & Alaranta, 1999; Pincus, Fraser, & Pearce, 1998; Sjøgren, Christrup, Petersen, & Højsted,
2005; Snider, Asmundson, & KC, 1999; Weissman-Fogel, et al., 2011). Discussion between the two
reviewers resulted in the exclusion of three studies because they did not report an explicit or
commonly used measure of executive function (Grisart, et al., 2007; Grisart, et al., 2002; Luoto, et
al., 1999); one study because a neutral interference factor was not measured, that is , only
interference factors due to affective or sensory bias were reported (Snider, et al., 1999); and one
study because it used a dot probe paradigm (Asmundson, et al., 2005a). The remaining four studies
were included because they reported outcomes from test(s) that are commonly used to investigate
executive function, that is, Stroop Test and Continuous Reaction Time Test (Andersson & Haldrup,
2003; Pincus, et al., 1998; Sjøgren, et al., 2005; Weissman-Fogel, et al., 2011). Additional information
was sought from the authors of 10 papers: eight (Apkarian, et al., 2004; Castel, et al., 2009;
ACC
EPTE
D M
ANU
SCR
IPT
ACCEPTED MANUSCRIPT
Eccleston, 1994; Grisart & Plaghki, 1999; Lamoth, Stins, Pont, Kerckhoff, & Beek, 2008; Luerding,
Weigand, Bogdahn, & Schmidt-Wilcke, 2008; Melkumova, Podchufarova, & Yakhno, 2011; Pickering,
Salimani, & Dubray, 2010) to obtain mean and standard deviation information, and two (Khatibi,
Deghani, Sharpe, Asmundson, & Puretemad, 2009; Snider, et al., 1999) to clarify how the data were
interpreted. Five authors replied with data (Eccleston, 1994; Khatibi, et al., 2009; Lamoth, et al.,
2008; Luerding, et al., 2008; Snider, et al., 1999). Two articles (Apkarian, et al., 2004; Grisart &
Plaghki, 1999) were reported on, but not included in the forest plots because of a lack of
information. Two tests (Tracking Test and Bourdon Vos Test), from three studies (Oosterman,
Derksen, Van Wijck, Kessels, & Veldhuijzen, 2012; Oosterman, Derksen, Van Wijck, Veldhuijzen, &
Kessels, 2011; Veldhuijzen, et al., 2006) were reported on, but not included in the forest plot
because of the complexity of interpretation. Full information for two abstracts (Castel, et al., 2009;
Pickering, et al., 2010) and control comparison data for one article (Melkumova, et al., 2011) could
not be obtained. Table 1 summarises the key characteristics of the 25 included studies.
Risk of Bias of Included Studies:
All studies were judged to have a high risk of bias, primarily due to unclearly described methods of
recruitment. Only two studies (Jongsma, et al., 2011; Lee, et al., 2010) reported recruiting a
representative sample and less than half of the studies screened controls using the same diagnostic
criteria as they had applied to the condition sample. With the exception of Veldhuijzen et al. (2006)
and Can & Gencay-Can (2012), no studies reported a priori calculation of the sample size that would
be required for adequate power. Twenty-one studies did not report the reliability of the test(s) they
used and 18 studies did not report the validity of the test(s) they used. The study that was assessed
as having the least risk of bias was Can & Gencay-Can (2012). Risk of bias data are summarised in
Table 2.
How Executive Function was evaluated – test and test outcomes
ACC
EPTE
D M
ANU
SCR
IPT
ACCEPTED MANUSCRIPT
All 25 studies measured a behavioural response to a neuropsychological test of executive function
(see Tables 3 and 4). The interference factor was calculated in eight studies (Andersson & Haldrup,
2003; Eccleston, 1994, 1995; Lamoth, et al., 2008; Oosterman, et al., 2012; Pincus, et al., 1998;
Veldhuijzen, Sondaal, & Oosterman, 2012; Weissman-Fogel, et al., 2011; see Appendix B, Table B1) .
One study (Luerding, et al., 2008) presented standardised normal scores and z scores, stratified by
age and education for Trail-making Test A and B outcomes which were converted into mean and
standard deviations using data from Tombaugh (Tombaugh, 2004; see Appendix B, Table B2). One
study (Roldan-Tapia, Canovas-Lopez, Cimdevilla, & Valverde, 2007) calculated scaled scores for the
Stroop Test that required plotting in a reverse fashion on the number count forest plot (i.e. control
scores were entered first). One study (Glass, et al., 2011) measured the fMRI responses to a
neuropsychological test of executive function. In total, 19 different tests were used to assess
executive function.
Behavioural outcome measure: Number or sum of correct responses
Fourteen studies (Can & Gencay-Can, 2012; Glass, et al., 2011; Grace, Nielson, Hopkins, & Berg,
1999; Jongsma, et al., 2011; Lee, et al., 2010; Oosterman, et al., 2012; Park, Glass, Minear, &
Crofford, 2001; Roldan-Tapia, et al., 2007; Suhr, 2003; Veldhuijzen, et al., 2012; Veldhuijzen, et al.,
2006; Verdejo-García, et al., 2009; Walteros, et al., 2011; Weiner, Rudy, Morrow, Slaboda, & Lieber,
2006) presented 29 outcomes for number or sum of correct responses across the three cognitive
components of executive function: Response Inhibition, Complex Executive Function and Set
Shifting. Five studies (Can & Gencay-Can, 2012; Jongsma, et al., 2011; Suhr, 2003; Veldhuijzen, et al.,
2006; Verdejo-García, et al., 2009) reported error data and these were transformed into accuracy
data for ease of further analysis. Fifteen different number count outcomes tests were used to
evaluate the cognitive components of executive function. Figure 2 shows the forest plot, and Table 3
displays the types of tests, the outcome measures, and the studies included on the forest plots in
this section. Please refer to this table for a comprehensive breakdown of the information on the

ACC
EPTE
D M
ANU
SCR
IPT
ACCEPTED MANUSCRIPT
forest plot. Post hoc sensitivity analyses forest plots for number or sum of correct responses by
outcome and pain group are provided in the Supplemental Online Files (Figures 4, 5 and 6).
Response Inhibition
Pooled results from eight comparisons across five studies (Glass, et al., 2011; Jongsma, et al., 2011;
Roldan-Tapia, et al., 2007; Veldhuijzen, et al., 2012; Walteros, et al., 2011), showed that chronic pain
was not associated with Response Inhibition. That is, there was a non-significant effect estimate of -
0.12 (95%CI = -0.44 to 0.20). Of interest, the accuracy outcome data appeared very different to the
number correct data. A sensitivity analysis removing the accuracy data revealed a medium,
significant effect estimate of -0.55 (95%CI = -0.95 to -0.15) for Response Inhibition (see
Supplemental Online Files, Figure 4).
Sensitivity analysis for chronic non-fibromyalgia and fibromyalgia pain
Neither chronic non-fibromyalgia pain, nor chronic fibromyalgia pain was associated with Response
Inhibition. That is, for chronic non-fibromyalgia pain, there was a non-significant effect estimate of -
0.33 (95%CI = -0.86 to 0.20) from three comparisons across two studies (Jongsma, et al., 2011;
Roldan-Tapia, et al., 2007). For chronic fibromyalgia pain, pooled results from five comparisons
across four studies (Glass, et al., 2011; Roldan-Tapia, et al., 2007; Veldhuijzen, et al., 2012; Walteros,
et al., 2011) showed a non-significant effect estimate of -0.07 (95%CI = -0.24 to 0.39; see
Supplemental Online Files, Figures 5 and 6).
Complex Executive Function
Pooled results from twelve comparisons, across seven studies (Can & Gencay-Can, 2012; Lee, et al.,
2010; Oosterman, et al., 2012; Roldan-Tapia, et al., 2007; Suhr, 2003; Veldhuijzen, et al., 2006;
Verdejo-García, et al., 2009), showed that chronic pain was associated with decreased Complex
Executive Function. That is, there was a small, significant effect estimate of -0.49 (95%CI = -0.81 to -
0.17). Significant heterogeneity was detected for Complex Executive Function (Χ2 = 40.49, p < .001,

ACC
EPTE
D M
ANU
SCR
IPT
ACCEPTED MANUSCRIPT
I2 =73%). One result not included on the forest plot was the magnitude of variance, between a
healthy control group and a group with chronic pain, on a computer generated Tracking Test
(reported as the root mean square; Veldhuijzen, et al., 2006). Contrary to the pooled effect estimate
that suggested a loss of Complex Executive Function in people with chronic pain, no significant
difference was found between groups on this test (p = .22; CP mean [standard deviation] = 16.3
[8.9], n= 14; HC mean [standard deviation] = 12.8 [5.8], n=14).
Sensitivity analysis for chronic non-fibromyalgia and fibromyalgia pain
When analysed separately, chronic non-fibromyalgia pain showed no association with decreased
Complex Executive Function, but an association was shown with chronic fibromyalgia pain. That is,
there was a non-significant effect estimate of -0.38 (95%CI = -0.83 to 0.07) from six comparisons
across five studies (Lee, et al., 2010; Oosterman, et al., 2012; Roldan-Tapia, et al., 2007; Suhr, 2003;
Veldhuijzen, et al., 2006) for chronic non-fibromyalgia pain. For chronic fibromyalgia pain, pooled
results from six comparisons across four studies (Can & Gencay-Can, 2012; Roldan-Tapia, et al.,
2007; Suhr, 2003; Verdejo-García, et al., 2009) showed a medium, significant effect estimate of -0.57
(95%CI = -0.94 to -0.20). Significant heterogeneity was demonstrated for both chronic pain groups
(for chronic non-fibromyalgia pain Χ2 = 19.89, p = .001, I2 = 75%; for chronic fibromyalgia pain Χ2 =
11.04, p = .05, I2 = 55%).
Set Shifting
Pooled results from seven comparisons, across six studies (Grace, et al., 1999; Jongsma, et al., 2011;
Park, et al., 2001; Suhr, 2003; Verdejo-García, et al., 2009; Weiner, et al., 2006), showed that chronic
pain was associated with poorer Set Shifting. That is, there was a small, significant effect estimate of
-0.25 (95%CI = -0.41 to -0.09).
Sensitivity analysis for chronic non-fibromyalgia and fibromyalgia pain

ACC
EPTE
D M
ANU
SCR
IPT
ACCEPTED MANUSCRIPT
When analysed separately, chronic non-fibromyalgia pain showed an association with impaired Set
Shifting, but chronic fibromyalgia pain did not. That is, for chronic non-fibromyalgia pain, there was a
small, significant effect estimate of -0.32 (95%CI = -0.53 to -0.11) for pooled results from three
comparisons across three studies (Jongsma, et al., 2011; Suhr, 2003; Weiner, et al., 2006). For
chronic fibromyalgia pain, pooled results from four comparisons across four studies (Grace, et al.,
1999; Park, et al., 2001; Suhr, 2003; Verdejo-García, et al., 2009) showed a non-significant effect
estimate of -0.14 (95%CI = -0.40 to 0.13).
Behavioural outcome measure: Response time
Sixteen studies (Andersson & Haldrup, 2003; Apkarian, et al., 2004; Eccleston, 1994, 1995; Glass, et
al., 2011; Grisart & Plaghki, 1999; Jongsma, et al., 2011; Lamoth, et al., 2008; Oosterman, et al.,
2012; Oosterman, et al., 2011; Pincus, et al., 1998; Sjøgren, et al., 2005; Suhr, 2003; Veldhuijzen, et
al., 2012; Weissman-Fogel, et al., 2011) presented 40 outcomes for response time data (including
three studies - Apkarian, et al., 2004, Grisart & Plaghki, 1999, and Oosterman, et al., 2011 - that were
not included on the forest plot because they presented insufficient data or the data were not able
to be plotted), across the three cognitive components of executive function: Response Inhibition,
Complex Executive Function, and Set Shifting (See Figure 3). The Stroop Test was the most
frequently used of the 11 tests in this section. Table 4 displays the types of tests, the outcome
measures and the studies included on the forest plots in this section. Please refer to Table 4 for a
comprehensive breakdown of the information on the forest plot. Post hoc sensitivity analyses forest
plots for response time by group are provided in the Supplemental Online Files (Figures 7 and 8).
Response Inhibition
Pooled results from 21 comparisons, across 11 studies (Andersson & Haldrup, 2003; Eccleston, 1994,
1995; Glass, et al., 2011; Jongsma, et al., 2011; Lamoth, et al., 2008; Oosterman, et al., 2012; Pincus,
et al., 1998; Suhr, 2003; Veldhuijzen, et al., 2012; Weissman-Fogel, et al., 2011), suggested chronic

ACC
EPTE
D M
ANU
SCR
IPT
ACCEPTED MANUSCRIPT
pain was associated with impaired Response Inhibition. That is, there was a small, significant effect
estimate of 0.31 (95%CI = 0.08 to 0.55). Significant heterogeneity was detected for Response
Inhibition (Χ2 = 31.00, p = .06, I2 = 35%). Two studies (Apkarian, et al., 2004; Grisart & Plaghki, 1999)
had insufficient data to be included on the forest plot. One of those studies (Apkarian, et al., 2004)
used the Stroop Test and reported no difference between people with chronic low back pain and
healthy controls, which was inconsistent with the pooled findings. The other study (Grisart &
Plaghki, 1999) also used the Stroop Test and reported greater interference in people with high pain
than in people with low pain and in healthy controls (p < .05).
Sensitivity analysis for chronic non-fibromyalgia and fibromyalgia pain
When analysed separately, chronic non-fibromyalgia pain showed an association with impaired
Response Inhibition, but chronic fibromyalgia pain did not. That is, for chronic non-fibromyalgia pain,
pooled results from 17 comparisons across nine studies (Andersson & Haldrup, 2003; Eccleston,
1994, 1995; Jongsma, et al., 2011; Lamoth, et al., 2008; Oosterman, et al., 2012; Pincus, et al., 1998;
Suhr, 2003; Weissman-Fogel, et al., 2011) showed a small, significant effect estimate of 0.43 (95%CI
= 0.15 to 0.70). For chronic fibromyalgia pain, pooled results from four comparisons across three
studies (Glass, et al., 2011; Suhr, 2003; Veldhuijzen, et al., 2012) showed a non-significant effect
estimate of -0.05 (95%CI = -0.45 to 0.34).
Complex Executive Function
Pooled results from seven comparisons, across three studies (Jongsma, et al., 2011; Oosterman, et
al., 2012; Sjøgren, et al., 2005), suggested that chronic pain was associated with poorer Complex
Executive Function. That is, there was a small, significant effect estimate of 0.34 (95%CI = 0.03 to
0.66). One study (Sjøgren, et al., 2005) used the Continuous Reaction Test (CRT), in which the
participant responds rapidly to external stimuli for an extended period of time. The results were
reported in three percentiles - 10th (fastest reaction time), 50th (plotted in Figure 4) and 90th (slowest

ACC
EPTE
D M
ANU
SCR
IPT
ACCEPTED MANUSCRIPT
reaction time). This method of categorising CRT data is recommended for minimising both type I and
type II errors (Elsass, 1986). People with chronic pain who were in the 50th and 90th percentiles on
the CRT performed significantly worse than people in the same percentiles of the control group (p =
.036 and p = .017, respectively). There was no difference in performance between groups for the
10th percentile (p > .05). Two studies (Oosterman, et al., 2012; Oosterman, et al., 2011), provided
results (from the same sample) for the Bourdon Vos test, but the results were not amenable to
simple interpretation as per the forest plots. The participants were asked to circle every group of
four dots to be found in a line containing groups of three, four or five dots, as accurately and quickly
as they could (total of 33 lines). A decrease in attention is indicated by a longer time for completion
and increased omissions in the second seventeen lines of the test, compared to the first seventeen
lines of the test. Decreased attention is also reflected by increased variability in the measures per
row; calculated by comparing the individual row completion times and omissions across the 33 rows.
Oosterman, et al., (Oosterman, et al., 2012; Oosterman, et al., 2011) found that people with chronic
pain took longer overall to complete the test (F[1-63] = 5.28, p < .05, η2 = 0.07), had significantly
more omissions in the second half of the test (p < .05, CP mean [standard deviation] 0.49 [0.43];HC
mean [standard deviation] 0.29 [0.26]) and showed significantly more completion time variance (p <
.05, CP mean [standard deviation] 2.9 [3.1]; HC mean [standard deviation]) 1.8 [1.6]) in keeping with
the pooled data findings. No sensitivity analysis for chronic non-fibromyalgia and fibromyalgia pain
was performed for this pooled group because no studies recruited people with fibromyalgia.
Set Shifting
Pooled results from 12 comparisons, across five studies (Eccleston, 1995; Jongsma, et al., 2011;
Luerding, et al., 2008; Oosterman, et al., 2012; Suhr, 2003), suggested that chronic pain was
associated with impaired Set Shifting. That is, there was a medium, significant effect estimate of
0.57 (95%CI = 0.32 to 0.82).

ACC
EPTE
D M
ANU
SCR
IPT
ACCEPTED MANUSCRIPT
Sensitivity analysis for chronic non-fibromyalgia and fibromyalgia pain
Both chronic non-fibromyalgia and fibromyalgia pain, were associated with poorer Set Shifting. For
chronic non-fibromyalgia pain, pooled results from eight comparisons across four studies (Eccleston,
1995; Jongsma, et al., 2011; Oosterman, et al., 2012; Suhr, 2003) showed a medium, significant
effect estimate of 0.59 (95%CI = 0.26 to 0.92). For chronic fibromyalgia pain, pooled results from
four comparisons across two studies (Luerding, et al., 2008; Suhr, 2003) showed a medium,
significant effect estimate of 0.57 (95%CI = 0.18 to 0.96).
Physiological Outcome measure: Blood Oxygen Level-Dependent (BOLD) activation
Glass et al (2011) reported BOLD outcomes for brain activation during the Go/nogo Test. Healthy
controls had a larger activation in the right precentral gyrus (subtracting signal from people with
chronic pain from signal from healthy controls resulted in a cluster of 338 voxels z = 3.71), right
inferior parietal lobe (111 voxels, z = 3.60), bilateral supplementary motor area and midcingulate
gyrus (309 voxels, z = 3.29), left middle frontal gyrus (105 voxels, z = 3.22) and left putamen (102
voxels, z = 3.83). In contrast, people with chronic pain showed a larger activation in the right inferior
temporal/fusiform gyrus than healthy controls (subtracting signal from healthy controls from signal
from people with chronic pain resulted in a cluster of 100 voxels, z = 3.14). All statistical maps were
corrected for multiple comparisons at cluster level (p<.05). Functional connectivity analysis used a
seed region within the right inferior temporal/fusiform gyrus. During the inhibition task, fibromyalgia
patients exhibited greater connectivity than healthy controls between the seed and i) bilateral
superior/medial frontal gyrus (128 voxels, z=4.08), and ii) the left supplementary motor
area/superior frontal gyrus (135 voxels, z= 3.76).
ACC
EPTE
D M
ANU
SCR
IPT
ACCEPTED MANUSCRIPT
Discussion
We aimed to determine the current evidence for a loss of executive function in people with chronic
pain. We found consistent evidence for small to moderate impairments in people with chronic pain
across all three cognitive components - Response Inhibition, Complex Executive Function and Set
Shifting.
Response Inhibition
We found evidence (n = 15 studies; n = 410 subjects with chronic pain, n = 331 healthy controls) for a
small to moderate impairment in Response Inhibition in people with chronic pain. Two studies also
provided evidence that pain intensity moderated the effect (Eccleston, 1995; Grisart & Plaghki,
1999). Because chronic pain is associated with sensitisation and disinhibition, (Apkarian, et al., 2009;
Baliki, Geha, Apkarian, & Chialvo, 2008; Moseley & Flor, 2012), one might expect a larger effect for
Response Inhibition. One reason we may not have found a larger effect may be because of the
amount of variance between studies. While the Stroop Test (which included the variant - Verbal
Interference Test - used by Jongsma et al., 2011) accounted for 21 of the 31 total comparisons, there
was considerable diversity between studies in the way it was applied and measured. For example,
the Stroop Test was applied in six different ways (Golden, Number count Stroop, Stroop while
sitting, Stroop while walking, Computerised Stroop, and standard Stroop) and within that there were
six variations of the number of stimuli per card (n = 9, 50, 72, 99 and 100, and 3 cards x 12 sets of
words). Similarly, the second most commonly used test for Response Inhibition, a Card Interference
Test(Eccleston, 1994, 1995) was applied in four different ways, between three groups (high and low
pain, and controls) which provided eight comparisons. The amount of variability in study design and
outcomes measured contributed to the significant heterogeneity that was detected for response
time data (Χ2 = 31.00, p = .06) and leads to uncertainty about whether all studies within this group
are estimating the same cognitive component (Higgins & Green, 2008). Of interest, when
heterogeneity was negligible, as for the Response Inhibition number count data sensitivity analysis

ACC
EPTE
D M
ANU
SCR
IPT
ACCEPTED MANUSCRIPT
which compared the outcomes from 3 x Golden Stroop and 1 x Verbal Interference Test (see
Supplemental Online Files, Figure 4), a significant, moderate effect for Response Inhibition was
found. We were surprised to find such a diversity of methods and outcomes for an ostensibly
standard neuropsychological test as the Stroop Test. Perhaps, expert consensus about the best way
to apply the Stroop Test may help to provide comparable outcomes in the future, and allow
researchers to tease out the qualities it estimates.
Complex Executive Function
We found evidence (n = 10 studies; n = 556 subjects with chronic pain, n = 1565 healthy controls) for
a small impairment in Complex Executive Function in people with chronic pain. A range of
components under the umbrella of Complex Executive Function which included planning, visuo-
construction, sustained attention, abstract thought, problem solving and decision making (Miyake &
Friedman, 2012; Miyake, Friedman, et al., 2000) were tested by the nine different tests that were
used. This diversity contributed to the significant heterogeneity detected for number count data (Χ2
= 40.49, p < .001). To find a consistent, small effect estimate across such a range of tests suggests
that test differences may not be as important as group differences. It also raises the possibility that
larger differences between groups for specific components might have been obscured because the
effect was diluted across the variety of components that composed each test. However, the
relevance of such suggestions is open to question, when considered in light of the high risk of bias of
included studies. In order to advance our knowledge in this area, it may be helpful to discriminate
specific deficits within and between different groups; one way to do this might be to examine the
predictive ability of specific Complex Executive Function components to test outcomes. For example,
a recent study concluded that planning is the strongest predictor of total raw scores for the Zoo Map
Test (Oosterman, Wijers, & Kessels, 2013). Similar studies may help to unravel some of the
complexities associated with testing and interpreting outcomes from tests of Complex Executive
Function.
ACC
EPTE
D M
ANU
SCR
IPT
ACCEPTED MANUSCRIPT
Set shifting
We found evidence (n = 9 studies; n = 447 subjects with chronic pain, n = 502 healthy controls) for a
small to moderate impairment in Set Shifting in people with chronic pain. The majority of
comparisons (13 out of 19) used a version of the Trail-making Test (Part A or B) and thus provided
the most homogenous dataset in the review. Such evidence suggests we can have confidence in
group differences, because the influence of many of the test variables is removed. However, in light
of the high risk of bias of included studies, and potential moderators of the effect, we remain
circumspect in relation to interpreting the data. It is clear, however, that people with chronic pain
were both slower for Parts A and B of the test and made more errors completing Part B than healthy
controls. Set shifting is the term used to describe the ability to shift back and forth between tasks
(Miyake, Emerson, & Friedman, 2000) and is one of the processes considered to constitute
psychological flexibility (McCracken, 2013). Lack of psychological flexibility has been shown to
mediate the improvements achieved using acceptance commitment therapy in people with chronic
pain (Wicksell, et al., 2013; Wicksell, Olsson, & Hayes, 2010). Because effective clinical use of
treatments such as acceptance commitment therapy are predicted when there is adequate matching
of treatment methods to specific patient problems (Pincus & McCracken, 2013), further insights into
the relationship between the construct of psychological flexibility and test outcomes of Set Shifting
would be clinically relevant.
Physiological outcomes
Our interpretation of changes in neural activation and functional connectivity that might underpin
changes in executive function between people with chronic pain and healthy controls is limited by
the paucity of current literature on the topic. Not-withstanding this, Glass, et al., (2011), presented

ACC
EPTE
D M
ANU
SCR
IPT
ACCEPTED MANUSCRIPT
results for a Go/nogo Test which support the concept of altered cortical activity in association with
chronic pain (Baliki, et al., 2008; Farmer, et al., 2011). Adverse stimuli are effective triggers of
learning, and such altered cortical activity might reflect memory consolidation and long-term
potentiation brought about by the intrusion and reiteration of danger messages over time
(McAfoose & Baune, 2009). Further, the greater connectivity exhibited by people with chronic pain
in bilateral superior/medial frontal gyrus whilst they perform the Go/nogo Test is consistent with the
idea that the emergence of chronic pain is associated with progressive restructuring of neural
network connectivity (Baliki, et al., 2008). Greater connectivity between the seed region and the left
medial frontal gyrus has also been reported in people with PTSD during working memory tests
(Daniels, et al., 2010). There it is interpreted as reflecting up-regulation of the salience network,
recognised clinically as the phenomenon of hyperarousal (Daniels, et al., 2010).
Sensitivity Analyses between chronic non-fibromylagia and fibromyalgia pain
Of the recognised chronic pain conditions, fibromyalgia is most fervently linked to impaired
executive function as evidenced by the widely used term fibro-fog
(http://www.fmnetnews.com/free-articles/enews-alert-samples/fibro-fog; Glass, et al., 2011). As
such, one might predict that the sensitivity analyses, which compared chronic non-fibromyalgia pain
to controls and chronic fibromyalgia pain to controls, would reveal more executive function
impairment in the latter comparison. This was the case for Complex Executive Function (number
count data): chronic non-fibromyalgia pain showed a non-significant effect estimate of -0.38 (95%CI
= -0.83 to 0.07); chronic fibromyalgia pain showed a significant effect estimate of -0.57 (95%CI = -
0.94 to -0.20). However, this was not the case for the remaining outcomes of the sensitivity
analyses: both groups performed significantly worse than controls on Set Shifting (response time
data) and had comparable effect estimates. Further, for the outcomes of Set Shifting (number count
data) and Response Inhibition (response time data) the chronic non-fibromyalgia group performed

ACC
EPTE
D M
ANU
SCR
IPT
ACCEPTED MANUSCRIPT
significantly worse than controls, whereas the chronic fibromyalgia group had test outcomes
equivalent to controls. There were fewer subject numbers in the chronic fibromyalgia group for
these two comparisons (Set Shifting [number count data]: non-fibromyalgia n = 199, fibromyalgia n =
111 and Response Inhibition [response time data]: non-fibromyalgia n = 210, fibromyalgia n = 119),
but even still, the results challenge the widespread assumption that people with fibromyalgia are
more cognitively affected than those without. Additionally, it is worth noting that half of the results
in the analysis supportive of a greater impairment in fibromyalgia patients - Complex Executive
Function (response time data) - came from the same sample (n = 3), and even the same test (Clock
Face Test; scored three different ways).
Unfortunately, the literature does not provide the opportunity to make a head-to-head comparison
between different painful conditions, or even between chronic non-fibromyalgia pain and
fibromyalgia pain, because they are seldom included in, and compared within, the one cohort (n = 2
studies). This would seem a promising area of future work however, because, if differences do exist,
they might be relevant for our understanding of the underlying mechanisms of the various
conditions.
Risk of Bias
The risk of bias was moderate to high across the entire evidence base, with the biggest risk of bias
coming from the lack of statistical power due to small sample sizes. Remarkably, only two studies
made a priori sample calculations and it is well recognised that small samples elevate the chance of
both false negatives and false positives. Several other sources of bias are worthy of special mention.
First, unclearly described methods of recruitment in 17 studies (Andersson & Haldrup, 2003;
Apkarian, et al., 2004; Can & Gencay-Can, 2012; Eccleston, 1994, 1995; Glass, et al., 2011; Grace, et
al., 1999; Jongsma, et al., 2011; Lamoth, et al., 2008; Luerding, et al., 2008; Oosterman, et al., 2012;
Oosterman, et al., 2011; Park, et al., 2001; Pincus, et al., 1998; Suhr, 2003; Veldhuijzen, et al., 2006;

ACC
EPTE
D M
ANU
SCR
IPT
ACCEPTED MANUSCRIPT
Walteros, et al., 2011), and lack of serial recruitment in five more (Lamoth, et al., 2008; Roldan-
Tapia, et al., 2007; Veldhuijzen, et al., 2012; Verdejo-García, et al., 2009; Weiner, et al., 2006;
Weissman-Fogel, et al., 2011) raise the risk of preferential selection of patients with cognitive
impairment over patients without. Equally important is the possibility of preferential selection of
healthy volunteers without cognitive impairment. That is, the healthy pain-free population includes
some individuals with cognitive impairment and to exclude them might result in a false positive
comparison between the two groups. Second, only nine of the studies reported using the same
screening for patients and controls (Glass, et al., 2011; Lamoth, et al., 2008; Pincus, et al., 1998;
Roldan-Tapia, et al., 2007; Sjøgren, et al., 2005; Veldhuijzen, et al., 2006; Walteros, et al., 2011;
Weiner, et al., 2006; Weissman-Fogel, et al., 2011), which clearly raises the risk of false inclusions,
but, presumably, would reduce power of the design to detect differences, rather than elevate it.
Third, although 15 of the studies reported screening for psychiatric disorders (Apkarian, et al., 2004;
Can & Gencay-Can, 2012; Glass, et al., 2011; Grace, et al., 1999; Grisart & Plaghki, 1999; Lee, et al.,
2010; Luerding, et al., 2008; Oosterman, et al., 2012; Oosterman, et al., 2011; Park, et al., 2001;
Roldan-Tapia, et al., 2007; Veldhuijzen, et al., 2006; Verdejo-García, et al., 2009; Walteros, et al.,
2011; Weissman-Fogel, et al., 2011), the risk that the effects may reflect comorbid psychiatric
disorders such as post-traumatic stress disorder, anxiety, and/or depression remains
(Demyttenaere, et al., 2007; Sharp & Harvey, 2001). Similarly, the effects of sleep have not been
accounted for in a systematic manner. Finally, studies of executive function in people with chronic
pain do not tend to control for medication, although 17 studies reported the types and use of
medication. It would seem possible that medications could impart a systematic effect between the
groups.
Strengths and weaknesses of the current study
We followed a rigorous process to ensure we collected all relevant studies (see Berryman, et al.,
2013), and we did not exclude any studies on the grounds of low quality, although, importantly we

ACC
EPTE
D M
ANU
SCR
IPT
ACCEPTED MANUSCRIPT
did evaluate the data in light of the methodological quality. Heterogeneity of experimental designs
and test applications led us to commit to an a priori approach of pooling data into outcomes and
cognitive component groups, based on the theoretical understanding of executive function
described by Miyake (Miyake, Friedman, et al., 2000). This approach conforms to the gold standard
recommendations for systematic reviews (Higgins & Green, 2008). We also pooled data regardless
of specific diagnosis. Both methodological measures improve confidence in the results, but could
also dilute outcome-specific or condition-specific effects.
While the current evidence suggests an impairment of executive function people with chronic pain,
important caveats exist. First, testing executive function is inherently difficult and faces an
experimental paradox – we want to test the ability of the subject to perform an unstructured,
volitional task under novel conditions, yet we ask them to do precisely the opposite by testing in a
controlled laboratory experiment. Second, executive function is a non-unitary process and many
cognitive processes are engaged in one task, for example: the Stroop Test will not only involve the
over-ride of a usual response, but draws on recognition of common symbols and long term memory.
Thus, we are not able to isolate processes that may be more or less affected in people with chronic
pain. We also remain open to the idea that behavioural tests of executive function may need more
rigorous validation.
Confounders
One issue that seems to be overlooked in available studies on executive function in chronic pain is
that of the moderators of executive function. For example, sleep quality and quantity, pain duration
and intensity, medication use, inflammatory profile and education level, are all confounders that are
seldom controlled for. Improved recording and reporting of such variables, community sampling,
careful consideration of comorbid conditions, integration with sleep studies and assessment of
inflammatory biomarkers, may be required. We would also suggest that integrative accounts of
behavioural and physiological outcomes would assist interpretation of results.

ACC
EPTE
D M
ANU
SCR
IPT
ACCEPTED MANUSCRIPT
Acknowledgements
We would like to thank several authors who responded quickly and generously to enquiries for data
and/or assisted with interpretation: Christopher Eccleston, Ralf Luerding, Gordon Asmundson, Ali
Khatibi, Claudine Lamoth. We would also like to thank Judy Veldhuijzen for her ongoing advice on
various aspects of this topic and Flavia Di Pietro for her assistance in interpreting the fMRI results.
Conflicts of interest and source of funding
There are no conflicts of interest
CB and KJB are supported by post-graduate scholarships from the Australian Government. AT is
supported by a President’s Scholarship from the University of South Australia. TRS supported by the
Canadian Institutes of Health Research Postdoctoral Training Fellowship [ID 223354; 2011-2014] and
the National Helath and Medical Research Council of Australia Early Career Fellowship [ID 105 4041;
2014-2018]. GLM is supported by a Principal Research Fellowship from the National Health and
Medical Research Council of Australia [ID 106179]. This study supported by NHMRC Project Grant [ID
1047317].
ACC
EPTE
D M
ANU
SCR
IPT
ACCEPTED MANUSCRIPT
References
Andersson, G., & Haldrup, D. (2003). Personalised pain words and stroop interference in chronic pain patients. European Journal of Pain, 7, 431-38.
Apkarian, A., Baliki, M., & Geha, P. (2009). Towards a theory of chronic pain. Progress in Neurobiology, 87, 81-97.
Apkarian, A., Sosa, Y., Krauss, B., Thomas, P., Fredrickson, B., Levy, R., Harden, R., & Chialvo, D. (2004). Chronic pain patients are impaired on an emotional decision-making task. Pain, 108, 129 - 36.
Asmundson, G., Carleton, R., & Ekong, J. (2005a). Dot-probe evaluation of selective attentional processing of pain cues in patients with chronic headaches. Pain, 114, 250-56.
Baliki, M., Geha, P., Apkarian, A., & Chialvo, D. (2008). Beyond Feeling: Chronic Pain Hurts the Brain, Disrupting the Default-Mode Network Dynamics. The Journal of Neuroscience, 28, 1398-403.
Banich, M. (2009). Executive function: The search for an integrated account. Current Directions in Psychological Science, 18, 89 - 94.
Berryman, C., Stanton, T., Bowering, K., Tabor, A., McFarlane, A., & Moseley, G. (2013). Evidence for working memory deficits in chronic pain: A systematic review and meta-analysis. Pain, 154, 1181-96.
Birrell, J., & Brown, V. (2000). Medial frontal cortex mediates perceptual attentional set shifting in the rat. Journal of Neuroscience, 20, 4320-24.
Bowie, C., & Harvey, P. (2006). Administration and interpretation of the trail making test. Nature Protocols, 1, 2277-81.
Butler, D., & Moseley, G. (2003). Explain Pain. Adelaide: Noigroup. Can, S. S., & Gencay-Can, A. (2012). Assessment of cognitive function in patients with fibromyalgia
using the clock drawing test. Journal of Musculoskeletal Pain, 20, 177-82. Castel, A., Cascon, R., Padrol, A., Sala, J., Aragones, N., Perez, M., & Rull, M. (2009). Cognitive
performance and memory complaints: Differences between chronic pain patients and healthy controls. European Journal of Pain, 13, S219.
Cohen, J. (1998). Statistical power analysis for the behavioral sciences. Hillsdale New Jersey: Lawrence Erlbaum Associates.
Crombez, G., Eccleston, C., Baeyens, F., Van Houdenhove, B., & Van den Broeck, A. (1999). Attention to chronic pain is dependent upon pain-related fear. Journal of Psychosomatic Research, 47, 403-10.
Crombez, G., Van Ryckeghem, D. M. L., Eccleston, C., & Van Damme, S. (2013). Attentional bias to pain-related information: A meta-analysis. Pain, 154 (4), 497-510.
Daniels, J., McFarlane, A., Bluhm, R., Moores, K., Clark, R., Shaw, M., Williamson, P., Densmore, M., & Lanius, R. (2010). Switching between executive and default mode networks in posttraumatic stress disorder: Alterations in functional connectivity. Journal of Psychiatry and Neuroscience, 35, 258-66.
Dear, B., Titov, N., Perry, K., Johnston, L., Wootton, B., Terides, M., Rapee, R., & Hudson, J. (2013). The pain course: A randomised controlled trial of a clinician-guided Internet delivered cognitive behaviour therapy program for managing chronic pain and emotional well-being. Pain, 154, 942-50.
Demyttenaere, K., Bruffaerts, R., Lee, S., Posada-Villa, J., Kovess, V., Angermeyer, M., Levinson, D., de Girolamo, G., Nakane, H., Mneimneh, Z., Lara, C., de Graaf, R., Scott, K., Gureje, O., Stein, D., Haro, J., Bromet, E., Kessler, R., Alonso, J., & Von Korff, M. (2007). Mental disorders among persons with chronic back or neck pain: Results from the world mental health surveys. Pain, 129, 332-42.
Dudley, R., Kuyken, W., & Padesky, C. (2011). Disorder specific and trans-diagnostic case conceptualisation. Clinical Psychology Review, 31, 213-24.

ACC
EPTE
D M
ANU
SCR
IPT
ACCEPTED MANUSCRIPT
Duncan, J., Johnson, R., Swales, M., & Freer, C. (1997). Frontal lobe deficits after head injury: Unity and diversity of function. Cognitive Neuropsychology, 14, 713-41.
Duncan, J., & Owen, A. (2000). Common regions of the human frontal lobe recruited by diverse cognitive demands. Trends in Neurosciences, 23, 475-83.
Eccleston, C. (1994). Chronic pain and attention: A cognitive approach. British Journal of Clinical Psychology, 33, 535 - 47.
Eccleston, C. (1995). Chronic pain and distraction: An experimental investigation into the role of sustained and shifting attention in the processing of chronic persistent pain. Behaviour Research and Therapy, 33, 391 - 405.
Eccleston, C., & Crombez, G. (1999). Pain demands attention: A cognitive–affective model of the interruptive function of pain. Psychological Bulletin, 125, 356-66.
Eccleston, C., Morley, S., & Williams, A. (2013). Psychological approaches to chronic pain management: evidence and challenges. British Journal of Anaesthesia, 111, 59-63.
Elliot, R. (2003). Executive functions and their disorders. British Medical Bulletin, 65, 49-59. Elsass, P. (1986). Continuous reaction times in cerebral dysfunction. Acta Neurologica Scandinvica,
73, 225-46. Farmer, M., Baliki, M., & Apkarian, A. (2012). A dynamic network perspective of chronic pain.
Neuroscience Letters, 520, 197-203. Farmer, M., Baliki, M., Chanda, M., Parks, E., Baliki, M., Apkarian, A., & Schaeffer, A. (2011). Brain
Functional and Anatomical Changes in Chronic Prostatitis/Chronic Pelvic Pain Syndrome. The Journal of Urology, 186, 117-24.
Fisher, P. (2002). A Chronic Pain Management Manual: A guide for those who suffer and those who treat pain. S.I: Writer's Club Press.
Funahashi, S. (2001). Neuronal mechanisms of executive control by the prefrontal cortex. Neuroscience Research, 39, 147-65.
Glass, J., Williams, D., Fernandez-Sanchez, M.-L., Kairys, A., Barjola, P., Heitzeg, M., Clauw, D., & Schmidt-Wilcke, T. (2011). Executive function in chronic pain patients and healthy controls: Different cortical activation during response inhibition in fibromyalgia. The Journal of Pain, 12, 1219-29.
Grace, G., Nielson, W., Hopkins, M., & Berg, M. (1999). Concentration and memory deficits in patients with fibromyalgia syndrome. Journal of Clinical and Experimental Neuropsychology, 21, 477 - 87.
Grisart, J., & Plaghki, L. (1999). Impaired selective attention in chronic pain patients. European Journal of Pain, 3, 325-33.
Grisart, J., Van der Linden, M., & Bastin, C. (2007). The contribution of recollection and familiarity to recognition memory performance in chronic pain patients. Behaviour Research and Therapy, 45, 1077-84.
Grisart, J., Van der Linden, M., & Masquelier, E. (2002). Controlled processes and automaticity in memory functioning in fibromyalgia patients: Relation with emotional distress and hypervigilance. Journal of Clinical and Experimental Neuropsychology, 24, 994 - 1009.
Hayes, S., & Strosahl, E. (1999). Acceptance and commitment therapy: A experiential approach to behavior change. New York: Guildford Press.
Higgins, J., & Green, S. (2008). Cochrane Handbook for Systematic Reviews of Interventions; The Cochrane Collaboration. Chichester, UK: John Wiley and Sons Ltd.
Hofmann, W., Schmeichel, B., & Baddeley, A. (2012). Executive functions and self regulation. Trends in Cognitive Sciences, 16, 174-80.
Holzel, B., Lazar, S., Gard, T., Schuman-Olivier, Z., Vago, D., & Ott, U. (2011). How does mindfulness meditation work? Proposing mechanisms of action from a conceptual and neural perspective. Perspectives on psychological science, 6, 537-59.
Hughes, C., & Graham, A. (2002). Measuring executive functions in childhood: Problems and solutions? Child and Adolescent Mental Health, 7, 131-42.

ACC
EPTE
D M
ANU
SCR
IPT
ACCEPTED MANUSCRIPT
International Association for the Study of Pain. (1986). Introduction. Pain, 24, S5. Jensen, M. (2011). Psychosocial approaches to pain management: An organizational framework.
Pain, 152, 717-25. Jongsma, M. L. A., Postma, S. A. E., Souren, P., Arns, M., Gordon, E., Vissers, K., Wilder-Smith, O., van
Rijn, C. M., & van Goor, H. (2011). Neurodegenerative Properties of Chronic Pain: Cognitive Decline in Patients with Chronic Pancreatitis. PLoS ONE, 6, e23363.
Jurado, M., & Rosselli, M. (2007). The elusive nature of executive functions: a review of our current understandings. Neuropsychological Review, 17, 213 - 33.
Kaplan, G., Sengor, N., Gurvit, H., Genc, I., & Guzelis, C. (2006). A composite neural network model for perseveration and distractibility in the Wisconsin card sorting test. Neural Networks, 19, 375-87.
Kaye, A., & Urman, R. (2011). Understanding Pain: what you need to know to take control. Santa Barbara California: Praeger/ABC-CLIO.
Khatibi, A., Deghani, M., Sharpe, L., Asmundson, G., & Puretemad, H. (2009). Selective attention towards painful faces among chronic pain patients: Evidence from a modified version of the dot probe test. Pain, 142, 42-47.
Lamoth, C., Stins, J., Pont, M., Kerckhoff, F., & Beek, P. (2008). Effects of attention on the control of locomotion in individuals with chronic low back pain. Journal of NeuroEngineering and Rehabilitation, 5, 1-8.
Lee, D., Pendleton, N., Tajar, A., O'Neill, T., O'Connor, D., Bartfai, G., Boonen, S., Casanueva, F., Finn, J., Forti, G., Giwercman, A., Han, T., Huhtaniemi, I., Kula, K., Lean, M., Punab, M., Silman, A., Vanderschueren, D., Moseley, C., Wu, F., & McBeth, J. (2010). Chronic widespread pain is associated with slower cognitive processing speed in middle-aged and older European men. Pain, 151, 30-36.
Legrain, V., Perchet, C., & Garcia-Larrea, L. (2009). Involuntary orienting of attention to pain. Neural and behavioural signatures. Journal of Neurophysiology, 102, 2423-34.
Legrain, V., Van Damme, S., Eccleston, C., Davis, K., Seminowicz, D., & Crombez, G. (2009). A neurocognitive model of attention to pain: Behavioral and neurimaging evidence. Pain, 144, 230-32.
Lezak, M., Howieson, D., & Loring, D. (2004). Neuropsychological Assessment. New York: Oxford University Press.
Logue, S., & Gould, T. (2013). The neural and genetic basis of executive function: Attention, cognitive flexibility, and response inhibition. Pharmacology, Biochemistry and Behavior.
Luerding, R., Weigand, T., Bogdahn, U., & Schmidt-Wilcke, T. (2008). Working memory performance is correlated with local brain morphology in the medial frontal and anterior cingulate cortex in fibromyalgia patients: structural correlates of pain–cognition interaction. Brain, 131, 3222-31.
Luoto, S., Taimela, S., Hurri, H., & Alaranta, H. (1999). Mechanisms explaining the association between low back trouble and deficits in information processing. A controlled study with followup. Spine, 24, 251-61.
McAfoose, J., & Baune, B. T. (2009). Evidence for a cytokine model of cognitive function. Neuroscience & Biobehavioral Reviews, 33, 355-66.
McAlonon, K., & Brown, V. (2003). Orbital prefrontal cortex mediates reversal learning and not attentional set shifting in the rat. Behavioral Brain Research, 2003, 97-103.
McCracken, L. (2013). Committed Action: An Application of the Psychological Flexibility Model to Activity Patterns in Chronic Pain. The Journal of Pain, 14, 828-35.
McCracken, L., & Eccleston, C. (2005). A prospective study of acceptance of pain and patient functioning with chronic pain. Pain, 118, 164 - 69.
McLeod, c., Mathews, A., & Tata, P. (1986). Attentional bias in emotional disorders. Journal of Abnormal Psychology, 95, 15-20.

ACC
EPTE
D M
ANU
SCR
IPT
ACCEPTED MANUSCRIPT
Melkumova, K., Podchufarova, E., & Yakhno, N. (2011). Characteristics of cognitive functions in patients with chronic spinal pain. Neuroscience and Behavioral Physiology, 41, 20-24.
Miyake, A., Emerson, M., & Friedman, M. (2000). Assessment of executive functions in clinical settings: Problems and recommendations. Seminars in Speech and Language, 21, 169 - 86.
Miyake, A., & Friedman, N. (2012). The nature and organisation of individual differences in executive functions: Four general conclusions. Current Directions in Psychological Science, 21, 8-14.
Miyake, A., Friedman, N., Emerson, M., Witzki, A., Howerter, A., & Wager, T. (2000). The unity and diversity of executive functions and their contributions to complex "frontal lobe tasks": A latent variable analysis. Cognitive Psychology, 41, 49 - 100.
Moher, D., Liberati, A., Tetzlaff, J., & Altman, D. (2009). Preferred Reporting Items for Systematic Reviews and Meta-Analyses: The PRISMA Statement. PLoS Med, 6, e1000097.
Morley, S., Eccleston, C., & Williams, A. (1999). Systematic review and meta-analysis of randomized controlled trials of cognitive behaviour therapy and behaviour therapy for chronic pain in adults, excluding headache. Pain, 80, 1-13.
Moseley, G. (2003). A pain neuromatrix approach to patients with chronic pain. Manual Therapy, 8, 130-40.
Moseley, G., & Flor, H. (2012). Targeting cortical representations in the treatment of chronic pain: A review. Neurorehabilitation and Neural Repair, 26, 646 - 52.
Nes, L., Roach, A., & Segerstrom, S. (2009). Executive functions, self-regualtion and chronic pain: a review. Annals of Behavioral Medicine, 37, 173-83.
Oosterman, J., Derksen, L., Van Wijck, A., Kessels, R., & Veldhuijzen, D. (2012). Executive and attentional functions in chronic pain: Does performance decrease with increasing task load? Pain Research and Management, 3, 159-65.
Oosterman, J., Derksen, L., Van Wijck, A., Veldhuijzen, D., & Kessels, R. (2011). Memory functions in chronic pain: Examining contributions of attention and age to test performance. Clinical Journal of Pain, 27, 70-75.
Oosterman, J., Wijers, M., & Kessels, R. (2013). Planning or something else? Examining neuropsychological predictors of zoo map performance. Applied Neuropsychology: Adult, 20, 103-09.
Park, D. C., Glass, J. M., Minear, M., & Crofford, L. J. (2001). Cognitive function in fibromyalgia patients. Arthritis & Rheumatism, 44, 2125-33.
Pickering, G., Salimani, R., & Dubray, C. (2010). Cognitive impact of post-herpetic neuropathic pain in older persons. European Journal of Pain Supplements, 4, 86.
Pincus, T., Fraser, L., & Pearce, S. (1998). Do chronic pain patients 'Stroop' on pain stimuli? The British Journal of Clinical Psychology, 37, 49-58.
Pincus, T., & McCracken, L. (2013). Psychological factors and treatment opportunities in low back pain. Best Practice & Research Clinical Rheumatology, 27, 625-35.
RefWorks. Ann Arbor Michigan: Proquest LLC Roldan-Tapia, L., Canovas-Lopez, R., Cimdevilla, J., & Valverde, M. (2007). Cognition and perception
deficits in fibromyalgia and rheumatoid arthritis. Rheumatology Clinics, 3, 101-09. Seminowicz, D., & Davis, K. (2007). Pain Enhances Functional Connectivity of a Brain Network Evoked
by Performance of a Cognitive Task. Journal of Neurophysiology, 97, 3651-59. Sharp, T. J., & Harvey, A. G. (2001). Chronic pain and posttraumatic stress disorder: Mutual
maintenance? Clinical Psychology Review, 21, 857-77. Sjøgren, P., Christrup, L. L., Petersen, M. A., & Højsted, J. (2005). Neuropsychological assessment of
chronic non-malignant pain patients treated in a multidisciplinary pain centre. European Journal of Pain, 9, 453-62.
Snider, B., Asmundson, G., & KC, W. (1999). Automatic and strategic processing of threat cues in patients with chronic pain: A modified stroop evaluation. The Clinical Journal of Pain, 16, 144-54.
ACC
EPTE
D M
ANU
SCR
IPT
ACCEPTED MANUSCRIPT
Suhr, J. A. (2003). Neuropsychological impairment in fibromyalgia: Relation to depression, fatigue, and pain. Journal of Psychosomatic Research, 55, 321-29.
The Nordic Cochrane Centre. (2011). Review Manager. In (5.1 ed.). Copenhagen: The Cochrane Collaboration.
Tombaugh, T. (2004). Trail making test A and B: Normative data stratified by age and education. Archives of Clinical Neuropsychology, 19, 203-14.
Tracey, I., & Bushnell, M. (2009). How Neuroimaging Studies Have Challenged Us to Rethink: Is Chronic Pain a Disease? The Journal of Pain, 10, 1113-20.
Turk, D., & Gatchell, R. (2002). Psychological Approaches to Pain Management: A Practitioner's Handbook. In (Second edition ed.). New York, New York: Guilford Press.
Van Daame, S., Legrain, V., Vogt, J., & Crombez, G. (2010). Keeping pain in mind: A motivational account of attention to pain. Neuroscience and Biobehvioural Reviews, 34, 204-13.
Veldhuijzen, D., Sondaal, S., & Oosterman, J. (2012). Intact cognitive inhibition in patients with fibromyalgia but evidence of declined processing speed. The Journal of Pain, 13, 507-15.
Veldhuijzen, D., van Wijck, A., Wille, F., Verster, J., Kenemans, J., Kalkman, C., Olivier, B., & Volkerts, E. (2006). Effect of chronic nonmalignant pain on highway driving performance. Pain, 122, 28-35.
Verdejo-García, A., López-Torrecillas, F., Calandre, E., Delgado-Rodríguez, A., & Bechara, A. (2009). Executive function and decision-making in women with Fibromyalgia. Archives of Clinical Neuropsychology, 24, 113-22.
Walteros, C., Sanchez-Navarro, J., Munoz, M., Martinez-Selva, J., Chialvo, D., & Montoya, P. (2011). Altered associative learning and emotional decision making in fibromyalgia. Journal of Psychosomatic Research, 70, 294-301.
Wand, B., Parkitny, L., O'Connell, N., Luomajoki, H., McAuley, J., Thacker, M., & Moseley, G. (2011). Cortical changes in chronic low back pain: Current state of the art and implications for clinical practice. Manual Therapy, 16, 15-20.
Wand, B., Parkitny, L., O’Connell, N., Luomajoki, H., McAuley, J., Thacker, M., & Moseley, G. (2011). Cortical changes in chronic low back pain: Current state of the art and implications for clinical practice. Manual Therapy, 16, 15-20.
Weiner, D. K., Rudy, T. E., Morrow, L., Slaboda, J., & Lieber, S. (2006). The Relationship Between Pain, Neuropsychological Performance, and Physical Function in Community-Dwelling Older Adults with Chronic Low Back Pain. Pain Medicine, 7, 60-70.
Weissman-Fogel, I., Moayedi, M., Tenenbaum, H. C., Goldberg, M. B., Freeman, B. V., & Davis, K. D. (2011). Abnormal cortical activity in patients with temporomandibular disorder evoked by cognitive and emotional tasks. Pain, 152, 384-96.
Wicksell, R., Kemani, M., Jensen, K., Kosek, E., Kadetoff, D., Sorjonen, K., Ingvar, M., & Olsson, G. (2013). Acceptance and commitment therapy for fibromyalgia: A randomized controlled trial. European Journal of Pain, 17, 599-611.
Wicksell, R., Olsson, G., & Hayes, S. (2010). Psychological flexibility as a mediator of improvement in acceptance and commitment therapy for patients with chronic pain following whiplash. European Journal of Pain, 14, 1059.e1-59.e11.
Wiech, K., Seymour, B., Kalisch, R., Stephan, K., Koltzenburg, M., Driver, J., & Dolan, R. (2005). Modulation of pain processing in hyperalgesia by cognitive demand. NeuroImage, 27, 59-69.
Williams, A. C., Eccleston, C., & Morley, S. (2012). Psychological therapies for the management of chronic pain (excluding headaches) in adults (Review). The Cochrane Database of Systematic Reviews, Art. No.: CD007407.

ACC
EPTE
D M
ANU
SCR
IPT
ACCEPTED MANUSCRIPT
Figure Legends
Figure 1. Flow chart of articles through the study.
n=number
Figure 2. Number or sum correct outcomes for executive function.
Legend: FM = Fibromyalgia; RA = Rheumatoid Arthritis; CP = Chronic Pain; HC = Healthy Controls; SD = standard deviation; CI = confidence interval; IS = Incongruent Stroop Test; IMSIT = Incongruent Multisource Interference Test; Shulman = Shulman score for the clock face test (sum of correct components/5); Sunderland = Sunderland score for the clock face test (sum of correct components/10); Watson = Watson score for the clock face test (sum of errors/7); WCST = Wisconsin Card Sorting Test; Zoo 1 = Card 1 of Zoo Map Test (unstructured path); Zoo 2 = Card 2 of Zoo Map Test (structured path).
Figure 3. Response time outcomes for executive function.
Legend: FM = Fibromyalgia; RA = Rheumatoid Arthritis; CP = Chronic Pain; HC = Healthy Controls; SD = standard deviation; CI = confidence interval; S = Stroop Test; IS = Incongruent Stroop Test; IMSIT = Incongruent Multisource Interference Test; NCS = Number Count Stroop Test; Comp S = Computerised Stroop; high = high intensity pain group; low = low intensity pain group; easy = easy task; hard = hard task; T1 = task one; Zoo 1 = Card 1 of the Zoo Map Test (unstructured path); Zoo 2 = Card 2 of the Zoo Map Test (structured path); Maze A = First trial of Maze Test; Maze B = Second trial of Maze Test; TMT a = Trail-making Test A; TMTb = Trail-making Test B; Sw = Switching condition of the Card Interference Test
Figure 4. Supplemental Online File. Sensitivity analysis of response inhibition for number count or sum correct data, accuracy results removed.
Legend: FM = Fibromyalgia; RA = Rheumatoid Arthritis; CP = Chronic Pain; HC = healthy controls; SD = standard deviation; CI = confidence interval.
Figure 5. Supplemental Online File. Sensitivity analysis of number count or sum correct data for non-fibromyalgia and healthy control groups.
Legend: RA = Rheumatoid Arthritis; Non-FM = non-fibromyalgia group; HC = healthy controls; SD = standard deviation; CI = confidence interval; Zoo 1 = Card 1 of Zoo Map Test (unstructured path); Zoo 2 = Card 2 of Zoo Map Test (structured path); WCST = Wisconsin Card Sorting Test.
Figure 6. Supplemental Online File. Sensitivity analysis of number count or sum correct data for fibromyalgia and healthy control groups.
Legend: FM = Fibromyalgia; HC = Healthy Controls; SD = standard deviation; CI = confidence interval; IS = Incongruent Stroop Test; IMSIT = Incongruent Multisource Interference Test; WCST = Wisconsin Card Sorting Test; Shulman = Shulman score for the clock face test (sum of correct components/5); Sunderland = Sunderland score for the clock face test (sum of correct components/10); Watson = Watson score for the clock face test (sum of errors/7).
Figure 7. Supplemental Online File. Sensitivity analysis of response time data for non-fibromyalgia and healthy control groups.
Legend: Non-FM = Non Fibromyalgia; HC = Healthy Controls; SD = standard deviation; CI = confidence interval; S = Stroop Test; NCS = Number Count Stroop Test; Comp S = Computerised Stroop Test; high = high intensity pain group; low = low intensity pain group; easy = easy task; hard = hard task; T1 = task one; Zoo 1 = Card 1 of the Zoo Map Test (unstructured path); Zoo 2 = Card 2 of the Zoo Map Test (structured path); Maze A = First trial of Maze Test; Maze B = Second trial of Maze Test; TMT a = Trail-making Test A; TMTb = Trail-making Test B; Sw = Switching condition of the Card Interference Test
Figure 8. Supplemental Online File. Sensitivity analysis of response time data for fibromyalgia and healthy control groups.

ACC
EPTE
D M
ANU
SCR
IPT
ACCEPTED MANUSCRIPT
Legend: FM = Fibromyalgia; HC = Healthy Controls; SD = standard deviation; CI = confidence interval; IS = Incongruent Stroop Test; IMSIT = Incongruent Multisource Interference Test; S = Stroop Test; TMT a = Trail-making Test A; TMTb = Trail-making Test B.
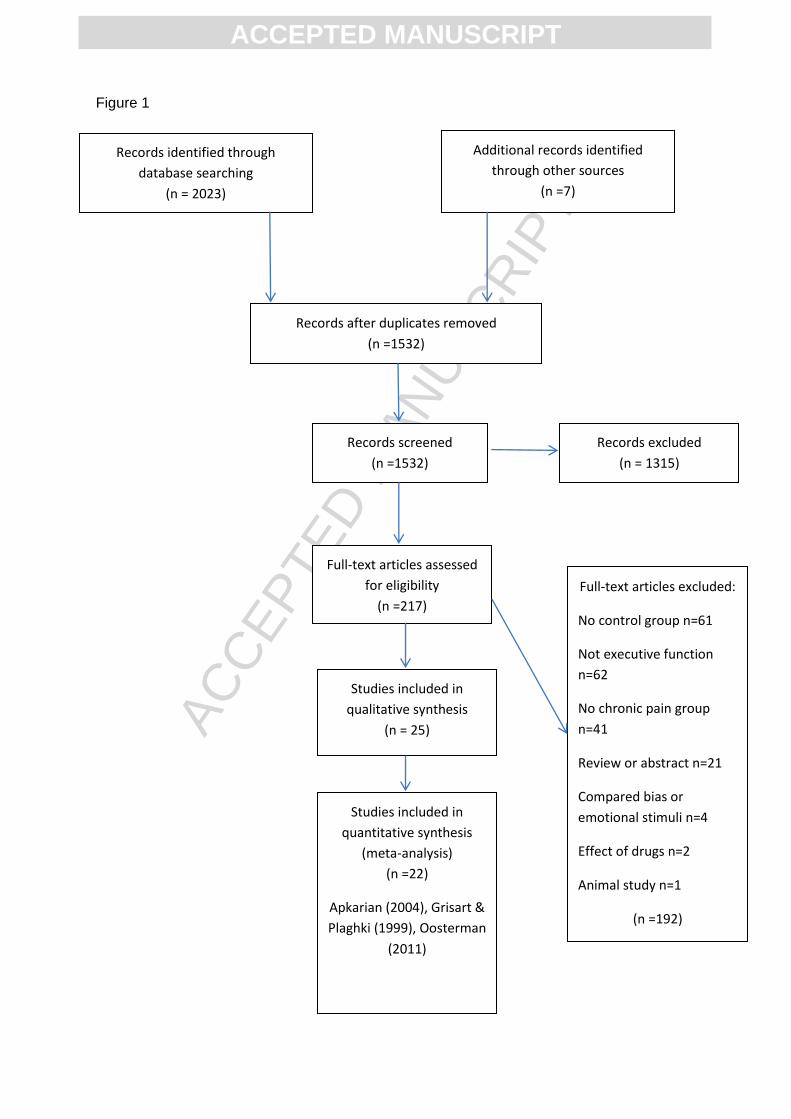
ACC
EPTE
D M
ANU
SCR
IPT
ACCEPTED MANUSCRIPT
Figure 1
Records identified through
database searching
(n = 2023)
Additional records identified
through other sources
(n =7)
Records after duplicates removed
(n =1532)
Records screened
(n =1532)
Full-text articles assessed
for eligibility
(n =217)
Studies included in
qualitative synthesis
(n = 25)
Records excluded
(n = 1315)
Studies included in
quantitative synthesis
(meta-analysis)
(n =22)
Apkarian (2004), Grisart &
Plaghki (1999), Oosterman
(2011)
Full-text articles excluded:
No control group n=61
Not executive function
n=62
No chronic pain group
n=41
Review or abstract n=21
Compared bias or
emotional stimuli n=4
Effect of drugs n=2
Animal study n=1
(n =192)
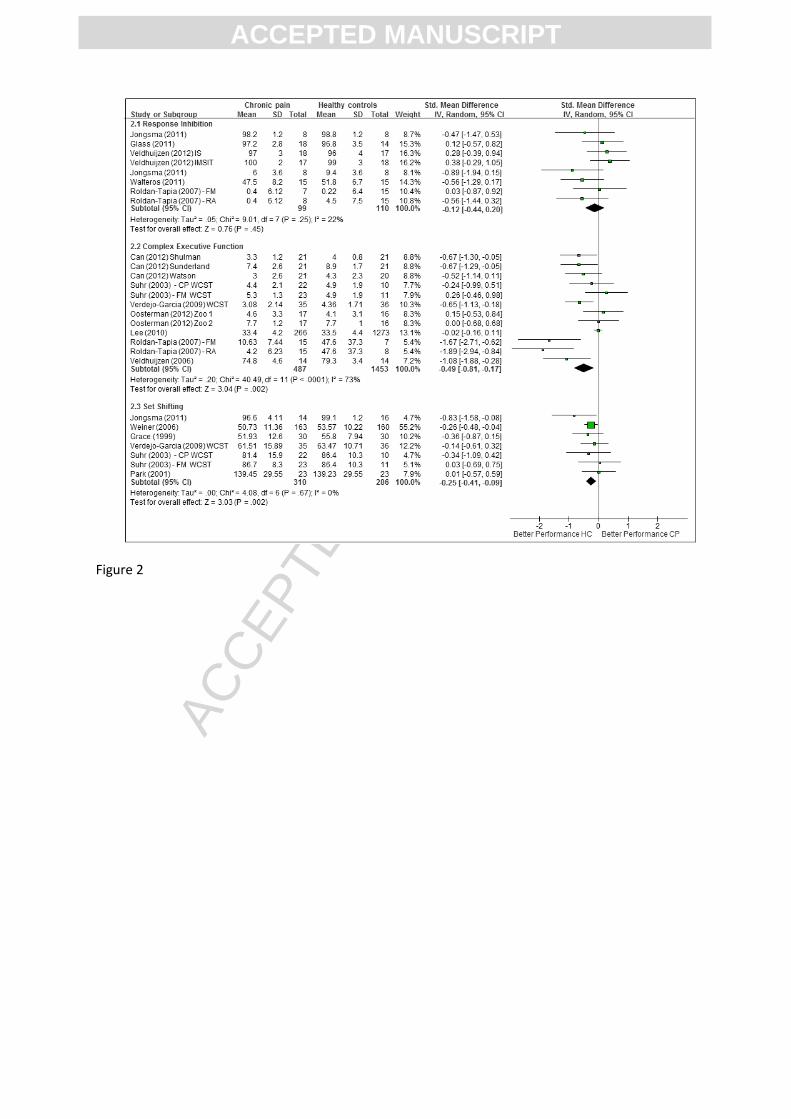
ACC
EPTE
D M
ANU
SCR
IPT
ACCEPTED MANUSCRIPT
Figure 2
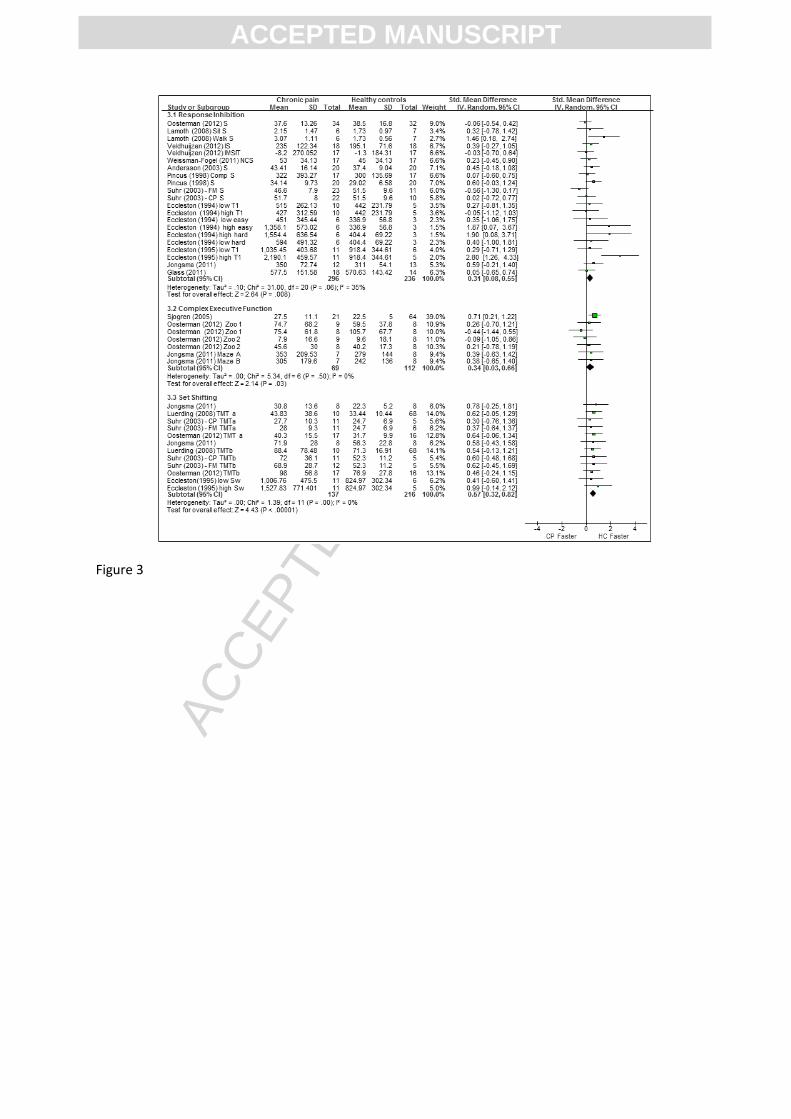
ACC
EPTE
D M
ANU
SCR
IPT
ACCEPTED MANUSCRIPT
Figure 3

ACC
EPTE
D M
ANU
SCR
IPT
ACCEPTED MANUSCRIPT
Figure 4
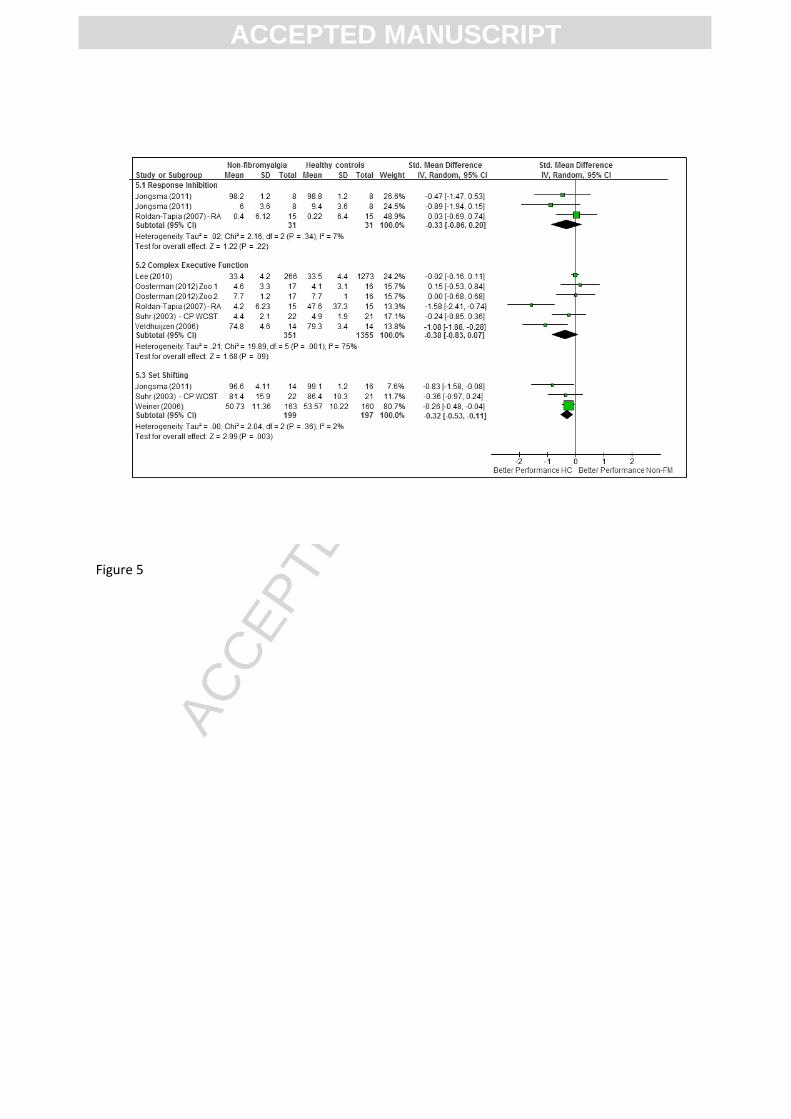
ACC
EPTE
D M
ANU
SCR
IPT
ACCEPTED MANUSCRIPT
Figure 5
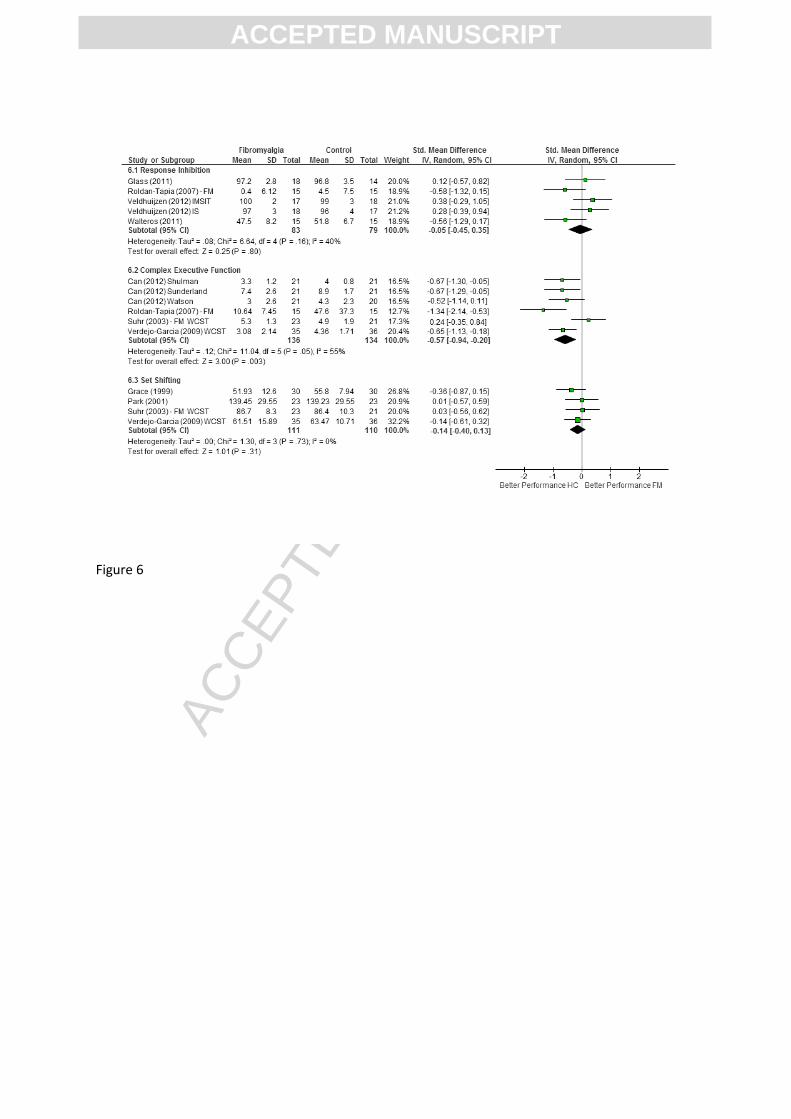
ACC
EPTE
D M
ANU
SCR
IPT
ACCEPTED MANUSCRIPT
Figure 6
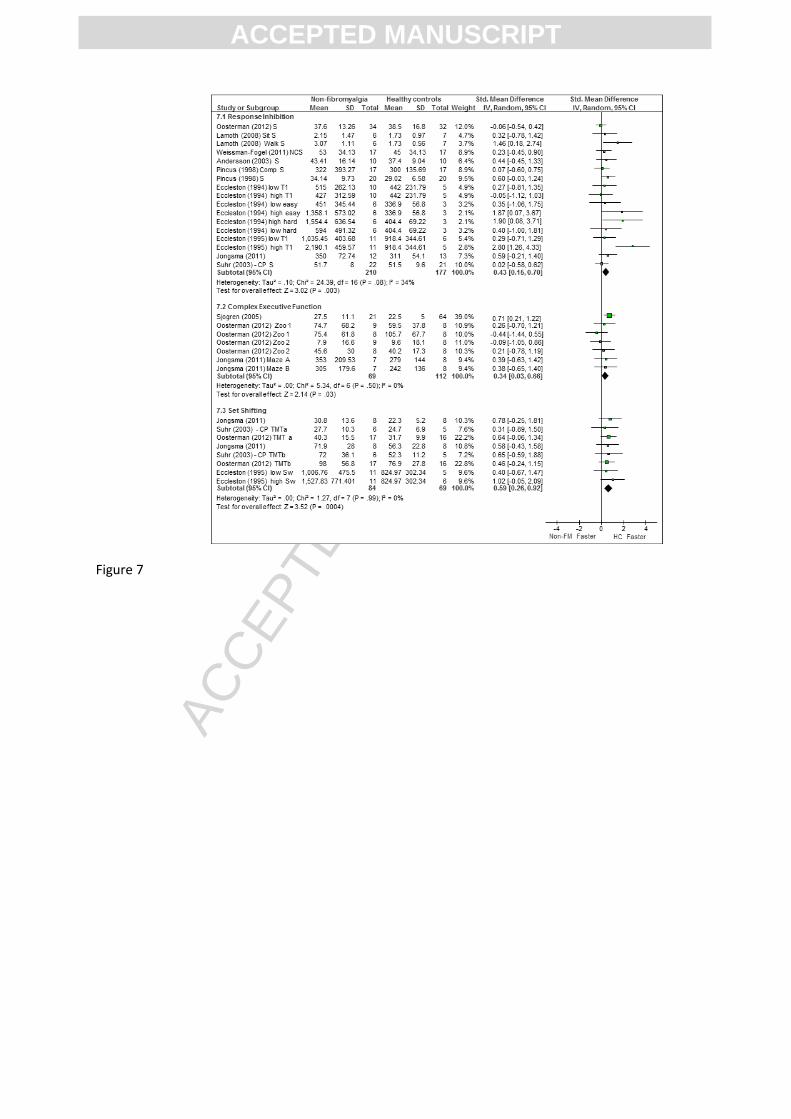
ACC
EPTE
D M
ANU
SCR
IPT
ACCEPTED MANUSCRIPT
Figure 7

ACC
EPTE
D M
ANU
SCR
IPT
ACCEPTED MANUSCRIPT
Figure 8
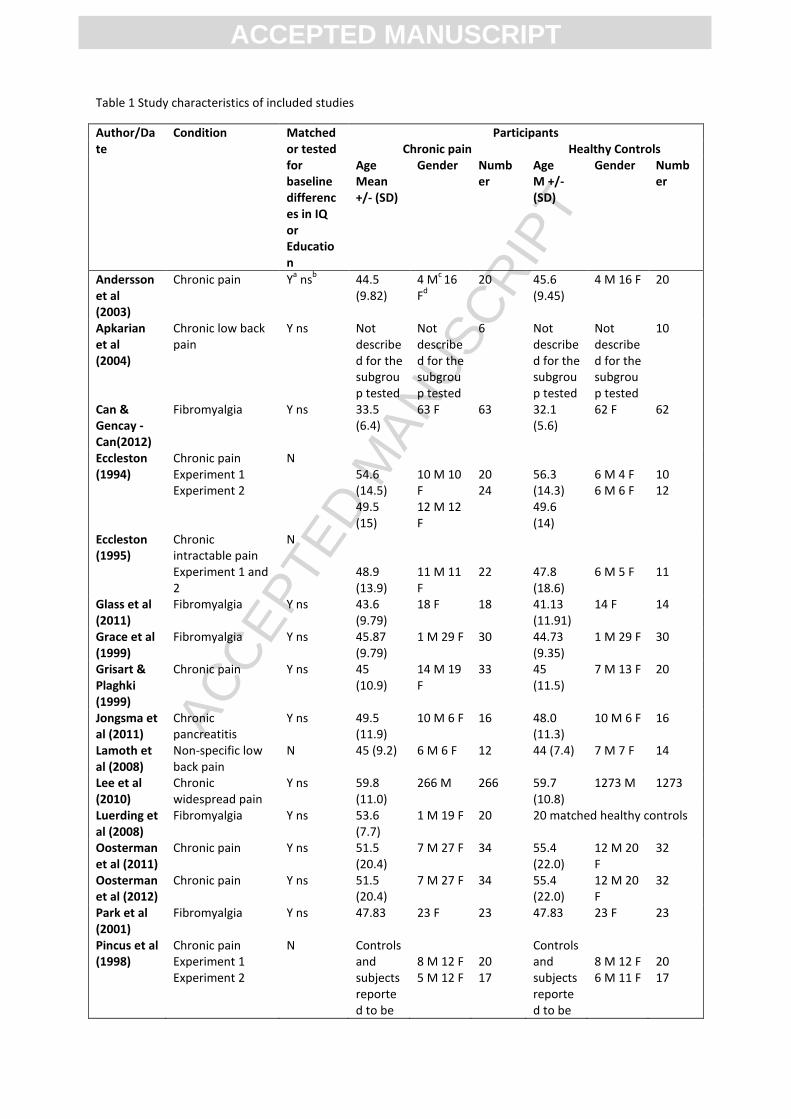
ACC
EPTE
D M
ANU
SCR
IPT
ACCEPTED MANUSCRIPT
Table 1 Study characteristics of included studies
Author/Date
Condition Matched or tested for baseline differences in IQ or Education
Participants Chronic pain Healthy Controls
Age Mean +/- (SD)
Gender Number
Age M +/- (SD)
Gender Number
Andersson et al (2003)
Chronic pain Ya ns
b 44.5
(9.82) 4 M
c 16
Fd
20 45.6 (9.45)
4 M 16 F 20
Apkarian et al (2004)
Chronic low back pain
Y ns
Not described for the subgroup tested
Not described for the subgroup tested
6
Not described for the subgroup tested
Not described for the subgroup tested
10
Can & Gencay -Can(2012)
Fibromyalgia Y ns 33.5 (6.4)
63 F 63 32.1 (5.6)
62 F 62
Eccleston (1994)
Chronic pain Experiment 1 Experiment 2
N 54.6 (14.5) 49.5 (15)
10 M 10 F 12 M 12 F
20 24
56.3 (14.3) 49.6 (14)
6 M 4 F 6 M 6 F
10 12
Eccleston (1995)
Chronic intractable pain Experiment 1 and 2
N 48.9 (13.9)
11 M 11 F
22
47.8 (18.6)
6 M 5 F
11
Glass et al (2011)
Fibromyalgia Y ns 43.6 (9.79)
18 F 18 41.13 (11.91)
14 F 14
Grace et al (1999)
Fibromyalgia Y ns 45.87 (9.79)
1 M 29 F 30 44.73 (9.35)
1 M 29 F 30
Grisart & Plaghki (1999)
Chronic pain Y ns 45 (10.9)
14 M 19 F
33 45 (11.5)
7 M 13 F 20
Jongsma et al (2011)
Chronic pancreatitis
Y ns 49.5 (11.9)
10 M 6 F 16 48.0 (11.3)
10 M 6 F 16
Lamoth et al (2008)
Non-specific low back pain
N 45 (9.2) 6 M 6 F 12 44 (7.4) 7 M 7 F 14
Lee et al (2010)
Chronic widespread pain
Y ns 59.8 (11.0)
266 M 266 59.7 (10.8)
1273 M 1273
Luerding et al (2008)
Fibromyalgia Y ns 53.6 (7.7)
1 M 19 F 20 20 matched healthy controls
Oosterman et al (2011)
Chronic pain Y ns 51.5 (20.4)
7 M 27 F 34 55.4 (22.0)
12 M 20 F
32
Oosterman et al (2012)
Chronic pain Y ns 51.5 (20.4)
7 M 27 F 34 55.4 (22.0)
12 M 20 F
32
Park et al (2001)
Fibromyalgia Y ns 47.83 23 F 23 47.83 23 F 23
Pincus et al (1998)
Chronic pain Experiment 1 Experiment 2
N Controls and subjects reported to be
8 M 12 F 5 M 12 F
20 17
Controls and subjects reported to be
8 M 12 F 6 M 11 F
20 17

ACC
EPTE
D M
ANU
SCR
IPT
ACCEPTED MANUSCRIPT
age matched
age matched
Roldan-Tapia et al (2007)
Fibromyalgia Rheumatoid Arthritis
Y ns Y ns
48.5 (7.49) 41.9 (6.79)
15 F 15 F
15 15
44.33 (5.99)
15 F 15
Sjogren et al (2005)
Chronic pain N 40.4 (15.5)
5 M 16 F 21 47.6 (17.4)
29 M 35 F
64
Suhr (2003)
Fibromyalgia Chronic pain
Y ns
48.1 (10.9) 49.5 (13.8)
2 M 21 F 6 M 16 F
23 22
45.9 (12.7)
4 M 17 F
21
Veldhuijzen et al (2006)
Chronic non-malignant pain
Y ns 46.9 (8.5)
10 M 4 F 14 50 (7.5) 7 M 7 F 14
Veldhuijzen et al (2012)
Fibromyalgia Y p < .0001
30.4 (8.6)
35 F 35 29.3 (9.2)
35 F 35
Verdejo-Garcia et al (2009)
Fibromyalgia
Y ns 45.86 (6.78)
36 F 36 44.97 (6.70)
36 F 36
Walteros et al (2011)
Fibromyalgia Y ns 50.4 (4.6)
15 gender not reported
15 49.0 (6.7)
15 gender not reported
15
Weiner et al (2006)
Osteoarthritis with Chronic Low Back Pain
Y ns 73.6 (5.2)
83 M 80 F
163 73.5 (4.8)
94 M 66 F
160
Weissman-Fogel et al (2011)
Temperomandibular disorder (chronic)
N 35.2 (11.6)
17 F 17 34 (9.9) 17 F 17
aY= yes,
bns = non-significant,
cM = male,
dF = female,
eSD = standard deviation.
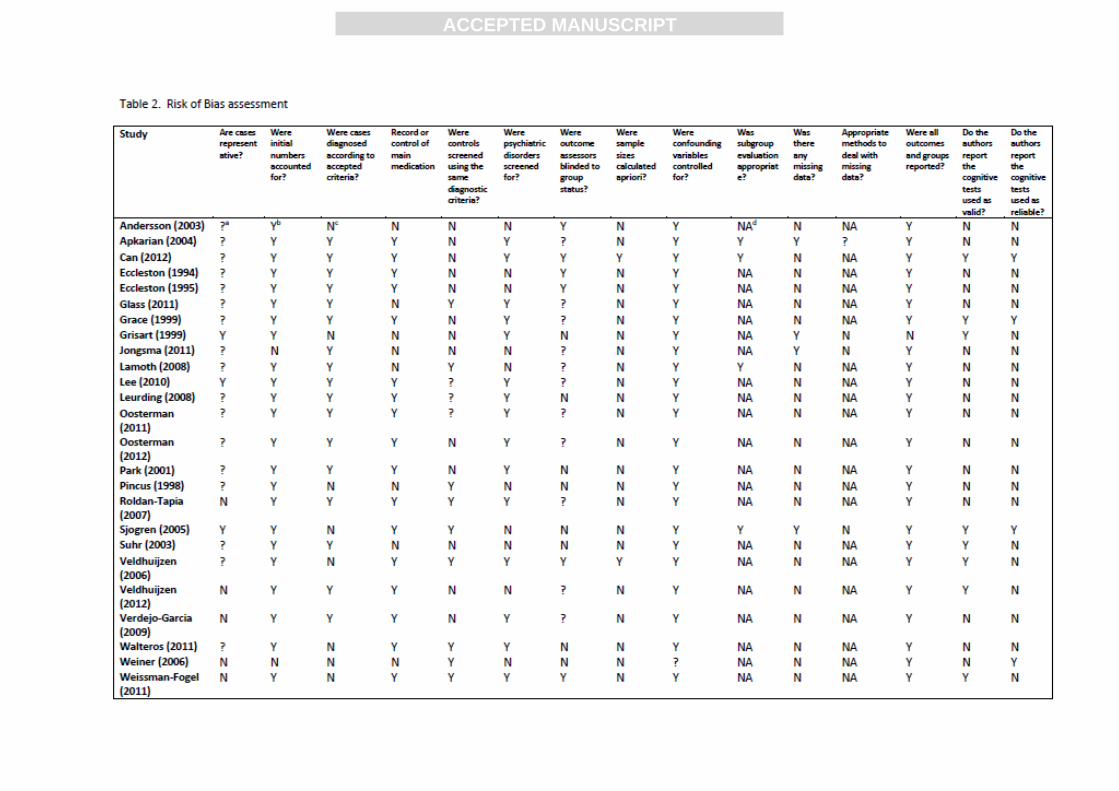
ACC
EPTE
D M
ANU
SCR
IPT
ACCEPTED MANUSCRIPT

ACC
EPTE
D M
ANU
SCR
IPT
ACCEPTED MANUSCRIPT
a?=Indeterminate; bY= Yes; cN = No; dNA= not applicable

ACC
EPTE
D M
ANU
SCR
IPT
ACCEPTED MANUSCRIPT
Table 3. Number or sum correct outcomes for executive function
Cognitive Component
Test Outcome Studies that used this test
Response Inhibition
a. Verbal Interference Test – equivalent to a Stroop Test
a#errors (converted to
accuracy score 100-E) # correct responses
Jongsma et al. (2011)
b. Go/Nogo Test # errors (converted to accuracy score 100-E)
Glass et al. (2011)
c. Stroop Test - Speed at which you can: (i). read the words (W) on a card of 100 colour words in black text (neutral stimulus) or same colour text (e.g RED in red, congruent stimulus), (ii). name the colours (C) on a card of coloured patches, and (iii). read the words on a card of colour words (CW) written in an incongruent colour text (e.g. RED written in blue, incongruent stimulus).
# errors due to interference (converted to accuracy score 100-E)
Veldhuijzen, Sondaal, & Oosterman (2012)
d. Multisource Interference Test –indicate which numeral is the odd one out of three (1,2,3) presented using numerical key pad – key pad position of number and number position on the screen congruent or incongruent
b% correct of 2 trials x
84 stimuli
Veldhuijzen et al. (2012)
e. ‘Golden’ Stroop Test –Number of correct responses to the CW card (incongruent)
# of correct responses (out of 100 words) in 45 seconds Roldan –Tapia (2007) scaled outcome scores for age and used the formula for interference factor (IF): IF =colour-word card- (colour card x word card)/(colour card +word card) Interference is considered high from 10 onwards
Walteros, et al. (2011); Roldan-Tapia, Canovas-Lopez, Cimdevilla, & Valverde (2007)
Complex Executive Function
a. Clock Face Test – presented with a blank clock face and a time that needs to be drawn in.
Shulman Score c∑
correct components / 5 Sunderland score∑ correct components /10 Watson score ∑ errors /7
Can & Gencay-Can (2012)
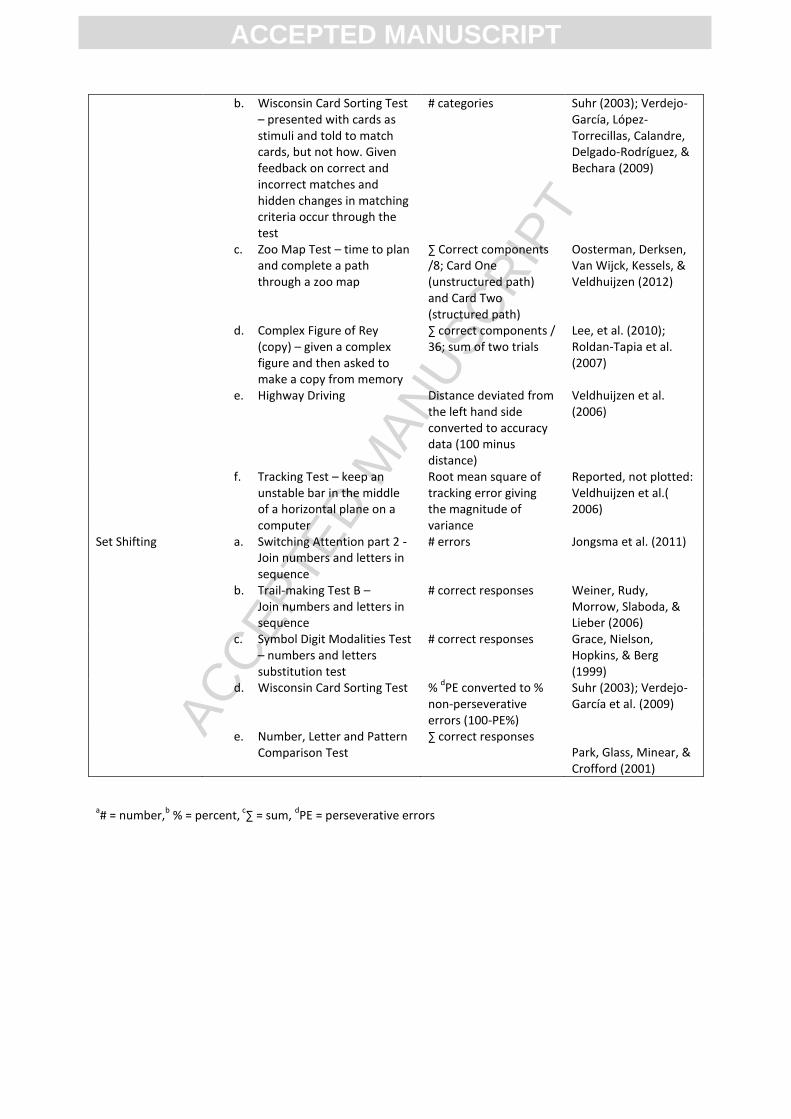
ACC
EPTE
D M
ANU
SCR
IPT
ACCEPTED MANUSCRIPT
a# = number,
b % = percent,
c∑ = sum,
dPE = perseverative errors
b. Wisconsin Card Sorting Test – presented with cards as stimuli and told to match cards, but not how. Given feedback on correct and incorrect matches and hidden changes in matching criteria occur through the test
# categories
Suhr (2003); Verdejo-García, López-Torrecillas, Calandre, Delgado-Rodríguez, & Bechara (2009)
c. Zoo Map Test – time to plan and complete a path through a zoo map
∑ Correct components /8; Card One (unstructured path) and Card Two (structured path)
Oosterman, Derksen, Van Wijck, Kessels, & Veldhuijzen (2012)
d. Complex Figure of Rey (copy) – given a complex figure and then asked to make a copy from memory
∑ correct components / 36; sum of two trials
Lee, et al. (2010); Roldan-Tapia et al. (2007)
e. Highway Driving Distance deviated from the left hand side converted to accuracy data (100 minus distance)
Veldhuijzen et al. (2006)
f. Tracking Test – keep an unstable bar in the middle of a horizontal plane on a computer
Root mean square of tracking error giving the magnitude of variance
Reported, not plotted: Veldhuijzen et al.( 2006)
Set Shifting a. Switching Attention part 2 - Join numbers and letters in sequence
# errors Jongsma et al. (2011)
b. Trail-making Test B – Join numbers and letters in sequence
# correct responses Weiner, Rudy, Morrow, Slaboda, & Lieber (2006)
c. Symbol Digit Modalities Test – numbers and letters substitution test
# correct responses Grace, Nielson, Hopkins, & Berg (1999)
d. Wisconsin Card Sorting Test % dPE converted to %
non-perseverative errors (100-PE%)
Suhr (2003); Verdejo-García et al. (2009)
e. Number, Letter and Pattern Comparison Test
∑ correct responses Park, Glass, Minear, & Crofford (2001)

ACC
EPTE
D M
ANU
SCR
IPT
ACCEPTED MANUSCRIPT
Table 4 Response time outcomes for executive function
Cognitive Process
Test Outcome Studies that use this test
Response Inhibition
a. Stroop Test during sit and walk conditions
Average time to read 9 Stroop Test items on a powerpoint slide
Lamoth, Stins, Pont, Kerckhoff, & Beek (2008)
b. Stroop Test - Time taken to read/name word and colour cards and incongruent colour-word cards and then scored for interference
Response time: Andersson & Haldrup – 99 stimuli per card; Apkarian et al. – 100 stimuli per card; Oosterman et al., Veldhuijzen et al. - 72 stimuli per card; Pincus et al.- 50 stimuli per card; Suhr - not described; Weissman-Fogel et al. - 3 x 12 sets of words (3 blocks), repeated 6 times. Interference factor = mean response time for CW card – mean response time for C card (see Appendix B, Table B1)
Andersson & Haldrup (2003); Pincus, Fraser, & Pearce (1998); Oosterman, Derksen, Van Wijck, Kessels, & Veldhuijzen (2012); Veldhuijzen, Sondaal, & Oosterman (2012); Suhr (2003); Weissman-Fogel et al.(2011). Reported (not plotted): Apkarian et al. (2004); Grisart & Plaghki (1999)
c. Multisource Interference Test –indicate which numeral is the odd one out of three (1,2,3) presented using numerical key pad – key pad position of number and number position on the screen congruent or incongruent
Response time to button press: 1. Congruent trial = 84 stimuli 2. Incongruent trial = 84 stimuli
Veldhuijzen et al. (2012)
d. Card Interference Test
1994 Task 1: 72 stimuli (1 card printed with a group of one type of digit between 1 and 9 = a stimulus) reaction time to report value of digit on card and number of digits on card
Easy task: 59 stimuli (2 cards printed with a group of one type of digit between 1 and 9 = a stimulus (no two the same) numbers and values 1-4 units apart
Hard task: 59 stimuli (as above) numbers and values 5-9 units apart
1995 Task 1: 59 stimuli (2 cards as above) measure the reaction time to report the card with the largest value digit and then another run
Response time to read: 1. Value of the digit on the card 2. Number of digits on the card Interference factor for all trials = mean reaction time for reporting 2 – mean reaction time for reporting 1
Eccleston (1994, 1995)

ACC
EPTE
D M
ANU
SCR
IPT
ACCEPTED MANUSCRIPT
with reaction time to report the card with the largest number of digits of the pair
e. Go/Nogo Test Reaction time to correct button press
Jongsma et al.(2011); Glass et al. (2011)
Complex Executive Function
a. Continuous Reaction Time Test
Reaction time to auditory signals delivered over a 10 minute period, percentiles
Sjøgren, Christrup, Petersen, & Højsted (2005)
b. Zoo Map Test Planning time card 1 – unstructured path Time to completion card 1 Planning time card 2 – structured path Time to completion card 2
Oosterman et al. (2012)
c. Maze Test A and B – How quickly participants found and completed a (hidden) path through an 8x8 matrix
Seconds to complete (given up to 7 minutes)
Jongsma et al. (2011)
d. Bourdon Vos Test - circle every group of four dots presented in a line containing groups of three, four or five dots as fast and accurately as possible, 33 lines in total.
Response time and omission scores lines 18-33 compared with lines 0-17
Reported, not plotted: Oosterman et al.( 2012); Oosterman, Derksen, Van Wijck, Veldhuijzen, & Kessels (2011)
Set Shifting a. Switching Attention Part 1 – Join numbers trail in sequence
Time to connect numerals 1 to 25
Jongsma et al. (2011)
b. Trail-making Test A - Join numbers trail in sequence
Time to connect numerals 1 to 25
Luerding, Weigand, Bogdahn, & Schmidt-Wilcke (2008); Suhr (2003); Oosterman et al. (2012)
c. Switching Attention Part 2 – Join numbers and letters trail in sequence
Time to connect letters and numerals in sequence (e.g. A1, B2 etc)
Jongsma et al. ( 2011)
d. Trail- making Test B – Join numbers and letters trail in sequence
Time to connect letters and numerals in sequence (e.g. A1, B2 etc)
Luerding et al. ( 2008); Suhr (2003); Oosterman et al.( 2012)
e. Card Interference Test – Task 2 switching condition
59 stimuli (two cards printed with groups of one type of Arabic numerals: no two cards were the same in either value of digit or number of digits) subjects were asked to switch uncued between reporting the card with the largest value digit, and the card with the largest number of digits, of the pair
Reaction time to correct button press Interference factor = mean reaction time of switching task – baseline (average of mean correct reaction time score for performance on the number and value interference scores of the first experiment – (1995) – T1)
Eccleston (1995)

ACC
EPTE
D M
ANU
SCR
IPT
ACCEPTED MANUSCRIPT
Highlights:
People with chronic pain show small to medium impairments in executive function.
Small sample sizes meant a moderate risk of bias across the evidence base.
Moderators of executive function were seldom controlled for in study design.
Studies could not isolate processes more or less affected in people with chronic pain.