do multiple data sets provide support for a bipolar illness susceptibility locus on chromosome 18?
TRANSCRIPT
Genetic Epidemiology 14:599!604 (1997)
Do Multiple Data Sets Provide Supportfor a Bipolar Illness SusceptibilityLocus on Chromosome 18?Mark Daly, Andrew Kirby, and Leonid Kruglyak
Whitehead Institute for Biomedical Research, Cambridge, Massachusetts
We carried out nonparametric linkage (NPL) analysis of the five chromosome 18data sets for bipolar illness, as well as of the combined data set. Prior to analysis,we constructed a common genetic map and computed separate marker allelefrequencies for each data set. We also attempted to create two consistentdiagnostic categories, Narrow (bipolar I, BPI, only) and Broad. The results of theanalysis of the combined data set provided stronger evidence of linkage under theBroad category, but at a level of significance that would be expected to occur bychance 4-5 times in a whole-genome scan. When the data sets were analyzedindividually, the NIMH data set showed suggestive evidence of linkage (p =0.0007). The other four data sets, considered together or separately, failed tosupport this finding, showing only slightly elevated allele sharing among affectedsat a level that would not be unexpected in an unlinked chromosomal region.© 1997 Wiley-Liss, Inc.
Key words: bipolar illness, genome-wide significance, meta-analysis, nonparametic tests
INTRODUCTION
We describe the preparation for and results of an analysis of the chromosome 18bipolar data. As several suggestive results have been published previously by some of thegroups supplying data [Berrettini et al., 1994; Stine et al., 1995], the aim of our analysiswas to see if these data sets, when combined, would support more strongly the hypothesisof the existence of a locus on chromosome 18 affecting susceptibility to bipolar illness.
METHODS
Data Preparation. To analyze the data simultaneously, we needed to convert allthe data files to one common format. Given that all groups have analyzed their data with
Address reprint requests to Dr. Leonid Kruglyak, Whitehead Institute for Biomedical Research, One KendallSquare, Bldg. 300, Cambridge, MA 02139.
© 1997 Wiley-Liss, Inc.
600 Daly et al.
standard linkage software, this proved surprisingly difficult. We settled on the LINKAGEfile format for both pedigree and locus data, and wrote scripts to standardize and combinethe wide variety of genotype, phenotype, and locus description file formats.
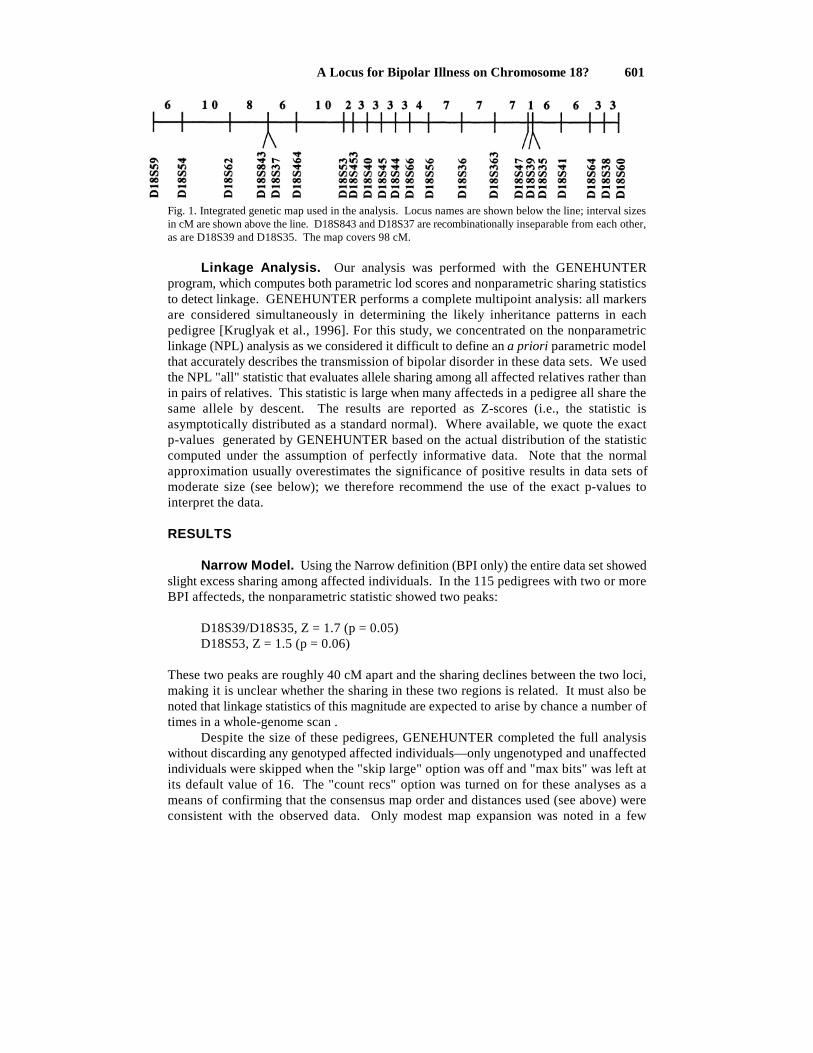
Creating a Common Genetic Map. A common map was needed to combineresults across all data sets. The CEPH/Genethon maps [Dib et al., 1996] were used as aprimary backbone, with positions of markers not available there obtained from CHLC data.Distances for some markers (e.g., D18S35-D18S47) were not completely known (thesemarkers were placed relative to other markers but not on framework maps themselves); inthese cases marker distances were estimated using the current data. The creation of acommon map on which the markers scored in each data set could be placed was crucial asit enabled us to carry out multipoint linkage analysis in all pedigrees simultaneously at allpositions throughout the chromosome. The final map used is shown in Figure 1.
Assigning Allele Frequencies. For the purpose of analysis, we computed allelefrequencies for each marker from the data provided. We considered it likely that allelefrequencies computed in one data set might not be appropriate for another. To avoid theproblem of misspecifying allele frequencies, we handled the cases of markers scored inmore than one data set by creating separate copies of the marker for each data set it wasscored in and computing the allele frequencies separately. These copies of the markerswere then placed on the map in the same position (recombinationally inseparable) and wereconsidered simultaneously in the multipoint mapping analysis. Some markers from theHopkins data set did not have consistent allele nomenclature (rendering it impossible tocalculate accurate allele frequencies) and were dropped from the analysis.
Diagnostic Criteria. The next significant step in the analysis process was toattempt to create a consistent diagnostic definition of affection for the five data sets.Because we wanted to examine the combined linkage results of all data sets, it was vitalthat we define affection consistently across the data sets for our results to be meaningful.We used two different affection definitions: a Narrow definition (BPI only) and a Broaddefinition (BPI and II, schizoaffective disorder, and unipolar). For the Narrow model, onlyBPI patients were designated as affecteds. For the Broad model, the following wereconsidered affected:
NIMH BPI, BPII, schizoaffective, maniaHopkins BPI, BPII, schizoaffective, recurrent unipolarLondon BPI, BPII, manic disorderBonn Broad model (BPI, BPII, recurrent major depression, schizoaffective)Columbia Broad model (BPI down to recurrent unipolar)Bonn Broad model (BPI, BPII, recurrent major depression, schizoaffective)Columbia Broad model (BPI down to recurrent unipolar)
Because each group provided quite different information, and not all groupsprovided sufficient information to reconstruct the primary diagnosis, we could notguarantee that our definitions were consistent across the five data sets. Because anyadditional heterogeneity among data sets makes the detection of linkage more difficult,research into the genetics of bipolar affective disorder would benefit greatly from anagreement on standard diagnostic criteria and nomenclature.
A Locus for Bipolar Illness on Chromosome 18? 601
Fig. 1. Integrated genetic map used in the analysis. Locus names are shown below the line; interval sizesin cM are shown above the line. D18S843 and D18S37 are recombinationally inseparable from each other,as are D18S39 and D18S35. The map covers 98 cM.
Linkage Analysis. Our analysis was performed with the GENEHUNTERprogram, which computes both parametric lod scores and nonparametric sharing statisticsto detect linkage. GENEHUNTER performs a complete multipoint analysis: all markersare considered simultaneously in determining the likely inheritance patterns in eachpedigree [Kruglyak et al., 1996]. For this study, we concentrated on the nonparametriclinkage (NPL) analysis as we considered it difficult to define an a priori parametric modelthat accurately describes the transmission of bipolar disorder in these data sets. We usedthe NPL "all" statistic that evaluates allele sharing among all affected relatives rather thanin pairs of relatives. This statistic is large when many affecteds in a pedigree all share thesame allele by descent. The results are reported as Z-scores (i.e., the statistic isasymptotically distributed as a standard normal). Where available, we quote the exactp-values generated by GENEHUNTER based on the actual distribution of the statisticcomputed under the assumption of perfectly informative data. Note that the normalapproximation usually overestimates the significance of positive results in data sets ofmoderate size (see below); we therefore recommend the use of the exact p-values tointerpret the data.
RESULTS
Narrow Model. Using the Narrow definition (BPI only) the entire data set showedslight excess sharing among affected individuals. In the 115 pedigrees with two or moreBPI affecteds, the nonparametric statistic showed two peaks:
D18S39/D18S35, Z = 1.7 (p = 0.05)D18S53, Z = 1.5 (p = 0.06)
These two peaks are roughly 40 cM apart and the sharing declines between the two loci,making it is unclear whether the sharing in these two regions is related. It must also benoted that linkage statistics of this magnitude are expected to arise by chance a number oftimes in a whole-genome scan .
Despite the size of these pedigrees, GENEHUNTER completed the full analysiswithout discarding any genotyped affected individuals—only ungenotyped and unaffectedindividuals were skipped when the "skip large" option was off and "max bits" was left atits default value of 16. The "count recs" option was turned on for these analyses as ameans of confirming that the consensus map order and distances used (see above) wereconsistent with the observed data. Only modest map expansion was noted in a few
602 Daly et al.
positions, which may indicate an occasional genotyping error, but not incorrect map orderor size.
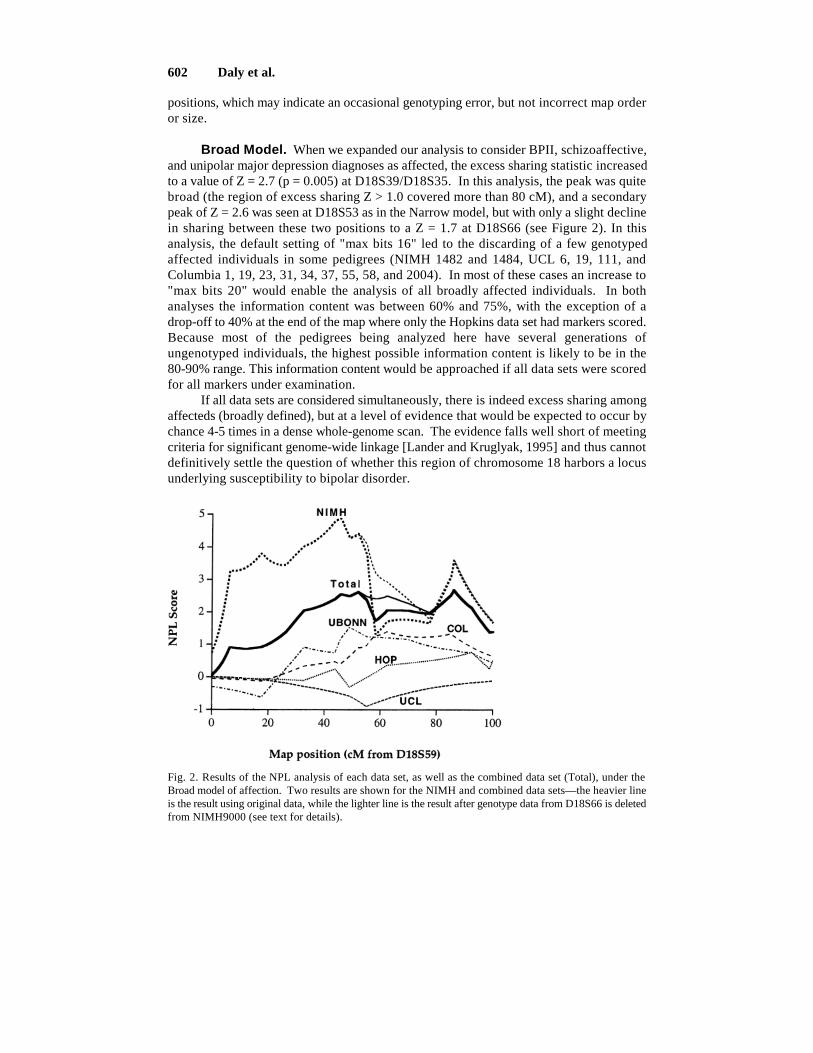
Broad Model. When we expanded our analysis to consider BPII, schizoaffective,and unipolar major depression diagnoses as affected, the excess sharing statistic increasedto a value of Z = 2.7 (p = 0.005) at D18S39/D18S35. In this analysis, the peak was quitebroad (the region of excess sharing Z > 1.0 covered more than 80 cM), and a secondarypeak of Z = 2.6 was seen at D18S53 as in the Narrow model, but with only a slight declinein sharing between these two positions to a Z = 1.7 at D18S66 (see Figure 2). In thisanalysis, the default setting of "max bits 16" led to the discarding of a few genotypedaffected individuals in some pedigrees (NIMH 1482 and 1484, UCL 6, 19, 111, andColumbia 1, 19, 23, 31, 34, 37, 55, 58, and 2004). In most of these cases an increase to"max bits 20" would enable the analysis of all broadly affected individuals. In bothanalyses the information content was between 60% and 75%, with the exception of adrop-off to 40% at the end of the map where only the Hopkins data set had markers scored.Because most of the pedigrees being analyzed here have several generations ofungenotyped individuals, the highest possible information content is likely to be in the80-90% range. This information content would be approached if all data sets were scoredfor all markers under examination.
If all data sets are considered simultaneously, there is indeed excess sharing amongaffecteds (broadly defined), but at a level of evidence that would be expected to occur bychance 4-5 times in a dense whole-genome scan. The evidence falls well short of meetingcriteria for significant genome-wide linkage [Lander and Kruglyak, 1995] and thus cannotdefinitively settle the question of whether this region of chromosome 18 harbors a locusunderlying susceptibility to bipolar disorder.
Fig. 2. Results of the NPL analysis of each data set, as well as the combined data set (Total), under theBroad model of affection. Two results are shown for the NIMH and combined data sets—the heavier lineis the result using original data, while the lighter line is the result after genotype data from D18S66 is deletedfrom NIMH9000 (see text for details).
A Locus for Bipolar Illness on Chromosome 18? 603
When data sets were analyzed separately, the following maximum linkage statisticswere obtained (not at the same chromosomal location; see Figure 2):
NIMH 4.9 (p = 0.0007)HOPKINS 1.3UCLONDON 0.0UBONN 1.5COLUMBIA 1.4
The NIMH data set provides suggestive evidence for linkage (p = 0.0007). Note thatusing the normal approximation would give a p-value 3 orders of magnitude moresignificant in this data set. This underscores the danger of using asymptotic assumptionsin data sets consisting of a modest number of pedigrees of different structure and theimportance of either calculating p-values that don’t rely on asymptotics or obtainingempirical p-values by simulation. It is interesting to note that the strongest individualevidence for linkage comes from the Amish pedigree (see below). Removing this onepedigree from the data set lowers the maximum statistics to 2.6 for NIMH, and to 1.9 forthe combined data set.
The other four data sets show slight excess sharing on parts of chromosome 18 butalso have regions of less than expected sharing and do not look different from what onewould see by chance in a region containing no disease loci. Combining the NIMH andHopkins data sets, which previously reported linkage to this region, results in a peakstatistic of 3.4. The other three data sets combined give a peak statistic of 1.5, as do thefour data sets excluding NIMH.
Haplotype Analysis of NIMH9000. Because the strongest evidence for linkagewas obtained in the NIMH pedigree 9000 (the right extension of Amish pedigree 110), weanalyzed this pedigree in greater detail. GENEHUNTER was used to generate haplotypesfor all affected individuals in this pedigree, as well as for the connecting individuals.Unfortunately only 4 of the affecteds in this pedigree had genotype data available(individuals 25, 37, 41, and 50). These four individuals shared a haplotype for all themarkers examined, with two exceptions. Marker D18S59, the most distal marker on ourmap, showed recombination events in several individuals. Marker D18S66 showed adifference between the "left" branch of the pedigree (those descended from individual 65,including affecteds 37 and 41) and the "right" branch of the pedigree (those descendedfrom individual 71, including affecteds 25 and 50). The right branch carries allele 3,predicted by the program to be part of the ancestral haplotype inherited from individuals7/8. The left branch carries allele 2. This change is flanked by shared alleles at ninemarkers on one side and at five markers on the other side. It is thus most likely torepresent either a mutation event in the meiosis from individual 65 to individual 62 or aninconsistency in allele scoring between the two branches.
For all four genotyped affecteds to share the common haplotype, it must have beentransmitted "correctly" through eight meioses. Thus the probability of this occurring bychance in this pedigree is 1/256 or .0039 (equivalent to a lod score of 2.4 under a dominantmodel). It would be interesting to type additional affecteds from this pedigree(if DNA is available) to see if the evidence for linkage persists. It is worth noting thatother parts of the extended Amish pedigree have been reported not to show evidence of
604 Daly et al.
linkage to chromosome 18 [Pauls et al., 1995]; this can be caused either by the absence oflinkage or by within-pedigree heterogeneity.
Finally, the single event of nonsharing among affecteds at marker D18S66 appearsto bring down the evidence for linkage to the middle of the region not just in this pedigreebut in the entire NIMH data set as well as in the combined data set. If genotype data at thismarker is removed from NIMH9000, the NPL statistic shows smoother fall-off from thepeak near 40 cM, with a shallower "trough" between the two peaks (see Figure 2). Weurge the group supplying the data to resolve this discrepancy experimentally.
DISCUSSION
This analysis of additional pedigree data can be interpreted as a failure to replicatethe initial linkage finding of the NIMH group. As usual, such failure of replication canreflect a false-positive result in the initial data set, heterogeneity among data sets, or afalse-negative result in the new data set. Lack of phenotypic standardization adds to thedifficulty of interpretation. The strongest evidence for linkage to this region is contributedby the "right extension" of the Amish pedigree (NIMH9000). Finally, we note that unlikesome of the previous analyses of parts of these data, we did not attempt to separate thefamilies by maternal vs. paternal inheritance and did not separately test for linkage inmaternally or paternally inherited chromosomes. If parent-of-origin effects are importantin the genetics of bipolar disorder, such analyses could provide greater power to detect theloci involved.
ACKNOWLEDGMENTS
We thank Michele Gschwend and Melanie Mahtani for helpful discussions. Thiswork was supported in part by a Special Emphasis Research Career Award (HG00017)from NCHGR to L.K.
REFERENCES
Berrettini WH, Ferrano TN, Goldin LR, Weeks DE, Detera-Wadleigh S, Nurnberger JI, Gershon ES (1994):Chromosome 18 DNA markers and manic-depressive illness: Evidence for a susceptibility gene.Proc Natl Acad Sci USA 91:5918-5921.
Dib C, Faure S, Fizames C, Samson D, Drouot N, Vignal A, Millasseau P, Marc S, Hazan J, Seboun E,Lathrop M, Gyapay G, Morissette J, Weissenbach J (1996): A comprehensive genetic map of thehuman genome based on 5264 microsatellites. Nature 380:152-154.
Kruglyak L, Daly MJ, Reeve-Daly MP, Lander ES (1996): Parametric and nonparametric linkage analysis:A unified multipoint approach. Am J Hum Genet 58:1347-1363.
Lander E, Kruglyak L (1995): Genetic dissection of complex traits: guidelines for interpreting and reportinglinkage results. Nat Genet 11:241-247.
Pauls DL, Ott J, Paul SM, Allen CR, Fann CSJ, Carulli JP, Falls KM, Bouthillier CA, Gravius TC, KeithTP, Egeland JA, Ginns EI (1995): Linkage analyses of chromosome 18 markers do not identify amajor susceptibility locus for bipolar affective disorder in the Old Order Amish. Am J Hum Genet57:636-643.
Stine OC, Xu J, Koskela R, McMahon FJ, Gschwend M, Friddle C, Clark CD, McInnis MG, Simpson SG,Breschel TS, Vishis E, Riskin K, Feilotter H, Chen E, Shen S, Folstein S, Meyers DA,Botstein D, Marr TG, DePaulo JR (1995): Evidence for linkage of bipolar disorder to chromosome18 with a parent-of-origin effect. Am J Hum Genet 57:1384-1394.