do multinational firms invest more? on the impact of
TRANSCRIPT

Do multinational firms invest more?
On the impact of internal debt
financing and transfer pricing on
capital accumulation
WP15/30
The paper is circulated for discussion purposes only, contents should be considered preliminary and are not to
be quoted or reproduced without the author’s permission.
November2015
Martin Simmler
Oxford University Centre for
Business Taxation
Working paper series | 2015

Do multinational firms invest more?On the impact of internal debt
financing and transfer pricing oncapital accumulation∗
Martin Simmler†
AbstractThis study analyzes whether multinational companies (MNC) that
are able to reduce their tax burden on capital by shifting profits tolow tax jurisdictions invest more than domestic firm. To study therelationship, I exploit a massive corporate tax rate cut of 10%-pointsin Germany 2008 as a quasi-natural experiment. This reform reducedsubstantially the incentive of MNC to engage in profit shifting. Using adifference in differences matching strategy (DiD), the results suggestthat MNC decreased their fraction of internal borrowing and theircapital stock compared to purely domestic firms. Taking the evidencetogether, the findings suggest that if MNC shift profits abroad, theircapital accumulation is less depressed by the national tax rate and,therefore, benefits less from a tax rate reduction. The DiD results areconfirmed by a more structural approach, which exploits variation inthe tax incentive to shift profits to the headquarter for identification.Further, the results suggest that only internal debt financing but nottransfer pricing fosters capital accumulation.
Keywords: internal debt shifting; capital accumulation; corporateincome taxation; depreciation allowances.
JEL Classification: H25, F23, G31, G32.
∗I thank Steve Bond, Ron Davies, Mike Devereux, Jost Heckemeyer, Niels Johannesen,Adam Lederer, Li Liu, Axel Moehlmann, Guttorm Schjelderup, Dirk Schindler, NadineRiedel and Tim Schmidt-Eisenlohr as well as participants at the IIPF Conference 2013 inTaomina, and the EEA/ESEM Conference 2013 in Gothenburg for helpful and valuablecomments. The usual disclaimer applies.†DIW Berlin, Mohrenstrae 58, 10117 Berlin, Germany; e-mail address: msimm-
[email protected], Oxford University Centre for Business Taxation, Said Business School, ParkEnd Street, Oxford OX1 1HP, United Kingdom
1 Introduction
A growing body of literature documents that multinational corporations useintra-firm transactions to reduce their tax payments.1 These activities causea loss in tax revenue and incentivize governments to engage in tax competi-tion by decreasing their tax rates (e.g. Devereux et al., 2008) and/or to limitprofit shifting activities by introducing anti-abuse regulations2. Thus, profitshifting activities of multinational firms are mainly associated with welfarelosses for countries.
This might, however, not reflect the whole picture as recently pointedout by theoretical studies (e.g. Desai et al., 2006; Hong and Smart, 2010;Schindler and Schjelderup, 2012). A higher tax burden on capital reducescapital accumulation (e.g. Chirinko et al., 1999). Thus, if multinationalfirms are able to reduce their tax burden by shifting profits to low tax juris-dictions, their capital accumulation should be less depressed by the nationaltax rate. In other words, multinational firms that shift profits abroad shouldinvest more compared to domestic firms. The aim of this study is to provideclear evidence on the positive impact of profit shifting activities on capitalaccumulation.3
To answer my research question, I rely on a difference in differences design(DiD). The causal impact of profit shifting activities on capital accumulationis identified by comparing the financing and investment behavior of purelydomestic and multinational firms in a high tax country in response to a strongtax rate reduction. To account for potential differences between treatmentand control group, I follow prior literature (e.g. Egger et al., 2010) andcombine the DiD with a propensity score matching approach.
Further, to link the results to the investment literature (e.g. Chirinko etal., 1999; Bond and Xing, 2011) and to allow a comparison with the priorliterature on profit shifting activities of multinational companies, a secondidentification strategy is implemented as well. This exploits the change inthe tax incentive to engage in profit shifting to the headquarter for identifica-
1e.g. Grubert and Mutti, 1991; Hines and Rise, 1994; Bartelsman and Beetsma, 2003;Clausing 2003; Huizinga and Laeven, 2008, Huizinga et al., 2008; Weichenrieder, 2009;Egger et al., 2010; Buettner and Wamser, 2013.
2See Fuest and Hemmelgarn (2005) and Haufler and Runkel (2012) for a theoreticaland Buettner et al. (2012), Buslei and Simmler (2013) and Blouin et al. (2014) for anempirical analysis of thin capitalization rules. Peralta et al. (2006) investigate whethercountries should limit profit shifting or not.
3The paper deals solely with the impact of profit shifting activities on the intensivemargin of capital accumulation. For the impact of taxation on the extensive margin, i.e.the location decision of multinational firms, see De Mooij and Ederveen (2003), Devereuxand Griffith (2003) or Barrios et al.(2013).
1

tion. Compared to the first approach, the second approach is sensitive to themodeling of the tax incentive. It allows, however, to link explicitly multi-national firms’ tax savings to investment spending. Since the studied taxrate reduction came along with the introduction of less generous deprecia-tion allowances, their impact on firms’ profit shifting activities and its relatedimpact on capital accumulation is investigated as well. The database for bothapproaches are financial statements, ownership and subsidiary informationfor German firms between 2004 and 2010.
Both applied methods provide consistent results and confirm the theoret-ical predictions. The findings suggest that multinational firms, for which theincentive to shift profits was reduced or even abolished due to the tax ratereduction, decreased their (internal) debt ratio and their capital stock com-pared to domestic firms. These results are consistent with the presence ofa tax-advantage of multinational firms due to their profit shifting activities.The tax advantage allows multinational firms to invest more compared todomestic firms. Moreover, the analysis presents evidence that in particularshifting profits via internal debt financing foster capital accumulation, butnot transfer pricing.
The results show further that if governments restrict the generosity ofdepreciation allowances, the tax advantage of multinational firms increasesas the tax burden on capital. Thus, recent tax reforms that followed theprinciple tax rate cut cum base broadening might have decreased the num-ber of firms shifting (simply) profits (to the headquarter) but increased atthe same time the tax advantage of firms that still engage in internal debtshifting.
The paper contributes to the prior literature in several ways. Firstly, anew identification strategy is used. So far, most of the empirical literatureon profit shifting activities of multinational companies exploit variation inthe incentive to engage in profit shifting (e.g. Huizinga and Laeven, 2008;Huizinga et al., 2008; Buettner and Wamser, 2013). Identification relies thenon the functional form. By using a difference in differences approach thefunctional form assumption is relaxed. Moreover, by focusing on the tax ratereduction in the high tax country, I ensure that all subsidiaries had beforethe tax rate reduction an incentive to shift profits out of the high tax country.This is important as only shifting profits out of the country affects capitalaccumulation but not if profits are shifted into it. Further, the massive taxrate reduction rules out that adjustment costs refrain firms from reacting.
By studying the tax rate reduction in the subsidiary country I further ruleout that complementarity or substitutability of production functions withinthe multinational group are driving the results. This might, however, occur ifvariation in the parent tax rate is used for identification as shown by Becker
2

and Riedel (2012). Overesch (2009) reports that changes in the tax rate ofthe parent company affect subsidiary’s investment spending. He explainshis finding by profit shifting activities. In the light of the results by Beckerand Riedel (2012) the observed impact could be fully independent of profitshifting activities but simply be related to the interdependence of productionfunctions within multinational groups.
Another contribution to the literature relates to the investigation of thepotential different impact of different means of profit shifting on capital accu-mulation. So far, prior studies did not distinguish between these two differentchannels (e.g. Mintz and Smart, 2004; Overesch 2009, Egger et al., 2014).As suggested by Schindler and Schjelderup (2013), the two different forms ofprofit shifting are, however, likely to affect capital accumulation differently.This paper is the first that accounts for the potential different impact andprovides empirical evidence on its relevance.
Moreover, I contribute to the literature by explicitly linking the profitshifting to the investment literature. So far, both literature streams havedeveloped more or less separately. Since multinational firms do account for alarge share of capital accumulation, it is important to understand how thesefirms react to tax policy and how the behavioral response is influenced bythe presence of profit shifting activities. The results of this paper highlightthat tax rate reductions in high tax countries may not spur investment, ifmultinational firms shift profits via internal debt financing to low tax juris-diction.
Finally, by estimating both, a difference in differences and a more struc-tural approach, a comparison of the two methods is possible. This allowsme to gain insights into the relevance of methodological differences. Further,using two different methods that provide consistent results adds confidencein the empirical results.
The remainder of this paper is as follow. In section two the 2008 corporatetax reform in Germany, the high tax country used in this study, is described.Domestic and multinational firms’ expected behavioral responses with re-spect to internal debt financing and capital accumulation are illustrated insection three. After introducing the data in section four, the methodologyand the results of the difference in differences matching strategy are presentedin section five, and for the structural approach in section six. In section seventhe results of the two methods are compared. Section eight concludes.
3

Figure 1: Corporate tax rates for selected parent companies of German sub-sidiaries in 2008
Notes: Corporate income tax rates in 2008 for countries with at least 50 parent firm - yearobservations in the database are shown. Tax rates are obtained from the Corporate Tax Guideby Ernest & Young 2008.Source: DAFNE firm data base, 2008.
2 Institutional Background: The German Cor-
porate Tax Reform 2008
The identification strategy employed in this paper compares the behaviorof multinational and domestic firms in a high tax country in response to alarge tax rate cut. The country that provides almost ideal conditions for thisidentification strategy is Germany in 2008.
Firstly, prior to 2008, Germany had one of the highest tax rates on cor-porate profits in Europe and the world. Thus, almost every foreign ownedsubsidiary in Germany had an incentive to shift part of the profits abroad,e.g. to its headquarter (see Figure 1 for a distribution of the tax rates facedby parent companies owning German firms). Most of the subsidiaries alsoseemed to follow this incentive as empirical evidence suggests that profitshifting activities came, to a large extent, at Germany’s cost (Huizinga andLaeven, 2008).
Secondly, to discourage firms from shifting profits abroad, the German
4

government implemented with the corporate tax reform 2008 a strong reduc-tion of the tax rate on profits from 40 to 30%.
Further changes due to the corporate tax reform concern the introductionof less generous depreciation allowances, and the introduction of anti-abuseregulations as the new interest barrier (see e.g. Buslei and Simmler, 2013).A minor change that is, however, important in the light of this study relatesto the adding back regulations of the local business tax. Certain financeexpenses, e.g. interest expenses, have to be partially added back to the taxbase of the local business tax. Due to these tax base adjustment the tax rateon profits does not necessarily equal the tax rate to which interest expensesare deductible in Germany.4 Before 2008, only interest expenses on long termdebt (with a maturity exceeding one year) had to be added back to 50% tothe local business tax base. In order to treat interest expenses for short andlong term debt in the same way, this applies beginning in 2008 to all interestpayments but only to 25%. The share of the local business tax of the overalltax rate is around 50%.5
3 Theoretical Background
To illustrate the impact of internal debt financing on real investment andhow both are affected by the German corporate tax reform 2008, the cost ofcapital approach (e.g. Jorgenson, 1963; Hall and Jorgenson, 1967) is usedand extended by allowing for internal debt financing.6
To account for internal debt financing in the multinational context, thestarting point of the approach is a shareholder who owns two representativefirms in two different countries (G and A). The shareholders’ interest is to
4The origin of these regulations go back to the 1990s, when the local business taxes,set and collected by German municipalities, were designed to be a tax on infrastructureuse.
5Before 2008, the local business tax rate was calculated as local business tax multi-plier, set by the municipality, times the Gewerbesteuermesszahl, which was 5.5% for allmunicipalities. Further, the local business tax was deductible from its own and from thecorporate income tax base. The effective local business tax amounts before the reform toroughly 18% for the average multiplier of 400. Since local business tax payments reducethe corporate income tax base, the average overall tax rate amounts to 39% (18%+(1-18%)*26.38%). Due to the corporate tax reform, the Gewerbesteuermesszahl was reducedto 3.5% and the deductibility of the local business tax abolished. The average overalltax rate on profits amounts thus after 2007 to 29% (14% local business tax and 15.8%corporate income tax, including solidarity surcharge). The difference between the tax rateon profits and to which interest payments are deductible decreased. On average, beforethe reform it amounted to 6%; after to 3.5%.
6For an overview and extensions of the approach see Devereux (2004).
5

maximize the value of the two firms (VG,t and VA,t). The value of a firm canbe expressed as the present value of its future cash flows (equation (1)), whichis the sum of real activity cash flow (πr) and financial activity cash flow (πf )(equation (2)). The real activity cash flow in period s for each firm equalssales (price ps multiplied with output F (Ks−1)) minus investment costs andtaxes. Firms’ tax payments are determined by the tax rate on profits (u)and depreciation allowances (φ) (see equation (3) for the firm in country G).
The financial activity cash flow captures internal debt financing and, thus,borrowing and lending between the two firms of the shareholder. It is deter-mined by three terms and exemplary shown for the firm in country G.7 Thefirst term in equation (4) reflects that interest payments for internal debtfinancing, given by the share βG,t−1 of the capital stock (KG,t−1) in coun-try G, can be deducted from the tax base.8 The tax rate to which interestpayments are deductible (uG,mod,t) may however differ from the tax rate onprofits (uG,t) due to, for instance, adding back regulations or thin capital-ization rules. Since internal debt financing cannot exceed the amount of thecapital stock, it is important to note that β is bounded as it cannot exceedone.9 The second term determining firms’ financial cash flow is the impactof internal debt financing of the capital stock in A on profits in G, thus theopposite case. In this case, the tax base in country G is broadened by thereceived interest income.
Vt = VG,t + VA,t (1)
Vt,G = Et∑s=t
(1 + r)−s[πr,s,G + πf,s,G] (2)
πr,t,G = (1− uG,t)pG,tF (KG,t−1)− qtIG,t + usφ(qtIG,t +KTG,t−1)(3)
πf,t,G = −(1− uG,mod,t)rβG,t−1KG,t−1 + (1− uG,t)rβA,t−1KA,t−1
+c(βG,t−1) (4)
c(βG,t−1) = cfix + cvar(βG,t−1) = cGπ∗G,t(uG,mod,t − uA,t) + cvar(βG,t−1)(5)
Kt = It + (1− δ)Kt−1 (6)
KTt = (1− φ)KT
t−1 + (1− φ)qt−1It (7)
If firms use internal debt financing, they face costs (c(β)) that consist of
7In the following I ignore that cash flow changes due to the received respectively paidback, nominal value of debt and focus only on interest payments.
8In principle, multinational firms might manipulate interest rates as well. However,this strategy would conflict with the arm’s-length principle and is thus not considered inthis study.
9In principle β might exceed one but in this case capital would earn only the interestrate. Thus, it would be beneficial to receive this income in the low tax country.
6

a fixed (cfix) and variable part (cvar(β)) (equation (5)). The fixed cost com-ponent is assumed to be a fraction (cG) of firms’ maximal tax savings basedon firms’ maximal taxable profits (π∗
G,t(uG,mod − uA)).10 It accounts for thefact that multinational firms have different ways to shift profits abroad, e.g.internal debt financing and transfer pricing. Thus, they use the way thatallows them to shift more (which is the way with lower overall costs). Themain advantage of using a fixed cost component for internal debt financingis that transfer pricing and its related costs does not have to be explicitlymodeled but are still included in the model. There are various ways to modeltransfer pricing as this depends on the input factors (e.g. royalties or man-agement services) of which prices are manipulated. The variable cost partof internal debt financing is assumed to be convex in the fraction of internaldebt financing as standard in the literature.11 It relates to tax engineeringexpenses incurred in order to avoid or relax regulations such as thin capital-ization rules and/or controlled-foreign-company rules.12
The shareholder maximizes the present value of the future cash flows bychoosing the state variables for the two firms, firms’ capital stock and thefraction of internal borrowing (K and β). The maximization is subject toa capital accumulation constraint (equation (7)) and the valuation of thecapital stock for tax purposes (equation (8)).
Optimal Internal Debt Financing: Out of the model, three insightsregarding the optimal fraction of internal debt financing (β∗
G) in countryG can be derived (equations (8) and (9)). One insight relates to the firstorder condition for the interior solution, the two other deal with the cornersolutions.
One of the two corner solutions is that the firm can shift as much as itwants and thus faces ultimately a zero tax burden in the high tax countryG (third line equation (9)). The maximum fraction that has to be shiftedis given by equation (8) as for βmaxG,t−1 taxable profits in country G are zero
10In principle the maximal tax savings could relate to actual production, but this wouldnot change the results qualitatively.
11Further, prior literature assumes that the cost of shifting increases in the capital stock(e.g. Schindler and Schjelderup, 2012). The results are not sensitive to this choice. Theonly difference is that the impact of internal debt financing on capital accumulation wouldin this case be reduced by the costs of shifting. Since I am not able to account for thecost of internal debt financing in the empirical analysis, I have to leave the question forfuture research and assume the simpler case in my model. The impact I estimate is thenet effect.
12It is assumed that the costs of internal debt financing are not tax-deductible. Theassumption is not crucial for the results. If the costs are deductible, then the firm has anincentive to deduct them in the high tax country.
7

in period t.13 This maximum fraction increases with the ratio of profitsbefore interest payments to the capital stock (first term within the brackets)and decreases with the share of depreciation allowances to the capital stock(second term within the brackets). Since β cannot exceed one, this meansthat firms with a high ratio of profits before interest to their capital stockand/or low depreciation allowances are not able to reduce their tax paymentsto a large extent by using internal debt financing. Finally, the maximumshare increases with the ratio between the tax rate on profits and the taxrate to which interest payments are deductible.
The other corner solution (first line, equation (9)) and thus the second in-sight relates to the question whether a firm engages in internal debt financingor not. This depends on the fixed costs. If tax savings exceed the costs, thefirm engages in internal debt financing. Since the fixed costs are a fraction offirms’ potential overall tax savings, a firm will only engage in internal debtfinancing if it can substantially reduce its tax payment. Thus, drawing fromthe insights before, firms with a high ratio of profits to the capital stock areless likely to engage in internal debt financing as these firms are not able toreduce their tax burden to a large extent.
Finally, the last insight relates to the question how much internal financ-ing is used if the firm engages in debt financing and cannot shift as muchas it want. It is given by the first order condition for the interior solution(second line, equation (9)) and states that for the optimal amount of internaldebt financing the marginal benefit of internal debt financing, expressed bythe tax savings, equals the marginal costs, a common result in the literature(e.g. Schindler and Schjelderup, 2012).
βmaxG,t−1 =uG,t
uG,mod,t
πTr,t,GrKG,t−1
(8)
=uG,t
uG,mod,t[pG,tF (.)
rKG,t−1
−φ(qG,tIG,t +KT
G,t−1)
rKG,t−1
]
βoptG,t−1 =
0 if a ≤ π∗
G,tcG
rKG,t−1
KG,t−1r(uG,mod,t − uA,t) = cβG,t−1(β∗
G,t−1) if a >π∗G,tcG
rKG,t−1
and β∗G,t−1 ≤ βmaxG,t−1
min(1, βmaxG,t−1) if β∗G,t−1 > βmaxG,t−1
13One has to derive an expression for firms tax payments in period t, set it to zero andsolve it for β.
8

with
a =β∗G,t−1rKG,t−1 −
cvar(β∗G,t−1)
uG,mod,t−uA,t
rKG,t−1
(9)
Optimal capital stock with debt shifting: The first order conditionfor the optimal capital stock of the representative firms in county G is givenby equation (10).14 In the optimum the marginal productivity of capital (lefthand side) has to equal marginal costs (right hand side). The latter consistfor multinational firms of two parts. The first term is the usual expressionfor the user costs of capital using retained earnings (e.g. Chirinko et al.,1999). It depends on the present value of depreciation allowances (1−A)15,the finance costs r, the economic depreciation rate δ, and the business taxrate ut. The second term captures the impact of internal debt financing. Itis obvious that if the capital stock of the representative firm in country G is(partly) financed with internal debt (βG > 0), the user costs of capital arelower than without shifting (equation (11)). Further, since only βG,t affectsthe return of capital in country G, there will be no difference in the user costsof capital in country G, if profits are shifted from A to G.
FKG,t=
(1− AG,t+1)(r + δ))− rβG,t(uG,mod,t+1 − uA,t+1)
pG,t+1(1− uG,t+1)(10)
= UCCREG,t −
rβG,t(uG,mod,t+1 − uA,t+1)
pG,t+1(1− uG,t+1)(11)
A =utφ(1 + r)
φ+ r(12)
Before summing up the hypothesis derived from the neoclassical invest-ment model, two simplifying assumption are discussed. The first concernsthe fact that only two companies are considered in the analysis, the secondthe role of external debt financing.
More than two countries: To understand the incentive in a moregeneral setting, the case with three firms is briefly described. The shareholderowns in the following a firm in T as well. Profits from G can now be shiftedto A and T. The costs of shifting depend on the overall fraction that is shiftedabroad (βG,A,t+βG,T,t). Further, one may assume that the shareholder prefers
14The expression is derived by taking the first order condition for the optimal capitalstock, then setting inflation and expected real change in the price of capital to zero.
15Present value of depreciation allowances is shown for declining-balance method.
9

(or dislikes) profits to be located in country A (ω). The first order conditionfor the interior solution for the optimal fraction of internal debt financing areshown in equation (13) and (14).
cβG,A,t= KG,tr(uG,mod,t+1 − uA,t+1) + ωβG,A,t
(βG,A,t) (13)
cβG,T,t= KG,tr(uG,mod,t+1 − uT,t+1) (14)
FKG,t= UCCRE
G,t −rβG,A,t(uG,mod,t+1 − uA,t+1)
pG,t+1(1− uG,t+1)(15)
= −rβG,T,t(uG,mod,t+1 − uT,t+1)
pG,t+1(1− uG,t+1)
Depending on the preference parameter (ω) and the tax rates in the twocountries, two different cases may arise out of this setting. Firstly, the share-holder shifts all profits to one location, which is then not different from thetwo country case. Secondly, it may be optimal to shift part of the profitsto one place and the rest to the other place. The capital stock in G for thelatter case is given by equation (15). It depends now on the tax rates inall three countries, but the implications are the same as in the two countrycase. If multinational firms shift profits abroad via internal debt financing,they face lower investment costs and thus have a higher capital stock thandomestic firms.
External Debt Financing: Compared to retained earnings, internaland external debt financing is tax favored as interest payments are de-ductible from the tax base. In contrast to internal debt financing, how-ever, both, domestic and multinational firms, are able to use external debtfinancing. Following the trade-off-theory, the use of external debt financingcauses bankruptcy costs (Kraus and Litzenberger, 1973). If in the optimum,bankruptcy costs equal the tax advantage of external debt on the firm level,both type of firms would - if otherwise identical - use the same amount ofexternal debt and thus react to the same extend to a change in the tax advan-tage. Further, their investment would be equally affected. The implicationsstated above would thus be the same.
If marginal costs and benefits are not balanced on the firm but ratheron the group level, the picture would change. In this case, external andinternal debt are to some extend substitutes as multinational firms have anincentive to load firms in high tax countries with a larger amount of debt(see Moen et al., 2011). Multinational firms will then react differently withtheir external debt ratio to changes in the tax rate. Although this is likelyto affect the estimates for the overall debt ratio, I do not expect a bias in
10

the investment equation. External debt financing does not seem to influencecapital accumulation as at the margin marginal costs and marginal benefitsof external debt financing equal each other (e.g. Bond and Xing, 2011).
Summing up, the following hypothesis can be derived out of the model.
Hypothesis 1a: If the tax rate on profits in country A is lower than the taxrate to which interest expenses are deductible in country G, then the share-holder of the firms in G and A shift profits from G to A. The larger thedifference is, the higher the share of internal debt financing.
Hypothesis 1b: Firms with a high ratio of profits before interest to theircapital stock do not engage in internal debt financing due to fixed costs. Fur-ther, internal borrowing of firms with generous depreciation allowances de-pends less on the tax rate difference as these firms are able to shift as muchincome as they want and are, therefore, not constrained by marginal costs.
For the 2008 corporate tax rate cut, this means that multinational firmswill decrease their internal debt financing as the tax advantage to engage ininternal debt financing is reduced. Further, I expect due to fixed costs ofinternal debt financing that firms with a low ratio of profits to their capitalstock will decrease their internal debt financing stronger than firms with ahigh ratio of profits. Since firms benefiting from more generous depreciationallowances have to shift less, their fraction of internal borrowing was lowerbefore the tax rate reduction. Thus, their reduction in the internal debt ratioin response to the tax rate cut should be less strong.
Hypothesis 2a: If profits are shifted from country G to A, the capital stockin G is larger than without internal debt financing shifting.
Hypothesis 2b: The relative advantage of the profit shifting firm with re-spect to investment increases in the ratio between profits shifted abroad andthe overall taxable profits. Thus, the positive impact on investment is largerfor firms with a low ratio of profits before interest payments to the capitalstock and for firms with less generous depreciation allowances.
If multinational firms shifted profits via internal debt financing to lowtax jurisdictions prior to the tax rate reduction, their investment was lessaffected by the national tax rate. In other words, their capital stock willbenefit less from the tax rate reduction, and should, thus, decreases relativeto purely domestic firms. Further, I expect that the reduction in the capitalstock is larger for firms that were more actively engaged in internal debt
11

shifting before the reform. These are firms with a low share of profits to thecapital stock and firms with less generous depreciation allowances.
4 Data
To test the hypothesis outlined in the previous section, two different methodsare used. The first method is a difference in differences propensity scoreestimation; the second a more structural approach. Since for both methodsthe same dataset is used, although using different subsample, I start bydescribing the data and then introduce in the next two sections the methodsin detail and present the results.
The database of this study are unconsolidated financial statements, own-ership and subsidiary information for German incorporated firms between2004 and 2010 from the database DAFNE. This data has two main advan-tages compared to other data sets used to study the behavior of multinationalfirms. Firstly, beginning in 2006 it covers almost 85% of all German firmswith limited liability. Thus, the database allows to compare multinationalfirms with a broad set of domestic firms instead of exploiting differences be-tween multinational firms. Secondly, at least for a subsample of firms incomestatements are observed. This allows on the one side to explore firm hetero-geneity as suggested by the theoretical model. On the other side it allows tocomplement the main analysis, which uses only balance sheet information,with additional regression results using interest payments and profits.
Two main selections are made to derive the final samples. Firstly, I re-quire that all firms in the sample are owned by another non-natural person.The main reason is to exclude stand-alone companies from the control groupsuch that only firms belonging to a domestic group are compared with firmsbelonging to a multinational group. Secondly, I require that the firms in-cluded in the final sample are observed before and after the reform as theidentification is based on the changed incentive due to the specific reform.A minor selection concerns the exclusion of subsidiaries owned by parentcompanies located in countries that apply the worldwide principle for corpo-rate taxation (in my sample US, UK, and Japan). Their investment decisiondepends independently of internal debt financing on the parent tax rate.Further, firms with changes in the ownership structure are excluded as thesecould be driven by taxes as well.
The data is complemented by a collection of foreign tax rates to capturethe tax incentive to engage in internal debt financing to the headquarter.16
Further, to exploit variation in the tax rate on profits in Germany, which
16The data stems from the Ernst & Young tax guides.
12
varies across the 12,000 municipalities, municipality specific local businesstax rates are merged to the data using firms’ postal code.17
5 Difference-in-Differences Propensity Score
Estimation
5.1 Methodology & Descriptive Statistics
The first approach used to provide evidence on the causal impact of internaldebt financing on capital accumulation compares the financing and invest-ment behavior of purely domestic to multinational firms, before and after thereform. Thus, I estimate a difference in differences specification of the formgiven in equation (16). The main advantage of this approach is that I do nothave to model the tax incentive to engage in internal debt shifting, which isalmost impossible given the complex structures of multinational companiesand the missing information on finance flows.
Yi,t = αi+β0Treatmenti+β1Treatmenti∗Reform+β2Reform+ei,t (16)
Descriptivie statistics, reported in Table 1, suggest that multinationaland domestic firms are different with respect to their observable characteris-tics. Domestic firms are smaller, have a lower debt ratio and a higher capitalstock than multinational firms. Further, they operate in different indus-tries. To account for these difference, I combine the difference in differenceswith a propensity score matching approach. This approach stems from theevaluation literature and can be used to make treatment and control groupmore comparable (Heckman et al., 1997).18 It is used in a similar contextby Egger et al. (2010). The idea of the approach is to use only treated andcontrol companies that are sufficiently similar to each other for the compar-ison. Treatment and control group observations are thus matched on a setof variables X such that the conditional mean independence assumption isfulfilled. The assumption states that both group would behave similar in theabsence of the treatment.
Crucial assumption for the matching approach is the inclusion of all rel-evant characteristics X in the analysis. The broadest set of variables, onwhich I match the two groups are: industry classification, debt ratio 2005,
17The local business tax rates are provided by the Federal Statistical Office. Since Ihave firm level data and not plant level data, I cannot account for the fact that plants ofthe same firm located in different municipality may face different local business tax rates.
18Stuart (2010), Caliendo and Kopeinig (2008) and Caliendo and Kuenn (2011) providecomprehensive overviews and an application of matching methods.
13

Table 1: Descriptive statistics for treatment and control group up to 2006
Mean p-valueControl Treatment t-testGroup Group (two-sided)
firm size (log(total assets)) 8.29 8.87 0.00debt ratio 0.45 0.50 0.00log(capital stock in thd. EURO) 6.14 5.54 0.00d.debt ratio -0.01 -0.01 0.57d.log(capital stock) 0.05 0.02 0.21
Industry dummiesagriculture, forestry and fishing 0.01 0.00 0.00mining and quarrying 0.00 0.00 0.56manufacturing 0.05 0.25 0.00electricity and gas supply 0.11 0.03 0.00water supply 0.02 0.03 0.00construction 0.04 0.23 0.00wholesale and retail trade 0.01 0.00 0.00transportation and storage 0.07 0.07 0.81information and communication 0.01 0.02 0.34accommodation and food service activities 0.42 0.33 0.00real estate activities 0.05 0.00 0.00professional, scientific and technical activities 0.09 0.01 0.00administrative and support service activities 0.11 0.03 0.00
Notes: Control group consists of purely domestic firms, that are observed between 2005 and2009. Treatment group includes firms that had before the reform an incentive to engage indebt financing to the headquarter, which was abolished due to the reform.Source: DAFNE firm data base 2004 - 2006.
firm size 2005 (measured as natural logarithm of total assets), and (naturallogarithm of the) capital stock in 2005 as well as the change in the capitalstock and the debt ratio between 2005 and 2006.19 I use the 2005 and 2006characteristics as the reform was announced in 2007. Although one mightargue that matching on capital stock and finance structure does not increasethe similarity of treatment and control group since multinational firms thatshift profits have a higher debt ratio and invest more, the null hypothesisis that both firms behave in the same way. To check the sensitivity of theresults, I exclude these variables in a robustness check.
Since I match on multiple variables, proximity between observations isbased on the estimated one-dimensional propensity score, which is the prob-ability of receiving treatment, conditional on the matching variables X. Itis estimated by running a logistic regression of the treatment indicator onX.20 As distance measure, I use the linear propensity score, which improvesthe balance between treatment and control groups (Rosenbaum and Rubin,1985). Finally, the observations are matched using kernel and, in a sensitivity
19In a robustness specification, I also matched on changes between 2004 and 2005. Theresults are qualitatively and quantitatively unchanged and are available upon request.
20Rosenbaum and Rubin (1985) show that conditioning on X is equivalent to condition-ing on the propensity score.
14

check, 5-to-1 nearest neighbor matching, both with replacement. To evaluatethe matching quality I report standardized bias before and after matching.21
Since the combination of DiD and propensity score estimation requires a bal-anced sample as otherwise the estimation would suffer from sample attrition,I include only firms in the sample that are observed in every year between2005 and 2009.
The control group in my setting consists of 6,083 purely domestic firms.These are firms that are ultimately owned by another German corporation,and that do not own foreign subsidiaries, neither directly nor indirectly (viathe parent company or subsidiaries). The treatment group in contrast consistof 1,081 foreign owned firms. These multinational firms had before the reforman incentive to engage in internal debt financing to the headquarter that wasabolished by the reform. The parent companies of these subsidiaries are, forexample, located in France or Sweden (see Table A.1 in the Appendix). Ifocus on this particular group of multinational firms as, firstly, only 30% ofthe multinational firms have a subsidiary in a tax haven (Gumpert et al.,2011; Buettner et al., 2013). Moreover, there seems to be a home bias inmultinational firms’ profit shifting activities (Dischinger et al., 2014). Thus,shifting profits to the parent company is likely to be a very important channel.Secondly, if a multinational subsidiary had before and after the reform anincentive to engage in internal debt shifting, its’ reaction is likely to be lessstrong, which may attenuate the estimated treatment effects. The sensitivityof the exclusion of other multinational firms is assessed in a robustness check.
The two outcome variables of interest are (the natural logarithm of) firms’capital stock and firms’ debt ratio (defined as total liabilities to total assets,inluding internal liabilities). The latter is used since internal liabilities arenot observed for all firms in the sample. Following the theoretical predic-tions, firm heterogeneity is assessed by splitting the sample according tofirms’ ratio of profits before interest payments to total assets and reapplythe propensity score matching approach. Since profits are not observed foreach company in the data, two-digit industry averages based on all availablefirms in the database are used. The mean ratio of profits before interestto total assets is around 30%. To uncover the impact of the generosity ofdepreciation allowances on internal debt financing and firms’ capital accu-mulation, I interact the ratio of depreciation allowances to total assets withthe Treatment*After variable. As for profits, two-digit industry averages areused, the mean is around 5.4%.
21The standardized bias is calculated as the difference between the mean characteristicof the treated and matched control firms, standardized by the square root of the averageof the variances in the two groups.
15

5.2 Results
Before presenting the results based on the matched sample, information onthe propensity score estimation is provided. The results from the logisticregression used to estimate the propensity score reflect the differences be-tween foreign owned firms and purely domestic firms (Table A.2 in the Ap-pendix). After estimating the propensity score, I apply kernel matching toidentify suitable control observations for every firm in the treatment group.The standardized bias indicates a successful matching as for all variables, Imatch on, the bias is below 5% (Table A.3 in the Appendix).
I begin with providing graphical evidence on the studied relationship. Theevolution of the debt ratio for treatment and control group using the matchedsample are shown on the left hand side of Figure 2. The debt ratio is nor-malized by groups’ mean debt ratio in 2006. The common trend assumptionseems to be fulfilled as between 2005 and 2006 both groups exhibit a similartrend. In line with the theoretical expectations, both the treatment (Shifter-NonShifter) and control (purely domestic firms) group decreased their debtratios after 2007 since the tax rate reduction reduced the tax advantage ofdebt (e.g. Modigliani and Miller, 1963; Feld et al., 2013). Further, in linewith the derived hypothesis in section 3, the debt ratio of the treatmentgroup decreased stronger.
The evolution of the capital stock for both type of firms is shown onthe right hand side of Figure 2. Depicted is the natural logarithm of thecapital stock, normalized by the groups’ mean in 2006. Purely domesticfirms increased their capital stock after 2007, which is consistent with theliterature on taxes and investment spending (e.g. Chirinko et al., 1999).Firms for which the tax incentive to engage in internal debt financing wasabolished (Shifter-NonShifter) did not increase their capital stock.
The clear picture of the graphical analysis is confirmed by the results ofthe difference in differences regression analysis, which accounts for firm spe-cific effects. Column (1) and (2) of Table 2 show the results for the debt ratioand the natural logarithm of the capital stock as dependent variable based onthe sample using kernel, and (3) and (4) using 5-to-1 nearest neighbor match-ing. In all specification, there is a statistically significant, negative impactfor the treatment group due to the corporate income tax rate reduction in2008. The results suggest that on average the treatment group reduced theirdebt ratio by 2.2 (kernel matching) to 2.3%-points (5-to-1 nearest neighbor)compared to domestic firms. This is in line with the hypothesis that thesefirms reduced or even stopped using internal debt financing to lower theirtaxable income. With regard to the capital stock, the results show that firmswhich stopped shifting profits abroad via internal debt financing decreased
16

Figure 2: Evolution debt ratio and capital stock for purely domestic firmsand Shifter-NonShifter based on the matched sample
Notes: The debt ratio is defined as total liabilities to total assets. Groups and sample as described in the text.Source: DAFNE firm data base, 2005 - 2009.
their capital stock by around 7 (5-to-1 nearest neighbor) to 11%-points (ker-nel matching) compared to domestic firms. All presented results are so farin line with the theoretical hypothesis 1a and 2a outlined in Section 3.
Table 2: Results difference in differences (DiD) specification
Matching Method Kernel Nearest Neighbor KernelMatching Variables with debt variables without
debt variableschange capital stock
Dep. Var Debt Capital Debt Capital Debt CapitalRatio Stock Ratio Stock Ratio Stock
(1) (2) (3) (4) (5) (6)D(> 2007) -0.016*** 0.120*** -0.019*** 0.124*** -0.020*** 0.080***
(0.002) (0.009) (0.002) (0.008) (0.001) (0.011)D(TR)*D(> 2007) -0.022*** -0.107** -0.023*** -0.070* -0.023*** -0.125***
(0.005) (0.040) (0.005) (0.040) (0.005) (0.043)Observations 35,615 35,615 17,025 17,025 35,615 35,615
Notes: Robust standard errors in parenthesis. Each regression includes a full set of firm andtime dummies (not reported). Stars *, **, *** indicate significant at the 10/5/1% level.Source: DAFNE firm database, 2005 to 2009, own calculations.
Before turning to the heterogeneity analysis, the sensitivity of the resultsis assessed. I start with excluding the finance structure variables as well asthe growth rate for the capital stock from the matching variables. The mainargument is that due to the fact that multinational firms use internal debtfinancing and thus have a higher debt ratio than domestic firms, matchingtreatment and control group on their finance structure does not increase theirsimilarity but rather their dissimilarity. The results are reported in Table 2,column (5) and (6). The result for the debt ratio is almost unchanged, whilethe impact for the capital stock increases to 12.5%. Overall, however, theresults are not statistically different from the baseline specification.
17

The second sensitivity check concerns the focus on firms that had beforethe reform an incentive to shift profits to the headquarter, but not after.Table 3 reports the results where all multinational firms, respectively onlyShifter-Shifter (firms with an incentive before and after the reform to engagein debt financing to the headquarter) and NonShifter-NonShifter (firms thathad neither before nor after the reform an incentive to engage in debt financ-ing to the headquarter) form the treatment group. Neither for Shifter-Shifternor for NonShifter-NonShifter are significant results found. When using allmultinationals as treated firms, only the negative impact on investment issignificant. These results suggest that it seems to be, in particular, Shifter-NonShifter that drive the results, as only these firms had to adjust their debtfinancing due to the changed tax incentive.
Table 3: Sensitivity analysis: DiD specification
Matching Method KernelTreatment Group All multinational Shifter- NonShifter-(TR) firms Shifter NonShifterDep. Var Debt Capital Debt Capital Debt Capital
Ratio Stock Ratio Stock Ratio Stock(1) (2) (3) (4) (5) (6)
D(> 2007) -0.009*** 0.102*** -0.015*** 0.092*** -0.025*** 0.050(0.002) (0.015) (0.004) (0.014) (0.004) (0.054)
D(TR) * D(> 2007) -0.009 -0.099*** 0.002 -0.060 0.003 -0.117(0.006) (0.030) (0.011) (0.045) (0.006) (0.100)
Observations 40,455 40,455 33,900 33,900 27,270 27,270
Notes: Robust standard errors in parenthesis. Each regression includes a full set of firm andtime dummies (not reported). Stars *, **, *** indicate significant at the 10/5/1% level.Source: DAFNE firm database, 2005 to 2009, own calculations.
Heterogeneity Analysis: The results for firm heterogeneity with firms’debt ratio as dependent variable are presented in Table 4. There is onlyweak evidence that firms with a low ratio of profits to total assets (Table4, column (1)) decreased their debt ratio more compared to firms with ahigh ratio (Table 4, column (3)). Further, the difference is not statisticallysignificant. The main reason is probably that the external debt ratio doeschange differently for multinational firms, making thus the impact of theoverall debt ratio as measured in Table 4 ambiguous. With respect to therole of depreciation allowance, the results are also not fully convincing as theinteraction terms are not significant. However, for the group that is likely toengage in internal debt financing the main effect increases in absolute termsand the interaction term is positive, which is in line with a lower reductionin firms’ debt ratio the more generous the depreciation allowances are.
The results for the capital stock as dependent variable are in line withthe theoretical expectation. They show that firms, which are not active in
18
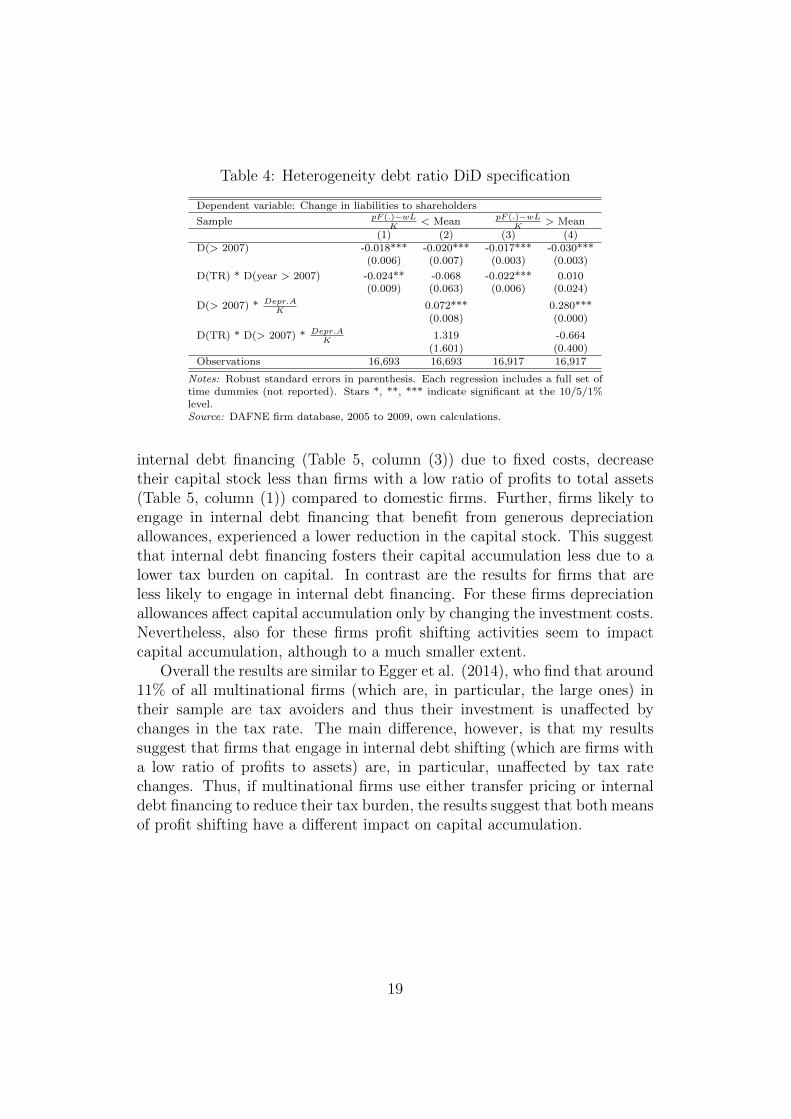
Table 4: Heterogeneity debt ratio DiD specification
Dependent variable: Change in liabilities to shareholders
SamplepF (.)−wL
K< Mean
pF (.)−wLK
> Mean
(1) (2) (3) (4)D(> 2007) -0.018*** -0.020*** -0.017*** -0.030***
(0.006) (0.007) (0.003) (0.003)
D(TR) * D(year > 2007) -0.024** -0.068 -0.022*** 0.010(0.009) (0.063) (0.006) (0.024)
D(> 2007) * Depr.AK
0.072*** 0.280***(0.008) (0.000)
D(TR) * D(> 2007) * Depr.AK
1.319 -0.664(1.601) (0.400)
Observations 16,693 16,693 16,917 16,917
Notes: Robust standard errors in parenthesis. Each regression includes a full set oftime dummies (not reported). Stars *, **, *** indicate significant at the 10/5/1%level.Source: DAFNE firm database, 2005 to 2009, own calculations.
internal debt financing (Table 5, column (3)) due to fixed costs, decreasetheir capital stock less than firms with a low ratio of profits to total assets(Table 5, column (1)) compared to domestic firms. Further, firms likely toengage in internal debt financing that benefit from generous depreciationallowances, experienced a lower reduction in the capital stock. This suggestthat internal debt financing fosters their capital accumulation less due to alower tax burden on capital. In contrast are the results for firms that areless likely to engage in internal debt financing. For these firms depreciationallowances affect capital accumulation only by changing the investment costs.Nevertheless, also for these firms profit shifting activities seem to impactcapital accumulation, although to a much smaller extent.
Overall the results are similar to Egger et al. (2014), who find that around11% of all multinational firms (which are, in particular, the large ones) intheir sample are tax avoiders and thus their investment is unaffected bychanges in the tax rate. The main difference, however, is that my resultssuggest that firms that engage in internal debt shifting (which are firms witha low ratio of profits to assets) are, in particular, unaffected by tax ratechanges. Thus, if multinational firms use either transfer pricing or internaldebt financing to reduce their tax burden, the results suggest that both meansof profit shifting have a different impact on capital accumulation.
19

Table 5: Heterogeneity capital stock DiD specification
Dependent variable: Growth rate of the capital stock
SamplepF (.)−wL
K< Mean
pF (.)−wLK
> Mean
(1) (2) (3) (4)D(> 2007) 0.114*** 0.080*** 0.141*** 0.136***
(0.016) (0.016) (0.013) (0.013)
D(TR) * D(year > 2007) -0.189** -0.776*** -0.094** -0.114**(0.086) (0.235) (0.043) (0.041)
D(> 2007) * Depr.AK
1.019*** 0.101***(0.076) (0.001)
D(TR) * D(> 2007) * Depr.AK
16.969*** 0.412(5.584) (0.669)
Observations 16,693 16,693 16,917 16,917
Notes: Robust standard errors in parenthesis. Each regression includes a fullset of time dummies (not reported). Stars *, **, *** indicate significant at the10/5/1% level.Source: DAFNE firm database, 2005 to 2009, own calculations.
6 Second Approach: Structural Approach
6.1 Methodology & Descriptive Statistics
To allow to link the results to the investment literature and as an addi-tional test of the hypothesis a second, more structural approach is applied.Compared to the first approach, it has the advantage that the estimated co-efficients are related to the potential tax savings of shifting profits abroad.The costs are that the tax incentive of multinational firms must be explicitlymodeled.
Since multinational groups are complex and the construction of the rel-evant tax incentive, therefore, almost impossible, I restrict the analysis toa particular channel, which is the incentive to shift profits to the headquar-ter. Three arguments support the relevance of this channel for multinationalfirms’ profit shifting activities. Firstly, the results of the difference in differ-ences approach are, only significant for multinational subsidiaries that hadan incentive to engage in internal debt shifting to the headquarter beforethe reform, but not after. Secondly, there seems to be a home bias in inter-nal debt financing (Dischinger et al., 2014). Thirdly, only up to 30% of allmultinational firms have subsidiaries in tax havens (Gumpert et al., 2011;Buettner et al., 2013). A further advantage is that liabilities to the par-ent company are directly observed in the data in contrast to liabilities toother subsidiaries. The latter are only available as the sum of all liabilitiesto other subsidiaries. Moreover, since the reform abolished the incentive toshift profits to the headquarter completely for some firms, a potential omitted
20

variables bias is of minor importance.22
To test the hypothesis outlined in Section 3, I estimate two equations.The first refers to the optimal amount of internal debt financing to the par-ent company (equation (17)). Thus, the dependent variable is the share of
liabilities against the parent company to total assets (LSi,t
TAi,t). The explana-
tory variable of interest is the tax rate differential (TRD). It captures theincentive to engage in profit shifting via internal debt financing. It is calcu-lated as the difference between the tax rate to which interest payments aredeductible, and the tax rate on profits of the parent company. Since the TRDis negative for some firms after the 2008 corporate tax reform, it should notaffect the internal debt ratio which includes no receivables from the parentcompany. To account for the irrelevance of the TRD in this case, I interactthe TRD with a dummy that is one if a company has no tax incentive toshift profits to the headquarter (D(NITS)). The coefficient of the TRD ( α1)should be positive since a positive TRD allows firms to save taxes by usinginternal debt financing. The TRD should, however, not influence the opti-mal amount of internal liabilities if a company has no tax incentive to shiftprofits. Thus, the sum of α1 and α2 should be zero.
Besides the TRD and the interaction term I control in the regression forthe business tax rate in Germany, as well as for firm size (measured as thenatural logarithm of total assets) and the business cycle (by including timedummies). The business tax rate in Germany is identified due to the variationin the local business tax rate. All control variables are captured in the matrixXi,t. Since the fraction of internal borrowing may depend on a firm specificeffect (η1,i), estimation is done in first differences. Robust standard errors,clustered for the location of the parent company, are reported.
LSi,tTAi,t
= η1,i + α1TRD + α2D(NITS) ∗ TRD + θ1Xi,t + εi,t (17)
The impact of internal debt financing on capital accumulation, i.e. thesecond hypothesis, is tested using a neoclassical investment equation. Theestimation equation (equation (19)) is derived by taking the natural loga-rithm of the first order condition with respect to the capital stock derived inthe model (equation (11)) and assuming a simple production function (equa-tion (18)). The equation states that the natural logarithm of the capital
22The omitted variable bias depends on the correlation between the omitted variable,which is for example the tax incentive to shift to a tax haven, and the variable of interest,which is the tax rate differential to the headquarter. Since I interact the latter with adummy that is one if the company has no tax incentive to shift to the headquarter, thebias is reduced as the interaction term between the dummy and the tax rate differentialto the headquarter is less correlated with the tax rate differential to the tax haven.
21

stock depends on the natural logarithm of the user costs of capital usingretained earnings less the tax advantage of the multinational firm due tointernal debt financing. To identify the impact of the tax advantage (γ), Ire-arrange equation (19). Following the argumentation for the internal debtshifting equation, I interact the tax advantage of the multinational firm witha dummy that is one if a firm has no tax incentive to shift profits to theheadquarter (equation (20)). I expect that the sum of the coefficient b2 andb3 should be zero, since a multinational firm should behave as a domestic firmif it does not engage in internal debt financing to save taxes. If, however, thefirm has a tax incentive to shift profits to the headquarter, it should havea higher capital stock. From a theoretical point I expect further that thecoefficient for the user costs of capital (b1) is −1.
Si,t = Kσi,t (18)
log(Ki,t) = η2,i − b1 ∗ log[UCCG,t − γ(uG,mod,t − uA,t)
(1− uG,t)]
+θ2log[Si,t] + wi,t (19)
log(Ki,t) = η2,i − b1 ∗ logUCCG,t + b2(uG,mod,t − uA,t)
(1− uG,t)UCCG,t
−b3(uG,mod,t − uA,t)
(1− uG,t)UCCG,tD(NITS) + θ2log[Si,t] + wi,t (20)
The key variable in the neoclassical investment equation (20) is the usercost of capital (UCC ). I construct them based upon the work by both Jor-genson (1963) as well as Hall and Jorgenson (1967). For the case withoutinternal debt financing, the UCCi,j,t for firm i in industry j at time t is theweighted average of its asset a specific user costs UCCi,a,j,t:
UCCi,j,t =∑a
κai,tUCCi,a,j,t =∑a
κai,tpItpSt
((1− ui,tza,t)(rt + δa,j,t)
1− ui,t(21)
where κai,t is the firm-specific share of asset a to total assets; pIt is a pricedeflater for investment goods and pSt the industry j-specific output price attime t23; δj,a,t is the asset a, industry j-specific economic depreciation rate24,
23The index pIt (Investitionsgueterpreisindex ) is constructed at the country level andthe price index pSt (Erzeugerpreisindex) on a disaggregated level for manufactures by theGerman Statistical Office. I use this information at the four digit industry level.
24The rate of economic depreciation δa,j,t can be derived from the national accountscapital stock (Kapitalstockrechnung), provided by the German Statistical Office. The rateis asset (fixed assets and structures), industry (four-digit-level) and time-specific. Therate of economic depreciation is calculated in prices of 2000.
22

and za,t are asset a-specific depreciation allowances by the tax system25,weighted by the tax rate ui,t. The financial costs are rt.
26 Two types ofassets are considered, property with buildings and fixed tangible assets.
I estimate the capital stock equation in first differences to account for firm-specific effects (η2,i). Robust standard errors clustered for the location of theparent company, are reported. Due to the short length of my panel, I am notable to instrument the UCC to account for measurement error (Goolsbee,2000), attenuation bias (Goolsbee, 1998; 2004), and endogeneity due to theasset specific weighting. Since attenuation bias and measurement error biasthe coefficient downwards, the coefficient for the UCC would present a lowerbound. Since this does not hold for the bias in case of endogeneity, thesensitivity of the results is assessed using firms’ twice lagged assets structurefor the weighting.27
Heterogeneity with respect to the use of internal debt financing is againstudied by, firstly, spitting the sample according to firm’s incentive to engagein internal debt financing and, secondly, interacting the TRD with the shareof depreciation allowances to total assets.
In the sample for the second approach 20,993 firms are included. Around20% of the firms are owned by foreign shareholders. Countries with thelargest number of parent companies are France, followed by Switzerland,Sweden and the Netherlands (see Table A.1 in the Appendix). The averagefirm in the sample has a fraction of internal liabilities to its shareholders of19%, the median is 9% (see Table 6). The mean of the UCC is 13%. Thetax rate differential, which is the difference between the tax rate to whichinterest expenses are deductible (incorporating the adding back regulation ofthe local business tax) and the tax rate of the parent company, for all foreignowned firms as described above has a mean of 3% and decreases over timedue to the corporate tax reform. Further, there is substantial variation in the
25In Germany, allowances for fixed assets and structures follow different methods. Struc-tures are depreciated on a straight line basis, whereas fixed assets could also be depreciatedaccording to the declining-balance method until 2007. The rates of depreciation are setby the Federal Ministry of Finance. Due to data restrictions, only regular depreciationallowances are considered. The relevant lifetime of structures for tax purposes is 33 1/3years. The yearly rate for the declining balance method is 0.2 for fixed assets. Becauseof missing information about the relevant lifetime for different fixed assets, I assumeda relevant lifetime of 16.9 years based on the investigation of depreciation allowances inGermany from Oestreicher and Spengel (2002).
26I used the overall yield on corporate bonds rt provided by the German CentralBank in its series ”Yields on debt securities outstanding issued by residents/corporatebonds/monthly average.”
27In case the twice lagged asset structure is not observed, lagged and then the currentasset structure is used.
23

Table 6: Descriptive statistics for the second sample
Obs. Mean P50 SDAll firmsCapital Stock in thd. EURO 20,993 41,963 4,468 912,975Turnover in thd. EURO 20,993 83,418 17,130 466,342LS/TA 20,993 0.19 0.09 0.23Business tax rate 20,993 0.35 0.37 0.05UCC 20,993 0.13 0.12 0.05d.log(Capital stock) 15,113 0.03 -0.01 0.68d.log(Turnover) 15,113 -0.00 0.03 1.13d.LS/TA 15,113 -0.00 -0.00 0.11D.Business tax rate 15,113 -0.02 0.00 0.03d.log(UCC) 15,113 -0.02 0.01 0.15
Only foreign owned firmsDummy(No incentive to shift, NITS) 4,719 0.31 0.00 0.46TRD 4,719 0.03 0.03 0.07TRD/(1-Business tax rate, BTR) 4,719 0.05 0.04 0.11d.Dummy(NITS) 3,322 0.09 0.00 0.35d.TRD 3,322 -0.01 0.00 0.04d.(TRD/(1-BTR)) 3,322 -0.02 0.00 0.06
Source: DAFNE firm data base 2004 - 2010.
tax rate differential. Almost 31% of the foreign owned firms do not have atax incentive to shift profits to the headquarter. For around 9% of the foreignowned firms, the incentive to shift profits vanished with the reform. The taxadvantage of the multinational, given by TRD/(1-Business tax rate), equals2% or roughly 15% of the UCC.
6.2 Results
The results for the change in the ratio of liabilities against shareholders to to-tal assets as dependent variable are reported in Table 7. Column (1) presentsthe baseline specification with the tax rate differential (TRD) and the in-teraction term. The results show that the TRD has a significant, positiveimpact on the ratio of liabilities to shareholders to total assets, if it is posi-tive. Otherwise no impact is found (bottom line of the table, standard errorsare calculated using the delta method). This is in line with the hypothesis1a derived from the model. It adds further evidence to the prior literatureon internal debt shifting as a switch in the two regimes (from shifting tonon-shifting) is used for the identification. The results also hold if the twotax rates enter separately (column (2)) or, if the TRD is defined as zero if itwould be negative (column (3)).
The size of the coefficients, which are statistically not different betweenthe specifications, suggests that an increase in the TRD by 10%-points in-creases the share of liabilities against shareholders by 2.9%-points. Com-pared to the prior literature that found an increase of around 1%-points (e.g.
24

Huizinga et al., 2008; Buettner and Wamser, 2013), the result seems quitelarge. However, at least three reasons may explain the difference. The firstrelates to the dependent variable and the used tax differential. In most ofthe papers on internal debt shifting, the dependent variable is the overall in-ternal debt ratio, which includes all liabilities to other group members (e.g.Buettner and Wamser, 2013), or even the overall debt ratio (e.g. Huizingaet al., 2008). The used tax differential is a (asset-) weighted tax differential.In case the weighting is not appropriate, a measurement error occurs, whichbiases the estimated coefficient to zero. This study, in contrast, focuses solelyon liabilities to the parent company and thus no weighting is necessary toderive the correct tax rate differential. Secondly, I explicitly account forthe direction of shifting by including the interaction term with the tax ratedifferential and the dummy that is one if the firm has no incentive to shiftprofits abroad. Other papers focus solely on liabilities of companies with-out accounting whether firms shift in or outwards. To assess whether thisargument explains part of the difference, I estimate a specification withoutcontrolling for the interaction with the No-Incentive-to-Shift dummy. Theresult is shown in column (4). The estimated coefficient for the tax ratedifferential decreases by 0.1 and is now much closer to prior studies. Fi-nally, adjustment costs may play a role as well. Since I focus on a particularstrong tax rate reduction, these are likely to be of minor importance for myestimate.
The results for the heterogeneity analysis show that firms within an in-dustry with a low ratio of profits before interest to the capital stock react totax incentives with their internal debt financing four times as strong than onaverage (Table 8, column (1)). In contrast, firms that are not likely to engagein internal debt financing due to fixed costs, seem not to react. Further, theresults suggest - in line with the hypothesis - that more generous depreciationallowances reduce the tax sensitivity remarkable. The estimated sensitivityof internal debt for firms with no depreciation allowances amounts to 2.3and is thus more than seven times higher than the one found in the baselineregression.
To assess whether the change in the internal liabilities shows up in interestpayments as well, I use the net interest result scaled by total assets as depen-dent variables (Table A.4 in the Appendix, column (1) and (4)). The resultssuggest that an increase of 10%-points in the tax rate differential, decreasethe net interest results to total assets for firms that are likely to engage indebt financing by around 0.0086. This estimate suggests an interest rate of6% on liabilities to the parent company, which seems quite plausible.28 For
28A 10%-points increase in the TRD increases the share of internal liabilities by 15%-
25

Table 7: Results debt ratio
Dep. Var. Change in liabilities against shareholders(1) (2) (3) (4)
d.Business tax rate [=uG,t] -0.331 -0.047 -0.333 -0.350(0.231) (0.254) (0.232) (0.227)
d.TRD [= umod,G,t − uA,t] (1) 0.288*** 0.185**(0.092) (0.072)
d.(TRD*D(NITS))(2) -0.311**(0.148)
d.umod,G,t*D(NITS) -0.275(0.172)
d.uA,t (1) -0.316***(0.112)
d.(uA,t*D(NITS))(2) 0.286*(0.155)
d.(TRD if > 0, 0 else) 0.285***(0.088)
d.Firmsize 0.035*** 0.035*** 0.035*** 0.035***(0.007) (0.007) (0.007) (0.007)
Observations 15,113 15,113 15,113 15,113Coefficient (1) + (2) -0.023 -0.031SE (Delta method) 0.079 0.140
Note: Robust standard errors clustered for the location of the parent in paren-theses. Each regression includes a full set of time dummies (not reported).Stars *, **, *** indicate significant at the 10/5/1% level.Source: DAFNE firm database, 2004 to 2010, own calculations.
Table 8: Results heterogeneity debt ratio
Dep. Var. Change in liabilities against shareholders
SamplepF (.)K
< MeanpF (.)K
> Mean
(1) (2) (3) (4)
d.Business tax rate [=uG,t] 0.231* 0.224** -0.600* -0.601*(0.112) (0.100) (0.356) (0.355)
d.(TRD if > 0, 0 else) 1.467*** 2.287** 0.112 0.118(0.506) (0.830) (0.093) (0.110)
d.(TRD if > 0, 0 else)*Depr.AK
-14.710* -0.115(8.218) (0.707)
d.Firmsize 0.026*** 0.027*** 0.045*** 0.045***(0.005) (0.006) (0.011) (0.011)
Observations 6,915 6,915 8,198 8,198
Note: Robust standard errors clustered for the location of the parent in paren-theses. Each regression includes a full set of time dummies (not reported).Stars *, **, *** indicate significant at the 10/5/1% level.Source: DAFNE firm database, 2004 to 2010, own calculations.
26

the other firms the sign is positive, which suggests that firms likely to engagein transfer pricing use less internal debt financing.
To assess whether firms unlikely to engage in internal debt financing usetransfer pricing to reduce their tax payments, I estimate the same specifi-cation using before interest profits to total assets as the dependent variable(Table A.4 in the Appendix, column (2) and (5)). The coefficient for theTRD is only significant in the sample of firms that are unlikely to engage ininternal debt financing. To rule out that measurement error drives the re-sults, I constructed a modified TRD that captures the incentive to engage intransfer pricing, and re-run the regressions. The modified TRD differs fromthe TRD used so far, as the latter accounts for the adding back regulation ofthe local business tax. The precision of the estimates increases (decreases)for firms unlikely (likely) to engage in internal debt financing (column (3)and (6)). This suggest that firms that are not likely to engage in internaldebt financing do use transfer pricing.
The results of the capital stock equation (Table 9) show that the elasticityof the capital stock with respect to its user costs is not statistically differentfrom −1, which is line with my model and the prior literature (e.g. Dwenger,2014). The coefficient for sales is, however, as in other studies quite small andsuggests decreasing returns to scale. An impact of the tax advantage of themultinational firm on investment spending is only found for firms engagingin tax-motivated internal debt shifting. If firms have no tax incentive to shiftprofits to the headquarter, the TRD does not affect their investment decision(bottom line of the table, coefficient is statistically not different from zero).This holds again when including the two tax rate separately as well as amodified TRD, which is zero if the TRD is negative.
Regarding firm heterogeneity, the results suggest that capital accumula-tion of firms with a low ratio of profits before interest to their capital stockdepends much more strongly on the TRD (Table 10, column (1) and (3)).The reason is that only these firms are able to use internal debt financingto re-allocate a large share of their profits, which reduces the tax burdenon capital and thus fosters investment. The advantage is, however, decreas-ing in the generosity of the depreciation allowances as they reduce the taxburden on capital as well (column (2) and (4)). In contrast is the impacton profit shifting activities on investment for firms that engage in transferpricing. For these firms profit shifting activities do only to a small extentaffect investment. This suggests in line with the results of the first approachthat transfer pricing and internal debt financing affect capital accumulation
points (Table 8, column (1)). This translates for a interest rate of 6% to a change in firms’interest results to total assets of 0.009.
27

Table 9: Results capital stock
Dep. Var. Growth rate of the capital stockB = (1 −BTR) ∗ UCC
(1) (2) (3)
d.log(UCC) -1.259*** -1.139*** -1.260***(0.138) (0.074) (0.138)
d. TRDB
(1) 0.136**(0.052)
d.(TRDB
*D(NITS)) (1) -0.151*(0.085)
d.uG,mod,t
B0.163**(0.075)
d.(uG,mod,t
B*D(NITS)) -0.156
(0.136)
d.uA,t
B-0.135**(0.065)
d.(uA,t
B*D(NITS)) 0.154
(0.114)
d.(TRDB
if > 0, 0 else) 0.134**(0.051)
d.log(Sales) 0.044*** 0.043*** 0.044***(0.013) (0.013) (0.013)
Observations 15,113 15,113 15,113Coefficient (1) + (2) -0.016 0.020SE (Delta method) 0.052 0.134
Note: Robust standard errors clustered for the location of theparent in parentheses. Each regression includes a full set of timedummies (not reported). Stars *, **, *** indicate significant atthe 10/5/1% level.Source: DAFNE firm database, 2004 to 2010, own calculations.
28

in different ways.
Table 10: Results heterogeneity capital stock
Dep. Var. Growth rate of the capital stockB = (1 −BTR) ∗ UCC
SamplepF (.)K
< MeanpF (.)K
> Mean
(1) (2) (3) (4)
d.log(UCC) -1.071*** -1.059*** -1.571*** -1.578***(0.123) (0.110) (0.147) (0.148)
d.(TRDB
if > 0, 0 else) 0.459** 0.923*** 0.098** -0.064(0.206) (0.267) (0.044) (0.118)
d.(TRDB
if > 0, 0 else)*Depr.AK
-9.119*** 3.294(2.449) (2.327)
d.log(Sales) 0.055*** 0.055*** 0.036** 0.035**(0.014) (0.014) (0.015) (0.014)
Observations 6,915 6,915 8,198 8,198
Note: Robust standard errors clustered for the location of the parent in parentheses.Each regression includes a full set of time dummies (not reported). Stars *, **, ***indicate significant at the 10/5/1% level.Source: DAFNE firm database, 2004 to 2010, own calculations.
Sensitivity AnalysisTo check the sensitivity of the results, I perform four robustness checks.The first relates to the fact that German owned firms might be differentlyaffected by the business cycle. Thus, I exclude all domestic owned firms fromthe sample and re-estimate the equation of the heterogeneity analysis. Theresults for the debt ratio are shown in Table A.5, column (1) and (4), andfor the capital stock in Table A.6, column (1) and (4). They are statisticallynot different from the results for the sample shown above.
The second sensitivity check accounts for the redesigned thin capitaliza-tion rule in Germany (see Buslei and Simmler, 2013). The regulation, whichwas introduced in 2008, restricts the amount of deductible interest expensesto 30% of the tax adjusted EBITDA (earnings before interest, taxes, depre-ciation and amortization). Since the German government, however, was notinterested in harming its own economy, the regulation came with several es-capes clauses. The most important one is the exemption limit of 1 millioneuro. If firms have net interest expenses below the exemption threshold, theregulation is not applied. The exemption limit was raised retroactively in2009 to 3 million euro due to the impact of the financial crisis. To checkthe sensitivity of my results, I re-estimate the last specifications using onlyfirms with net interest expenses below 1 million euro. The results for thedebt shifting equation are reported in column (2) and (5) of Table A.5 andfor the investment equation in column (2) and (5) of Table A.6. Again the
29

results are not statistically different from the ones using the whole sample,which is due to the fact that only few firms are affected by the regulation.
In the third sensitivity check the internal debt shifting equation is es-timated using the overall internal debt ratio as dependent variable. It isdefined as the sum of liabilities to the parent company and to all other groupmembers. The main idea is to assess whether the changed incentive to engagein internal debt financing to the headquarter causes an increase in liabilitiesto other group members. If this is the case, the estimated coefficient for theTRD should shrink sharply. The results suggest, however, that no substitu-tion took place (Table A.5, column (3) and (6)).
Finally, the fourth sensitivity test relates to the potential endogeneity ofthe UCC. To address whether this biases the estimates for the tax advantageof the multinational firm in the capital stock equation, I use the twice-laggedassets structure for weighting the asset-specific UCC. The results are shownin Table A.6 in the Appendix. Although the estimated coefficient decreasesfor the UCC, the ones for the tax advantage as well as for the impact of thedepreciation allowance remain basically unchanged.
7 Comparing the two Methods
To compare the results of the two different methods, I calculated the ex-pected change in firms’ debt ratio and capital stock for the first sample usingthe structural parameter estimates of the second method. More precisely, Ipredict firms’ behavioral response with respect to the two variables using thechange in the TRD and TRD/(1-BTR)UCC for Shifter-NonShifter for thefirst sample from 2007 to 2008. Table 11 summarizes the estimated impactfor the two methods.
The comparison shows that the ratio between the change in the (internal)debt ratio and in the capital stock are almost identical for the two methods(around 21%). The absolute impact differs however. The impact estimatedin the structural approach is only half the size of the estimated impact onthe DiD approach. Two reasons may explain the difference and both arerelated to the used tax rate differential, which is the Achilles’ heel of thesecond approach. The first explanation questions whether the adding backregulation for the local business tax before the reform were binding. Accord-ing to the regulation, 50% of the interest payments on long term debt hadto be added back. Since multinational firms could avoid the regulation byusing only short term loans, the used tax rate differential would not beenthe correct one. To investigate whether this changes the picture, the impacton debt ratio and capital stock is calculated using the modified TRD. The
30

Table 11: Comparison of the results DiD and structural approach
DiD Structural ApproachEstimated Estimated TRD resp. Estimated
Coefficient Coefficient TRD(1−BTR)UCC
Impact
Baseline estimation resultsChange in the debt ratio -0.022*** 0.285*** -0.043 -0.012***
(0.005) (0.088) (0.004)Change log(capital stock) -0.107** 0.134** -0.443 -0.059**
(0.040) (0.051) (0.022)d.Debt
d.log(capitalstock)in % 21 21
A1: TRD if adding back regulation local business tax before the reform was not binding[A2: 30% shift to the headquarter and 70% to other subsidiaries]Change in the debt ratio 0.022*** 0.285*** -0.073 [-0.075] -0.021*** [-0.022***]
(0.005) (0.088) (0.006) [(0.007)]Change log(capital stock) -0.107** 0.134** -0.744 [-0.0769] -0.099** [-0.103**]
(0.040) (0.051) (0.038) [(0.039)]
Firm likely to engage in debt shifting with no depreciation allowancesChange in the debt ratio -0.068 2.287*** -0.043 -0.095***
(0.063) (0.830) (0.035)Change log(capital stock) -0.776** 0.923*** -0.443 -0.435***
(0.235) (0.267) (0.118)d.Debt
d.log(capitalstock)in % 9 22
A1: TRD if adding back regulation local business tax before the reform was not binding[A2: 30% shift to the headquarter and 70% to other subsidiaries]Change in the debt ratio -0.068 2.287*** -0.073 [-0.075] -0.161*** [-0.168***]
(0.063) (0.830) (0.061) [(0.062)]Change log(capital stock) -0.776** 0.923*** -0.744 [-0.769] -0.733*** [-0.782***]
(0.235) (0.267) (0.199) [(0.205)]
Notes: The TRD in alternative 1 is calculated as a weighted average. The TRD amounts for thecase of shifting to other subsidiaries to 9%. The TRD for alternative 2 is before (after) the reformcalculated as the difference between the tax rate on profits (tax rate to which interest expensesare deductible) in Germany and the tax rate on profits abroad before. The TRD/(1-BTR)UCCare adjusted to the changed TRD.
31

results of the two approaches are now very similar.Another explanation for the difference between the two approaches could
be that part of the subsidiaries do not shift profits to the headquarters butto other subsidiaries in low tax countries. If I assume that only 30% of allmultinational firms shift to the headquarters, whereas the rest shift to taxhavens, and use a weighted average of the TRD (similar to equation (16)),the results are again very similar. Most likely both explanation are able toexplain part of the difference.
Comparing the estimated impact for firms likely to engage in internaldebt shifting with no depreciation allowances leads to similar conclusions.Firstly, the ratio of the change in debt financing to the change in capitalstock is in the structural approach again around 21%. The ratio for the DiDapproach is lower but the coefficient for the debt ratio has not been estimatedvery precisely. Secondly, the estimated, absolute impact using the structuralapproach is again much lower. However, as before, both explanations, thatthe adding back regulations were not binding before the tax rate reduction,and that some firms shift to other subsidiaries, lead to a very similar impactfor the change in the capital stock for the structural and the DiD approach.
8 Conclusion
The aim of this paper is to provide evidence on the causal impact of profitshifting activities of multinational firms on their capital accumulation. Thisis important as profit shifting activities have, so far, been seen as welfaredecreasing for countries. If these activities, however, foster capital accu-mulation, they might at least to some extend be beneficial by reducing thenegative impact of taxation on capital accumulation (e.g. Hong and Smart,2010).
This paper contributes to the existing literature in at least three ways.Firstly, I employ a new identification strategy to uncover the impact of profitshifting activities of multinational companies on their capital accumulation.Secondly, the study attempts to disentangle the potential different impactof different means of profit shifting by focusing on internal debt financing.Finally, two different identification strategies are employed that provide con-sistent results.
The findings suggest that in particular internal debt financing fosters cap-ital accumulation by decreasing the tax burden on capital, but not transferpricing. Thus, the tax rate reduction in Germany had only a modest impacton multinational firms’ investment spending if these firms used before thereform internal debt financing to shift profits out of Germany. Moreover, the
32

results show that generous depreciation allowances reduce the tax sensitivityof internal borrowing remarkably. Since depreciation allowances decrease thetax burden on capital as well, they also lower the tax advantage of firmsengaging in internal debt shifting with respect to the capital stock.
Altogether the results suggest that internal debt shifting activities ofmultinational firms are to some extend welfare increasing. The results, how-ever, also speak for tax cuts to increase the competitiveness of domestic firms.These firms face a competitive disadvantage as they are not able to engagein internal debt financing, at least not as long as they remain domestic. Fur-ther, the findings highlight the role of recent tax reforms that followed theprinciple tax rate cut cum base broadening. The reduction in the tax ratemight have decreased the number of firms shifting profits abroad, but thereduction in the generosity of depreciation allowances increased the tax ad-vantage of firms still shifting profits via internal debt financing. Given thesebenefits, it is likely that more firms will become multinational (Bucovetskyand Haufler, 2008).
33

References
Bartelsman, E. J., Beetsma, R.M.W.J. , 2003. Why pay more? Corpo-rate tax avoidance through transfer pricing in OECD countries. Journalof Public Economics 87, 2225-2252.
Barrios, S., Huizinga, H., Laeven, L., Nicodeme, G., 2013. Interna-tional taxation and multinational firm location decision. Journal ofPublic Economics 96, 946-958.
Becker, J., Riedel, N., 2012. Cross-border tax effects on affiliate invest-ment: Evidence from European multinationals. European EconomicReview 56, 436-450.
Blouin, J., Huizinga, H., Laeven, L., Nicodme, G., 2014. Thin cap-italization rules and multinational firm capital structure. EuropeanCommission, Taxation Papers, Working Paper 42.
Bond, S., Xing, J., 2011. Corporate taxation and capital accumulation.Discussion Paper, Oxford University Centre for Business Taxation No.10/15.
Bucovetsky, S., Haufler, A, 2008. Tax competition when firms choosetheir organizational form: Should tax loopholes for multinationals beclosed. Journal of International Economics 74(1), 188-201.
Buettner, T., Holzmann, C., Overesch, M., Schreiber, U., 2013. Anti-tax-avoidance rules and multinationals’ tax-haven demand. Mimeo.
Buettner, T., Overesch, M., Schreiber, U., Wamser, G., 2012. Theimpact of thin capitalization rules on the capital structure of multina-tionals firms. Journal of Public Economics 96, 930-938.
Buettner, T., Wamser, G., 2013. Internal debt and multinationals’profit shifting - Empirical evidence from firm-level panel data. NationalTax Journal 66, 63-95.
Buslei, H., Simmler, M., 2013. Intended and non-intended behavioralresponses to the German interest barrier. Mimeo.
Caliendo, M., Kopeinig, S., 2008. Some practical guidance for theimplementation of propensity score matching. Journal for EconomicSurveys 22: 31-72.
34

Caliendo, M., Kuenn, S., 2011. Start-up subsidies for the unemployed:Long-term evidence and effect heterogeneity. Journal of Public Eco-nomics 95, 311-331.
Clausing, K.A., 2003. Tax-motivated transfer pricing and US intrafirmtrade prices. Journal of Public Economics 87, 2207-2223.
Chirinko, R., Fazzari, S.M., Meyer, A.P., 1999. How responsive isbusiness capital formation to its user cost? An exploration with microdata. Journal of Public Economics 74, 53-80.
De Mooij, R., Ederveen, S., 2003. Taxation and foreign direct invest-ment: A synthesis of empirical research. International Tax and PublicFinance 10, 673-693.
Devereux M., Griffith, R., 2003. Evaluating tax policy for locationdecision. International Tax and Public Finance 10, 107-126.
Devereux, M., 2004. Measuring taxes on income from capital. In Soren-son, P.B. (Eds) Measuring the tax burden on capital and labor. MITPress, Cambridge, chapter 2.
Devereux, M.P., Lockwood, B., Redoano, M., 2008. Do countries com-pete over corporate tax rates? Journal of Public Economics 92, 1210-1235
Desai, M.A., Foley, C.F., Hines, J.R., 2006. Do tax havens diverteconomic activity? Economics Letters 90, 219-224
Dischinger, M., Knoll. B., Riedel, N., 2014. The role of headquartersin multinational profit shifting strategies. International Tax and PublicFinance 21,248-271.
Dwenger, N., 2014. User cost elasticity of capital revisited. Economica81, 161-186.
Egger, P., Eggert, W., Keuschnigg, C., Winner, H., 2010. Saving taxesthrough foreign plant ownership. Journal of International Economics81: 99-108.
Egger, P., Merlo, V., Wamser, G., 2014. Unobserved tax avoidance andthe tax elasticity of FDI. CESifo Working Paper Series 4921, CESifoGroup Munich.
35

Feld, L. P., Heckemeyer,J. H., Overesch, M., 2013. Capital structurechoice and company taxation: A meta-study. Journal of Banking andFinance 37, 2850-2866.
Fuest, C., Hemmelgarn, T., 2005. Corporate tax policy, foreign firmownership and thin capitalization. Regional Science and Urban Eco-nomics 35, 508-526.
Goolsbee, A., 1998. Investment tax incentives, prices, and the supplyof capital goods. The Quarterly Journal of Economics 113, 121-148.
Goolsbee, A., 2000. The importance of measurement error in the costof capital. National Tax Journal 53, 215-228.
Goolsbee, A., 2004. The impact of the corporate income tax: Evidencefrom state organizational form data. Journal of Public Economics 88,2283-2299.
Grubert, H., Mutti, J., 1991. Taxes, tariffs and transfer pricing inmultinational corporate decision making. The Review of Economicsand Statistics 80, 365-373.
Gumpert, A., Hines Jr., J.R., Schnitzer, M., 2011. The use of taxhavens in exemption regimes, Bundesbank Discussion Paper, Series 1,30/2011.
Hall, R. E., Jorgenson, D., 1967. Tax policy and investment behavior.American Economic Review 57, 391-414.
Haufler, A., Runkel, M., 2012. Firms’ financial choices and thin capi-talization rules under corporate tax competition. European EconomicReview 56, 1087-1103.
Heckman, J., Ichimura, H., Todd, P. E., 1997. Matching as an econo-metric evaluation estimator: Evidence from evaluating a job trainingprogram, Review of Economic Studies 64, 605-654.
Hines Jr., J.R., Rice, E.M., 1994. Fiscal paradise: foreign tax havensand American business. Quarterly Journal of Economics 109, 149-182.
Huizinga, H., Laeven, L., 2008. International profit shifting withinmultinationals: A multi-country perspective. Journal of Public Eco-nomics 92, 1164-1182.
36

Huizinga, H., Laeven, L., Nicodeme, G., 2008. Capital structure andinternal debt shifting. Journal of Financial Economics 88, 80-118.
Hong, Q., Smart, M., 2010. In praise of tax havens: International taxplanning and foreign direct investment. European Economic Review54, 82-95.
Jorgenson, D., 1963. Capital theory and investment behaviour. Amer-ican Economic Review 52, 305-360.
Kraus, A. and R.H. Litzenberger, 1973. A State-Preference Model ofOptimal Financial Leverage. Journal of Finance 28, 911-922.
Mintz, J., Smart, M., 2004. Income shifting, investment, and tax com-petition: Theory and evidence from provincial taxation in Canada.Journal of Public Economics 88, 1149-1168.
Modigliani, F., Miller, M. H., 1963. Corporate income taxes and thecost of capital: A correction. The American Economic Review 53,433-443
Moen, J., Schindler, D., Schjelderup, G. and J. Tropina, 2011. Interna-tional debt shifting: Do multinationals shift internal or external debt?.CESifo Working Paper Series 3519, CESifo Group Munich.
Overesch, M., 2009. The effects of multinationals’ profit shifting activ-ities on real investment. National Tax Journal 62, 5-23.
Peralta, S., Wauthy, X., and T. van Ypersele, 2006. Should coun-ties control international profit shifting? Journal of International Eco-nomics 68: 24-37.
Rosenbaum, P. R., Rubin, D. B., 1985. Constructing a control groupusing multivariate matched sampling methods that incorporate thepropensity score, American Statistician 39, 33-38.
Schindler, D., Schjelderup, G., 2012. Debt shifting and ownershipstructure. European Economic Review 56, 635-647.
Schindler, D., Schjelderup, G., 2013. Transfer pricing and debt shiftingin multinationals. CESifo Working Paper Series 4381, CESifo GroupMunich.
Stuart, E. A., 2010. Matching methods for causal inference: A reviewand a look forward. Statistical Science 25, 1-21.
37

Zodrow, G., Miezkowski, P., 1986. Pigou, Tiebout, property taxation,and the underprovision of local public goods. Journal of Urban Eco-nomics 19, 356-370.
38

Appendix - Additional Descriptive Statistics
and Regression Results
Table A.1: Descriptive statistics on the location of the (ultimate) parentcompany
All firms Sample 1 Sample 2Australia 340 120 53Austria 1464 140 224Belgium 878 440 127Canada 376 75 47Cayman Islands 125 0 19Czech Republic 29 0 11Denmark 1951 190 242Finland 596 105 138France 4,919 2,260 1,175Germany 78,918 30,415 16,274Hong Kong 67 0 14Iceland 27 0 10India 256 110 27Ireland 374 0 56Israel 160 30 12Italy 1816 0 314Korea, Republic of 256 85 114Kuwait 83 0 24Luxembourg 644 150 82Malaysia 29 5 24Mexico 85 35 14Netherlands 2315 210 413Norway 423 175 87Other countries 705 40 80South Africa 95 0 14Spain 642 250 140Sweden 2040 760 416Switzerland 3753 0 800Taiwan 189 25 42Total 103,555 35,620 20,993
Notes: Sample 1 includes German owned firms that do not own foreignsubsidiaries and foreign owned firms that had before the reform anincentive to shift profits via internal debt financing to the headquarter,which was abolished due to the reform. All firms in sample 1 arerequired to be observed in every year between 2005 and 2009. Sample2 includes all firms for which liabilities against the parent companyare observed.Source: DAFNE firm database, own calculations.
39

Table A.2: Logistic regression of the propensity score
Matching variables all without(1), (2), (3)
Log(Total Assets 2006) 0.246*** 0.240***(0.019) (0.019)
Debt Ratio 2006 (1) 0.289**(0.127)
Log(Capital Stock 2006) -0.125*** -0.116***(0.013) (0.013)
d.Debt Ratio 2006 (2) 1.052***(0.313)
d.log(capital stock 2006) (3) -0.125***(0.047)
Industry dummiesagriculture -3.636*** -3.774***
(1.012) (1.011)electricity and gas supply -2.690*** -2.898***
(0.196) (0.194)water supply -0.918*** -0.966***
(0.219) (0.218)construction 0.117 0.225*
(0.125) (0.124)wholesale and retail trade -3.740*** -3.741***
(1.012) (1.011)transportation and storage -1.446*** -1.568***
(0.155) (0.154)information and communication -1.555*** -1.259***
(0.288) (0.281)accommodation -1.934*** -1.759***
(0.105) (0.101)real estate activities -5.332*** -5.371***
(1.005) (1.005)professional, technical activities -4.142*** -4.334***
(0.420) (0.419)support service activities -2.663*** -2.719***
(0.200) (0.200)Observations 7,124 7,124
Notes: The dependent variable is the treatment indicator. It equalsone for firms that had before the corporate tax reform an incentiveto shift profits via internal debt financing to the headquarter, butnot after the reform. It is zero for purely domestic firms. Stars*,**,*** indicate significance at the 1/5/10% level.Source: DAFNE firm database, 2005, 2006, own calculations.
40

Table A.3: Standardized bias before and after matching
Mean Standardized Bias in %Treatment Control Before After matching
Matching method Kernel NN KernelMatching variables all without
(1), (2),(3)
firm size (log(total assets) 2005 8.81 8.26 22.89 2.24 0.25 1.39debt ratio 2005 (1) 0.5 0.45 14.28 -0.08 0.29 6.64log(capital stock) 2005 5.54 6.12 -16.41 3.10 5.70 2.94d.debt ratio 2006 (2) 0.00 -0.01 5.5 -0.26 -0.54 10.81d.log(capital stock) (3) 2006 0.00 0.04 -5.21 1.07 -0.26 -8.38
Industry dummiesagriculture, forestry and fishing 0.00 0.01 -12.93 -1.31 0.65 -0.92manufacturing 0.25 0.05 57.57 2.99 0.25 2.63electricity and gas supply 0.03 0.10 -28.99 -1.04 0.03 -1.05water supply 0.03 0.01 7.62 2.5 0.03 3.41construction 0.22 0.04 54.98 1.76 0.22 2.21wholesale and retail trade 0.00 0.01 -13.3 -1.41 0.00 -1.01transportation and storage 0.06 0.06 -0.56 0.16 0.06 0.61information and communication 0.01 0.01 2.22 -0.25 0.01 -0.20accommodation 0.33 0.41 -18.00 -2.13 0.33 -3.27real estate activities 0.00 0.05 -31.89 -6.45 0.00 -5.8professional, technical activities 0.00 0.08 -40.12 -4.88 0.00 -3.76support service activities 0.03 0.10 -31.34 -1.34 0.03 -1.14
Notes: Control group consists of purely domestic firms, that are observed between 2005 and2009. Treatment group includes firms that had before the reform an incentive to engage in debtfinancing, which was abolished due to the reform.Source: DAFNE firm database, 2005,2006, own calculations.
Table A.4: Results interest result and profits
Dep. Var. Interest Profit before Interest Profit before(scaled by total assets) Result Interest Result Interest
SamplepF (.)K
< MeanpF (.)K
> Mean
(1) (2) (3) (4) (5) (6)
d.Business tax rate [=uG,t] -0.076*** -0.598** -0.600** -0.076 0.307 0.353(0.009) (0.235) (0.235) (0.050) (0.269) (0.287)
d.TRD [= umod,G,t − uA,t] (1) -0.087** -0.281 0.012** -0.179**(0.033) (0.164) (0.005) (0.082)
d.(TRD*D(NITS))(2) 0.106** 0.363* -0.015 -0.095(0.044) (0.203) (0.009) (0.157)
d.TRD (modified) (1) -0.224 -0.187**(0.206) (0.081)
d.TRD (modified)*D(NITS) 0.333 -0.196(0.443) (0.262)
Observations 5,680 5,680 5,680 6,707 6,707 6,707Coeff. (1)+(2) 0.020 0.082 0.109 -0.003 -0.274 -0.384SE (Delta method) 0.015 0.087 0.259 0.008 0.144 0.246
Note: Robust standard errors clustered for the location of the parent in parentheses. Each regressionincludes a full set of time dummies (not reported). Stars *, **, *** indicate significant at the 10/5/1%level.Source: DAFNE firm database, 2004 to 2010, own calculations.
41

Table A.5: Sensitivity analysis debt ratio
Dep. Var. Change in liabilities against shareholders (LS) resp. group members (LGM)
SamplepF (.)K
< MeanpF (.)K
> MeanDep. Var. LS LGM LS LGMGerman owned firms excluded x xFirms with interest result x x> 1 million EURO
(1) (2) (3) (4) (5) (6)
d.Business tax rate [=uG,t] 0.282 0.194* 0.247** -0.365 -0.617* -0.346(2.360) (0.106) (0.117) (0.866) (0.366) (0.456)
d.(TRD if > 0, 0 else) 2.544*** 2.299** 2.126*** 0.099 0.119 0.120***(0.896) (0.824) (0.666) (0.162) (0.111) (0.042)
d.(TRD if > 0, 0 else)*Depr.AK
-14.849* -14.797* -16.836** -0.013 -0.205 -0.720**(8.487) (8.161) (7.773) (0.731) (0.671) (0.325)
d.Firmsize 0.041** 0.026*** 0.034*** 0.028 0.045*** 0.070***(0.017) (0.005) (0.005) (0.018) (0.011) (0.010)
Observations 429 6,802 6,913 2,893 8,013 8,194
Note: Robust standard errors clustered for the location of the parent in parentheses. Each regression includesa full set of time dummies (not reported). Stars *, **, *** indicate significant at the 10/5/1% level.Source: DAFNE firm database, 2004 to 2010, own calculations.
Table A.6: Sensitivity analysis capital stock
Dep. Var. Growth rate of the capital stockB = (1 −BTR) ∗ UCC and Bmod = (1 −BTR) ∗ UCCmod
SamplepF (.)K
< MeanpF (.)K
> Mean
German owned firms excluded x xFirms with interest result x x> 1 million EURO
(1) (2) (3) (4) (5) (6)
d.log(UCC) -2.196** -1.088*** -1.730*** -1.592***(0.818) (0.110) (0.478) (0.148)
d.log(UCCmod) -0.252*** -0.317***(0.044) (0.080)
d.(TRDB
if > 0, 0 else) 0.806*** 0.920*** -0.007 -0.069(0.285) (0.264) (0.147) (0.119)
d.(TRDB
if > 0, 0 else)*Depr.AK
-6.494*** -9.029*** 3.183 3.386(1.418) (2.392) (2.261) (2.358)
d.( TRDBmod
if > 0, 0 else) 0.860** -0.054
(0.335) (0.104)
d.( TRDBmod
if > 0, 0 else)*Depr.AK
-8.923** 2.649
(3.390) (2.035)d.log(Sales) 0.167** 0.055*** 0.061*** 0.074*** 0.035** 0.041***
(0.069) (0.015) (0.016) (0.018) (0.014) (0.013)
Observations 429 6,802 6,915 2,893 8,013 8,198
Note: Robust standard errors clustered for the location of the parent in parentheses. Each regression includesa full set of time dummies (not reported). Stars *, **, *** indicate significant at the 10/5/1% level.Source: DAFNE firm database, 2004 to 2010, own calculations.
42

Oxford University Centre for Business Taxation Working Paper series recent papers
WP 15/29 Daniel Shaviro The crossroads versus the seesaw: getting a 'fix' on recent international tax policy developments WP 15/28 Zhonglan Dai, Douglas A Shackelford, Yue (Layla) Ying and Harold H Zhang Do companies invest more after shareholder tax cuts? WP 15/27 Martin Ruf and Julia Schmider Who bears the cost of taxing the rich? An empirical study on CEO pay WP 15/26 Eric Orhn The corporate investment response to the domestic production activities deduction WP 15/25 Li Liu International taxation and MNE investment: evidence from the UK change to territoriality WP 15/24 Edward D Kleinbard Reimagining capital income taxation WP 15/23 James R Hines Jr, Niklas Potrafke, Marina Riem and Christoph Schinke Inter vivos transfers of ownership in family firms WP 15/22 Céline Azémar and Dhammika Dharmapala Tax sparing agreements, territorial tax reforms, and foreign direct investment WP 15/21 Wei Cui A critical review of proposals for destination-based cash-flow corporate taxation as an international tax reform option WP 15/20 Andrew Bird and Stephen A Karolyi Governance and taxes: evidence from regression discontinuity WP 15/19 Reuven Avi-Yonah Reinventing the wheel: what we can learn from the Tax Reform Act of 1986 WP 15/18 Annette Alstadsæter, Salvador Barrios, Gaetan Nicodeme, Agnieszka Maria Skonieczna and Antonio Vezzani Patent boxes design, patents,location and local R&D WP 15/17 Laurent Bach Do better entrepreneurs avoid more taxes? WP 15/16 Nadja Dwenger, Frank M Fossen and Martin Simmler From financial to real economic crisis: evidence from individual firm–bank relationships in Germany WP 15/15 Giorgia Maffini and John Vella Evidence-based policy-making? The Commission's proposal for an FTT WP 15/14 Clemens Fuest and Jing Xing How can a country 'graduate' from procyclical fiscal policy? Evidence from China?

WP 15/13 Richard Collier and Giorgia Maffini The UK international tax agenda for business and the impact of the OECD BEPS project WP 15/11 Irem Guceri Tax incentives and R&D: an evaluation of the 2002 UK reform using micro data WP 15/10 Rita de la Feria and Parintira Tanawong Surcharges and penalties in UK tax law WP 15/09 Ernesto Crivelli, Ruud de Mooij, Michael Keen Base erosion, profit-shifting and developing countries WP 15/08 Judith Freedman Managing tax complexity: the institutional framework for tax policy-making and oversight
WP 15/07 Michael P Devereux, Giorgia Maffini and Jing Xing Corporate tax incentives and capital structure: empirical evidence from UK tax returns WP 15/06 Li Liu and Ben Lockwood VAT notches WP 15/05 Clemens Fuest and Li Liu Does ownership affect the impact of taxes on firm behaviour? Evidence from China. WP 15/04 Michael P Devereux, Clemens Fuest and Ben Lockwood The taxation of foreign profits: a unified view WP 15/03 Jitao Tang and Rosanne Altshuler The spillover effects of outward foreign direct investment on home countries: evidence from the United States WP 15/02 Juan Carlos Suarez Serrato and Owen Zidar Who benefits from state corporate tax cuts? A local labour markets approach with heterogeneous firms WP 15/01 Ronald B Davies, Julien Martin, Mathieu Parenti and Farid Toubal Knocking on Tax Haven’s Door: multinational firms and transfer pricing WP 14/27 Peter Birch Sørensen Taxation and the optimal constraint on corporate debt finance WP 14/26 Johannes Becker, Ronald B Davies and Gitte Jakobs The economics of advance pricing agreements WP 14/25 Michael P Devereux and John Vella Are we heading towards a corporate tax system fit for the 21st century? WP 14/24 Martin Simmler Do multinational firms invest more? On the impact of internal debt financing on capital accumulation WP 14/23 Ben Lockwood and Erez Yerushalmi Should transactions services be taxed at the same rate as consumption?

WP 14/22 Chris Sanchirico As American as Apple Inc: International tax and ownership nationality WP 14/19 Jörg Paetzold and Hannes Winner Taking the High Road? Compliance with commuter tax allowances and the role of evasion spillovers WP 14/18 David Gamage How should governments promote distributive justice?: A framework for analyzing the optimal choice of tax instruments WP 14/16 Scott D Dyreng, Jeffrey L Hoopes and Jaron H Wilde Public pressure and corporate tax behaviour WP 14/15 Eric Zwick and James Mahon Do financial frictions amplify fiscal policy? Evidence from business investment stimulus WP 14/14 David Weisbach The use of neutralities in international tax policy WP 14/13 Rita de la Feria Blueprint for reform of VAT rates in Europe WP 14/12 Miguel Almunia and David Lopez Rodriguez Heterogeneous responses to effective tax enforcement: evidence from Spanish firms WP 14/11 Charles E McLure, Jack Mintz and George R Zodrow US Supreme Court unanimously chooses substance over form in foreign tax credit WP 14/10 David Neumark and Helen Simpson Place-based policies WP 14/09 Johannes Becker and Ronald B Davies A negotiation-based model of tax-induced transfer pricing WP 14/08 Marko Koethenbuerger and Michael Stimmelmayr Taxing multinationals in the presence of internal capital markets WP 14/07 Michael Devereux and Rita de la Feria Designing and implementing a destination-based corporate tax WP 14/05 John W Diamond and George R Zodrow The dynamic economic effects of a US corporate income tax rate reduction WP 14/04 Claudia Keser, Gerrit Kimpel and Andreas Oesterricher The CCCTB option – an experimental study WP 14/03 Arjan Lejour The foreign investment effects of tax treaties WP 14/02 Ralph-C. Bayer Harald Oberhofer and Hannes Winner The occurrence of tax amnesties: theory and evidence WP14/01 Nils Herger, Steve McCorriston and Christos Kotsogiannisz Multiple taxes and alternative forms of FDI: evidence from cross-border acquisitions

WP13/25 Michael Devereux, Niels Johannesen and John Vella Can taxes tame the banks?
Evidence from European bank levies
WP13/24 Matt Krzepkowski Debt and tax losses: the effect of tax asymmetries on the
cost of capital and capital structure
WP13/23 Jennifer Blouin, Harry Huizinga, Luc Laeven, Gaëtan Nicodème Thin
capitalization rules and multinational firm capital structure
WP13/22 Danny Yagan Capital tax reform and the real economy: the effects of the 2003
dividend tax cut
WP13/21 Andreas Haufler and Christoph Lülfesmann Reforming an asymmetric union: on
the virtues of dual tier capital taxation
WP13/20 Michael Blackwell Do the haves come out ahead in tax litigation? An empirical
study of the dynamics of tax appeals in the UK
WP13/19 Johannes Becker and Ronald B Davies Learning and international policy diffusion:
the case of corporate tax policy
WP13/18 Reuven S Avi-Yonah And yet it moves: taxation and labour mobility in the 21st
century
WP13/17 Anne Brockmeyer The investment effect of taxation: evidence from a corporate
tax kink
WP13/16 Dominika Langenmayr and Rebecca Lesterz Taxation and corporate risk-taking
WP13/15 Martin Ruf and Alfons J Weichenrieder CFC legislation, passive assets and the
impact of the ECJ’s Cadbury-Schweppes decision
WP13/14 Annette Alstadsæter and Martin Jacob The effect of awareness and incentives
on tax evasion
WP13/13 Jarkko Harju and Tuomos Matikka The elasticity of taxable income and income-
shifting between tax bases: what is “real” and what is not?
WP13/12 Li Liu and Andrew Harper Temporary increase in annual investment allowance
WP13/11 Alan J Auderbach and Michael P Devererux Consumption and cash-flow taxes in
an international setting
WP13/10 Andreas Haufler and Mohammed Mardan Cross-border loss offset can fuel tax
competition
WP13/09 Ben Lockwood How should financial intermediation services be taxed?

WP13/08 Dominika Langenmayr, Andreas Haufler and Christian J bauer Should tax policy
favour high or low productivity firms?
WP13/07 Theresa Lohse and Nadine Riedel Do transfer pricing laws limit international
income shifting? Evidence from European multinationals
WP13/06 Ruud de Mooij and Jost Heckemeyer Taxation and corporate debt: are banks any
different?
WP13/05 Rita de la Feria EU VAT rate structure: towards unilateral convergence?
WP13/04 Johannes Becker and Melaine Steinhoff Conservative accounting yields excessive
risk-taking - a note
WP13/03 Michael P.Devereux, Clemens Fuest, and Ben Lockwood The Taxation of Foreign
Profits: a Unified View
WP13/02 Giorgia Maffini Corporate tax policy under the Labour government 1997-2010
WP13/01 Christoph Ernst, Katharina Richter and Nadine Riedel Corporate taxation and the
quality of research & development