do fair value accounting & impairment rules hurt equity...
TRANSCRIPT
The Economic Consequences of Relaxing Fair Value Accounting and Impairment Rules on Banks during the Financial Crisis of 2008-2009
Robert M. Bowen
PricewaterhouseCoopers & Alumni Professor of Accounting Foster School of Business, University of Washington
Email: [email protected]
Urooj Khan Assistant Professor
Graduate School of Business, Columbia University Email: [email protected]
Shiva Rajgopal*
Schaefer Chaired Professor in Accounting Goizueta Business School, Emory University
Email: [email protected]
13 September 2010
Abstract: Fair value accounting (FVA) has been blamed for amplifying the recent financial crisis. We conduct an event study of policymaker deliberations, recommendations and decisions about FVA and impairment rules in the banking industry. If FVA was a key contributor to the financial crisis as some industry pundits and academic research suggest, we first should observe positive stock market reactions to proposals to relax FVA rules and negative reactions when policymakers support FVA. Second, we expect especially positive reactions to the curtailment of FVA and impairment rules for banks that are relatively sensitive to pro-cyclical contagion. Third, we investigate cross-sectional reactions to factors that potentially contribute to pro-cyclical contagion, including relatively (i) low regulatory capital, (ii) more assets recorded at fair value, (iii) poor asset liquidity, (iv) larger potential impairments, and (v) more trading assets. Finally, we expect banks that have fewer alternative sources of information about fair values beyond those reported in financial statements to experience relatively negative reactions to potential relaxation of FVA and impairment rules. We examine ten event windows related to FVA and impairment rules for financial institutions. We also examine a subset of five event windows that are relatively “clean” of potential confounding events. As predicted, we find that events that signaled an increased (decreased) probability that existing FVA standards would be relaxed (retained) generally produced positive (negative) abnormal stock price reactions for sample banks. The magnitude of the stock price reactions was positively related to our proxy for individual bank’s susceptibility to contagion in our ten-window design but was insignificant in our “clean” five-window design. Further, stock price reactions were weakly associated with firm-specific attributes that could contribute to contagion, with holdings of illiquid assets being the only significant variable in both designs. In sum, while stock market participants appeared to welcome relaxation of FVA and impairment rules during the financial crisis of 2008-09, we provide only modest evidence that banks that benefited the most were more susceptible to contagion. We believe our study informs the debate about the role of FVA in the recent financial crisis.
*Corresponding author. We acknowledge financial assistance from the Michael G. Foster School of Business at the University of Washington and Columbia Business School. We would like to thank seminar participants at Carnegie Mellon University for their helpful comments and suggestion. All errors are ours alone.
1
The Economic Consequences of Relaxing Fair Value Accounting and Impairment Rules on Banks during the Financial Crisis of 2008-2009
“In perhaps the most sweeping indictment of fair-value accounting to date, the chairman of the Federal Deposit Insurance Corporation during the 1980s savings-and-loan debacle told the Securities and Exchange Commission
today that mark-to-market accounting rules caused the current financial meltdown.” CFO.com, October 29, 2008.
Introduction
The Financial Accounting Standards Board (FASB) states that a long-term objective is to use
fair value (a.k.a., mark-to-market) accounting to measure and report financial instruments (see
Statement of Financial Accounting Standard (SFAS) No. 159). However, critics argue that fair value
accounting (FVA) contributed to the worst economic crisis in the United States since the Great
Depression (Hughes and Tett 2008; Johnson 2008; Rummell 2008). Speaking at a SEC panel on
mark-to-market accounting and the market turmoil following the subprime crisis, William Isaac,
chairman of the Federal Deposit Insurance Corporation (FDIC) from 1978 to 1985, blamed FVA for
causing the financial meltdown that followed the subprime crisis (Katz, 2008).1 The International
Monetary Fund (2008, 127) worried that “investment decision rules based on fair value accounting
outcomes could lead to self-fulfilling forced sales and falling prices when valuations fell below
important thresholds (either self-imposed by financial institutions or regulation).” Theoretical models
by Cifuentes, Ferrucci, and Shin (2005) and Plantin, Shin, and Sapra (2008) show that FVA has the
potential of exacerbating contagion among banks (i.e., the spread of market shocks) potentially leading
to a breakdown of the entire banking system.2
1 Similar views are expressed by Newt Gingrich (Forbes.com, Sept. 29, 2008) and by several participants at the SEC’s October 29 Roundtable on Mark-to-Market Accounting including Aubrey Patterson (Chairman and CEO of BancorpSouth, Inc.) and Bradley Hunkler (Vice President and Controller of Western & Southern Financial Group).
In contrast, several commentators (e.g., Ball 2008, CFA
Center for Financial Market Integrity 2008 and Ryan 2009) suggest that relaxing FVA rules would
lead to less timely and hence less informative disclosures about banks’ financial soundness and, as a
result, extend the duration of the financial crisis.
2 Pro-cyclical contagion is the process whereby one bank is affected by the actions of another bank. For example, assume that in the recent recession, Bank A is forced to sell assets at fire-sale prices to shore up its regulatory capital. This in turn forces other banks to mark their similar assets to these declining prices, causing some of these otherwise healthy banks to sell assets and curtail lending in an attempt to bolster their regulatory capital. Prices fall further, and the cycle repeats itself exacerbating the crisis.
2
In this paper, we examine whether bank stock prices were affected by events that potentially
changed the probability that policymakers would relax (or retain) existing FVA or impairment rules
during the financial crisis of 2008-2009. This approximate six-month period of debate about FVA and
impairment rules culminated with three Financial Accounting Standards Board (FASB) staff positions
(FSPs) issued on April 9, 2009. These FSPs clarified that FVA and impairment rules need not be
applied when markets are illiquid or when transactions are forced by liquidation or distressed sales. In
short, this guidance generally relaxed the requirement to apply FVA and impairment rules during the
financial crisis – see the Appendix for more details on these rule changes.
By examining stock price reactions to policy deliberations and decisions leading to these
FSPs, we investigate the link between FVA and contagion and inform the debate about the role of
FVA and impairment rules during a period of extreme financial turmoil. We believe our paper is
among the first to examine whether investors, on balance, believed the alleged negative effects of FVA
(via reliance on fire-sale market prices in illiquid markets and the contagion caused by distress sales of
assets) potentially outweighed the benefits associated with having more timely mark-to-mark data for
decision-making. We directly test whether relaxation of FVA and impairment rules increased bank
values during a financial crisis characterized by pro-cyclical contagion. We expect positive (negative)
reactions to events that increased (decreased) the probability of FVA or impairment rules being
relaxed.3
3 While marking impaired assets to market was arguably not required under then-existing FVA and impairment rules, the emphasis in practice was apparently to use the last transaction price or the last quoted price as the primary basis of estimating fair value in SFAS No. 157. The result was marking assets to ‘fire sale’ prices during the crisis. The subsequent FASB staff position, FSP No. FAS 157-4 (April 2009), provided guidance on determining fair value when markets were thin with the aim of avoiding marking assets to distressed fire sale prices – see the Appendix for more detail.
If these potential fire sale markdowns recorded under the original FVA rules did not reflect
long run economic values, inefficient regulatory intervention and pro-cyclical contagion become more
likely and equity values were likely to be destroyed. Alternatively, if investors on balance perceive
that curtailing FVA or impairment rules could mask the underlying economics of banks, we could see
relatively negative reactions to proposals that relax FVA or impairment rules. Thus, we also
3
investigate the role of a bank’s information environment on the stock price reactions to the
deliberations leading to relaxation of FVA and impairment rules.
We first examine ten event windows leading to the eventual adoption of new FVA and
impairment rules. We find that four of seven event windows that signaled an increased probability
that existing FVA standards would be relaxed produced significant positive abnormal stock price
reactions for sample banks. We find that two of three event windows that signaled a decreased
probability of existing FVA standards being relaxed exhibited significant negative abnormal stock
returns. We also find a highly significant reaction when we combine all ten events into one event
window using an indicator variable that equals 1 (-1) during each event window assumed to increase
(decrease) the probability of suspension/modification of FVA or impairment rules, 0 otherwise. Our
initial results suggest that (i) stock market participants viewed FVA and impairment rules to be value-
relevant for banks during the recent economic crisis, and (ii) concerns about pro-cyclical contagion
dominated concerns about the loss of fair value information, on average.
Next, we test for a relation between individual bank’s susceptibility to contagion and their stock
price reaction to subsequent events that led to relaxation of FVA and impairment rules. We construct
a proxy for individual bank sensitivity to contagion by examining banks’ stock price reactions to the
collapse of Lehman Brothers in mid-September 2008 – an event that arguably precipitated the
financial crisis of 2008-09. Our proxy captures the market’s assessment of bank susceptibility to
contagion directly via the broken banking relationships with Lehman Brothers and indirectly via the
market’s forecast of the side effects of Lehman’s failure on individual banks and on the banking
system in general. We find that our proxy for contagion is associated with stock price reactions to
events leading to the relaxation of FVA and impairment rules, i.e., banks that were most sensitive to
contagion tended to reap the greatest benefit from relaxation of FVA and impairment rules.
Next, we identify additional bank-specific factors that potentially contribute to pro-cyclical
contagion, including relatively (i) low regulatory capital, (ii) more assets recorded at fair value, (ii)
poor asset liquidity, (iv) larger potential impairments, and (v) more trading assets. We find that the
4
magnitude of stock price reactions to the relaxation of FVA and impairment rules was positively
related to (i) banks being less than ‘well capitalized,’ (ii) poor asset liquidity, and (iii) banks’
likelihood of being subject to potential other-than-temporary impairments related to the 2008-09
financial meltdown.
Finally, we predict that banks with a relatively weak information environment, proxied by the
absence of analyst coverage, should experience more negative (or less positive) reactions to the
potential loss of fair value information resulting from the relaxation of FVA and impairment rules.
Arguably, fair value accounting provides more timely and relevant information (Ball 2008 and Ryan
2009). Thus, if FVA is relaxed or modified, banks with no analyst coverage have fewer alternative
sources of timely and relevant information. Consistent with this informativeness hypothesis, we find
that banks with no analyst coverage experience smaller positive stock price reactions to events leading
up to the FASB’s relaxation of FVA and impairment rules.
To rule out the possibility that our findings are driven by other contemporaneous events
unrelated to the modification of FVA impacting the banking industry, we examine other sources to
identify confounding events. We find that two of our event windows appear to have no confounding
events and three others are confounded with events which would generate bank stock price reactions in
the direction opposite to that predicted by the events related to FVA. We label this five-window
subset as “clean” and re-run our analyses using only these five relatively clean event-windows.
We find that the banks in our clean sample experience abnormal stock returns in the predicted
direction in each of the five event windows. We also find a highly statistically and economically
significant stock price reaction when the five clean event windows are combined. The fact that we
continue to find significant stock price reactions in an event study confined to only these relatively
clean event windows adds weight to our initial results that stock market participants considered FVA
and impairment rules to be value relevant for banks during the recent economic crisis.
Next, we re-estimate our cross-sectional analyses using the clean event windows. In our cross-
sectional analyses, we continue to find that the coefficient on our overall proxy for contagion is
5
positive as predicted but is no longer statistically significant at conventional levels. Using this smaller
set of clean event windows, we continue to find that the magnitude of the stock price reaction to the
relaxation of FVA and impairment rules was positively related to the proportion of assets that are less
liquid. However, the coefficients on proxies of other bank-specific factors that we previously found
significant in our initial ten event window design have signs in the predicted direction but are no
longer statistically significant.
We believe our study informs the debate about the role of FVA in the recent financial crisis. The
FASB has alleged that investors wanted more FVA because it provides more timely and relevant
information than the cost-basis model. In contrast, bankers argued that FVA contributed to the credit
crisis. Ours is one of the first event studies to examine the impact of events that affected the
probability of FVA rules being modified during a period of market turmoil, the 2008-09 financial
crisis. The prior FVA literature (e.g., Barth, Landsman and Wahlen 1995; Beatty, Chamberlain and
Magliolo 1995; and Cornett, Rezaee and Tehranian 1996) does not directly address the potential
criticisms of FVA during a severe credit crunch, including the need to take impairments based on fire-
sale prices driven by market illiquidity and the adverse contagion effects that FVA potentially causes.
On balance, our evidence suggests that, when relaxation of FVA and impairment rules was discussed
by regulators and the media, investors reacted favorably as if banks would benefit and pro-cyclical
contagion would be reduced. We provide some evidence that banks that benefited the most were more
susceptible to contagion, especially those that had relatively large amounts of illiquid assets that were
subject to being marked down to fire sale prices.
Our paper is also related to emerging literature on the 2008 financial crisis in general (e.g.,
Beltratti and Stulz 2009; Diamond and Rajan 2009; Shleifer and Vishny 2009; Acharya, Gale and
Yorulmazer 2009) and on the role of FVA in that crisis in particular (Ryan 2009, Laux and Leuz 2009,
Sapra 2009). In a time-series analysis spanning 1988-2007, Khan (2009) finds an association between
systemic risk and the proportion of the banks’ balance sheet that rely on fair value reporting,
particularly during times of market illiquidity. Gartenberg and Serafeim (2009) fail to find a negative
6
association between stock returns of banks during the fourth quarter of 2008 and their holdings of level
1 and level 2 fair value assets and hence conclude that FVA did not exacerbate the financial crisis.
None of these papers investigates the economic consequences associated with policymaker initiatives
to relax FVA or impairment rules. Moreover, we exploit cross-sectional variation in banks’ returns to
these regulatory events to test fine-grained hypotheses related to the potential consequences of relaxing
FVA.
Section 2 provides a brief background of fair value accounting in the banking industry, outlines
events from September 2008 through April 2009 during the financial crisis that potentially affected the
continuation of FVA and impairment rules and develops hypotheses about how these events affected
bank stock prices. Section 3 describes our data sources, sample selection, research design and variable
measurement. Section 4 presents the results of the overall reaction to fair value policy announcements.
Section 5 investigates whether the stock market reactions are a function of bank-specific
characteristics. Section 6 concludes.
2.0 Background and hypothesis development
2.1 Fair value accounting in the banking industry
Accounting serves at least two key functions in the banking industry – an information role
common to all public companies in the economy and a contracting role that has unique implications
specific to banking. In its information role, FVA and impairment rules provide analysts and investors
information about the current market value and riskiness of key bank assets and liabilities. This
information can be especially important when markets are volatile and fair values diverge from their
underlying historical costs. In its contracting role, accounting forms the basis for monitoring and
contracting with regulatory agencies such as the Federal Reserve and the Federal Deposit Insurance
Corporation (FDIC). Especially important are contractual minimum capital requirements defined by
accounting numbers.4
4 The Financial Institutions Reform, Recovery and Enforcement Act of 1989 (“FIRREA”) and the Federal Deposit Insurance Corporation Improvement Act of 1991 (“FDICIA”) enacted in the wake of the Savings and Loans
To the extent markets are volatile and regulators use FVA for both monitoring

7
and contracts, intervention is more likely as banks hit thresholds that indicate concern about capital
adequacy. Barth, Landsman and Wahlen (1995) find that banks violate regulatory capital requirements
more frequently under fair value than historical cost regimes, but share prices do not fully reflect this
additional regulatory risk.
2.2 Prior Literature on the stock market reaction to FVA rules
Cornett, Rezaee and Tehranian (1996) and Beatty, Chamberlain, and Magliolo (1996)
investigate the stock price reaction of bank holding companies around events related to the
promulgation of fair value accounting in the early 1990s. These two studies conclude that investors
expect implementation of SFAS 105, 107, and 115 to decrease bank stock values. Cornett et al. (1996)
hypothesize that sample banks' negative stock price responses result from SFAS 115's impact on bond
covenants whereas Beatty et al. (1996) focus on both SFAS 115's impact on contracting and on bank
regulation. Lys (1996) points out that bank regulation was the more likely reason for investors'
negative assessment of the implication SFAS 115 for bank stock prices.
We evaluate the economic consequences of the relaxation of FVA and impairment rule in the
financial crisis of 2008-09. During this crisis, markets for asset-backed securities, and even interbank
and secured lending, were not functioning normally. The SEC and the FASB faced intense political
pressure to relax FVA and impairment rules. Such pressure generates an ideal setting to examine the
economic consequences associated with relaxing FVA and impairment rules. Moreover, conducting
an event study during this crisis also enables us to test claims that FVA is less valuable when markets
for assets are illiquid. The argument is that inactive illiquid markets make banks pro-cyclical because
a fire-sale of assets by one bank forces other banks to mark down their assets, which reduces risk-
based capital for all banks that hold similar assets. Some of these otherwise healthy banks with now-
impaired capital ratios are forced to sell assets and curtail lending, further lowering asset prices and
scandal prohibits banking regulators from applying regulatory accounting principles that are any less rigorous than GAAP. Further details about the minimum capital requirements for banks and the regulatory action for violating these minimum capital requirements can be found at http://stlouisfed.org/col/director/materials/alco_capitaladequacy.htm
8
exacerbating the financial crisis. In contrast, under historical cost accounting, losses are recognized far
more slowly.
2.3 Events that could affect the probability of a change in FVA or impairment rules
The timeline of events leading up to relaxation of FVA and impairment rules in March and April
2009 is summarized in Table 1. We consider events from September 2008 onward as this is when the
national and worldwide economies quickly deteriorated, including (i) the takeover of government-
sponsored organizations Fannie Mae (Federal National Mortgage Association) and Freddie Mac
(Federal Home Loan Mortgage Corporation) by the FHFA (Federal Housing Financial Agency) on
September 7, 2008, (ii) the bankruptcy of Lehman Brothers and sudden sale of Merrill Lynch to Bank
of America on September 14, (iii) the intervention by the Federal Reserve Bank to ‘bailout’ AIG on
September 16, (iv) the temporary ban on short-selling of financial stocks by the SEC (Securities and
Exchange Commission) on September 19, (v) the two remaining U.S. investment banks, Goldman
Sachs and Morgan Stanley converting to bank holding companies with the approval of the Federal
Reserve on September 21, (vi) the Federal Deposit Insurance Corporation (FDIC) seizing Washington
Mutual, the nation’s largest savings and loan, on September 25, and (vii) Citigroup agreeing to acquire
Wachovia, the nation’s 4th largest bank, on September 29. Stock prices fell dramatically and stock
price volatility soared.
Our first event window is the period around the introduction, deliberation and passage of the
amended Emergency Economic Stabilization Act of 2008 (EESA). It begins on September 27, the day
before the release of an EESA draft which gave the SEC the authority to suspend FVA and required
the SEC to conduct a study on the effects of FVA (including impairment rules5
5 In general, impairment rules are intertwined with FVA rules in the deliberations described here and in most of the event windows examined. Hence, testing for the separate implications of relaxing FVA and impairment rules is not feasible.
) within 90-days from
the day of the enactment of the Act. Event window 1 ends on October 4, 2008, the day after President
Bush signed EESA into law within hours of the House passing the revised version of the bill. Activity
leading up to passage of the bill received intense media coverage (with approximately 10,000 cites on

9
Google news and Google blogs – see Table 1); the probability of FVA being relaxed or suspended
likely increased during this period.6
Event window 2 begins on Monday October 13, 2008 when the International Accounting
Standards Board (IASB) issued amendments to International Accounting Standard (IAS) 39 ‘Financial
Instruments: Recognition and Measurement,’ and International Financial Reporting Standard (IFRS) 7
‘Financial Instruments: Disclosures’ that permitted the reclassification of some financial instruments
so that banks reporting under IFRS could avoid using fair values in reporting selected financial
instruments. The IASB’s Chairman, Sir David Tweedy, acknowledged that the IASB was forced to
amend rules due to political pressure. In early October 2008, the IASB received requests to address
differences between the reclassification requirements of IAS 39 and US GAAP. SFAS 115 permitted
a security to be reclassified out of the trading category in rare situations. SFAS 65 permitted a loan to
be reclassified out of the held-for-sale category if the entity had the intention to hold the loan until
maturity. IAS 39 did not permit reclassifications for financial assets classified as held for trading. The
Board was asked to consider allowing entities applying IFRS the same ability to reclassify a financial
asset out of the held-for-trading category as is permitted by SFAS 115 and SFAS 65. The IASB
responded quickly:
“The Board normally publishes an exposure draft of any proposed amendments to standards to invite comments from interested parties. However, given the requests to address this issue urgently in the light of market conditions, and after consultation with the Trustees of the IASC Foundation, the Board decided to proceed directly to issuing the amendments. In taking this exceptional step the Board noted that the amendments to IAS 39 relaxed the existing requirements to provide short-term relief for some entities. The Board also noted that the amendments were a short-term response to the requests and therefore the Board decided to restrict the scope of the amendments.” (IASB 2008)
Event window 2 ends on October 16, the day after the European Union’s (EU) regulator’s committee
voted unanimously to accept IASB’s emergency changes to mark-to-market rules. International FVA
rules were clearly relaxed during this event window but, given the event did not change the rules for
U.S. banks, it likely had little effect on the stock prices of U.S. banks. We include this event for 6 Given there were many non-FVA events in this bill, we also run our tests after excluding this first event but find the reported inferences remain unchanged.
10
completeness.
The third event window is centered on the three days before, during and after the first of two
SEC-hosted roundtable discussions of mark-to-market accounting on October 29, 2008. The purpose
of the round table discussions was to provide input to the SEC study mandated by the EESA of 2008
(see event window 1). While no formal rules were proposed, most panelists argued that SFAS 157,
Fair Value Measurements, should be retained. While far from definitive given the event was a public
forum, the opposition to relaxing FVA accounting rules likely reduced the probability of FVA being
suspended.
The fourth event window is centered on the three days before, during and after the second of two
SEC-hosted roundtable discussions of mark-to-market accounting on November 21, 2008. While no
consensus was reached about the future of mark-to-market rules, Chairman Cox mentioned in his
opening remarks that “at a minimum there are areas where fair value accounting could be improved.”
While again not definitive given the event was a public forum, the Chairman’s statement that FVA
rules “could be improved” likely increased the market’s probability assessment of FVA rules being
relaxed.
The fifth event window is the three days centered on December 30, 2008 – the date the SEC
issued its staff study of mark-to-market accounting. The study recommended that SFAS 157 be
improved but that existing mark-to-market rules be retained. The staff’s recommendations likely
reduced the probability of FVA being suspended by the SEC Board.
The sixth event window is the three days centered on January 12, 2009 – the date the FASB
issued FSP EITF 99-20-1, amending impairment guidance of EITF Issue No. 99-20, allowing more
managerial judgment in determining other-than-temporary impairments (OTTI). FSP EITF 99-20-1
applies to impairment of interests held by a transferor in a securitization transaction accounted for as a
sale and in purchased beneficial interests in securitized financial assets; it aligns the guidance for OTTI
under EITF 99-20 with FAS 115. Previously, EITF 99-20 required the use of market participant
assumptions about future cash flows in determining OTTIs, not allowing for managerial judgment in
11
the determination of the probability regarding the collection of the previously projected cash flows.
Thus, applying EITF 99-20 in an illiquid/distressed market can automatically result in an OTTI when
the fair value is less than the cost basis, even though the management may have current information
suggesting that the underlying assets are still expected to fully perform. FSP EITF 99-20-1 provided
guidance to establish that it is inappropriate to automatically conclude that every decline in fair value
represents an OTTI. It required further analysis and allowed managerial judgment to assess whether a
decline in fair value suggests an OTTI, thereby allowing for more managerial discretion in recording
OTTIs. This event clearly relaxed impairment rules and gave managers the opportunity to avoid some
OTTIs.
The seventh event window is the three days centered on February 18, 2009 – the date the FASB
announced a project to improve measurement and disclosure of fair value estimates with the specific
goal of providing more guidance on determining when a market is active or inactive, when a
transaction is distressed, etc. We interpret the FASB’s continued support for FVA as likely reducing
the probability of FVA being suspended by policymakers.
The eighth event window encompasses five days of political activity that supported the
relaxation of FVA rules. On March 10, 2009, Federal Reserve Board of Governors Chairman
Bernanke, in a speech before the Council of Foreign Relations, said current accounting rules need to
be revised so that they do not amplify negative effects of a downturn. On the same day, Rep. Barney
Frank echoed Bernanke’s views nudging regulators to explore the possibility of implementing new
guidelines for mark-to-market rules. On March 11, Mary Schapiro, SEC Chairwoman, supported
changes to FVA rules in a testimony to the House Financial Services subcommittee. On March 12,
standard setters and regulators were pressed in a House Financial Services subcommittee hearing to
alter existing FVA rules immediately. The probability of FVA being relaxed or suspended likely
increased during this period.
The ninth window revealed policy decisions about impairment and FVA rules. The ninth event
window is the three days centered on March 16, 2009 – the day the FASB proposed two new staff
12
positions that would relax FVA and impairment rules as described in the Appendix.
The tenth event window is the four days centered on April 1-2, 2009. On April 1, 2009, the
Financial Times reported that the FASB was expected to approve changes in FVA and impairment
rules proposed on March 16, 2009. The FASB affirmed changes in FVA rules on April 2, 2009.
Table 1 provides data on the number of Google News and Google Blogs cites for each event and
event window using search terms available from the authors. We caution the reader not to take the
numerical data too literally. Rather, these data provide a sense of the amount of new coverage each
step in the policymaking process received.
2.4 Contemporaneous events that may potentially confound our event windows
Our sample period from early September, 2008 through April 3, 2009 covers much of the
financial crisis and thus includes other events related to the banking industry and the economy at large
that occur simultaneously with the FVA events we study. Consequently, the results we document may
be attributable to coincident confounding events, rather than events that signaled potential changes in
FVA or impairment rules. To address this concern, we identify confounding events occurring within
the ten event windows discussed above.
We use five different sources to identify potentially confounding events. Our first source is Ait-
Sahalia, Andtritzky, Jobst, Nowak and Tamirisa (2010). Ait-Sahalia et al. (2010) construct a detailed
database of macroeconomics and financial sector policy initiatives announced during the crisis in four
advanced economies – the United States, the United Kingdom, the euro area and Japan – between June
1, 2007 and March 31, 2009. Our second source is Lev and Zhou (2010) who identify 44 key crisis
events between September 1 and December 31, 2008 by examining news releases from federal
agencies and the major media outlets. Next, we identify potentially confounding events from the crisis
timeline in Acharya, Philippon, Richardson and Roubini (2009). Finally, we examine two major
media outlets to identify any confounding events that might not have been covered by the above three
sources. The two media outlets include Wall Street Journal’s timeline of the financial crisis, “Two
13
Years in the Credit Crisis,” and a Washington Post article titled “Timeline: Crisis on Wall Street.”7
We identify no confounding events in windows 6 and 9. Windows 3, 5 and 7 appear to have
confounding events, but the impact of the these events on bank stock prices is likely to be in the
direction opposite to that predicted by FVA related events in these windows. Thus, we label the five
event windows 3, 5, 6, 7 and 9 as “clean” in that either (i) we did not identify confounding events or
(ii) confounding events worked opposite to our predictions related to changes in FVA and impairment
rules. We re-run our analyses using these five relatively “clean” event windows and examine whether
stock market participants considered events potentially affecting FVA and impairment rules to be
value relevant for banks.
These potentially confounding events are summarized in Table 2.
2.5 Overall market reaction to events signaling a change in FVA or impairment rules (H1)
We begin by examining the reaction of bank stocks to the above events that signaled potential
changes in FVA or impairment rules. If FVA was harmful to banks in general during the recent period
of economic instability because of increased probability of regulatory intervention (regulatory
intervention hypothesis) or because illiquid assets are inappropriately marked to market (noisy
information hypothesis), we should observe positive stock price reactions to events that signaled
relaxation of FVA rules and negative reactions to announcements that supported current FVA rules.
Thus our first overall hypothesis is:
Hypothesis 1: Events that potentially increase (decrease) the probability of FVA or impairment rules being relaxed (retained) in the banking industry are associated with significant positive (negative) stock price reactions among banks.
We examine (i) each of the ten event windows listed in Table 1 separately and (ii) an overall
event window for all event windows aggregated together. We aggregate individual event windows by
assigning +1 (-1) to each event window assumed to increase the probability that FVA or impairment
7 Wall Street Journal’s timeline of the credit crisis can be accessed at http://online.wsj.com/public/resources/documents/info-CRISIS0809_Retro.html. And, the Washington Post article describing the timeline of the crisis on Wall Street is available at http://www.washingtonpost.com/wp-srv/business/economy-watch/timeline/index.html.
14
rules would be relaxed (retained).
2.6 Do banks that are more susceptible to pro-cyclical contagion have relatively large reactions to events signaling a change in FVA or impairment rules? (H2)
Next, we examine the cross-sectional relation between bank susceptibility to contagion and
stock price reactions to events that potentially changed the probability of FVA or impairment rules
being relaxed or retained. Credit markets became illiquid during the global economic crisis of 2008-
09. Trades not backed by a stable government ceased to exist – except at ‘fire-sale’ prices in an
inactive market. For example, a bank that needed to improve its regulatory capital ratio might be
forced to sell mortgage-baked securities in the open market to move them from assets requiring large
amounts of risk-based capital to cash or U.S. Treasuries that required little or no risk-based capital.
Other banks exposed to FVA rules that held similar securities were arguably required to write down
their holdings to these fire-sale prices because of FASB guidance associated with FAS 157, “Fair
Value Measurements.”8
Hypothesis 2: The magnitude of the stock price reactions to events that potentially changed the probability of FVA or impairment rules being relaxed (retained) in the banking industry is relatively positive (negative) for banks that are more susceptible to pro-cyclical contagion.
This in turn caused capital adequacy ratios of some of these otherwise healthy
banks to fall below ‘well-capitalized’ and forced these banks to curtail lending and sell assets in the
inactive marketplace in an attempt to improve their capital ratios or risk costly regulatory intervention.
This ‘pro-cyclical’ contagion allegedly worsened the financial crisis as prices for securities fell and
even more banks were forced to react to improve their regulatory capital. We predict that banks that
were relatively more exposed to pro-cyclical contagion had stronger positive (negative) reactions to
changes in the probability of FVA or impairment rules being relaxed (retained).
In short, we predict that banks that faced larger consequences from changes in FVA and
impairment rules should experience larger stock price reactions. We construct a proxy for individual
8 Technically FAS 157 did not require other banks to mark their assets to fire-sale prices (level 3 assets were not required to be marked to fire-sale prices to begin with). However, the guidance provided by the FASB regarding FAS 157 implicitly conveyed that observable market inputs are preferred over unobservable inputs. Therefore, valuation models in practice tend to base inputs observable market data were used, which essentially resulted in marking assets to fire sale prices. See Mortgage Bankers Association (2009).
15
bank sensitivity to contagion by assigning a scaled rank to each bank based on its stock price reaction
to the collapse of Lehman Brothers in September 2008. Our proxy captures the market’s assessment
of bank susceptibility to contagion directly via the broken banking relationships with Lehman Brothers
and indirectly via the market’s forecast of the side effects of Lehman’s failure on the banking system.
We chose this proxy because the Lehman’s collapse was early in the crisis and did not overlap
discussions about modifying FVA or impairment rules. Stock return reactions to Lehman’s collapse
are summed from September 12, 2008 to Sep 15, 2008 (where September 13 and 14 are non-trading
days). Banks’ stock return reactions are ranked from most negative to most positive and scaled by the
total number of banks in the sample (i.e., 288). Acharya, Pedersen, Philippon and Richardson (2009)
argue that the Lehman failure revealed the systemic flaws and interrelationships in the banking
industry that could contribute to contagion.
2.6 Cross-sectional market reactions to events signaling a change in FVA or impairment rules (H3-H8)
Next, we examine the cross-sectional relationship between specific bank characteristics and
the overall market reaction to events that potentially changed the probability of FVA or impairment
rules being relaxed or retained. We begin by identifying bank characteristics that potentially
contributed to pro-cyclical contagion, including relatively (i) low regulatory capital, (ii) more assets
recorded at fair value, (iii) poor asset liquidity, (iv) larger potential impairments, and (v) more trading
assets. Finally, we predict that banks with a relatively weak information environment, proxied by the
absence of analyst coverage, should experience more negative reactions (or less positive reactions) to
the potential loss of fair value information resulting from the relaxation of FVA and impairment rules.
Below, we discuss each explanation of cross-sectional bank returns.
First, we consider the adequacy of banks’ regulatory capital. In December 1991, the U.S.
Congress passed the Federal Deposit Insurance Corporation Improvement Act (FDICIA), which
emphasized the importance of adequate capital buffers. One key provision of the FDICIA, Prompt
Corrective Action (PCA), involved early intervention in problem banks by regulators. PCA aims to
resolve banking problems of inadequate capital early and at the minimum cost to the bank insurance
16
fund. PCA uses three major ratios in the assessment of capital adequacy. These three ratios are (i)
Tier 1 Risk-Based Capital ratio, (ii) Total Risk-Based Capital ratio and (iii) Tier 1 Leverage ratio.
Based on these ratios, banks are categorized by their regulatory capital into five categories:
“well-capitalized,” “adequately capitalized,” “undercapitalized,” “significantly undercapitalized,” or
“critically undercapitalized.” Well-capitalized banks are supposed to have sufficient capital to serve as
a buffer from market swings. In contrast, market volatility can lead to swings in fair values such that
regulatory capital is impaired and regulatory intervention is more likely for banks that are not well-
capitalized. Regulatory intervention can result in the dilution of equity values or even takeovers. We
hypothesize that banks that are less than “well-capitalized” are more affected by changes in FVA or
impairment rules. For example, when banks experience a positive reaction to events that can lead to
relaxation of FVA or impairment rules, we expect a larger positive reaction from banks that are
relatively poorly capitalized.
Hypothesis 3: The magnitude of the stock price reactions to events that potentially changed the probability of FVA or impairment rules being relaxed (retained) in the banking industry is relatively positive (negative) for banks that are less than ‘well capitalized.’
Our proxy for banks that are less than well-capitalized, ‘Not-well-cap,’ is an indicator variable
that assumes the value 1 if a bank is not classified as well-capitalized or better based on its regulatory
capital ratios and 0 otherwise. That is, Not-well-cap assumes the value 1 if a bank is classified as
adequately capitalized, undercapitalized, significantly undercapitalized, or critically undercapitalized.
Not-well-cap equals 0 if a bank is classified as well-capitalized.
Our second cross-sectional hypothesis considers banks’ use of FVA. Banks that have
relatively more assets denominated in fair values should experience relatively large positive (negative)
reactions to changes in the probability of FVA or impairment rules being relaxed (retained).
Hypothesis 4: The magnitude of the stock price reactions to announcements that potentially changed the probability of FVA or impairment rules being curtailed in the banking industry is positively related to the bank’s proportion of fair value assets.
We measure a bank’s proportion of fair value assets, “FV_A to Total A,” as the ratio of assets
reported using fair value to the total assets of the bank. Assets reported at fair value include available-
17
for-sale securities, trading assets, loans and leases reported at fair value, other financial assets, and
servicing rights reported at fair value.
Third, we consider bank exposure to pro-cyclical consequences of illiquid assets reported at
fair value. As discussed above, credit markets became illiquid during the financial crisis of 2008-09.
Pro-cyclical contagion allegedly contributed to the financial crisis as prices for securities fell in the
inactive market and more banks were forced to react to improve their regulatory capital. We predict
that banks with relatively large amounts of illiquid assets reported at fair value were more exposed to
pro-cyclical contagion and had stronger reactions to changes in the probability of FVA or impairment
rules being relaxed (retained).
Hypothesis 5: The magnitude of the stock price reactions to announcements that potentially changed the probability of FVA or impairment rules being curtailed in the banking industry is positively related to the bank’s amount of illiquid fair value assets. Our measure for the amount of illiquid fair value assets, “Level 2 and 3 FV_A,” is the sum of
level 2 and level 3 fair value assets scaled by total assets of the bank. Level 2 assets’ fair values are
based on models that use market inputs. So, if the markets are not functioning properly and market
inputs are used in valuing these assets, the models essentially result in fire-sale prices. Level 3 assets
are the most difficult for banks to measure at fair value – generally because there is no active market
for these assets. As a result, unobservable inputs must be used to model their values. The models used
to value these assets require a "liquidity risk factor" and the result is valuations that generally are not
much different from recent fire-sale prices (Mortgage Bankers Association 2009). Thus, we predict
that firms with a higher proportion of their assets classified as level 2 and level 3 fair value assets are
more susceptible to write downs and pro-cyclicality as they mark down their assets to the recent fire-
sale price.
Fourth, on March 16, 2009, the FASB proposed a new rule that relaxed the conditions under
which a bank would have to report impairment in the value of its non-fair value assets (FSP No. FAS
115-2 and FAS 124-2). To avoid considering an impairment as ‘other-than-temporary’ under the new
rules, bank management would be required to assert that (i) it does not have the intent to sell the
18
security and (ii) it is more likely than not that it will not have to sell the security before recovery of its
cost basis. Prior to this FASB Staff Position, to avoid an OTTI, management was required to state that
it has both the intent and ability to hold an impaired security for a period of time sufficient to allow for
any anticipated recovery in fair value. Further, the new rule required that only the impairment related
to credit loss be recognized in earnings. Impairment related to all other factors (e.g., liquidity) is to be
recognized in other comprehensive income. Relaxation of these rules for recording OTTI suggests the
following hypothesis:
Hypothesis 6: The magnitude of the stock price reactions to events that potentially changed the probability of FVA or impairment rules being relaxed (retained) in the banking industry is especially positive (negative) for banks with relatively large amounts of potentially impaired securities. Our measure for potentially impaired securities, “BTM_Securities,” is the book-to-market ratio
of a bank’s debt-securities portfolio. BTM_Securities equals the sum of amortized cost of held-to-
maturity securities and available-for-sale securities scaled by the total fair value of held-to-maturity
and available-for-sale securities.
Fifth, we examine the effects of potentially inconsistent application of FVA across banks
applying U.S. GAAP. If an asset is classified as a trading asset, the bank is required to report the asset
at fair value on a recurring basis on the balance sheet and recognize any change in fair value in
earnings. On the other hand, if the same asset is classified as an available-for-sale security, the bank
reports the fair value of the asset on the balance sheet, but changes in fair value are not recognized in
earnings unless the impairment is permanent. Thus, similar or even identical assets can have different
effects on earnings and regulatory capital depending on their classification as trading versus available-
for-sale. Prior to FSP No. FAS 157-4, which provided additional guidance for determining fair value
of assets in illiquid markets or distressed transactions, a bank that classified an asset as a trading asset
was arguably required to take an instant write-down if the market value of the asset declined even
though the new price of the asset was from a distressed/fire sale. On the other hand, a bank that
classified the same asset as an available-for-sale security would take a write-down only if the decline

19
in the market value was other-than-temporary. Accordingly, we expect that banks with relatively large
amounts of trading assets will have more positive reactions to changes in the probability of FVA rules
being relaxed.
Hypothesis 7: The magnitude of the stock price reactions to events that potentially changed the probability of fair value accounting or impairment rules being relaxed (retained) in the banking industry is especially positive (negative) for banks with relatively more trading assets.
Our measure for the amount of trading assets, “Trading_A to Total A,” is total trading assets
scaled by total assets of the bank.
Our last cross-sectional factor considers aspects of individual bank’s information environment.
FVA arguably provides investors more timely and relevant information about the current market value
of banks’ assets and liabilities (Ball 2008, Ryan 2009). This information can be important especially
during crises when markets are volatile and there is greater information asymmetry. Relative to cost-
basis accounting, strict FVA and impairment rules ought to improve the information environment of
banks by increasing transparency and reducing information asymmetry. Assuming improved
transparency and less information asymmetry are valuable, we hypothesize:
Hypothesis 8: The magnitude of the stock price reactions to events that potentially changed the probability of fair value accounting or impairment rules being relaxed (retained) in the banking industry is especially negative (positive) for banks with a relatively weak information environment.
Our proxy for banks’ information environment, “Analyst Coverage,” is an indicator variable that
equals one if the bank has at least one IBES analyst providing an earnings estimate in the year prior to
the start of our sample period (i.e., over the period September 1, 2007 to August 31, 2008) and zero
otherwise. If FVA or impairment rules are relaxed, banks with no analyst coverage have fewer
alternative sources of timely and relevant information, which in turn suggests that banks without
analyst coverage are likely to have a relatively weak information environment characterized by greater
information asymmetry and less transparency.
3.0 Methodology 3.1 Stock price reactions
20
Bank-specific stock returns are commonly modeled using a two-factor model that controls for
the market return and interest rate changes, e.g., see Flannery and James (1984) and Beatty et al.
(1996). Therefore, to test H1, we use a two-factor model in which firm-specific returns are regressed
on the CRSP equally-weighted daily return, on a variable capturing interest rate changes, and on ten
event dummy variables as specified in Table 1:
RETit = α0 + β1 Mkt_Rett + γ1 ΔT-Billt + δ1 FV_Windowt + εit (1)
Where
RETit = daily stock return for firm i, Mkt_Rett = CRSP equally-weighted daily return, ΔT-Billt = daily change in 3-month Treasury bill secondary market rate, FV_Windowt = indicator variables that allow for mean shifts in returns on event days. Each event window is specified as follows. FV_Window assumes a value of 1 on the day
before, the day of, and the day after the event date(s) listed in Table 1. If two or more event periods
overlap, the event window extends from the day preceding the first event to the day following the last
event. In total, we examine ten event windows leading to the eventual adoption of new FVA and
impairment rules. We report results using two different specifications of FV_Window. First, we
allow δ1 to vary by event (FV_Window_n) and report stock price reactions for each event window.
Second, we report the stock price reaction for all events aggregated together (FV_Window_Combined)
by setting FV_Window equal to 1 (-1) on announcement days assumed to increase (decrease) the
probability of suspension/modification of FVA or impairment rules, 0 otherwise. To assess the
statistical significance of the stock price reactions, we cluster standard errors by time (i.e., by trading
day) to produce robust t-statistics (see Petersen 2009).
3.2 Cross-sectional analysis
As discussed earlier, we also test for cross-sectional variation (hypotheses H2-H8) in banks
stock price reactions to deliberations leading to adoption of new FVA and impairment rules. Since
cross-sectional dependence in security returns can produce ‘too many’ statistically significant t-values
21
in event studies (Leftwich 1981), we use a procedure suggested by Sefcik and Thomspon (1986).9
δ1 = b0 + b1 (Not-well-cap) + b2 (FV_A to Total A) + b3 (Level 2 and 3 FV_A) + b4
(BTM_Securities) + b5 (Trading_A to Total A) + b6 (Analyst Coverage) (2)
The
advantage of the Sefcik and Thompson (1986) approach is that it yields valid standard errors as it
accounts for cross-sectional heteroskedasticity and cross-correlation of the residuals which is likely to
occur in the presence of common event windows for all sample firms. To illustrate how the Sefcik and
Thompson (1986) approach works, consider a setting in which the event coefficient, δ1 (from equation
1), has a constant component and a component that depends on firm-specific values of
BTM_Securities, Not-well-cap, FV_A to Total A, Level 2 and 3 FV_A, BTM_Securities, Trading_A
to Total A, and Analyst Coverage. That is, δ1 can be expressed as follows:
where:
Not-well-cap = 1 if a bank is classified as not “well-capitalized,” 0 otherwise, i.e., a bank is classified as not well-capitalized for any category worse than “well-capitalized,” including “adequately capitalized,” “undercapitalized” or “significantly undercapitalized” or “critically undercapitalized.”
FV_A to Total A = ratio of assets reported at fair value to total assets, i.e., the sum of available-
for-sale securities, trading assets, loans and leases reported at fair value, other financial assets and servicing rights reported at fair value, scaled by total assets.
Level 2 and 3 FV_A = sum of level 2 and level 3 fair value assets scaled by total assets. BTM_Securities = the sum of amortized cost of held-to-maturity securities and available-for-
sale securities scaled by the sum of the fair value of held-to-maturity securities and available-for-sale securities.
Trading_A to Total A = Trading assets scaled by total assets. Analyst Coverage = 1 if a bank has analyst coverage over the 12 months prior to Sep 2009, 0
otherwise. The Sefcik and Thompson (1986) procedure creates a portfolio for each cross-sectional
hypothesis (plus the intercept). Thus, we have seven portfolios constructed from sample firm returns,
and time-series regressions in equation (1) are performed using weighted-portfolio returns as the 9 An alternate approach is a two-step procedure that involves regressing event period residuals on proxies for the different determinants of cross-sectional variation. However, this approach may yield invalid standard errors.
22
dependent variable.10
RETit = αi + βi Mkt_Rett + γi ΔT-Billt + bi FV_Window_Combinedt, (3)
To obtain weighted-portfolio returns we define two matrices: (i) a t x j matrix,
R, of returns where t is the number of periods and j the number of firms, and (ii) a j x k matrix, F,
where k represents the number of determinants of cross-sectional variation plus the intercept. Finally,
we estimate (F'F)-1F'R' to get a matrix of weighted-portfolio returns (see Sefcik and Thompson 1986
for a full discussion). The equation below represents the portfolio time-series regressions:
where i ranges from one to seven and t equals the number of trading days in our sample period (i.e., 150).
The significance of a firm-specific characteristic in a cross-sectional regression is assessed by
examining the t-statistics of the coefficient on FV_Window_Combined in the above system of
equations. For example, to assess whether banks that are not well-capitalized had a more positive
stock price reaction to events that signaled an increase in the probability that existing FVA and
impairment rules would be modified, we examine whether b1 in the above system of equations is
positive and statistically significant.
3.3 Data sources and sample selection
The sample comprises of all U.S. bank holding companies that file the FR Y-9C report and have
financial data available on the Bank Holding Companies Database maintained by the Federal Reserve
Bank of Chicago and stock price data on CRSP.11
Our event analysis extends from the beginning of September 2008 to April 3, 2009. The
announcements that we have identified as event windows are listed in Table 1. The announcements
These restrictions result in a sample of 299 bank
holding companies. For the cross-sectional analysis we require that the bank holding companies have
stock price data for the entire sample period, reducing the sample to 288 bank holding companies. The
daily three-month U.S. Treasury bill secondary market rate data is obtained from the Federal Reserve
Bank of St. Louis.
10 In all results reported in the paper, the FV_Window coefficients, δ1, examined in our cross-sectional analyses are those from firm-specific regressions of (1) with the FV_Window variable defined as FV_Window_Combined. 11 The Bank Holding Companies Database collects financial data included in the FR Y-9C reports filed by the bank holding companies. These reports contain information from the balance sheet, income statement, risk-based capital measures and additional supporting schedules. The data is available quarterly from 1986 onwards.
23
were identified primarily through a search of Google, Google News, and Google Blogs. We also
cross-checked our events with FASB’s chronology of events listed in their project updates to be sure
that we did not miss important announcements or events. Finally, all our cross-sectional variables are
measured at the beginning of our event analysis period, i.e., at the beginning of September 2008.
3.4 Descriptive data
Table 3 presents descriptive data on sample banks. Cost-basis and fair value accounting data are
from June 30, 2008 and stock price data are from August 29, 2008. The mean (median) bank had
$33.6 ($2.3) billion in total assets, $2.8 ($0.2) billion in book value of equity and $3.2 ($0.2) billion in
market value of equity. For each of these measures of size, the mean bank exceeded the 90th
percentile, consistent with a relatively few huge national banks dominating the sample. As of the end
of June 2008, the cost-basis of held-to-maturity and available-for-sale securities generally exceeded
their fair values with mean (median) percentage differences being 1.3% (0.8%) but reaching 3.6% at
the 90th percentile (see BTM_Securities). As of June 30, 2008, almost 45% of sample banks were
classified by regulators as less than “well capitalized.” On average, assets recorded at fair value
comprised 16.3% of total assets (FV_A to Total A), trading assets were less than 1% (Trading_A to
Total A), level 2 plus level 3 fair value assets were 1.4% (Level 1 and 2 FV_A), and 82.6% of banks in
our sample were followed by analysts (Analyst Coverage). Sample banks had a mean (median) -2% (-
1.8%) return during the collapse of Lehman Brothers in September 2008. The mean and median
equally weighted CRSP daily index return was -0.1% from August 29, 2008 through April 3, 2009,
and the total buy-and-hold market return over the same period was -23.4%. The mean and median
daily change in Treasury Bill rate was -0.01% from August 29, 2008 through April 3, 2009.
4.0 Results on overall and event-by-event stock price reactions to potential changes in FVA or impairment rules (H1)
Table 4 presents results on the reaction of bank stocks to ten individual events that signaled
potential changes in FVA or impairment rules. Each predicted sign in Table 4 assumes that reporting
under then-existing FVA and impairment rules was perceived as harmful to most banks during this
24
period of economic instability. Given our events are aligned in calendar time and firms are all in the
same industry, we use relatively short windows to better isolate the effects of each event. We
acknowledge that, to the extent that the market did not quickly sort out the relative exposure of banks
to potential changes in FVA and impairment rules, the entire market reaction may not be captured.
Column 1 of Panel A in Table 4, presents results of the all event window analysis. The sign of
the market reaction was as predicted for nine of the ten events; event window four is the only
exception. On average, banks had significant positive reactions to four of seven events associated with
relaxing FVA or impairment rules and significant negative reactions to two of three events signaling
current FVA or impairment rules would be supported. Column 2 of Panel A in Table 4 presents results
for the five clean event windows. The sign of the market reaction was as predicted for each of these
five events and, on average, banks had significant stock price reactions in the predicted direction for
each of the five windows.
Panel B of Table 4 presents results on the overall stock market reaction for all event windows
aggregated together by assigning +1 (-1) to each event window assumed to increase the probability
that FVA or impairment rules would be relaxed (retained). The results for all ten events combined are
reported in column 1. The overall reaction was positive and significant (p = 0.001).12
12 Event window 1 is centered around the deliberations and passage of the Emergency Economic Stabilization Act of 2008 (also known as the bailout bill). Since the bill included provisions unrelated to revising FVA or impairment rules, we repeated the analysis excluding event window #1 and the results were qualitatively unchanged.
Consistent with
the results reported in column 1, we find that the inferences drawn do not change when we restrict our
analysis to the clean windows. The results for the clean windows combined are reported in column 2
and once again the overall reaction is positive and significant (p < 0.001). On average, our results
suggest that stock market participants viewed changes that relaxed (retained) FVA or impairment rules
as positive (negative) for banks. Our results are consistent with stock market participants viewing fair
value accounting rules to be value-relevant for banks during financial crisis of 2008-09. If market
perceptions capture the underlying economics, then-existing FVA and impairment rules appeared to be

25
perceived as harmful on average to banks during this crisis.
5.0 Do stock market reactions to fair value announcements vary in the cross-section with individual bank’s susceptibility to contagion? (H2-H8)
While our stock market reaction tests discussed above indicate a significant relation between
potential changes in FVA/impairment rules and bank equity values, we next explore the link to
contagion among banks during the financial crisis of 2008-09. Recall that contagion is the process
whereby arguably independent shocks at one bank spread like a disease to other banks, and in the
extreme, potentially lead to a breakdown of the entire banking system. In this section we address
whether contagion among banks was exacerbated by FVA and impairment rules. In section 5.1, we
conduct an overall test of the relation between contagion and banks’ stock price reactions to potential
changes in FVA and impairment rules. We investigate bank characteristics that potentially affect
contagion in section 5.2, and consider the countervailing effect of potentially losing fair value
information in section 5.3.
5.1 Overall test of contagion (H2)
In H2, we examine the overall cross-sectional relation between bank susceptibility to contagion
and market reactions to events that potentially changed the probability of FVA or impairment rules
being relaxed or retained. Recall that we measure individual bank sensitivity to contagion by
assigning a scaled rank to each bank based on its stock price reaction to the collapse of Lehman
Brothers from September 12, 2008 to Sep 15, 2008 (where September 13 and 14 were non-trading
days). We assume that banks that had relatively negative stock price reactions to Lehman’s collapse
are more susceptible to contagion. We rank individual bank’s stock return reactions from most
negative to most positive and scale them by the total number of banks in the sample (i.e., 288) and
label this variable ‘Contagion.’
Table 5 presents results on our overall cross-sectional test of the relation between bank
susceptibility to contagion and market reactions to events that signaled potential changes in FVA or
impairment rules. Table 5 summarizes the estimated coefficients of the signed-mean market reaction
26
(FV_Window_Combined) from two different regressions – one for the intercept and one for
Contagion, as described in the methods section. Each of these regressions is a time-series regression
with the portfolio weight based on a cross-sectional proxy as a dependent variable and market return,
change in Treasury bill rate and signed-mean as the independent variables. When we consider all
event windows in column 1 of Table 5, we find that Contagion is positive as predicted and significant
(p = 0.076), consistent with interdependencies across the banking industry and suggesting that banks
more susceptible to contagion are also the ones that would benefit most from relaxation of FVA and
impairment rules. However, when we restrict our analysis to the five clean event windows reported in
column 2 of Table 5, we find that the coefficient on Contagion is still positive, but is no longer
statistically significant (p = 0.174). We consider more fine-grained firm-specific factors that
potentially contribute to contagion in the next section.
5.2 Components of contagion (H3-H7)
In this section we examine five bank characteristics that potentially contributed to pro-cyclical
contagion during the financial crisis of 2008-09: (i) low regulatory capital (H3), (ii) more assets
recorded at fair value (H4), (iii) poor asset liquidity (H5); (iv) larger potential impairments (H6); and
(v) proportion of trading assets relative to total assets (H7).
Table 6 summarizes the estimated coefficients of the signed-mean market reaction variable
(FV_Window_Combined) from seven different regressions, as described in the methods section.
Again, each of these regressions is a time-series regression with the portfolio weight based on a cross-
sectional proxy as a dependent variable and market return, change in Treasury bill rate and signed-
mean as the independent variables. The results of the all ten event-window analysis are reported in
column 1 of Table 6. Consistent with H3, we find that the magnitude of stock price reactions to the
relaxation of FVA and impairment rules was positively related to banks being less than ‘well
capitalized’ and marginally significant (p = 0.102). Perhaps not surprisingly given U.S. GAAP is used
for regulatory purposes, concerns about regulatory capital appear to have affected investors’ reactions
to potential changes in FVA and impairment rules. Inconsistent with H4, we find no evidence that the
27
ratio of fair value assets to total assets was associated with stronger reactions to changes in FVA and
impairment rules. Consistent with H5, we find that market reactions to changes in FVA and
impairment rules were positively associated with the amount of illiquid (level 2 plus level 3 fair value)
assets subject to market value tests and thus more exposed to pro-cyclical contagion as other banks
marked down their assets to fire sale prices (p = 0.075). The results on H4 and H5 compliment the
findings of Lev and Zhou (2010) who also find that equity investors of financial firms with greater
proportion of level 2 and 3 fair value assets react more negatively to the financial crisis events. On the
other hand, they do not find that the proportion of level 1 fair value assets plays a role in the reaction
to the events in the financial crisis. Consistent with H6, we find that market reactions to changes in
FVA and impairment rules were significantly associated with banks’ likelihood of being subject to
other-than-temporary impairments related to the 2008-09 financial meltdown (p = 0.064). Finally and
inconsistent with H7, we find no evidence that the extent of trading assets was associated with stronger
reactions to changes in FVA and impairment rules. In summary, of the five bank characteristics we
identify, three are at least marginally significantly associated with market reactions to potential
modifications to FVA or impairment rules: (i) being less than ‘well-capitalized’ (Not-well-cap); (ii) the
extent of illiquid assets on their books (sum of level 2 and level 3 fair value assets) and (iii) the
likelihood of other-than-temporary impairments (BTM_securities).
Column 2 of Table 6 reports the results of examining the components of contagion after
restricting the analysis to the five clean event windows. Consistent with H5, we continue to find that
market reactions to changes in FVA and impairment rules were positively associated with the
proportion of illiquid (level 2 plus level 3 fair value) assets (p = 0.021). While the coefficients on the
other previously significant variables, not-well-capitalized and likelihood of other-than-temporary
impairment, are in the predicted direction, they are no longer statistically significant (p = 0.369 and p =
0.294, respectively).
5.3 Do investors care about the potential loss of fair value information? (H8)
Finally, we investigate whether the potential loss of fair value information harms banks with a
28
relatively weak information environment. We proxy for a weak information environment by the
absence of professional analyst coverage. We argue that banks with no analyst coverage are likely to
have fewer alternative sources of information and investors in these banks are more likely to be
harmed by the potential relaxation of FVA and impairment rules. In results reported in column 1 of
Table 6 for our ten event-window analysis, we find that banks without analyst coverage experience
significantly smaller (larger) positive reactions (p = 0.023) to events suggesting relaxation (retention)
of then-existing FVA and impairment rules. This is consistent with investors in banks without analyst
coverage being concerned they would not be able to rely on analysts’ expertise to compensate for the
loss of value-relevant fair value information. Hence, the positive coefficient on analyst coverage can
be interpreted as evidence consistent with views that relaxing FVA and impairment rules will lead to
less timely and less informative disclosures for at least some banks (e.g., Ball 2008, Ryan 2009 and the
CFA Center for Market Integrity 2008). However, after restricting our analysis to the five clean event
windows reported in column 2 of Table 6, the coefficient on Analyst Coverage remains positive, but is
no longer statistically significant (p = 0.240).
5.4 Interpreting the cross-sectional results?
So how should one interpret our mixed cross-sectional results? On one hand, one could put
more weight on our higher power but potentially confounded ten event-window results. This would
implicitly require one to assume that event window news is being driven largely by potential changes
in FVA and impairment rules. With this interpretation, we find some evidence consistent with pro-
cyclical contagion being related to: (i) banks being less than well-capitalized; (ii) the extent of banks’
illiquid assets, and (iii) banks’ likelihood of experiencing other-than-temporary impairments.
Alternatively, if one is concerned that other non-FVA events may be confounding our ten-window
results, one should probably rely on our relatively clean but lower power five-window tests. Here, we
only find evidence of pro-cyclical contagion being related to the relative magnitude of banks’ illiquid
assets. While this is arguably the most direct measure of banks’ exposure to pro-cyclical FVA-
induced contagion (as level 2 and level 3 assets were most subject to concern about being marked
29
down to fire sale prices during the crisis), none of the other cross-sectional explanations of stock price
reactions are statistically significant.
6.0 Conclusion The financial crisis of 2008-09 arguably led to a near meltdown of the U.S. banking system.
Then existing FVA and impairment rules were alleged to contribute to the crisis by exacerbating pro-
cyclical contagion by effectively requiring banks to mark down many of their assets to fire sale prices.
For example, assume a bank has to sell assets at fire sale prices due to a shortfall in regulatory capital.
This, in turn, can force other banks to mark their similar assets to these declining prices, causing some
of these otherwise healthy banks to sell assets and curtail lending in an attempt to maintain adequate
regulatory capital.
We examine stock price reactions to policy deliberations and decisions related to FVA and
impairment rules during the financial crisis. In doing so, we examine the link between FVA and
contagion, and inform the debate about the role of FVA and impairment rules during a period of
extreme financial turmoil. We identify ten event windows where policymaker deliberations,
recommendations and actions potentially affected the probability of FVA and impairment rules being
relaxed or supported. We find that four of seven events that signaled an increased probability that
existing FVA standards would be relaxed had significant positive abnormal stock price reactions for
sample banks. We find that two of three events that signaled a decreased probability that existing
FVA standards would be relaxed exhibited significant negative abnormal stock returns.
We also identify a subset of five “clean” event windows that either (i) did not have confounding
events or (ii) had potential confounding events operating in the opposite direction from that predicted
by potential changes in FVA or impairment rules. Restricting our analysis to these five “clean” event
windows, we find that both of the “clean” event windows that signaled an increased probability that
the existing FVA standards would be relaxed had significant positive abnormal stock price reactions.
Further, all three of the “clean” event windows that signaled a decreased probability that existing FVA
standards would be relaxed exhibited significant negative abnormal stock returns. In addition, we find
30
a highly significant reaction when we aggregate all events into one window, regardless of whether the
aggregation is over the original ten event windows or a subset of five “clean” event windows. In sum,
investors apparently acted as if the potential negative effects of then-existing FVA and impairment
rules outweighed the benefits associated with having more timely and hence transparent mark-to-mark
data for decision making.
In cross-sectional tests, we find mixed evidence on the distribution of stock price reactions being
consistent with investors worrying about contagion among banks. When we examine all ten event-
windows, banks that were most susceptible to pro-cyclical contagion tended to garner the greatest
benefit from relaxation of FVA and impairment rules. When we restrict our analysis to a subset of five
relatively clean event windows, we fail to find evidence that banks most susceptible to contagion
reaped the greatest benefits from potential modification of FVA and impairment rules. Further, when
we looked at five bank-specific characteristics that could contribute to contagion, we found robust
evidence of the magnitude of stock price reactions to the relaxation of FVA and impairment rules
being positively related to the proportion of banks’ illiquid assets. We find mixed evidence for two
other bank characteristics: (i) banks being less than ‘well-capitalized,’ and (ii) banks’ likelihood of
being subject to other-than-temporary impairments related to the 2008-09 financial meltdown. Both
were at least marginally significant in our ten-window tests but were insignificant in our clean five-
window tests. In our ten-window tests, we also found some evidence that banks with no analyst
coverage react less positively to the events that relaxed FVA. This suggests that FVA data may
provide timely and informative disclosures about the banks’ financial soundness when other
information sources are less available. In sum, the ten-window results are consistent with opposing
views related to relaxing FVA, i.e., market participants act as if FVA encourages contagion but also
provides more informative disclosures for at least some banks. However, analyst coverage was
insignificant in our relatively clean five-window tests.
While our research indicates that market participants acted as if then-existing FVA and
impairment rules harmed banks on average during the financial crisis, it does not address the question,
31
“Which is best – FVA or cost-basis accounting?” Throughout this period, regulatory accounting
principles (RAP) largely relied on U.S. GAAP. Hence, one might argue that had regulators used
separate cost-basis RAP, political and market reactions to U.S. GAAP FVA and impairment rules
would likely have been muted. However, research by Hill and Ingram (1989) and Blacconiere et al
(1991) reminds us that Savings and Loans (S&L) strategically used regulatory accounting principles
(“RAP”) when it would benefit the firm or management. Under then existing RAP, S&Ls were
permitted a number of accounting devices that seemed to increase their capital, including the ability to
record present gains at fair value, but defer losses on securities or loans already sold – a clear departure
from GAAP. Hence, decoupling RAP from GAAP may not be a panacea either.
Further, our tests do not necessarily suggest that FVA is ‘worse’ than cost basis accounting for
regulatory purposes. As we discussed above, we provide some modest evidence that investors in
banks with less access to alternative information sources did not react as enthusiastically to
policymakers’ efforts to relax FVA. Hence, it is possible that FVA merely accelerates the price and
resource allocation adjustment processes resulting in a relatively speedy return to financial stability.
32
Appendix
Changes in Fair Value Accounting and Impairment Rules: September 29, 2008 to April 2, 2009
Following the onset of the financial crisis in September 2008, policymakers debated relaxation
(versus retention) of then-existing FVA or impairment rules. This approximate six-month period of
deliberation culminated with three Financial Accounting Standards Board (FASB) staff positions
(FSPs) issued on April 2, 2009 that affected FVA and impairment rules: (i) FSP No. FAS 157-4, (ii)
FSP No. FAS 115-2 and FAS 124-2; and (iii) FSP FAS No. 107-1 and APB 28-1.
FSP 157-4 provided additional guidance for estimating fair value in accordance with SFAS
No. 157 when the volume of activity for the asset or liability has decreased significantly. Prior to FSP
No. FAS 157-4, many in practice interpreted FASB guidance (in FSP No. FAS 157-3) as emphasizing
the use of last transaction price or quoted price as the primary basis for estimating fair value in SFAS
157. This resulted in alleged misapplication of SFAS No. 157, which states that “a fair value
measurement assumes that the asset or liability is exchanged in an orderly transaction between market
participants to sell the asset or transfer the liability at the measurement date. An orderly transaction is
a transaction that assumes exposure to the market for a period prior to the measurement date to allow
for marketing activities that are usual and customary for transactions involving such assets or
liabilities; it is not a forced transaction (for example, a forced liquidation or distress sale)” (emphasis
added in FSP No. FAS 157-4). The notion that a transaction resulting from a forced liquidation or
distressed sale does not represent fair value also is discussed in paragraphs 10 and 17 of Statement
157.
FSP No. FAS 115-2 and FAS 124-2 amended other-than-temporary impairment (OTTI)
guidance in U.S. GAAP for debt securities to make the guidance more operational and to improve the
disclosure and presentation of OTTI on debt and equity securities in the financial statements. The
FASB modified the existing requirements that, to avoid recognizing an OTTI, an investor must assert
that it has both the intent and ability to hold a security for a period of time sufficient to allow for an
33
anticipated recovery in its fair value to its amortized cost basis. The new FSP required entities to
assess whether the entity (a) has the intent to sell the debt security, or (b) more likely than not will be
required to sell the debt security before its anticipated recovery. If either of these conditions is met,
the entity must recognize an OTTI. Further, in instances in which a determination is made that a credit
loss exists but the entity does not intend to sell the debt security and it is more likely than not that the
entity will be required to sell the debt security before the anticipated recovery of its remaining
amortized cost basis, the impairment is separated into (a) the amount of the total impairment related to
the credit loss, and (b) the amount of the total impairment related to all other factors. The amount of
the total OTTI related to credit loss is recognized in earnings and the amount of the total OTTI related
to all other factors is recognized in other comprehensive income.
FSP No. FAS 107-1 and APB 28-1 relates to fair value disclosures of any financial
instruments. This FSP amended FAS No. 107 and APB Opinion No. 28 to require disclosures about
fair value of financial instruments for interim periods as well as in annual financial statements.
34
REFERENCES Ait-Sahalia, Y., J. Andritzky, A. Jobst, S. Nowak and N. Tamarisia. 2010. “Market response to policy
initiatives during the global financial crisis.” NBER Working Paper 15809. Available at: http://www.nber.org/papers/w15809
Acharya, V.V., D.M. Gale, and T. Yorulmazer. 2009. “Rollover risk and market freezes.” NYU
Working Paper No. FIN-08-030. Available at SSRN: http://papers.ssrn.com/sol3/papers.cfm?abstract_id=1354517
Acharya, V., L. Pedersen, T. Philippon and M. Richardson. 2009. “Regulating systemic risk” in
Restoring Financial Stability: How to Repair a Failed System (eds. V. Acharya and M. Richardson). Wiley Finance (New Jersey).
Acharya, V., T. Philippon, M. Richardson and N. Roubini. 2009. “The Financial Crisis of 2007-2009:
Causes and remedies” in Restoring Financial Stability: How to Repair a Failed System (eds. V. Acharya and M. Richardson). Wiley Finance (New Jersey).
Ball, R. 2008. “Don’t blame the messenger…or ignore the message.” Note, available at
http://faculty.chicagobooth.edu/brian.barry/igm/ShootingtheMessenger2008-10-12.pdf Barth, M.E., W.R. Landsman, and J.M. Wahlen. 1995. “Fair value accounting: Effects on banks’
earnings volatility, regulatory capital, and value of contractual cash flow.” Journal of Banking and Finance 19: 577-605.
Beatty, A., S. Chamberlain, and J. Magliolo. 1996. “An empirical analysis of the economic
implications of fair value accounting for investment securities.” Journal of Accounting and Economics 22: 43-77.
Beltratti, A., R. Stulz. 2009. “Why did some banks perform better during the credit crisis? A cross-
country study of the impact of governance and regulation.” NBER Working Paper No. w15180. Available at SSRN: http://papers.ssrn.com/sol3/papers.cfm?abstract_id=1442652
Blacconiere, W., R. Bowen, S. Sefcik, and C. Stinson. 1991. “Determinants of the use of regulatory
accounting principles by Savings and Loans.” Journal of Accounting and Economics 14: 167-201. CFA Institute Centre for Financial Market Integrity. 2009. Comment letter to the FASB on “Proposed
FSP FAS 107-b and APB 28-a Interim Disclosures about Fair Value of Financial Instruments.” Cifuentes, R., G. Ferrucci, and H.S. Shin. 2005. “Liquidity risk and contagion.” Journal of the
European Economic Association 3: 556-566. Cornett, M.M., Z. Rezaee, and H. Tehranian. 1996. “An investigation of capital market reactions to
pronouncements on fair value accounting.” Journal of Accounting and Economics 22: 119-154. Diamond, D.W., and R.G. Rajan. 2009. “Fear of fire sales and the credit freeze.” NBER Working
Paper Series, Vol. w14925. Available at SSRN: http://papers.ssrn.com/sol3/papers.cfm?abstract_id=1394832
Flannery, M., and C. James. 1984. “The effect of interest rate changes on the common stock returns of
financial institutions.” Journal of Finance 39: 1141-1153.
35
Financial Accounting Standards Board. February 2007. “SFAS No. 159: The fair value option for
financial assets and financial liabilities.” Financial Accounting Standards Board. April 2009. “FSP No. FAS 157-4: Determining fair value
when the volume and level of activity for the asset or liability have significantly decreased and identifying transactions that are not orderly.”
Gartenberg, C.M., and G. Serafeim. 2009. “Did fair valuation depress equity values during the 2008
financial crisis?” Available at SSRN: http://ssrn.com/abstract=1468824 Gingrich, N. 2008. “Suspend mark-to-market now!” Forbes.com, Sept. 29,
http://www.forbes.com/2008/09/29/mark-to-market-oped-cx_ng_0929gingrich.html. Hill, J.W and R. W. Ingram. 1989. “Selection of GAAP or RAP in the Savings and Loan Industry.”
The Accounting Review, Vol. 64, No. 4 (Oct., 1989), pp. 667-679. Hughes, J., and G. Tett. March 13, 2008. “An unforgiving eye: Bankers cry foul over fair value
accounting.” http://us.ft.com/ftgateway/superpage.ft?news_id=fto031320081631003695 International Accounting Standards Board. October 2008. “Reclassification of financial assets:
Amendments to IAS 39 and IFRS 7.” International Monetary Fund. 2008. Containing systemic risks and restoring financial soundness.
April. Johnson, S. March 19, 2008. “The fair-value blame game.”
http://www.cfo.com/article.cfm/10902771?f=home_featured Katz, D.M. October 29, 2008. “Former FDIC chief: Fair value caused the crisis.”
http://www.cfo.com/article.cfm/12502908?f=members_110508 Khan, U. 2009. “Does fair value accounting contribute to systemic risk in the banking industry?”
Available at SSRN: http://papers.ssrn.com/sol3/papers.cfm?abstract_id=1327596 Laux, C., and C. Leuz. 2009. “The crisis of fair value accounting: Making sense of the recent debate.”
Accounting, Organizations, and Society 34. Available at SSRN: http://papers.ssrn.com/sol3/papers.cfm?abstract_id=1392645
Leftwich, R. 1981. “Evidence of the impact of mandatory changes in accounting principles on
corporate loan agreements.” Journal of Accounting and Economics 3: 3-36. Lev, B. and N. Zhou. 2010. “Unintended consequence: Fair value accounting informs on liquidity
risk.” Working Paper. Available at SSRN: http://papers.ssrn.com/sol3/papers.cfm?abstract_id=1466009
Lys, T. 1996. “Abandoning the transaction-based accounting model: Weighing the evidence.” Journal
of Accounting and Economics 22: 155-175.
36
Mortgage Bankers Association. January 2009. “The SEC should address the pro-cyclical impact of fair value accounting.” Available at : http://www.mbaa.org/files/AU/IssueBriefs/FairValueAccountingIssueBrief.pdf
Petersen, M. A. 2009. “Estimating standard errors in finance panel data sets: Comparing approaches.”
Review of Financial Studies 22: 435-480. Plantin, G., H. Sapra, and H.S. Shin. 2008. “Marking-to-market: Panacea or pandora’s box?” Journal
of Accounting Research 46: 435-460. Rummell, N. March 24, 2008. “Fair value rules get more blame for crunch.”
http://www.financialweek.com/apps/pbcs.dll/article?AID=/20080324/REG/854569832 Ryan, S.G. 2008. “Accounting in and for the subprime crisis.” Available at SSRN:
http://ssrn.com/abstract=1115323 Ryan, S.G. 2009. “Fair value accounting: Policy issues raised by the credit crunch.” In Restoring
Financial Stability: How to Repair a Failed System. Viral Acharya and Matthew Richardson (eds). John Wiley and Sons (New Jersey).
Sapra, H. 2009. “What are the economic trade-offs in the fair value debate?” Chicago Booth Research
Paper No. 09-35. Available at SSRN: http://papers.ssrn.com/sol3/papers.cfm?abstract_id=1481777 Securities and Exchange Commission. 2008. Unedited transcript of the roundtable on mark-to-market
accounting. October 29, available at http://www.sec.gov/spotlight/fairvalue/marktomarket/mtmtranscript102908.pdf
Securities and Exchange Commission. December 2008. “Report and recommendations pursuant to
section 133 of the Emergency Economic Stabilization Act of 2008: Study on mark-to-market accounting.”
Sefcik, S.E. and R. Thompson. 1986. “An approach to statistical inference in cross-sectional models
with security abnormal returns as dependent variable.” Journal of Accounting Research 24 (2): 316-334.
Shleifer, A., and R.W. Vishny. 2009. “Unstable banking.” NBER Working Paper No. w14943.
Available at SSRN: http://papers.ssrn.com/sol3/papers.cfm?abstract_id=1401788
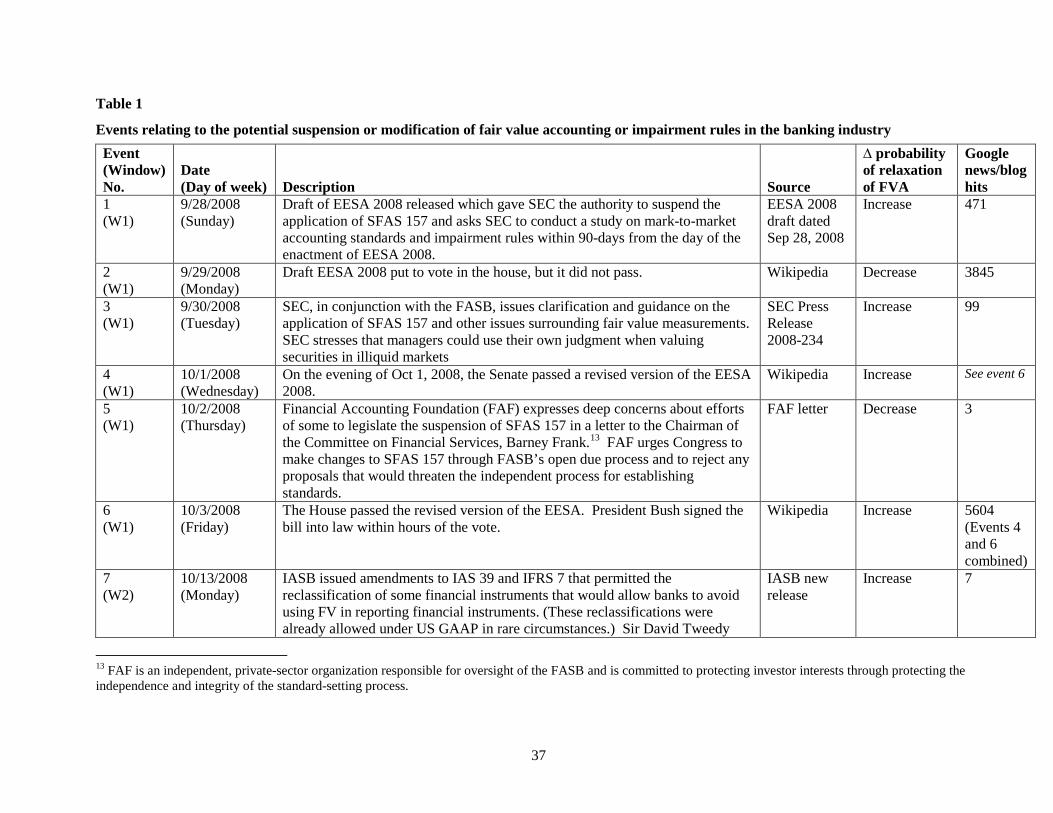
37
Table 1
Events relating to the potential suspension or modification of fair value accounting or impairment rules in the banking industry
Event (Window) No.
Date (Day of week) Description Source
∆ probability of relaxation of FVA
Google news/blog hits
1 (W1)
9/28/2008 (Sunday)
Draft of EESA 2008 released which gave SEC the authority to suspend the application of SFAS 157 and asks SEC to conduct a study on mark-to-market accounting standards and impairment rules within 90-days from the day of the enactment of EESA 2008.
EESA 2008 draft dated Sep 28, 2008
Increase 471
2 (W1)
9/29/2008 (Monday)
Draft EESA 2008 put to vote in the house, but it did not pass. Wikipedia Decrease 3845
3 (W1)
9/30/2008 (Tuesday)
SEC, in conjunction with the FASB, issues clarification and guidance on the application of SFAS 157 and other issues surrounding fair value measurements. SEC stresses that managers could use their own judgment when valuing securities in illiquid markets
SEC Press Release 2008-234
Increase 99
4 (W1)
10/1/2008 (Wednesday)
On the evening of Oct 1, 2008, the Senate passed a revised version of the EESA 2008.
Wikipedia Increase See event 6
5 (W1)
10/2/2008 (Thursday)
Financial Accounting Foundation (FAF) expresses deep concerns about efforts of some to legislate the suspension of SFAS 157 in a letter to the Chairman of the Committee on Financial Services, Barney Frank.13
FAF letter
FAF urges Congress to make changes to SFAS 157 through FASB’s open due process and to reject any proposals that would threaten the independent process for establishing standards.
Decrease 3
6 (W1)
10/3/2008 (Friday)
The House passed the revised version of the EESA. President Bush signed the bill into law within hours of the vote.
Wikipedia Increase 5604 (Events 4 and 6 combined)
7 (W2)
10/13/2008 (Monday)
IASB issued amendments to IAS 39 and IFRS 7 that permitted the reclassification of some financial instruments that would allow banks to avoid using FV in reporting financial instruments. (These reclassifications were already allowed under US GAAP in rare circumstances.) Sir David Tweedy
IASB new release
Increase 7
13 FAF is an independent, private-sector organization responsible for oversight of the FASB and is committed to protecting investor interests through protecting the independence and integrity of the standard-setting process.
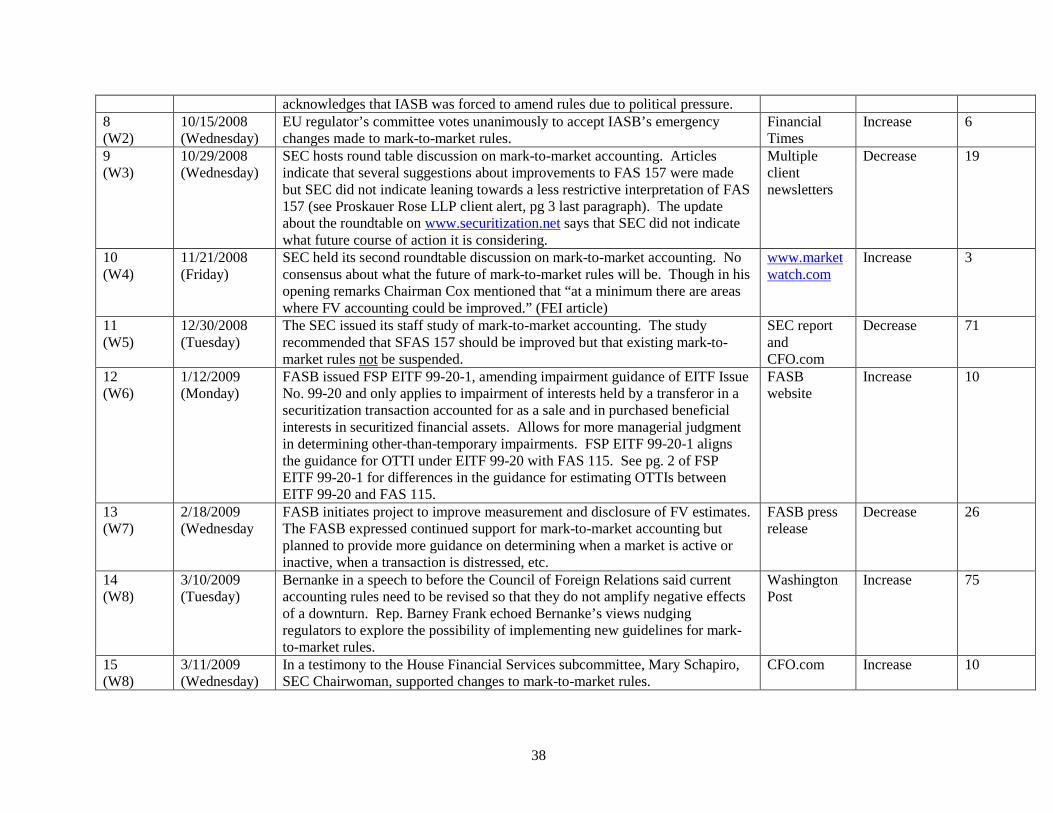
38
acknowledges that IASB was forced to amend rules due to political pressure. 8 (W2)
10/15/2008 (Wednesday)
EU regulator’s committee votes unanimously to accept IASB’s emergency changes made to mark-to-market rules.
Financial Times
Increase 6
9 (W3)
10/29/2008 (Wednesday)
SEC hosts round table discussion on mark-to-market accounting. Articles indicate that several suggestions about improvements to FAS 157 were made but SEC did not indicate leaning towards a less restrictive interpretation of FAS 157 (see Proskauer Rose LLP client alert, pg 3 last paragraph). The update about the roundtable on www.securitization.net says that SEC did not indicate what future course of action it is considering.
Multiple client newsletters
Decrease 19
10 (W4)
11/21/2008 (Friday)
SEC held its second roundtable discussion on mark-to-market accounting. No consensus about what the future of mark-to-market rules will be. Though in his opening remarks Chairman Cox mentioned that “at a minimum there are areas where FV accounting could be improved.” (FEI article)
www.marketwatch.com
Increase 3
11 (W5)
12/30/2008 (Tuesday)
The SEC issued its staff study of mark-to-market accounting. The study recommended that SFAS 157 should be improved but that existing mark-to-market rules not be suspended.
SEC report and CFO.com
Decrease 71
12 (W6)
1/12/2009 (Monday)
FASB issued FSP EITF 99-20-1, amending impairment guidance of EITF Issue No. 99-20 and only applies to impairment of interests held by a transferor in a securitization transaction accounted for as a sale and in purchased beneficial interests in securitized financial assets. Allows for more managerial judgment in determining other-than-temporary impairments. FSP EITF 99-20-1 aligns the guidance for OTTI under EITF 99-20 with FAS 115. See pg. 2 of FSP EITF 99-20-1 for differences in the guidance for estimating OTTIs between EITF 99-20 and FAS 115.
FASB website
Increase 10
13 (W7)
2/18/2009 (Wednesday
FASB initiates project to improve measurement and disclosure of FV estimates. The FASB expressed continued support for mark-to-market accounting but planned to provide more guidance on determining when a market is active or inactive, when a transaction is distressed, etc.
FASB press release
Decrease 26
14 (W8)
3/10/2009 (Tuesday)
Bernanke in a speech to before the Council of Foreign Relations said current accounting rules need to be revised so that they do not amplify negative effects of a downturn. Rep. Barney Frank echoed Bernanke’s views nudging regulators to explore the possibility of implementing new guidelines for mark-to-market rules.
Washington Post
Increase 75
15 (W8)
3/11/2009 (Wednesday)
In a testimony to the House Financial Services subcommittee, Mary Schapiro, SEC Chairwoman, supported changes to mark-to-market rules.
CFO.com Increase 10

39
16 (W8)
3/12/2009 (Thursday)
In a House Financial Services subcommittee hearing standard setters and regulators were pressed hard to alter existing fair value accounting rules immediately.
CFO.com Increase 121
17 (W9)
3/16/2009 (Monday)
FASB proposes guidance on how to determine whether an asset’s market can be considered not active, whether a transaction being used to estimate an asset’s value is distressed. FASB issues two FASB Staff Positions (FSP) giving guidance on when markets are illiquid and OTTI.
FASB press release and CFO.com
Increase 59
18 (W10)
4/1/-4/2/2009 (Wednesday-Thursday)
FASB affirms change in FV rules on April 2, 2009. FT reported that FASB is expected to approve change in FV rules on April 1, 2009. News release about the final staff positions is dated Apr 9, 2009.
Financial Times
Increase 282
Notes to Table 1: EESA = Emergency Economic Stabilization Act IASB = International Accounting Standards Board FSP EITF = FASB Staff Position Emerging Issues Task Force OTTI = other-than-temporary-impairments
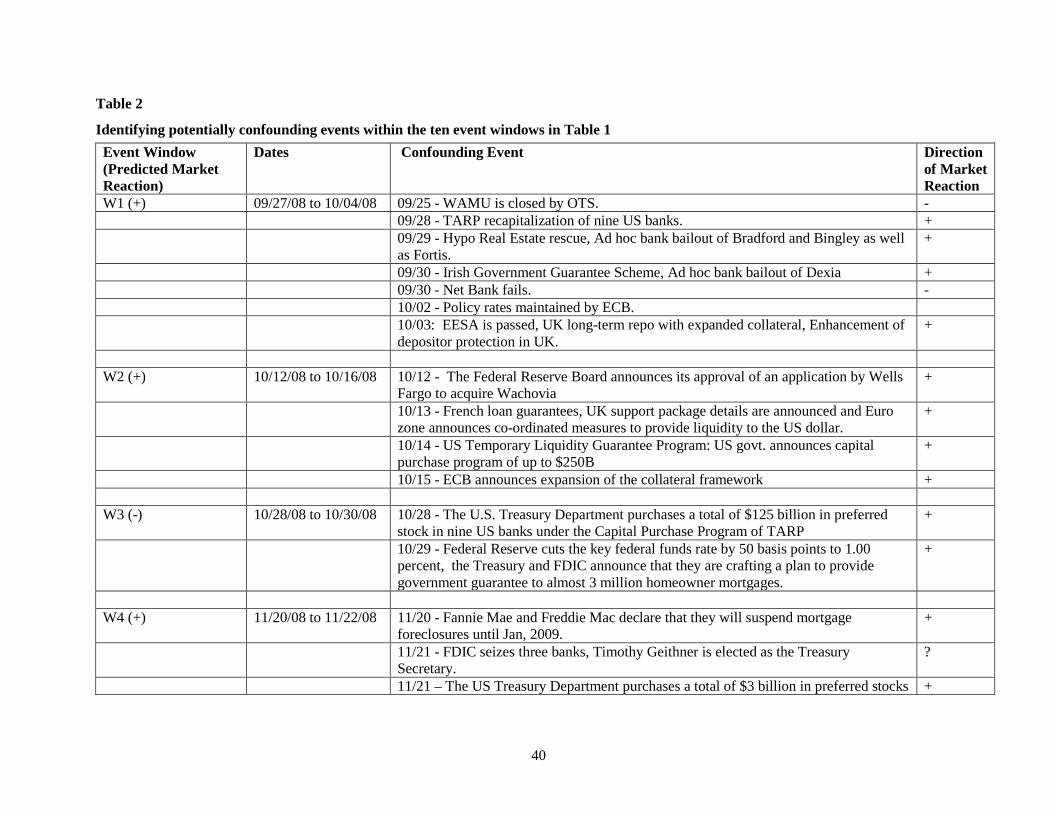
40
Table 2
Identifying potentially confounding events within the ten event windows in Table 1 Event Window (Predicted Market Reaction)
Dates Confounding Event Direction of Market Reaction
W1 (+) 09/27/08 to 10/04/08 09/25 - WAMU is closed by OTS. - 09/28 - TARP recapitalization of nine US banks. + 09/29 - Hypo Real Estate rescue, Ad hoc bank bailout of Bradford and Bingley as well
as Fortis. +
09/30 - Irish Government Guarantee Scheme, Ad hoc bank bailout of Dexia + 09/30 - Net Bank fails. - 10/02 - Policy rates maintained by ECB. 10/03: EESA is passed, UK long-term repo with expanded collateral, Enhancement of
depositor protection in UK. +
W2 (+) 10/12/08 to 10/16/08 10/12 - The Federal Reserve Board announces its approval of an application by Wells
Fargo to acquire Wachovia +
10/13 - French loan guarantees, UK support package details are announced and Euro zone announces co-ordinated measures to provide liquidity to the US dollar.
+
10/14 - US Temporary Liquidity Guarantee Program: US govt. announces capital purchase program of up to $250B
+
10/15 - ECB announces expansion of the collateral framework + W3 (-) 10/28/08 to 10/30/08 10/28 - The U.S. Treasury Department purchases a total of $125 billion in preferred
stock in nine US banks under the Capital Purchase Program of TARP +
10/29 - Federal Reserve cuts the key federal funds rate by 50 basis points to 1.00 percent, the Treasury and FDIC announce that they are crafting a plan to provide government guarantee to almost 3 million homeowner mortgages.
+
W4 (+) 11/20/08 to 11/22/08 11/20 - Fannie Mae and Freddie Mac declare that they will suspend mortgage
foreclosures until Jan, 2009. +
11/21 - FDIC seizes three banks, Timothy Geithner is elected as the Treasury Secretary.
?
11/21 – The US Treasury Department purchases a total of $3 billion in preferred stocks +
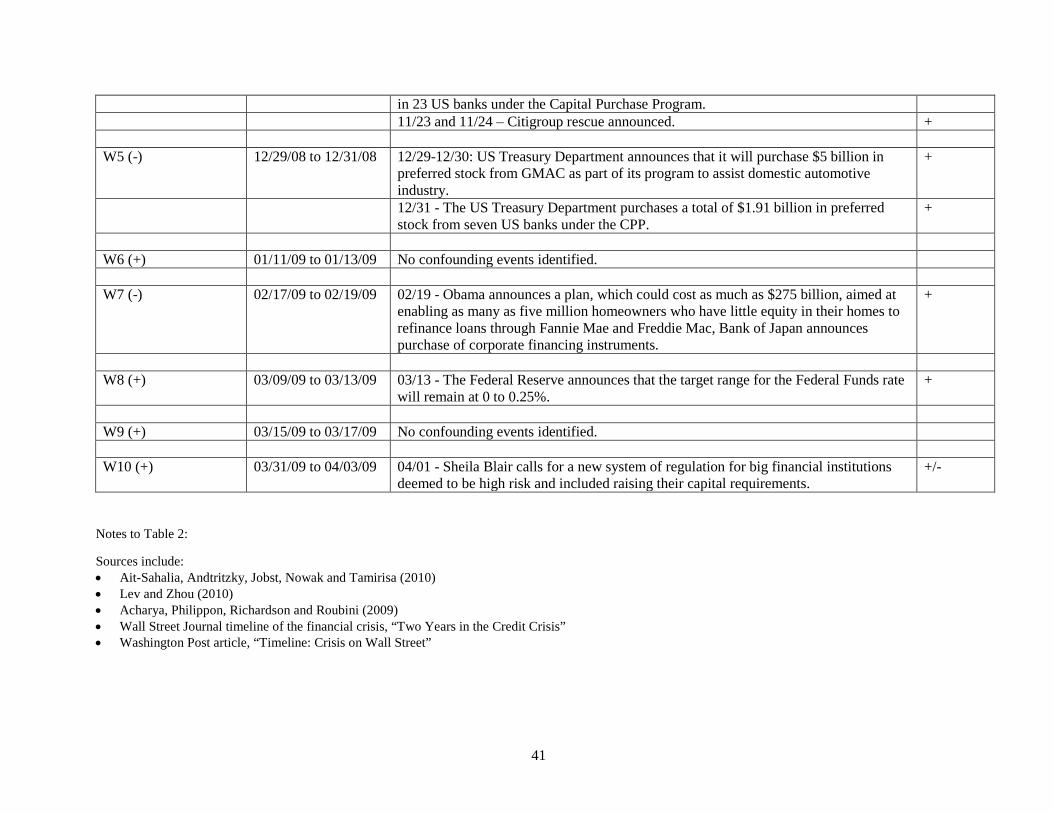
41
Notes to Table 2: Sources include: • Ait-Sahalia, Andtritzky, Jobst, Nowak and Tamirisa (2010) • Lev and Zhou (2010) • Acharya, Philippon, Richardson and Roubini (2009) • Wall Street Journal timeline of the financial crisis, “Two Years in the Credit Crisis” • Washington Post article, “Timeline: Crisis on Wall Street”
in 23 US banks under the Capital Purchase Program. 11/23 and 11/24 – Citigroup rescue announced. + W5 (-) 12/29/08 to 12/31/08 12/29-12/30: US Treasury Department announces that it will purchase $5 billion in
preferred stock from GMAC as part of its program to assist domestic automotive industry.
+
12/31 - The US Treasury Department purchases a total of $1.91 billion in preferred stock from seven US banks under the CPP.
+
W6 (+) 01/11/09 to 01/13/09 No confounding events identified. W7 (-) 02/17/09 to 02/19/09 02/19 - Obama announces a plan, which could cost as much as $275 billion, aimed at
enabling as many as five million homeowners who have little equity in their homes to refinance loans through Fannie Mae and Freddie Mac, Bank of Japan announces purchase of corporate financing instruments.
+
W8 (+) 03/09/09 to 03/13/09 03/13 - The Federal Reserve announces that the target range for the Federal Funds rate
will remain at 0 to 0.25%. +
W9 (+) 03/15/09 to 03/17/09 No confounding events identified. W10 (+) 03/31/09 to 04/03/09 04/01 - Sheila Blair calls for a new system of regulation for big financial institutions
deemed to be high risk and included raising their capital requirements. +/-
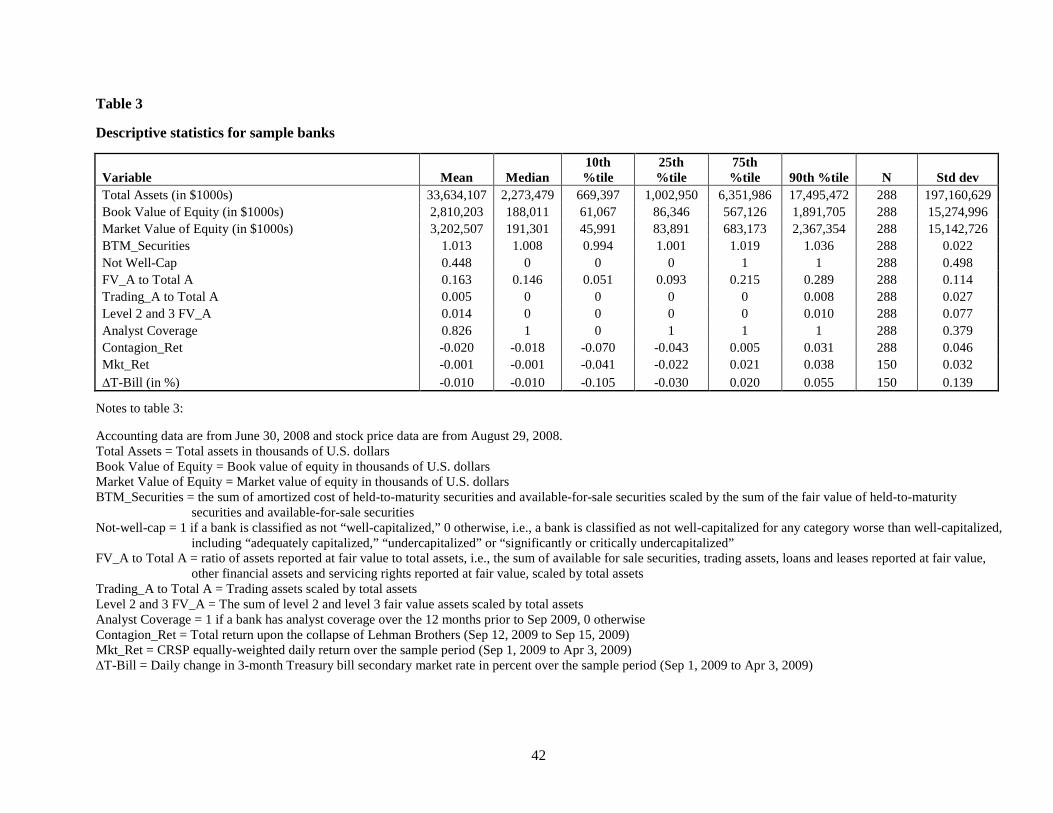
42
Table 3 Descriptive statistics for sample banks
Variable Mean Median 10th %tile
25th %tile
75th %tile 90th %tile N Std dev
Total Assets (in $1000s) 33,634,107 2,273,479 669,397 1,002,950 6,351,986 17,495,472 288 197,160,629 Book Value of Equity (in $1000s) 2,810,203 188,011 61,067 86,346 567,126 1,891,705 288 15,274,996 Market Value of Equity (in $1000s) 3,202,507 191,301 45,991 83,891 683,173 2,367,354 288 15,142,726 BTM_Securities 1.013 1.008 0.994 1.001 1.019 1.036 288 0.022 Not Well-Cap 0.448 0 0 0 1 1 288 0.498 FV_A to Total A 0.163 0.146 0.051 0.093 0.215 0.289 288 0.114 Trading_A to Total A 0.005 0 0 0 0 0.008 288 0.027 Level 2 and 3 FV_A 0.014 0 0 0 0 0.010 288 0.077 Analyst Coverage 0.826 1 0 1 1 1 288 0.379 Contagion_Ret -0.020 -0.018 -0.070 -0.043 0.005 0.031 288 0.046 Mkt_Ret -0.001 -0.001 -0.041 -0.022 0.021 0.038 150 0.032 ∆T-Bill (in %) -0.010 -0.010 -0.105 -0.030 0.020 0.055 150 0.139
Notes to table 3: Accounting data are from June 30, 2008 and stock price data are from August 29, 2008. Total Assets = Total assets in thousands of U.S. dollars Book Value of Equity = Book value of equity in thousands of U.S. dollars Market Value of Equity = Market value of equity in thousands of U.S. dollars BTM_Securities = the sum of amortized cost of held-to-maturity securities and available-for-sale securities scaled by the sum of the fair value of held-to-maturity
securities and available-for-sale securities Not-well-cap = 1 if a bank is classified as not “well-capitalized,” 0 otherwise, i.e., a bank is classified as not well-capitalized for any category worse than well-capitalized,
including “adequately capitalized,” “undercapitalized” or “significantly or critically undercapitalized” FV_A to Total A = ratio of assets reported at fair value to total assets, i.e., the sum of available for sale securities, trading assets, loans and leases reported at fair value,
other financial assets and servicing rights reported at fair value, scaled by total assets Trading_A to Total A = Trading assets scaled by total assets Level 2 and 3 FV_A = The sum of level 2 and level 3 fair value assets scaled by total assets Analyst Coverage = 1 if a bank has analyst coverage over the 12 months prior to Sep 2009, 0 otherwise Contagion_Ret = Total return upon the collapse of Lehman Brothers (Sep 12, 2009 to Sep 15, 2009) Mkt_Ret = CRSP equally-weighted daily return over the sample period (Sep 1, 2009 to Apr 3, 2009) ∆T-Bill = Daily change in 3-month Treasury bill secondary market rate in percent over the sample period (Sep 1, 2009 to Apr 3, 2009)
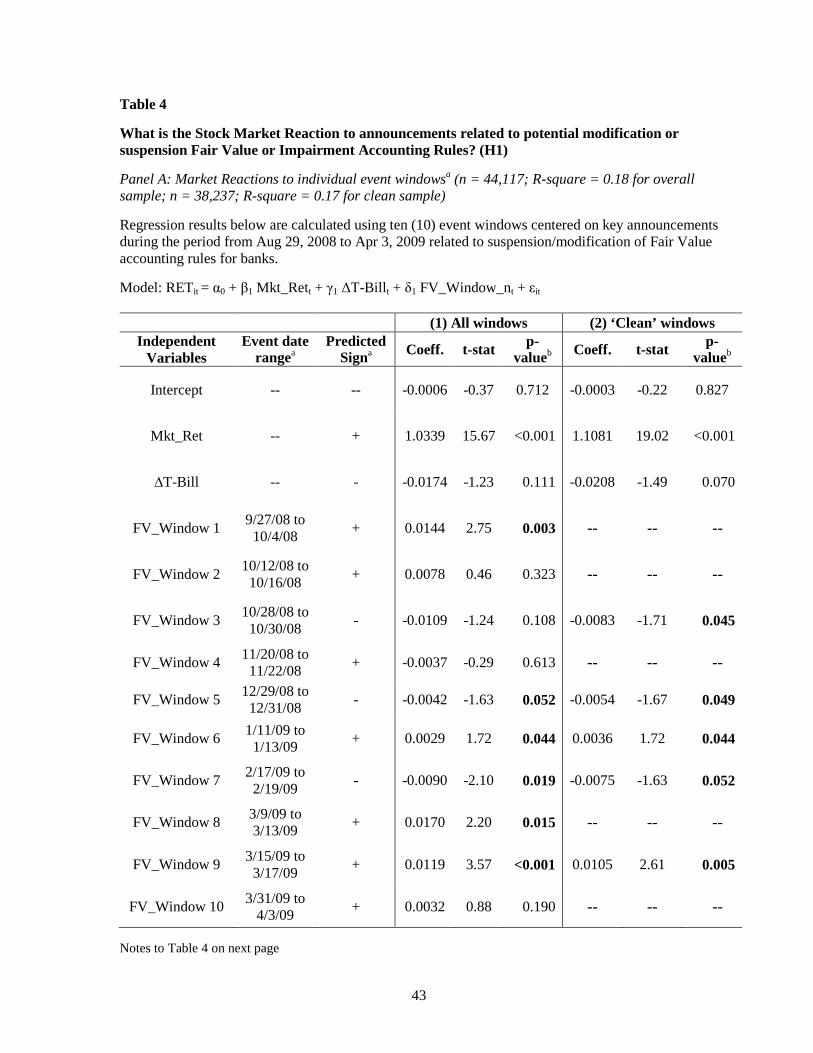
43
Table 4 What is the Stock Market Reaction to announcements related to potential modification or suspension Fair Value or Impairment Accounting Rules? (H1) Panel A: Market Reactions to individual event windowsa (n = 44,117; R-square = 0.18 for overall sample; n = 38,237; R-square = 0.17 for clean sample) Regression results below are calculated using ten (10) event windows centered on key announcements during the period from Aug 29, 2008 to Apr 3, 2009 related to suspension/modification of Fair Value accounting rules for banks. Model: RETit = α0 + β1 Mkt_Rett + γ1 ΔT-Billt + δ1 FV_Window_nt + εit
(1) All windows (2) ‘Clean’ windows Independent
Variables Event date
rangea Predicted
Signa Coeff. t-stat p-valueb Coeff. t-stat p-
valueb
Intercept -- -- -0.0006 -0.37 0.712 -0.0003 -0.22 0.827
Mkt_Ret -- + 1.0339 15.67 <0.001 1.1081 19.02 <0.001
∆T-Bill -- - -0.0174 -1.23 0.111 -0.0208 -1.49 0.070
FV_Window 1 9/27/08 to 10/4/08 + 0.0144 2.75 0.003 -- -- --
FV_Window 2 10/12/08 to 10/16/08 + 0.0078 0.46 0.323 -- -- --
FV_Window 3 10/28/08 to 10/30/08 - -0.0109 -1.24 0.108 -0.0083 -1.71 0.045
FV_Window 4 11/20/08 to 11/22/08 + -0.0037 -0.29 0.613 -- -- --
FV_Window 5 12/29/08 to 12/31/08 - -0.0042 -1.63 0.052 -0.0054 -1.67 0.049
FV_Window 6 1/11/09 to 1/13/09 + 0.0029 1.72 0.044 0.0036 1.72 0.044
FV_Window 7 2/17/09 to 2/19/09 - -0.0090 -2.10 0.019 -0.0075 -1.63 0.052
FV_Window 8 3/9/09 to 3/13/09 + 0.0170 2.20 0.015 -- -- --
FV_Window 9 3/15/09 to 3/17/09 + 0.0119 3.57 <0.001 0.0105 2.61 0.005
FV_Window 10 3/31/09 to 4/3/09 + 0.0032 0.88 0.190 -- -- --
Notes to Table 4 on next page
44
Table 4 (continued) What is the Stock Market Reaction to announcements related to potential modification or suspension Fair Value or Impairment Accounting Rules? (H1) Panel B: Overall Market Reaction after combining individual event windowsa into a single signed event window (n = 44,117; R-square = 0.17 for overall sample; n = 38,237; R-square = 0.17 for clean sample) Regression results below are calculated after combining the individual windows in Panel A centered on key announcements during the period from Aug 29, 2008 to April 3, 2009 related to suspension/modification of Fair Value accounting rules for banks. Events with a predicted negative sign are multiplied by -1 to produce a consistent positive-signed combined event. Model: RETit = α0 + β1 Mkt_Rett + γ1 ΔT-Billt + δ1 FV_Events_Combined t + εit
(1) All windows (2) ‘Clean’ windows
Independent Variables
Event date
rangea Predicted
Signa Coeff. t-statb
p-valuec Coeff. t-statb p-
valuec
Intercept -- -- -0.0005 -0.35 0.731 -0.0004 -0.30 0.762
Mkt_Ret -- + 1.0376 16.30 <0.001 1.1031 20.30 <0.001
∆T-Bill -- - -0.0178 -1.31 0.096 -0.0196 -1.44 0.075
FV_Events_ Combined
8/29/08 to 4/3/09 + 0.0089 3.13 0.001 0.0083 3.41 <0.001
Notes to Table 4: a Individual events and event windows are described in Table 2. Event dates ending on a weekend day are truncated to the subsequent day if it is the first date in the range or to the prior day if it is the last date in the range. b t-statistics are clustered by date to control for cross-sectional correlation. c P-values are one-sided for variables with directional predictions, two-sided otherwise. Coefficients on treatment variables that are significant at less than the 10% level are shown in bold. We report (1 - (p/2)) values for coefficients that assume a sign opposite to the one predicted. Definition of variables: RETi,e = cumulative raw return for bank ‘i’ on the range of dates specified for event ‘e,’ e.g., for event 1, the
cumulative raw return for bank ‘i’ for the period 9/28/08 through 10/3/08 is RETi,1. Mkt_Ret = equally weighted return from CRSP, a portfolio of all publicly held U.S. stocks. ∆T-Bill = change in the daily 3-month U.S. Treasury-bill secondary market rate. Source is Federal Reserve of
St. Louis. FV_Window_n = an indicator variable that equals 1 (-1) during each event window assumed to increase
(decrease) the probability of suspension/modification of FVA or impairment rules, 0 otherwise. Event window days are specified in table 2.
FV_Events_Combined = an indicator variable that equals 1 (-1) for all combined event window days assumed to increase (decrease) the probability of suspension/modification of FVA or impairment rules, 0 otherwise.
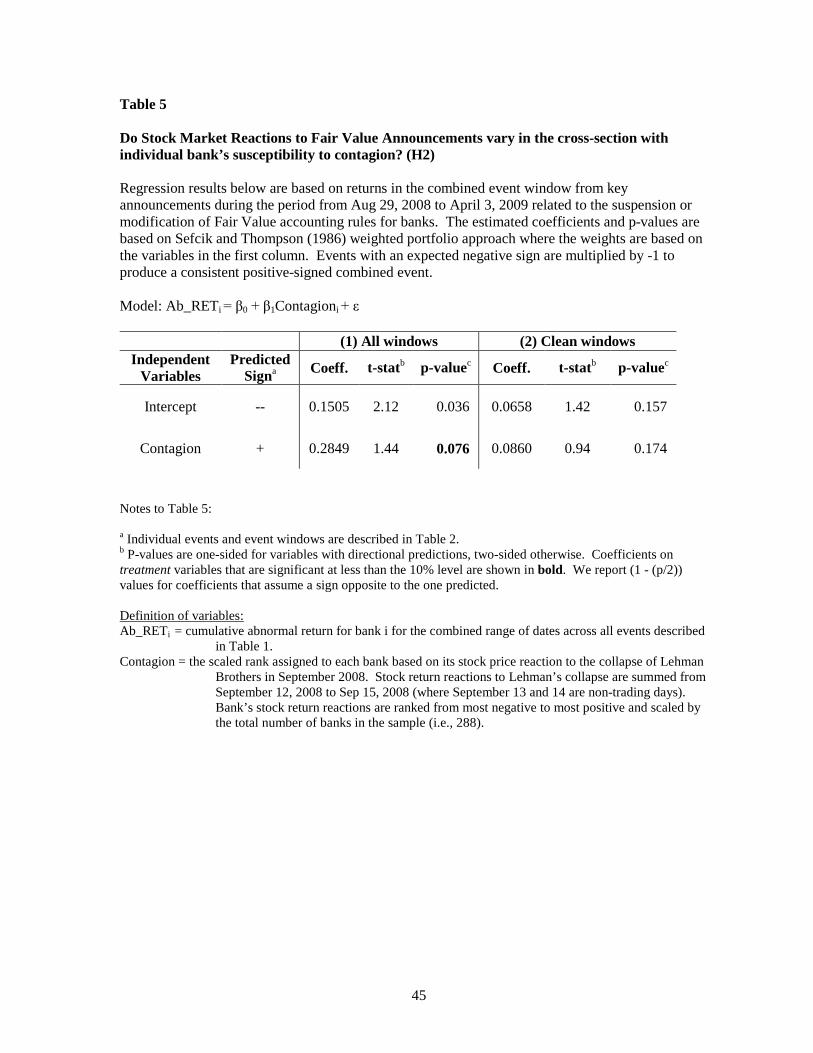
45
Table 5 Do Stock Market Reactions to Fair Value Announcements vary in the cross-section with individual bank’s susceptibility to contagion? (H2) Regression results below are based on returns in the combined event window from key announcements during the period from Aug 29, 2008 to April 3, 2009 related to the suspension or modification of Fair Value accounting rules for banks. The estimated coefficients and p-values are based on Sefcik and Thompson (1986) weighted portfolio approach where the weights are based on the variables in the first column. Events with an expected negative sign are multiplied by -1 to produce a consistent positive-signed combined event. Model: Ab_RETi = β0 + β1Contagioni + ε
(1) All windows (2) Clean windows Independent
Variables Predicted
Signa Coeff. t-statb p-valuec Coeff. t-statb p-valuec
Intercept -- 0.1505 2.12 0.036 0.0658 1.42 0.157
Contagion + 0.2849 1.44 0.076 0.0860 0.94 0.174
Notes to Table 5: a Individual events and event windows are described in Table 2. b P-values are one-sided for variables with directional predictions, two-sided otherwise. Coefficients on treatment variables that are significant at less than the 10% level are shown in bold. We report (1 - (p/2)) values for coefficients that assume a sign opposite to the one predicted. Definition of variables: Ab_RETi = cumulative abnormal return for bank i for the combined range of dates across all events described
in Table 1. Contagion = the scaled rank assigned to each bank based on its stock price reaction to the collapse of Lehman
Brothers in September 2008. Stock return reactions to Lehman’s collapse are summed from September 12, 2008 to Sep 15, 2008 (where September 13 and 14 are non-trading days). Bank’s stock return reactions are ranked from most negative to most positive and scaled by the total number of banks in the sample (i.e., 288).
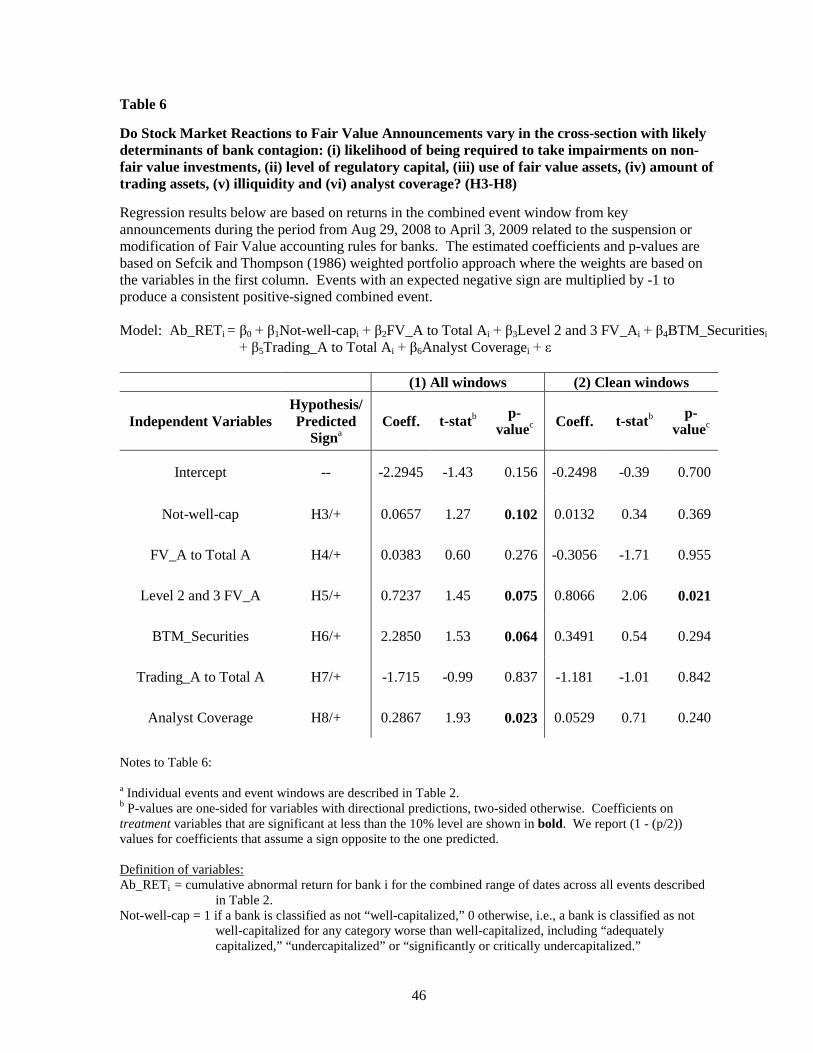
46
Table 6 Do Stock Market Reactions to Fair Value Announcements vary in the cross-section with likely determinants of bank contagion: (i) likelihood of being required to take impairments on non-fair value investments, (ii) level of regulatory capital, (iii) use of fair value assets, (iv) amount of trading assets, (v) illiquidity and (vi) analyst coverage? (H3-H8) Regression results below are based on returns in the combined event window from key announcements during the period from Aug 29, 2008 to April 3, 2009 related to the suspension or modification of Fair Value accounting rules for banks. The estimated coefficients and p-values are based on Sefcik and Thompson (1986) weighted portfolio approach where the weights are based on the variables in the first column. Events with an expected negative sign are multiplied by -1 to produce a consistent positive-signed combined event. Model: Ab_RETi = β0 + β1Not-well-capi + β2FV_A to Total Ai + β3Level 2 and 3 FV_Ai + β4BTM_Securitiesi
+ β5Trading_A to Total Ai + β6Analyst Coveragei + ε
(1) All windows (2) Clean windows
Independent Variables Hypothesis/Predicted
Signa Coeff. t-statb p-
valuec Coeff. t-statb p-valuec
Intercept -- -2.2945 -1.43 0.156 -0.2498 -0.39 0.700
Not-well-cap H3/+ 0.0657 1.27 0.102 0.0132 0.34 0.369
FV_A to Total A H4/+ 0.0383 0.60 0.276 -0.3056 -1.71 0.955
Level 2 and 3 FV_A H5/+ 0.7237 1.45 0.075 0.8066 2.06 0.021
BTM_Securities H6/+ 2.2850 1.53 0.064 0.3491 0.54 0.294
Trading_A to Total A H7/+ -1.715 -0.99 0.837 -1.181 -1.01 0.842
Analyst Coverage H8/+ 0.2867 1.93 0.023 0.0529 0.71 0.240
Notes to Table 6: a Individual events and event windows are described in Table 2. b P-values are one-sided for variables with directional predictions, two-sided otherwise. Coefficients on treatment variables that are significant at less than the 10% level are shown in bold. We report (1 - (p/2)) values for coefficients that assume a sign opposite to the one predicted. Definition of variables: Ab_RETi = cumulative abnormal return for bank i for the combined range of dates across all events described
in Table 2. Not-well-cap = 1 if a bank is classified as not “well-capitalized,” 0 otherwise, i.e., a bank is classified as not
well-capitalized for any category worse than well-capitalized, including “adequately capitalized,” “undercapitalized” or “significantly or critically undercapitalized.”

47
FV_A to Total A = ratio of assets reported at fair value to total assets, i.e., the sum of available for sale securities, trading assets, loans and leases reported at fair value, other financial assets and servicing rights reported at fair value, scaled by total assets.
Level 2 and 3 FV_A = The sum of level 2 and level 3 fair value assets scaled by total assets. BTM_Securities = the sum of amortized cost of held-to-maturity securities and available-for-sale securities
scaled by the sum of the fair value of held-to-maturity securities and available-for-sale securities.
Trading_A to Total A = Trading assets scaled by total assets. Analyst Coverage = 1 if a bank has analyst coverage over the 12 months prior to Sep 2009, 0 otherwise.