do changes in dividend policy signal the future …repository.um.edu.my/830/1/do changes in dividend...
TRANSCRIPT
DO CHANGES IN DIVIDEND POLICY SIGNAL THE FUTURE OR THE PAST?
LIM WEI LING
FACULTY OF BUSINESS AND ACCOUNTANCY UNIVERSITY OF MALAYA
NOVEMBER 2008
Do Changes in Dividend Policy Signal the Future or the Past?
Lim Wei Ling
Bachelor of Business Administration Universiti Kebangsaan Malaysia
2001
Submitted to the Graduate School of Business Faculty of Business and Accountancy
University of Malaya, in partial fulfilment of the requirements for the Degree of Master of Business Administration
November 2008
ii
ABSTRACT
This research study investigates whether Malaysian Main Board companies pursue
changes in dividends to convey information on the future profitability of the
companies by studying on a total of 2,679 firm-year observations from year 1998 to
2007. The Ordinary Least Square regression results show that Main Board listed
companies do not use dividends as a signalling tool to convey information on the
future prospect of the companies. In fact, positive and significant relationship is found
to be stronger between changes in dividends in year T=0 with concurrent changes in
earnings in year T=0, which is consistent with the previous findings by Benartzi,
Michaely and Thaler (1997) and Nissim and Ziv (2001). Further, regression analysis
on sub-samples of firm-year observations categorized by the period of stable
dividends before the dividend change events (2 years, 3 years and 4 years) shows no
relationship exists between the stability of dividends before dividend change events
with the extent of dividend signalling. No relationship is found between size of
dividend change, size of dividend yield with the extent of dividend signalling.
Multiple regression by incorporating industry dummies in the regression equation
shows that no difference in changes in earnings between the 3 major sectors
(Industrial, Trading/Service and Consumer) when there are changes in dividends,
indicating that industry effect does not have any influence on the extent of dividend
signalling of the companies.

iii
ACKNOWLEDGEMENTS
I would like to express my gratitude to my supervisor of my research project,
Ybhg. Professor Dato' Dr. Mansor for his patience, support and guidance given on my
research area on dividend signalling. Despite the difficulties encountered in my
research due to meticulous works involved and constraints in getting complete
financial database needed in this study, I am glad to be able to complete my research
on time under the intellectual guidance and share of research experiences by Professor
Dato’ Dr. Mansor.
Million of thanks to my beloved family for their unconditional supports and
understanding despite of my less time with them due to my busy schedule for both
work and research project. Appreciation is also dedicated to my superior and
colleagues at work for their support and understanding during my entire MBA course
period.
Special thanks to Mr CG Teh, Mr KL Ooi and Ms Shirley Lo who have
provided their professional insights on dividend signalling in Malaysia. Being top
management involved in the dividend decision of three Main Board listed companies,
their feedbacks are really useful in explaining the reasons of dividend signalling not
applicable in Malaysia.
Last but not least, I would also like to express my appreciation to my fellow
MBA coursemates who have accompanied me for the whole MBA course with joy
and unforgettable memories. Special thanks to Mr Cheong Kok Loong who has
provided his assistance and support to me during my journey of completing this
research study.
iv
TABLE OF CONTENTS ABSTRACT……………………………………………………………………. ii ACKNOWLEDGEMENTS…………………………………………………… iii LIST OF SYMBOLS AND ABBREVIATIONS…………………………….. viii CHAPTER 1: INTRODUCTION……………………………………………………………... 1 1.1 PURPOSE AND SIGNIFICANCE OF THE STUDY…………………. 1 1.2 OBJECTIVE AND SCOPE OF THE STUDY…………………………. 2 1.3 LIMITATION OF THE STUDY ………………………………………. 4 1.4 ORGANISATION OF THE STUDY…………………………………... 5 CHAPTER 2: LITERATURE REVIEW…………………………………….. 6 2.1 WHAT IS DIVIDEND POLICY……………………………………….. 6 2.2 THE DIVIDEND SIGNALLING THEORY…………………………… 12
2.2.1 Previous literatures that support earnings and past dividends determine current dividends…………………………………… 15
2.2.2 Previous literatures that support changes in dividends do not provide signals to the market…………………………………… 17
2.2.3 Previous literatures that support changes in dividends provide signals to the market…………………………………………… 20
CHAPTER 3: RESEARCH METHODOLOGY……………………………. 23 3.1 DEVELOPMENT OF THE HYPOTHESES…………………………… 23 3.2 SELECTIONS OF MEASURES……………………………………….. 27
3.2.1 Measure of unexpected earnings………………………………... 28 3.2.2 Measure of changes in dividends……………………………….. 29
3.3 SAMPLING DESIGN…………………………………………………... 30 3.4 DATA COLLECTION PROCEDURE…………………………………. 31 3.5 DATA ANALYSIS TECHNIQUES……………………………………. 32
3.5.1 Data Filtering…………………………………………………… 32 3.5.2 Assumptions adopted in the regression analysis……………… 33 3.5.3 Analysis on the relationship between changes in dividends in
year 0 with changes in earnings in the concurrent year and subsequent 5 years ……………………………………………... 34
3.5.4 Analysis on the extent of dividend signalling with the influence of industry effect using multiple regression…………………….. 36
CHAPTER 4: RESEARCH RESULTS……………………………………… 37 4.1 SUMMARY STATISTICS……………………………………………... 37
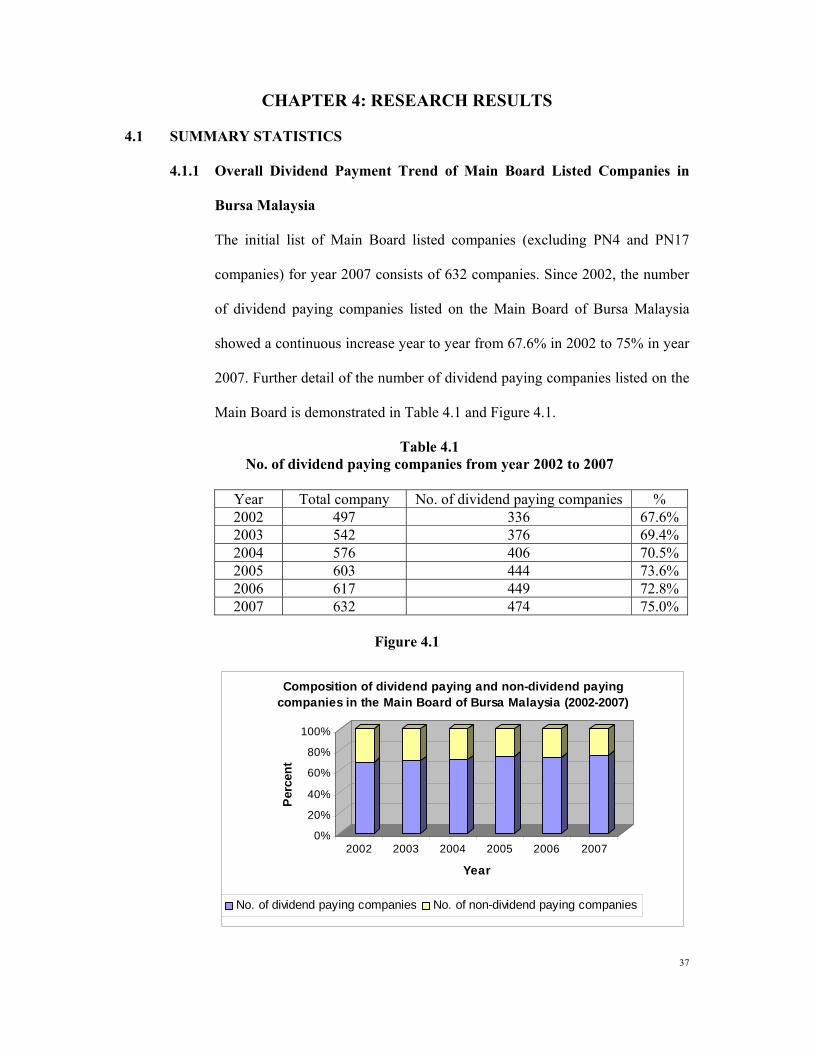
4.1.1 Overall Dividend Payment Trend of Main Board Listed Companies in Bursa Malaysia…………………………………... 39
4.1.2 Descriptive summary on the selected samples………………….. 53 4.2 ANALYSIS OF MEASURES………………………………………….. 62
4.2.1 Analysis of Regression Result on All Firm-Year Observations... 66 4.2.2 Analysis of Regression Result on Each Individual Year
Observations From Year 1998 to 2007…………………………. 70 4.2.3 Analysis of Regression Result on Dividend Change Events
During the Financial Crisis Period (1998-2001) and Post-Financial Crisis Period (2002-2007)……………………………. 81
4.2.4 Analysis of Regression Result on Dividend Change Events Occurred After Stable DPS for Consecutive 2 years, 3 years and 4 years…………………………………………………………... 85
v
4.2.5 Analysis of Regression Result on the Dividend Change Events Categorized by Size of Dividend Change……………………… 88
4.2.6 Analysis of Regression Result on Dividend Change Events Categorized by Size of Dividend Yield………………………… 89
4.2.7 Analysis of Regression Result on All Firm-Year Observations by Incorporating Industry Effect……………………………….. 91
4.3 SUMMARY OF RESEARCH RESULTS……………………………… 97 CHAPTER 5: CONCLUSIONS AND RECOMMENDATIONS…………... 109 5.1 CONCLUSION…………………………………………………………. 109 5.2 SUGGESTIONS FOR FUTURE RESEARCH ………………………... 117 REFERENCES………………………………………………………………… 119 APPENDICES
vi
LIST OF FIGURES Figure 4.1
Composition of dividend paying and non-dividend paying companies in the Main Board of Bursa Malaysia (2002-2007)…… 37
Figure 4.2
Dividend paying companies in the Main Board of Bursa Malaysia (by sector), 2002-2007…………………………………………….. 40
Figure 4.3 Type of dividend changes for dividend paying companies (2002-2007)……………………………………………………………….. 41
Figure 4.4 Average DPS of Main Board Companies, categorized by sector (2002-2007)………………………………………………………... 45
Figure 4.5 Average DPR of listed companies between 1981-2007…………… 49 Figure 4.6
Average Dividend Payout Ratio of Main Board Companies categorized by sector (2002-2007)………………………………… 50
Figure 4.7 Average Dividend Yield (%): 1981-2007…………………………. 52 Figure 4.8
Average Dividend Yield of Main Board Companies categorized by sector (2002-2007)………………………………………………… 53
Figure 4.9 DPS, EPS and DPR of Construction Sector (1998-2007)…………. 55 Figure 4.10 DPS, EPS and DPR of Consumer Sector (1998-2007)……………. 56 Figure 4.11 DPS, EPS and DPR of Industrial Sector (1998-2007)…………….. 57 Figure 4.12 DPS, EPS and DPR of Plantation Sector (1998-2007)……………. 58 Figure 4.13 DPS, EPS and DPR of Properties Sector (1998-2007)……………. 59 Figure 4.14 DPS, EPS and DPR of Technology Sector (1998-2007)………….. 60 Figure 4.15 DPS, EPS and DPR of Trading / Services Sector (1998-2007)…… 61
LIST OF TABLES Table 3.1 List of Regression Analysis………………………………………... 35 Table 4.1 No. of dividend paying companies from year 2002 to 2007………. 37 Table 4.2 Percentage of dividend paying companies by sector (Year 2002-
2007)……………………………………………………………….. 39 Table 4.3 Type of dividend changes for dividend paying companies (2002-
2007)……………………………………………………………….. 41 Table 4.4 No. of sample companies by sector (1998 to 2007)……………….. 54 Table 4.5
Regression result on dividend change events for all firm-year observations (1998-2007)………………………………………….. 68
Table 4.6
Regression result on dividend increase events for all firm-year observations (1998-2007)………………………………………….. 69
Table 4.7
Regression result on dividend decrease events for all firm-year observations (1998-2007)…………………………………………. 69
Table 4.8 Regression result on all firm-year observations, categorized by type of dividend change (1998)……………………………………. 71
Table 4.9 Regression result on all firm-year observations, categorized by type of dividend change (1999)……………………………………. 72
Table 4.10 Regression result on all firm-year observations, categorized by type of dividend change (2000)……………………………………. 73
Table 4.11 Regression result on all firm-year observations, categorized by type of dividend change (2001)……………………………………. 74
Table 4.12 Regression result on all firm-year observations, categorized by type of dividend change (2002)……………………………………. 75
vii
Table 4.13 Regression result on all firm-year observations, categorized by type of dividend change (2003)……………………………………. 76
Table 4.14 Regression result on all firm-year observations, categorized by type of dividend change (2004)……………………………………. 77
Table 4.15 Regression result on all firm-year observations, categorized by type of dividend change (2005)……………………………………. 78
Table 4.16 Regression result on all firm-year observations, categorized by type of dividend change (2006)……………………………………. 79
Table 4.17 Regression result on all firm-year observations, categorized by type of dividend change (2007)……………………………………. 80
Table 4.18 Regression result on all firm-year observations categorized by type of dividend change during the financial crisis period (1998-2001).. 83
Table 4.19 Regression result on all firm-year observations categorized by type of dividend change during the post- financial crisis period (2002-2007)……………………………………………………………….. 84
Table 4.20 Regression result on dividend change events that occurred after stable dividends for 2 years, 3 years and 4 years………………….. 87
Table 4.21 Regression result on dividend increase events that occurred after stable dividends for 2 years, 3 years and 4 years………………….. 87
Table 4.22 Regression result on dividend decrease events that occurred after stable dividends for 2 years, 3 years and 4 years………………….. 87
Table 4.23
Summary on the regression result for dividend change events categorized by different sizes of dividend change………………… 88
Table 4.24 Summary on the regression result for dividend change events categorised by different sizes of dividend yield…………………… 90
Table 4.25 Multiple regression on all firm-year observations controlled by industry effect: Industrial sector as base………………………….. 93
Table 4.26 Multiple regression on all firm-year observations controlled by industry effect: Trading / Services sector as base………………… 93
Table 4.27 Multiple regression on all firm-year observations controlled by industry effect: Consumer sector as base………………………….. 94
Table 4.28 Multiple regression on dividend increase and dividend decrease sub-samples controlled by industry effect: Industrial sector as base 96
Table 4.29 Multiple regression on dividend increase and dividend decrease sub-samples controlled by industry effect: Trading / Services sector as base………………………………………………………. 96
Table 4.30 Multiple regression on dividend increase and dividend decrease sub-samples controlled by industry effect: Consumer sector as base………………………………………………………………… 97
Table 4.31 Regression result for all firm-year observations from year 1998 to 2007………………………………………………………………... 97
Table 4.32 Regression result for all dividend increase observations from year 1998 to 2007……………………………………………………….. 99
Table 4.33 Regression result for all dividend decrease observations from year 1998 to 2007……………………………………………………….. 100
Table 4.34 Multiple regression result for industry dummies………………….. 101
viii
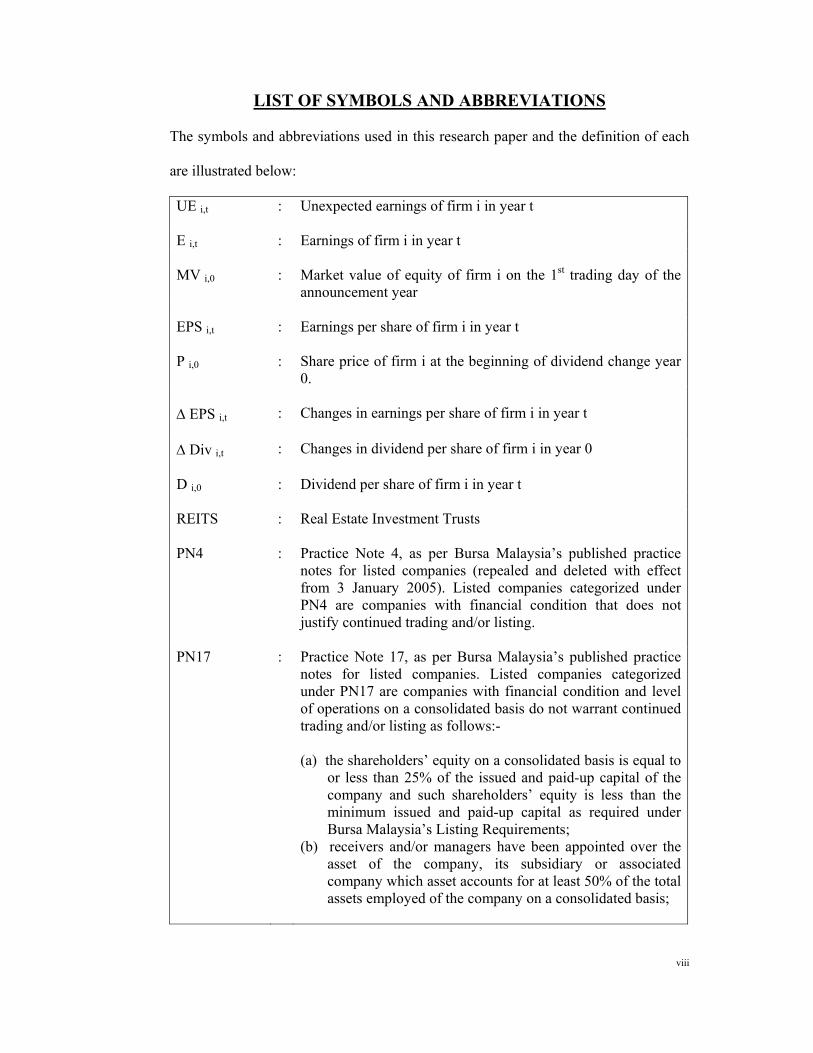
LIST OF SYMBOLS AND ABBREVIATIONS The symbols and abbreviations used in this research paper and the definition of each
are illustrated below:
UE i,t : Unexpected earnings of firm i in year t E i,t : Earnings of firm i in year t MV i,0 : Market value of equity of firm i on the 1st trading day of the
announcement year EPS i,t : Earnings per share of firm i in year t P i,0 : Share price of firm i at the beginning of dividend change year
0. ∆ EPS i,t : Changes in earnings per share of firm i in year t ∆ Div i,t : Changes in dividend per share of firm i in year 0 D i,0 : Dividend per share of firm i in year t REITS : Real Estate Investment Trusts PN4 : Practice Note 4, as per Bursa Malaysia’s published practice
notes for listed companies (repealed and deleted with effect from 3 January 2005). Listed companies categorized under PN4 are companies with financial condition that does not justify continued trading and/or listing.
PN17 : Practice Note 17, as per Bursa Malaysia’s published practice notes for listed companies. Listed companies categorized under PN17 are companies with financial condition and level of operations on a consolidated basis do not warrant continued trading and/or listing as follows:- (a) the shareholders’ equity on a consolidated basis is equal to
or less than 25% of the issued and paid-up capital of the company and such shareholders’ equity is less than the minimum issued and paid-up capital as required under Bursa Malaysia’s Listing Requirements;
(b) receivers and/or managers have been appointed over the asset of the company, its subsidiary or associated company which asset accounts for at least 50% of the total assets employed of the company on a consolidated basis;
ix
(c) a winding up of the company’s subsidiary or associated company which accounts for at least 50% of the total assets employed of the company on a consolidated basis;
(d) the auditors have expressed an adverse or disclaimer opinion in the company’s latest audited accounts;
(e) the auditors have expressed a modified opinion with emphasis on the company’s going concern in the company’s latest audited accounts and the shareholders’ equity on a consolidated basis is equal to or less than 50% of the issued and paid-up capital of the company;
(f) a default in payment by the company, its major subsidiary or major associated company and the company is unable to provide a solvency declaration to Bursa Malaysia.
(g) the company has suspended or ceased:- (i) all of its business or its major business; or (ii) its entire or major operations, for reasons of:- (aa) the cancellation, loss or non-renewal of a licence,
concession or other rights necessary to conduct its business activities;
(bb) the disposal of the company's business or major business; or
(cc) a court order or judgment obtained against the company prohibiting the company from conducting its major operations on grounds of infringement of copyright of products etc; or
(h) the company has an insignificant business or operations IPC : Infrastructure Project Companies α0 : Constant term in the regression equation, represents the
intercept of the regression line on axis Y (dependent variables) when the value of X (independent variable) is equal to zero
α1, α2, α3…. and any other subsequent alpha values
: Beta coefficient for the independent variable and any other subsequent independent variables in the regression equation, measured on the effect of changes in independent variables on the dependent variables
∈T : Error term in the regression DPS : Dividend per share EPS : Earnings per share DPR : Dividend payout ratio which shows how much dividend is
payout from every Ringgit Malaysia of EPS. The formula for dividend payout ratio is DPS / EPS

x
DY : Dividend yield which measures how much cash flow an investor can get for each Ringgit Malaysia invested in the share of a company. The formula for dividend yield is DPS / Price per share.
1
CHAPTER 1: INTRODUCTION
1.1 PURPOSE AND SIGNIFICANCE OF THE STUDY
Dividend policy has become one of the major areas of research amongst the finance
scholars since 1950s. It is obvious from the research results of these scholars that
dividend decision is the most elusive and controversial in financial decision making,
hence remained unsolved with puzzles (Black, 1976). The dividend decision of a
company involves retaining a proportion of net earnings for investment needs in the
future while distributing the rest as dividend to shareholders. A good dividend policy
not only attracts investors and facilitates fund raising from the stock market; it also
caters for the future investment needs of the company. The association between
dividend decision, earnings and future investment needs therefore makes dividend
announcement a source of information to the investors in accessing the future
prospects of a company. In other words, dividend “signals” information to investors.
Majority of the studies on dividend signalling of corporations in developed markets
e.g. United States and Europe concluded with mixed results with some level of
controversial in the theory of dividend signalling. Researchers who support the theory
of dividend signalling claimed that the signalling effect from dividend announcements
help to overcome informational asymmetries between the management of a company
and investors who are less informed about the financial prospects of the company.
Investors may view an increase in dividend payout as a signal that the company has
sufficient future cash flows to meet its debt and dividend payment in the future. Such
positive signal will stimulate positive reaction from investors and further cause an
increase in the share price. (Handjinicolaou and Kalay, 1984). However, there are

2
also findings that showed dividend signalling does not exist, especially in an efficient
market.
The research findings in the developed market may not applicable in Malaysia in view
of different firm characteristics such as ownership structure (Mancinelli and Ozkan,
2006), investment decision of firms (Fama, 1974) as well as the industry and market
`characteristics differentiated by industry classification (Baker, 1998). Therefore, this
research study is to examine whether Malaysian Main Board listed companies use
dividend changes to signal their future financial prospects, i.e. earnings of the
companies to the investors.
1.2 OBJECTIVE AND SCOPE OF THE STUDY
The objective of this research is to test whether dividend signalling applies in
Malaysia, given the fact that most previous studies on dividend signalling were
conducted in developed countries. Given the mixed results on dividend signalling in
developed countries, the study on dividend signalling in the context of Malaysia is
interesting due to different market structure, legal enforcement and ownership
structure in the Malaysian stock market. Hence, the objectives of this study are
generally as follows:-
(1) To study whether Main Board companies in Bursa Malaysia use changes in
dividend to convey earnings prospect of the companies
(2) To examine the effect of dividend signalling in the subsequent 5 years
following the changes in dividend, should dividend signalling is proven to
exist amongst the Main Board companies in Bursa Malaysia. In other words,
3
the research will examine whether the signalling effect becomes stronger
(weaker) in subsequent years following the dividend change events.
(3) To examine whether the dividend signalling effect becomes stronger when
companies change their dividend policy after some period of stable dividend.
(4) The scope of study is further extended to examine whether the larger the
change in dividend, the stronger the signalling effect based on the behavioural
norms of investors who are more concerned with larger changes as compared
with smaller and insignificant changes in dividends,
(5) To examine the clientele effect by creating the linkage between dividend yield
and dividend signalling. Companies with higher dividend yield will place
more emphasis on dividend in their share valuations as compared with
companies with low dividend yield.
(6) To examine the “industry effect” or “peer group effect” in dividend signalling
hypothesis. Under such industry or peer group effect, a firm will adjust their
dividend decisions “to conform with the industry dividend practices” (Baker
and Powell, 2000; Baker, Veit, and Powell, 2001).
This scope of this research paper is generally to examine whether managers use
changes in dividends to signal future prospects to the investing public i.e. increase
(decrease) in earnings in the subsequent years following changes in dividends to the
investing public. The relationship between changes dividends and changes earnings is
tested by focusing the relationship between dividend changes in year 0 with future
earnings changes in the concurrent (year 0) and subsequent 5 years following the
dividend changes (year 1 to year 5) of the companies listed on the Main Board of
Bursa Malaysia.

4
1.3 LIMITATION OF THE STUDY In studying the information content of dividend, changes in future earnings (following
changes in dividends), in some extent may take into account the effect of changes in
earnings in the current year. In Malaysian stock market, the announcements of
dividends and earnings are make simultaneously via the release of annual reports to
the public investors. As highlighted by Aharory and Swary (1980), the major
difficulty in studying the information content of dividend is the synchronization of
dividend and earnings announcement.
The study may not cover adequate width of studies, i.e. the size and pool of the
sample is smaller and may not sufficient for the testing of dividend signalling
hypothesis as compared with the previous studies conducted in more established stock
exchange. The smaller sample with fewer number of dividend paying companies in
each sector is due to the fact that Malaysian stock market is considered as a
developing stock market with smaller number of listed companies. Furthermore, the
number of Main Board listed companies is further eliminate in the filtering process as
(1) some companies did not pay dividends consistently throughout the years; and (2)
companies with incomplete financial information on dividends and earnings are
further eliminated from the study.
The Ordinary Least Square Regression (OLS Regression) adopted in this study has its
limitations in terms of the violation of a host of auxiliary assumptions. For instance,
the error terms in the regression equation might be (1) correlated and may not concern
the effect of outliers or (2) obtained poorly behaved error terms on estimates.
Moreover, the outcome of the OLS Regression might be skewed i.e. when the
5
unexpected earnings distribution has “fat-tails” and is heavily right skewed, the
estimates generated by the OLS Regression will be driven by the data in the tails of
the unexpected earnings distribution.
Signalling theory has limitations in the form of monotonous restriction (Bernhardt,
Douglas and Robertson, 2005) by “averaging” across the changes in dividend signals,
but in fact there are many factors which can influence the result. The problem arises
when there are larger reductions in dividend signal (Bernhardt, et. al, 2005).
1.4 ORGANISATION OF THE STUDY
The study on the dividend signalling of Main Board listed companies in Bursa
Malaysia is presented in the subsequent sections. Chapter 2 summarizes the result of
the studies done by the past scholars and researchers on dividend theories and
dividend signalling. Chapter 3 explains the methodologies adopted in this research
study which include the hypotheses being tested, measurements and formulas of the
variables in the study, sampling design, data collection procedures and data analysis
techniques. Chapter 4 presents the descriptive summaries of the sample and the results
of the analysis. Chapter 5 concludes the research findings and suggests for the
possible area for future research. Chapter 6 lists down all the references in relation to
this research study.
6
CHAPTER 2: LITERATURE REVIEW
2.1 WHAT IS DIVIDEND POLICY
Dividend can be defined as distribution or payment in either cash or shares to the
shareholders of the company out of the firms’ earnings (Ross, Westerfield and Jordan,
2003; Investopedia online). The decision on the amount of net earnings to be paid out
as dividend to the shareholders involves several factors to be considered such as the
firm’s current earnings, future investment needs, cash flow position, shareholders’
preferences (or composition of shareholders), market sentiment as well as dividend
decisions of other companies within the same industry. Due to the complexities
involved in dividend decision, such decision is normally determined by the top
management of the company such as chief financial officers, treasurers and board of
directors.
Dividend policy is a payout matter considered by firms in relation to when, how much
of the net earnings to be payout as dividends and in what forms the dividends to be
paid. In simpler context, dividend policy relates to the time pattern of dividend payout
(Ross et al, 2003) and is determined by the changes in earnings, after taking into
consideration of investment decisions (Lumby and Jones, 1981). We refer such
condition as “residual dividend policy”. High-growth firms will not pay out large
portion of their earnings as dividends, in view of the requirement to sustain higher
than average growth (Investopedia online). In fact, firms that increase dividends are
found to be larger and more profitable than firms that cut or maintain their dividends
(Grullon, Michaely, Benartzi and Thaler, 2005). Although dividend increase is more
frequent than dividend decrease, dividend increase is smaller in magnitude than
7
dividend decrease (DeAngelo and DeAngelo, 1990; Nissim and Ziv, 2001).
There are some studies conducted on the pattern of dividend payout in other countries,
i.e. companies in the United States distribute large part of their earnings as dividends
and try to maintain a stable dividend policy. The establishment of dividend in these
companies is in accordance with the level of current earnings as well as dividends in
previous years (Lintner, 1956). However, dividend policy in emerging markets had
showed some level of differences with developed markets in which the former
pursued less stable dividend policy with lower payout ratio (Glen, Karmokolias,
Miller and Shah, 1995). But there are also cases in which Asian companies in India
and Singapore pursue a stable dividend policy (Pandey and Bhat, 1994; Ariff and
Johnson, 1994).
Many studies were conducted on the dividend policy in Malaysia. Studies in the
1990’s showed that the dividend behavior of Malaysian companies was stable and
confirmed the applicability of the Lintner model in Malaysia (Isa, 1992; Annuar and
Shamser, 1993; Gupta and Lok, 1995; Kester and Isa, 1996). However, subsequent
studies showed that dividend behavior of Malaysin companies was sensitive to
dividend changes (pursued less stable dividend policy) but do not immediately omit
dividends when earnings decreased (Pandey, 2001). Pandey (2001)’s result was
consistent with study done by DeAngelo and DeAngelo (1990), Michaely, Thaler and
Womack (1995), Nissim and Ziv (2001) and Grullon et al (2005) which showed that
dividend cuts are less common than dividend increase and more extreme in magnitude.
Following Pandey’s studies, Al-Twaijry (2007) tested the relationship between DPS
and EPS of listed companies in the Bursa Malaysia and concluded that companies

8
follow dividend policies which are not strongly attached to current earnings and
negative (but insignificant) relationship was found between dividend payout ratio and
future earnings.
The following section elaborates on dividend related theories, namely the (1) dividend
irrelevance theory, (2) agency theory, (3) information asymmetry, (4) Bird-in-Hand
fallacy and (5) clientele effect.
(a) Dividend Irrelevance Theory
According to Miller and Modigliani (1961), the pattern of dividend is
irrelevant and therefore the value and the investment decisions of a firm are
independent from dividend policy in a (1) perfect and efficient market and (2)
a world without taxes and transaction costs. Under the dividend irrelevance
theory, a firm is free to determine any dividend policy in a free of tax
environment without affecting the stream of cash flows or value of the firm in
the following manner:-
(i) Pay dividend in excess of cash flows from operations and issue new
equities to finance for the dividend payment
(ii) Pay dividend less than the cash flows from operations after making
investments and the excess cash flows after paying dividends will be
used to repurchase shares (Copeland and Weston, 1988)
Under the dividend irrelevance theory, the pattern of cash flows provided by a
company through the payment of dividends is irrelevant as shareholders are
free to adjust the dividend patterns to suit their desired consumption patterns

9
through the capital market (Lumby and Jones, 1981). As dividend is irrelevant
in enhancing shareholders’ wealth in a perfect capital market, the only source
to enhance shareholders’ value is through the investment decision alone.
(b) The Bird-in-Hand Fallacy
Under the theory of Bird-in-Hand fallacy, risk-averse investors prefer
dividends as compared to capital gains due to the uncertainties inherent with
capital gains. However, there are a few arguments to this Bird-in-Hand Fallacy
due to the following reasons:-
(i) The choices between current dividends and the current share price
appreciation. When dividend payment is announced by the company,
share price of the company drops slightly lower than the dividend on
the ex-dividend day.
(ii) When firm increases its dividend without changing its investment
policy, dividend payment has to be financed by issuing new shares and
hence the increase in dividend payment is offset by losing an amount
equivalent to the present value of price appreciation (Damodaran,
2001). As the risk of the firm is determined by the risk of the project
cash flow, a decrease in dividend means greater investments and
higher risk and therefore increase in the market rates of return (higher
share price) (Copeland and Weston, 1988).
10
(c) Agency Theory
When there are differences in ownership and control of the company, agency
problem occurs. Managers as agents for shareholders must make their
decisions based on the objective of maximizing shareholders’ wealth. In order
to ensure their decisions are in line with the objective of maximization of
shareholders’ wealth, shareholders will incur nontrivial monitoring costs.
However, pursuing such monitoring action will create “trade-off” issue for
both shareholders and managers. Shareholders will face the trade-off between
monitoring costs and the forms of compensation involved to encourage the
agents to act in the owners’ interest. At the same time, managers also face the
trade-off between maximizing shareholders’ value and its own personal
interests by pursuing non-pecuniary interest. Selfish managers may not pay
out dividends but utilize the funds for personal compensation when the firms
are making profits. Therefore, increase in dividend payout can reduce agency
cost (Rozeff, 1982) as greater dividend payments serves as a mean in
monitoring and bonding the performance of managers. Greater dividend
payout may involve external financing i.e. through fund raising in the capital
markets and hence put the firm under greater scrutiny by the supplier of
capital besides the shareholders of the company. When a company is
controlled by a majority of insiders, there is less need to pay dividends to
reduce agency costs. At the contrary, agency cost will become higher when the
shareholding structure of a company is dispersed and hence higher dividend
payout (Rozeff, 1982).
11
(d) Clientele effect
Contrary with the assumptions of perfect capital market and a tax-free world
under the dividend irrelevance theory, the concept of clientele effect exists due
to imperfection in the capital market (e.g. transaction costs, difference in
interest rates and the presence of absolute capital rationing). The imperfection
in capital market will impose certain costs to shareholders when adjustments
in the dividend patterns are made to fit his preferred consumption pattern. In
such an imperfect capital market, simple wealth maximization may not be a
unique desire for the shareholders and therefore a continuous and stable
supply of dividend is viewed positively as a source of cash inflows to match
the desired consumption pattern of the shareholders (Lumby and Jones, 1981).
The fulfillment of the shareholders’ wealth creates a consequential cost to the
company as the company may leave with insufficient funds to finance for
profitable investments. Alternatively, the company has to finance its
investment needs from external resources which involve issuance cost. As
such, companies start to maintain stable dividend policy with the hope that the
stable dividend policy will not incur heavy cost penalties.
(e) Information asymmetry
The concept of information asymmetry is related to the differences in the
amount of information held by the management and the external shareholders.
The management, being the insiders of the company has more priori
information as compared with external shareholders who have limited access
to the information of the company. Due to such differences in a world of
asymmetry information, any changes in the dividend will be interpreted as a
12
costly signaling tool used by insiders of a company to convey information on
the firm’s future prospects (Bhattacharya, 1979; John and Williams, 1985;
Miller and Rock, 1985). The problem of information asymmetry is mitigated
when the ownership of a company becomes more concentrated, as such the
importance of dividend signalling is reduced (Vieira and Raposo, 2007).
Dividend policy of a firm can be measured using 2 methods: (1) dividend yield and
dividend payout ratio (Damodaran, 2001; Investopedia online). Changes in these 2
measures provide some information in relation to risks and future growth in earnings
of the company. Previous research studies showed that shares with high dividend
yields will result in excess returns, after adjusting for the market performance and risk
(Damodaran, 2001). Dividend payout ratio is used in estimating future dividends and
expected growth in earnings. When dividend payout ratio increases, the amount of
free cash flow decreases and fewer investments can be made from the available cash
flow, therefore the firm is expected to have lower growth in earnings. In other words,
high retention ratio (1-dividend payout ratio) will result in higher growth in earnings
(Damodaran, 2001).
2.2 THE DIVIDEND SIGNALLING THEORY
Dividend signalling theory suggests that dividend announcements convey information
on the firm’s future prospects (Investopedia online) by stimulating changes in share
prices which further generate returns to the shareholders. In other words, we refer this
as the “information content of dividend” as suggested by Miller and Modigliani
(1961). According to Miller and Modigliani, a company’s value is determined by its
13
expected future earnings and not on current earnings. If dividends are dependent on
the permanent component of the earnings, dividends would serve as a surrogate for
expected future earnings. The classic study on dividend signalling suggests that
current dividend is dependant on future as well as current and past earnings (Lintner,
1956). Although changes in dividends do contain some information to the investors,
dividend signalling is not universally applied to all firms (Chin, 2005).
An early study by John Lintner (1956) on dividend signalling showed that changes in
earnings will affect dividend payout and managers rarely change their dividend
payout in order to achieve the target payout ratio. Subsequent study by Fama and
Babiak (1968) also confirmed the findings by Lintner (1956) in which changes in
dividend lagged changes in earnings.
While early scholars suggested that firms use changes in dividends to convey
information on the firms’ financial prospects to the investors, some argued that firms
rarely change their dividends regardless of the earnings of the firm. The reasons of
such sticky dividend can be explained by 2 factors (Damodaran, 2001):-
(a) Concern of firms in maintaining higher dividends in the future; and
(b) Negative views on dividend decrease, which is associated with decrease in
share price
Based on the assertion of firms’ reluctant to change dividends, an increase in dividend
signals a favorable expectation on the firm’s future prospects and vice versa.
14
There are two important hypotheses related to the dividend signalling theory, namely
the free cash flow hypothesis and the maturity hypothesis. The free cash flow
hypothesis suggests that dividend signals information on investment policies of
overinvestment firms (Litzenberger and Ramaswamy, 1979). An increase in dividend
payment signals lack of investment opportunities for the firm and vice versa. The
maturity hypothesis suggests that an increase in dividend conveys information on
decreased investment opportunities, decreased return on assets and future earnings
growth rate as well as decrease in systematic risks. (Grullon, Michaely, Roni and
Swaminathan, 2002).
Using dividend as a mechanism to convey information on the firm’s profitability
involves signalling cost, especially in countries that impose taxation on both dividend
income and capital gains such as United States. When the cost of signalling becomes
higher due to higher tax rate imposed on dividend as compared to capital gains, an
increase in dividends will involve higher cost and therefore a higher return is required
to compensate for the cost of taxation involved (Brennan, 1970; Litzenberger and
Ramaswamy, 1979). In other words, firm value is more sensitive to a more costly
signal under the signalling model (Bernhardt et al, 2005). Contrary with Bernhardt’s
view, subsequent studies showed that market responses more favorably to dividend
increase when the tax rate on dividend is reduced, as experienced after the
implementation of the Tax Reform Act 1986.
The decision whether to use dividend to signal firm’s prospects to the investors may
be determined by the quality and characteristics of the firms. Firms with reputation
may rely on other lower cost communication channel rather than using dividend
15
signalling to convey information to the shareholders.
If changes in dividends signal information to the investors in an efficient capital
market, such changes will be reflected in the share prices of the firms immediately
after the dividend announcements. According to Fama (1970), a market is efficient
when it fully reflects all available information and is characterized by availability of
investment data, large pool of investors and fund managers, active trading, well-
disseminated business and financial information, appropriate degree of market
regulation and reasonably sophisticated communication system. (Lian, 2000)
2.2.1 Previous literatures that support earnings and past dividends determine
current dividends
The signalling effect of dividend has become the major debates amongst the
finance researchers and scholars. The famous dividend-signalling model in
1950s by Lintner (1956) showed that earnings of a company can be sub-
divided into permanent earnings and temporary earnings. He observed that
only changes in permanent earnings affect changes in dividends, while
temporary earnings will not have any influence on a company’s dividend
policy. Due to the nature of dividend which functions as a lagging indicator of
changes in a company’s permanent earnings, dividend payout ratio rises when
a company begins a period of bad times and falls when a company reaches a
period of good times. Further study by Aharony and Swary (1980) supported
Lintner’s model. According to their findings, quarterly dividend
announcements have information content beyond the earnings announcement,
which further supported the semi-strong form of efficient market hypothesis.
16
Lintner (1956) discovered for the first time that firms maintain a target
dividend payout ratio and adjust their dividend policies to such target. His
studies showed that current earnings of the firm and dividend in the previous
years determined the firms’ dividends. Lintner also pointed that managers
believed that investors prefer firms with stable dividend policies. Subsequent
surveys by Baker, Farrelly, and Edelman (1985) on the listed companies in the
New York Stock Exchange supported Lintner’s views with the conclusion that
the major determinants of dividend payments are current earnings and past
dividends.
Empirical evidences had shown that dividends do signal to the market on the
financial position of a company. A research study by Garrett and Priestly
(2000) showed significant evidence of dividend smoothing and dividends
convey information on unexpected positive changes in current permanent
earnings. No evidence was found to support the notion that the dividend
signals future permanent earnings. In the same year, Guay and Harford (2000)
found that relationship exists between dividend distribution with the past and
contemporary cash flow shock. Their studies were further tested by Al-
Sharaks (2005) and his findings supported the previous research done by Guay
and Harford (2000).
17
2.2.2 Previous literatures that support changes in dividends do not provide
signals to the market
A well-known finance theory on irrelevance of dividends without any
influence on the share prices of the company was introduced by Miller and
Modigliani (1961) who supported the market efficiency theory. While some
researchers have different views that the capital market is inefficient and
therefore changes in dividends provide signal to the market, Miller and
Modigliani theory suggests that changes in dividend might have information
content if there exists insider information (managers are better informed than
investors). Further studies by Watts (1973) and Gonedes (1978) showed that
there is no relationship between current dividends and future earnings.
However research done by Watts (1973, 1976a, 1976b) showed that the
hypothesis on the information content of dividend was trivial.
Although Marsh and Merton (1987) briefly considered the dividend signalling
hypothesis, they argued that dividend signalling unlikely to occur as the firm’s
specific information will be washed-out. In other words, the market efficiency
theory exists to support the study by Marsh and Merton (1987). They argued
that the dividend decisions of individual firms are not independent of the
decision of other firms in the same industry. Managers respond to the dividend
announcements of their peers, regardless of the company’s financial position
and future investment requirements. Further study by Healy and Palepu (1988)
and Benartzi et al (1997) proved the earnings reversal phenomena. The results
by Benartzi et al (1997) showed no significant relationship between changes in
dividends and changes in earnings in the subsequent years. However, changes
18
in dividends indicate changes in earnings in current year.
Using Marsh and Merton model, Kao and Wu (1994) discovered marginal
evidence of dividend signalling. Following Kao and Wu’s studies, Fudenberg
and Tirole (1995), and Vieira and Raposo (2007) proved that dividends are
sticky as managers tend to maintain their dividend per share even when the
company faces temporary net losses. Managers cut down their dividend
payment only when they are sure that the earnings will not revive. There are
researchers who viewed a dividend cut as a good news to the investors as it
shows managers’ decision to solve the firms’ financial problems (Abeyratna
and Power, 2002).
The linearity and non-linearity of the mean reversion of earnings are found to
be the elements that distinguish between the effects of dividend signalling.
Earlier study on dividend signalling by Nissim and Ziv (2001) supported for
the dividend signalling theory, however the reverse was found after
considering the non-linearity of earnings (Grullon et al, 2005). Initial test on
the relationship between changes in dividend and changes in future earnings
by assuming the linearity in the changes in earnings and controlling on the
uniform mean reversion and momentum in earnings showed that changes in
dividends convey some information about future earnings. The study by
Grullon et al (2005) showed that changes in dividends are strongly related to
concurrent earnings. His result was consistent with the empirical evidence that
changes in dividend policy occur only when changes in earnings are
substantial (Brav, Graham, Harvey and Michaely, 2003). In other words,
19
changes in dividends are considered as surrogate for non-linearity of earnings
under a uniform mean reversion model. The result by Grullon et al (2005) was
proven earlier by DeAngelo, DeAngelo and Skinner (1992) and Benartzi et al
(1997). The dividend signalling theory holds true for dividend increase based
on the study by Nissim and Ziv (2001) who found the lack of correlation
between dividend decrease and future earnings as the information content of
dividend decrease is already captured by current year earnings. Indeed, they
found that current year earnings and dividend decrease are highly correlated,
which is consistent with the result of DeAngelo et al (1992) and Benartzi, et al
(1997). Study by Benartzi et al (1997) supported the dividend signalling
theory, showing the evidence on changes in dividends provide information on
the current and past level of earnings. According to Nissim and Ziv (2001), the
negative relationship between these two variables is due to accounting
conservatism.
Besides, market characteristics also determine the extent of dividend
signalling. The usage of dividend as a signalling tool is less prominent in less
developed markets as compared with developed markets such as United
Kingdom in which current dividends are determined by lagged dividends
(Vieira and Raposo, 2007). The fact that a developed stock market with larger
pooled of investors is characterised by less concentrated ownership and the
management may use changes in dividends to convey information on firm’s
prospects to the external shareholders. In other words, the pattern of firm
ownership determines the effect of dividend signalling. Firms with
concentrated ownership may not need dividend as signalling tool (Goergen,
20
Renneboog and Silva, 2005) as concentrated ownership reduces information
asymmetries (Vieira and Clara, 2007).
The size of the dividend announcing firms also has some level of influence on
the extent of dividend signalling. According to Bajaj and Vijh (1990),
dividend announcements by large firms will not trigger large market reaction.
2.2.3 Previous literatures that support changes in dividends provide signals to
the market
Some previous studies on dividend behavior found evidence that managers use
changes in dividend as a signalling device to convey information about
unexpected shock in earnings (Bhattacharya, 1979; John and Williams, 1985;
Miller and Rock, 1985; Aharony and Dotan, 1994; Chen and Wu, 1999;
Nissim and Ziv, 2001; Arnott and Asness, 2001 and 2003; Harada and Nguyen,
2005; Baker, Mukherjee and Paskelian, 2006; Staceseu, 2006; Vivian, 2006).
The reason behind changes in dividends as a clear and unambiguous tool to
convey the future prospects of the companies lies on the fact that financial
reports of the firms only reflect past financial performance of the firms and are
manipulated by the management especially when the firms faced financial and
operational difficulties (Kaplan and Roll, 1972).
Research conducted by Yoon and Starks (1995) supported dividend signaling,
which is in turn supported by the evidence of payout asymmetries. In the same
year, Bernheim and Wantz (1995) found evidence in support of signalling
rather than agency explanations on the reasons dividends are paid.
21
Further, two research studies by Fama and French (1998) explained current
dividend payout signals future expected earnings.
Other researchers who used financial models to test the dividend signalling
and dividend behavior in the stock market such as Brickley (1983), Healy and
Palepu (1988) and Aharony and Dotan (1994) found that an increase in
dividend leads to the increase in future earnings. Research done by Aharony
and Dotan (1994) showed that firms that increase (decrease) their dividends
experience greater (smaller) unexpected changes in earnings in the subsequent
years as compared with firms that do not change their dividends. However, the
magnitude of the relationship becomes smaller when the earnings change
events move further away from the event quarter. Differences in the
magnitude of the changes in the unexpected earnings yield are discovered
under different categories of dividend change.
Some researchers tested the relationship between dividends and future
earnings with and without controlling for the effect of past and current
earnings. Nissim and Ziv (2001) proved a positive relationship between
current dividend and changes in earnings in the subsequent 2 years following
the dividend change year by controlling a particular (linear) form of mean
reversion in earnings. However, their results showed that dividend decrease
was not related to future profits. Brickley (1983) found a positive relationship
between dividend increase (decrease) and earnings increase (decrease) without
controlling for the effect of past and current earnings announcements.

22
From the above review on the historical research findings, we can conclude that there
are different views on dividend as signal on the future prospects of the company. The
reasons on the differences in findings are partly due to geographical differences
(different stock exchanges with different market characteristics / sophistication /
market liquidity), differences in companies’ characteristics (different corporate
culture or dividend policies) and industry effect.
Many research studies on dividend signalling have been done in developed countries,
but lack of research studies are conducted in developing countries such as Malaysia.
As such, there is a need to further discover on the dividend signalling of the listed
companies in Bursa Malaysia.

23
CHAPTER 3: RESEARCH METHODOLOGY 3.1 DEVELOPMENT OF THE HYPOTHESES
The information content of dividend with the underlying assumption that earnings
follow a random walk (Benartzi et al, 1997; Nissim and Ziv, 2001) is tested using the
following hypotheses:-
(A) Relationship between changes in dividends in current year with changes in
earnings in the concurrent and subsequent years:
HAo: Companies that change their dividends in year 0 will not experience
any changes in unexpected earnings in the following years, i.e. year 1
to year 5. Instead, there is a positive and significant relationship
between changes in dividends and unexpected earnings in the
concurrent year.
HA1: Companies that change their dividends in year 0 will experience
changes in unexpected earnings in the following years, i.e. year 1 to
year 5 with positive and significant relationship (Dividend signalling
exists).
The above hypothesis is further extended to test the relationship between the type of
dividend change (dividend increase and dividend decrease) with change in unexpected
earnings in the concurrent and subsequent years as follows:-
(B) Relationship between increase in dividend in current year with increase in
earnings in the concurrent and subsequent years:
HBo: There is no relationship between increase in dividends in the

24
concurrent year with increase in the unexpected earnings in the
subsequent years from year 1 to year 5. Instead, there is a positive and
significant relationship between increase in dividends with increase in
unexpected earnings in the concurrent year.
HB1: There is a positive relationship between increases in dividend in the
current year with increases in the unexpected earnings in the
subsequent year 1 to year 5 (Dividend signalling exists for dividend
increase).
(C) Relationship between decrease in dividends in current year with decrease in
earnings in the concurrent and subsequent years
HCo: There is no relationship between decrease in dividends in current year
with decrease in unexpected earnings in subsequent years from year 1
to year 5. Instead, there is a positive and significant relationship
between decrease in dividends with decrease in unexpected earnings in
the concurrent year.
HC1: There is a positive and significant relationship between decreases in
dividends in the current year with decreases in the unexpected earnings
in the subsequent year 1 to year 5 (Dividend signalling exists for
dividend decrease).
The subdivision of the dividend change events into sub-groups of dividend increase
and dividend decrease is to identify the type of dividend change which has a stronger
effect on changes in earnings in the concurrent and / or subsequent 5 years following
the dividend change event, as tested in the hypothesis B and C above.

25
Further to the testing of the above hypotheses A to C, the relationship between
changes in dividends with changes in unexpected earnings was tested by each
category of years as follows:-
(a) Each individual year under the study period from year 1998 to 2007
(b) Sub-period during the financial crisis (1998-2001) and post financial crisis (2002-
2007)
(c) Case by case analysis on dividend change events that occurred after experiencing
stable dividend per share for consecutive 2 years, 3 years and 4 years.
The case by case analysis on changes in dividends that happened after some period of
stable dividends as mentioned in (c) above is tested by using the hypothesis below:-
(D) Relationship between the stability of dividend before changes in dividends
with the extent of dividend signalling
HDo: There is no relationship between the stability of dividend before
changes in dividends with the extent of dividend signalling.
HD1: There is a positive relationship between the stability of dividend before
changes in dividends with the extent of dividend signalling. The more
stable of dividend before the changes in dividend policies, the stronger
the dividend signalling.
Besides testing on the relationship between changes in dividends and changes in
earnings on a combined-year and individual-year basis, more in-depth study was
conducted on the extent of dividend signalling based on the size of changes in

26
dividends and the size of dividend yields of the companies. The rationale behind the
study on the extent of dividend signalling based on the size of changes in dividends is
that investors are more concerned with larger changes in dividends as compared with
smaller and insignificant changes. Hence the hypothesis to test the extent of dividend
signalling based on the size of dividend changes is as follows:-
(E) Relationship between the size of changes in dividends with the extent of
dividend signalling
HEo: There is no relationship between the size of changes in dividends with
the extent of dividend signalling.
HE1: There is a positive relationship between the size of changes in dividend
with the extent of dividend signalling. The larger (smaller) the changes
in dividends, the stronger (weaker) the dividend signalling effect.
In addition to the size effect of changes in dividends, study is further expanded to
examine the clientele effect by testing the relationship between the dividend yield with
the extent of dividend signalling. Naturally, companies with higher dividend yield tend
to place more weight on dividend in share valuation as compared with those companies
with low dividend yield. This is due to investors of those companies with low dividend
yield are more concerned with changes in the share price as a source of investment
gains rather than relying on dividend as investment income. Hence the hypothesis
tested is:-

27
(F) Relationship between dividend yield and the extent of dividend signalling
HF0: There is no relationship between dividend yield and the extent of
dividend signalling.
HF1: There is a positive relationship between dividend yield and the extent
of dividend signalling. The larger (smaller) the dividend yield, the
stronger (weaker) the dividend signalling.
Lastly, industry effect in influencing the extent of dividend signalling is further tested
by incorporating the effect of 3 sectors with the highest number of dividend paying
companies (namely, industrial, trading / services and consumer sector) in the
regression model.
(G) Industry effect in influencing the extend of dividend signalling
HG0: Industry effect does not have any influence on the extent of dividend
signalling of the companies.
HG1: Industry effect does exists to influence the extent of dividend
signalling of the companies
3.2 SELECTION OF MEASURES
The information content of dividends of the listed companies in the Main Board of
Bursa Malaysia is measured by using Pearson correlation and regression analysis on 2
major variables, namely the changes in unexpected earnings and changes in dividends.
The measurement of these 2 variables is shown in the formulas below:-

28
3.2.1 Measure of unexpected earnings
The unexpected earnings are measured by using the following formula as
adopted by Benartzi et al (1997).
∆UE i,t = (E i,t – E i,t-1) / MVi,0
Whereas
∆UE i,t = Changes in unexpected earnings of firm i in year t
E i,t = Earnings of firm i in year t
E i,t-1 = Earnings of firm i in year t-1
MV i,0 = Market value of equity of firm i on the 1st trading day of the
announcement year
In this study, expectation model is adopted for annual changes in earnings in
which we assume earnings follow a random walk with drift (Aharony and
Dotan, 1994).
As the above formula (adopted by the previous studies) uses absolute value,
modification has been made to reflect per share value for dividends and
earnings before extraordinary items as below:-
∆EPS i,t= (EPS i,t – EPS i,t-1) / Pi,0
Whereas
∆EPS i,t = Changes in earnings per share of firm i in year t
EPS i,t = Earnings per share of firm i in year t
EPS i,t-1 = Earnings per share of firm i in year t-1
P i,0 = Share price of firm at the beginning of the dividend
change year 0
29
The EPS of the selected sample companies are adjusted in which extraordinary
items such as gain or loss on sale of investments, land etc and diminution in
the value of investments are excluded from the computation of the bottom line
earnings, except in cases where such extraordinary items are regarded as part
of the ordinary business of the selected sample companies. The adoption of
earnings before extraordinary items is in line with the basis of measurement of
earnings as adopted by Benartzi et al (1997).
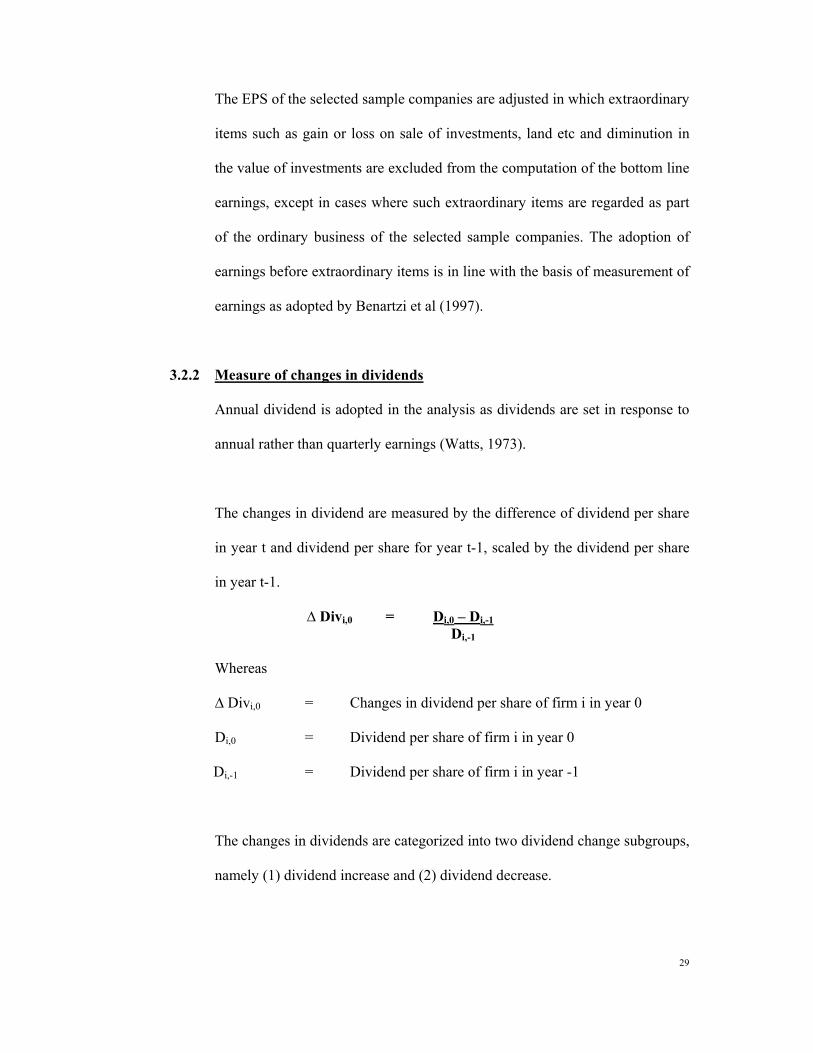
3.2.2 Measure of changes in dividends
Annual dividend is adopted in the analysis as dividends are set in response to
annual rather than quarterly earnings (Watts, 1973).
The changes in dividend are measured by the difference of dividend per share
in year t and dividend per share for year t-1, scaled by the dividend per share
in year t-1.
∆ Divi,0 = Di,0 – Di,-1 Di,-1
Whereas
∆ Divi,0 = Changes in dividend per share of firm i in year 0
Di,0 = Dividend per share of firm i in year 0
Di,-1 = Dividend per share of firm i in year -1
The changes in dividends are categorized into two dividend change subgroups,
namely (1) dividend increase and (2) dividend decrease.
30
3.3 SAMPLING DESIGN
The sample for this study consists of listed companies on the Main Board of Bursa
Malaysia, which is derived from the yearly publication of Dynaquest Sdn Bhd titled
“Stock Performance Guide” featuring historical financial and stock performance data
of listed companies on the Main Board of Bursa Malaysia. The selection criteria of
the sample are as follows:-
(i) The selected companies must be listed on the Main Board of Bursa Malaysia
since 1997 onwards with complete financial data of EPS and DPS.
(ii) Companies in the Finance, REITS and Closed-End Funds sectors are excluded
from the study to improve homogeneity of the sample as these companies have
very high leverage with different rules for income measurement. Such
selection criterion follows the selection method adopted by Pandey (2001),
Grullon et al (2003) and Short, Zhang and Keasey (2002).
(iii) Companies that are categorised under PN4 and PN17 will be excluded from
the study. A firm being categorised under PN4 is a company with its assets
consist of 70% or more of cash or short term investments. The inclusion of
these companies in the analysis will jeopardise the result as companies with
abundant of cash may distribute large portion of its retained earnings as
dividends, regardless of the losses experienced by the company. Whereas a
PN17 companies are financially distressed companies in which the possibility
of division omission is very high.
(iv) Companies categorized under the IPC, Hotels and Mining are excluded from
the study due to its relatively small number of companies under each sector.

31
(v) The selected companies must pay at least 2 consecutive years of dividends to
enable calculation of yearly changes in dividends. Dividend initiations and
dividend omissions are excluded from the study.
(vi) The selected companies must have financial information on the changes in
EPS for the current and future five years after the dividend payment year.
(vii) Companies with other distribution events such as stock splits or a stock
dividends declared around the declaration of the current dividend will be
excluded from the study (Grullon et al, 2003; Aharony and Dotan, 1994;
Nissim and Ziv, 2001). The selection criterion is to minimize any
contaminating announcements effect as such distribution events will affect the
per unit share price, which is used as the denominator in measuring changes in
earnings.
3.4 DATA COLLECTION PROCEDURES
The analysis to test the relationship between changes in dividends in year 0 (year 0 is
the dividend change year) and changes in earnings in year 0 and 5 years following the
dividend change year (year 1 to year 5) requires data on EPS and DPS from year 1997
until year 2007 and share price on the beginning of the dividend change year from
year 1998 to 2007. All these data are obtained from the latest yearly publication of
Dynaquest Sdn Bhd - “Stock Performance Guide” which features all the Main Board
listed companies in Bursa Malaysia.
32
3.5 DATA ANALYSIS TECHNIQUES 3.5.1 Data Filtering
The final list of sample companies was obtained by going through 4 stages of
filtering to ensure that the final list of the samples contained only companies
with complete financial data for regression analysis.
1st stage : Filtering of dividend paying and non-dividend paying
companies
Companies that did not pay dividends in each individual year
for the period 1998 to 2007 were excluded from the study.
The process of filtering by excluding companies with DPS=0
on each individual year 0 involves the filtering of dividend
omission events at the same time should DPS is more than 0
in year –1.
2nd stage : Filtering of dividend initiation events
Companies with DPS more than 0 in year 0 but DPS equals
to 0 in year –1 were excluded from the study.
3rd stage : Filtering of companies in the sector of Finance, IPC,
Mining, Hotels, REITS and Closed-End Funds
Companies in the sector of Finance, IPC, Mining, Hotels,
REITS and Closed End Funds were further excluded from
study in view of the different accounting procedures adopted
by Finance companies and the relatively small amount of
companies categorized under the sector of IPC, Mining,
Hotels, REITS and Closed-End Funds.

33
4th stage : Filtering out companies with incomplete financial data
The final stage of the filtering process is to filter out those
companies without complete data on changes in earnings
from year 0 to year 5 due to changes in financial years.
The initial sample of dividend paying companies after the filtering process
consists of 2,679 firm-year observations.
3.5.2 Assumptions adopted in the regression analysis
Prior to regression analysis, the following assumptions must be fulfilled to
ensure reliability of the regression results (Coakes and Steed, 2007)
(1) Minimum number of cases for analysis must be at least five times of
independent variables. The ideal number of cases must be twenty times
more than the number of predictors.
(2) Outliers are deleted or modified to minimize the influence on the result
of the regression.
(3) No multicollinearity and singularity between the independent variables
for multiple regressions.
(4) Variables must fulfill the assumption of normality, linearity,
homoscedasticity and independence of residuals.
All the variables have fulfilled the above assumptions as the number of cases
is large (more than 2,000 cases). The normality on all the variables used in the
regression analysis, namely changes in dividends in year 0 and changes in
34
earnings in the concurrent year and 5 years after the dividend change year
(year 1 to year 5) were tested and identified through the value of skewness,
kurtosis and Kolmogorov-Smirnov test. Outliers were identified through the
generation of boxplots during the normality test by using SPSS.
Initial normality test on all the variables used in the regression analysis
showed some variables were not normally distributed with skewness value
more than 3, high value of kurtosis and Kolmogorov-Smirnov value at
significant level p<0.05. To improve the normality of the variables, outliers
were identified from the boxplots generated from the SPSS program and were
further eliminated from the samples. The elimination of outliers from the
samples has helped in reducing the value of skewness and kurtosis.
Berry and Feldman (1995) pointed out that the most important regression
assumption is related to residuals. A residual plot is used to check the
assumption of independence of error terms in the regression. Examination on
the pattern of the scatter plot of residuals against predicted values for each of
the regression showed random and patternless residuals with no clear
relationship of both variables and hence consistent with assumption (4) above.
3.5.3 Analysis on the relationship between changes in dividends in year 0 with
changes in earnings in the concurrent year and subsequent 5 years
The analysis technique adopted in this study is regression analysis. In
analyzing the variables using the regression analysis, 2 categories of dividend
changes are identified namely “INCREASE” and “DECREASE”. The
35
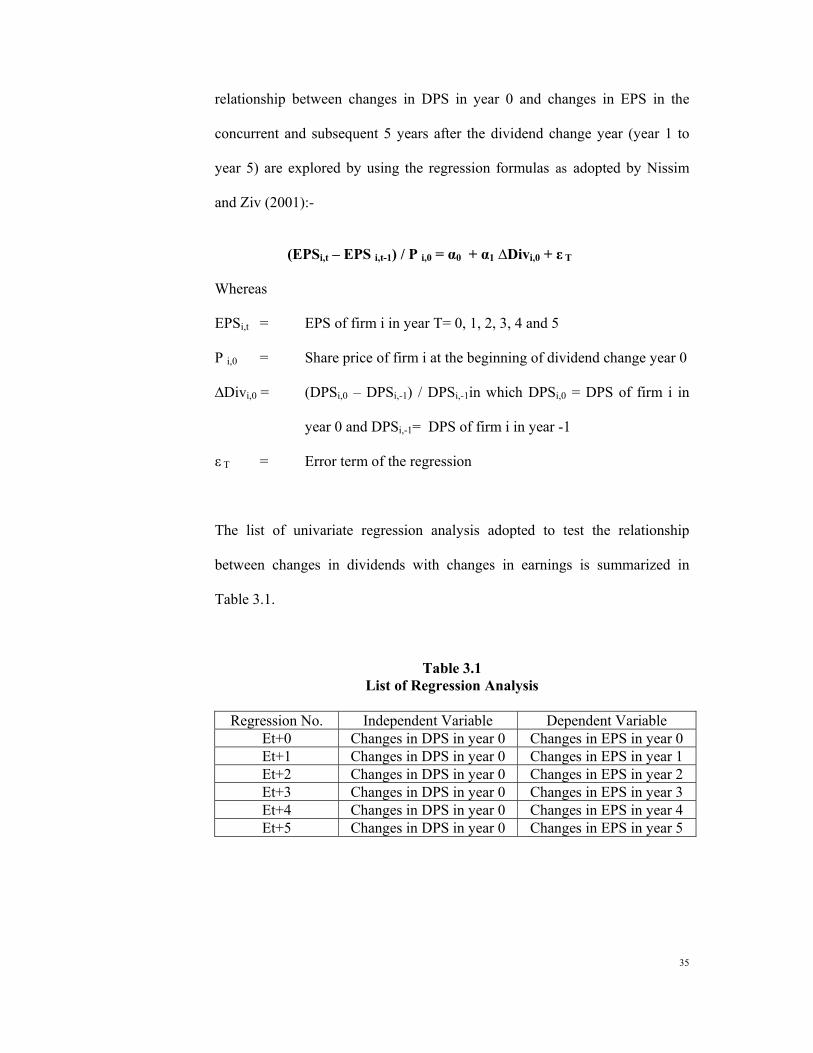
relationship between changes in DPS in year 0 and changes in EPS in the
concurrent and subsequent 5 years after the dividend change year (year 1 to
year 5) are explored by using the regression formulas as adopted by Nissim
and Ziv (2001):-
(EPSi,t – EPS i,t-1) / P i,0 = α0 + α1 ∆Divi,0 + ε T
Whereas
EPSi,t = EPS of firm i in year T= 0, 1, 2, 3, 4 and 5
P i,0 = Share price of firm i at the beginning of dividend change year 0
∆Divi,0 = (DPSi,0 – DPSi,-1) / DPSi,-1in which DPSi,0 = DPS of firm i in
year 0 and DPSi,-1= DPS of firm i in year -1
ε T = Error term of the regression
The list of univariate regression analysis adopted to test the relationship
between changes in dividends with changes in earnings is summarized in
Table 3.1.
Table 3.1 List of Regression Analysis
Regression No. Independent Variable Dependent Variable
Et+0 Changes in DPS in year 0 Changes in EPS in year 0 Et+1 Changes in DPS in year 0 Changes in EPS in year 1 Et+2 Changes in DPS in year 0 Changes in EPS in year 2 Et+3 Changes in DPS in year 0 Changes in EPS in year 3 Et+4 Changes in DPS in year 0 Changes in EPS in year 4 Et+5 Changes in DPS in year 0 Changes in EPS in year 5
36
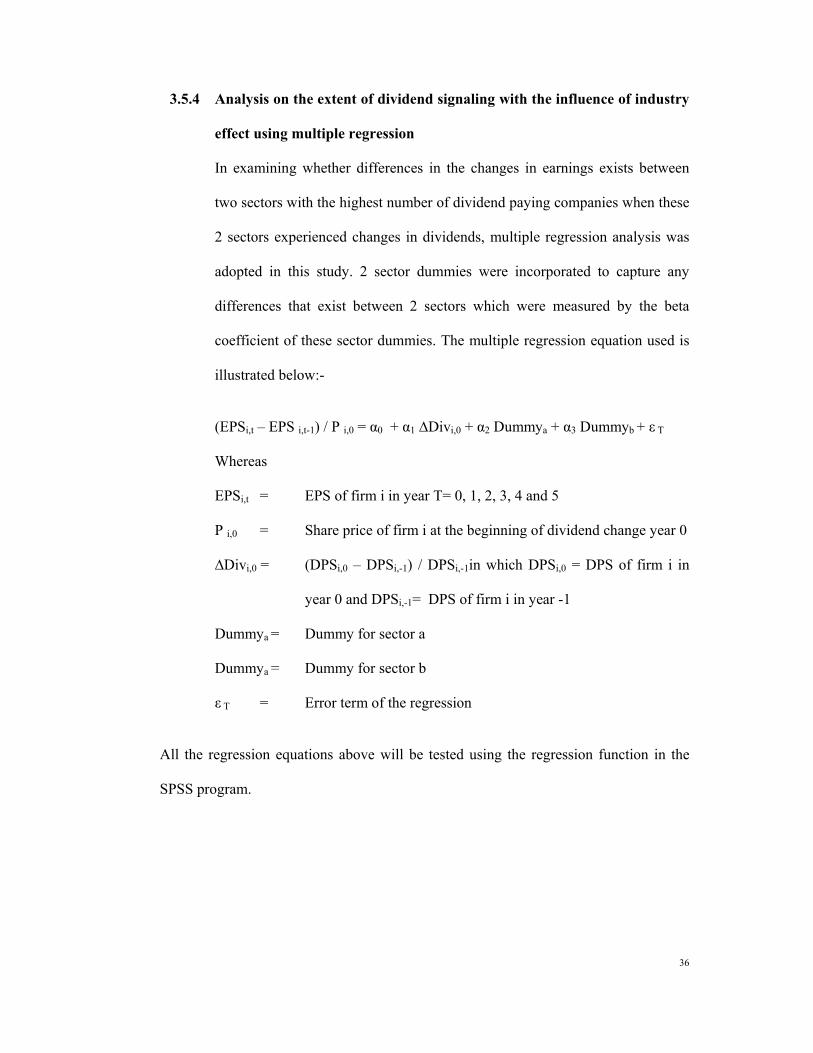
3.5.4 Analysis on the extent of dividend signaling with the influence of industry
effect using multiple regression
In examining whether differences in the changes in earnings exists between
two sectors with the highest number of dividend paying companies when these
2 sectors experienced changes in dividends, multiple regression analysis was
adopted in this study. 2 sector dummies were incorporated to capture any
differences that exist between 2 sectors which were measured by the beta
coefficient of these sector dummies. The multiple regression equation used is
illustrated below:-
(EPSi,t – EPS i,t-1) / P i,0 = α0 + α1 ∆Divi,0 + α2 Dummya + α3 Dummyb + ε T
Whereas
EPSi,t = EPS of firm i in year T= 0, 1, 2, 3, 4 and 5
P i,0 = Share price of firm i at the beginning of dividend change year 0
∆Divi,0 = (DPSi,0 – DPSi,-1) / DPSi,-1in which DPSi,0 = DPS of firm i in
year 0 and DPSi,-1= DPS of firm i in year -1
Dummya = Dummy for sector a
Dummya = Dummy for sector b
ε T = Error term of the regression
All the regression equations above will be tested using the regression function in the
SPSS program.
37
CHAPTER 4: RESEARCH RESULTS 4.1 SUMMARY STATISTICS
4.1.1 Overall Dividend Payment Trend of Main Board Listed Companies in
Bursa Malaysia
The initial list of Main Board listed companies (excluding PN4 and PN17
companies) for year 2007 consists of 632 companies. Since 2002, the number
of dividend paying companies listed on the Main Board of Bursa Malaysia
showed a continuous increase year to year from 67.6% in 2002 to 75% in year
2007. Further detail of the number of dividend paying companies listed on the
Main Board is demonstrated in Table 4.1 and Figure 4.1.
Table 4.1 No. of dividend paying companies from year 2002 to 2007
Year Total company No. of dividend paying companies % 2002 497 336 67.6% 2003 542 376 69.4% 2004 576 406 70.5% 2005 603 444 73.6% 2006 617 449 72.8% 2007 632 474 75.0%
Figure 4.1
0%
20%
40%
60%
80%
100%
Per
cent
2002 2003 2004 2005 2006 2007
Year
Composition of dividend paying and non-dividend paying companies in the Main Board of Bursa Malaysia (2002-2007)
No. of dividend paying companies No. of non-dividend paying companies
38
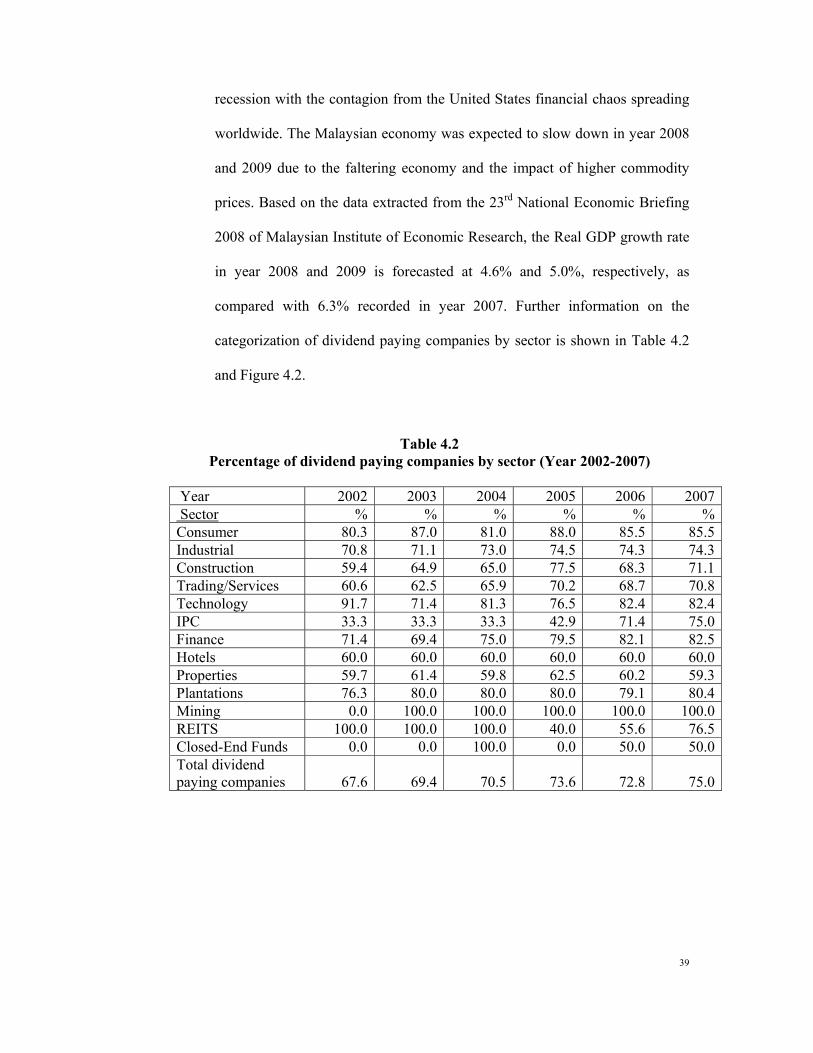
More than 50% of the dividend paying companies listed on the Main Board
came from 3 major sectors, namely Industrial, Trading / Services and
Consumer sector, with each sector being the first, second and third sector with
the highest number of dividend paying companies in year 2007. The
percentage of the dividend paying companies from the Consumer sector
remained at more than 80% since year 2002, with the highest percentage of
dividend paying companies recorded in year 2005 (88%). As can be seen from
Table 4.2, the Mining sector continued to become a 100% dividend paying
sector in the Main Board of Bursa Malaysia for 5 consecutive years since 2003,
as there is only 1 company listed under this sector. Excluding Mining sector, 3
sectors with the highest percentage of dividend paying companies for the past
2 years since 2006 were the Consumer, Finance and Technology sector with
more than 80% of the companies in these sectors paying dividends. 2 sectors
that experienced continuous increase in the percentage of dividend paying
companies in each sector since year 2002 are the Industrial and IPC sector.
Hotels sector continued to maintain its percentage of dividend paying
companies at 60% across the years since 2002. 3 sectors with the lowest
percentage of dividend paying companies for the part 2 years since 2006 were
the Closed-End Funds, Properties and Hotels sectors. A study on the trend of
percentage of dividend paying companies showed that a total of 5 sectors
(Consumer, Industrial, Construction, Trading / Services, Properties and
Plantations) experienced decrease in the percentage of dividend paying
companies in year 2006, which recorded the highest number of sectors with
reduced dividend paying companies. This may be caused by unfavorable
outlook on the domestic and global economy which is under the threat of
39
recession with the contagion from the United States financial chaos spreading
worldwide. The Malaysian economy was expected to slow down in year 2008
and 2009 due to the faltering economy and the impact of higher commodity
prices. Based on the data extracted from the 23rd National Economic Briefing
2008 of Malaysian Institute of Economic Research, the Real GDP growth rate
in year 2008 and 2009 is forecasted at 4.6% and 5.0%, respectively, as
compared with 6.3% recorded in year 2007. Further information on the
categorization of dividend paying companies by sector is shown in Table 4.2
and Figure 4.2.
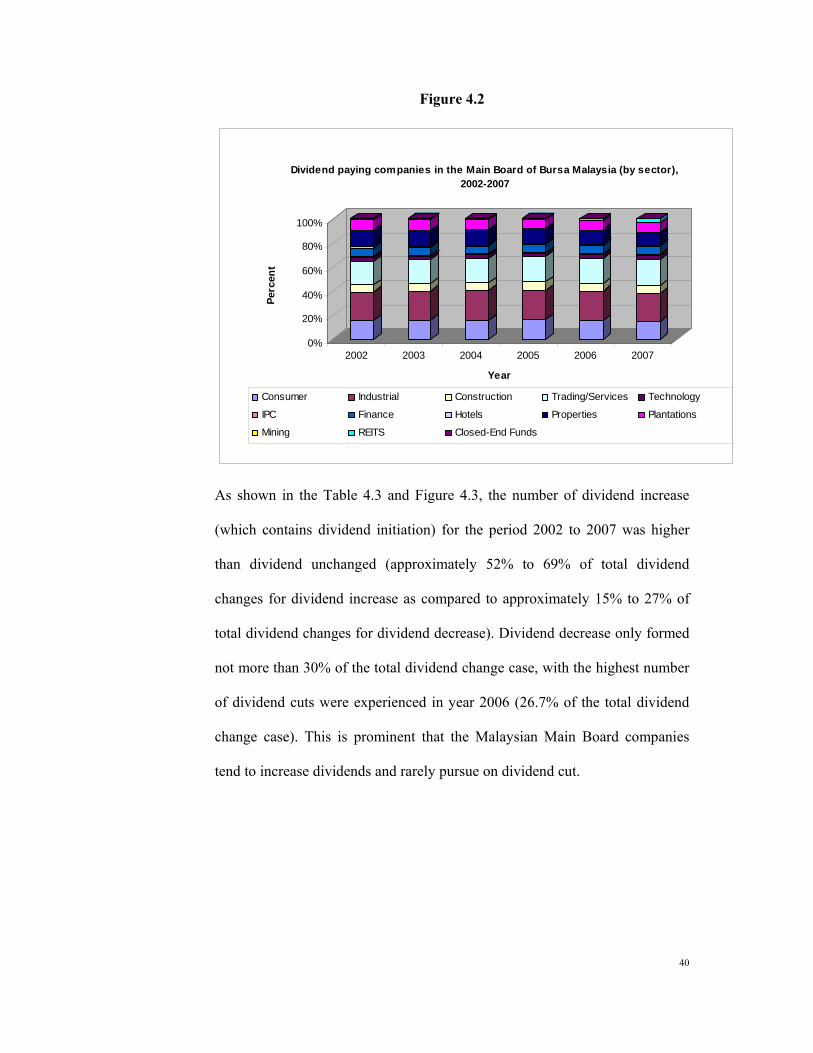
Table 4.2 Percentage of dividend paying companies by sector (Year 2002-2007)
Year 2002 2003 2004 2005 2006 2007 Sector % % % % % %Consumer 80.3 87.0 81.0 88.0 85.5 85.5Industrial 70.8 71.1 73.0 74.5 74.3 74.3Construction 59.4 64.9 65.0 77.5 68.3 71.1Trading/Services 60.6 62.5 65.9 70.2 68.7 70.8Technology 91.7 71.4 81.3 76.5 82.4 82.4IPC 33.3 33.3 33.3 42.9 71.4 75.0Finance 71.4 69.4 75.0 79.5 82.1 82.5Hotels 60.0 60.0 60.0 60.0 60.0 60.0Properties 59.7 61.4 59.8 62.5 60.2 59.3Plantations 76.3 80.0 80.0 80.0 79.1 80.4Mining 0.0 100.0 100.0 100.0 100.0 100.0REITS 100.0 100.0 100.0 40.0 55.6 76.5Closed-End Funds 0.0 0.0 100.0 0.0 50.0 50.0Total dividend paying companies 67.6 69.4 70.5 73.6 72.8 75.0
40
Figure 4.2
0%
20%
40%
60%
80%
100%
P erc
e nt
2002 2003 2004 2005 2006 2007
Year
Dividend paying companies in the Main Board of Bursa Malaysia (by sector), 2002-2007
Consumer Industrial Construction Trading/Services Technology
IPC Finance Hotels Properties Plantations
Mining REITS Closed-End Funds
As shown in the Table 4.3 and Figure 4.3, the number of dividend increase
(which contains dividend initiation) for the period 2002 to 2007 was higher
than dividend unchanged (approximately 52% to 69% of total dividend
changes for dividend increase as compared to approximately 15% to 27% of
total dividend changes for dividend decrease). Dividend decrease only formed
not more than 30% of the total dividend change case, with the highest number
of dividend cuts were experienced in year 2006 (26.7% of the total dividend
change case). This is prominent that the Malaysian Main Board companies
tend to increase dividends and rarely pursue on dividend cut.
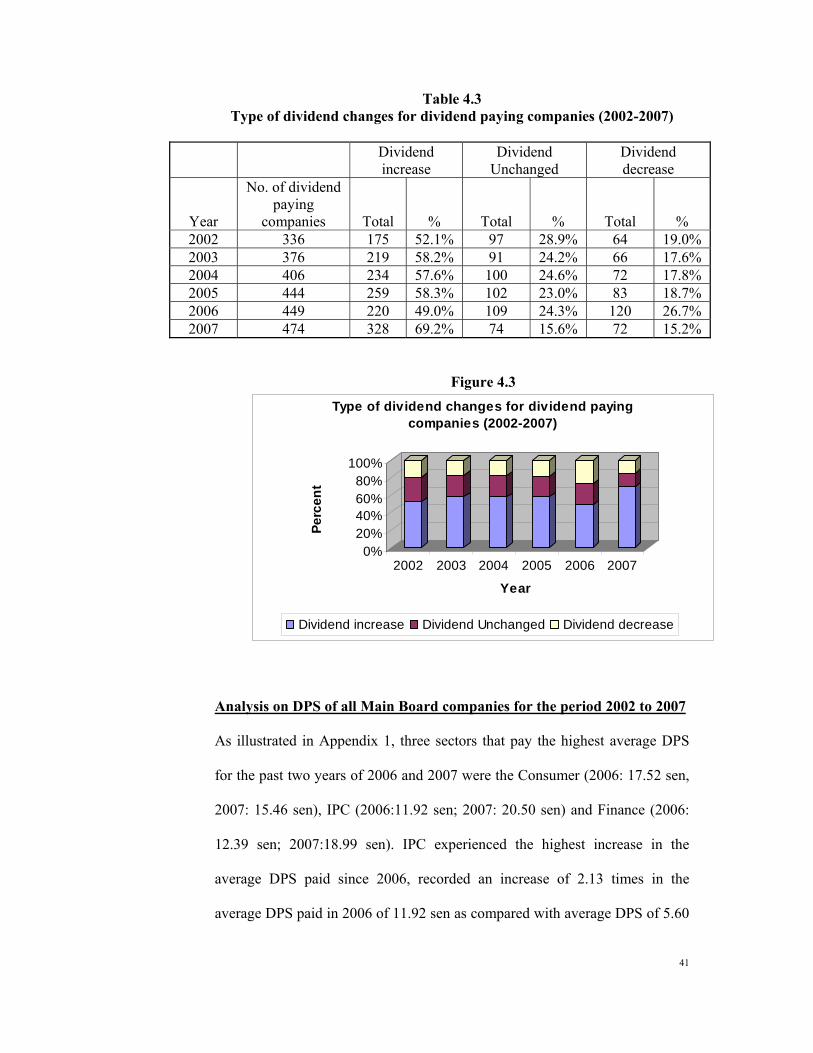
41
Table 4.3 Type of dividend changes for dividend paying companies (2002-2007)
Dividend increase
Dividend Unchanged
Dividend decrease
Year
No. of dividend paying
companies Total % Total % Total % 2002 336 175 52.1% 97 28.9% 64 19.0% 2003 376 219 58.2% 91 24.2% 66 17.6% 2004 406 234 57.6% 100 24.6% 72 17.8% 2005 444 259 58.3% 102 23.0% 83 18.7% 2006 449 220 49.0% 109 24.3% 120 26.7% 2007 474 328 69.2% 74 15.6% 72 15.2%
Figure 4.3
0%20%40%60%80%
100%
Perc
ent
2002 2003 2004 2005 2006 2007
Year
Type of dividend changes for dividend paying companies (2002-2007)
Dividend increase Dividend Unchanged Dividend decrease
Analysis on DPS of all Main Board companies for the period 2002 to 2007 As illustrated in Appendix 1, three sectors that pay the highest average DPS
for the past two years of 2006 and 2007 were the Consumer (2006: 17.52 sen,
2007: 15.46 sen), IPC (2006:11.92 sen; 2007: 20.50 sen) and Finance (2006:
12.39 sen; 2007:18.99 sen). IPC experienced the highest increase in the
average DPS paid since 2006, recorded an increase of 2.13 times in the
average DPS paid in 2006 of 11.92 sen as compared with average DPS of 5.60
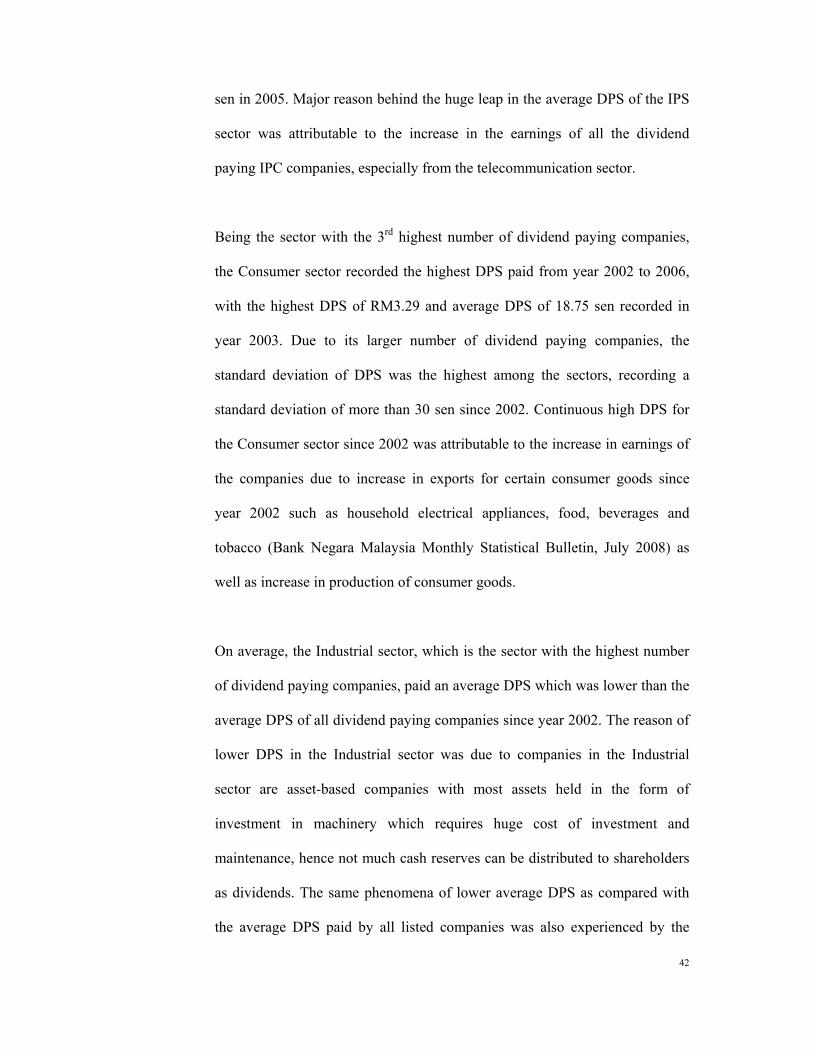
42
sen in 2005. Major reason behind the huge leap in the average DPS of the IPS
sector was attributable to the increase in the earnings of all the dividend
paying IPC companies, especially from the telecommunication sector.
Being the sector with the 3rd highest number of dividend paying companies,
the Consumer sector recorded the highest DPS paid from year 2002 to 2006,
with the highest DPS of RM3.29 and average DPS of 18.75 sen recorded in
year 2003. Due to its larger number of dividend paying companies, the
standard deviation of DPS was the highest among the sectors, recording a
standard deviation of more than 30 sen since 2002. Continuous high DPS for
the Consumer sector since 2002 was attributable to the increase in earnings of
the companies due to increase in exports for certain consumer goods since
year 2002 such as household electrical appliances, food, beverages and
tobacco (Bank Negara Malaysia Monthly Statistical Bulletin, July 2008) as
well as increase in production of consumer goods.
On average, the Industrial sector, which is the sector with the highest number
of dividend paying companies, paid an average DPS which was lower than the
average DPS of all dividend paying companies since year 2002. The reason of
lower DPS in the Industrial sector was due to companies in the Industrial
sector are asset-based companies with most assets held in the form of
investment in machinery which requires huge cost of investment and
maintenance, hence not much cash reserves can be distributed to shareholders
as dividends. The same phenomena of lower average DPS as compared with
the average DPS paid by all listed companies was also experienced by the
43
Trading / Services sector since year 2003.
Companies in the Technology and Hotels sectors experienced quite stable
average DPS for the past 3 years since 2005 as shown by the standard
deviation of DPS in these sectors. The Technology sector recorded an average
DPS between 7.5 to 8 sen with a standard deviation of 10 sen for 3
consecutive years, while the Hotel sector continued to record an average DPS
of 3 sen per share with a standard deviation of between 2.3 sen to 2.5 sen for
the past 3 years since 2005.
On average, the average DPS of the Property sector were lower than the
average DPS paid by all Main Board listed companies for the past 6 years due
to its higher cash flow requirement to finance the property development
projects. An interesting trend discovered for the dividend payment trend of the
companies in the Properties sector in the period of 2002 to 2007 was that this
sector tends to maintain its dividend payment for the 2 consecutive years and
revise after each 2 years. In the period of 2002 to 2003, the average DPS was 4
sen with a standard deviation of 5 sen. For the period of 2004 to 2005, the
average DPS recorded was between 5 sen to 6 sen, with a standard deviation
of 5 to 6 sen, while for the period of 2006 to 2007, the average DPS was
between 6 to 7 sen with standard deviation of 8 sen. Overall the Properties
sector experienced continuous increase in dividend payment from year to year.
Based on the above analysis on the trend of DPS amongst the sectors, the
variations in the DPS amongst the sectors can be attributable to the following

44
factors:-
a) Industry effect as companies within the same industry or sector tend to
adjust their dividend in tandem with the industry norms.
b) Difference in the financial performance of the industries / sectors,
attributable to the change in economic landscape and government
policies. For instance, expected slowdown in the world economies
such as the United States which is the major importer of electronic and
electrical products. The slowdown of the economy in the United States
may affect the revenue of Industrial sector due to decrease in exports.
Should the government emphasized on domestic oriented growth rather
than export oriented growth in the economy by stimulating private
consumptions, the revenues of companies in the Industrial sector may
be severely affected while the companies under the Consumer sector
will benefit from the increase in consumer expenditures. Differences
in the financial performance of these 2 sectors will further cause the
dividend of these sectors vary, in which Industrial sector will
experience lower DPS as compared with higher DPS of the Consumer
sector.
c) Nature of the industry whether the industry is an asset-based or capital-
intensive industry which requires huge investments in assets such as
machinery. Such sectors (for instance Industrial and Property sectors)
require large amount of cash to be invested in fixed assets and hence
lower dividends are paid as compared with less capital-intensive
industry such as Finance sector.
45
Figure 4.4
Analysis of DPR of all Main Board companies for the period 2002 to 2007 As shown in Appendix 2, the average market DPR for all Main Board listed
companies showed a volatile trend. Average market DPR of all the dividend
paying companies listed on the Main Board experienced huge variance in year
2002 to 2003, with the highest DPR recorded in year 2003 (average market
DPR was 0.56). Subsequently after year 2003, the average market DPR of the
Main Board listed companies decreased due to the unfavorable economy
outlook of the Malaysia economy in which the real GDP fall below 6% for 2
consecutive years after year 2004. For the period of year 2004 to 2005,
average market DPR was below 0.40 (2004: 0.36; 2005: 0.32). Following the
Average DPS of Main Board Companies, categorized by sector (2002-2007)
0
5
10
15
20
25
2002 2003 2004 2005 2006 2007
Year
RM
(sen
)
Consumer Industrial ConstructionTrading/Services Technology IPCFinance Hotels PropertiesPlantations Mining REITSClosed-End Funds Main Board Companies
46
drop in the average market DPR in year 2004 and 2005, the average market
DPR started to increase to more than 0.50 for year 2006 and 2007, due to
favorable stock market condition. During this period, the Kuala Lumpur
Composite Index recorded more than 1,000 points (2006: 1,096.24; 2007:
1,445.03).
Overall, the average DPR of the 3 major sectors with the highest number of
dividend paying companies, namely the Industrial, Trading / Services and
Consumer sector for the past 2 years since 2006 were in tandem with the
average DPR of all the Main Board companies of between 0.50 to 0.60.
Observation on the DPR trends on these 3 major dividend paying sectors from
year 2002 to 2007 showed that the DPR trends were very volatile, especially
between the period 2002 to 2004 in which these sectors experienced the same
volatile swing in the market DPR. Trading/ Services sector, for instance,
experienced huge decrease in the average DPR from 0.57 to 0.28 between the
period of 2002 and 2003.
The average DPR of Construction sector was below the average DPR of the
overall Main Board companies, recorded an average DPR of between 0.31 to
0.38 since 2006 as compared with the average market DPR of between 0.5 to
0.54 for the past 2 years.
Technology, IPC, Hotels and Mining sectors continued to experience decrease
in the DPR year to year for the past 3 years since 2005. The average DPR of
the Technology sector was very low in the period of 2002 to 2003 but started
47
to pick up in year 2004, recorded the highest average DPR of 0.56 in year
2005 and started to decrease year to year after year 2005. Although the trend
of average DPR for the IPC and Hotels sectors were not as volatile as the
Technology sector, however, the average DPR of these sectors were lower
than the overall average DPR across the Main Board companies for the past 2
years since 2006. For the Plantation sector, the highest average DPR of 0.65
were recorded in year 2005 but started to decrease thereafter with its average
DPS in year 2006 and 2007 fall below the average market DPR of 0.50.
Finance sector was one of sectors with the most volatile average DPR across
the years since 2002 and its average industry DPR trend were not in tandem
with the overall market DPR. The highest average DPR recorded was 0.84 in
year 2002 while there were two-year record of negative average DPR in year
2003 and 2005 (2003:-0.07; 2005:-1.33). The negative value of DPR indicates
that on average, companies within the Finance sector pay dividends despite of
their negative earnings before extraordinary items recorded in these years.
Dividend payments were made despite of losses experienced by companies in
the Finance sector mainly due to the fulfillment of shareholders’ requirements
for higher dividends attributable to slowdown in the economy. Real GDP
growth in year 2003 and 2005 were 5.8% and 5.3% respectively, which were
lower than the 6.8% real GDP growth in year 2004. In addition, the overall
stock market performance of the Kuala Lumpur Stock Exchange was below
the 1,000 points. For instance the Kuala Lumpur Composite Index (KLCI)
recorded in year 2003 and 2005 were 793.94 and 899.79 respectively, which
were lower than the KLCI of 907.43 recorded in year 2004. In view of the
48
unfavorable economy and stock market condition, we can conclude that the
payment of dividend despite of losses experienced by most finance companies
can be attributable to the fulfillment of investors’ demand for higher dividend
to offset their capital losses in the stock market.
Average DPR for the Properties sector was in tandem with the overall market
trend of DPR for the period between 2002 to 2007, with the lowest average
DPR of 0.16 recorded in year 2004 and quite stable at the average DPR of
between 0.40 to 0.60 for the past 3 years since 2005.
The average DPR of companies under the REITS and Closed-End Funds were
above the overall market DPR, with the average DPR of these sectors for the
past 3 years at approximately 0.70 as compared with the average market DPR
of approximately 0.50.
A further comparison with the average DPR of listed companies listed in the
Kuala Lumpur Stock Exchange in the 1980s and early 1990s done by Isa
(1993) is showed in the Figure 4.5.
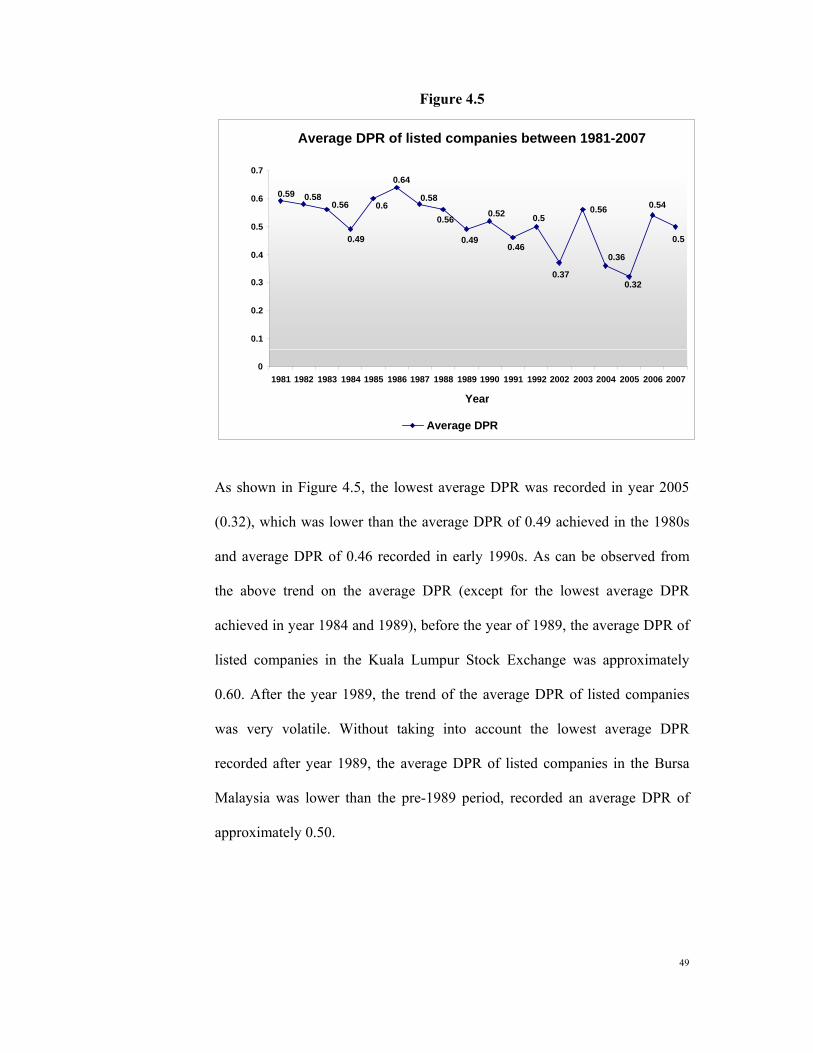
49
Figure 4.5
As shown in Figure 4.5, the lowest average DPR was recorded in year 2005
(0.32), which was lower than the average DPR of 0.49 achieved in the 1980s
and average DPR of 0.46 recorded in early 1990s. As can be observed from
the above trend on the average DPR (except for the lowest average DPR
achieved in year 1984 and 1989), before the year of 1989, the average DPR of
listed companies in the Kuala Lumpur Stock Exchange was approximately
0.60. After the year 1989, the trend of the average DPR of listed companies
was very volatile. Without taking into account the lowest average DPR
recorded after year 1989, the average DPR of listed companies in the Bursa
Malaysia was lower than the pre-1989 period, recorded an average DPR of
approximately 0.50.
Average DPR of listed companies between 1981-2007
0.56
0.5
0.54
0.32
0.36
0.37
0.5
0.46
0.52
0.49
0.56
0.58
0.64
0.6
0.49
0.560.580.59
0
0.1
0.2
0.3
0.4
0.5
0.6
0.7
1981 1982 1983 1984 1985 1986 1987 1988 1989 1990 1991 1992 2002 2003 2004 2005 2006 2007
Year
Average DPR
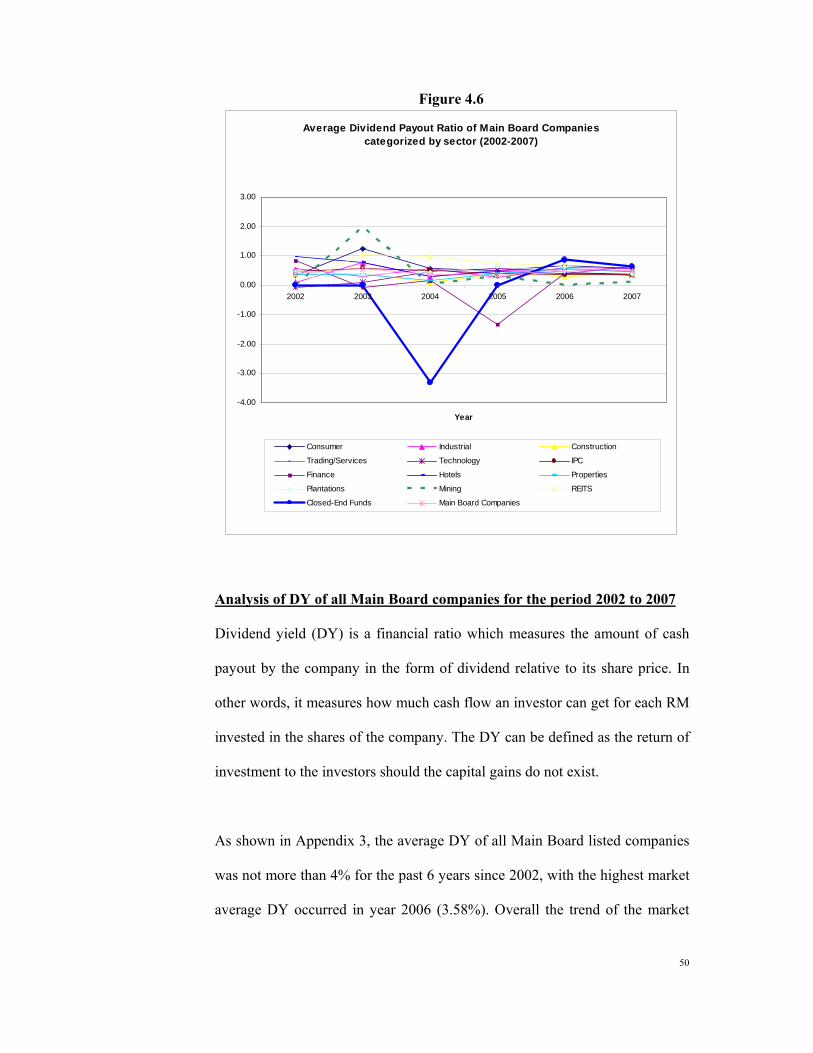
50
Figure 4.6
Average Dividend Payout Ratio of Main Board Companies categorized by sector (2002-2007)
-4.00
-3.00
-2.00
-1.00
0.00
1.00
2.00
3.00
2002 2003 2004 2005 2006 2007
Year
Consumer Industrial Construction
Trading/Services Technology IPC
Finance Hotels Properties
Plantations Mining REITS
Closed-End Funds Main Board Companies
Analysis of DY of all Main Board companies for the period 2002 to 2007
Dividend yield (DY) is a financial ratio which measures the amount of cash
payout by the company in the form of dividend relative to its share price. In
other words, it measures how much cash flow an investor can get for each RM
invested in the shares of the company. The DY can be defined as the return of
investment to the investors should the capital gains do not exist.
As shown in Appendix 3, the average DY of all Main Board listed companies
was not more than 4% for the past 6 years since 2002, with the highest market
average DY occurred in year 2006 (3.58%). Overall the trend of the market
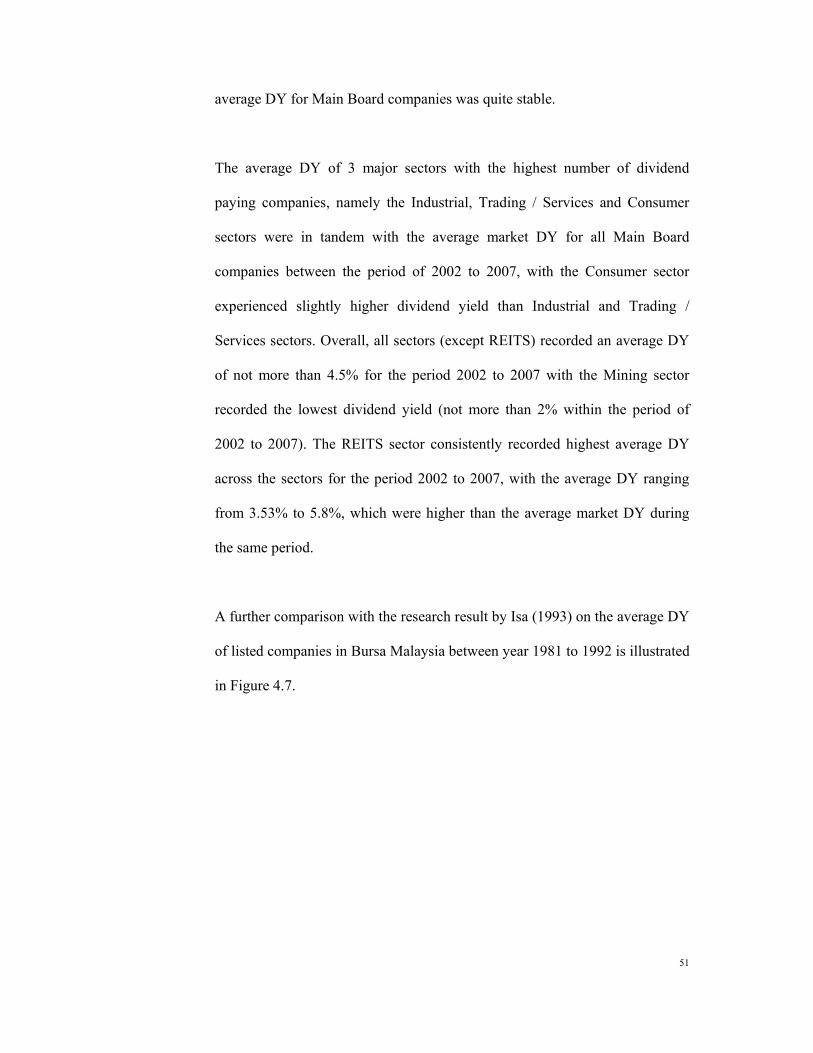
51
average DY for Main Board companies was quite stable.
The average DY of 3 major sectors with the highest number of dividend
paying companies, namely the Industrial, Trading / Services and Consumer
sectors were in tandem with the average market DY for all Main Board
companies between the period of 2002 to 2007, with the Consumer sector
experienced slightly higher dividend yield than Industrial and Trading /
Services sectors. Overall, all sectors (except REITS) recorded an average DY
of not more than 4.5% for the period 2002 to 2007 with the Mining sector
recorded the lowest dividend yield (not more than 2% within the period of
2002 to 2007). The REITS sector consistently recorded highest average DY
across the sectors for the period 2002 to 2007, with the average DY ranging
from 3.53% to 5.8%, which were higher than the average market DY during
the same period.
A further comparison with the research result by Isa (1993) on the average DY
of listed companies in Bursa Malaysia between year 1981 to 1992 is illustrated
in Figure 4.7.
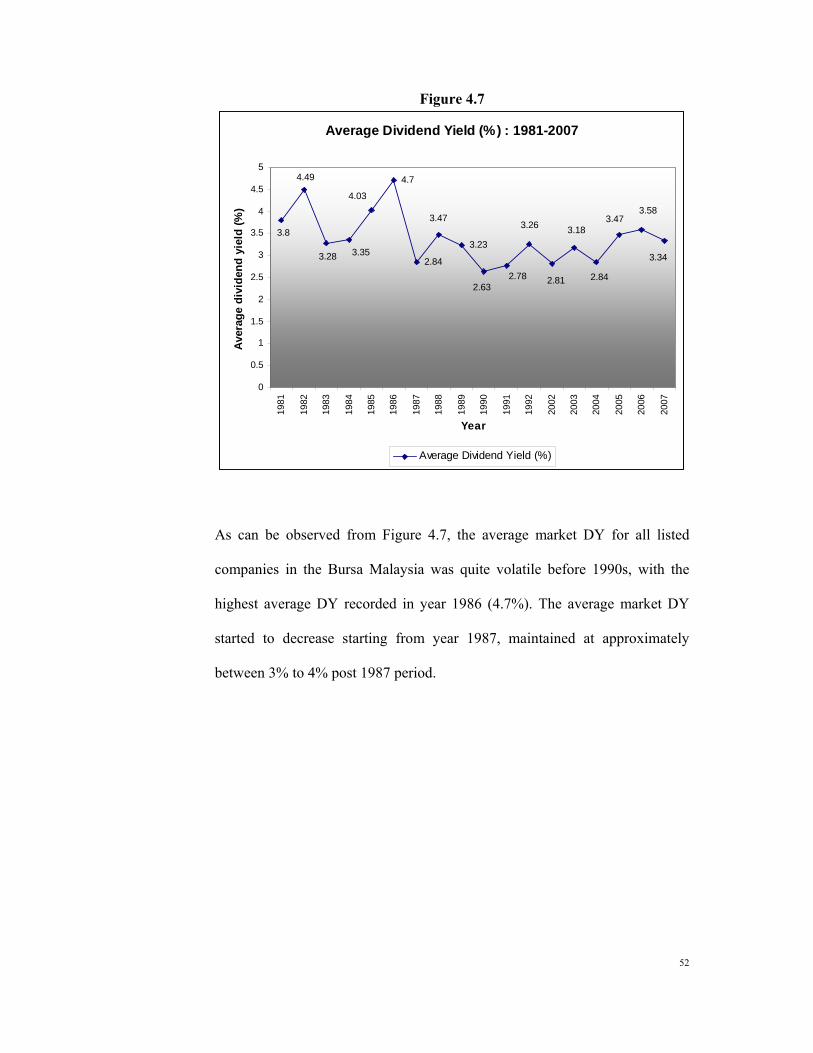
52
Figure 4.7
Average Dividend Yield (%) : 1981-2007
4.7
2.84
3.233.34
3.583.47
2.84
3.18
2.81
3.26
2.782.63
3.47
4.03
3.353.28
4.49
3.8
0
0.5
1
1.5
2
2.5
3
3.5
4
4.5
5
1981
1982
1983
1984
1985
1986
1987
1988
1989
1990
1991
1992
2002
2003
2004
2005
2006
2007
Year
Aver
age
divi
dend
yie
ld (%
)
Average Dividend Yield (%)
As can be observed from Figure 4.7, the average market DY for all listed
companies in the Bursa Malaysia was quite volatile before 1990s, with the
highest average DY recorded in year 1986 (4.7%). The average market DY
started to decrease starting from year 1987, maintained at approximately
between 3% to 4% post 1987 period.
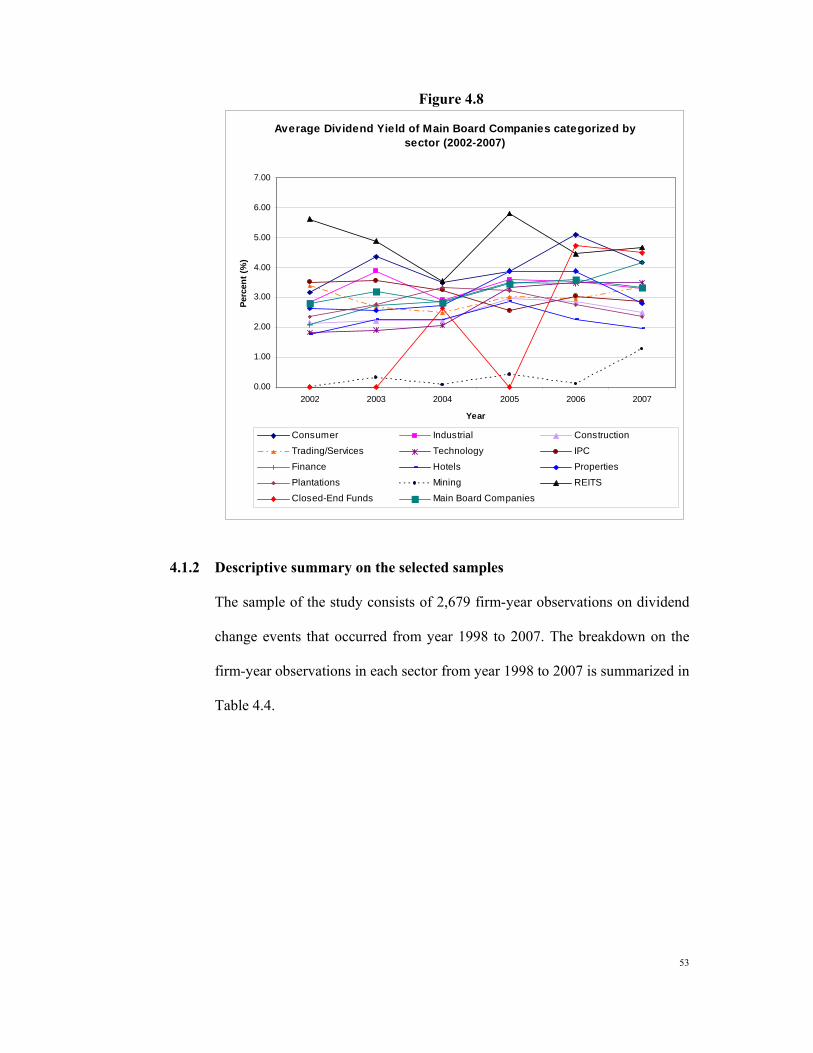
53
Figure 4.8
Average Dividend Yield of Main Board Companies categorized by sector (2002-2007)
0.00
1.00
2.00
3.00
4.00
5.00
6.00
7.00
2002 2003 2004 2005 2006 2007
Year
Perc
ent (
%)
Consumer Industrial Construction
Trading/Services Technology IPC
Finance Hotels Properties
Plantations Mining REITSClosed-End Funds Main Board Companies
4.1.2 Descriptive summary on the selected samples
The sample of the study consists of 2,679 firm-year observations on dividend
change events that occurred from year 1998 to 2007. The breakdown on the
firm-year observations in each sector from year 1998 to 2007 is summarized in
Table 4.4.
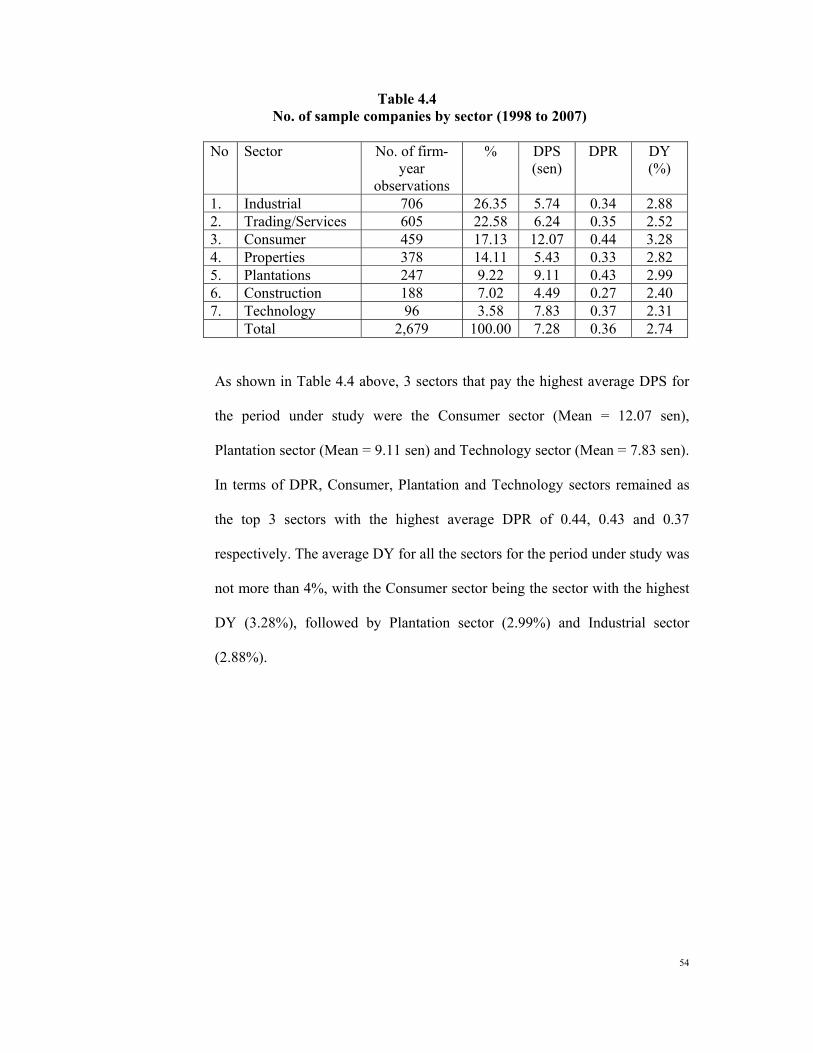
54
Table 4.4 No. of sample companies by sector (1998 to 2007)
No Sector No. of firm-
year observations
% DPS (sen)
DPR
DY (%)
1. Industrial 706 26.35 5.74 0.34 2.88 2. Trading/Services 605 22.58 6.24 0.35 2.52 3. Consumer 459 17.13 12.07 0.44 3.28 4. Properties 378 14.11 5.43 0.33 2.82 5. Plantations 247 9.22 9.11 0.43 2.99 6. Construction 188 7.02 4.49 0.27 2.40 7. Technology 96 3.58 7.83 0.37 2.31 Total 2,679 100.00 7.28 0.36 2.74
As shown in Table 4.4 above, 3 sectors that pay the highest average DPS for
the period under study were the Consumer sector (Mean = 12.07 sen),
Plantation sector (Mean = 9.11 sen) and Technology sector (Mean = 7.83 sen).
In terms of DPR, Consumer, Plantation and Technology sectors remained as
the top 3 sectors with the highest average DPR of 0.44, 0.43 and 0.37
respectively. The average DY for all the sectors for the period under study was
not more than 4%, with the Consumer sector being the sector with the highest
DY (3.28%), followed by Plantation sector (2.99%) and Industrial sector
(2.88%).
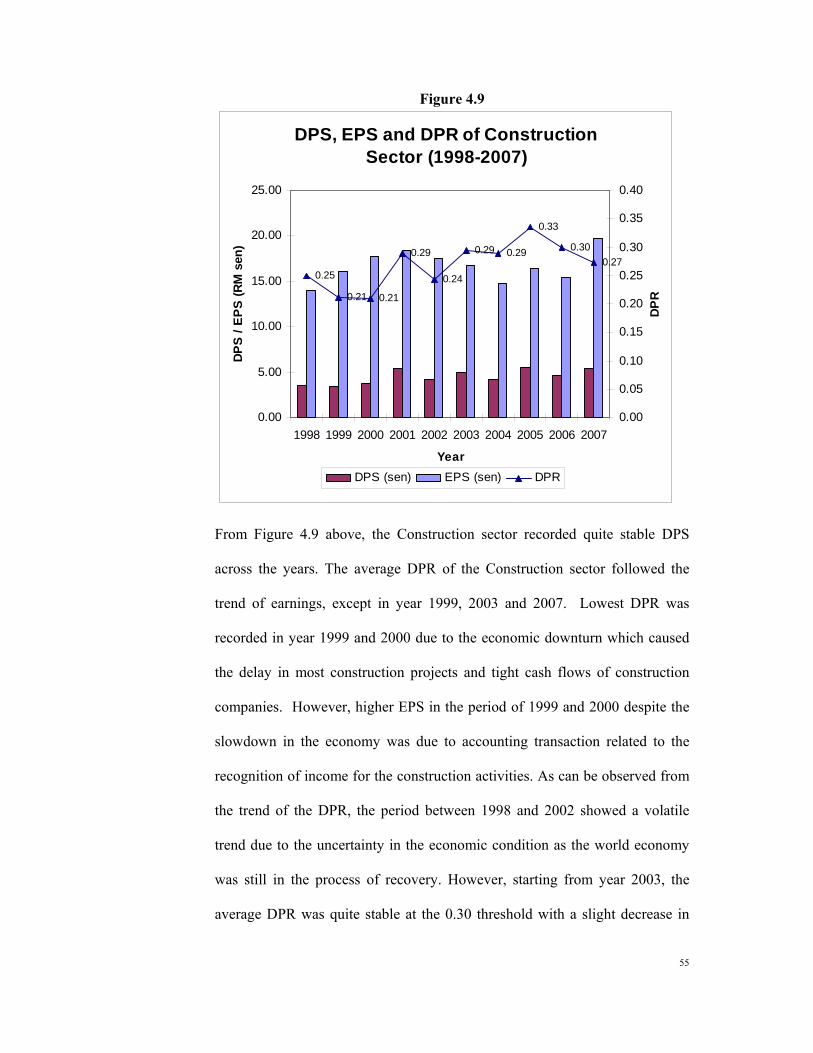
55
Figure 4.9
DPS, EPS and DPR of Construction Sector (1998-2007)
0.25
0.21 0.21
0.29
0.24
0.29 0.29
0.33
0.300.27
0.00
5.00
10.00
15.00
20.00
25.00
1998 1999 2000 2001 2002 2003 2004 2005 2006 2007
Year
DPS
/ E
PS
(RM
sen
)
0.00
0.05
0.10
0.15
0.20
0.25
0.30
0.35
0.40
DP
R
DPS (sen) EPS (sen) DPR
From Figure 4.9 above, the Construction sector recorded quite stable DPS
across the years. The average DPR of the Construction sector followed the
trend of earnings, except in year 1999, 2003 and 2007. Lowest DPR was
recorded in year 1999 and 2000 due to the economic downturn which caused
the delay in most construction projects and tight cash flows of construction
companies. However, higher EPS in the period of 1999 and 2000 despite the
slowdown in the economy was due to accounting transaction related to the
recognition of income for the construction activities. As can be observed from
the trend of the DPR, the period between 1998 and 2002 showed a volatile
trend due to the uncertainty in the economic condition as the world economy
was still in the process of recovery. However, starting from year 2003, the
average DPR was quite stable at the 0.30 threshold with a slight decrease in
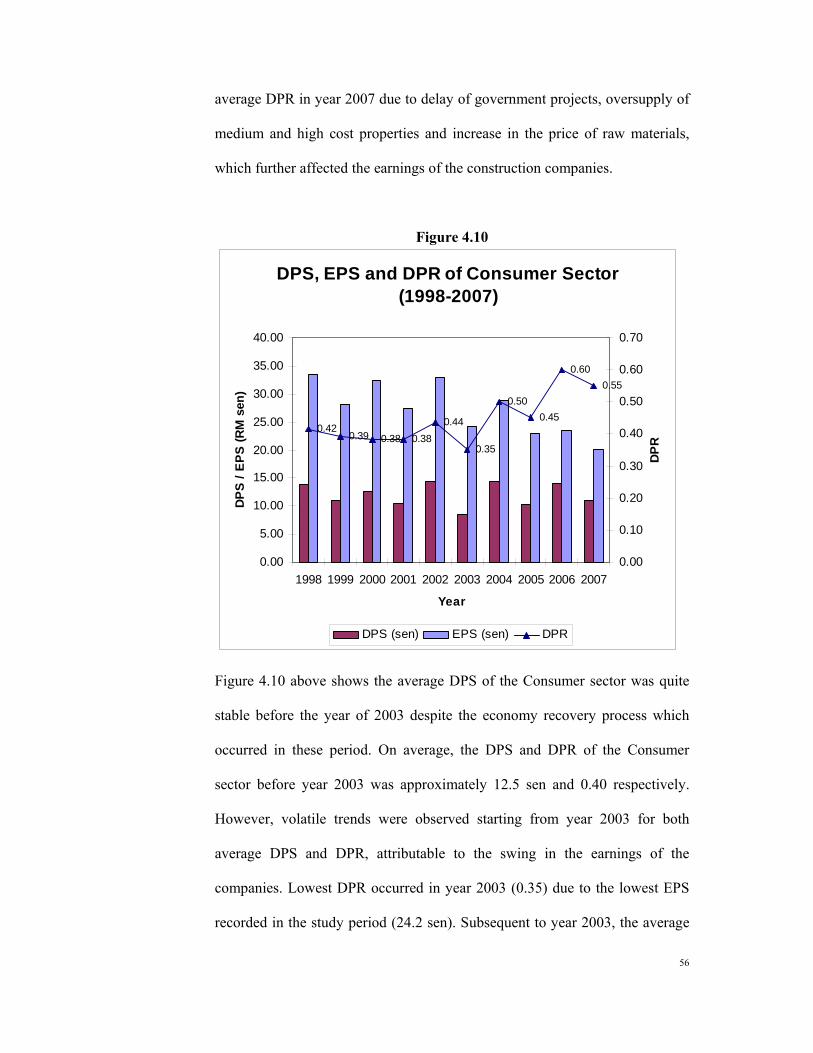
56
average DPR in year 2007 due to delay of government projects, oversupply of
medium and high cost properties and increase in the price of raw materials,
which further affected the earnings of the construction companies.
Figure 4.10
DPS, EPS and DPR of Consumer Sector (1998-2007)
0.420.39 0.38 0.38
0.44
0.35
0.500.45
0.600.55
0.00
5.00
10.00
15.00
20.00
25.00
30.00
35.00
40.00
1998 1999 2000 2001 2002 2003 2004 2005 2006 2007
Year
DP
S / E
PS
(RM
sen
)
0.00
0.10
0.20
0.30
0.40
0.50
0.60
0.70
DP
RDPS (sen) EPS (sen) DPR
Figure 4.10 above shows the average DPS of the Consumer sector was quite
stable before the year of 2003 despite the economy recovery process which
occurred in these period. On average, the DPS and DPR of the Consumer
sector before year 2003 was approximately 12.5 sen and 0.40 respectively.
However, volatile trends were observed starting from year 2003 for both
average DPS and DPR, attributable to the swing in the earnings of the
companies. Lowest DPR occurred in year 2003 (0.35) due to the lowest EPS
recorded in the study period (24.2 sen). Subsequent to year 2003, the average
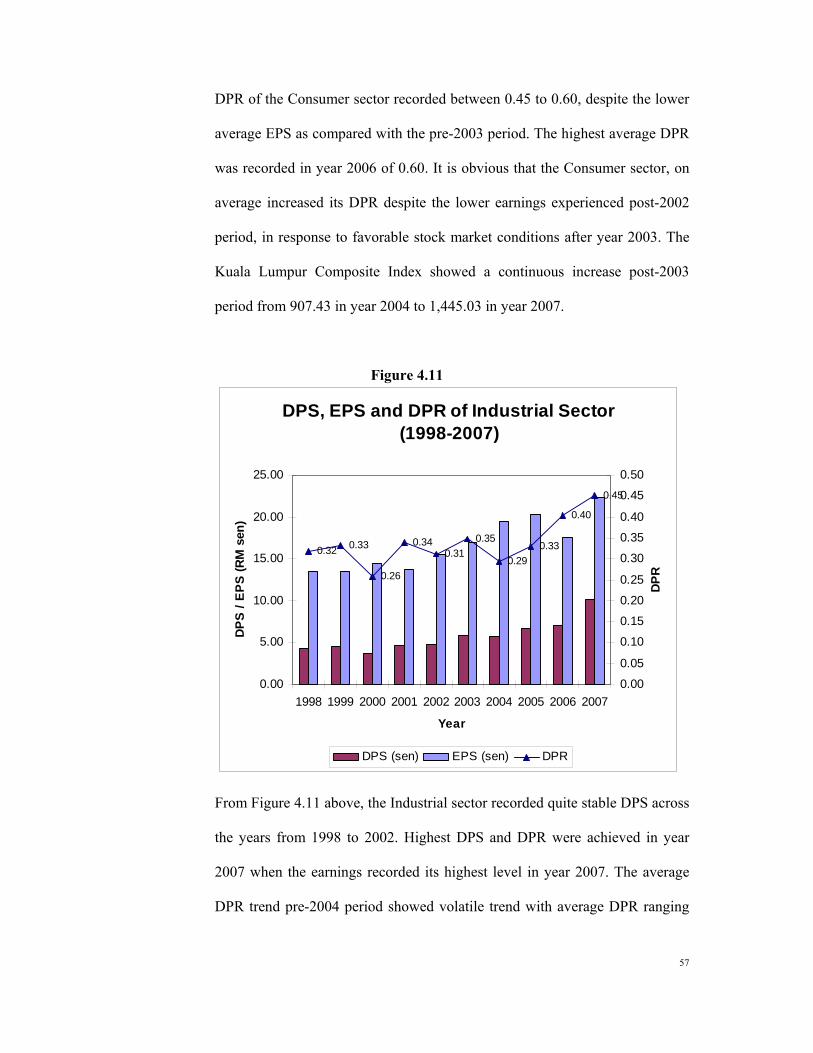
57
DPR of the Consumer sector recorded between 0.45 to 0.60, despite the lower
average EPS as compared with the pre-2003 period. The highest average DPR
was recorded in year 2006 of 0.60. It is obvious that the Consumer sector, on
average increased its DPR despite the lower earnings experienced post-2002
period, in response to favorable stock market conditions after year 2003. The
Kuala Lumpur Composite Index showed a continuous increase post-2003
period from 907.43 in year 2004 to 1,445.03 in year 2007.
Figure 4.11
DPS, EPS and DPR of Industrial Sector (1998-2007)
0.32 0.33
0.26
0.340.31
0.35
0.290.33
0.40
0.45
0.00
5.00
10.00
15.00
20.00
25.00
1998 1999 2000 2001 2002 2003 2004 2005 2006 2007
Year
DP
S /
EP
S (R
M s
en)
0.00
0.05
0.10
0.15
0.20
0.25
0.30
0.35
0.40
0.45
0.50
DPR
DPS (sen) EPS (sen) DPR
From Figure 4.11 above, the Industrial sector recorded quite stable DPS across
the years from 1998 to 2002. Highest DPS and DPR were achieved in year
2007 when the earnings recorded its highest level in year 2007. The average
DPR trend pre-2004 period showed volatile trend with average DPR ranging
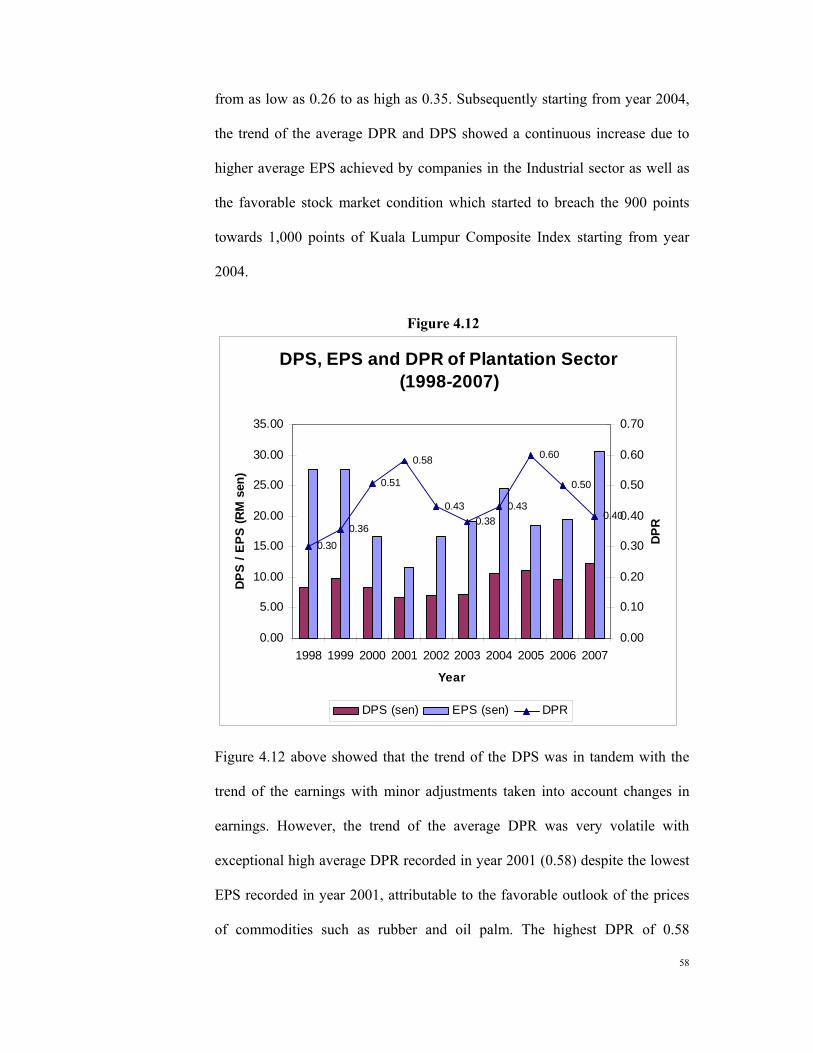
58
from as low as 0.26 to as high as 0.35. Subsequently starting from year 2004,
the trend of the average DPR and DPS showed a continuous increase due to
higher average EPS achieved by companies in the Industrial sector as well as
the favorable stock market condition which started to breach the 900 points
towards 1,000 points of Kuala Lumpur Composite Index starting from year
2004.
Figure 4.12
DPS, EPS and DPR of Plantation Sector (1998-2007)
0.300.36
0.51
0.58
0.430.38
0.43
0.60
0.50
0.40
0.00
5.00
10.00
15.00
20.00
25.00
30.00
35.00
1998 1999 2000 2001 2002 2003 2004 2005 2006 2007
Year
DP
S /
EPS
(RM
sen
)
0.00
0.10
0.20
0.30
0.40
0.50
0.60
0.70
DPR
DPS (sen) EPS (sen) DPR
Figure 4.12 above showed that the trend of the DPS was in tandem with the
trend of the earnings with minor adjustments taken into account changes in
earnings. However, the trend of the average DPR was very volatile with
exceptional high average DPR recorded in year 2001 (0.58) despite the lowest
EPS recorded in year 2001, attributable to the favorable outlook of the prices
of commodities such as rubber and oil palm. The highest DPR of 0.58
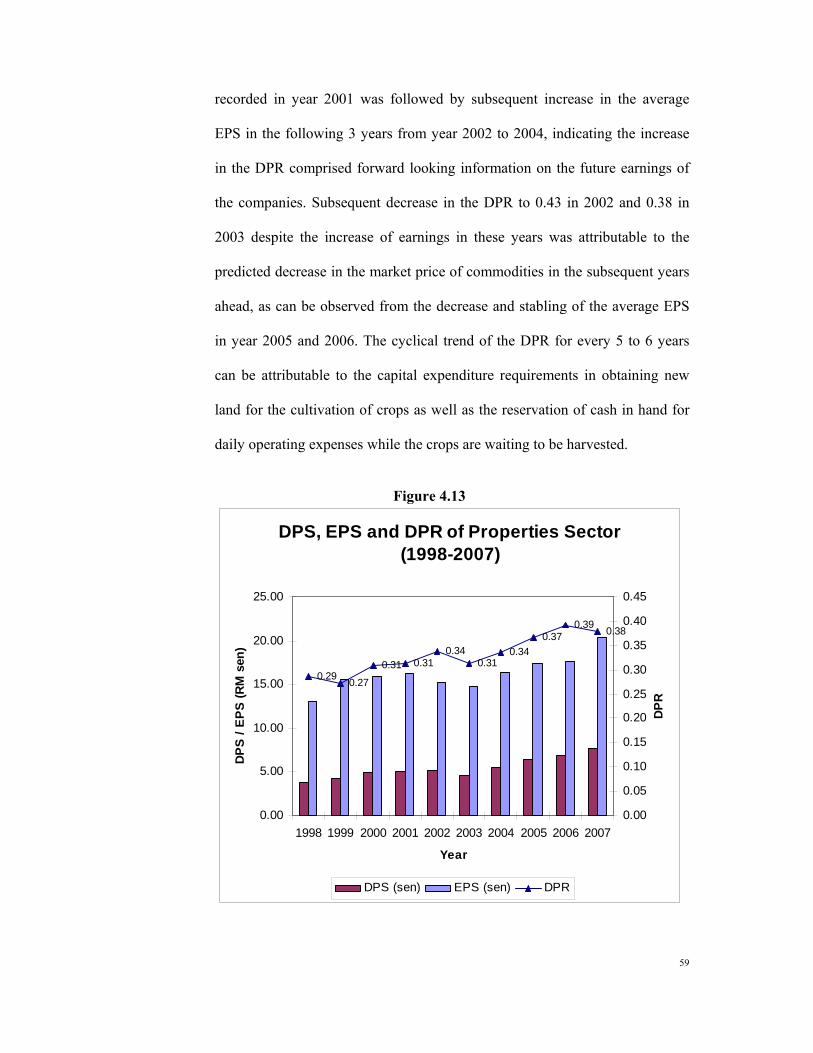
59
recorded in year 2001 was followed by subsequent increase in the average
EPS in the following 3 years from year 2002 to 2004, indicating the increase
in the DPR comprised forward looking information on the future earnings of
the companies. Subsequent decrease in the DPR to 0.43 in 2002 and 0.38 in
2003 despite the increase of earnings in these years was attributable to the
predicted decrease in the market price of commodities in the subsequent years
ahead, as can be observed from the decrease and stabling of the average EPS
in year 2005 and 2006. The cyclical trend of the DPR for every 5 to 6 years
can be attributable to the capital expenditure requirements in obtaining new
land for the cultivation of crops as well as the reservation of cash in hand for
daily operating expenses while the crops are waiting to be harvested.
Figure 4.13
DPS, EPS and DPR of Properties Sector (1998-2007)
0.29 0.27
0.31 0.310.34
0.310.34
0.370.39 0.38
0.00
5.00
10.00
15.00
20.00
25.00
1998 1999 2000 2001 2002 2003 2004 2005 2006 2007
Year
DP
S /
EP
S (R
M s
en)
0.00
0.05
0.10
0.15
0.20
0.25
0.30
0.35
0.40
0.45
DPR
DPS (sen) EPS (sen) DPR
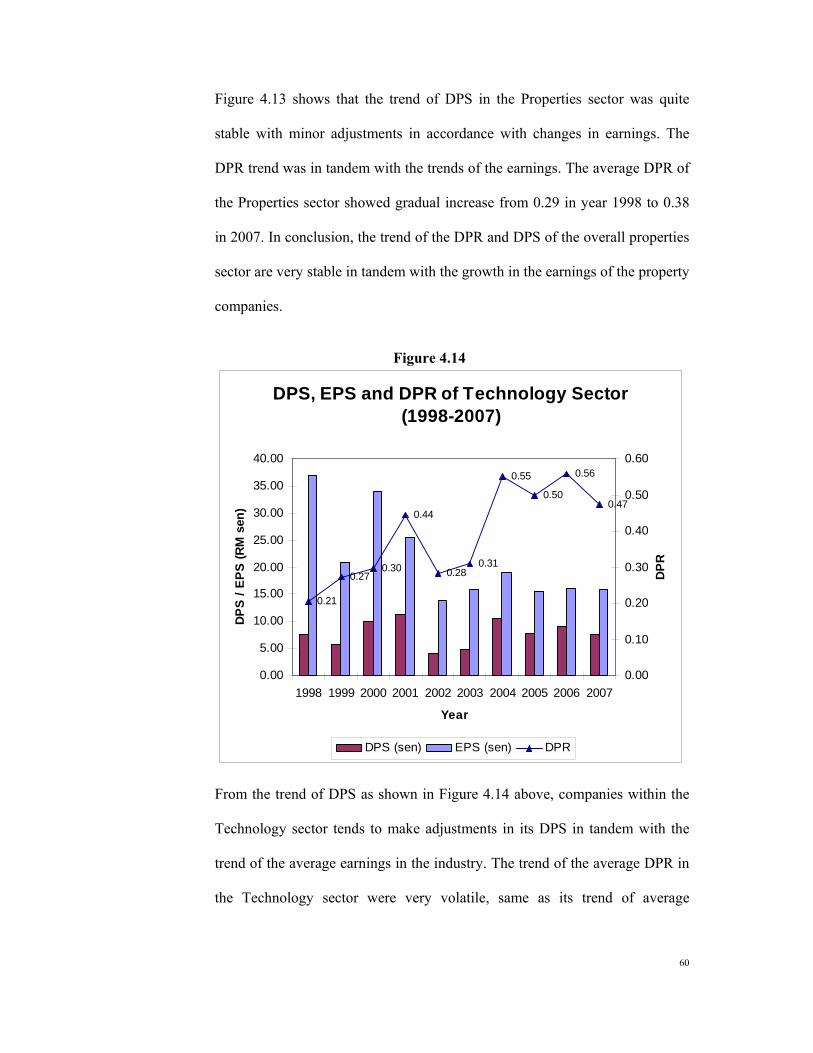
60
Figure 4.13 shows that the trend of DPS in the Properties sector was quite
stable with minor adjustments in accordance with changes in earnings. The
DPR trend was in tandem with the trends of the earnings. The average DPR of
the Properties sector showed gradual increase from 0.29 in year 1998 to 0.38
in 2007. In conclusion, the trend of the DPR and DPS of the overall properties
sector are very stable in tandem with the growth in the earnings of the property
companies.
Figure 4.14
DPS, EPS and DPR of Technology Sector (1998-2007)
0.21
0.270.30
0.44
0.280.31
0.55
0.50
0.56
0.47
0.00
5.00
10.00
15.00
20.00
25.00
30.00
35.00
40.00
1998 1999 2000 2001 2002 2003 2004 2005 2006 2007
Year
DP
S /
EPS
(RM
sen
)
0.00
0.10
0.20
0.30
0.40
0.50
0.60
DP
R
DPS (sen) EPS (sen) DPR
From the trend of DPS as shown in Figure 4.14 above, companies within the
Technology sector tends to make adjustments in its DPS in tandem with the
trend of the average earnings in the industry. The trend of the average DPR in
the Technology sector were very volatile, same as its trend of average
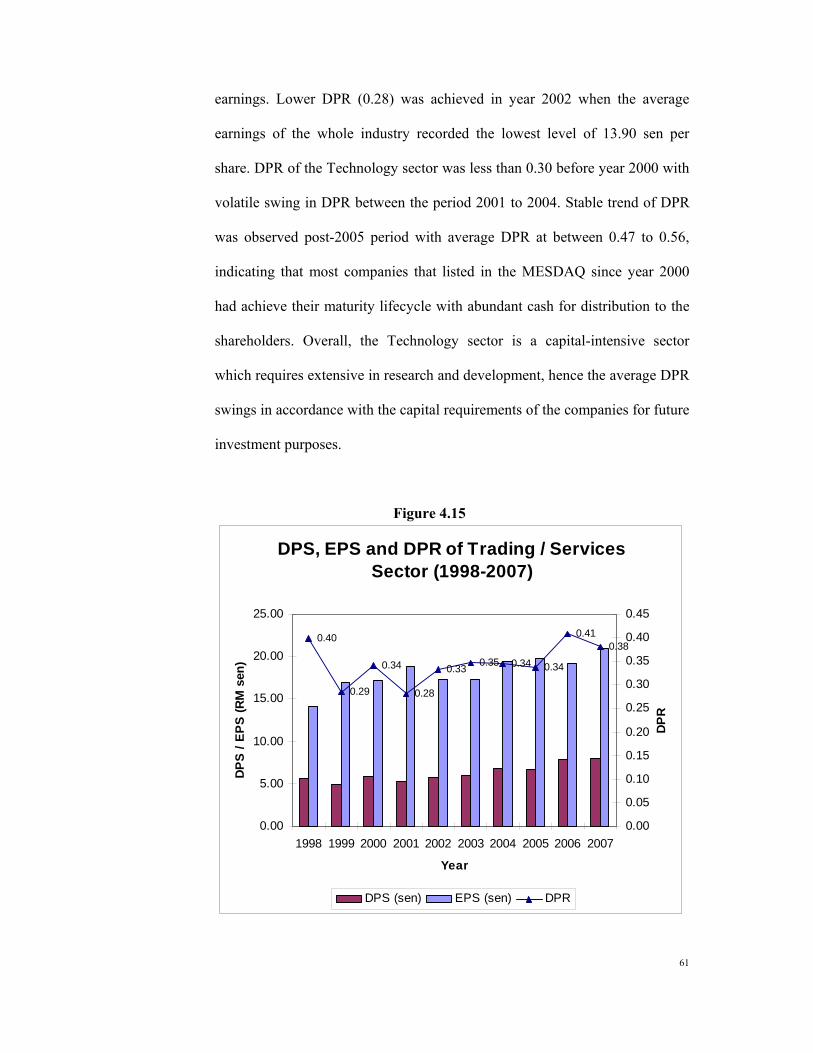
61
earnings. Lower DPR (0.28) was achieved in year 2002 when the average
earnings of the whole industry recorded the lowest level of 13.90 sen per
share. DPR of the Technology sector was less than 0.30 before year 2000 with
volatile swing in DPR between the period 2001 to 2004. Stable trend of DPR
was observed post-2005 period with average DPR at between 0.47 to 0.56,
indicating that most companies that listed in the MESDAQ since year 2000
had achieve their maturity lifecycle with abundant cash for distribution to the
shareholders. Overall, the Technology sector is a capital-intensive sector
which requires extensive in research and development, hence the average DPR
swings in accordance with the capital requirements of the companies for future
investment purposes.
Figure 4.15
DPS, EPS and DPR of Trading / Services Sector (1998-2007)
0.40
0.29
0.34
0.28
0.33 0.35 0.34 0.34
0.410.38
0.00
5.00
10.00
15.00
20.00
25.00
1998 1999 2000 2001 2002 2003 2004 2005 2006 2007
Year
DP
S /
EPS
(RM
sen
)
0.00
0.05
0.10
0.15
0.20
0.25
0.30
0.35
0.40
0.45
DP
R
DPS (sen) EPS (sen) DPR
62
As shown in Figure 4.15 above, although the earnings of the companies in the
Trading / Services sector were affected by the financial crisis in 1998 (average
EPS was 14.13 sen), however the companies in this sector still pay a
reasonable high dividend with the average DPS of 5.62 sen with average DPR
of 0.40. The average DPR was quite volatile pre-2002 period and started to
recorded stable average DPS between the period of 2002 to 2005 at
approximately 0.30 when the Kuala Lumpur Composite Index was still below
1,000 points. Subsequently after year 2005 when the Kuala Lumpur
Composite Index started to breach the 1,000 points, most companies in the
Trading and Services sector started to increase their DPR to the highest record
of 0.41 and further slightly reduced to 0.38 in year 2007 in view of the
expectation of the slowdown of the Malaysia and world economy and the
pressure of inflation.
4.2 ANALYSIS OF MEASURES
The univariate OLS Regression performed to test the relationship between changes in
dividends in year 0 (independent variable) and changes in earnings in current year 0
and subsequent 5 years from year 1 to year 5 was further elaborate as follows:-
(a) All firm-year observations for dividend change events that occurred from year
1998 to 2007. All the dividend change events were further subdivided into 2
sub-categories of dividend increase and dividend decrease to examine the
category of dividend change event which shows stronger signalling effect.
63
Regression results were elaborated in Section 4.2.1.
(b) Individual year observation on dividend change events that occurred from year
1998 to 2007. For each individual year, regressions were done on all dividend
events that occurred in that individual year. Subsequently, regression analysis
was conducted on each sub-category of dividend increase and dividend
decrease events in each individual year to examine the category of dividend
change event which shows stronger signalling effect. The reasons such a
detailed analysis was conducted was to identify whether the signalling effect
on all the firm-year observations within the study period was more strongly
affected by certain individual years. The regression results were further
discussed in Section 4.2.2.
(c) All firm-year observations for dividend events that occurred for the sub-
periods between 1998 to 2001 (financial crisis period) and between 2002 to
2007 (post-financial crisis period) to examine whether differences in the extent
of dividend signalling exists between these sub-periods. The year from 1998 to
2001 was categorized as financial crisis period due to the financial crisis
experienced in year 1997 and 1998 and low Gross Domestic Product growth in
year 2001(0.5%). During the 1997 to 2001 period, the Foreign Direct
Investments inflows continued to decrease from approximately US$7 billion
in 1997 to zero in year 2001. In year 2001, Malaysian export growth dropped
to its lowest level to -10%. The period starting from 2002 onwards was
categorized as post-financial crisis period due to the observed trend of
recovery in the economic indicators. The reasons such a detailed analysis was
conducted was to identify whether the signalling effect on all the firm-year
observations within the study period was more strongly affected by certain
64
economic conditions (financial crisis period and post financial crisis period).
Further regressions were performed on sub-category of dividend increase and
dividend decrease events that occurred in each of the sub-period. The results
of the regression performed were elaborated in Section 4.2.3.
(d) Case by case observation on all dividend change events that occurred after 2
years, 3 years and 4 years of stable DPS, in which only companies that
experienced changes in dividends after some period of stable DPS will be
selected in the studies. The purpose of such detailed observations were
performed is to examine whether the signalling effect becomes stronger should
the companies undergone stable dividend policy for a longer period of time.
All the dividend events that occurred after some period of stable DPS were
further subdivided into 2 sub-category of dividend increase and dividend
decrease to identify the extent of signalling effect of each category of dividend
change. Regression results were elaborated in Section 4.2.4.
(e) Sub-group regression on dividend change events that fall within certain
categories of dividend change (measured in percentage). The sub-group
regression analysis was performed to test whether the signalling effect
becomes stronger when the size of dividend change events becomes larger.
The categories of dividend change are:-
1) Dividend decrease ≥100%
2) Dividend decease between 50% to not more than 100%
3) Dividend decrease between 30% to not more than 50%
4) Dividend decrease more than 0% to not more than 30%
65
5) Dividend no change at 0%
6) Dividend increase more than 0% to not more than 30%
7) Dividend increase between 30% to not more than 50%
8) Dividend increase between 50% to not more than 100%
9) Dividend increase equals to or more than 100%
Regression results to test the above relationship between the size of dividend
change with the extent of dividend signalling were elaborated in Section 4.2.5.
(h) All firm year observations on dividend changes event categorised by the size
of dividend yield (measured in percentage). The sub-group regression analysis
on these different categories of dividend yield was performed to test whether
the signalling effect becomes stronger under the clientele effect in which it is
assumed that the larger the dividend yield of a company, the stronger the
signalling effect when the company changed its dividend payment. The sub-
division of dividend yield into different categories are listed below:-
(i) Dividend yield less than 1%
(ii) 1% ≤ Dividend Yield < 4%
(iii) 4% ≤ Dividend Yield < 6%
(iv) 6% ≤ Dividend Yield < 8%
(v) Dividend yield ≥ 8%
Regression results to test the above relationship between the size of dividend
yield with the extent of dividend signalling were elaborated in Section 4.2.6.
66
In addition to the univariate OLS regression, multiple regression was also performed
to test the industry effect in dividend signalling. The industry effect of three major
sectors with the highest number of dividend paying companies, namely Industrial,
Trading / Services and Consumer sector are studied by incorporating industry
dummies in the regression equation. The regression performed was further elaborated
as below:
(i) All firm-year observation for dividend events that occurred from year 1998 to
2007 by controlling the industry effect. Two sector dummy variables from the
Industrial, Trading / Services and Consumer sector were included in the
multiple regression equation. The beta coefficient generated for each of the
dummy variable is used to identify whether any differences exist between 2
sectors. Subsequent to this, all the firm year observations were further
subdivided into 2 sub-categories of dividend increase and dividend decrease to
identify the extent of signalling effect of each category of dividend change
under the influence of industry effect. The regression results were elaborated
in Section 4.2.7.
4.2.1 Analysis of Regression Result on All Firm-Year Observations
The regression equation adopted in this study is as follows:-
(EPS i,t – EPS i,t–1) / P i,0 = α0 + α1 ∆Div i,0 + ε T
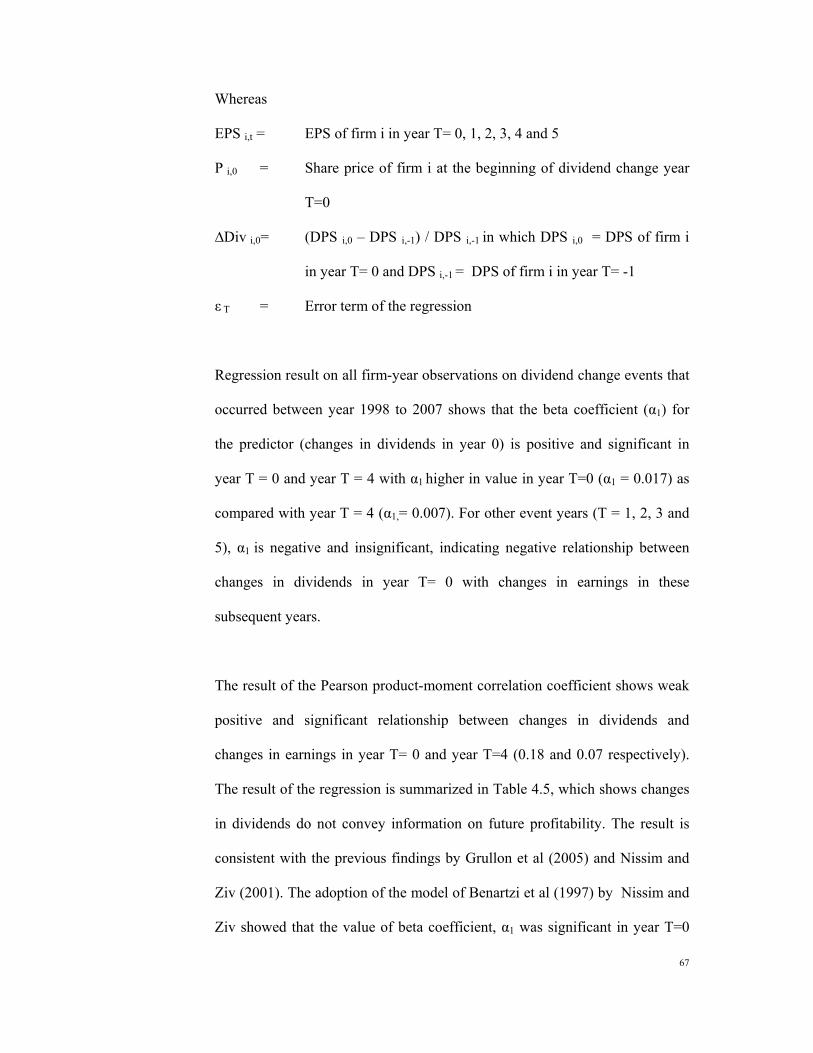
67
Whereas
EPS i,t = EPS of firm i in year T= 0, 1, 2, 3, 4 and 5
P i,0 = Share price of firm i at the beginning of dividend change year
T=0
∆Div i,0= (DPS i,0 – DPS i,-1) / DPS i,-1 in which DPS i,0 = DPS of firm i
in year T= 0 and DPS i,-1 = DPS of firm i in year T= -1
ε T = Error term of the regression
Regression result on all firm-year observations on dividend change events that
occurred between year 1998 to 2007 shows that the beta coefficient (α1) for
the predictor (changes in dividends in year 0) is positive and significant in
year T = 0 and year T = 4 with α1 higher in value in year T=0 (α1 = 0.017) as
compared with year T = 4 (α1,= 0.007). For other event years (T = 1, 2, 3 and
5), α1 is negative and insignificant, indicating negative relationship between
changes in dividends in year T= 0 with changes in earnings in these
subsequent years.
The result of the Pearson product-moment correlation coefficient shows weak
positive and significant relationship between changes in dividends and
changes in earnings in year T= 0 and year T=4 (0.18 and 0.07 respectively).
The result of the regression is summarized in Table 4.5, which shows changes
in dividends do not convey information on future profitability. The result is
consistent with the previous findings by Grullon et al (2005) and Nissim and
Ziv (2001). The adoption of the model of Benartzi et al (1997) by Nissim and
Ziv showed that the value of beta coefficient, α1 was significant in year T=0
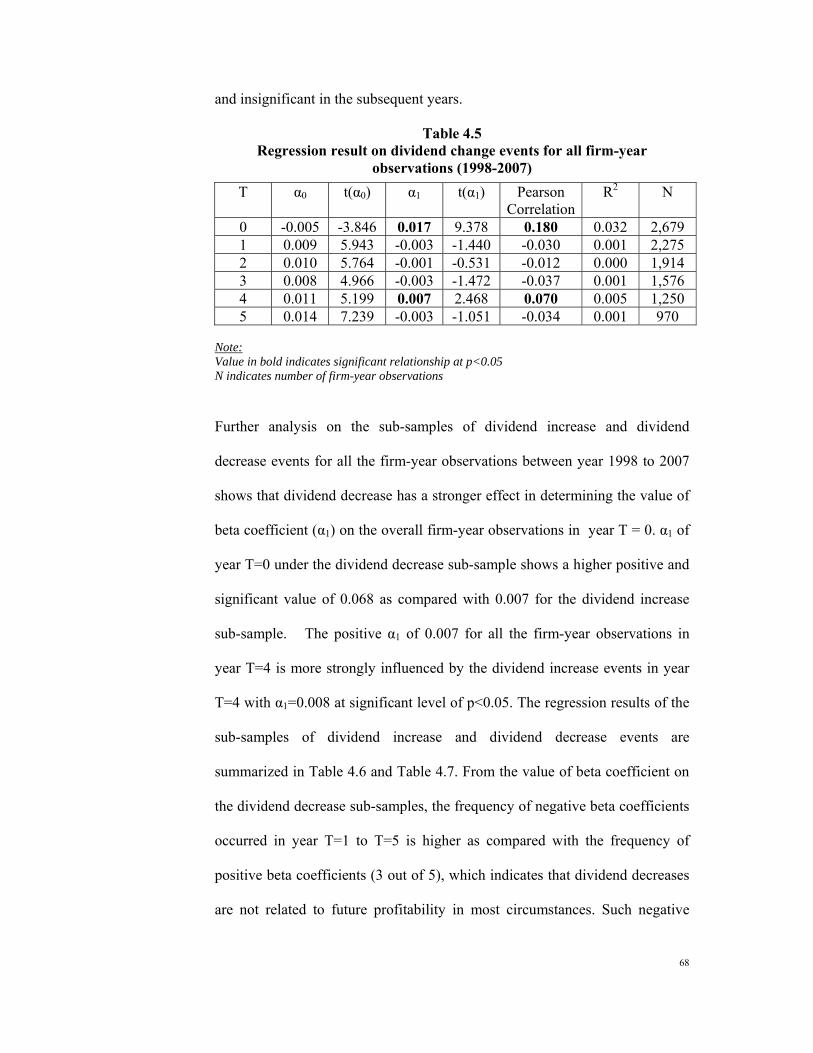
68
and insignificant in the subsequent years.
Table 4.5 Regression result on dividend change events for all firm-year
observations (1998-2007) T α0 t(α0) α1 t(α1) Pearson
Correlation R2 N
0 -0.005 -3.846 0.017 9.378 0.180 0.032 2,679 1 0.009 5.943 -0.003 -1.440 -0.030 0.001 2,275 2 0.010 5.764 -0.001 -0.531 -0.012 0.000 1,914 3 0.008 4.966 -0.003 -1.472 -0.037 0.001 1,576 4 0.011 5.199 0.007 2.468 0.070 0.005 1,250 5 0.014 7.239 -0.003 -1.051 -0.034 0.001 970
Note: Value in bold indicates significant relationship at p<0.05 N indicates number of firm-year observations
Further analysis on the sub-samples of dividend increase and dividend
decrease events for all the firm-year observations between year 1998 to 2007
shows that dividend decrease has a stronger effect in determining the value of
beta coefficient (α1) on the overall firm-year observations in year T = 0. α1 of
year T=0 under the dividend decrease sub-sample shows a higher positive and
significant value of 0.068 as compared with 0.007 for the dividend increase
sub-sample. The positive α1 of 0.007 for all the firm-year observations in
year T=4 is more strongly influenced by the dividend increase events in year
T=4 with α1=0.008 at significant level of p<0.05. The regression results of the
sub-samples of dividend increase and dividend decrease events are
summarized in Table 4.6 and Table 4.7. From the value of beta coefficient on
the dividend decrease sub-samples, the frequency of negative beta coefficients
occurred in year T=1 to T=5 is higher as compared with the frequency of
positive beta coefficients (3 out of 5), which indicates that dividend decreases
are not related to future profitability in most circumstances. Such negative
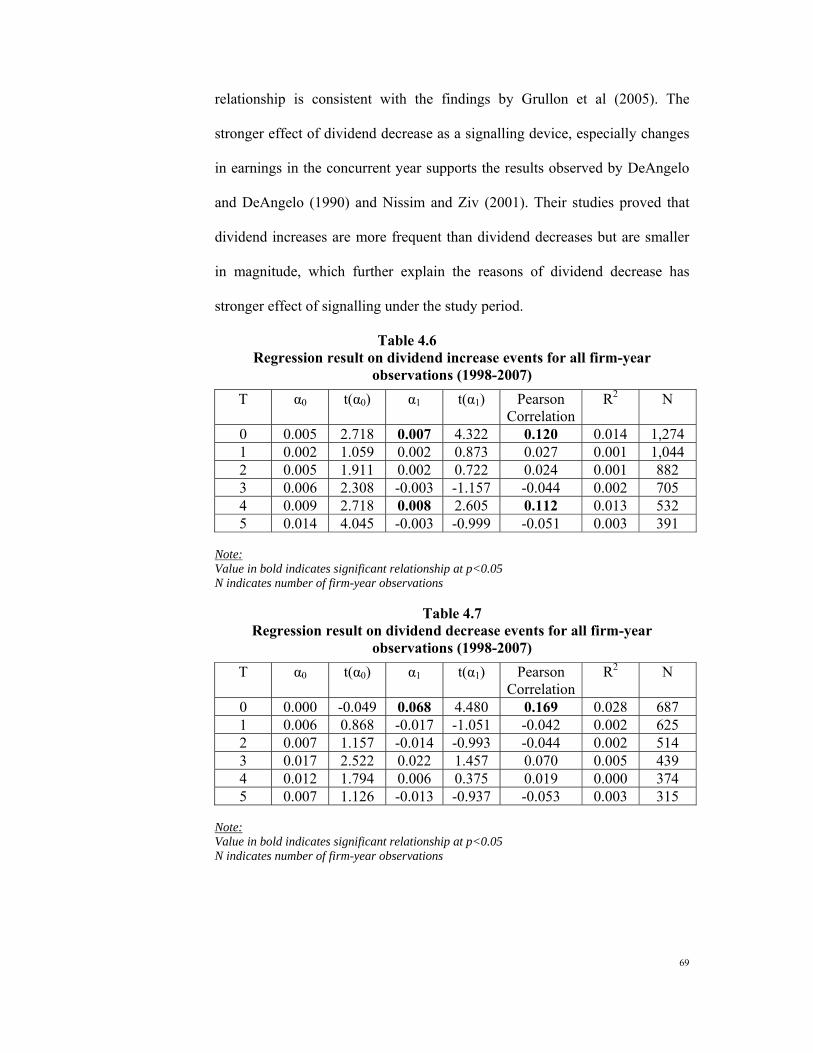
69
relationship is consistent with the findings by Grullon et al (2005). The
stronger effect of dividend decrease as a signalling device, especially changes
in earnings in the concurrent year supports the results observed by DeAngelo
and DeAngelo (1990) and Nissim and Ziv (2001). Their studies proved that
dividend increases are more frequent than dividend decreases but are smaller
in magnitude, which further explain the reasons of dividend decrease has
stronger effect of signalling under the study period.
Table 4.6 Regression result on dividend increase events for all firm-year
observations (1998-2007) T α0 t(α0) α1 t(α1) Pearson
Correlation R2 N
0 0.005 2.718 0.007 4.322 0.120 0.014 1,274 1 0.002 1.059 0.002 0.873 0.027 0.001 1,044 2 0.005 1.911 0.002 0.722 0.024 0.001 882 3 0.006 2.308 -0.003 -1.157 -0.044 0.002 705 4 0.009 2.718 0.008 2.605 0.112 0.013 532 5 0.014 4.045 -0.003 -0.999 -0.051 0.003 391
Note: Value in bold indicates significant relationship at p<0.05 N indicates number of firm-year observations
Table 4.7 Regression result on dividend decrease events for all firm-year
observations (1998-2007) T α0 t(α0) α1 t(α1) Pearson
Correlation R2 N
0 0.000 -0.049 0.068 4.480 0.169 0.028 687 1 0.006 0.868 -0.017 -1.051 -0.042 0.002 625 2 0.007 1.157 -0.014 -0.993 -0.044 0.002 514 3 0.017 2.522 0.022 1.457 0.070 0.005 439 4 0.012 1.794 0.006 0.375 0.019 0.000 374 5 0.007 1.126 -0.013 -0.937 -0.053 0.003 315
Note: Value in bold indicates significant relationship at p<0.05 N indicates number of firm-year observations
70
4.2.2 Analysis of Regression Result on Each Individual Year Observations
From Year 1998 to 2007
Regression analysis was performed on each individual year to examine the
signalling effect of changes in dividends in each individual year and to
examine which individual year has a stronger signalling effect in determining
the overall signalling effect of all the firm year observations under the period
of study.
Regression Result for Year 1998 The regression result shows strongest positive and significant relationship
between changes in dividends and changes in earnings occurred in year T=0
for all firm-year observations (α1 = 0.095), which is strongly influenced by the
dividend decrease event (α1 = 0.092, significant at p<0.05). A negative and
significant beta coefficient was recorded in year T=2 for all firm-year
observations which was strongly influenced by dividend decrease events with
a stronger negative (but insignificant) beta coefficient (α1 = -0.049, p>0.05).
Regression analysis on the sub-samples of both dividend increase and
dividend decrease showed that in most circumstances, dividend increase
(decrease) has a negative relationship with subsequent increase (decrease) in
earnings in year T=1 to T=5. Table 4.8 shows the summary of the regression
result in year 1998:-
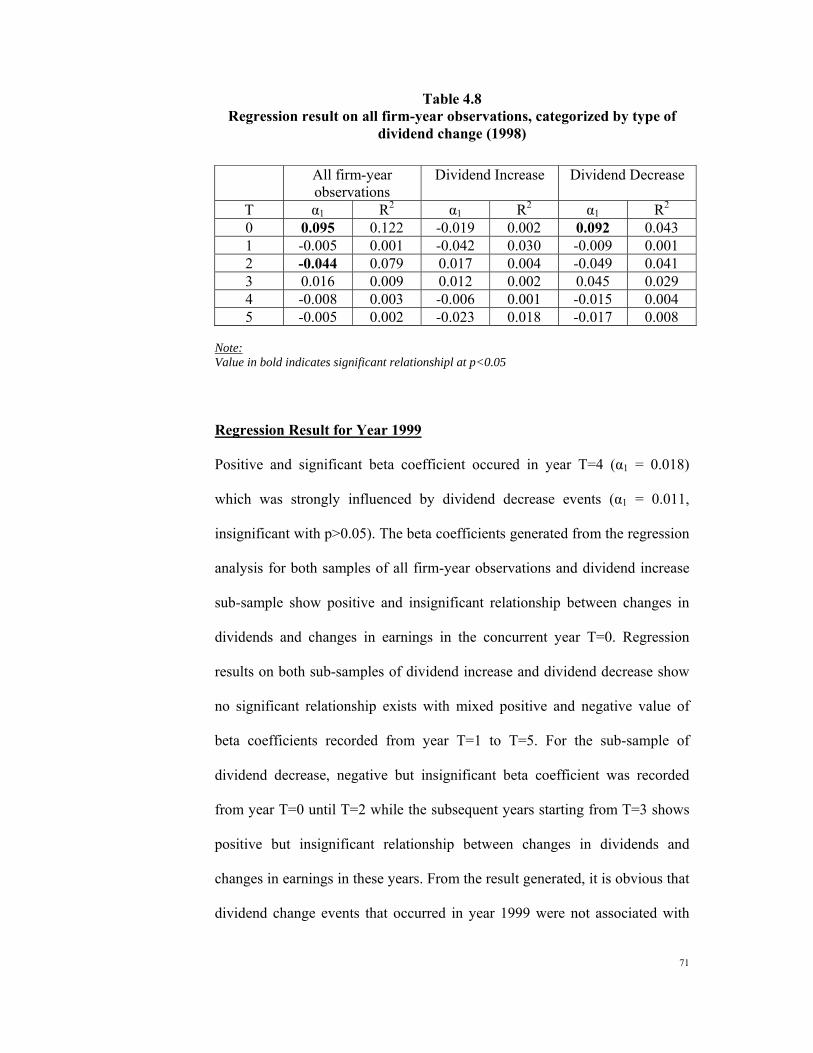
71
Table 4.8 Regression result on all firm-year observations, categorized by type of
dividend change (1998)
All firm-year observations
Dividend Increase Dividend Decrease
T α1 R2 α1 R2 α1 R2 0 0.095 0.122 -0.019 0.002 0.092 0.043 1 -0.005 0.001 -0.042 0.030 -0.009 0.001 2 -0.044 0.079 0.017 0.004 -0.049 0.041 3 0.016 0.009 0.012 0.002 0.045 0.029 4 -0.008 0.003 -0.006 0.001 -0.015 0.004 5 -0.005 0.002 -0.023 0.018 -0.017 0.008
Note: Value in bold indicates significant relationshipl at p<0.05
Regression Result for Year 1999
Positive and significant beta coefficient occured in year T=4 (α1 = 0.018)
which was strongly influenced by dividend decrease events (α1 = 0.011,
insignificant with p>0.05). The beta coefficients generated from the regression
analysis for both samples of all firm-year observations and dividend increase
sub-sample show positive and insignificant relationship between changes in
dividends and changes in earnings in the concurrent year T=0. Regression
results on both sub-samples of dividend increase and dividend decrease show
no significant relationship exists with mixed positive and negative value of
beta coefficients recorded from year T=1 to T=5. For the sub-sample of
dividend decrease, negative but insignificant beta coefficient was recorded
from year T=0 until T=2 while the subsequent years starting from T=3 shows
positive but insignificant relationship between changes in dividends and
changes in earnings in these years. From the result generated, it is obvious that
dividend change events that occurred in year 1999 were not associated with
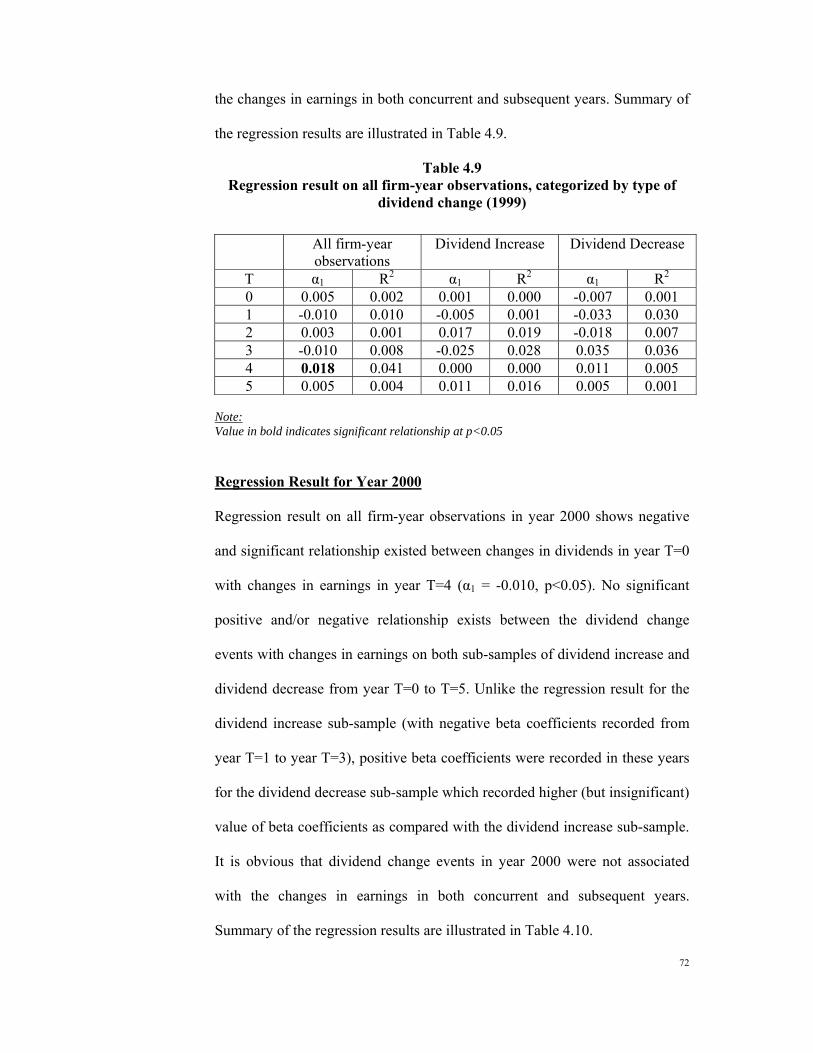
72
the changes in earnings in both concurrent and subsequent years. Summary of
the regression results are illustrated in Table 4.9.
Table 4.9 Regression result on all firm-year observations, categorized by type of
dividend change (1999)
All firm-year observations
Dividend Increase Dividend Decrease
T α1 R2 α1 R2 α1 R2 0 0.005 0.002 0.001 0.000 -0.007 0.001 1 -0.010 0.010 -0.005 0.001 -0.033 0.030 2 0.003 0.001 0.017 0.019 -0.018 0.007 3 -0.010 0.008 -0.025 0.028 0.035 0.036 4 0.018 0.041 0.000 0.000 0.011 0.005 5 0.005 0.004 0.011 0.016 0.005 0.001
Note: Value in bold indicates significant relationship at p<0.05
Regression Result for Year 2000
Regression result on all firm-year observations in year 2000 shows negative
and significant relationship existed between changes in dividends in year T=0
with changes in earnings in year T=4 (α1 = -0.010, p<0.05). No significant
positive and/or negative relationship exists between the dividend change
events with changes in earnings on both sub-samples of dividend increase and
dividend decrease from year T=0 to T=5. Unlike the regression result for the
dividend increase sub-sample (with negative beta coefficients recorded from
year T=1 to year T=3), positive beta coefficients were recorded in these years
for the dividend decrease sub-sample which recorded higher (but insignificant)
value of beta coefficients as compared with the dividend increase sub-sample.
It is obvious that dividend change events in year 2000 were not associated
with the changes in earnings in both concurrent and subsequent years.
Summary of the regression results are illustrated in Table 4.10.
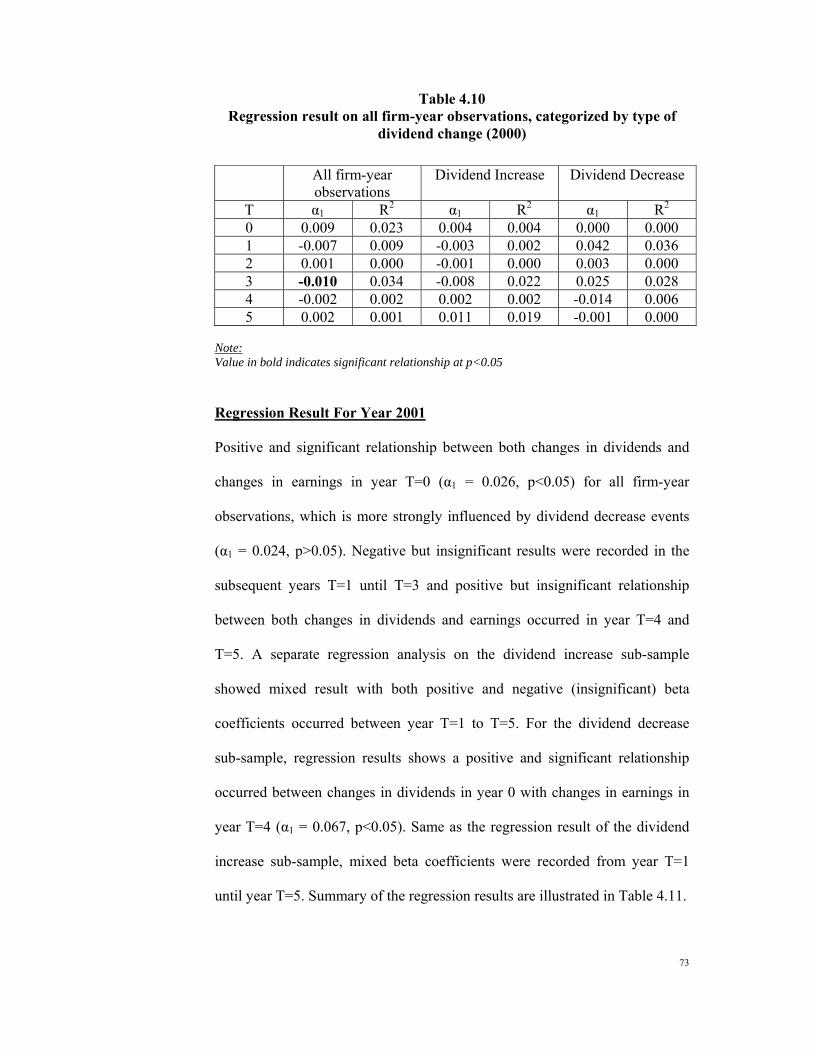
73
Table 4.10 Regression result on all firm-year observations, categorized by type of
dividend change (2000)
All firm-year observations
Dividend Increase Dividend Decrease
T α1 R2 α1 R2 α1 R2 0 0.009 0.023 0.004 0.004 0.000 0.000 1 -0.007 0.009 -0.003 0.002 0.042 0.036 2 0.001 0.000 -0.001 0.000 0.003 0.000 3 -0.010 0.034 -0.008 0.022 0.025 0.028 4 -0.002 0.002 0.002 0.002 -0.014 0.006 5 0.002 0.001 0.011 0.019 -0.001 0.000
Note: Value in bold indicates significant relationship at p<0.05
Regression Result For Year 2001
Positive and significant relationship between both changes in dividends and
changes in earnings in year T=0 (α1 = 0.026, p<0.05) for all firm-year
observations, which is more strongly influenced by dividend decrease events
(α1 = 0.024, p>0.05). Negative but insignificant results were recorded in the
subsequent years T=1 until T=3 and positive but insignificant relationship
between both changes in dividends and earnings occurred in year T=4 and
T=5. A separate regression analysis on the dividend increase sub-sample
showed mixed result with both positive and negative (insignificant) beta
coefficients occurred between year T=1 to T=5. For the dividend decrease
sub-sample, regression results shows a positive and significant relationship
occurred between changes in dividends in year 0 with changes in earnings in
year T=4 (α1 = 0.067, p<0.05). Same as the regression result of the dividend
increase sub-sample, mixed beta coefficients were recorded from year T=1
until year T=5. Summary of the regression results are illustrated in Table 4.11.
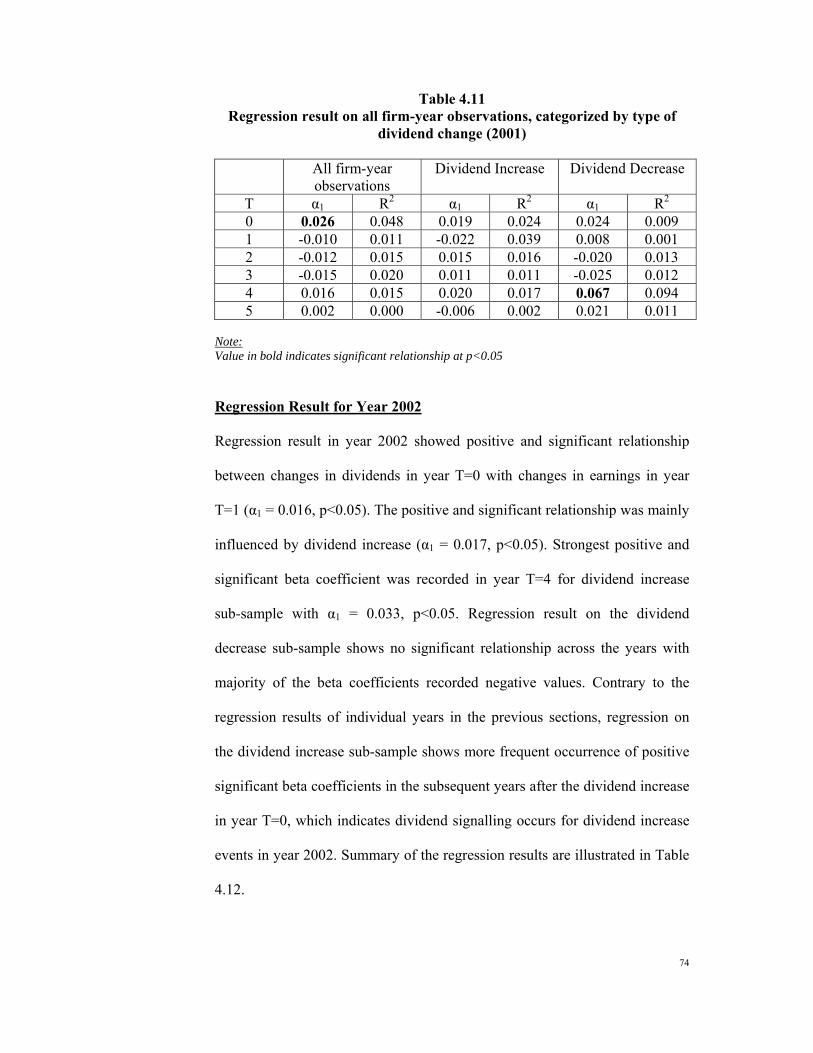
74
Table 4.11 Regression result on all firm-year observations, categorized by type of
dividend change (2001)
All firm-year observations
Dividend Increase Dividend Decrease
T α1 R2 α1 R2 α1 R2 0 0.026 0.048 0.019 0.024 0.024 0.009 1 -0.010 0.011 -0.022 0.039 0.008 0.001 2 -0.012 0.015 0.015 0.016 -0.020 0.013 3 -0.015 0.020 0.011 0.011 -0.025 0.012 4 0.016 0.015 0.020 0.017 0.067 0.094 5 0.002 0.000 -0.006 0.002 0.021 0.011
Note: Value in bold indicates significant relationship at p<0.05
Regression Result for Year 2002 Regression result in year 2002 showed positive and significant relationship
between changes in dividends in year T=0 with changes in earnings in year
T=1 (α1 = 0.016, p<0.05). The positive and significant relationship was mainly
influenced by dividend increase (α1 = 0.017, p<0.05). Strongest positive and
significant beta coefficient was recorded in year T=4 for dividend increase
sub-sample with α1 = 0.033, p<0.05. Regression result on the dividend
decrease sub-sample shows no significant relationship across the years with
majority of the beta coefficients recorded negative values. Contrary to the
regression results of individual years in the previous sections, regression on
the dividend increase sub-sample shows more frequent occurrence of positive
significant beta coefficients in the subsequent years after the dividend increase
in year T=0, which indicates dividend signalling occurs for dividend increase
events in year 2002. Summary of the regression results are illustrated in Table
4.12.
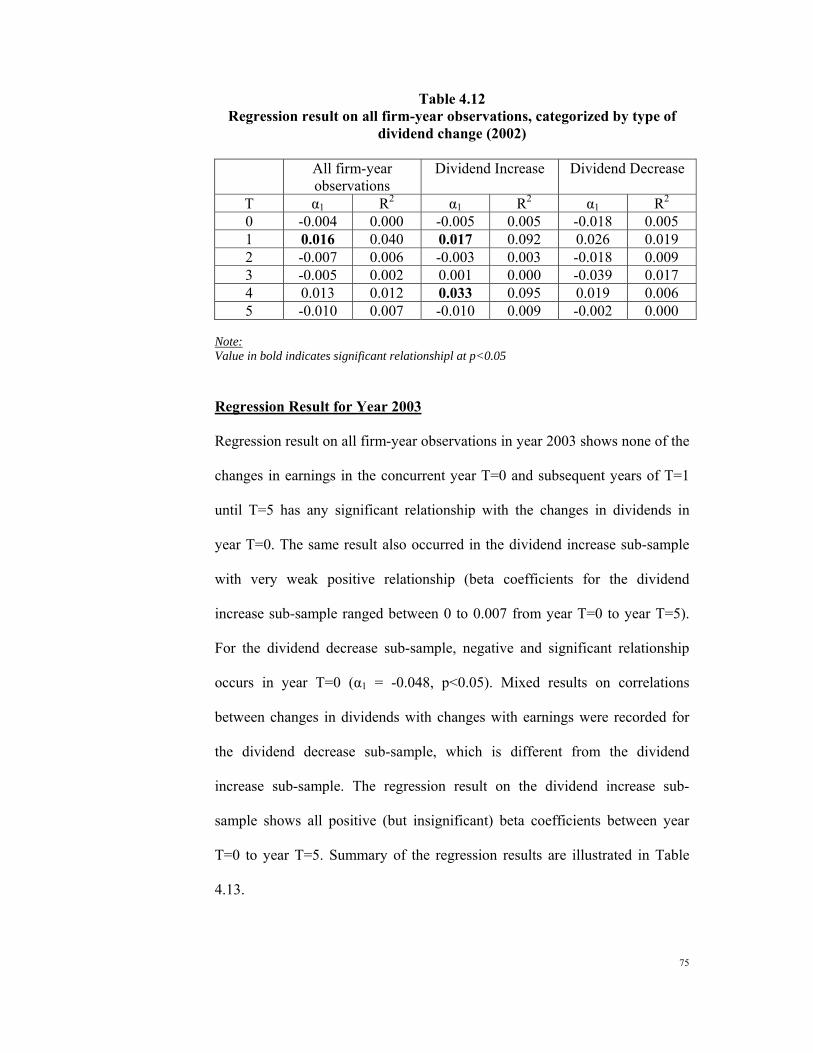
75
Table 4.12 Regression result on all firm-year observations, categorized by type of
dividend change (2002)
All firm-year observations
Dividend Increase Dividend Decrease
T α1 R2 α1 R2 α1 R2 0 -0.004 0.000 -0.005 0.005 -0.018 0.005 1 0.016 0.040 0.017 0.092 0.026 0.019 2 -0.007 0.006 -0.003 0.003 -0.018 0.009 3 -0.005 0.002 0.001 0.000 -0.039 0.017 4 0.013 0.012 0.033 0.095 0.019 0.006 5 -0.010 0.007 -0.010 0.009 -0.002 0.000
Note: Value in bold indicates significant relationshipl at p<0.05
Regression Result for Year 2003 Regression result on all firm-year observations in year 2003 shows none of the
changes in earnings in the concurrent year T=0 and subsequent years of T=1
until T=5 has any significant relationship with the changes in dividends in
year T=0. The same result also occurred in the dividend increase sub-sample
with very weak positive relationship (beta coefficients for the dividend
increase sub-sample ranged between 0 to 0.007 from year T=0 to year T=5).
For the dividend decrease sub-sample, negative and significant relationship
occurs in year T=0 (α1 = -0.048, p<0.05). Mixed results on correlations
between changes in dividends with changes with earnings were recorded for
the dividend decrease sub-sample, which is different from the dividend
increase sub-sample. The regression result on the dividend increase sub-
sample shows all positive (but insignificant) beta coefficients between year
T=0 to year T=5. Summary of the regression results are illustrated in Table
4.13.
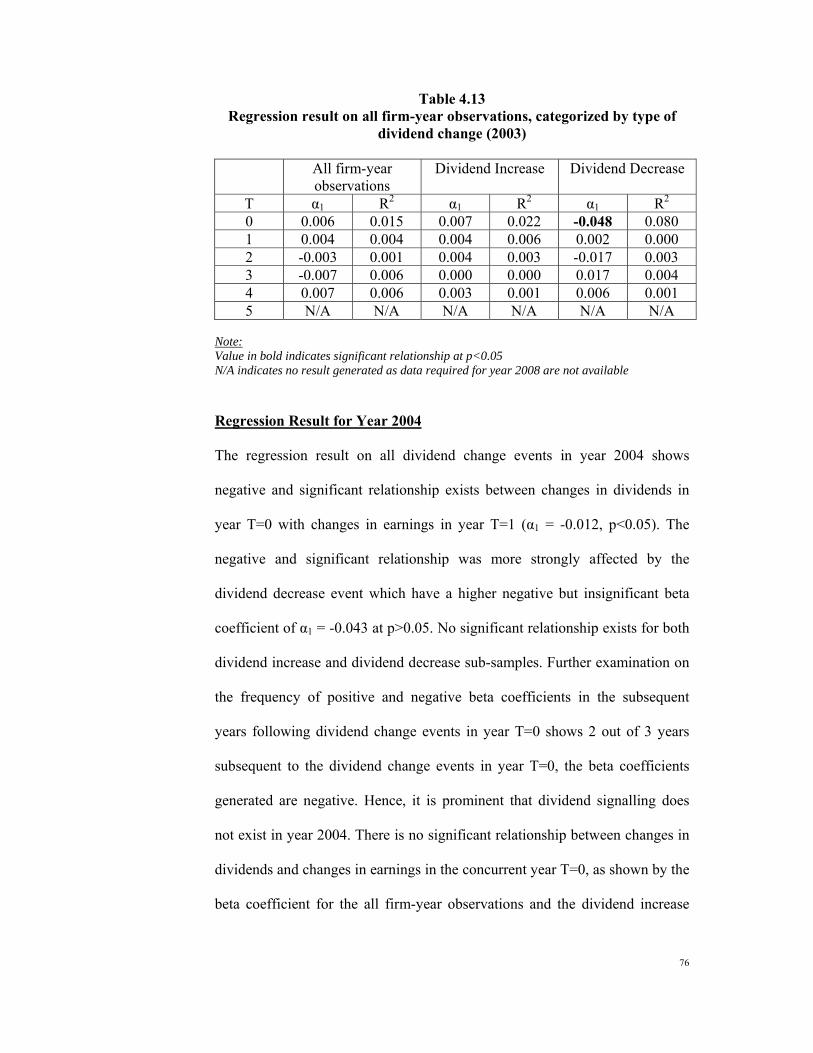
76
Table 4.13 Regression result on all firm-year observations, categorized by type of
dividend change (2003)
All firm-year observations
Dividend Increase Dividend Decrease
T α1 R2 α1 R2 α1 R2 0 0.006 0.015 0.007 0.022 -0.048 0.080 1 0.004 0.004 0.004 0.006 0.002 0.000 2 -0.003 0.001 0.004 0.003 -0.017 0.003 3 -0.007 0.006 0.000 0.000 0.017 0.004 4 0.007 0.006 0.003 0.001 0.006 0.001 5 N/A N/A N/A N/A N/A N/A
Note: Value in bold indicates significant relationship at p<0.05 N/A indicates no result generated as data required for year 2008 are not available
Regression Result for Year 2004 The regression result on all dividend change events in year 2004 shows
negative and significant relationship exists between changes in dividends in
year T=0 with changes in earnings in year T=1 (α1 = -0.012, p<0.05). The
negative and significant relationship was more strongly affected by the
dividend decrease event which have a higher negative but insignificant beta
coefficient of α1 = -0.043 at p>0.05. No significant relationship exists for both
dividend increase and dividend decrease sub-samples. Further examination on
the frequency of positive and negative beta coefficients in the subsequent
years following dividend change events in year T=0 shows 2 out of 3 years
subsequent to the dividend change events in year T=0, the beta coefficients
generated are negative. Hence, it is prominent that dividend signalling does
not exist in year 2004. There is no significant relationship between changes in
dividends and changes in earnings in the concurrent year T=0, as shown by the
beta coefficient for the all firm-year observations and the dividend increase
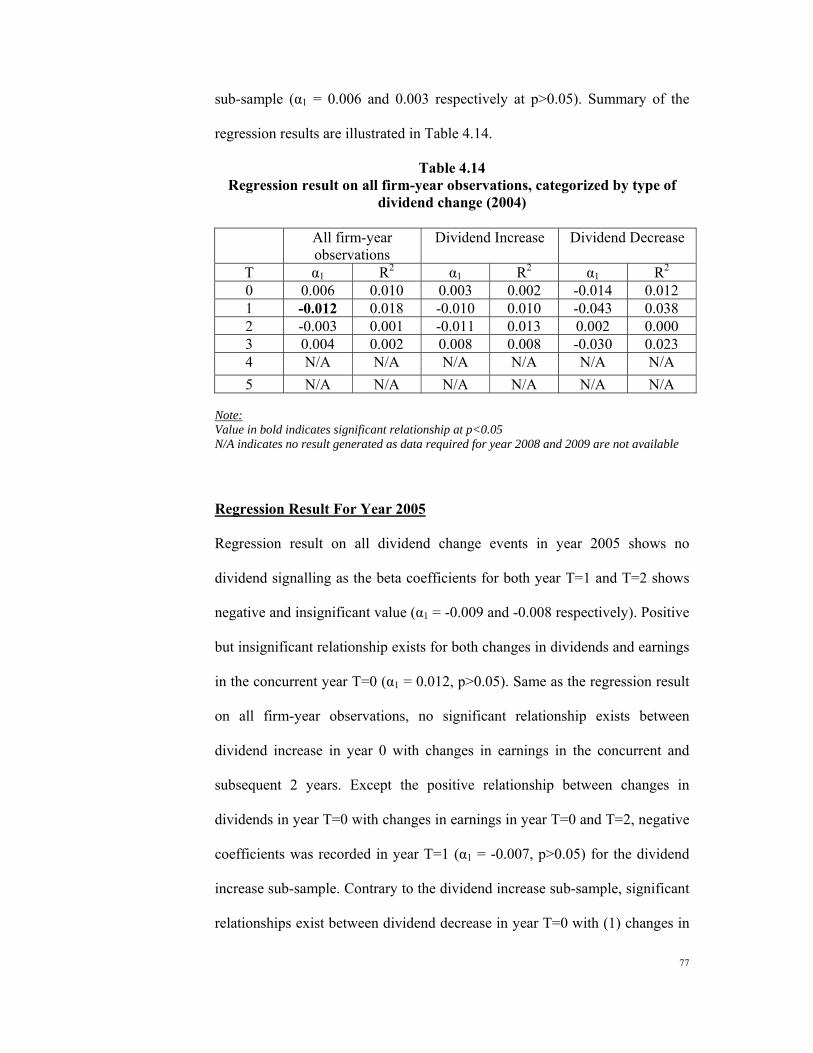
77
sub-sample (α1 = 0.006 and 0.003 respectively at p>0.05). Summary of the
regression results are illustrated in Table 4.14.
Table 4.14 Regression result on all firm-year observations, categorized by type of
dividend change (2004)
All firm-year observations
Dividend Increase Dividend Decrease
T α1 R2 α1 R2 α1 R2 0 0.006 0.010 0.003 0.002 -0.014 0.012 1 -0.012 0.018 -0.010 0.010 -0.043 0.038 2 -0.003 0.001 -0.011 0.013 0.002 0.000 3 0.004 0.002 0.008 0.008 -0.030 0.023 4 N/A N/A N/A N/A N/A N/A 5 N/A N/A N/A N/A N/A N/A
Note: Value in bold indicates significant relationship at p<0.05 N/A indicates no result generated as data required for year 2008 and 2009 are not available
Regression Result For Year 2005 Regression result on all dividend change events in year 2005 shows no
dividend signalling as the beta coefficients for both year T=1 and T=2 shows
negative and insignificant value (α1 = -0.009 and -0.008 respectively). Positive
but insignificant relationship exists for both changes in dividends and earnings
in the concurrent year T=0 (α1 = 0.012, p>0.05). Same as the regression result
on all firm-year observations, no significant relationship exists between
dividend increase in year 0 with changes in earnings in the concurrent and
subsequent 2 years. Except the positive relationship between changes in
dividends in year T=0 with changes in earnings in year T=0 and T=2, negative
coefficients was recorded in year T=1 (α1 = -0.007, p>0.05) for the dividend
increase sub-sample. Contrary to the dividend increase sub-sample, significant
relationships exist between dividend decrease in year T=0 with (1) changes in
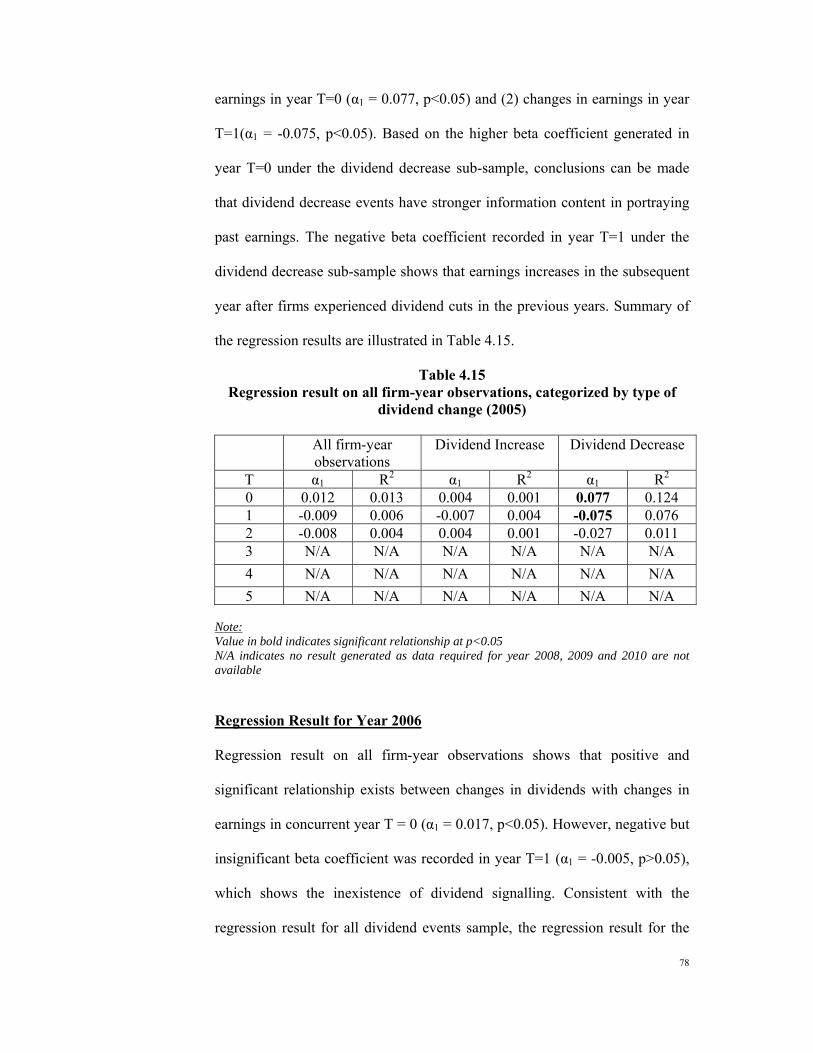
78
earnings in year T=0 (α1 = 0.077, p<0.05) and (2) changes in earnings in year
T=1(α1 = -0.075, p<0.05). Based on the higher beta coefficient generated in
year T=0 under the dividend decrease sub-sample, conclusions can be made
that dividend decrease events have stronger information content in portraying
past earnings. The negative beta coefficient recorded in year T=1 under the
dividend decrease sub-sample shows that earnings increases in the subsequent
year after firms experienced dividend cuts in the previous years. Summary of
the regression results are illustrated in Table 4.15.
Table 4.15 Regression result on all firm-year observations, categorized by type of
dividend change (2005)
All firm-year observations
Dividend Increase Dividend Decrease
T α1 R2 α1 R2 α1 R2 0 0.012 0.013 0.004 0.001 0.077 0.124 1 -0.009 0.006 -0.007 0.004 -0.075 0.076 2 -0.008 0.004 0.004 0.001 -0.027 0.011 3 N/A N/A N/A N/A N/A N/A 4 N/A N/A N/A N/A N/A N/A 5 N/A N/A N/A N/A N/A N/A
Note: Value in bold indicates significant relationship at p<0.05 N/A indicates no result generated as data required for year 2008, 2009 and 2010 are not available
Regression Result for Year 2006 Regression result on all firm-year observations shows that positive and
significant relationship exists between changes in dividends with changes in
earnings in concurrent year T = 0 (α1 = 0.017, p<0.05). However, negative but
insignificant beta coefficient was recorded in year T=1 (α1 = -0.005, p>0.05),
which shows the inexistence of dividend signalling. Consistent with the
regression result for all dividend events sample, the regression result for the
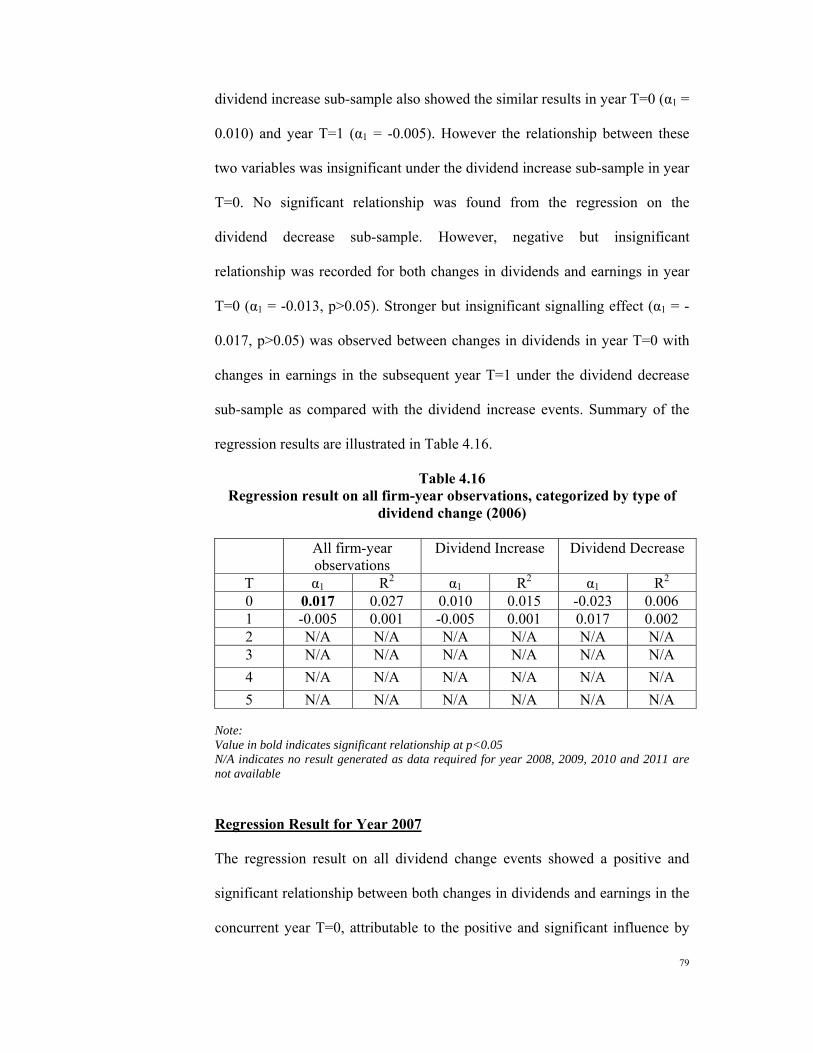
79
dividend increase sub-sample also showed the similar results in year T=0 (α1 =
0.010) and year T=1 (α1 = -0.005). However the relationship between these
two variables was insignificant under the dividend increase sub-sample in year
T=0. No significant relationship was found from the regression on the
dividend decrease sub-sample. However, negative but insignificant
relationship was recorded for both changes in dividends and earnings in year
T=0 (α1 = -0.013, p>0.05). Stronger but insignificant signalling effect (α1 = -
0.017, p>0.05) was observed between changes in dividends in year T=0 with
changes in earnings in the subsequent year T=1 under the dividend decrease
sub-sample as compared with the dividend increase events. Summary of the
regression results are illustrated in Table 4.16.
Table 4.16 Regression result on all firm-year observations, categorized by type of
dividend change (2006)
All firm-year observations
Dividend Increase Dividend Decrease
T α1 R2 α1 R2 α1 R2 0 0.017 0.027 0.010 0.015 -0.023 0.006 1 -0.005 0.001 -0.005 0.001 0.017 0.002 2 N/A N/A N/A N/A N/A N/A 3 N/A N/A N/A N/A N/A N/A 4 N/A N/A N/A N/A N/A N/A
5 N/A N/A N/A N/A N/A N/A Note: Value in bold indicates significant relationship at p<0.05 N/A indicates no result generated as data required for year 2008, 2009, 2010 and 2011 are not available
Regression Result for Year 2007 The regression result on all dividend change events showed a positive and
significant relationship between both changes in dividends and earnings in the
concurrent year T=0, attributable to the positive and significant influence by
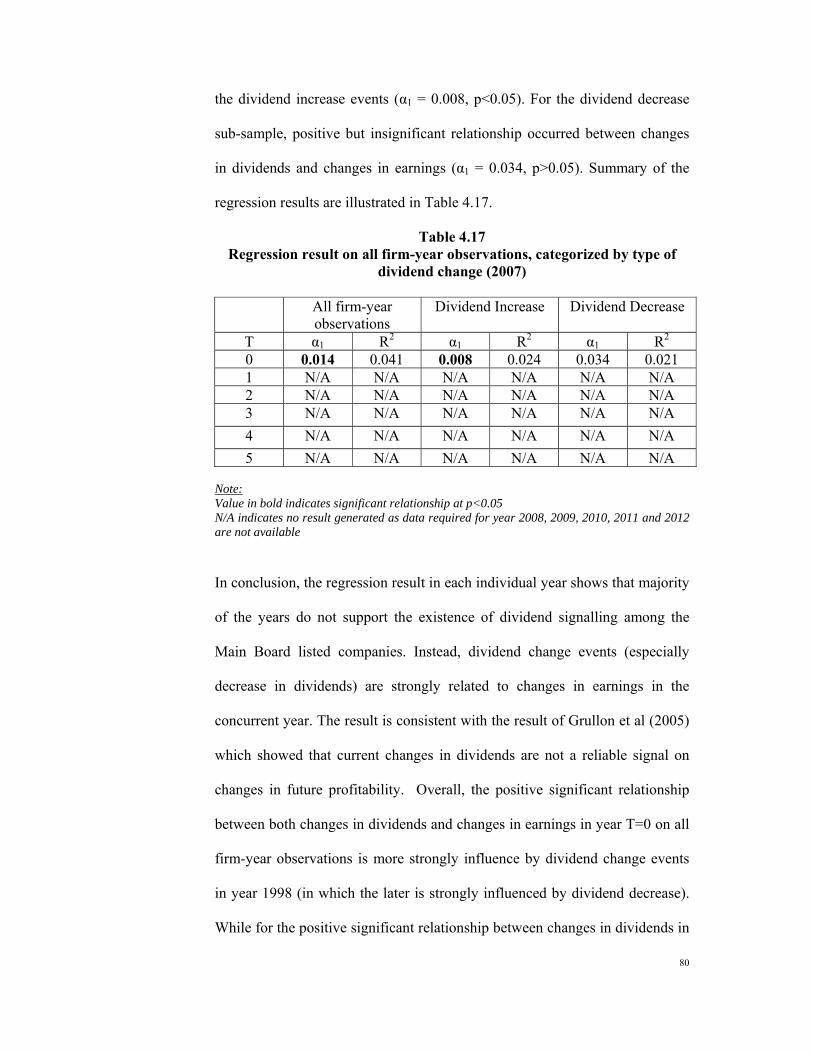
80
the dividend increase events (α1 = 0.008, p<0.05). For the dividend decrease
sub-sample, positive but insignificant relationship occurred between changes
in dividends and changes in earnings (α1 = 0.034, p>0.05). Summary of the
regression results are illustrated in Table 4.17.
Table 4.17 Regression result on all firm-year observations, categorized by type of
dividend change (2007)
All firm-year observations
Dividend Increase Dividend Decrease
T α1 R2 α1 R2 α1 R2 0 0.014 0.041 0.008 0.024 0.034 0.021 1 N/A N/A N/A N/A N/A N/A 2 N/A N/A N/A N/A N/A N/A 3 N/A N/A N/A N/A N/A N/A
4 N/A N/A N/A N/A N/A N/A 5 N/A N/A N/A N/A N/A N/A
Note: Value in bold indicates significant relationship at p<0.05 N/A indicates no result generated as data required for year 2008, 2009, 2010, 2011 and 2012 are not available
In conclusion, the regression result in each individual year shows that majority
of the years do not support the existence of dividend signalling among the
Main Board listed companies. Instead, dividend change events (especially
decrease in dividends) are strongly related to changes in earnings in the
concurrent year. The result is consistent with the result of Grullon et al (2005)
which showed that current changes in dividends are not a reliable signal on
changes in future profitability. Overall, the positive significant relationship
between both changes in dividends and changes in earnings in year T=0 on all
firm-year observations is more strongly influence by dividend change events
in year 1998 (in which the later is strongly influenced by dividend decrease).
While for the positive significant relationship between changes in dividends in
81
year T=0 with changes in earnings in year T=4 on all firm-year observations,
the significant relationship is more strongly influence by dividend change
events in year 1999 (in which the later is strongly influenced by dividend
decrease).
4.2.3 Analysis of Regression Result on Dividend Change Events During the
Financial Crisis Period (1998-2001) and Post-Financial Crisis Period
(2002-2007)
Regression analysis was performed on sub-groups of dividend change events
during the financial crisis period (1998 to 2001) and after the financial crisis
period (2002 to 2007) to examine whether the signalling effect differs between
these two sub-groups. The regression analysis performed is based on the
following reasoning:-
i. Stronger signalling effect exists during the financial crisis period as
compared with post-financial crisis period. Any changes in dividends
during the financial crisis period are associated with the firms’
expectations on the future profitability given the economic condition
during the financial crisis period. An increase in dividends during the
financial crisis period can be interpreted as positive outlook of the
firms in its ability to regain its profitability while other industry players
are still experiencing decrease in profitability.
ii. Weaker signalling effect after the financial crisis period as compared
with financial crisis period as any changes in dividends has weaker
signalling effect when the economy condition becomes more stable.
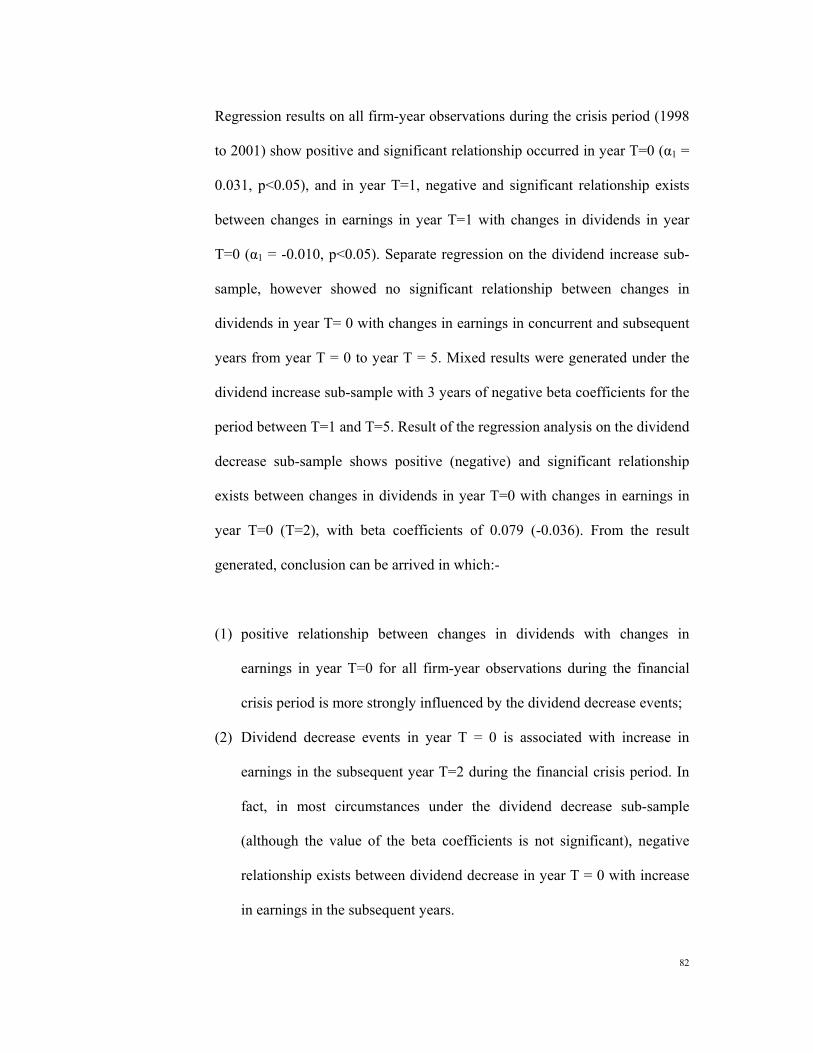
82
Regression results on all firm-year observations during the crisis period (1998
to 2001) show positive and significant relationship occurred in year T=0 (α1 =
0.031, p<0.05), and in year T=1, negative and significant relationship exists
between changes in earnings in year T=1 with changes in dividends in year
T=0 (α1 = -0.010, p<0.05). Separate regression on the dividend increase sub-
sample, however showed no significant relationship between changes in
dividends in year T= 0 with changes in earnings in concurrent and subsequent
years from year T = 0 to year T = 5. Mixed results were generated under the
dividend increase sub-sample with 3 years of negative beta coefficients for the
period between T=1 and T=5. Result of the regression analysis on the dividend
decrease sub-sample shows positive (negative) and significant relationship
exists between changes in dividends in year T=0 with changes in earnings in
year T=0 (T=2), with beta coefficients of 0.079 (-0.036). From the result
generated, conclusion can be arrived in which:-
(1) positive relationship between changes in dividends with changes in
earnings in year T=0 for all firm-year observations during the financial
crisis period is more strongly influenced by the dividend decrease events;
(2) Dividend decrease events in year T = 0 is associated with increase in
earnings in the subsequent year T=2 during the financial crisis period. In
fact, in most circumstances under the dividend decrease sub-sample
(although the value of the beta coefficients is not significant), negative
relationship exists between dividend decrease in year T = 0 with increase
in earnings in the subsequent years.
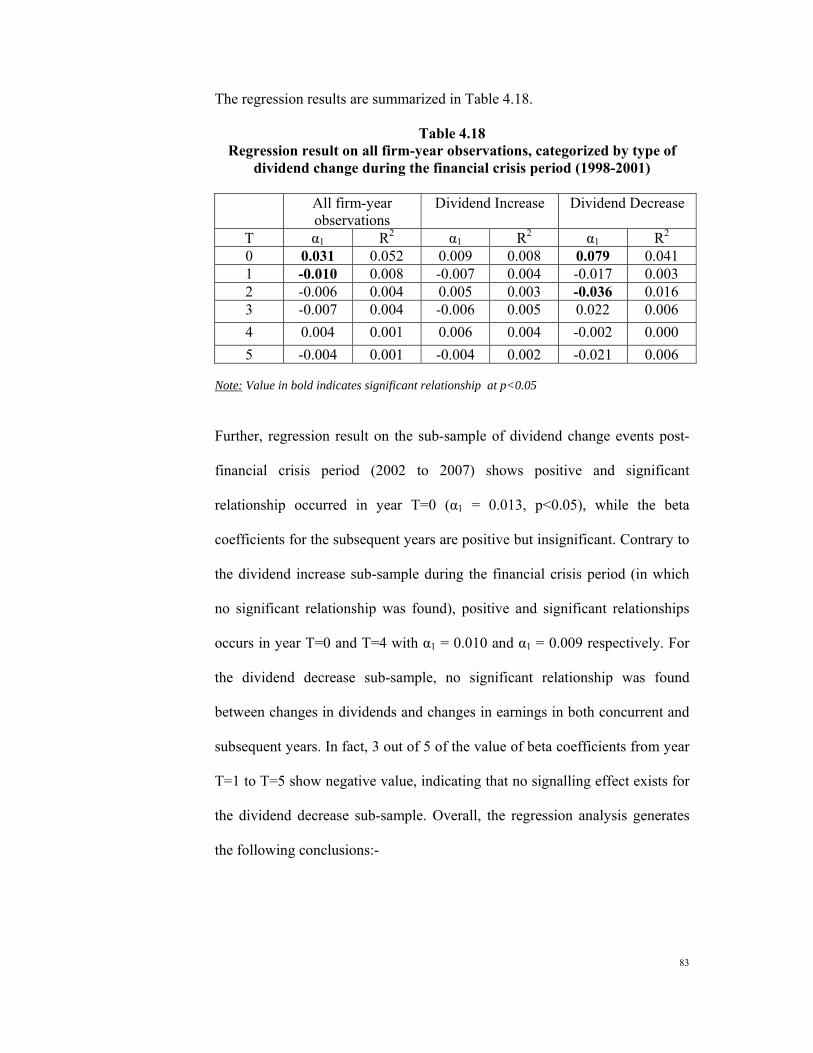
83
The regression results are summarized in Table 4.18.
Table 4.18 Regression result on all firm-year observations, categorized by type of
dividend change during the financial crisis period (1998-2001)
All firm-year observations
Dividend Increase Dividend Decrease
T α1 R2 α1 R2 α1 R2 0 0.031 0.052 0.009 0.008 0.079 0.041 1 -0.010 0.008 -0.007 0.004 -0.017 0.003 2 -0.006 0.004 0.005 0.003 -0.036 0.016 3 -0.007 0.004 -0.006 0.005 0.022 0.006 4 0.004 0.001 0.006 0.004 -0.002 0.000 5 -0.004 0.001 -0.004 0.002 -0.021 0.006
Note: Value in bold indicates significant relationship at p<0.05
Further, regression result on the sub-sample of dividend change events post-
financial crisis period (2002 to 2007) shows positive and significant
relationship occurred in year T=0 (α1 = 0.013, p<0.05), while the beta
coefficients for the subsequent years are positive but insignificant. Contrary to
the dividend increase sub-sample during the financial crisis period (in which
no significant relationship was found), positive and significant relationships
occurs in year T=0 and T=4 with α1 = 0.010 and α1 = 0.009 respectively. For
the dividend decrease sub-sample, no significant relationship was found
between changes in dividends and changes in earnings in both concurrent and
subsequent years. In fact, 3 out of 5 of the value of beta coefficients from year
T=1 to T=5 show negative value, indicating that no signalling effect exists for
the dividend decrease sub-sample. Overall, the regression analysis generates
the following conclusions:-
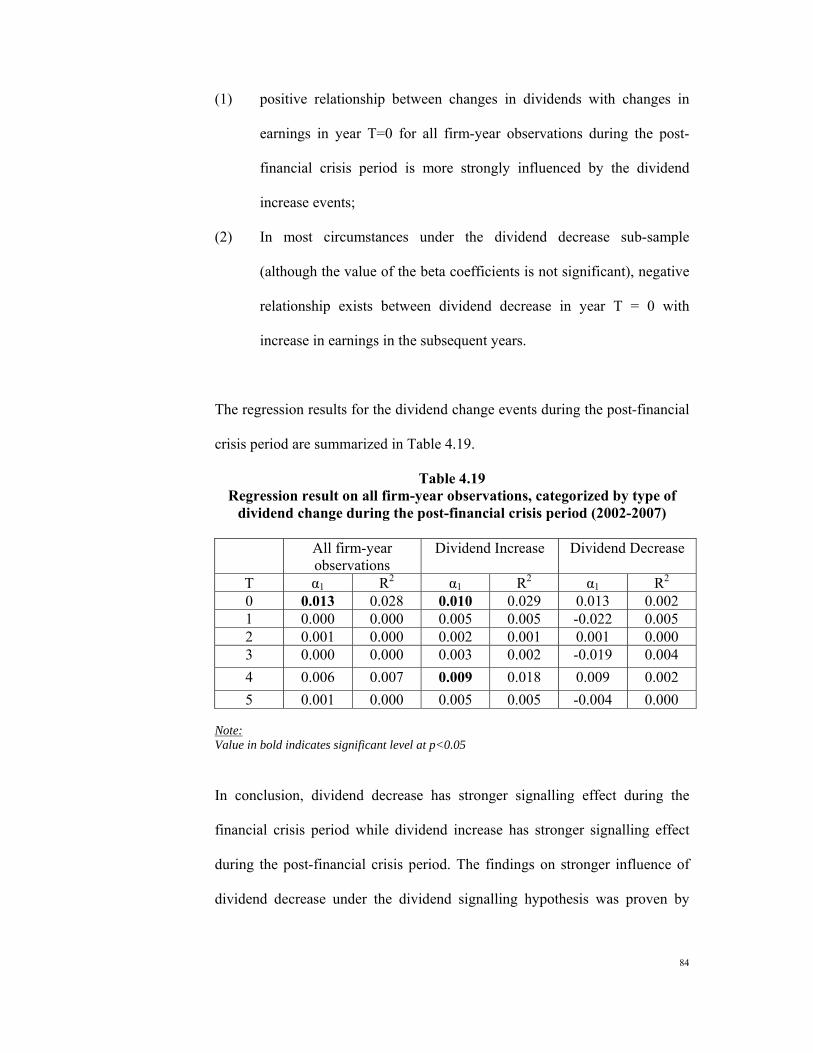
84
(1) positive relationship between changes in dividends with changes in
earnings in year T=0 for all firm-year observations during the post-
financial crisis period is more strongly influenced by the dividend
increase events;
(2) In most circumstances under the dividend decrease sub-sample
(although the value of the beta coefficients is not significant), negative
relationship exists between dividend decrease in year T = 0 with
increase in earnings in the subsequent years.
The regression results for the dividend change events during the post-financial
crisis period are summarized in Table 4.19.
Table 4.19 Regression result on all firm-year observations, categorized by type of
dividend change during the post-financial crisis period (2002-2007)
All firm-year observations
Dividend Increase Dividend Decrease
T α1 R2 α1 R2 α1 R2 0 0.013 0.028 0.010 0.029 0.013 0.002 1 0.000 0.000 0.005 0.005 -0.022 0.005 2 0.001 0.000 0.002 0.001 0.001 0.000 3 0.000 0.000 0.003 0.002 -0.019 0.004 4 0.006 0.007 0.009 0.018 0.009 0.002 5 0.001 0.000 0.005 0.005 -0.004 0.000
Note: Value in bold indicates significant level at p<0.05
In conclusion, dividend decrease has stronger signalling effect during the
financial crisis period while dividend increase has stronger signalling effect
during the post-financial crisis period. The findings on stronger influence of
dividend decrease under the dividend signalling hypothesis was proven by
85
Grullon et al (2005) in which the regression result on each individual year, i.e.
year 1997 showed a higher beta coefficient for dividend decrease events (α1 =
0.063) as compared with dividend increase events (α1 = 0.021).
4.2.4 Analysis of Regression Result on Dividend Change Events Occurred After
Stable DPS for Consecutive 2 Years, 3 Years and 4 Years
Regression analysis was performed on sub-samples of dividend change events
that occurred after certain period of stable DPS to examine the differences in
signalling effect under different period of stable dividend. As such, the
expected regression result shall be higher beta coefficients for dividend change
events that occurred after longer period of stable dividend.
Regression result on the dividend change events that occurred after 2
consecutive years of stable DPS shows positive and significant relationship
occurred in year T=0 and further analysis on the sub-sample of dividend
increase shows the same result with α1 = 0.011 and 0.007 respectively.
However, regression result on the dividend decrease sub-sample shows no
significant positive or negative relationship between dividend decrease with
concurrent and subsequent increase or decrease in earnings.
Surprisingly, different from the regression result for dividend change events
that occurred after 2 consecutive years of stable dividends, no positive and
significant relationship exists between the changes in dividends in year 0 with
the concurrent changes in earnings for the dividend change events that
occurred after 3 consecutive years of stable dividends. The same result was
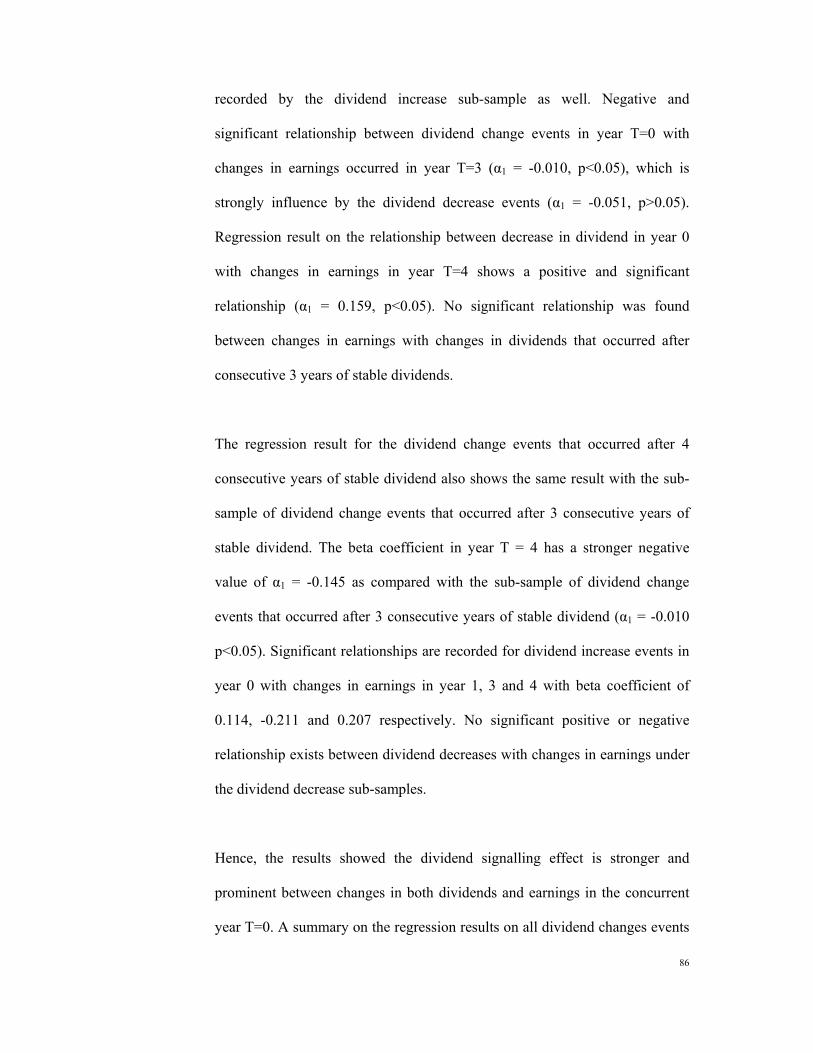
86
recorded by the dividend increase sub-sample as well. Negative and
significant relationship between dividend change events in year T=0 with
changes in earnings occurred in year T=3 (α1 = -0.010, p<0.05), which is
strongly influence by the dividend decrease events (α1 = -0.051, p>0.05).
Regression result on the relationship between decrease in dividend in year 0
with changes in earnings in year T=4 shows a positive and significant
relationship (α1 = 0.159, p<0.05). No significant relationship was found
between changes in earnings with changes in dividends that occurred after
consecutive 3 years of stable dividends.
The regression result for the dividend change events that occurred after 4
consecutive years of stable dividend also shows the same result with the sub-
sample of dividend change events that occurred after 3 consecutive years of
stable dividend. The beta coefficient in year T = 4 has a stronger negative
value of α1 = -0.145 as compared with the sub-sample of dividend change
events that occurred after 3 consecutive years of stable dividend (α1 = -0.010
p<0.05). Significant relationships are recorded for dividend increase events in
year 0 with changes in earnings in year 1, 3 and 4 with beta coefficient of
0.114, -0.211 and 0.207 respectively. No significant positive or negative
relationship exists between dividend decreases with changes in earnings under
the dividend decrease sub-samples.
Hence, the results showed the dividend signalling effect is stronger and
prominent between changes in both dividends and earnings in the concurrent
year T=0. A summary on the regression results on all dividend changes events
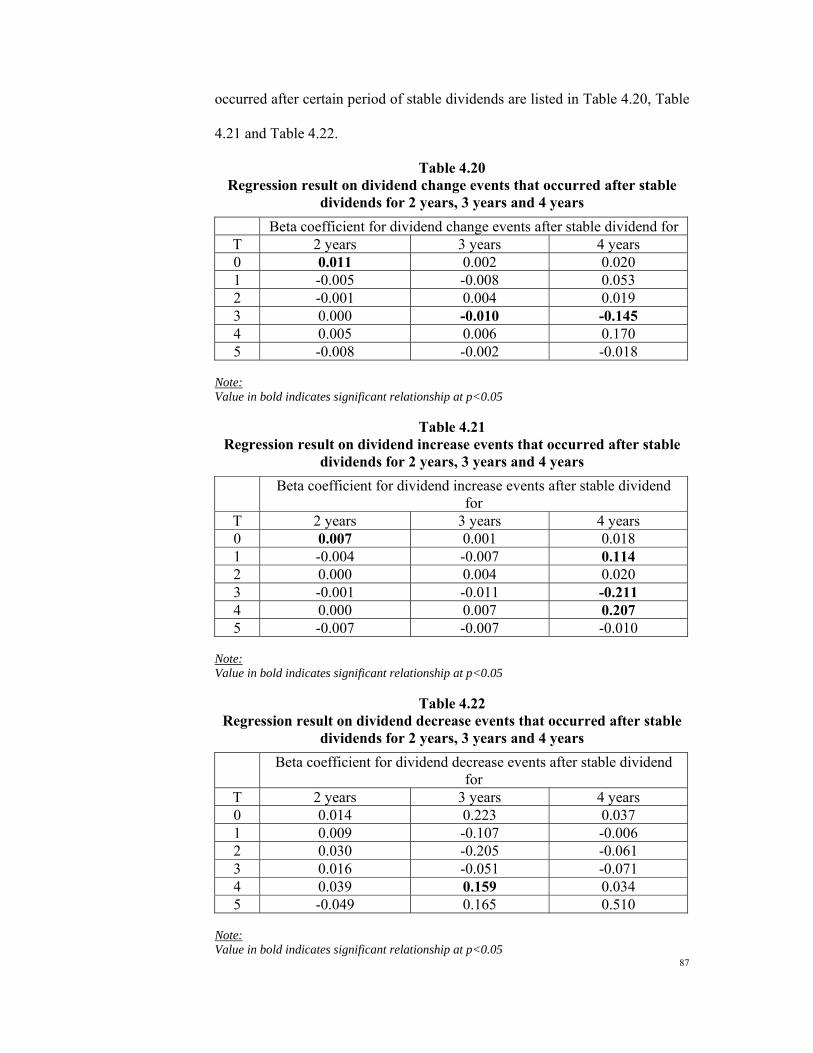
87
occurred after certain period of stable dividends are listed in Table 4.20, Table
4.21 and Table 4.22.
Table 4.20 Regression result on dividend change events that occurred after stable
dividends for 2 years, 3 years and 4 years Beta coefficient for dividend change events after stable dividend for
T 2 years 3 years 4 years 0 0.011 0.002 0.020 1 -0.005 -0.008 0.053 2 -0.001 0.004 0.019 3 0.000 -0.010 -0.145 4 0.005 0.006 0.170 5 -0.008 -0.002 -0.018
Note: Value in bold indicates significant relationship at p<0.05
Table 4.21 Regression result on dividend increase events that occurred after stable
dividends for 2 years, 3 years and 4 years Beta coefficient for dividend increase events after stable dividend
for T 2 years 3 years 4 years 0 0.007 0.001 0.018 1 -0.004 -0.007 0.114 2 0.000 0.004 0.020 3 -0.001 -0.011 -0.211 4 0.000 0.007 0.207 5 -0.007 -0.007 -0.010
Note: Value in bold indicates significant relationship at p<0.05
Table 4.22 Regression result on dividend decrease events that occurred after stable
dividends for 2 years, 3 years and 4 years Beta coefficient for dividend decrease events after stable dividend
for T 2 years 3 years 4 years 0 0.014 0.223 0.037 1 0.009 -0.107 -0.006 2 0.030 -0.205 -0.061 3 0.016 -0.051 -0.071 4 0.039 0.159 0.034 5 -0.049 0.165 0.510
Note: Value in bold indicates significant relationship at p<0.05
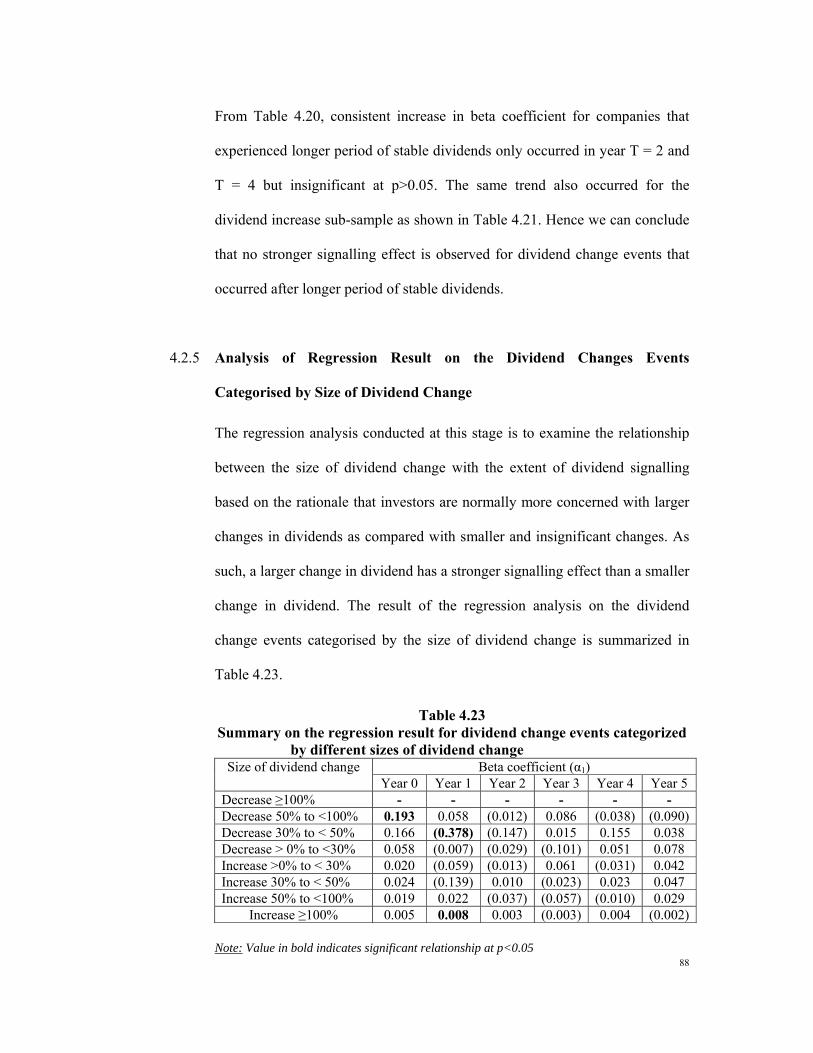
88
From Table 4.20, consistent increase in beta coefficient for companies that
experienced longer period of stable dividends only occurred in year T = 2 and
T = 4 but insignificant at p>0.05. The same trend also occurred for the
dividend increase sub-sample as shown in Table 4.21. Hence we can conclude
that no stronger signalling effect is observed for dividend change events that
occurred after longer period of stable dividends.
4.2.5 Analysis of Regression Result on the Dividend Changes Events
Categorised by Size of Dividend Change
The regression analysis conducted at this stage is to examine the relationship
between the size of dividend change with the extent of dividend signalling
based on the rationale that investors are normally more concerned with larger
changes in dividends as compared with smaller and insignificant changes. As
such, a larger change in dividend has a stronger signalling effect than a smaller
change in dividend. The result of the regression analysis on the dividend
change events categorised by the size of dividend change is summarized in
Table 4.23.
Table 4.23 Summary on the regression result for dividend change events categorized
by different sizes of dividend change Beta coefficient (α1) Size of dividend change
Year 0 Year 1 Year 2 Year 3 Year 4 Year 5 Decrease ≥100% - - - - - - Decrease 50% to <100% 0.193 0.058 (0.012) 0.086 (0.038) (0.090)Decrease 30% to < 50% 0.166 (0.378) (0.147) 0.015 0.155 0.038 Decrease > 0% to <30% 0.058 (0.007) (0.029) (0.101) 0.051 0.078 Increase >0% to < 30% 0.020 (0.059) (0.013) 0.061 (0.031) 0.042 Increase 30% to < 50% 0.024 (0.139) 0.010 (0.023) 0.023 0.047 Increase 50% to <100% 0.019 0.022 (0.037) (0.057) (0.010) 0.029
Increase ≥100% 0.005 0.008 0.003 (0.003) 0.004 (0.002)
Note: Value in bold indicates significant relationship at p<0.05
89
From Table 4.22, continuous increase in the value of beta coefficient occurs in
year T=0 when the size of dividend decrease becomes larger. i.e. dividend
decreases from more than 0% to less than 100% in year T=0. Positive and
significant beta coefficient of 0.193 recorded in year T=0 when the dividend
decreases from 50% to less than 100%. For the dividend increase sub-sample,
stronger signalling effect only occurred when the dividend increases from
more than 0% to not more than 50%, as can be observed in year T=1 and year
T=5. As such, we can conclude that the result has proved that there is no
strong relationship between the size of dividend change with the extent of
dividend signalling as the continuous increase in the beta coefficients when
the size of dividend change increases only occurred in year T=0.
4.2.6 Analysis of Regression Result on the Dividend Change Events
Categorised by Size of Dividend Yield
The objective of the regression analysis is to examine the relationship between
the size of dividend yield with the extent of dividend signalling based on the
rationale that companies with higher dividend yields will place more weight in
their dividend decisions. This is because such high dividend yield companies
use dividend as their basis of share valuation. In contrary, companies with low
dividend yield will place more weight on share price appreciation. Hence, we
can hypothesize that the higher the dividend yield, the greater the signalling
effect when a company changes its dividend payment.
The analysis on the extent of dividend signalling on the concurrent and
subsequent years after the changes in dividends, categorized by the size of
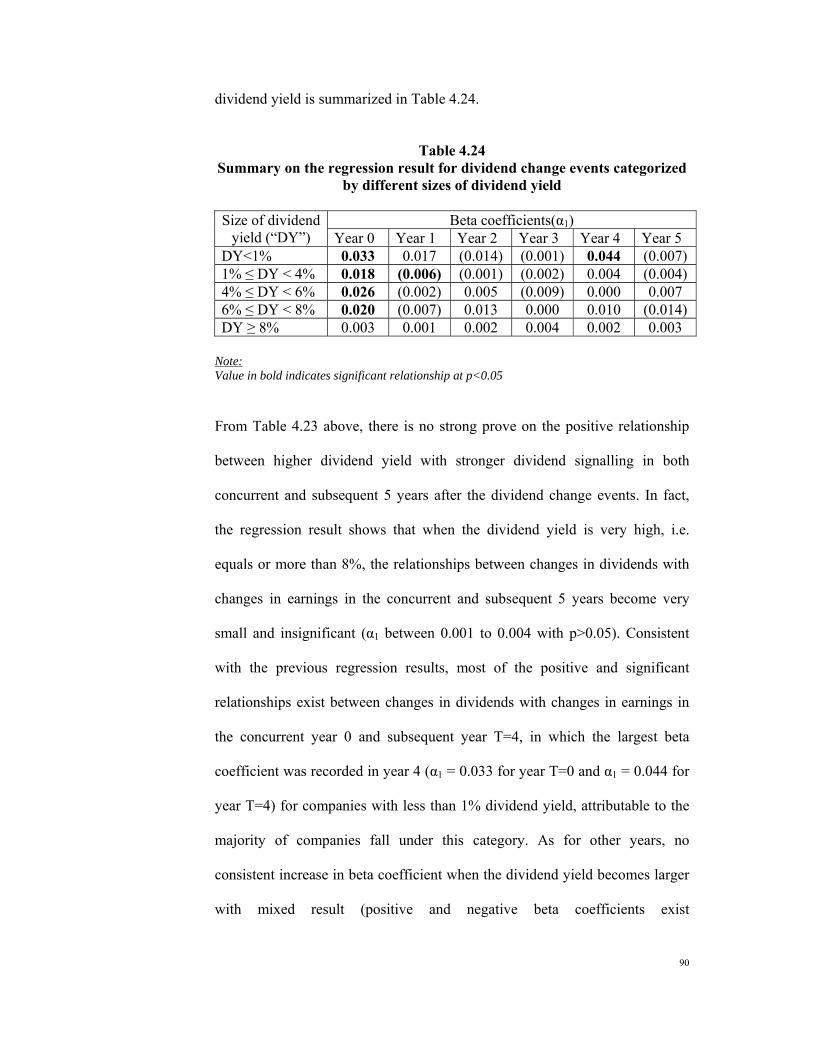
90
dividend yield is summarized in Table 4.24.
Table 4.24
Summary on the regression result for dividend change events categorized by different sizes of dividend yield
Beta coefficients(α1) Size of dividend
yield (“DY”) Year 0 Year 1 Year 2 Year 3 Year 4 Year 5 DY<1% 0.033 0.017 (0.014) (0.001) 0.044 (0.007) 1% ≤ DY < 4% 0.018 (0.006) (0.001) (0.002) 0.004 (0.004) 4% ≤ DY < 6% 0.026 (0.002) 0.005 (0.009) 0.000 0.007 6% ≤ DY < 8% 0.020 (0.007) 0.013 0.000 0.010 (0.014) DY ≥ 8% 0.003 0.001 0.002 0.004 0.002 0.003
Note: Value in bold indicates significant relationship at p<0.05 From Table 4.23 above, there is no strong prove on the positive relationship
between higher dividend yield with stronger dividend signalling in both
concurrent and subsequent 5 years after the dividend change events. In fact,
the regression result shows that when the dividend yield is very high, i.e.
equals or more than 8%, the relationships between changes in dividends with
changes in earnings in the concurrent and subsequent 5 years become very
small and insignificant (α1 between 0.001 to 0.004 with p>0.05). Consistent
with the previous regression results, most of the positive and significant
relationships exist between changes in dividends with changes in earnings in
the concurrent year 0 and subsequent year T=4, in which the largest beta
coefficient was recorded in year 4 (α1 = 0.033 for year T=0 and α1 = 0.044 for
year T=4) for companies with less than 1% dividend yield, attributable to the
majority of companies fall under this category. As for other years, no
consistent increase in beta coefficient when the dividend yield becomes larger
with mixed result (positive and negative beta coefficients exist
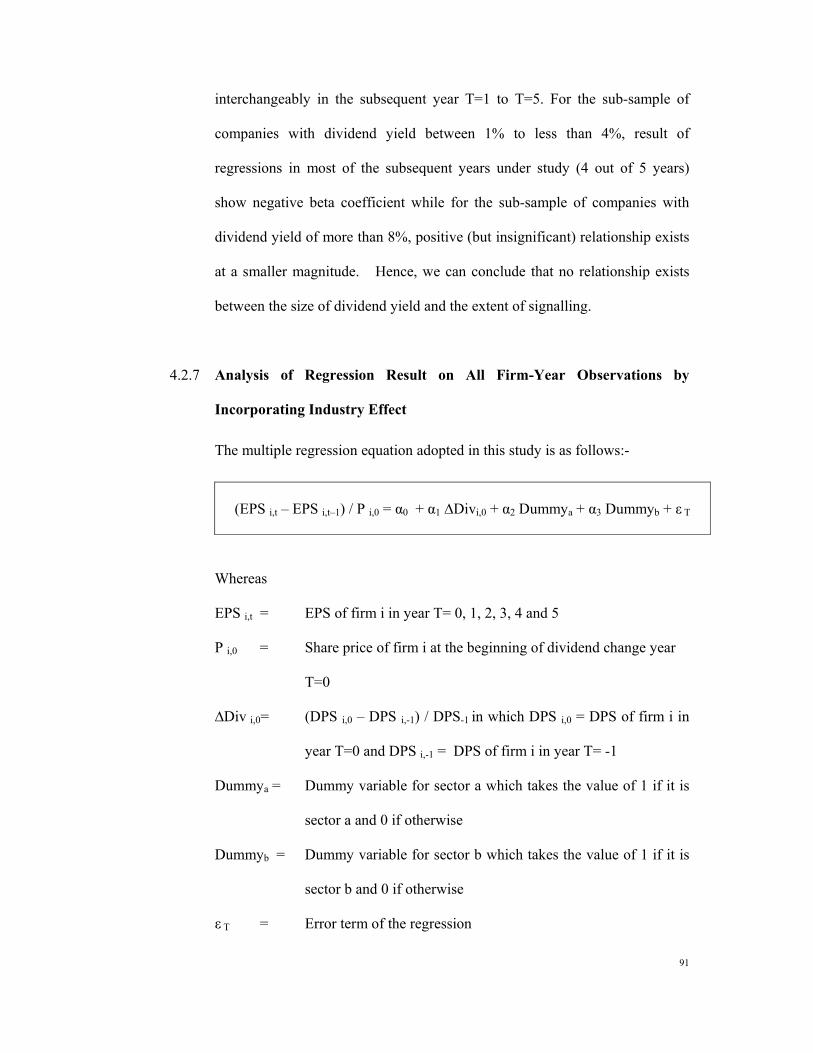
91
interchangeably in the subsequent year T=1 to T=5. For the sub-sample of
companies with dividend yield between 1% to less than 4%, result of
regressions in most of the subsequent years under study (4 out of 5 years)
show negative beta coefficient while for the sub-sample of companies with
dividend yield of more than 8%, positive (but insignificant) relationship exists
at a smaller magnitude. Hence, we can conclude that no relationship exists
between the size of dividend yield and the extent of signalling.
4.2.7 Analysis of Regression Result on All Firm-Year Observations by
Incorporating Industry Effect
The multiple regression equation adopted in this study is as follows:-
(EPS i,t – EPS i,t–1) / P i,0 = α0 + α1 ∆Divi,0 + α2 Dummya + α3 Dummyb + ε T
Whereas
EPS i,t = EPS of firm i in year T= 0, 1, 2, 3, 4 and 5
P i,0 = Share price of firm i at the beginning of dividend change year
T=0
∆Div i,0= (DPS i,0 – DPS i,-1) / DPS-1 in which DPS i,0 = DPS of firm i in
year T=0 and DPS i,-1 = DPS of firm i in year T= -1
Dummya = Dummy variable for sector a which takes the value of 1 if it is
sector a and 0 if otherwise
Dummyb = Dummy variable for sector b which takes the value of 1 if it is
sector b and 0 if otherwise
ε T = Error term of the regression
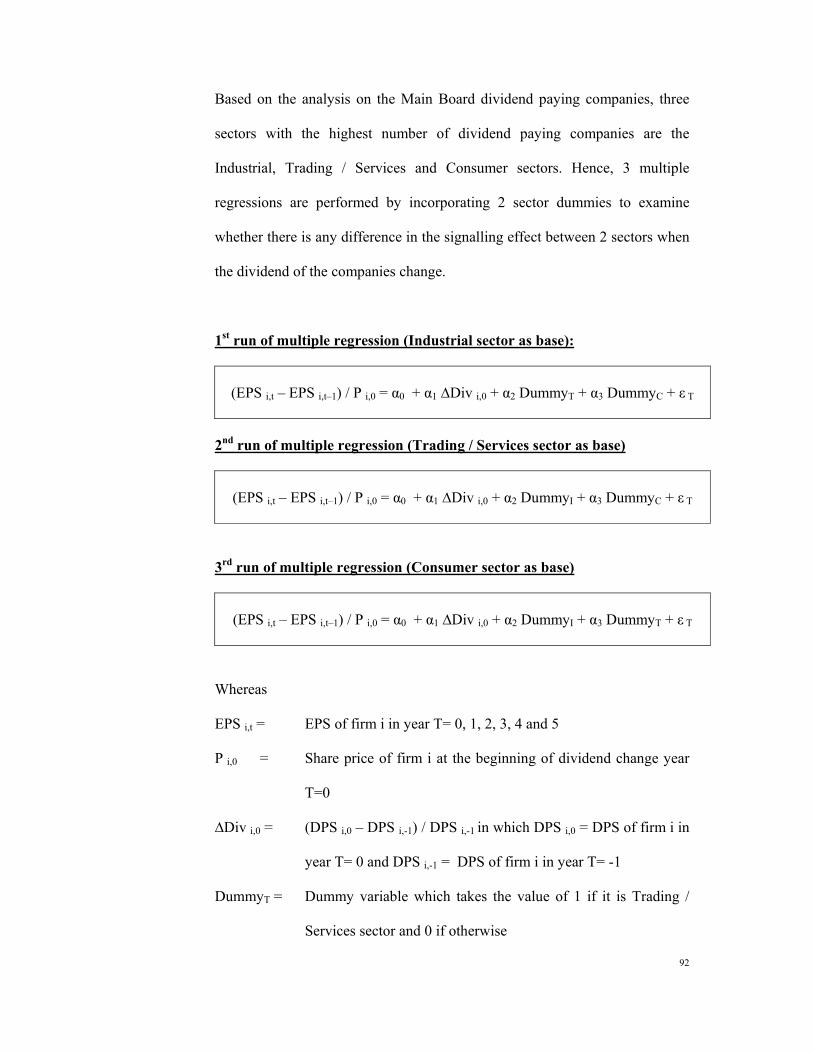
92
Based on the analysis on the Main Board dividend paying companies, three
sectors with the highest number of dividend paying companies are the
Industrial, Trading / Services and Consumer sectors. Hence, 3 multiple
regressions are performed by incorporating 2 sector dummies to examine
whether there is any difference in the signalling effect between 2 sectors when
the dividend of the companies change.
1st run of multiple regression (Industrial sector as base):
(EPS i,t – EPS i,t–1) / P i,0 = α0 + α1 ∆Div i,0 + α2 DummyT + α3 DummyC + ε T
2nd run of multiple regression (Trading / Services sector as base)
(EPS i,t – EPS i,t–1) / P i,0 = α0 + α1 ∆Div i,0 + α2 DummyI + α3 DummyC + ε T
3rd run of multiple regression (Consumer sector as base)
(EPS i,t – EPS i,t–1) / P i,0 = α0 + α1 ∆Div i,0 + α2 DummyI + α3 DummyT + ε T
Whereas
EPS i,t = EPS of firm i in year T= 0, 1, 2, 3, 4 and 5
P i,0 = Share price of firm i at the beginning of dividend change year
T=0
∆Div i,0 = (DPS i,0 – DPS i,-1) / DPS i,-1 in which DPS i,0 = DPS of firm i in
year T= 0 and DPS i,-1 = DPS of firm i in year T= -1
DummyT = Dummy variable which takes the value of 1 if it is Trading /
Services sector and 0 if otherwise
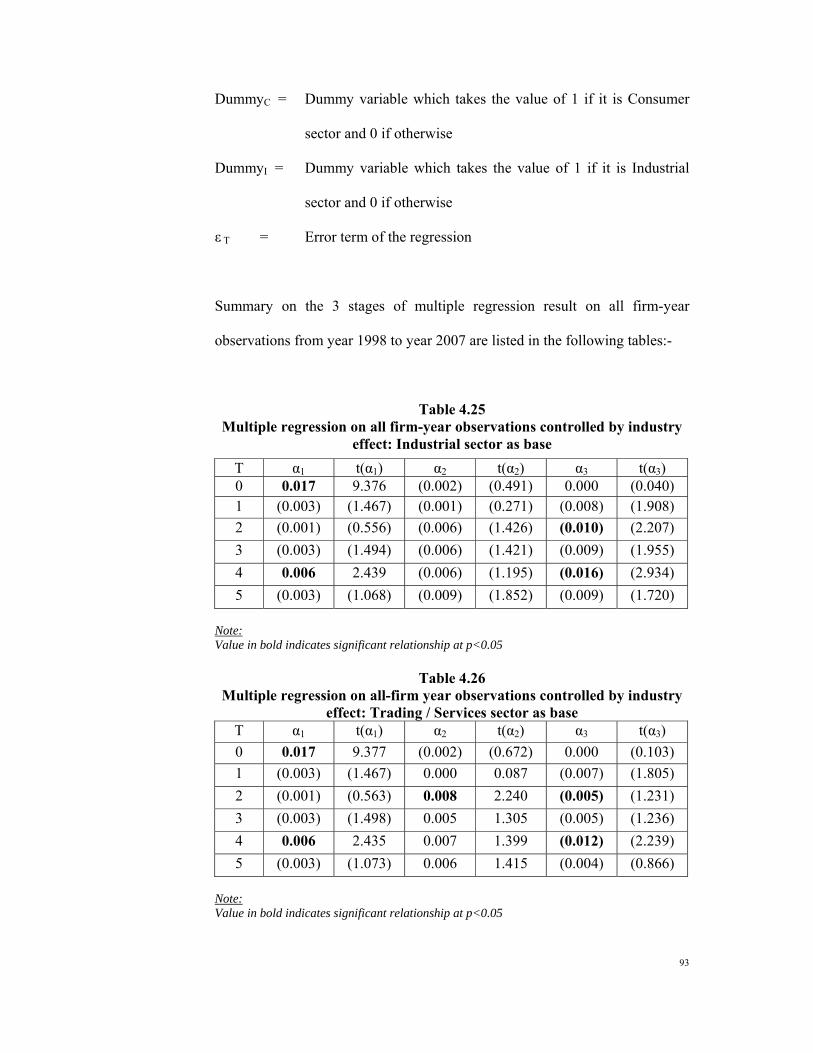
93
DummyC = Dummy variable which takes the value of 1 if it is Consumer
sector and 0 if otherwise
DummyI = Dummy variable which takes the value of 1 if it is Industrial
sector and 0 if otherwise
ε T = Error term of the regression
Summary on the 3 stages of multiple regression result on all firm-year
observations from year 1998 to year 2007 are listed in the following tables:-
Table 4.25 Multiple regression on all firm-year observations controlled by industry
effect: Industrial sector as base T α1 t(α1) α2 t(α2) α3 t(α3) 0 0.017 9.376 (0.002) (0.491) 0.000 (0.040) 1 (0.003) (1.467) (0.001) (0.271) (0.008) (1.908) 2 (0.001) (0.556) (0.006) (1.426) (0.010) (2.207) 3 (0.003) (1.494) (0.006) (1.421) (0.009) (1.955) 4 0.006 2.439 (0.006) (1.195) (0.016) (2.934) 5 (0.003) (1.068) (0.009) (1.852) (0.009) (1.720)
Note: Value in bold indicates significant relationship at p<0.05
Table 4.26
Multiple regression on all-firm year observations controlled by industry effect: Trading / Services sector as base
T α1 t(α1) α2 t(α2) α3 t(α3) 0 0.017 9.377 (0.002) (0.672) 0.000 (0.103) 1 (0.003) (1.467) 0.000 0.087 (0.007) (1.805) 2 (0.001) (0.563) 0.008 2.240 (0.005) (1.231) 3 (0.003) (1.498) 0.005 1.305 (0.005) (1.236) 4 0.006 2.435 0.007 1.399 (0.012) (2.239) 5 (0.003) (1.073) 0.006 1.415 (0.004) (0.866)
Note: Value in bold indicates significant relationship at p<0.05
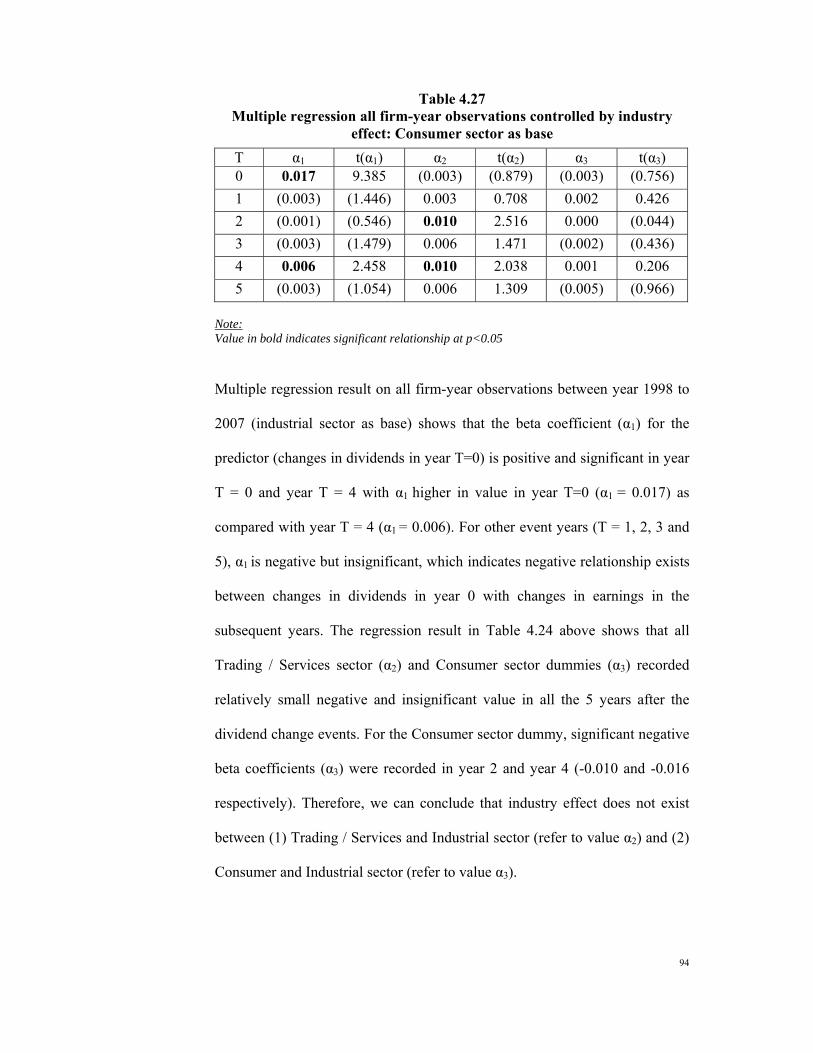
94
Table 4.27 Multiple regression all firm-year observations controlled by industry
effect: Consumer sector as base T α1 t(α1) α2 t(α2) α3 t(α3) 0 0.017 9.385 (0.003) (0.879) (0.003) (0.756) 1 (0.003) (1.446) 0.003 0.708 0.002 0.426 2 (0.001) (0.546) 0.010 2.516 0.000 (0.044) 3 (0.003) (1.479) 0.006 1.471 (0.002) (0.436) 4 0.006 2.458 0.010 2.038 0.001 0.206 5 (0.003) (1.054) 0.006 1.309 (0.005) (0.966)
Note: Value in bold indicates significant relationship at p<0.05
Multiple regression result on all firm-year observations between year 1998 to
2007 (industrial sector as base) shows that the beta coefficient (α1) for the
predictor (changes in dividends in year T=0) is positive and significant in year
T = 0 and year T = 4 with α1 higher in value in year T=0 (α1 = 0.017) as
compared with year T = 4 (α1 = 0.006). For other event years (T = 1, 2, 3 and
5), α1 is negative but insignificant, which indicates negative relationship exists
between changes in dividends in year 0 with changes in earnings in the
subsequent years. The regression result in Table 4.24 above shows that all
Trading / Services sector (α2) and Consumer sector dummies (α3) recorded
relatively small negative and insignificant value in all the 5 years after the
dividend change events. For the Consumer sector dummy, significant negative
beta coefficients (α3) were recorded in year 2 and year 4 (-0.010 and -0.016
respectively). Therefore, we can conclude that industry effect does not exist
between (1) Trading / Services and Industrial sector (refer to value α2) and (2)
Consumer and Industrial sector (refer to value α3).
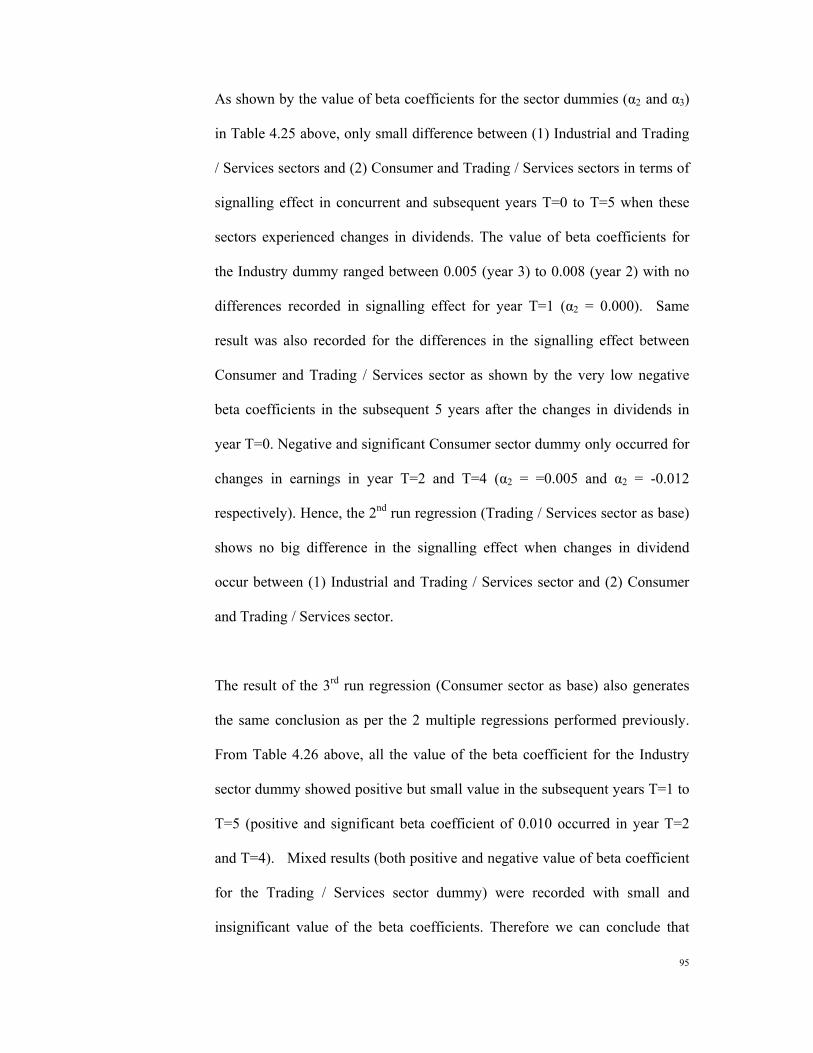
95
As shown by the value of beta coefficients for the sector dummies (α2 and α3)
in Table 4.25 above, only small difference between (1) Industrial and Trading
/ Services sectors and (2) Consumer and Trading / Services sectors in terms of
signalling effect in concurrent and subsequent years T=0 to T=5 when these
sectors experienced changes in dividends. The value of beta coefficients for
the Industry dummy ranged between 0.005 (year 3) to 0.008 (year 2) with no
differences recorded in signalling effect for year T=1 (α2 = 0.000). Same
result was also recorded for the differences in the signalling effect between
Consumer and Trading / Services sector as shown by the very low negative
beta coefficients in the subsequent 5 years after the changes in dividends in
year T=0. Negative and significant Consumer sector dummy only occurred for
changes in earnings in year T=2 and T=4 (α2 = =0.005 and α2 = -0.012
respectively). Hence, the 2nd run regression (Trading / Services sector as base)
shows no big difference in the signalling effect when changes in dividend
occur between (1) Industrial and Trading / Services sector and (2) Consumer
and Trading / Services sector.
The result of the 3rd run regression (Consumer sector as base) also generates
the same conclusion as per the 2 multiple regressions performed previously.
From Table 4.26 above, all the value of the beta coefficient for the Industry
sector dummy showed positive but small value in the subsequent years T=1 to
T=5 (positive and significant beta coefficient of 0.010 occurred in year T=2
and T=4). Mixed results (both positive and negative value of beta coefficient
for the Trading / Services sector dummy) were recorded with small and
insignificant value of the beta coefficients. Therefore we can conclude that
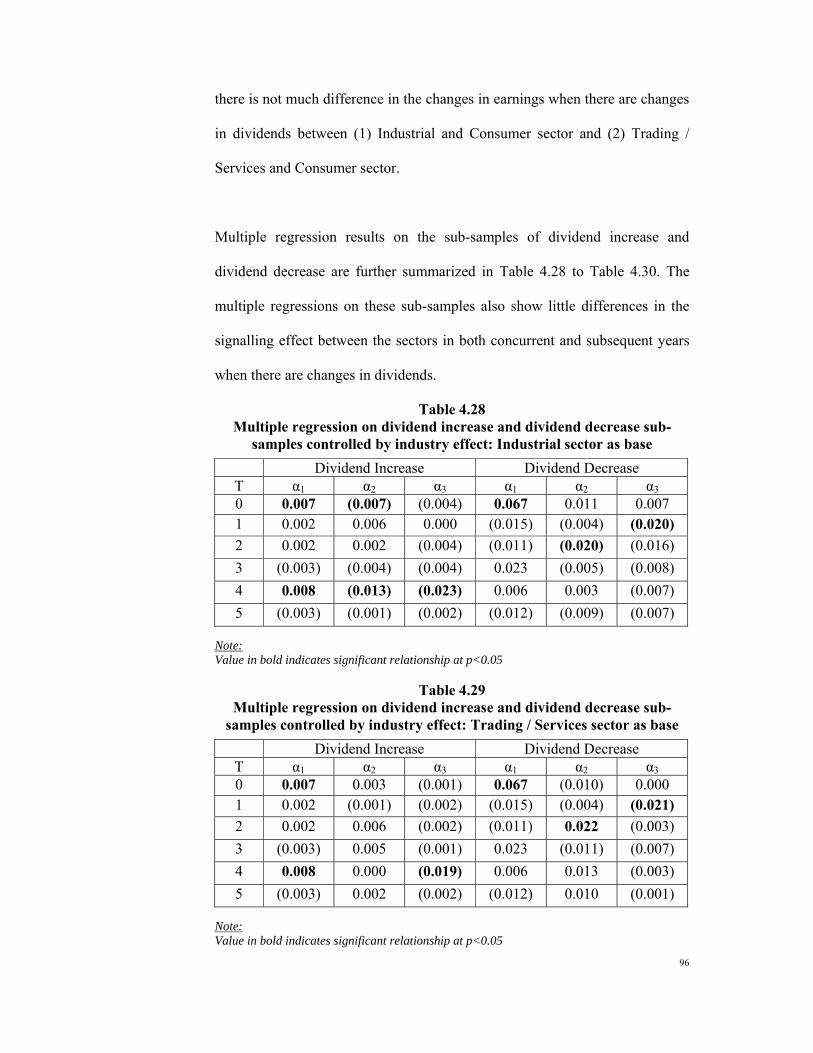
96
there is not much difference in the changes in earnings when there are changes
in dividends between (1) Industrial and Consumer sector and (2) Trading /
Services and Consumer sector.
Multiple regression results on the sub-samples of dividend increase and
dividend decrease are further summarized in Table 4.28 to Table 4.30. The
multiple regressions on these sub-samples also show little differences in the
signalling effect between the sectors in both concurrent and subsequent years
when there are changes in dividends.
Table 4.28 Multiple regression on dividend increase and dividend decrease sub-
samples controlled by industry effect: Industrial sector as base Dividend Increase Dividend Decrease
T α1 α2 α3 α1 α2 α3 0 0.007 (0.007) (0.004) 0.067 0.011 0.007 1 0.002 0.006 0.000 (0.015) (0.004) (0.020) 2 0.002 0.002 (0.004) (0.011) (0.020) (0.016) 3 (0.003) (0.004) (0.004) 0.023 (0.005) (0.008) 4 0.008 (0.013) (0.023) 0.006 0.003 (0.007) 5 (0.003) (0.001) (0.002) (0.012) (0.009) (0.007)
Note: Value in bold indicates significant relationship at p<0.05
Table 4.29 Multiple regression on dividend increase and dividend decrease sub-
samples controlled by industry effect: Trading / Services sector as base Dividend Increase Dividend Decrease
T α1 α2 α3 α1 α2 α3 0 0.007 0.003 (0.001) 0.067 (0.010) 0.000 1 0.002 (0.001) (0.002) (0.015) (0.004) (0.021) 2 0.002 0.006 (0.002) (0.011) 0.022 (0.003) 3 (0.003) 0.005 (0.001) 0.023 (0.011) (0.007) 4 0.008 0.000 (0.019) 0.006 0.013 (0.003) 5 (0.003) 0.002 (0.002) (0.012) 0.010 (0.001)
Note: Value in bold indicates significant relationship at p<0.05
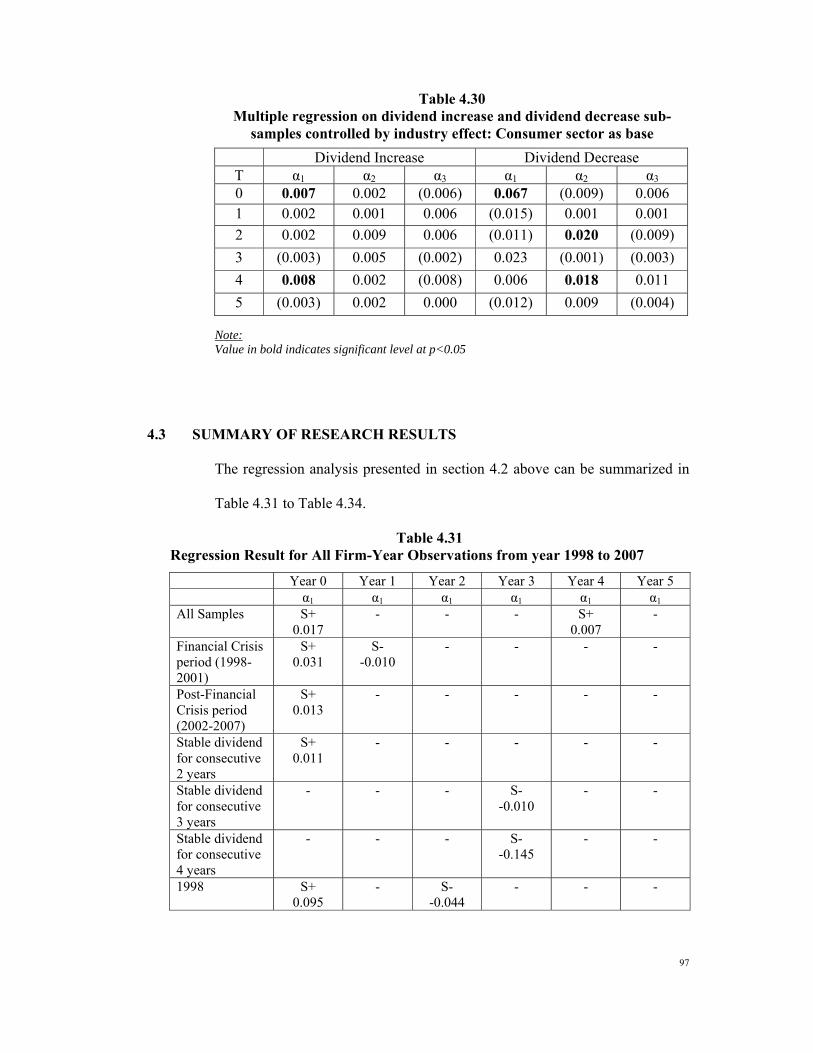
97
Table 4.30 Multiple regression on dividend increase and dividend decrease sub-
samples controlled by industry effect: Consumer sector as base Dividend Increase Dividend Decrease
T α1 α2 α3 α1 α2 α3 0 0.007 0.002 (0.006) 0.067 (0.009) 0.006 1 0.002 0.001 0.006 (0.015) 0.001 0.001 2 0.002 0.009 0.006 (0.011) 0.020 (0.009) 3 (0.003) 0.005 (0.002) 0.023 (0.001) (0.003) 4 0.008 0.002 (0.008) 0.006 0.018 0.011 5 (0.003) 0.002 0.000 (0.012) 0.009 (0.004)
Note: Value in bold indicates significant level at p<0.05
4.3 SUMMARY OF RESEARCH RESULTS
The regression analysis presented in section 4.2 above can be summarized in
Table 4.31 to Table 4.34.
Table 4.31 Regression Result for All Firm-Year Observations from year 1998 to 2007
Year 0 Year 1 Year 2 Year 3 Year 4 Year 5 α1 α1 α1 α1 α1 α1 All Samples S+
0.017 - - - S+
0.007 -
Financial Crisis period (1998-2001)
S+ 0.031
S- -0.010
- - - -
Post-Financial Crisis period (2002-2007)
S+ 0.013
- - - - -
Stable dividend for consecutive 2 years
S+ 0.011
- - - - -
Stable dividend for consecutive 3 years
- - - S- -0.010
- -
Stable dividend for consecutive 4 years
- - - S- -0.145
- -
1998 S+ 0.095
- S- -0.044
- - -
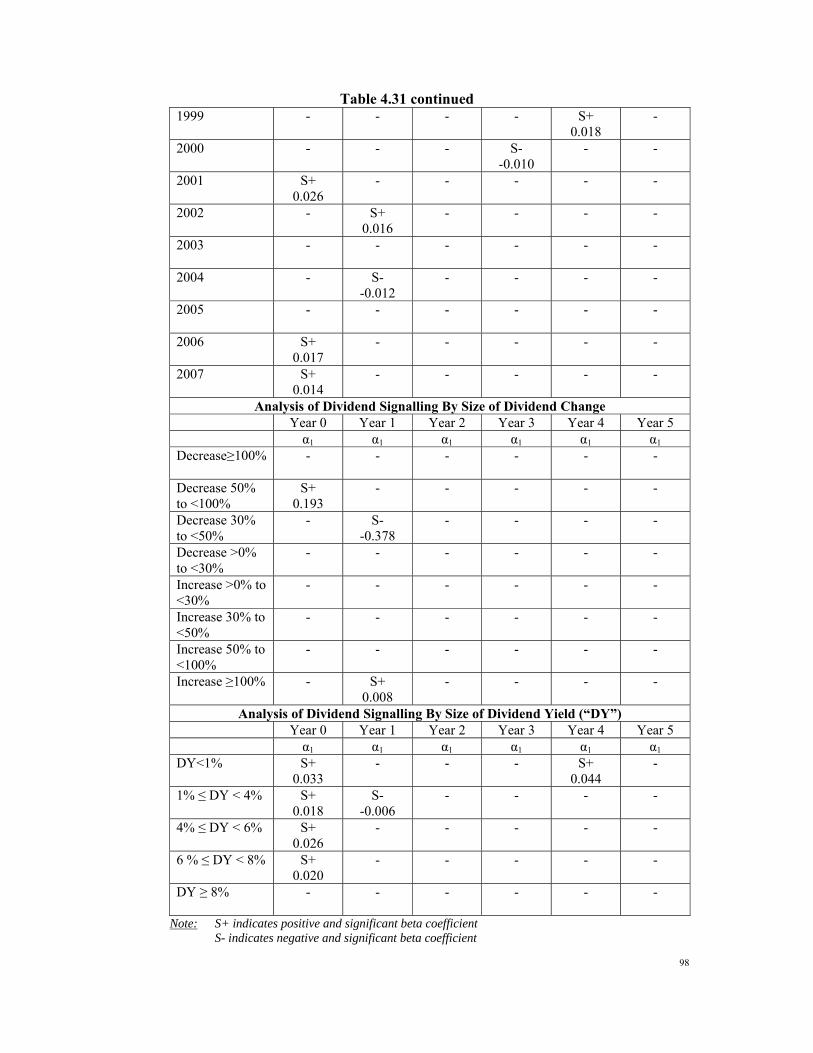
98
Table 4.31 continued 1999 - - - - S+
0.018 -
2000 - - - S- -0.010
- -
2001 S+ 0.026
- - - - -
2002 - S+ 0.016
- - - -
2003
- - - - - -
2004 - S- -0.012
- - - -
2005
- - - - - -
2006 S+ 0.017
- - - - -
2007 S+ 0.014
- - - - -
Analysis of Dividend Signalling By Size of Dividend Change Year 0 Year 1 Year 2 Year 3 Year 4 Year 5 α1 α1 α1 α1 α1 α1 Decrease≥100% - - - - - -
Decrease 50% to <100%
S+ 0.193
- - - - -
Decrease 30% to <50%
- S- -0.378
- - - -
Decrease >0% to <30%
- - - - - -
Increase >0% to <30%
- - - - - -
Increase 30% to <50%
- - - - - -
Increase 50% to <100%
- - - - - -
Increase ≥100% - S+ 0.008
- - - -
Analysis of Dividend Signalling By Size of Dividend Yield (“DY”) Year 0 Year 1 Year 2 Year 3 Year 4 Year 5 α1 α1 α1 α1 α1 α1 DY<1% S+
0.033 - - - S+
0.044 -
1% ≤ DY < 4% S+ 0.018
S- -0.006
- - - -
4% ≤ DY < 6% S+ 0.026
- - - - -
6 % ≤ DY < 8% S+ 0.020
- - - - -
DY ≥ 8% -
- - - - -
Note: S+ indicates positive and significant beta coefficient S- indicates negative and significant beta coefficient
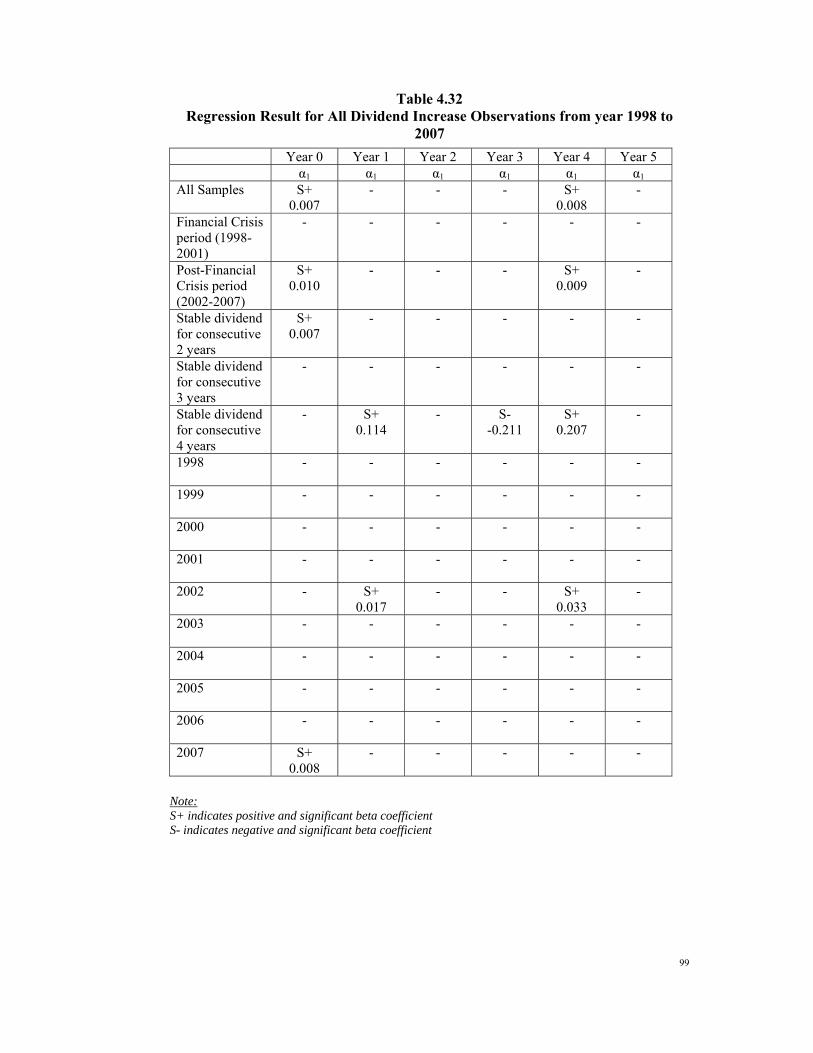
99
Table 4.32 Regression Result for All Dividend Increase Observations from year 1998 to
2007 Year 0 Year 1 Year 2 Year 3 Year 4 Year 5 α1 α1 α1 α1 α1 α1 All Samples S+
0.007 - - - S+
0.008 -
Financial Crisis period (1998-2001)
- - - - - -
Post-Financial Crisis period (2002-2007)
S+ 0.010
- - - S+ 0.009
-
Stable dividend for consecutive 2 years
S+ 0.007
- - - - -
Stable dividend for consecutive 3 years
- - - - - -
Stable dividend for consecutive 4 years
- S+ 0.114
- S- -0.211
S+ 0.207
-
1998
- - - - - -
1999
- - - - - -
2000
- - - - - -
2001
- - - - - -
2002 - S+ 0.017
- - S+ 0.033
-
2003
- - - - - -
2004
- - - - - -
2005
- - - - - -
2006
- - - - - -
2007 S+ 0.008
- - - - -
Note: S+ indicates positive and significant beta coefficient S- indicates negative and significant beta coefficient
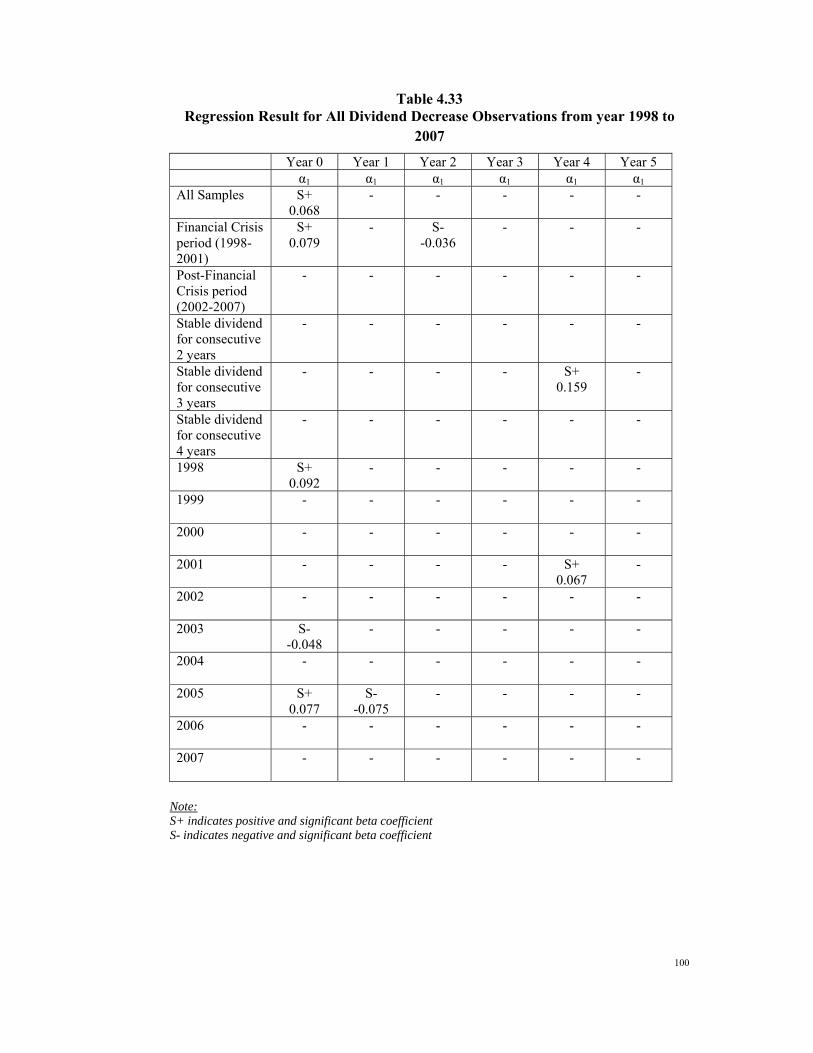
100
Table 4.33 Regression Result for All Dividend Decrease Observations from year 1998 to
2007
Year 0 Year 1 Year 2 Year 3 Year 4 Year 5 α1 α1 α1 α1 α1 α1 All Samples S+
0.068 - - - - -
Financial Crisis period (1998-2001)
S+ 0.079
- S- -0.036
- - -
Post-Financial Crisis period (2002-2007)
- - - - - -
Stable dividend for consecutive 2 years
- - - - - -
Stable dividend for consecutive 3 years
- - - - S+ 0.159
-
Stable dividend for consecutive 4 years
- - - - - -
1998 S+ 0.092
- - - - -
1999
- - - - - -
2000
- - - - - -
2001 - - - - S+ 0.067
-
2002
- - - - - -
2003
S- -0.048
- - - - -
2004
- - - - - -
2005
S+ 0.077
S- -0.075
- - - -
2006
- - - - - -
2007
- - - - - -
Note: S+ indicates positive and significant beta coefficient S- indicates negative and significant beta coefficient
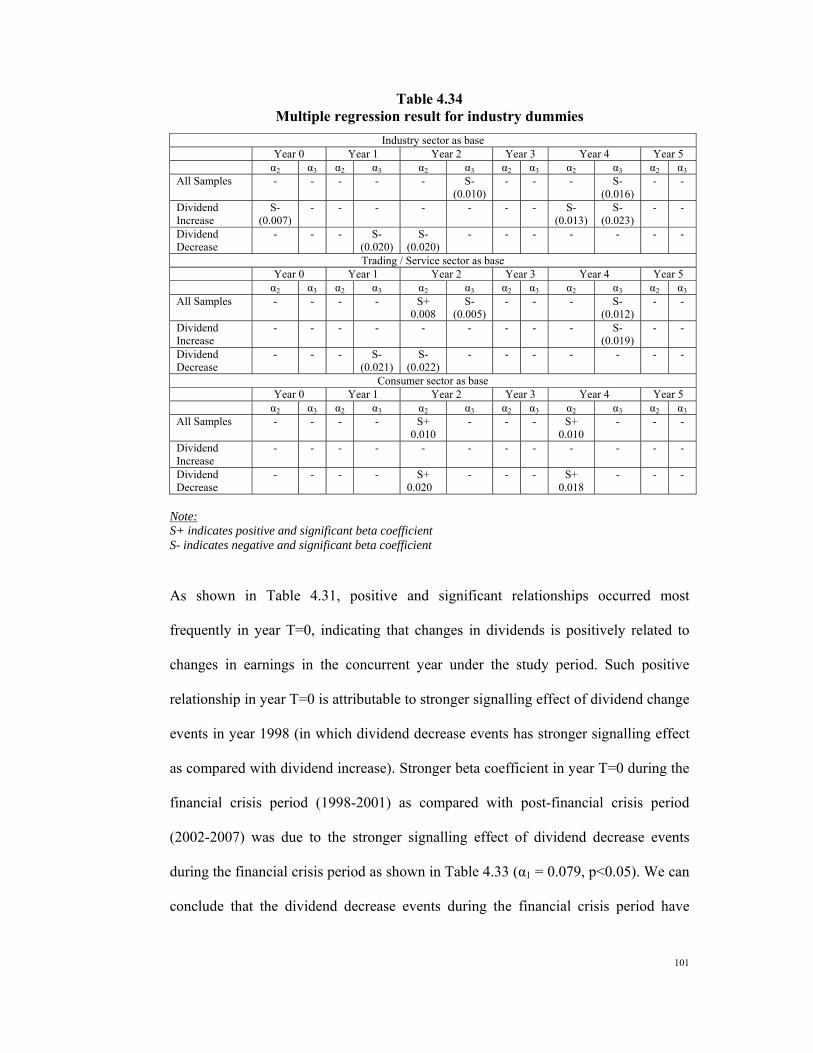
101
Table 4.34 Multiple regression result for industry dummies
Industry sector as base Year 0 Year 1 Year 2 Year 3 Year 4 Year 5 α2 α3 α2 α3 α2 α3 α2 α3 α2 α3 α2 α3 All Samples - - - - - S-
(0.010) - - - S-
(0.016) - -
Dividend Increase
S- (0.007)
- - - - - - - S- (0.013)
S- (0.023)
- -
Dividend Decrease
- - - S- (0.020)
S- (0.020)
- - - - - - -
Trading / Service sector as base Year 0 Year 1 Year 2 Year 3 Year 4 Year 5 α2 α3 α2 α3 α2 α3 α2 α3 α2 α3 α2 α3 All Samples - - - - S+
0.008 S-
(0.005) - - - S-
(0.012) - -
Dividend Increase
- - - - - - - - - S- (0.019)
- -
Dividend Decrease
- - - S- (0.021)
S- (0.022)
- - - - - - -
Consumer sector as base Year 0 Year 1 Year 2 Year 3 Year 4 Year 5 α2 α3 α2 α3 α2 α3 α2 α3 α2 α3 α2 α3 All Samples - - - - S+
0.010 - - - S+
0.010 - - -
Dividend Increase
- - - - - - - - - - - -
Dividend Decrease
- - - - S+ 0.020
- - - S+ 0.018
- - -
Note: S+ indicates positive and significant beta coefficient S- indicates negative and significant beta coefficient
As shown in Table 4.31, positive and significant relationships occurred most
frequently in year T=0, indicating that changes in dividends is positively related to
changes in earnings in the concurrent year under the study period. Such positive
relationship in year T=0 is attributable to stronger signalling effect of dividend change
events in year 1998 (in which dividend decrease events has stronger signalling effect
as compared with dividend increase). Stronger beta coefficient in year T=0 during the
financial crisis period (1998-2001) as compared with post-financial crisis period
(2002-2007) was due to the stronger signalling effect of dividend decrease events
during the financial crisis period as shown in Table 4.33 (α1 = 0.079, p<0.05). We can
conclude that the dividend decrease events during the financial crisis period have
102
stronger signalling effect as compared with dividend increase events and dividend
cuts occurred in year 1998 have the strongest influence in determining the positive
and significant value of the beta coefficients recorded under the study period.
Only positive and significant beta coefficient was recorded for dividend decrease
between 50% to less than 100% in year T=0 and this indicates that stronger signalling
effect only occurred in year T=0 when the size of dividend decrease is very large. For
the regression analysis on different categories of dividend yield, positive and
significant relationship occurs in year T=0 when the dividend yield was less than 8%.
However, no significant relationship is found between both changes in dividends and
earnings in the concurrent year T=0 when the dividend yield is more than 8% due to
smaller sample of companies (less than 100 companies). As there is no increase in the
value of the beta coefficients when the dividend yield becomes larger, we can
conclude that no relationship exists between the size of dividend yield and the extent
of dividend signalling in the concurrent year T=0.
No strong relationships occurs between changes in dividend with changes in earnings
in the subsequent years from T=1 to T=5 as shown in Table 4.31. In most cases, there
are negative and significant relationships between changes in dividends in year T=0
with subsequent changes in earnings. Such negative relationships occurred due to the
utilization of cash reserves from dividend cuts in year T=0 in pursuing more income-
generated activities and as the consequence, the earnings of the company increases in
the subsequent years following the dividend decrease. In most circumstances, the
frequency of occurrence of positive and significant beta coefficients is higher under
the post-financial crisis period, while under the financial crisis period, most beta
103
coefficients recorded negative and significant value after dividend change events in
year T=0.
An interesting result observed in year T=4 shows a weak positive and significant
relationship existed between changes in dividends in year T=0 with subsequent
changes in earnings in year T=4 (α1 = 0.007, p<0.05). Such weak positive signalling
effect was more strongly influenced by dividend increase events that occurred after
stable DPS for consecutive 4 years (refer to Table 4.32 which shows α1 = 0.207,
p<0.05). For the dividend decrease sub-sample, positive and stronger relationship
recorded for the relationship between decrease in earnings in year T=4 with decrease
in dividends in year T=0 under the scenario of stable dividend for 3 consecutive years.
Dividend decrease events that occurred after a shorter period of stable dividends i.e. 3
years recorded positive and significant beta coefficients, while for the dividend
increase sub-sample, signalling effect occurs after a longer period of stable dividends,
i.e. 4 years. Hence, we can conclude that the signalling effect of dividend decrease is
more prominent after a shorter period of stable dividend and dividend increase events
will only show its signalling effect after a longer period of stable dividend. No
positive and significant relationship is recorded between changes in dividends in year
0 with changes in earnings in year 5.
In concluding the relationship between changes in dividends with changes in earnings,
the regression result clearly shows that the relationship is stronger and prominent for
both changes in dividends and earnings in the concurrent year T=0. Hence, the
conclusions of the regression results , expressed by way of the acceptance or rejection
of the hypotheses as listed in Section 3.1 above are as follows:-
104
(A) Relationship between changes in dividends in current year with changes in
earnings in the concurrent and subsequent years:
Accept hypothesis HAo: Companies that change their dividends in year 0 will
not experience any changes in unexpected earnings in the following years, i.e.
year 1 to year 5. Instead, there is a positive and significant relationship
between changes in dividends and unexpected earnings in the concurrent year.
(B) Relationship between increase in dividend in current year with increase in
earnings in the concurrent and subsequent years:
Accept HBo: There is no relationship between increase in dividends in the
concurrent year with increase in the unexpected earnings in the subsequent
years from year 1 to year 5. Instead, there is a positive and significant
relationship between increase in dividends with increase in unexpected
earnings in the concurrent year.
(C) Relationship between decrease in dividends in current year with decrease in
earnings in the concurrent and subsequent years
Accept HCo: There is no relationship between decrease in dividends in
current year with decreases in unexpected earnings in subsequent years from
year 1 to year 5. Instead, there is a positive and significant relationship
between decrease in dividends with decrease in unexpected earnings in the
concurrent year.
The testing of dividend signalling for each individual year from year 1998 to 2007
shows stronger and significant relationship between changes in dividends and changes
105
in earnings exists in year T=0, which supports the hypothesis HA0 and HC0 above.
However when testing hypothesis B under each individual year from year 1998 to
2007, a positive relationship exists between increase in dividends in year T=0 with
increase in earnings in year T= 1 (for all firm-year observations and dividend increase
events in year 2002) and year T= 4 (for dividend increase events in year 2002), while
the remaining years shows no positive significant relationship. In view of the result
generated, we can conclude that weak signalling effect occurs for dividend increase
events in year 2002 with increase in earnings in year 2003 and 2006.
The result on the case by case analysis on dividend change events occurred after
stable dividend for consecutive 2 years, 3 years and 4 years showed that the dividend
signalling effect is stronger and prominent for both changes in earnings and dividends
in the concurrent year T=0. As shown in Table 4.31, weak positive and significant
relationship recorded in year T=0 for dividend change events that occurred after
stable dividend for 2 consecutive years (α1 = 0.011, p<0.05). Stronger positive and
significant beta coefficients occurred for the relationship between (1) increase in
dividend (after 4 years of stable dividend) with increase in earnings in year T=4 (α1 =
0.207) and (2) decrease in dividend (after 3 years of stable dividend) with increase in
earnings in year T=4 (α1 = 0.159). In view of the smaller value of beta coefficients
recorded, we can conclude that weak relationship exists between the stability of
dividend with the extent of dividend signalling as follows:-
106
(D) Relationship between the stability of dividend before changes in dividends
with the extent of dividend signalling
Accept HDo: There is no relationship between the stability of dividend
before changes in dividends with the extent of dividend signalling.
The regression analysis to examine the extent of dividend signalling based on
different sizes of dividend change has further generate the following result :-
(E) Relationship between the size of changes in dividends with the extent of
dividend signalling
Accept HEo: There is no relationship between the size of changes in
dividends with the extent of dividend signalling.
The analysis on the extent of dividend signalling based on different sizes of dividend
change shows that the signalling effect becomes stronger when the size of dividend
decrease becomes larger and such positive relationship is prominent only in year T=0.
For the dividend increase events, such positive relationship between the size of
dividend increase with dividend signalling only occurs in year T=0 when the size of
dividend increase ranged between 0% to less than 50%. Further analysis on the extent
of signalling in the subsequent years from T=1 to T=5 shows that only 3 cases which
showed the positive relationship between size of dividend change with the extent of
dividend signalling as follows:-
(a) when the dividend decreases from 30% onwards, the signalling effect becomes
stronger in year T = 3 at larger dividend decrease (α1 increased from 0.015 to
0.086, insignificant with p>0.05)
107
(b) when the dividend decreases from 0% to less than 50%, the signalling effect
becomes stronger in year T = 4 at larger dividend decrease (α1 increased from
0.051 to 0.155, insignificant with p>0.05)
(c) when the dividend increases from 0% to less than 50%, the signalling effect
becomes stronger in year T = 5 at larger dividend increase (α1 increased from
0.042 to 0.047, insignificant with p>0.05)
The regression analysis on the relationship between dividend yield and the extent of
dividend signalling shows dividend signalling becomes stronger when the dividend
yield increases from 1% to less than 6% and this only occurred in year T=0. No
significant continuous increase in the value of beta coefficients when the dividend
yield increases in the subsequent years from year 1 to year 5. As such, the following
conclusion is made:-
(F) Relationship between dividend yield and the extent of dividend signalling
Accept HF0: There is no relationship between dividend yield and the extent
of dividend signalling.
Finally, the following conclusion was arrived after multiple regression analysis was
performed to examine whether there is any difference between sectors in their
signalling effect when there are changes in dividends:-
(H) Industry effect in influencing the extend of dividend signalling
Accept HG0: Industry effect does not have any influence on the extent of
dividend signalling of the companies.
108
The above conclusion is achieved based on the relative small beta coefficients for the
sector dummies generated from the regression analysis as shown in Table 4.34 above.
Overall, from the series of the regression results concluded above, it is clear that
dividend signalling does not exist among the Main Board listed companies in
Malaysia, which are consistent with the studies done by Grullon et al (2005) and
initial analysis done by Nissim and Ziv (2001) who had adopted the regression
equation of Benartzi et al (1997). Both studies by Nissim and Ziv (2001) and Benartzi
et al (1997) showed the beta coefficient α1 is positive and highly significant in year T
= 0 but is insignificant for T =1 and T=2.
109
CHAPTER 5: CONCLUSIONS AND RECOMMENDATIONS 5.1 CONCLUSION
The result of this study shows that Main Board companies do not use dividends as a
signalling tool to convey future prospect of the companies, which is consistent with
the findings by Grullon et al (2005) and Nissim and Ziv (2001). Positive and
significant relationship exists between changes in dividends and changes in earnings
in the concurrent year T=0, which strongly proved that changes in dividends are
related to changes in earnings in the past. In fact, in most circumstances, dividend
decreases has a stronger signaling effect in the concurrent year T=0 and are not
related to future profitability, which is consistent with the research findings by
Grullon et al (2005). Overall, the positive and significant relationship between both
changes in dividends and earnings in the concurrent year T=0 for all firm-year
observations under the study period from 1998 to 2007 was strongly influenced by the
dividend decrease events occurred in year 1998. Separate studies on both financial
crisis period and post-financial crisis period shows difference in the signaling effect of
dividend increase and dividend decrease events; with the former has a stronger
signaling effect post-financial crisis period, while the later has a stronger signaling
effect during the financial crisis period.
A comparison amongst the dividend change events that occurred after consecutive 2
years, 3 years and 4 years of stable dividend shows that the signalling effect of
dividend decrease is more prominent after a shorter period of stable dividend as
compared with dividend increase. While the dividend increase events show stronger
signalling effect after a longer period of stable dividend. The result is consistent with
the Lintner (1956) which showed that firms rarely changed their dividend policies
110
unless the management of the firms were confident that the firms can maintain the
higher or lower level of dividends in the future. Hence, investors may consider a cut
in dividends as a stronger signal as compared with the dividend increase events.
However, no strong signalling effect is observed for dividend change events that
occurred after longer period of stable dividends, which supports the acceptance of
hypothesis HD0 above.
Regressions to test the extent of dividend signalling given different sizes of dividend
change and dividend yield were conducted based on the assumptions that the bigger
the size of the dividend changes and dividend yield, the stronger the signalling effect
as dividends are sticky (firms rarely change their dividends). Hence any major
changes in dividends may be viewed by the investors as signals by the firms on the
future prospects of the firm. For the relationship between the dividend yield and the
extent of dividend signalling, regression is performed on the rationale of clientele
effect. The results on both regressions show that (1) no strong relationship exists
between the size of dividend change with the extent of dividend signalling and (2) no
strong relationship exists between the size of dividend yield with the extent of
dividend signalling. The result of the regression to test the dividend signalling based
on different sizes of dividend changes shows a stronger significant relationship
existed for dividend decrease and concurrent earnings decrease in year T=0. For the
regression result on the relationship between the size of dividend yield and the extent
of dividend signalling, positive and significant relationship exists for the dividend
yield ranges from 1% to less than 6% in year T=0. For subsequent years from T=1 to
T=5, the regression results showed mixed results with both positive and negative
value of beta coefficient and no consistent increase in the beta coefficients values

111
when the dividend yield increases.
Finally, multiple regressions by incorporating industry effect or “peer influence”
proved that industry effect does not exist, as can be observed from the low value of
the beta coefficient of the sector dummies (α2, α3). In other words, there is no different
in the changes in earnings between the sectors when there are changes in dividends.
To further obtain the evidence that Main Board listed companies in Malaysia do not
use changes in dividend to signal information on the future prospects of the
companies, informal interviews were conducted with a few Group Accountant and
Chief Financial Officers of Main Board listed companies. All of them agreed that
dividend signalling does not exist in Malaysia and there are certain established
corporations which adopt dividend signalling theory while majority are still catching
up with the ideas of dividend signalling. Some of them claimed that the dividend
behaviour of listed companies in Malaysia is more towards dividend speculation
rather than dividend signalling as controlling shareholders would have the most
influence in the dividend payouts of the investee company unless the company adopts
a clear dividend policy which spells out the quantum of dividend payout per dollar
earned. The reasons of dividend are not used as a signalling tool to the investors can
be summarized as follows:-
(1) Earnings in the future are unpredictable
The earnings of a company is unpredictable in the future and hence changes in
dividend shall not be used as a signalling tool. This statement supports
Lintner’s findings in the United States that firms were reluctant to increase
112
dividends to levels that cannot be sustained. The concept of “sticky dividends”
as per Lintner’s findings was also noted by Donaldson (1961) in which the
later observed that although the firms in the United States have target payout
ratios to their investment opportunities, any changes in dividend payments
were done gradually to void sudden changes in dividend payments.
(2) Composition of the shareholders
The inexistence of dividend signalling in Malaysia conveys an important
earnings behaviour following changes in dividend in which in most
circumstance an increase (decrease) in the dividends in year T=0 will be
followed by a decrease (increase) in the earnings in the subsequent years. Such
phenomena may be attributable to the dividend policy of a company which is
more focus on paying higher dividends regardless of its earnings position. The
decision of continuously paying dividends to investors was attributable to the
composition of its shareholders who value dividends as a “sure” return as
compared with share price appreciation, which we referred as to the “Bird-in-
Hand Fallacy”. For companies controlled by institutional investors or the
company is a trustee stock company11, such companies may maintain certain
period of uninterrupted dividend payments in accordance to the investment
guidelines or investment philosophy of such institutional investors which
require continuous payment of dividends as a source of investment income.
1 For shares categorised as trustee stock in accordance to Section 4 of Tustee Act 1949, the company must have (1) paid-up share capital of not less than RM5 million; (2) pay dividend not less than 5% for the past 3 years; and (3) total amount of borrowings (including interest due) does not exceed 2/3 of the borrowing amount from the borrower.

113
(3) Section 108 of Income Tax Act
This Section can be considered as a constraining factor on the dividend
payments of the company as Malaysian companies generally pay dividend
without incurring additional tax payment to the government by not paying
dividends more than the amount allowed by Section 108 credit balance of
notional account. Credit entry will be made for the current year’s income tax
payable while a tax deduction on the gross dividend declared is debited into
the account.
(4) Fulfilment of shareholders’ need on return on investment
Some respondents mentioned that one of the reason dividend signalling does
not exist in Malaysia is due to the companies wish to fulfil the need of
shareholders to get their dividends as a source of return on their investments,
especially during the period of losses, albeit a smaller sum.
(5) Fund requirement for expansion in the future
According to the reply from the respondents, it is quite common for the
companies to pay consistent dividends as to reserve funds for expansions or
dividend payment in the future and therefore dividend signalling does not
happen in Malaysia.
(6) More concern on changes in share price as compared with dividend
Companies do not use dividends as a signalling tool to the investors may be
attributable to Malaysian investors who do not pay much attention to dividend
announcement. Instead, more concern is placed on share price appreciation as
114
a “short-term” return to the investors.
Subsequent to the interviews conducted on Group Accountants and Chief Financial
Officers of Main Board listed companies on their views on dividend signalling,
further examination on previous literatures in dividend policy in other countries
shows that other possible reasons or factors that caused the inexistence of dividend
signalling as follows:-
(7) Difference in the firm’s characteristics
Although managers in some extent may use dividend (especially dividend
decease) to convey useful information on the firm’s future prospect, changes
in dividends are not perfect signals to the investors. According to research
done by Easterbrook (1994), dividend increase may be an ambiguous signal
unless the market can distinguish between growing firms and firms with a lack
of investment opportunities. A growing firm may reduce its dividend payment
for strategic investments in income generating assets or expansion of its
operations but experience increase in earnings following a dividend cut, which
can be explained by the increase in return generated from the new investment
made in pervious year.
(8) Dividend smoothing behaviour of firms
Although managers advocated a long-range target payout ratio (Fama and
Babiak, 1968; Baker et al, 1985), most managers believe that shareholders
prefer a steady increase of dividends. Hence, managers sought to avoid
making changes in their dividend payment that might have to be reversed in
115
the future although they foresee possible earnings reduction in the coming
years. Therefore, managers tend to make partial adjustments toward a target
payout ratio rather than dramatic changes in the dividends. In other words,
managers “smooth” their dividend payment in the short run to avoid frequent
changes in the future.
(9) Changes in dividends are related to permanent cash flow increase
Research by Yaron (1998) showed that only firms with permanent increase in
cash flow will increase their dividends. In his study which established the
direct link between positive income shocks, dividend decisions and stock
returns, his result showed that all or even most dividend decisions were not
signalling the future profitability. The subdivision of the firms into (1) firms
with permanent increase in cash flows and (2) firms with temporary increase
(“TI”) in cash flows showed that TI firms will increase their dividends
substantially when their cash flows increase. Following the initial increase in
dividends, the dividends of the TI firms will continue to increase at a slower
rate despite the fall of cash flow in the subsequent years. It shows that the TI
firms are reluctant to acknowledge negative earnings information and do not
aware of the continue deteriorating of their financial performance. Yaron’s
result is consistent with the result of Benartzi et al (1997) which showed that
dividends are related to the past and not future earnings. In addition, the
research result shows that the size of dividend increases in prior years have no
relationship with future changes in earnings, which are consistent with the
result of this research study.
116
(10) Concern of managers on market reaction towards dividend change events
As most shareholders react to dividend change announcement by interpreting
the dividend increase as positive signals and vice versa, managers normally do
not use dividends as signals for negative information. DeAngelo et al (1992)
argued that the reliability of dividends as a signalling mechanism was reduced
by the over optimism of the managers and small cash obligations associated
with dividend increase.
(11) Availability of other mechanism of profit distribution
Firms that decrease their dividends may accumulate cash for their proposed
share-buybacks as another mechanism of profit distribution to shareholders.
When a firm implement its share-buybacks, the firm believes that the shares of
the firms are undervalued with good prospects. According to Vermaelen
(1984), share-buybacks signals improved future profitability. Hence a decrease
in dividend may be followed by an increase in earnings in the following years.
In relation to the question on whether the respondent’s company dividend decision is
influenced by dividend decisions of other company (i.e. industry effect in the dividend
decision), all the respondents agree that in some extent, dividend decisions or
announcement by their peers served as a guide to their dividend decisions but will not
influence the dividend decisions of the company. This is due to (1) every company
performed differently from their peers in term of profitability and cash flows; (2)
dividend payment tends to follow previous dividend payout track record; and (3)
every company has its own capital expenditure requirement, i.e. need to retain certain
amount of cash not distributable as dividends and (4) the dividend decision of a

117
company is not comparable with other dividend decisions of other companies as some
Malaysian listed companies have varied interests in other businesses other than their
mainstay.
Given the result of the research, we can conclude that changes in dividend are not
strong signalling tools for the Main Board companies in Malaysia and hence investors
should not rely to dividend change to predict future prospect of a company.
5.2 SUGGESTIONS FOR FUTURE RESEARCH
The current study on dividend signaling of Main Board listed companies covers a
relatively smaller number of firm-year observations as compared with major dividend
signalling studies conducted in other developed markets. For researchers who wish to
conduct more in depth studies on dividend signalling in Malaysia in the future, they
may consider the following suggestions:-
(a) Studies shall cover both Main Board and Second Board companies in
Malaysia. Comparisons between the regression results on Main Board
companies with Second Board companies could be done to examine the
differences in terms of signalling effect of these companies.
(b) Generally, most of the studies on dividend signalling covered annual
dividends changes with no strong support on dividend signalling hypothesis.
Researchers might consider to study on the relationship between special
dividends and interim dividends declared by companies that rarely practiced

118
such profit distribution in the past to examine whether the declaration of
special dividends and interim dividends conveys forward-looking information.
(c) Companies with different ownership structure might be different in
communicating their future prospects to the external shareholders as
companies that are mostly controlled by the management and employees
might not use dividend as signalling tool. Researchers might conduct studies
on two different group of companies (highly concentrated in ownership and
dispersed ownership companies) to examine the dividend signalling effect.
(d) Current research results do not support the dividend signalling hypothesis for
the Main Board listed companies in Malaysia due to factors such as
shareholder structure, income tax regulation in Malaysia etc, which are
obtained from informal interviews. As such, research studies in the future may
structure the study on dividend signalling by way of structured questionnaires
or face-to-face interviews with the chief financial officers of the listed
companies to study on the factors that affect the dividend decision of the
company.
Generally, many possibilities and factors that may affect the signalling effect of
dividend and researchers should explore other factors that may influence the dividned
signaling in Malaysia.
119
REFERENCES Abeyratna, G. and Power, David M. (2002), “The Post-announcement Performance of Dividend-changing Companies: The Dividend-Signalling Hypothesis Revisited,” Accounting and Finance, 42, 131-151. Aharony, J. and A. Dotan (1994), “Regular Dividend Announcements and Future Unexpected Earnings: An Empirical Analysis,” Financial Review, 29 (1) (February), 125-151 Aharony, J. and I. Swary, (1980), “Quarterly Dividend and Earnings Announcements and Stockholders’ Return: An Empirical Analysis,” Journal of Finance, Vol. XXXV (1) (March), 1-12 Al-Sharaks, A. (2005), “Dividend Policy and Future Cash Flows,” Finance India, Vol. XIX (3) (September), 901-913 Annuar, M.N. and Shamser, M. (1993), “Earnings and Dividend Behavior,” Journal of Social Science and Humanities, 1(2), 171-177 Ariff, M. (2008), “Twenty-Third National Economic Briefing,” Malaysia, Malaysian Institute of Economic Research Ariff, M. and Johnson, L.W. (1994), “Securities Market and Stock Pricing: Evidence from a Developing Market in Asia, Singapore, Sydney and London,” Journal of Social Science and Humanities, 1 (2), 171-177. Arnott, Robert D. and Asness, Cliford S., (2001), “Does Dividend Policy Foretell Earnings Growth?” SSRN Working Paper Bajoj, M and Anand M. Vijh (1990), “Dividend Clientele and the Information Content of Dividend Changes,” Journal of Financial Economics, 26, 193-219. Baker, H. (1988), “Relationship between Industry Classification and Dividend Policy,” Southern Business Review, 14 (1), pp 1-8. Baker, H.K., E.T. Veit and G.E. Powell (2001), “Factors Influencing Dividend Policy Decisions of Nasdaq Firms,” The Financial Review, 36 (3), 19-39. Baker, H.K., G.E. Farrelly and R. B. Edelman (1985), “A Survey of Management Views on Dividend Policy,” Financial Management (Autumn), 78-87 Baker, H. K. and G.E. Powell (2000), “Determinants of corporate dividend policy: A survey of NYSE firms”, Financial Practice and Education, 10 (1), 29-40. Baker, H. K., Mukherjee, Tarun K. and Paskelian, Ohannes G., (2006), “How Norwegien Managers View Dividend Policy,” Global Finance Journal, 17(1), 155-176 Bank Negara Malaysia Monthly Statistical Bulletin, (July 2008), Kuala Lumpur: Bank Negara Malaysia.
120
Benartzi, S., R. Michaely and R. Thaler (1997), “Do changes in dividends signal the future or the past?” Journal of Finance, 52(3) (July), 1007-1034 Bernhardt, Dan. Douglas, Alan and Robertson, Fiona (2005), “Testing Dividend Signalling Models,” Journal of Empirical Finance, 12, 77-98 Bernheim B.D. and A.Wantz. (1995), “A Tax Based Test of the Dividend Signalling Hypothesis,” American Economic Review, Vol. 85, 532-551 Berry, W. D. and Feldman, S. (1985). Multiple regression in practice, London: Sage Publications. Bhattacharya. Sudipto (1979), “Imperfect Information, Dividend Policy and the Bird in the Hand Fallacy,” Bell Journal of Economics, 10(1), 259-270 Black, F. (1976), “The Dividend Puzzle”, Journal of Portfolio Management (Winter): 5-8 Brav, A.J.R., Graham C.R. Harvey and R, Michaely (2003), “Payout Policy in the 21st Century,” Working Paper, National Bureau of Economic Research, Cambridge, MA. Brennam, M. (1970), “Taxes, Market Valuation & Corporate Financial Policy,” National Tax Journal, 23, 417-427 Brickley, J.A. (1983), “Shareholders Wealth, Information Signalling and the Specially Designated Dividend: An Empirical Study”, Journal of Financial Economics, 12 (August), 187-209 Chen, Chung and Wu, Chunchi (1999), “The Dynamics of Dividends, Earnings and Prices: Evidence and Implications for Dividend Smoothing and Signalling,” Journal of Empirical Finance, 6(1), 29-58 Chin, Bun Tse (2005), “Use dividend to signal or not: an examination of the UK dividend payout patterns”, Managerial Finance, 31(April), 12-32 Coakes, Sheridah J. and Steed, Lyndall (2007), SPSS Version 14 for Windows: Analysis without Anguish, Australia: John Wiley & Sons Australia, Ltd. Copeland, Thomas E., and Weston, J. Fred (1988), Financial Theory and Corporate Policy, United States: Addison-Westley Publishing Company Damodaran, Aswath (2001), Corporate Finance: Theory and Practice, United States: John Wiley & Sons Inc. DeAngelo, Harry and DeAngelo Linda (1990), “Dividend Policy and Financial Distress: Am Empirical Investigation of Troubled NYSE Firms,” The Journal of Finance, 45(5), 1415-1431. DeAngelo, H., DeAngelo, L. and Skinner, Douglas J. (1992), “Dividends and Losses,” The Journal of Finance, 47(5), 1837-1863 Donaldson, G. (1961), “Corporate Debt Capacity”, Division of Research, Graduate School of Business Administration, Harvard University.
121
Easterbrook, F.H. (1984), "Two Agency-Cost Explanations of Dividends," American Economic Review, 74, no. 3 (September), 650-658. Fama, E.F. (1970), “Efficient Capital Markets: A Review of Theory and Empirical Work,” Journal of Finance, 25, 384-417 Fama, F. (1974), “The Empirical Relationship between the Dividend and Investment Decisions of Firms,” American Economic Review, 64 (3), pp. 304-18 Fama, E.F. and H. Babiak, (1968), “Dividend Policy: An Empirical Analysis,” Journal of the American Statistical Association, 63(324), 1132-1161 Fama, E.F. and K.R. French (1998), “Dividends, Debt, Investment and Earnings,” Working Paper, Graduate School of Business, University of Chicago. Fama, E.F. and K.R. French (1998), “Taxes, Financing Decisions and Firm Value,” Journal of Finance, Vol. 53, 819-844 Fudenberg, D. and Jean Tirol (1995), “A Theory of Income and Dividend Smoothing Based in Incumbency Rents,” Journal of Political Economy, February, 75-93. Garrett, I. and Priestly, R (2000), “Dividend Behavior and Dividend Signalling,” Journal of Finance and Quantitative Analysis, 35 (2) (June), 173-189 Glen, J. D., Karmokolias, Y., Miller, R. and Shah, S. (1995). “Dividend Policy and Behaviour in Emerging Markets: To Pay or Not to Pay,” IFC Discussion Paper No. 26. Goergen, M., Renneboog, L. and Silva, L (2005), “When do German Firms Change Their Dividends?” Journal of Corporate Finance, 11(2), 378-399 Gonedes, N. J (1978), “Corporate Signalling, External Accounting, and Capital Market Equilibrium: Evidence on Dividends, Income and Extraordinary Items,” Journal of Accounting Research, Vol. 16, 26-79 Greene, W.H. (2000, 4th edition), Econometric Analysis, New Jersey: Prentice Hall. Grullon, G., Michaely, R (2001), “Asymmetric Information, Agency Conflicts and the Impact of Taxation on the Market Reaction to Dividend Changes,” Working Paper, Cornell Universirty, Italiana, New York. Grullon, G., Michaely R., Benartzi, S. and Thaler R.H. (2003), “Dividend Changes Do Not Signal Changes in Future Profitability,” Joint Working Paper (October), 1-36 Grullon. G., Michely, R., Benartzi, S., and Thaler, R.H. (2005), “Dividend Changes Do Not Signal Changes in Future Profitability”, The Journal of Business, 78 (5), 1659-1682. Grullon. G., Michaely, R. and Swaminathan, B (2002), “Are Dividend Changes a Sign of Firm Maturity?” The Journal of Business, 75 (3), 383-424.
122
Guay, W. and J. Harford, (2000), “The Cash Flow Permanence and Information Content of Dividend Increases vs. Repurchases,” Journal of Financial Economics, Vol. 57, 385-415 Gupta, G.S. and Lok, K.S. (1992), “Dividend Behaviour in Malaysia”, Capital Market Review, 73-83 Handjinicolaou, G. and Avner, K (1984), “Wealth Redistributions of Changes in Firms Value: An Analysis of Returns to Bondholders and Stockholders around Dividend Announcements”, Journal of Financial Economics, March, 36-63. Harada, K., and Nguyen, P., (2005), “ Dividend Changes Context and Signalling Efficiency in Japan,” Pacific-Basin Finance Journal, 13(5), 504-522 Healy P. and K. Palepu (1988), “Earning Information Conveyed by Dividend Initiations and Omissions,” Journal of Financial Economics, Vol. 21, 149-175 Investopedia webpage for the definition of dividend: http://www.investopedia.com/terms/d/dividend.asp Isa, Mansor Md (1992), “Dividend Policies and Practices of Listed Malaysian Companies,” Securities Industry Review, 18 (1), 53-64 Isa, Mansor Md (1993), “Dividend and Share Value: The Case of Malaysia,” Securities Industry Review, 19(2), 43-56 John K. and William, J., (1985), “Dividends, Dilution and Taxes: A Signalling Equilibrium,” The Journal of Finance, 40(4), 1053-1070 Kao, C. and C, Wu. (1994), “Tests of Dividend Signalling using Marsh-Merton Model: A Generalized Friction Approach,” Journal of Business, Vol. 67, 45-68 Kaplan, R.S. and R. Roll (1972), “Investor Evaluation of Accounting Information: Some Empirical Evidence,” Journal of Business, 45, April, 225-257 Kester, G. W. and Isa, Mansor Md (1996), “Dividend Policy in Malaysia: A Comparative Analysis,” Malaysian Journal of Economic Studies, 33(1) (June), 33-48. Lian, K.K. (2000), “Malaysian Stock Market and The Efficient Market Hypothesis,” Research Paper, Research Institute of Investment Analysts Malaysia, Kuala Lumpur Lintner, J (1956), “Distribution of Incomes of Corporations among Dividends, Retained Earnings, and Taxes,” American Economic Review, 46(2), 97-113 Litzenberger, R. and Ramaswamy. K (1979), “The Effect of Personal Taxes and Dividends on Capital Asset Prices: Theory and Empirical Evidence,” Journal of Financial Economics, 7, 163-195 Lumby, S., and Jones, C (1981, reprinted 2000 and 2001), Investment Appraisal & Financial Decision, London: Chapman and Hall.
123
Mancinelli, M. and Ozkan, A (2006), “Ownership structure and dividend policy: Evidence from Italian firms,” European Journal of Finance, 12(3), pp. 265-382. Marsh, T. and R.C. Merton (1987), “Dividend Behavior of the Aggregate Stock Markets,” Journal of Business, Vol. 60, 1-40. Michaely, R., R.H. Thaler, and K.L. Womack (1995), “Price Reactions to Dividend Initiations and Omissions: Overreaction or Drift?” Journal of Finance, 50 (June), 573-608. Miller, M. and Modigliani, F (1961), “Dividend Policy, Growth and the Valuation of Shares,” Journal of Business, 411-433. Miller, Merton H. and Rock, Kevin (1985), “Dividend Policy under Asymmetric Information,” The Journal of Finance, 40(4), 1031-1051 Nissim, D. and Ziv, A (2001), “Dividend Changes and Future Profitability,” The Journal of Finance, 56(6) (December), 2111-2133. Pandey, I.M. (2001), “Corporate Dividend Policy and Behaviour: The Malaysian Experience,” Working Paper No. 2001-11-01, Indian Institute of Management Ahmedabad (IIMA), India. Pandey, I.M. and Bhat, R (1994), “Dividend Decision: A Study on Managers’ Perceptions Decision,” 21(1&2), 67-86 Ross, A. Stephen, Westerfield, W. Randolph and Jordan, D. Bradford (2003), Fundamentals of Corporate Finance, New York: McGraw-Hill/Irwin. Rozeff, M (1982), “Growth, Beta and Agency Cost as Determinants of Dividend Payout Ratios”, Journal of Financial Research, Fall 1982, 249-259 Short, H., H. Zhang and K. Keasey (2002), “The Link between Dividend Policy and Institutional Ownership,” Journal of Corporate Finance, 8, 105-122. Stacescus, B (2006), “Dividends Revisited: An In-depth Look at the Relationship between Dividends and Earnings,” Working Paper, University of Zurich. Stock Performance Guide, (March, 2008), Penang: Dynaquest Sdn Bhd Vermaelen, T (1984), “Repurchase Tender Offers, Signalling, and Managerial Incentives,” Journal of Financial and Quantitative Analysis, (June), 163-181 Vieira, E. Simoes and Raposo, Clara C. (2007), “Signalling with Dividends? The Signalling Effects of Dividend Change Announcements: New Evidence from Europe,” Working Paper, January 2007, Social Science Research Network Vivian, A (2006), “The Payout Ratio, Earnings Growth Returns: UK Industry Evidence,” Working Paper, School of Economics, Finance and Business, University of Durham
124
Wajdi, M.F. (2006), “Dividend Signalling Hypothesis and Agency Cost: An Investigation on Shariah and Non-Shariah Compliant Firms in Kuala Lumpur Shariah Index,” Empirika, 19(1) (July), 1-9 Watts, R. (1973), “The Information Contents of Dividends,” Journal of Business, Vol. 46, 191-211 Watts, R (1976a), “Comments on the Impact of Dividend and Earnings Announcement: A Reconciliation,” Journal of Business, 46 (January), 97-106 Watt, R. (1976b), “Comments on the Informational Content of Dividends”, Journal of Business, 49 (January), 81-85 Yaron, B (1998), “Do Firms Use Dividends To Signal Large Future Cash Flow Increase?”, Financial Management Association, August, 1-7 Yoon, P.S. and L.T. Starck (1995), “Signalling, Investment Opportunities, and Dividend Announcements,” Review of Financial Studies, Vol. 8, 995-1018

APPENDICES
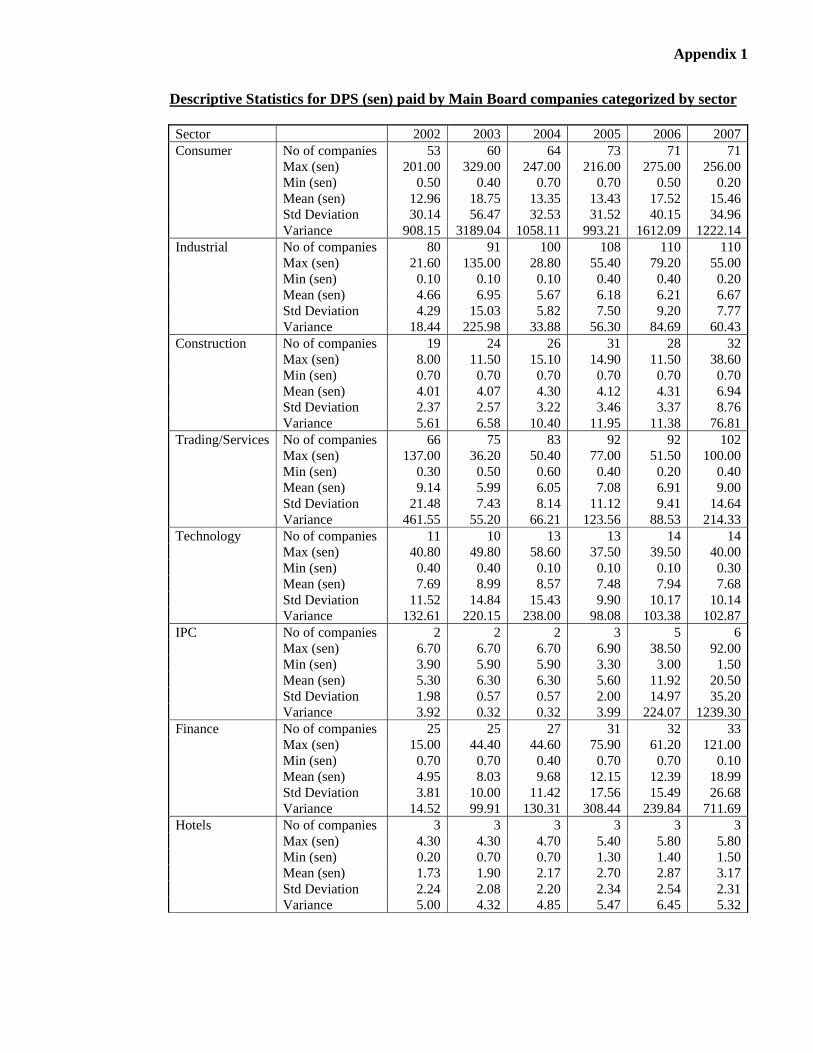
Appendix 1
Descriptive Statistics for DPS (sen) paid by Main Board companies categorized by sector Sector 2002 2003 2004 2005 2006 2007Consumer No of companies 53 60 64 73 71 71 Max (sen) 201.00 329.00 247.00 216.00 275.00 256.00 Min (sen) 0.50 0.40 0.70 0.70 0.50 0.20 Mean (sen) 12.96 18.75 13.35 13.43 17.52 15.46 Std Deviation 30.14 56.47 32.53 31.52 40.15 34.96 Variance 908.15 3189.04 1058.11 993.21 1612.09 1222.14Industrial No of companies 80 91 100 108 110 110 Max (sen) 21.60 135.00 28.80 55.40 79.20 55.00 Min (sen) 0.10 0.10 0.10 0.40 0.40 0.20 Mean (sen) 4.66 6.95 5.67 6.18 6.21 6.67 Std Deviation 4.29 15.03 5.82 7.50 9.20 7.77 Variance 18.44 225.98 33.88 56.30 84.69 60.43Construction No of companies 19 24 26 31 28 32 Max (sen) 8.00 11.50 15.10 14.90 11.50 38.60 Min (sen) 0.70 0.70 0.70 0.70 0.70 0.70 Mean (sen) 4.01 4.07 4.30 4.12 4.31 6.94 Std Deviation 2.37 2.57 3.22 3.46 3.37 8.76 Variance 5.61 6.58 10.40 11.95 11.38 76.81Trading/Services No of companies 66 75 83 92 92 102 Max (sen) 137.00 36.20 50.40 77.00 51.50 100.00 Min (sen) 0.30 0.50 0.60 0.40 0.20 0.40 Mean (sen) 9.14 5.99 6.05 7.08 6.91 9.00 Std Deviation 21.48 7.43 8.14 11.12 9.41 14.64 Variance 461.55 55.20 66.21 123.56 88.53 214.33Technology No of companies 11 10 13 13 14 14 Max (sen) 40.80 49.80 58.60 37.50 39.50 40.00 Min (sen) 0.40 0.40 0.10 0.10 0.10 0.30 Mean (sen) 7.69 8.99 8.57 7.48 7.94 7.68 Std Deviation 11.52 14.84 15.43 9.90 10.17 10.14 Variance 132.61 220.15 238.00 98.08 103.38 102.87IPC No of companies 2 2 2 3 5 6 Max (sen) 6.70 6.70 6.70 6.90 38.50 92.00 Min (sen) 3.90 5.90 5.90 3.30 3.00 1.50 Mean (sen) 5.30 6.30 6.30 5.60 11.92 20.50 Std Deviation 1.98 0.57 0.57 2.00 14.97 35.20 Variance 3.92 0.32 0.32 3.99 224.07 1239.30Finance No of companies 25 25 27 31 32 33 Max (sen) 15.00 44.40 44.60 75.90 61.20 121.00 Min (sen) 0.70 0.70 0.40 0.70 0.70 0.10 Mean (sen) 4.95 8.03 9.68 12.15 12.39 18.99 Std Deviation 3.81 10.00 11.42 17.56 15.49 26.68 Variance 14.52 99.91 130.31 308.44 239.84 711.69Hotels No of companies 3 3 3 3 3 3 Max (sen) 4.30 4.30 4.70 5.40 5.80 5.80 Min (sen) 0.20 0.70 0.70 1.30 1.40 1.50 Mean (sen) 1.73 1.90 2.17 2.70 2.87 3.17 Std Deviation 2.24 2.08 2.20 2.34 2.54 2.31 Variance 5.00 4.32 4.85 5.47 6.45 5.32
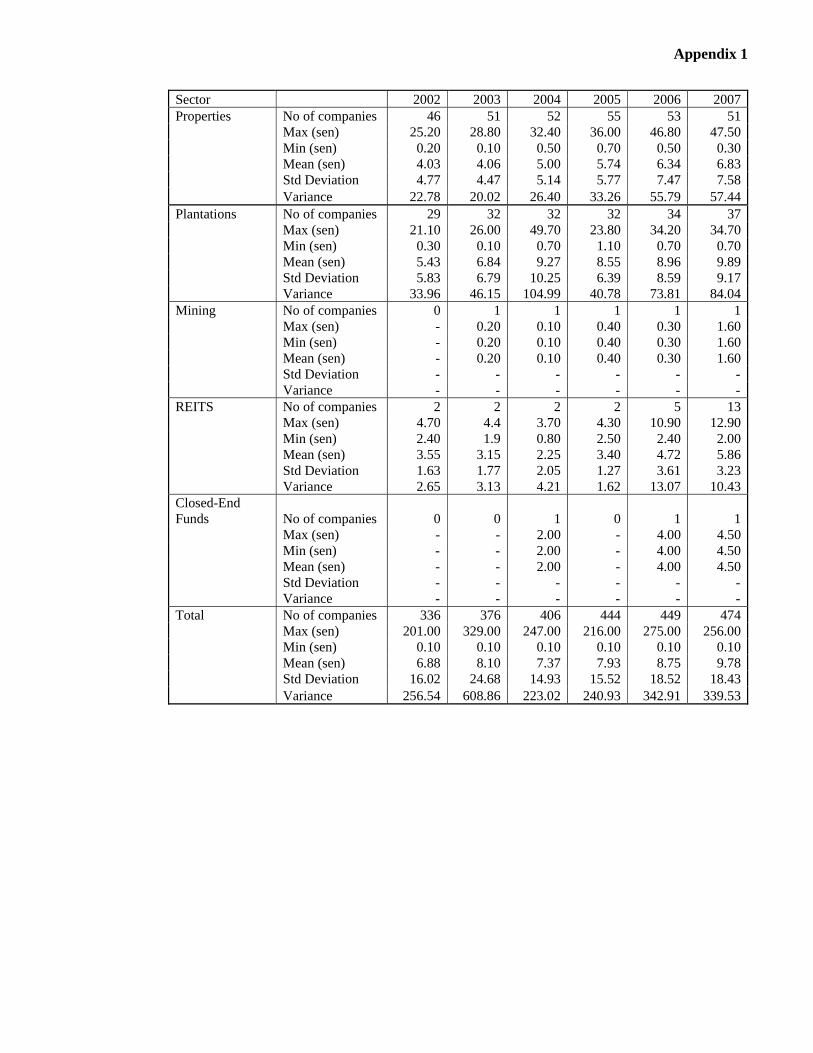
Appendix 1
Sector 2002 2003 2004 2005 2006 2007Properties No of companies 46 51 52 55 53 51 Max (sen) 25.20 28.80 32.40 36.00 46.80 47.50 Min (sen) 0.20 0.10 0.50 0.70 0.50 0.30 Mean (sen) 4.03 4.06 5.00 5.74 6.34 6.83 Std Deviation 4.77 4.47 5.14 5.77 7.47 7.58 Variance 22.78 20.02 26.40 33.26 55.79 57.44Plantations No of companies 29 32 32 32 34 37 Max (sen) 21.10 26.00 49.70 23.80 34.20 34.70 Min (sen) 0.30 0.10 0.70 1.10 0.70 0.70 Mean (sen) 5.43 6.84 9.27 8.55 8.96 9.89 Std Deviation 5.83 6.79 10.25 6.39 8.59 9.17 Variance 33.96 46.15 104.99 40.78 73.81 84.04Mining No of companies 0 1 1 1 1 1 Max (sen) - 0.20 0.10 0.40 0.30 1.60 Min (sen) - 0.20 0.10 0.40 0.30 1.60 Mean (sen) - 0.20 0.10 0.40 0.30 1.60 Std Deviation - - - - - - Variance - - - - - - REITS No of companies 2 2 2 2 5 13 Max (sen) 4.70 4.4 3.70 4.30 10.90 12.90 Min (sen) 2.40 1.9 0.80 2.50 2.40 2.00 Mean (sen) 3.55 3.15 2.25 3.40 4.72 5.86 Std Deviation 1.63 1.77 2.05 1.27 3.61 3.23 Variance 2.65 3.13 4.21 1.62 13.07 10.43Closed-End Funds No of companies 0 0 1 0 1 1 Max (sen) - - 2.00 - 4.00 4.50 Min (sen) - - 2.00 - 4.00 4.50 Mean (sen) - - 2.00 - 4.00 4.50 Std Deviation - - - - - - Variance - - - - - - Total No of companies 336 376 406 444 449 474 Max (sen) 201.00 329.00 247.00 216.00 275.00 256.00 Min (sen) 0.10 0.10 0.10 0.10 0.10 0.10 Mean (sen) 6.88 8.10 7.37 7.93 8.75 9.78 Std Deviation 16.02 24.68 14.93 15.52 18.52 18.43 Variance 256.54 608.86 223.02 240.93 342.91 339.53
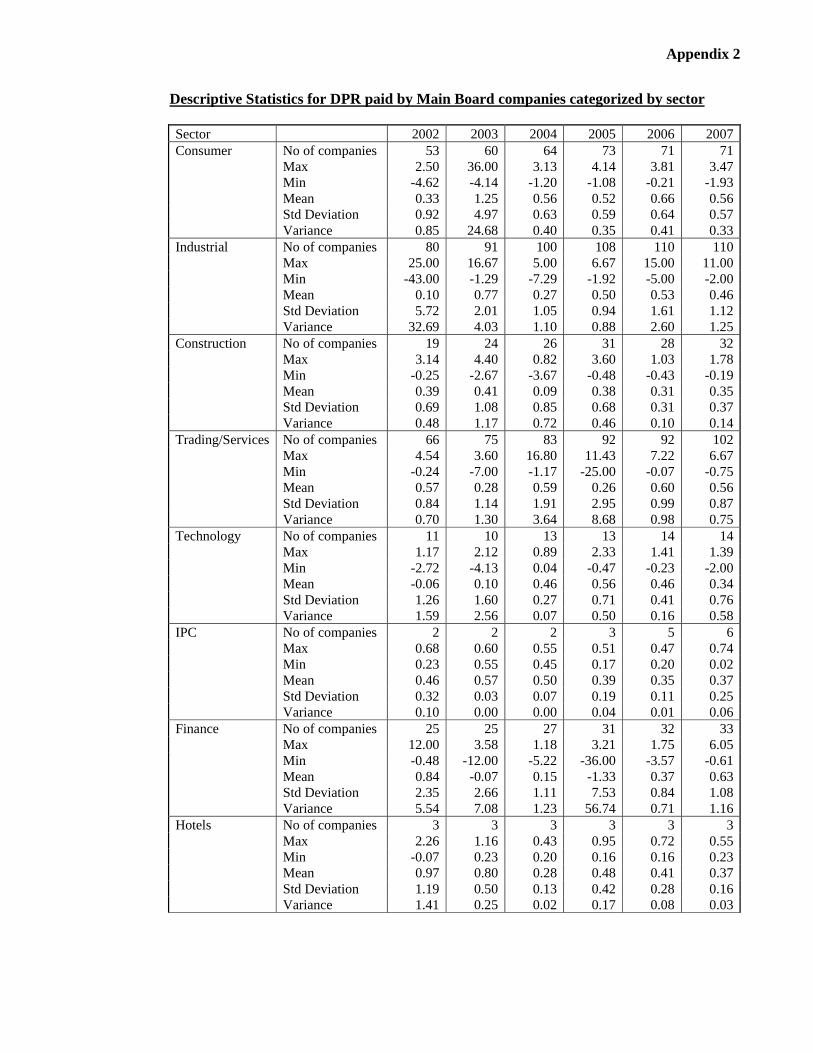
Appendix 2
Descriptive Statistics for DPR paid by Main Board companies categorized by sector Sector 2002 2003 2004 2005 2006 2007Consumer No of companies 53 60 64 73 71 71 Max 2.50 36.00 3.13 4.14 3.81 3.47 Min -4.62 -4.14 -1.20 -1.08 -0.21 -1.93 Mean 0.33 1.25 0.56 0.52 0.66 0.56 Std Deviation 0.92 4.97 0.63 0.59 0.64 0.57 Variance 0.85 24.68 0.40 0.35 0.41 0.33Industrial No of companies 80 91 100 108 110 110 Max 25.00 16.67 5.00 6.67 15.00 11.00 Min -43.00 -1.29 -7.29 -1.92 -5.00 -2.00 Mean 0.10 0.77 0.27 0.50 0.53 0.46 Std Deviation 5.72 2.01 1.05 0.94 1.61 1.12 Variance 32.69 4.03 1.10 0.88 2.60 1.25Construction No of companies 19 24 26 31 28 32 Max 3.14 4.40 0.82 3.60 1.03 1.78 Min -0.25 -2.67 -3.67 -0.48 -0.43 -0.19 Mean 0.39 0.41 0.09 0.38 0.31 0.35 Std Deviation 0.69 1.08 0.85 0.68 0.31 0.37 Variance 0.48 1.17 0.72 0.46 0.10 0.14Trading/Services No of companies 66 75 83 92 92 102 Max 4.54 3.60 16.80 11.43 7.22 6.67 Min -0.24 -7.00 -1.17 -25.00 -0.07 -0.75 Mean 0.57 0.28 0.59 0.26 0.60 0.56 Std Deviation 0.84 1.14 1.91 2.95 0.99 0.87 Variance 0.70 1.30 3.64 8.68 0.98 0.75Technology No of companies 11 10 13 13 14 14 Max 1.17 2.12 0.89 2.33 1.41 1.39 Min -2.72 -4.13 0.04 -0.47 -0.23 -2.00 Mean -0.06 0.10 0.46 0.56 0.46 0.34 Std Deviation 1.26 1.60 0.27 0.71 0.41 0.76 Variance 1.59 2.56 0.07 0.50 0.16 0.58IPC No of companies 2 2 2 3 5 6 Max 0.68 0.60 0.55 0.51 0.47 0.74 Min 0.23 0.55 0.45 0.17 0.20 0.02 Mean 0.46 0.57 0.50 0.39 0.35 0.37 Std Deviation 0.32 0.03 0.07 0.19 0.11 0.25 Variance 0.10 0.00 0.00 0.04 0.01 0.06Finance No of companies 25 25 27 31 32 33 Max 12.00 3.58 1.18 3.21 1.75 6.05 Min -0.48 -12.00 -5.22 -36.00 -3.57 -0.61 Mean 0.84 -0.07 0.15 -1.33 0.37 0.63 Std Deviation 2.35 2.66 1.11 7.53 0.84 1.08 Variance 5.54 7.08 1.23 56.74 0.71 1.16Hotels No of companies 3 3 3 3 3 3 Max 2.26 1.16 0.43 0.95 0.72 0.55 Min -0.07 0.23 0.20 0.16 0.16 0.23 Mean 0.97 0.80 0.28 0.48 0.41 0.37 Std Deviation 1.19 0.50 0.13 0.42 0.28 0.16 Variance 1.41 0.25 0.02 0.17 0.08 0.03
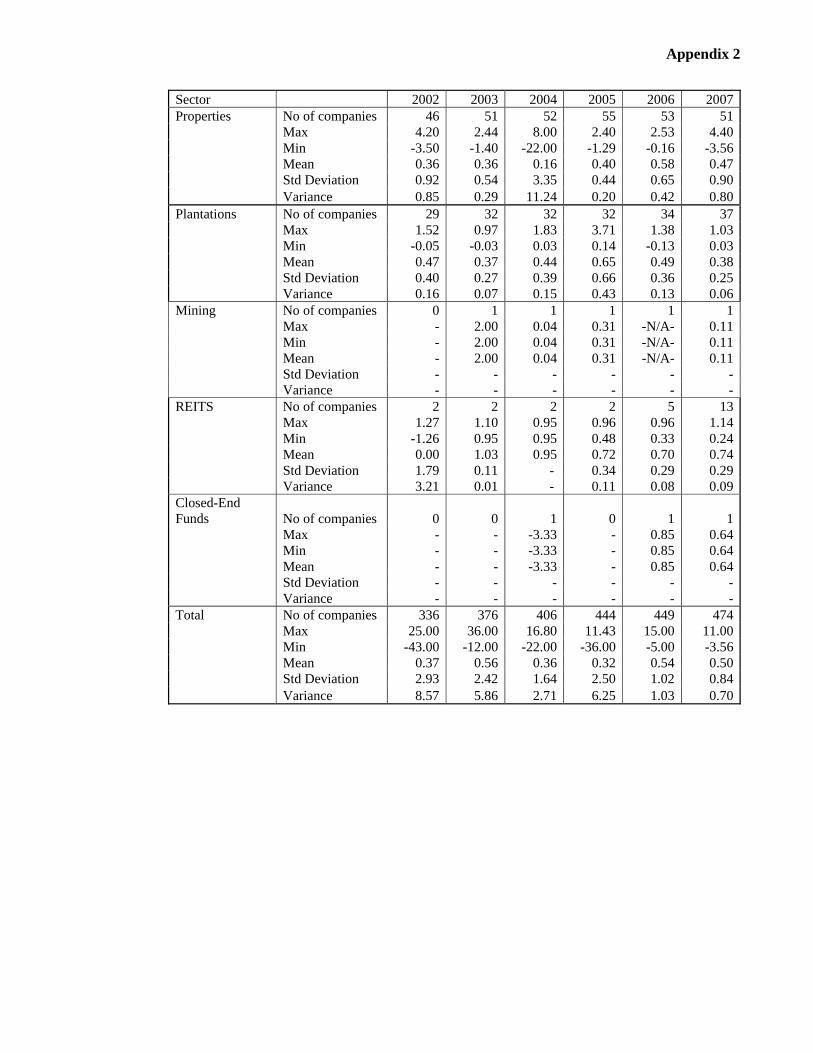
Appendix 2
Sector 2002 2003 2004 2005 2006 2007Properties No of companies 46 51 52 55 53 51 Max 4.20 2.44 8.00 2.40 2.53 4.40 Min -3.50 -1.40 -22.00 -1.29 -0.16 -3.56 Mean 0.36 0.36 0.16 0.40 0.58 0.47 Std Deviation 0.92 0.54 3.35 0.44 0.65 0.90 Variance 0.85 0.29 11.24 0.20 0.42 0.80Plantations No of companies 29 32 32 32 34 37 Max 1.52 0.97 1.83 3.71 1.38 1.03 Min -0.05 -0.03 0.03 0.14 -0.13 0.03 Mean 0.47 0.37 0.44 0.65 0.49 0.38 Std Deviation 0.40 0.27 0.39 0.66 0.36 0.25 Variance 0.16 0.07 0.15 0.43 0.13 0.06Mining No of companies 0 1 1 1 1 1 Max - 2.00 0.04 0.31 -N/A- 0.11 Min - 2.00 0.04 0.31 -N/A- 0.11 Mean - 2.00 0.04 0.31 -N/A- 0.11 Std Deviation - - - - - - Variance - - - - - - REITS No of companies 2 2 2 2 5 13 Max 1.27 1.10 0.95 0.96 0.96 1.14 Min -1.26 0.95 0.95 0.48 0.33 0.24 Mean 0.00 1.03 0.95 0.72 0.70 0.74 Std Deviation 1.79 0.11 - 0.34 0.29 0.29 Variance 3.21 0.01 - 0.11 0.08 0.09Closed-End Funds No of companies 0 0 1 0 1 1 Max - - -3.33 - 0.85 0.64 Min - - -3.33 - 0.85 0.64 Mean - - -3.33 - 0.85 0.64 Std Deviation - - - - - - Variance - - - - - - Total No of companies 336 376 406 444 449 474 Max 25.00 36.00 16.80 11.43 15.00 11.00 Min -43.00 -12.00 -22.00 -36.00 -5.00 -3.56 Mean 0.37 0.56 0.36 0.32 0.54 0.50 Std Deviation 2.93 2.42 1.64 2.50 1.02 0.84 Variance 8.57 5.86 2.71 6.25 1.03 0.70
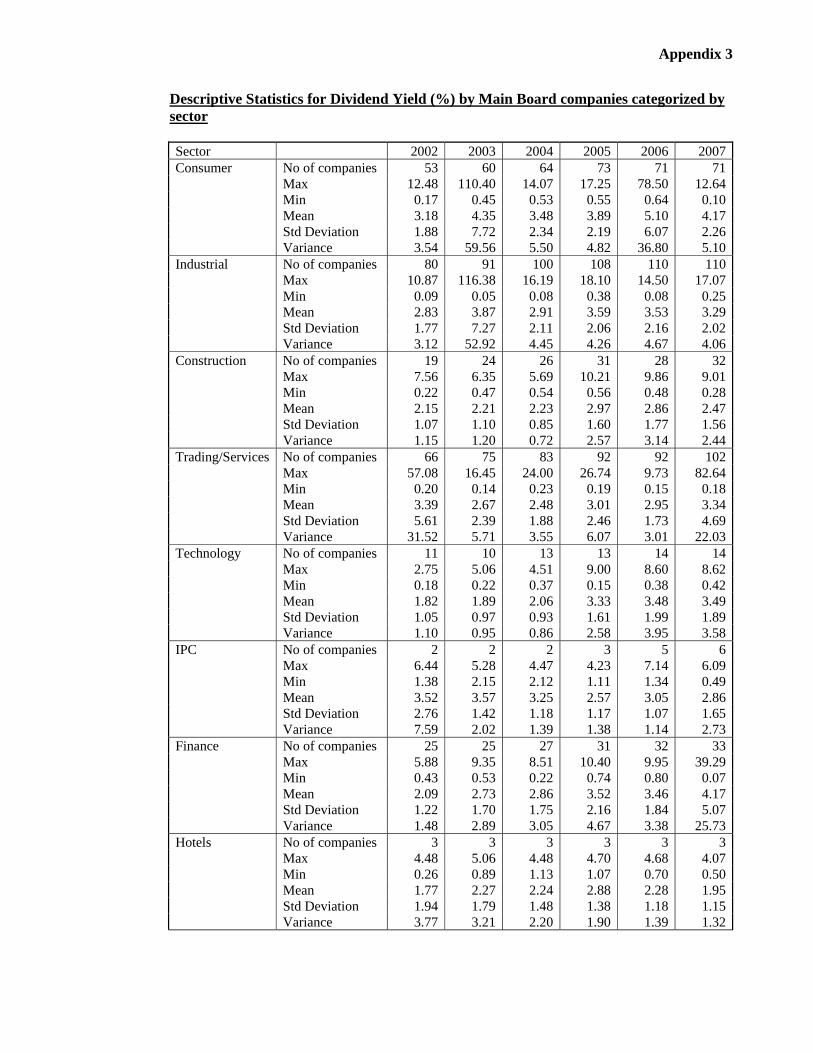
Appendix 3
Descriptive Statistics for Dividend Yield (%) by Main Board companies categorized by sector Sector 2002 2003 2004 2005 2006 2007Consumer No of companies 53 60 64 73 71 71 Max 12.48 110.40 14.07 17.25 78.50 12.64 Min 0.17 0.45 0.53 0.55 0.64 0.10 Mean 3.18 4.35 3.48 3.89 5.10 4.17 Std Deviation 1.88 7.72 2.34 2.19 6.07 2.26 Variance 3.54 59.56 5.50 4.82 36.80 5.10Industrial No of companies 80 91 100 108 110 110 Max 10.87 116.38 16.19 18.10 14.50 17.07 Min 0.09 0.05 0.08 0.38 0.08 0.25 Mean 2.83 3.87 2.91 3.59 3.53 3.29 Std Deviation 1.77 7.27 2.11 2.06 2.16 2.02 Variance 3.12 52.92 4.45 4.26 4.67 4.06Construction No of companies 19 24 26 31 28 32 Max 7.56 6.35 5.69 10.21 9.86 9.01 Min 0.22 0.47 0.54 0.56 0.48 0.28 Mean 2.15 2.21 2.23 2.97 2.86 2.47 Std Deviation 1.07 1.10 0.85 1.60 1.77 1.56 Variance 1.15 1.20 0.72 2.57 3.14 2.44Trading/Services No of companies 66 75 83 92 92 102 Max 57.08 16.45 24.00 26.74 9.73 82.64 Min 0.20 0.14 0.23 0.19 0.15 0.18 Mean 3.39 2.67 2.48 3.01 2.95 3.34 Std Deviation 5.61 2.39 1.88 2.46 1.73 4.69 Variance 31.52 5.71 3.55 6.07 3.01 22.03Technology No of companies 11 10 13 13 14 14 Max 2.75 5.06 4.51 9.00 8.60 8.62 Min 0.18 0.22 0.37 0.15 0.38 0.42 Mean 1.82 1.89 2.06 3.33 3.48 3.49 Std Deviation 1.05 0.97 0.93 1.61 1.99 1.89 Variance 1.10 0.95 0.86 2.58 3.95 3.58IPC No of companies 2 2 2 3 5 6 Max 6.44 5.28 4.47 4.23 7.14 6.09 Min 1.38 2.15 2.12 1.11 1.34 0.49 Mean 3.52 3.57 3.25 2.57 3.05 2.86 Std Deviation 2.76 1.42 1.18 1.17 1.07 1.65 Variance 7.59 2.02 1.39 1.38 1.14 2.73Finance No of companies 25 25 27 31 32 33 Max 5.88 9.35 8.51 10.40 9.95 39.29 Min 0.43 0.53 0.22 0.74 0.80 0.07 Mean 2.09 2.73 2.86 3.52 3.46 4.17 Std Deviation 1.22 1.70 1.75 2.16 1.84 5.07 Variance 1.48 2.89 3.05 4.67 3.38 25.73Hotels No of companies 3 3 3 3 3 3 Max 4.48 5.06 4.48 4.70 4.68 4.07 Min 0.26 0.89 1.13 1.07 0.70 0.50 Mean 1.77 2.27 2.24 2.88 2.28 1.95 Std Deviation 1.94 1.79 1.48 1.38 1.18 1.15 Variance 3.77 3.21 2.20 1.90 1.39 1.32
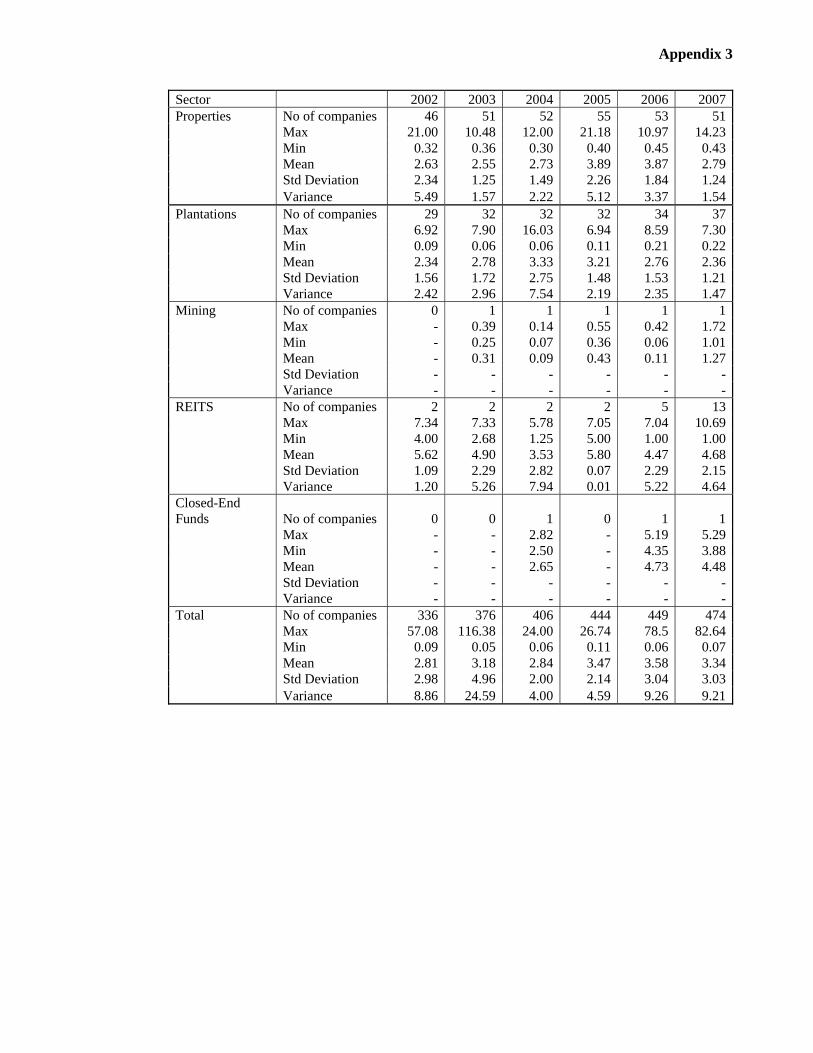
Appendix 3
Sector 2002 2003 2004 2005 2006 2007Properties No of companies 46 51 52 55 53 51 Max 21.00 10.48 12.00 21.18 10.97 14.23 Min 0.32 0.36 0.30 0.40 0.45 0.43 Mean 2.63 2.55 2.73 3.89 3.87 2.79 Std Deviation 2.34 1.25 1.49 2.26 1.84 1.24 Variance 5.49 1.57 2.22 5.12 3.37 1.54Plantations No of companies 29 32 32 32 34 37 Max 6.92 7.90 16.03 6.94 8.59 7.30 Min 0.09 0.06 0.06 0.11 0.21 0.22 Mean 2.34 2.78 3.33 3.21 2.76 2.36 Std Deviation 1.56 1.72 2.75 1.48 1.53 1.21 Variance 2.42 2.96 7.54 2.19 2.35 1.47Mining No of companies 0 1 1 1 1 1 Max - 0.39 0.14 0.55 0.42 1.72 Min - 0.25 0.07 0.36 0.06 1.01 Mean - 0.31 0.09 0.43 0.11 1.27 Std Deviation - - - - - - Variance - - - - - - REITS No of companies 2 2 2 2 5 13 Max 7.34 7.33 5.78 7.05 7.04 10.69 Min 4.00 2.68 1.25 5.00 1.00 1.00 Mean 5.62 4.90 3.53 5.80 4.47 4.68 Std Deviation 1.09 2.29 2.82 0.07 2.29 2.15 Variance 1.20 5.26 7.94 0.01 5.22 4.64Closed-End Funds No of companies 0 0 1 0 1 1 Max - - 2.82 - 5.19 5.29 Min - - 2.50 - 4.35 3.88 Mean - - 2.65 - 4.73 4.48 Std Deviation - - - - - - Variance - - - - - - Total No of companies 336 376 406 444 449 474 Max 57.08 116.38 24.00 26.74 78.5 82.64 Min 0.09 0.05 0.06 0.11 0.06 0.07 Mean 2.81 3.18 2.84 3.47 3.58 3.34 Std Deviation 2.98 4.96 2.00 2.14 3.04 3.03 Variance 8.86 24.59 4.00 4.59 9.26 9.21