do - centraal planbureau · 2018-02-15 · while so called ‘second‐degree’ teachers are only...
TRANSCRIPT


1
Dopaidteachertraineeprogramsleadtoadditionalteachersinsecondaryeducation?
ARegressionDiscontinuityAnalysis
Anja Deelen and Sonny Kuijpers1
CPB Netherlands Bureau for Economic Policy Analysis February 14, 2018
AbstractThis paper evaluates the quantitative effects of two teacher traineeships that were implemented in the Netherlands to address shortages of fully qualified teachers in secondary education. Applying a fuzzy regression discontinuity design, we estimate the effects of being selected to participate in one of the traineeships. We find no significant local average treatment effects of being selected on the probabilities of enrolling into academic teacher training, obtaining a full teaching qualification, and on working in education, although the point estimates are positive for the first two outcome variables. The lack of significant results may partially be due to our small sample size. However, the specific design of the traineeship programs, that required candidates to find a school by themselves, may also contribute to these findings.
Keywords: Education Policy, Teacher Shortages, Regression Discontinuity Design JEL Classifications: I20, I21, I28
1 Contact: Anja Deelen ([email protected]), Sonny Kuijpers ([email protected]), CPB Netherlands Bureau for Economic Policy Analysis, The Hague, The Netherlands (http://www.cpb.nl). The authors thank Wiljan van den Berge, Jonneke Bolhaar, Sander Gerritsen, Carla Haelermans, Vanessa Roelse (PBT) and Dinand Webbink for valuable discussions and their comments on earlier versions of this paper. Any errors remain our own. This research was commissioned and finance by the Ministry of Education, Culture, and Science.

2
1. IntroductionSecondary education in the Netherlands experiences teacher shortages, especially for subjects concerning languages and science. First of all, enrolment of students into the teacher training programs is limited. Second, not everyone who obtains a qualification starts working in the educational sector or remains working there. Among students who received an academic first‐degree qualification between 2000 and 2006, 78% was working in education 1 year after graduation, while after 8 years 71% remained (CPB, 2017).
This inflow into the teacher labour market is not always sufficient to cover the demand for first‐degree teachers.2 In practice, teacher shortages are often accommodated by hiring teachers who are not fully qualified for the subject in question, rather reducing the quality of education than the number of classes.3 Shortages mostly concern languages (Dutch, German, French, Latin, and Greek) and science (physics, computer science, chemistry, mathematics, technology).
To address the shortages and to attract more highly talented students to the teaching profession, two teacher training traineeships were developed as an alternative to the existing routes for becoming a first‐degree (or “fully qualified”) teacher. Hence, the traineeships considered in this paper were specifically targeted at teaching in the upper 2 or 3 years of the two highest tracks of secondary education (senior general secondary education (‘havo’) and pre‐university education (‘vwo’)).
Teacher traineeship program ‘Eerst De Klas’ (EDK, roughly translated: ‘Teach First’) started in academic year 2009‐2010, aiming at excellent university graduates who earned their degree recently. The ‘OnderwijsTraineeship’ (OTS; ‘Education Traineeship’) started in academic year 2013‐2014, its target group being individuals who recently earned an academic degree, specifically in a field that fits the understaffed school subjects. Both traineeships were temporary policy measures (finalising in 2018) executed under the authority of the Dutch Ministry of Education and Science and subsidized by the government.
The EDK‐ and OTS‐traineeships are inspired by the independent non‐profit organisations ‘Teach First’ in the UK and ‘Teach for America’ in the US, but they serve different goals and differ in their organisational set‐up. EDK and OTS are not associated with the international network organisation ‘Teach for All’. The UK and US programs aim at reducing the inequality in access to good education; college graduates from top universities commit to teaching for at least two years at primary schools in low‐income communities. As Dutch schools are generally funded by taxes at the national level, the
2 At the two highest tracks of Dutch secondary education, fully qualified (‘first‐degree’) teachers are certified to teach in the upper 2 or 3 years (comparable with ‘sixth form’ or ‘Key Stage 5’ in the UK education system), while so called ‘second‐degree’ teachers are only certified to teach in the first 3 years. 3 Adriaens et al. (2016) estimate the unfulfilled demand for teachers in secondary education under the assumption that there are no shortages at the point of departure (year 2014) of the projection. The demand for teachers is projected to decrease gradually after 2015 because the number of pupils starts to contract from that point onwards. Comparing the forecasted demand and supply (based on expected inflow and outflow of teachers) shortages were projected: regarding fully qualified teachers the projected overall shortage is expected to be 1.8% in the period 2018‐2020. Shortages of second‐degree teachers for secondary education are somewhat lower.

3
variation in resources over schools is limited. Dutch teacher shortages are therefore not limited to or concentrated that strongly at lower end schools, although there is some concentration in certain regions and specific school subjects. The Dutch traineeships, therefore, do not focus on disadvantaged schools or areas, but aim at increasing the enrolment of excellent academic students into teacher training (EDK) and to increase the number of academic teachers concerning shortage subjects (OTS).
Besides the number of teachers, also teacher quality is a focal point of educational policy. The teaching skills of EDK‐ and OTS‐trainees are being explored in an ongoing, longitudinal study by M. Helms‐Lorenz et al. (Admiraal and Helms‐Lorenz, 2016). They measure the teaching skills of recently qualified teachers, with zero to three years of experience after qualification. Starting teachers, who followed the regular teacher training program and an induction arrangement trajectory after certification, serve as a comparison group. Teaching skills are measured by means of an observation instrument which identifies six observable domains of teaching skills, and a questionnaire which measures the same constructs from the students’ perspective. Preliminary results indicate that EDK trainees outperform regular beginning teachers in induction arrangement trajectories. The higher observation scores were in the more complex behavioural domains.
International policy evaluations of programs, such as Teach for America (TFA) in the US (Antecol et al, 2013) and Teach First (TF) in the UK, usually focus on effects regarding student achievement. We do not know about any studies evaluating to which extent teacher traineeship programs lead to additional teachers. However, it is clear that TFA has a high turnover rate: a review of evidence on TFA by Heilig et al. (2010) suggests “if educational leaders plan to use TFA teachers as a solution to the problem of shortages, they should be prepared for constant attrition and the associated costs of ongoing recruitment and training”. However, compared to the Dutch traineeships, programs like TFA and TF also seem to aim at a more temporary contribution of individuals to the education system before they start their actual career.
Our study focuses on the quantitative effects of the Dutch teacher traineeship programs. To which extent are selected candidates more likely to become a fully qualified teacher? Specifically, we are interested in the causal effects of being selected for a teacher traineeship program on the probability of (1) enrolling into academic teacher training (comprising both the traineeships and the general teacher training program), (2) obtaining a first‐degree teaching qualification, and (3) working in education.
Ranking candidates based on the scores they obtained during the selection for the traineeships enables us to compare candidates who were just accepted with the ones who were just rejected. The effects of being selected to participate in one of the traineeships are estimated with a fuzzy regression discontinuity (FRD) design in which passing the selection is instrumented with an indicator for scoring at or above the cutoff.
The RD‐analysis shows little evidence that the traineeships had the intended effect. More specifically: (1) the local average treatment effect of passing the selection on the probability to enrol into academic teacher training (comprising both the traineeships and the general teacher training program) is positive but not statistically significant; (2) we find small and insignificant effects on the probability to obtain a first‐degree teaching qualification; (3) finally, we also find small and insignificant effects on the probability of working in education. However, our findings regarding

4
quantity do not rule out positive effects on teacher quality. Moreover, these findings do not exclude the possibility that the sheer presence of the programs has enhanced the appeal of the teaching profession. The specific design of the traineeship programs may be partly responsible for the lack of significantly positive local average treatment effects. Especially, the fact that candidates who pass the selection are supposed to find a school by themselves may negatively impact the probability to become a fully qualified teacher. Selected candidates who do not find a school often do not revert to the general teacher training program, probably due to a combination of demotivation, time‐restrictions and path‐dependencies. In contrast, rejected candidates are relatively prone to become fully qualified teachers through the general teacher training program. The paper is organised as follows. Section 2 describes the ins and outs of the teacher traineeships as well as other relevant institutional information. Section 3 and 4, respectively; discuss the methodology and the data that we use in this study. Section 5 presents the results, section 6 discusses, and section 7 concludes.
2. Institutions
TeacherTraineeshipsEDKandOTSIn recent years, two teacher traineeships have been developed in the Netherlands to enhance the inflow of university graduates into teacher training, by reducing barriers and improving the image of the profession. Teacher traineeship EDK started in academic year 2009‐2010, aiming at excellent university graduates who earned their degree recently. During 2 years, the trainees work as a teacher (3 days a week in the first year, 4 days a week in the second year). Trainees attend the academic teacher training one day per week during the first year. Moreover, trainees take part in a leadership training program one day a week during two years. This leadership program contains masterclasses from different companies (outside the education field) like for example Shell, Greenpeace or Siemens, a project at one of these companies and training in leadership skills. The aim of this leadership program was to attract a different target group to the field of education. The program thus induces collaboration between schools, teacher training colleges and the business world, in order to make working as a teacher more attractive to excellent students. Trainees earn a teachers’ starting salary, both for the days teaching and for the day spent at the leadership training. They do, however, not earn a salary for the days they attend the academic teacher college. Schools receive a subsidy of 11,000 euros to compensate for the unproductive hours and the costs of supervision.
OTS is part of the ‘Impuls Leraren Tekortvakken’ (Impulse Teachers in Understaffed School Subjects), a temporary (2013‐2016) focal point of educational policy)4. The target group of OTS consists of individuals who recently earned an academic degree, specifically in a field that fits the understaffed
4 The Impulse allocated 100 mln euros according to this time schedule: € 15 mln in 2013, € 20 mln in 2014, € 30 mln in 2015 and € 35 mln in 2016 to a set of policies aiming to address the problem of teacher shortages in secondary education. Among several other projects, OTS was fully financed by the Impulse; EDK became part of the Impulse in 2013 (Kamerbrief 13032013 (2013)). Since 2013, € 21 mln has been allocated to EDK and OTS in total.

5
school subjects. Similar to EDK, trainees work as a teacher from the onset, earning a starters salary and gain their first‐degree qualification through the academic teacher college (one day a week during one and a half year).5 Apart from that, OTS‐trainees take part in an additional program, which offers guidance to the starting teachers and enables them to gain expert knowledge and skills. This program aims at deepening the insight in curriculum design, test development, personalized learning, and change management. During the second year they carry out research related to one of these subjects at the school they work for. Like EDK, the school pays the trainees a salary for the days they work as a teacher and for the time spent on the additional program, whereas schools receive a subsidy of 9,000 euros to compensate for the unproductive hours and the costs of supervision. Teacher training colleges receive €2,000 for organizing the additional program. Trainees do not earn a salary for the days they attend the academic teacher college.
Selection procedures for EDK and OTS
The selection procedures for each ‘tranche’6 of the EDK‐ and OTS‐traineeships comprise the following steps:
1. The first step consists of a preselection based on written information delivered by the applicants. These are documents regarding the requirements7 which applicants must meet, a CV and a motivation letter. The preselection is carried out by the project organization and representatives from the participating teacher training colleges.
2. Selection day(s): I. EDK features two selection days (per ‘tranche’):
i. On the first selection day, applicants (who passed the preselection) participate in a group assignment to observe various competences like leadership and the ability to cooperate. They also give a presentation and were interviewed about their motivation to participate in the EDK‐traineeship. Committee members8 scored the various parts on a 1–5 scale. Moreover, candidates conduct written tests regarding IQ, EQ and self‐
5 Formally, the program allows OTS‐trainees to obtain their qualification after 1.5 years and EDK‐trainees after 1 year. In practice, it may take more time to finish off; however, all trainees are required to finish the teacher training before the end of the two‐year traineeship period. 6 EDK has one tranche per year (starting at the beginning of the academic year), whereas OTS starts twice a year: one tranche starts at the beginning of the academic year, and the other tranche starts in Winter. 7 EDK‐candidates are supposed to have graduated with a master’s degree (or admitted to the degree of doctor) during the last 2 years or to be in the process of graduation; their graduation mark (on a 10 point scale) has to be at least 7.0 for beta/technical studies and 7.5 for other studies. Their field of study has to belong to the selection of study fields that match with secondary school subjects. Candidates must not (have been) be registered already as a student at a regular (academic) teacher college, nor must they be registered as a teacher already. OTS‐candidates must be graduated with a master’s degree during the last 5 years (or 8 years, in case of having been admitted to the degree of doctor) or be in the process of graduation. Their field of study has to belong to the selection of study fields that match with secondary school subjects that are under‐staffed. Candidates for EDK and OTS are not allowed to have been registered earlier as a student at a teacher college (except for the educational minor), nor must they be registered as a teacher already. Based on the sort of training the applicant has done the teacher training colleges decide for which subject the applicant is qualified and which deficiencies have to be eliminated. 8 Selection committees of EDK and OTS typically consisted of 10‐20 members. Committee members were connected to participating firms, schools, teacher training colleges, and partners of EDK (several universities and coordinating bodies).

6
reflection. The selection was based on a (weighted) average of the scores obtained: above a certain threshold the candidate is accepted to move on to the second selection day. This threshold may differ between years. Also, there was no pre‐targeted number of candidates passing the first day. Note that the scores obtained during the first EDK selection day are not used in the empirical analysis.
ii. On the second selection day, candidates (who passed the first selection day) gave a 10‐minute trial lesson in their specific school subject, had a conversation about their motivation and were asked to reflect on their performance. Each committee member scored the various aspects of the performance (such as preparation, structure of the lesson, and didactical qualities of the candidate) and wrote down an overall mark and a ‘go/no go’ assessment. After all candidates had given their trial lesson the selection committee evaluated the candidates. There was no predetermined number of ‘vacancies’ to be filled or target number of candidates to pass the selection. The scores obtained during the second EDK selection day are used in the empirical analysis.
iii. In general, the committee and the so‐called assessor (a person connected with a teachers training college) took the final ‘go/no go’ decision.9 In case no consensus was achieved the assessor made the decision, since he was officially certified to assign the candidate a declaration of capability for this teacher training program. Hence, the selection was based on the perceived quality of the candidates; candidates who were not considered to meet the standards did not pass the selection. The standards may differ between teacher shortages subjects and non‐shortages subjects.
II. For the OTS‐traineeship just one selection day was held per tranche. One of the elements of this day is a conversation with the candidate about his/her motivation. Moreover, candidates give a 10‐minute trial lesson in their specific school subject and are asked to reflect on their performance. Committee members score both the motivation‐conversation and the trial lesson on a 1–5 scale. After all candidates have given their presentation the selection committee evaluates each candidate. The committee and the assessor take the final ‘go/no go’ decision together based on the scores given by the committee members; if no consensus is achieved the assessor takes the decision.
3. The last step consists of searching for a school. The candidates who pass the selection have to find a school by themselves, although they could get information about vacancies. Not all candidates actually end up starting with the traineeship: a substantial part withdraws during the search period, partly due to not succeeding in finding a school to start working at.
9 Due to progressing professionalization, for tranches EDK VII and OTS 2015.1 the final decision has not been taken on the spot but after the selection day. The scores were averaged (giving extra weight to the score given by the assessor). Candidates with an average score above a certain threshold‐score (on a 1–10 scale) passed the selection. For EDK, two thresholds were applied: for understaffed school subjects the threshold‐score was lower than for not‐ understaffed school subjects.

7
EDK and OTS are temporary arrangements, the last tranches starting in 2016 and ending in 2018.10 Like in case of other lateral entry arrangements, school which employ an EDK‐ or OTS‐trainee receive a subsidy, as mentioned above. After completion of the training, the trainees receive a certificate of competence, which states that they are qualified as a first‐degree teacher in their specific school subject.
Regularroutetobecomeafirst‐degreeteacherThe traineeships EDK and OTS have been developed as an alternative to the existing routes for becoming a fully qualified (‘first‐degree’) teacher. In the Netherlands, fully qualified teachers are certified to teach in the last 2 or 3 years of secondary education, while ‘second‐degree’ teachers are only permitted to teach in the first 3 years.11 Before the introduction of EDK and OTS, four routes12 existed to obtain the first‐degree qualification. First, students with an academic master degree in a field related to a secondary school subject can attend the one‐year fulltime (or eighteen months part‐time) Master of Education program (60 ETCS).13 Second, some academic studies in fields fitting secondary school subjects offer an integrated two‐year educative master (120 ETCS). Third, the so called ‘lateral entry route’, existing since the year 2000, is aimed at master graduates in fields not directly related to a secondary school subject who already have relevant work experience. After having obtained a declaration of capability, they enter a two‐year training course to become a fully qualified teacher while at the same time holding an appointment as a teacher. After a competence examination, these students receive a certificate indicating that they are qualified teacher. In the same fashion as the EDK/OTS trainees, they do not receive an educational master diploma though, since they were not registered at a regular academic teacher training. Finally, those who are already qualified as a second‐degree teacher or have a bachelor degree from a university of applied sciences can do a master teacher program at a university of applied sciences. This is a part‐time training (90 ECTS) with a minimum duration of three years, which is typically combined with a part‐time job as a ‘second‐degree’ teacher.
10 Currently, a redesign of the traineeships is in development. 11 More specifically, fully qualified teachers are certified to teach in the upper three years of the university prepatory education (vwo) and the upper two years of the senior general secondary education (havo). See Nuffic (2015) for an overview of the Dutch education system, including a graphical representation. 12 Source: Paden naar leraarschap, CPB Notitie, 2017 (in Dutch). 13 This is also the training program that is part of the EDK and OTS traineeships.

8
3. DataThe main data used in this study, concerning the selection procedures of the EDK and OTS traineeships and personal characteristics of the applicants, were obtained from ‘Platform Beta Techniek’, the foundation responsible for the implementation of the traineeships.
For all tranches in total about one thousand applicants participated in the final selection day and 396 actually started a traineeship (EDK: 250; OTS: 146). However, observations could only be included in our analysis if an (anonymized) Citizen Service Number (BSN), needed for merging with the enrolment and job data, could be determined14 and if the scores obtained at the selection day were available. For the most recent tranches the anonymised BSN was directly available for almost all observations, for some earlier tranches they could be assessed. Selection day scores were however only available for tranches EDK V–EDK VII (starting in academic years 2013‐2014 up to 2015‐2016) and OTS 2013.II–OTS 2015.I, hence these are the tranches that comprise our dataset. The scores (which we rescaled to a 1–10 scale where needed) were available for the large majority of the candidates, providing us with 498 observations. Out of this dataset 284 candidates were selected; in total 178 candidates out of them actually started in either the EDK‐ or the OTS‐traineeship.
Regarding personal characteristics (covariates), the main dataset contains, besides gender and date of birth, information on the school subject the candidate intends to teach in. In order to construct the regression covariate ‘shortage subject’, we have categorised these subjects into understaffed versus not understaffed, based on information by Adriaens et al. (2016).15
The first outcome variable we focus on in this study is enrolment into an academic teacher training to become a first‐degree teacher. We classify candidates who start with the EDK or OTS traineeship as enrolled (although they are not observed in the administrative enrolment data). For candidates who have not started the EDK‐ or OTS‐traineeship (either because they did not pass the selection or did not find a school) we use registered monthly data on enrolment into the (regular) academic teacher training. For this group we measure whether they are enrolled into the academic teacher training at different points in time after the start of the traineeship that they applied for. The regular academic teacher training typically starts twice a year: in September and in February. We use monthly data on enrolment into the (regular) academic teacher training up to August 2017; graduation data are only available until August 2016.
14 The anonymized BSN (‘Burger Service Nummer’: Citizen Service Number) has been assessed by Statistics Netherlands, either directly if the BSN was known (which was requested from candidates at EDK VI, EDKVII and OTS 2015.1), or indirectly by a matching procedure using gender, date of birth, postal code and house number. For EDK I and EDK II the date of birth was not available, which made it impossible to assess the BSN. For EDK III, EDK IV, and OTS 2013‐1 the BSN could be assessed, but the scores obtained at the last selection day were not available. OTS 2013‐I could not be included because selection scores were not available. However, the number of candidates who started in the early tranches was small (EDK I, II, III and IV: 19, 16, 25 and 27, respectively; OTS 2013‐1: 9), so the expected impact of not including them is limited. 15 Subjects considered understaffed in our descriptive statistics and regressions are: German, Greek, Latin, Informatics, Physics, Chemistry, and Mathematics.

9
Our second outcome variable of interest is obtaining a first‐degree teacher qualification. All trainees (except for a few who drop out during the traineeship) obtain this qualification.16 For non‐trainees, we use an administrative database, comprising data on obtained diplomas up to the end of 2016.
Our third outcome variable of interest is a dummy variable indicating whether a person is working in education. We determine to what extent candidates are ultimately holding a job in education based on 3‐digit information regarding the sector of industry a job belongs to, using monthly data up to June 2017.17 Since the job data do not tell whether jobs are filled by first‐degree teachers, second‐degree teachers or un(der)qualified teachers, the data do not allow us to determine whether someone is working as a first‐degree teacher.
4. MethodologyWe are interested in the causal effect of being selected into a teacher traineeship program on the probability of (1) enrolling into academic teacher training (comprising both the traineeships and the regular teacher training program), (2) obtaining a first‐degree teaching qualification, and (3) working in education. Since the probability of passing the selection is likely to be correlated with non‐observable characteristics (such as motivation) that also affect the outcome variables, using ordinary least squares (OLS) to compare the outcomes of students that did and dit not participate in a traineeship would generate biased coefficients.
We therefore apply a regression discontinuity approach, exploiting the scores assigned to candidates in the assessment procedure. During the (final) selection day, candidates were graded based on several criteria (see the discussion of Step 2 in the Institutions section). Candidates with an aggregate score above a certain threshold were much more likely to pass the selection. However, there was no explicit (pre‐determined) cutoff. We therefore estimate, for each tranche separately, the implicit cutoff for which the discontinuity in the probability of passing the selection is the largest (across different specifications).18 Appendix A presents the estimated cutoff(s) for each tranche.19
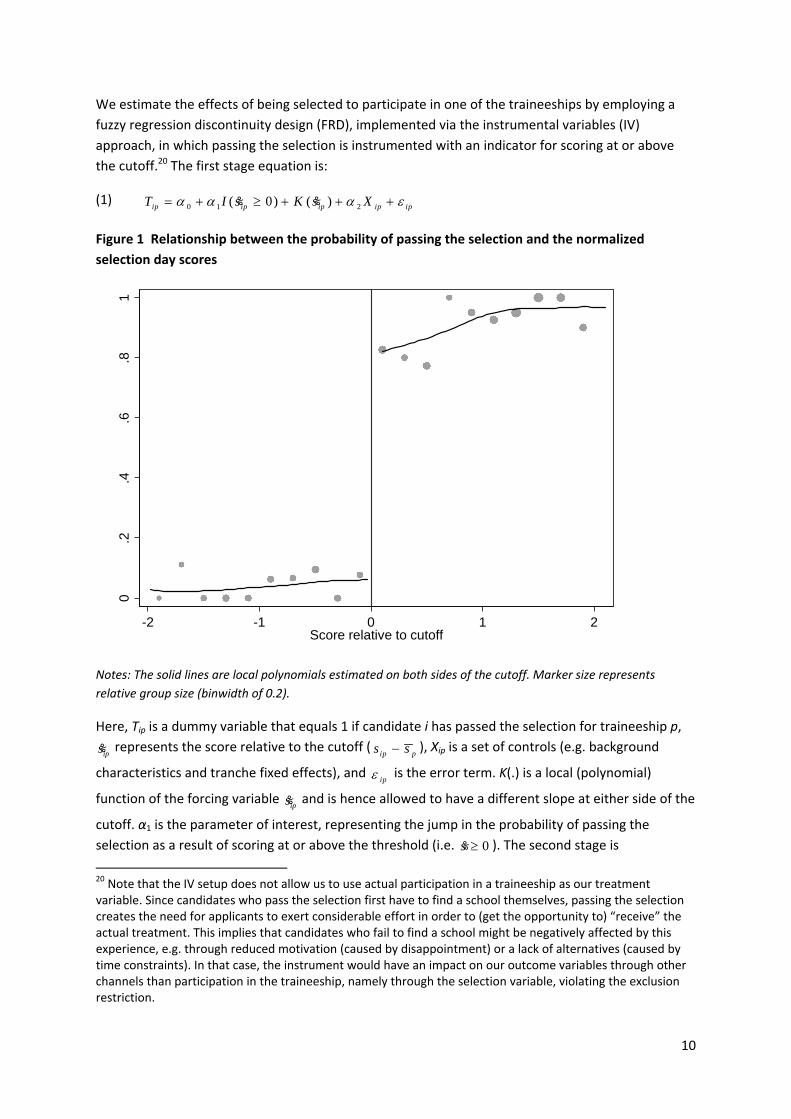
Figure 1 plots the probability of being selected against the normalized score (defined as the difference between the raw score and the relevant cutoff). There is a clear but fuzzy discontinuity: about 80 percent of the candidates scoring at or just above the threshold do pass the selection, whereas the probability of being selected is about 10 percent for candidates scoring just below the threshold. The ‘non‐compliance’ is due to the fact that the decision to select candidates for the traineeship was partially left at the discretion of the assessor and was therefore not solely based on the average grade. Note also that being selected does not guarantee that the candidate actually does start, since he or she first has to find a school that offers a contract.
16 Trainees are not registered as students at the regular academic teacher training and therefore do not obtain the diploma of the educational academic master; they receive an equivalent certificate of competence, which states that they are qualified as a first‐degree teacher in their specific school subject. 17 In case they have multiple jobs of which one is in education, we count them as working in education. 18 For EDK, the cutoffs are allowed to be different for candidates applying for a shortage subject (for this we apply the tranche‐specific categorizations as provided by PBT). 19 One likely explanation for the cutoff varying over tranches is that scores given by the selection committee are set relative to the score they gave to the first candidate appearing before the committee. Moreover, selection committees for the various traches consisted of different individuals.
10
We estimate the effects of being selected to participate in one of the traineeships by employing a fuzzy regression discontinuity design (FRD), implemented via the instrumental variables (IV) approach, in which passing the selection is instrumented with an indicator for scoring at or above the cutoff.20 The first stage equation is:
(1) 0 1 2( 0) ( )ip ip ip ip ipT I s K s X % %
Figure 1 Relationship between the probability of passing the selection and the normalized
selection day scores
Notes: The solid lines are local polynomials estimated on both sides of the cutoff. Marker size represents
relative group size (binwidth of 0.2).
Here, Tip is a dummy variable that equals 1 if candidate i has passed the selection for traineeship p,
ips% represents the score relative to the cutoff (ip ps s ), Xip is a set of controls (e.g. background
characteristics and tranche fixed effects), and ip is the error term. K(.) is a local (polynomial)
function of the forcing variable ips% and is hence allowed to have a different slope at either side of the
cutoff. α1 is the parameter of interest, representing the jump in the probability of passing the selection as a result of scoring at or above the threshold (i.e. 0s % ). The second stage is 20 Note that the IV setup does not allow us to use actual participation in a traineeship as our treatment variable. Since candidates who pass the selection first have to find a school themselves, passing the selection creates the need for applicants to exert considerable effort in order to (get the opportunity to) “receive” the actual treatment. This implies that candidates who fail to find a school might be negatively affected by this experience, e.g. through reduced motivation (caused by disappointment) or a lack of alternatives (caused by time constraints). In that case, the instrument would have an impact on our outcome variables through other channels than participation in the traineeship, namely through the selection variable, violating the exclusion restriction.
0.2
.4.6
.81
-2 -1 0 1 2Score relative to cutoff

11
(2) 0 1 2ˆ ( )ipt ip ip ip iptY T K s X % ,
where Yipt is the outcome for candidate i at time t (e.g. working as a teacher) and ipT is the predicted
probability from equation (1). Under the RD assumptions, 1 , our ultimate parameter of interest,
represents the local average treatment effect (LATE) of receiving an invitation to participate in one of the traineeships. As a benchmark, we will also present conventional OLS estimates of the effects of passing the selection.
All RD models are estimated within a certain bandwidth. Unfortunately, our limited sample size does not allow us to use very narrow bandwidths (due to power issues). At the same time, estimates within bandwidths that are very wide could be prone to specification bias (due to the groups to the left and right of the cutoff not being similar). For our main analyses, we try to balance this trade‐off by using ‘optimal’ bandwidths as selected by the method of Calonico et al. (2017). Our preferred RD models include a local linear specification of the forcing variable: for all bandwidths concerned, this simple specification is not rejected in favour of more flexible polynomials.21 With this linear polynomial, we find optimal bandwidths ranging between 1 and 1.6 score points. Since the scores are on a 1–10 scale, this bandwidth can be seen as fairly wide.22 In the robustness checks subsection, we assess the robustness of our results with respect to the choice of bandwidth and polynomial.
In the remainder of this section, we explore two potential threats to the RD approach. These include manipulation of the forcing variable and discontinuities in other variables around the cutoff.
The first concern relates to the possibility that candidates and/or assessors manipulate their score in order to be on one side of the cutoff rather than the other. This is unlikely, however, since the applicants did not know the cutoff beforehand. Moreover, the applicants were independently graded by a group of committee members and the assessor had no personal interest in the selection outcome. Figure 2 confirms this belief: there is no clear discontinuity in the density of the forcing variable around S = 0.23
Second, the unconfoundedness assumption requires that there are no other (unobserved) discontinuities around the cutoff. To explore whether this requirement might be violated, Figure 3 plots the mean of our four covariates (female, age at start of traineeship, at least one non‐Dutch parent – labelled as “Immigrant” –, and teacher‐shortage subject) against the normalized score, using a bandwidth of 1.4 score points.24 Not all covariates appear to be smooth around the cutoff,
21 We tested this using the ‘bin dummies approach’ as described by Lee and Lemieux (2010); results are available upon request. A visual inspection of the various RD plots (see below) also suggests that a linear specification seems appropriate. 22 For example, if the cutoff is 6.1 (e.g. for EDK_V, see Table A1) and the optimal bandwidth is 1 (as in Table 2), the ‘local sample’ comprises scores ranging from 5.1 to 7.1 23 This is also confirmed by the McCrary (2008) density test. There is, however, a remarkable spike in the density between 1.2 and 1.6. Our main results change very little if we exclude these observations from our analyses. 24 For ease of comparison, the bandwidth of 1.4 points (which lies within the range of optimal bandwidths found in Section 5) is used for all remaining RD plots in this paper. When we actually test for a discontinuity, however, we always apply the variable‐specific optimal bandwidth.

12
even though the jump is only significant for age. This may be due to sorting around the threshold, but it probably also reflects noise due to the small number of observations around the cutoff (and in each bin). Nevertheless, these findings stress the importance of including covariates in our regression models.
Figure 2 Histogram of the normalized scores
Figure 3 Relationship between covariates and the normalized selection day scores
Notes: The solid lines represent local linear regressions with triangular kernel weighting. Binwidth of 0.2.
0.1
.2.3
.4D
ensi
ty
-2 -1 0 1 2Score relative to cutoff
0.2
.4.6
.81
-1.5 -1 -.5 0 .5 1 1.5Score relative to cutoff
Female
2025
3035
-1.5 -1 -.5 0 .5 1 1.5Score relative to cutoff
Age
0.2
.4.6
.81
-1.5 -1 -.5 0 .5 1 1.5Score relative to cutoff
Immigrant
0.2
.4.6
.81
-1.5 -1 -.5 0 .5 1 1.5Score relative to cutoff
Shortage subject
13
5. ResultsThis section presents the main results. First, we present summary statistics of the data. Next, we estimate the effects of being selected for a traineeship on three outcome variables: (1) the probability of being in an academic training to become a fully qualified (‘first‐degree’) teacher (either through the regular academic teacher training or through the EDK‐ or OTS‐traineeship), (2) the probability of obtaining a first‐degree teaching qualification, and, subsequently, (3) the probability of working in education. Appendix B contains graphical illustrations of all RD models. In Appendix C, we present various “naïve” OLS estimates of the effects of passing the selection on our outcome variables.
Table 1 Descriptive statistics of characteristics of samples left and right of cutoff
Full sample Local sample (±1 grade point)
S < 0 S ≥ 0 P‐value S < 0 S ≥ 0 P‐value
Covariates
Female 0.51 0.64 0.01 0.48 0.66 0.02
(0.50) (0.48) (0.50) (0.48)
Age 27.34 27.10 0.46 26.45 27.46 0.04
(4.30) (2.92) (3.47) (2.82)
At least one non‐Dutch born parent 0.16 0.13 0.40 0.12 0.18 0.31
(0.37) (0.34) (0.33) (0.38)
Shortage subject 0.26 0.24 0.63 0.25 0.20 0.39
(0.44) (0.43) (0.44) (0.40)
Intermediate and outcome variables
Raw score 4.65 7.33 0.00 5.67 6.50 0.00
(1.23) (0.84) (0.51) (0.57)
Passed selection 0.03 0.94 0.00 0.06 0.86 0.00
(0.18) (0.25) (0.24) (0.35)
Started traineeship 0.01 0.59 0.00 0.02 0.52 0.00
(0.12) (0.49) (0.15) (0.50)
Enrolled into academic teacher training to become first‐degree teachera
0.27 0.65 0.00 0.33 0.60 0.00
(0.45) (0.48) (0.47) (0.49)
Did not finish traineeship 0.00 0.08 0.00 0.00 0.09 0.01
(0.00) (0.27) (0.00) (0.28)
Became first‐degree teacher (within 2 years after start of traineeship)b
0.21 0.52 0.000 0.27 0.47 0.04
(0.41) (0.50) (0.45) (0.50)
Works in secondary education (2½ years after start of traineeship)c
0.37 0.57 0.00 0.38 0.53 0.10
(0.48) (0.50) (0.49) (0.50)
N 202 296 83 91 Standard deviations in parentheses. a Either the regular academic teacher training program or the EDK‐ or OTS‐traineeship. b Based on smaller subsample (331 observations in the full sample, 111 observations in the local sample). c Based on smaller subsample (380 observations in the full sample, 125 observations in the local sample).
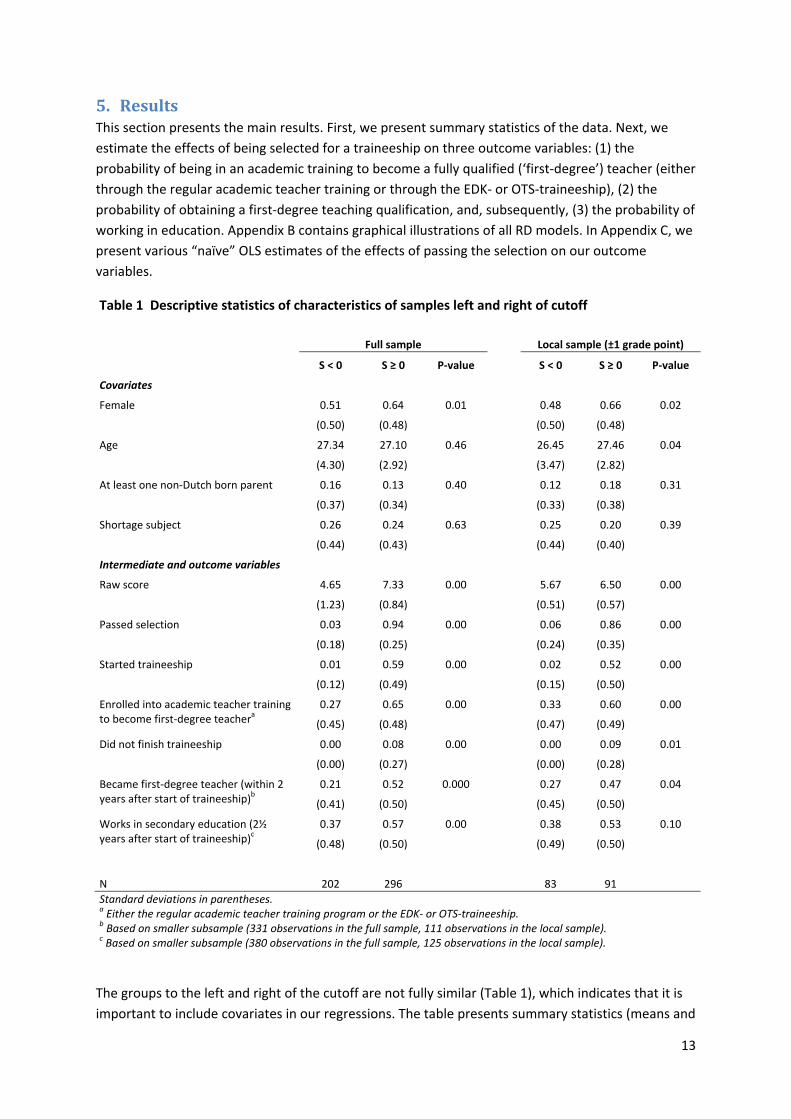
The groups to the left and right of the cutoff are not fully similar (Table 1), which indicates that it is important to include covariates in our regressions. The table presents summary statistics (means and

14
standard deviations) for several characteristics of the candidates below and above the threshold, both for the full sample and for a local subsample of candidates (within a ±1 grade point bandwidth on either side of the cutoff). Not surprisingly, there are differences between the two groups in both samples: in both the full sample and the local sample, women are overrepresented in the group with a score above the cutoff. Moreover, in the local sample, the people with a sufficient score are about a year older. More importantly, however, there is a remarkable difference between the probability of passing the selection and the probability of actually starting a traineeship for the people above the cutoff. About 90 percent of the candidates with a sufficient score passed the selection, whereas less than 60 percent actually started a traineeship. This implies that a third of the approved candidates did not manage to find a school or, in incidental cases, voluntarily withdrew before the start of the traineeship.
All tables that present regression results have the same structure. The first row of the tables presents the IV estimates on the outcome variable. The second row shows the first stage estimates, representing the jump in the probability of being selected to start the EDK‐ or OTS‐traineeship at the cutoff. The odd‐numbered columns depict the results without any applicant controls, whereas the even‐numbered columns present the results for estimates that include all controls: the latter is our preferred specification. All models include tranche fixed effects.
First, we find no statistical evidence that being selected for the traineeship increases the probability to enroll into an academic teacher training. Table 2 shows the estimated effects of passing the selection on the probability of being in training to become a first‐degree teacher, six months after the starting date of the traineeship (columns (1) and (2)) and at least once between the starting date of the traineeship and August 2017 (columns (3) and (4)). The first stage results show that selected candidates are about 70%‐points more likely to enroll into academic teacher training. The F‐statistics show a strong first stage (in all specifications F≥30).25 All IV estimates are positive but not significantly different from zero, thus suggesting that being selected did not cause additional enrollment into academic teacher training. However, this might be due to a lack of power: the relatively large standard errors suggest that the coefficients are imprecisely estimated. The RD point estimate in column (4), for example, suggests that there is a non‐negligible increase in enrollment at the cutoff (about 24 percentage points), but its standard error is too large to detect this effect.26 Yet, there are also two possible substantive explanations for this finding. First, a sizeable fraction of the rejected applicants (immediately) enroll in a regular teacher training program. Second, roughly one‐third of the selected applicants did not actually start the traineeship: they withdrew while searching for a school, either voluntarily or because they did not succeed in in finding a school to start working at. Most of them did not revert to the regular teacher training.27
25 This holds for all remaining tables. 26 Since the presented standard errors have not been corrected for the fact that we have estimated the implicit cutoffs, the ‘true’ standard errors are likely to be even bigger. 27 Appendix D presents the results of a survey held among applicants for the traineeships. Less than 30% of (actually enrolled) trainees who responded, answered that they would have started in the regular teacher training in case they had not been selected for the traineeship. This may point at some additionality of the traineeship regarding enrolment into academic teacher training and underlines that not finding a significantly positive effect on enrolment may be due to selected applicants not finding a school. Among the ones that did not enrol into the program, about 20% said they had started in the regular teacher training. However, the

15
The RD point estimates are sensitive to the inclusion of covariates, which suggests that it is indeed important to adequately control for any remaining differences around the cutoff. The “naïve” OLS estimates (as shown in Appendix C) are more positive and strongly significant, but are likely to suffer from selection bias.
Table 2 Enrolled into academic teacher training to become a first‐degree teacher; preferred specification (optimal bandwidth and linear polynomial)
½ year after start Ever (after start)
(1) (2) (3) (4)
Effect of passing selection (IV) 0.262 0.262 0.185 0.240 (0.201) (0.194) (0.203) (0.188)
First stage 0.699*** 0.722*** 0.700*** 0.725*** (0.112) (0.110) (0.108) (0.108)
Bandwidth 0.952 0.952 1.001 1.001 F‐statistic instrument 39.2 42.8 41.9 45.5 Number of observations 164 164 177 177 Covariates no yes no yes Tranche fixed effects yes yes yes yes Notes: Standard errors in parentheses. The RD models are estimated using the method of Calonico et al. (2017) with triangular kernel weighting; the optimal bandwidth from the specification with controls (even‐numbered columns) is also imposed on the specification without controls (odd‐numbered columns). Included covariates are: age, age squared, gender, nationality, and shortage subject. Significance levels: *** 1%, ** 5%, * 10%.
Second, we also find no significant effects on the probability of obtaining a first‐degree training qualification (Table 3). After two years, when all trainees who do not quit during the program28 obtain their first‐degree teacher qualification, the estimated effects are positive but small and insignificant (unlike the OLS estimates), although these results may also suffer from a lack of power.
Finally, we find no positive effects of passing the selection on the probability of working in education. This seems natural, since there are no significantly positive effects on enrolment and qualification. Yet, it could be that those who finish their traineeship are more likely to end up (remaining) working as a teacher.29 However, the preferred RD estimates are close to zero and insignificant shortly after the end of the traineeship (Table 4). It is possible that not all trainees receive a job offer from their school at the end of the traineeship, so there could be some (frictional) unemployment and switches to other sectors around this time period. Unfortunately, the current data do not allow us to look much further without losing another substantial amount of
survey response for the latter group was low. Note that the survey distinguishes between enrolled and non‐enrolled candidates, whereas the data‐analysis focuses on selected versus non‐selected candidates. 28 About 13% of the trainees drop out during the program. 29 Our survey‐results in Table A.1 in the Appendix show that about 75% of the (actually enrolled) trainees who responded, answered that they intend to work as a teacher, most of them for a longer period of time. Note that the survey distinguishes between enrolled and non‐enrolled candidates, whereas the data‐analysis focuses candidates on selected versus non‐selected into the traineeship.

16
observations.30 Table 3 Obtained first‐degree teaching qualification, preferred specification (optimal bandwidth and linear polynomial)
2 years after start
(1) (2) Effect of passing selection (IV) 0.024 0.091
(0.183) (0.173)
First stage 0.745*** 0.771***
(0.116) (0.116)
Bandwidth 1.601 1.601
F‐statistic instrument 41.1 44.0
Number of observations 207 207
Covariates no yes
Tranche fixed effects yes yes Notes: Standard errors in parentheses. The RD models are estimated using the method of Calonico et al. (2017) with triangular kernel weighting; the optimal bandwidth from the specification with controls (even‐numbered columns) is also imposed on the specification without controls (odd‐numbered columns). Included covariates are: age, age squared, gender, nationality and shortage subject. The maximum number of available observations is smaller than in Table 2. This reflects data availability (graduation data are only available until August 2016). Significance levels: *** 1%, ** 5%, * 10%.
Table 4 Working in education, preferred specification (optimal bandwidth and linear polynomial)
2 years after start 2½ years after start (1) (2) (3) (4) Effect of passing selection (IV) 0.031 ‐0.062 0.157 0.015
(0.200) (0.180) (0.221) (0.189) First stage 0.726*** 0.754*** 0.740*** 0.769***
(0.112) (0.111) (0.134) (0.133)
Bandwidth 1.589 1.589 1.182 1.182 F‐statistic instrument 42.3 46.1 30.6 38.8 Number of observations 235 235 153 153 Covariates no yes no no Tranche fixed effects yes yes yes yes Notes: Standard errors in parentheses. The RD models are estimated using the method of Calonico et al. (2017) with triangular kernel weighting; the optimal bandwidth from the specification with controls (even‐numbered columns) is also imposed on the specification without controls (odd‐numbered columns). Included covariates are: age, age squared, gender, nationality and shortage subject. The maximum number of available observations is smaller than in Table 2. This reflects data availability (labour market data are available until June 2017). Significance levels: *** 1%, ** 5%, * 10%.
30 After 2 years and 10 months (the latest point in time for which we have the same maximum number of observations), the coefficients are also close to zero and insignificant.

17
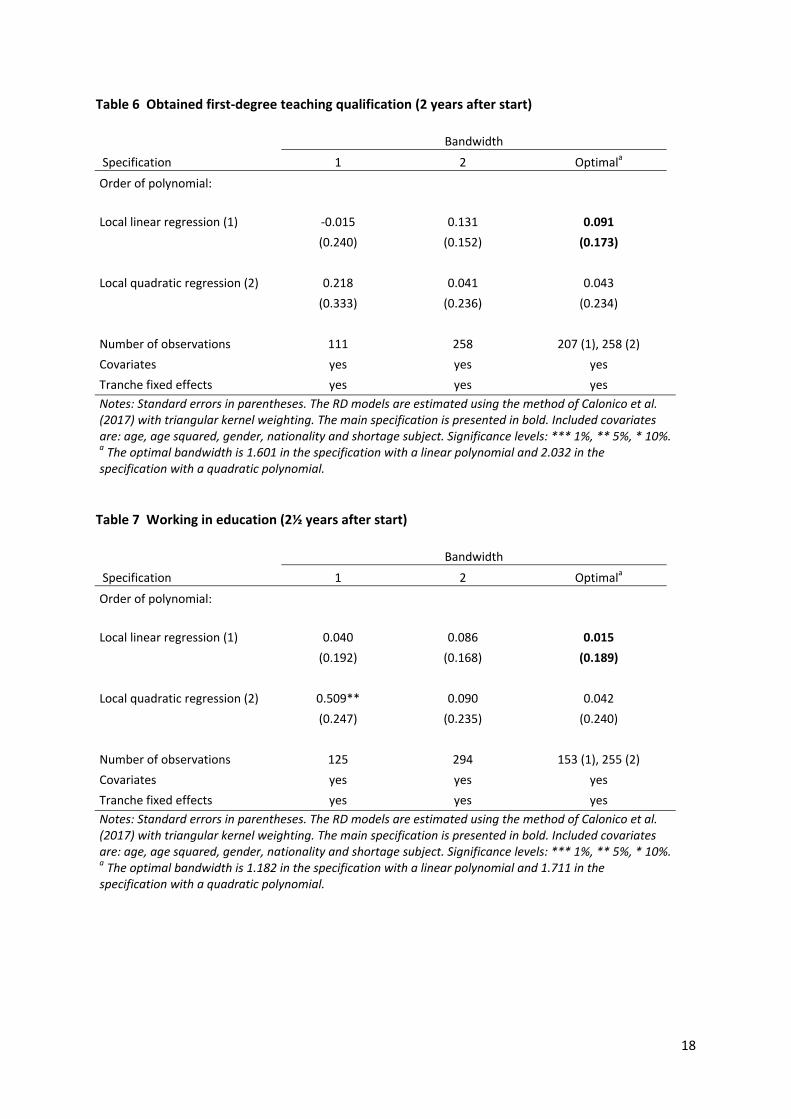
RobustnesschecksIn this subsection, we perform robustness checks with respect to the bandwidth and polynomial used in the RD regressions. We experiment with combinations of a linear or quadratic polynomial and a bandwidth of one score point or two score points or an automatically optimized bandwidth. Tables 5–7 show the IV estimates for these models, where we focus on the specification with controls and (if applicable) on the latest point in time after the start of the traineeship.31
For each outcome variable, the results of the specification with an automatically optimized bandwidth seem to be fairly insensitive with respect to the order of the polynomial. The combination of either (1) a narrow bandwidth and a linear polynomial or (2) a broader bandwidth and a quadratic polynomial generates estimates that are in line with the main specification. However, as we divert from these ‘standard’ combinations, the estimates can become less robust.
Table 5 Enrolled into academic teacher training to become a first‐degree teacher (ever after start)
Bandwidth Specification 1 2 Optimala Order of polynomial:
Local linear regression (1) 0.240 0.335*** 0.240
(0.189) (0.129) (0.188)
Local quadratic regression (2) 0.266 0.268 0.225
(0.278) (0.201) (0.220)
Number of observations 174 391 177 (1), 328 (2) Covariates yes yes yes Tranche fixed effects yes yes yes Notes: Standard errors in parentheses. The RD models are estimated using the method of Calonico et al. (2017) with triangular kernel weighting. The main specification is presented in bold. Included covariates are: age, age squared, gender, nationality and shortage subject. Significance levels: *** 1%, ** 5%, * 10%. a The optimal bandwidth is 1.001 in the specification with a linear polynomial and 1.616 in the specification with a quadratic polynomial.
31 This means that we assess the robustness of the IV estimates shown in column (4) of Table 2, column (2) of Table 3, and column (4) of Table 4, respectively.
18
Table 6 Obtained first‐degree teaching qualification (2 years after start)
Bandwidth Specification 1 2 Optimala Order of polynomial:
Local linear regression (1) ‐0.015 0.131 0.091
(0.240) (0.152) (0.173)
Local quadratic regression (2) 0.218 0.041 0.043
(0.333) (0.236) (0.234)
Number of observations 111 258 207 (1), 258 (2) Covariates yes yes yes Tranche fixed effects yes yes yes Notes: Standard errors in parentheses. The RD models are estimated using the method of Calonico et al. (2017) with triangular kernel weighting. The main specification is presented in bold. Included covariates are: age, age squared, gender, nationality and shortage subject. Significance levels: *** 1%, ** 5%, * 10%. a The optimal bandwidth is 1.601 in the specification with a linear polynomial and 2.032 in the specification with a quadratic polynomial.
Table 7 Working in education (2½ years after start)
Bandwidth Specification 1 2 Optimala
Order of polynomial:
Local linear regression (1) 0.040 0.086 0.015
(0.192) (0.168) (0.189)
Local quadratic regression (2) 0.509** 0.090 0.042
(0.247) (0.235) (0.240)
Number of observations 125 294 153 (1), 255 (2) Covariates yes yes yes Tranche fixed effects yes yes yes Notes: Standard errors in parentheses. The RD models are estimated using the method of Calonico et al. (2017) with triangular kernel weighting. The main specification is presented in bold. Included covariates are: age, age squared, gender, nationality and shortage subject. Significance levels: *** 1%, ** 5%, * 10%. a The optimal bandwidth is 1.182 in the specification with a linear polynomial and 1.711 in the specification with a quadratic polynomial.

19
6. DiscussionThe RD estimates show no positive local average treatment effect of being selected for the traineeship, neither on obtaining a first‐degree teaching qualification nor on working in education (with point estimates that are close to zero). In this section, we discuss both methodological and program‐related potential explanations for these findings.
The first methodological issue relates to power: the lack of significantly positive effects may be due to the small number of observations in our dataset. In particular, this might play a role in our estimates for enrolment. For example, the confidence intervals in Table 2 show that we cannot exclude enrolment effects of about 60 percentage points (with 95% confidence). At the same time, we find much smaller point estimates for qualification and retention. The statistical power of the estimates could be increased by choosing a larger bandwidth, but this comes at the cost of a reduction in internal validity: if the groups to the left and right of the cutoff include more people that are relatively far away from the cutoff, the groups become less similar.
The second methodological issue is also related to internal validity. As mentioned in the methodology section, we estimated the implicit cutoffs. This implies, however, that discontinuities in the selection variable at these cutoffs might not be fully exogenous: the observed cutoff point might in fact also be the result of non‐observable differences that are related to being on either side of the “threshold”.
Apart from methodological issues, the specific design of the program may provide some suggestions why these results occur. First of all, a substantial share of the approved candidates (the individuals who passed the selection day) did not succeed in finding a school to actually start their traineeship. In particular, the propensity of not finding a school is relatively high for candidates with a score just above the cutoff (see Figure 4) and candidates applying for a non‐shortage subject.32 On the side of the candidates, lower scores may indicate that there is a lower motivation or ability to find a school. On the side of the schools, candidates for non‐shortage subjects and candidates with a relatively low score might be seen as less attractive. Schools can apply various strategies to fulfil vacancies among which hiring an EDK‐ or OTS‐trainee is just one option. Schools will balance the expected costs and benefits against each other; costs are for example the salary paid for the time the trainee is not available for teaching (due to the EDK‐leadership program or time for studying) and the amount of supervision that has to be offered.33 Furthermore, they have to consider that they must appoint the candidate for a period of two years. Schools do indeed receive a subsidy to bear (part of) these costs, but it is clear that the attractiveness of the deal is higher the more promising the candidate is. Schools that are hesitant may therefore only be willing to accept top candidates. On the other hand, candidates with high scores may have attractive outside options that divert them from searching a school in the first place.
32 This follows from a simple descriptive analysis. Results are available upon request. 33 The only source of information about the reasons behind candidates having difficulty finding a school is a small survey among a limited group of selected candidates who did not actually start the traineeship. The survey indicates that schools were reluctant to hire candidates because these schools were not always convinced of the approach and added value of the traineeship programs. Moreover they felt hesitant about trainees teaching right away in spite of having little or no teaching experience (Korlaar and Steur, 2015).

20
It is possible that not finding a school has a negative impact on the likelihood to become a first‐degree teacher. Approved candidates who do not succeed in finding a school may of course revert to the general academic teacher training, but only a minority takes that road. Six months after the start of the traineeship, 20.6% of the candidates who were rejected on the selection day had enrolled into the general academic teacher training, whereas only 7.5% of the approved candidates who failed finding a school did so. One possible reason behind this difference is that the approved candidates who – to no avail – spent time trying to find a school have not been able to subscribe for the general training in time. Although it is possible to enrol in the regular teacher training twice a year, this difference does not become much smaller 12 months after the start of the traineeship (21.5% and 9.3%, respectively). Not only the average percentages differ between the two subsamples: Figure 5 shows that individuals with scores just below the cutoff have a high propensity to join the regular teacher training. This may indicate that there is a positive correlation between the obtained score and the motivation to become a fully qualified teacher.
Another possible reason why only a small percentage of the selected candidates without a school revert to the general teaching training is that failing to find a school may have been a demotivating experience. Moreover, path dependencies may have played a role: individuals who were not in time to enrol into the general teacher training program may have taken other initiatives (such as taking a job outside education) causing the teacher training to get out of scope. This is consistent with the observation that enrolment in the regular teacher training remains small even after a year (see above). Possibly, the perspective of entering a paid traineeship (induced by passing the selection) may also have changed their aspirations, strengthening their preference for a paid job, whereas reverting to the general teacher training would imply becoming a student again. Also, having been selected for a traineeship might be an advantage for job applicants.
To sum up, the specific design of the traineeship programs may be partly responsible for the lack of significant local average treatment effects. Especially the fact that candidates who pass the selection have to find a school by themselves (which turns out not to be easy) may negatively impact the probability to become a fully qualified teacher. A substantial part of them does not succeed in finding a school, in particular the ones with a score close to the cutoff. Whereas rejected candidates just below the cutoff tend to become a teacher through the general teacher training program, selected candidates who do not find a school often do not revert to the general teacher training program, probably due to a combination of demotivation, time‐restrictions and path‐dependencies.

21
Figure 4 Percentage of selected candidates that did not find a school to start traineeship
Notes: Individuals who have not been able to find a school, as a percentage of the ones who passed the
selection. Marker size represents relative group size (binwidth of 0.2).
Figure 5 Percentage enrolled in regular teacher training (within the observed period), out of the
candidates who did not start in a traineeship
Notes: Individuals who have enrolled at the regular teacher training program after the onset of the traineeship
they applied for and within the period observed by the data, as a percentage of the ones who did not start in
one of the traineeships. Marker size represents relative group size (binwidth of 0.2).
0.2
.4.6
.81
0 .5 1 1.5Score relative to cutoff
0.2
.4.6
.81
-1.5 -1 -.5 0 .5 1 1.5Score relative to cutoff

22
7. ConclusionsThis paper evaluated the effectiveness of two teacher traineeship programs, implemented in the Netherlands to address shortages of fully qualified teachers at the two highest tracks of secondary education, in terms of additional quantity. Hereto, we estimated the causal effects of being selected for a teacher traineeship program on the probability of (1) enrolling into academic teacher training (comprising both the traineeships and the general teacher training program), (2) obtaining a first‐degree teaching qualification, and (3) working in education. We applied a fuzzy regression discontinuity design (FRD), exploiting the scores candidates obtained at the selection day, where passing the selection was instrumented with an indicator for scoring at or above the cutoff.
The RD‐analysis shows little evidence that the traineeships had the intended effect. More specifically: (1) the local average treatment effect of passing the selection on the probability to enrol into academic teacher training (comprising both the traineeships and the general teacher training program) is positive but not statistically significant; (2) we find small and insignificant effects on the probability to obtain a first‐degree teaching qualification; (3) finally, we also find small and insignificant effects on the probability of working in education. The specific design of the traineeship programs may be partly responsible for the lack of significant local average treatment effects. Especially, the fact that candidates who pass the selection are supposed to find a school by themselves may negatively impact the probability to become a fully qualified teacher. Selected candidates who do not find a school are less likely to revert to the regular academic teacher training program than candidates who were rejected at the last selection day. Several interpretations are possible: not finding a school may demotivate the selected candidates, perhaps time‐restrictions prevent them for subscribing for the regular training program, or path‐dependencies may play a role. However, the fact that no significant local average treatment effects are found does not necessarily rule out that the traineeship programs in their entirety have led to additional teachers. The effects of passing the selection might be different for people further away from the cutoff. Assessing the external validity of the RD results is therefore not straightforward. Moreover, it could be that the sheer presence of the programs has enhanced the appeal of the teaching profession. Also, our findings regarding quantity do not rule out positive effects on teacher quality. However, our results suggest that making candidates responsible for finding a school to start their traineeship might be an obstacle to the success of such a program. Schools can make their choice from a menu of options to fulfil their vacancies; hiring an unexperienced trainee is one of those options and schools will weigh the expected benefits against the costs. In order to improve the match between candidates selected for the teacher traineeship program and schools, future policies could focus on improved coordination of the matching process, reducing the risks and uncertainties for schools and/or reducing the costs for schools.

23
ReferencesAdmiraal, J. M., and Helms‐Lorenz, M. (2016). Teaching skills of trainees in secondary education in the Netherlands – preliminary results. Paper presented at EARLI SIGs 18 and 23 Joint Conference 2016, Oslo, Norway.
Adriaens, M., P. Fontein, M. den Uijl and K. de Vos (2016). De toekomstige arbeidsmarkt voor onderwijspersoneel po, vo en mbo 2015‐2025 – Update november 2016. CentERdata, Tilburg.
Antecol, H., Eren, O. and Ozbeklik, S. (2013). The effect of Teach for America on the distribution of student achievement in primary school: Evidence from a randomized experiment. Economics of
Education Review, 37, 113‐125.
Calonico, S., M.D. Cattaneo, M.H. Farrell and R. Titiunik (2017). rdrobust: Software for regression‐discontinuity design. The Stata Journal, 17(2), 372‐404.
CPB (2017). Paden naar leraarschap. CPB Notitie, CPB, Den Haag.
Heilig, J.V. and Jez, S.J. (2010). Teach For America: A Review of the Evidence. Boulder and Tempe: Education and the Public Interest Center & Education Policy Research Unit.
Korlaar, L. and J. Steur (2015). Tussentijdse evaluatie OnderwijsTraineeships. Dialogic, Utrecht.
Kamerbrief 13032013 (2013). Nadere invulling impuls leraren tekortvakken € 100 mln inclusief uitwerking amendement Lucas en Jadnanansing. Ministerie van OCW, Den Haag.
Lee, D.S. and T. Lemieux (2010). Regression Discontinuity Designs in Economics. Journal of Economic
Literature 48, 281‐355.
McCrary, J. (2008). Manipulation of the running variable in the regression discontinuity design: A density test. Journal of Econometrics, 142(2), 698‐714.
Nuffic (2015), Education system The Netherlands, Den Haag.

24
Appendices
AppendixA:Tranche‐specificcutoffsTable A1 Estimated tranche‐specific cutoffs for shortage subjects and non‐shortage subjects
Tranche Shortage subjects Non‐shortage subjects
EDK_V 6.1 6.1 EDK_VI 6.0 7.0 EDK_VII 6.0 6.5 OTS_2013_2 6.5 ‐ OTS_2014_1 5.3 ‐ OTS_2014_2 5.6 ‐ OTS_2015_1 6.3 ‐
AppendixB:GraphicalillustrationofRDmodels This section presents plots of our RD models. Contrary to our estimations in the results section, we now use a fixed bandwidth of 1.4 points for all RD plots (for ease of comparison). In our regressions, we also include tranche fixed effects and individual controls.
Figure A1 Relationship between the probability of passing the selection and the normalized
selection day scores
Notes: The solid lines represent local linear regressions with triangular kernel weighting. Binwidth of 0.2.
0.2
.4.6
.81
-1.5 -1 -.5 0 .5 1 1.5Score relative to cutoff

25
Figure A2 Relationship between the probability of being enrolled into the academic teacher
training to become a first‐degree teacher (½ year after start) and the normalized selection day
scores
Notes: The solid lines represent local linear regressions with triangular kernel weighting. Binwidth of 0.2.
Figure A3 Relationship between the probability of being enrolled into the academic teacher
training to become a first‐degree teacher (ever after start) and the normalized selection day scores
Notes: The solid lines represent local linear regressions with triangular kernel weighting. Binwidth of 0.2.
0.2
.4.6
.81
-1.5 -1 -.5 0 .5 1 1.5Score relative to cutoff
0.2
.4.6
.81
-1.5 -1 -.5 0 .5 1 1.5Score relative to cutoff

26
Figure A4 Relationship between the probability of having obtained a first‐degree teaching
qualification (2 years after start) and the normalized selection day scores
Notes: The solid lines represent local linear regressions with triangular kernel weighting. Binwidth of 0.2.
Figure A5 Relationship between the probability of working in education (2 years after start) and
the normalized selection day scores
Notes: The solid lines represent local linear regressions with triangular kernel weighting. Binwidth of 0.2.
0.2
.4.6
.81
-1.5 -1 -.5 0 .5 1 1.5Score relative to cutoff
0.2
.4.6
.81

27
Figure A6 Relationship between the probability of working in education (2½ years after start) and
the normalized selection day scores
Notes: The solid lines represent local linear regressions with triangular kernel weighting. Binwidth of 0.2.
0.2
.4.6
.81

28
AppendixC:OLSresults This section presents ‘naïve’ OLS estimates for our three outcome variables. For the sake of comparison with our RD estimates (where we use ‘optimal’ bandwidths that vary across specifications), results for a variety of bandwidths are shown.
Table A2 OLS estimates of the effect of passing the selection on the probability of being enrolled
into the academic teacher training to become a first‐degree teacher
Bandwidth Specification 0.5 1 1.5 2 2.5 Timing after start:
½ years 0.251** 0.371*** 0.429*** 0.432*** 0.450*** (0.109) (0.072) (0.053) (0.047) (0.043)
Ever 0.263** 0.327*** 0.411*** 0.408*** 0.421***
(0.111) (0.074) (0.054) (0.048) (0.044)
Number of observations 93 174 299 391 444 Covariates yes yes yes yes yes Tranche fixed effects yes yes yes yes yes Notes: Standard errors in parentheses. Included covariates are: age, age squared, gender, nationality and shortage subject. Significance levels: *** 1%, ** 5%, * 10%.
Table A3 OLS estimates of the effect of passing the selection on the probability of having obtained
a first‐degree teaching qualification (2 years after start)
Bandwidth Specification 0.5 1 1.5 2 2.5
Timing after start:
2 years 0.120 0.335*** 0.397*** 0.389*** 0.384*** (0.155) (0.088) (0.064) (0.056) (0.053)
Number of observations 48 111 189 258 290 Covariates yes yes yes yes yes Tranche fixed effects yes yes yes yes yes Notes: Standard errors in parentheses. Included covariates are: age, age squared, gender, nationality and shortage subject. Significance levels: *** 1%, ** 5%, * 10%.
29
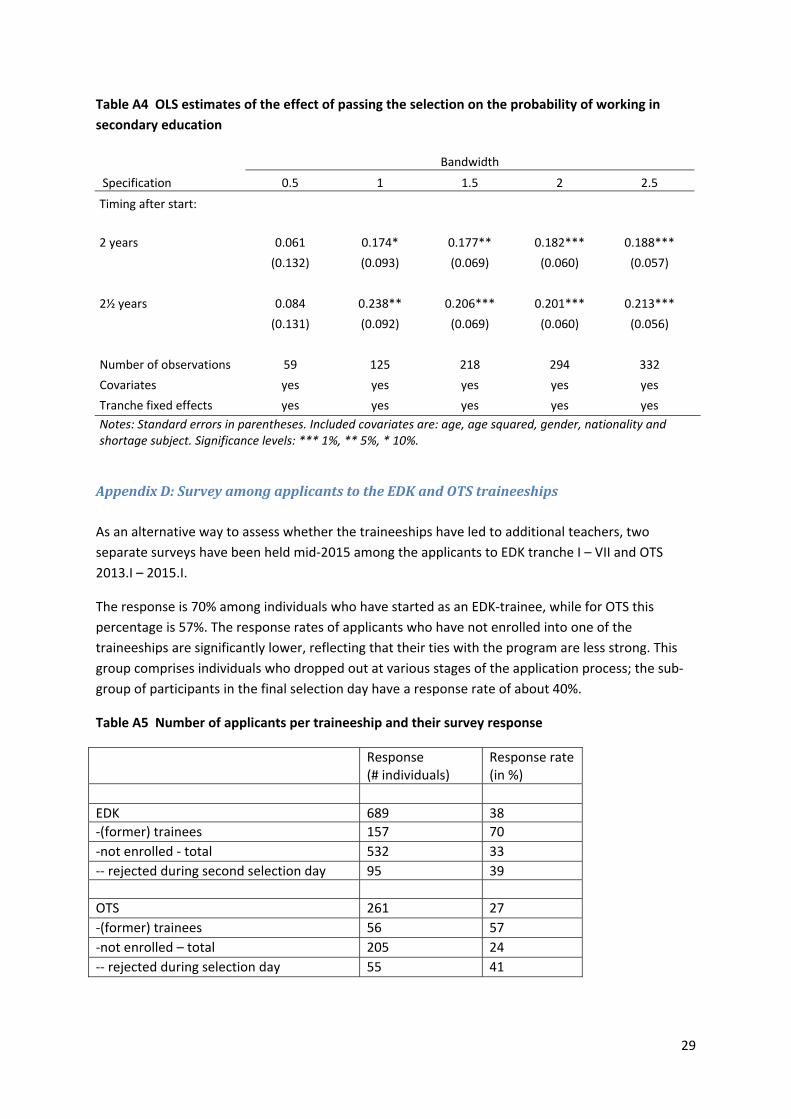
Table A4 OLS estimates of the effect of passing the selection on the probability of working in
secondary education
Bandwidth Specification 0.5 1 1.5 2 2.5
Timing after start:
2 years 0.061 0.174* 0.177** 0.182*** 0.188*** (0.132) (0.093) (0.069) (0.060) (0.057)
2½ years 0.084 0.238** 0.206*** 0.201*** 0.213***
(0.131) (0.092) (0.069) (0.060) (0.056)
Number of observations 59 125 218 294 332 Covariates yes yes yes yes yes Tranche fixed effects yes yes yes yes yes Notes: Standard errors in parentheses. Included covariates are: age, age squared, gender, nationality and shortage subject. Significance levels: *** 1%, ** 5%, * 10%.
AppendixD:SurveyamongapplicantstotheEDKandOTStraineeships As an alternative way to assess whether the traineeships have led to additional teachers, two separate surveys have been held mid‐2015 among the applicants to EDK tranche I – VII and OTS 2013.I – 2015.I.
The response is 70% among individuals who have started as an EDK‐trainee, while for OTS this percentage is 57%. The response rates of applicants who have not enrolled into one of the traineeships are significantly lower, reflecting that their ties with the program are less strong. This group comprises individuals who dropped out at various stages of the application process; the sub‐group of participants in the final selection day have a response rate of about 40%.
Table A5 Number of applicants per traineeship and their survey response
Response (# individuals)
Response rate (in %)
EDK 689 38 ‐(former) trainees 157 70 ‐not enrolled ‐ total 532 33 ‐‐ rejected during second selection day 95 39 OTS 261 27 ‐(former) trainees 56 57 ‐not enrolled – total 205 24 ‐‐ rejected during selection day 55 41

30
We use ‘What If’‐questions to evaluate which choices enrolled individuals would have made in the counterfactual case that they had not enrolled into the traineeship. The questions refer to both study choice and working in the educational sector. Regarding study choice, trainees and former trainees were asked for example: ‘If you had not been selected for the traineeship, would you have chosen for the regular teacher training?’. Individuals who did not enrol into the traineeship were asked: ‘Did you enrol into the regular teacher training?’. Regarding employment, all applicants were asked if they are working as a teacher at the time of the survey. As the survey was held at one specific moment in time, tranches varied in the time they were available for the labour market. Tranches that were still doing their traineeship were asked about their intention to work as a teacher once they would have finished their traineeship.
Table A6 gives an overview of the findings; the upper panel presents a set of four questions posed to individuals who enrolled into traineeship. Among them, only 30% report that they would have opted for the regular teacher traineeship in case they were not selected for the traineeship. Of the OTS‐trainees, another 30% say they would have chosen the regular lateral entry training (the option of the regular lateral entry training has not been included in the survey among EDK‐applicants). More than 70% of the respondents report they either have obtained a job contract as a teacher or that (in case they were still participating in the traineeship at the time of the survey) they intend to start working as a teacher. Among the ones working as a teacher the majority obtained a permanent contract. A majority says he/she intends to remain working as a teacher in the longer run.
The lower panel of Table A6 presents responses by individuals who were rejected at the (final) selection day. On average, almost a quarter of them report to have enrolled into the regular teacher training. More than a quarter of those currently working says to be working as a teacher, mostly on temporary contracts. The expectations of working as a teacher in the future are spread equally between low, neutral and high for individuals. Among respondents who passed the final selection days for EDK or OTS but did not start working as a trainee (this group is not mentioned in the table), either because they could not find a school to work at or for other reasons, about 19% started the regular teacher traineeship. Out of the individuals in this group who work, a quarter works as a teacher; the vast majority on temporary contracts
The survey‐results therefore suggest that the EDK‐ and OTS‐traineeships may have led to additional teachers. The response, however, is not very high, especially for individuals who did not pass the final selection day, thus possibly the results are not fully representative for the entire sample.

31
Table A6 Results of surveys among applicants to the EDK and OTS traineeships
Questions for individuals who enrolled into the traineeship:
# obs. 1) If you had not been selected for a traineeship, would you have opted for the regular teacher
training (OTS: yes=including regular ‘lateral entry’‐teacher training)? No (%) Yes, regular
teacher training(%) Yes, regular lateral entry teacher training (%)
EDK 72 28 155 OTS 41 29 30 55
2) Did you/do you (intend to) start working as a teacher after the traineeship? No (%) Yes (%) I don’t know (%) EDK 16 70 14 142 OTS 8 79 13 38
3) If working as a teacher, do you have a temporary or a permanent contract? Temporary Permanent EDK 26 74 89
4) How long do you expect to remain working as a teacher after finishing the traineeship? 0‐3 years (%) 3‐5 years (%) 5‐10 years (%) >10 years (%) EDK 17 29 31 23 105 OTS 7 30 17 46 30 Questions for individuals who were rejected at the (final) selection day:
5) Did you enrol into the regular teacher training? No (%) Yes (%) EDK 79 21 95 OTS 71 29 55
6) Sample of those who work: Are you currently working as a teacher in secondary education? No (%) Yes (%) EDK 64 29 95 OTS 74 26 46
7) If working as a teacher, do you have a temporary or a permanent contract? Temporary Permanent EDK 71 29 28 OTS 83 17 12
8) How high do you consider the chance that you will be working as a teacher in the future? Quite/very low (%) Neutral (%) Quite/very high (%) EDK 46 36 18 67 OTS 39 37 24 43 Note: The last column gives the total response (in # observations) for the question concerned. Regarding question 1), the two surveys differed: besides the regular teacher training, the OTS‐survey also offered the option of the ‘regular lateral entry teacher training’. For question 3) results for OTS are left out since the question was posed to cohort OTS‐I only (total # responses: 3).
