do all children have places to be active?
TRANSCRIPT

A national program of the Robert Wood Johnson Foundation, with direction and technical assistance provided by San Diego State University.
Do All Children Have Places to Be Active?Disparities in Access to Physical Activity Environments in Racial and Ethnic Minority and Lower-Income Communities
Active Living ResearchBuilding Evidence to Prevent Childhood Obesity and Support Active Communitieswww.activelivingresearch.org
IntroductIon
Childhood obesity is one of the country’s most significant health problems.
During the past four decades, the obesity rate for children ages 6 to 11
has more than quadrupled, and it has more than tripled among teens ages
12 to 19.1, 2 Currently, more than 23 million young people are overweight or
obese.3, 4 Many efforts to prevent childhood obesity aim to make it easier
for children to be active in their communities, because physical activity
provides numerous benefits for children. More active children have a lower
risk of obesity and diabetes,5 higher academic performance,6, 7 and are
more on-task and less disruptive in school.8 – 10 To ensure that efforts to
support physical activity among children are as effective as possible, it is
important to know how they impact children of all racial, ethnic and
economic backgrounds.
REsE ARCh synthEsIs | November 2011

Active Living Research | RESEARCh SynthESiS | November 2011 page 2
A national program of the Robert Wood Johnson Foundation, with direction and technical assistance provided by San Diego State University. activelivingresearch.org
Neighborhoods and communities can support activity both physically, by having sidewalks,
bicycle lanes and parks, and socially, by being safer, cleaner and having less traffic. This
synthesis examines the growing body of evidence indicating that racial and ethnic minority, and
lower-income, communities do not provide as many built and social environmental supports
for physical activity. It also summarizes research on racial, ethnic and economic disparities in
obesity and physical activity rates among children.
Although this synthesis focuses on how the environment can support activity among children
and adolescents, some evidence relating to adults is presented because many environmental
factors that affect adults’ physical activity have implications for children and youth as well.
Key Research Results
Racial and ethnic minority and lower-income children are more likely to be
overweight or obese.
n the evidence on racial, ethnic, and socioeconomic differences in physical activity rates
vary. For instance, while some self-report studies show that African-American and Mexican-
American youth are less active than White youth, other, objective data indicate that they are more
likely to meet activity recommendations than their White peers.11–13 What is clear however is that
high obesity rates and low physical activity rates are problems for children of all backgrounds14, 15
but that, overall, lower-income and racial and ethnic minority youth are more likely to be
overweight or obese.16–18
Communities with predominantly racial and ethnic minority and lower-income
residents lack features that support walking
n Adults who live in walkable neighborhoods — those that are densely populated and have
mixed land use and well-connected streets — tend to be more physically active than those
who don’t.19, 20 There is less evidence of such an association among young people.21, 22 Urban
neighborhoods are more likely to be walkable, and tend to have more African-American, Hispanic
and lower-income residents.23–25 But the urban communities with more racial and ethnic minority
and lower-income residents generally lack specific features that support walking, such as clean
and well-maintained sidewalks, trees and nice scenery.26–32 Such deficits may undermine the
generally favorable effects of walkable neighborhood design.
Lower-income groups and racial and ethnic minorities have limited access
to well-maintained or safe parks
n the presence of parks, open space and other recreational facilities is consistently linked
with higher physical activity levels among children and adolescents.33–35 However, many
studies show that lower-income groups and racial and ethnic minorities have limited access to
well-maintained or safe parks36–42 and recreational facilities.43–45 The low leisure-time physical

Active Living Research | RESEARCh SynthESiS | November 2011 page 3
A national program of the Robert Wood Johnson Foundation, with direction and technical assistance provided by San Diego State University. activelivingresearch.org
activity rates and high risk of obesity among racial or ethnic minority children, and those living in
lower-income areas, can be partially explained by their generally poor access to parks and private
recreation facilities.46, 47 There is, however, very little evidence of a relationship between
playgrounds and activity among youth,48 or of racial, ethnic, or socioeconomic disparities in
access to safe playgrounds.49
Lower-income groups and racial and ethnic minorities are more likely to live
in areas with higher crime rates and more physical and social disorder.
n Crime, perceptions of safety, neighborhood disorder, traffic and other aspects
of the social environment are associated with less physical activity among children and
adolescents.50, 51 Many studies find that people with lower incomes, and racial and ethnic
minorities, are more likely to live in areas with high crime rates;52–55 perceive their neighborhoods
as less safe;56–60 and report physical and social disorder in their neighborhoods, such as broken
windows, litter, graffiti, loitering and public drinking.61–65 These environmental variables may be
why, in some cases, a higher proportion of lower-income and racial and ethnic minority children
tend to be less active than their peers.
Details on Key Research Results
Racial and ethnic minority and lower-income children are more likely
to be overweight or obese.
n the evidence on racial, ethnic, and socioeconomic differences in physical activity rates
vary. For instance, while some self-report studies show that African-American and Mexican-
American youth are less active than White youth, other, objective data indicate that they are more
likely to meet activity recommendations than their White peers.66–68 What is clear however is that
high obesity rates and low physical activity rates are problems for children of all backgrounds69, 70
but that, overall, lower-income and racial and ethnic minority youth are more likely to be
overweight or obese.71– 73
details
Although childhood obesity rates have increased among children of all backgrounds, lower-
income and racial and ethnic minority children continue to have the highest rates.74,75 More than
23 percent of lower-income adolescents ages 12 to 17 are obese, compared with roughly
14 percent of those from higher-income families.76 Mexican-American children ages 6 to 11,
African-American adolescents ages 12 to 19, and American-Indian youth ages 12 to 19 have
higher obesity rates than their White peers.77 Thirty percent of American Indian and Alaska
Native teens ages 12 to 19 are obese, the highest rate of any ethnic age group.78
Children’s and adolescents’ physical activity also varies by race, ethnicity and socioeconomic
status, but it is not clear that these differences indicate systematic disparities. Self-reports reveal
that African-American, Hispanic and lower-income children ages 9 to 13 get less leisure-time

Active Living Research | RESEARCh SynthESiS | November 2011 page 4
A national program of the Robert Wood Johnson Foundation, with direction and technical assistance provided by San Diego State University. activelivingresearch.org
physical activity (e.g. play, recreational sports) than do White or higher-income children of the
same age.79 However, objective data indicate that African-American and Mexican-American
children ages 6 to 19 were more likely to meet recommended physical activity levels (at least
60 minutes of activity per day, 5 days per week) than were White children. The same data show
no disparities based on socioeconomic status.80, 81
These objective data for African-American children are surprising, and run counter to most self-
reports showing that African-American youth are less active. This discrepancy may be because
self reports tend to capture only recreational physical activity,82 whereas objective measures (e.g.
accelerometers) generally capture all types of physical activity. Past research suggests that self-
reports may not thoroughly capture the kinds of activity in which racial or ethnic minority people
engage, thus underestimating their activity levels.83 It also is possible that African Americans have
begun to be more active than Whites, in response to the increased national focus on preventing
obesity in high-risk populations.84
Finally, although African-American children ages 6 to 19 are more likely to meet activity
recommendations than their peers85 this activity level may not last until adulthood. Based on
cross-sectional data, these children also have the largest decline in activity as adults.86
The evidence also varies regarding disparities in the physical activity rates of children in different
socioeconomic groups. One review finds some evidence that higher-income adolescents are
more physically active than lower-income ones, but the findings are inconsistent: 42 percent of
the reviewed studies find no association or show an opposite relationship.87 Other studies provide
evidence that lower-income and racial and ethnic minority youth walk more than higher-income or
White youth, respectively. A national study of more than 14,000 children shows that Hispanics
and African Americans were the most likely to walk or bike to school—27.7 percent and 15.5
percent did so, respectively, compared with just 9.4 percent of Whites. Additionally, lower-income
children were twice as likely to walk to school as their higher-income peers, perhaps because
children whose families cannot afford cars rely more on public transit and walking.88 Lower-
income neighborhoods also tend to be more densely populated than higher-income ones, so
children may live closer to school and thus be more likely to walk or bicycle.
Communities with predominantly racial and ethnic minority and lower-income
residents lack features that support walking.
n Adults who live in walkable neighborhoods—those that are densely populated and have
mixed land use and well-connected streets—tend to be more physically active than those
who don’t.89, 90 There is less evidence of such an association among young people.91, 92 Urban
neighborhoods are more likely to be walkable, and tend to have more African-American, Hispanic
and lower-income residents.93–95 But the urban communities with more racial and ethnic minority
and lower-income residents generally lack specific features that support walking, such as clean
and well-maintained sidewalks, trees and nice scenery.96–102 Such deficits may undermine the
generally favorable effects of walkable neighborhood design.
Active Living Research | RESEARCh SynthESiS | November 2011 page 5
A national program of the Robert Wood Johnson Foundation, with direction and technical assistance provided by San Diego State University. activelivingresearch.org
details
People living in walkable neighborhoods are more active than those who live in less walkable,
suburban areas.103–105 However, walkability may not have as much influence on lower-income,
African-American or Hispanic populations as it does on higher-income or White ones.106 For
example, survey data on more than 10,000 adults in Atlanta show that neighborhood design did
not have as strong an association with the walking behavior of black men as it did with that of
White men.107 Data on over 3,000 Atlanta youth indicate that urban design factors (i.e. land use
mix, street connectivity and population density) were more strongly related to walking behavior
among White and higher-income youth, and less related to walking among non-Whites and
lower-income youth.108 However, another national study shows that children and teens were more
likely to walk and bike to school in areas with higher population density, regardless of their race,
ethnicity or socioeconomic status.109 Overall, the data attempting to connect urban design to
activity among youth are inconsistent.
Lower-income, African-American and Hispanic populations tend to live in areas that are fairly
walkable,110 so the lack of a strong connection between urban design and their walking behavior
is initially surprising. To more accurately identify the environmental factors related to physical activity
among lower-income people and racial and ethnic minorities, it is important to look beyond overall
neighborhood design and consider the role of street-level features and aesthetic amenities of the
neighborhood environment that make walking easier, safer and more appealing. Such factors
include sidewalk availability, cleanliness and quality; the presence of street trees and other appealing
scenery; and local historical, cultural, or architectural landmarks. For instance studies indicate
that the presence and quality of sidewalks are significantly related to higher physical activity levels
among youth.111 A survey of roughly 1,100 adolescents in Portugal shows a significant positive
relationship between how active they were and their neighborhood aesthetics.112
In general there are fewer of the street-level features described above, and they are of poorer
quality, in lower-income and some racial and ethnic minority neighborhoods. For example, a
nationally representative study of nearly 3,000 women finds that 81 percent of American Indian-
Alaskan Native women and 54 percent of African-American women reported a lack of
neighborhood sidewalks, compared with 47 percent of White women.113

Active Living Research | RESEARCh SynthESiS | November 2011 page 6
A national program of the Robert Wood Johnson Foundation, with direction and technical assistance provided by San Diego State University. activelivingresearch.org
F I g U r e 1. American-Indian and African-American Women are
More Likely than White Women to Report not having sidewalks
in their neighborhoods 114
American-Indian African-American White
81%
54%47%
Per
cent
rep
ortin
g la
ck o
f si
dew
alks
0
20
40
60
80
100
gIS data for more than 2,000 census tracts and observations of 76 commercial block faces in
New York City show that lower-income neighborhoods were significantly less likely to have street
trees and clean streets than were more affluent ones.115 Observations of 73 predominantly poor
and Hispanic neighborhoods near elementary schools in Austin, Texas find that although they had
well-connected streets and sidewalks, those sidewalks were generally poorly maintained.116 There
is also some evidence of a connection between the lack of supportive street-level features and
lower physical activity rates among some racial and ethnic minority groups. For example, a study
of almost 1,800 adults in North Carolina shows that American Indian respondents were
significantly less likely to report either having sidewalks and streetlights, or engaging in any activity,
than were Whites.117
Finally, neighborhood aesthetics such as appealing scenery and decorative architecture may also
be important correlates of physical activity among lower-income and racial and ethnic minority
populations. However some research indicates that these populations are less likely to live in
areas with such features.118, 119 A survey of over 1,800 U.S. adults indicates that enjoyable scenery
was the factor most strongly associated with physical activity among lower-income respondents,
yet they were nearly 16 percent less likely than higher-income respondents to report having
attractive scenery in their neighborhoods.120 A study in New York City finds that lower-income
neighborhoods were less likely to have buildings designated as historical, cultural, or architectural
landmarks.121 Observations in Birmingham, Ala., Houston, and Los Angeles reveal that African-
American and Latino neighborhoods were less likely to have well-maintained yards than White
neighborhoods,122 contributing to poor aesthetic quality.
Active Living Research | RESEARCh SynthESiS | November 2011 page 7
A national program of the Robert Wood Johnson Foundation, with direction and technical assistance provided by San Diego State University. activelivingresearch.org
Lower-income groups and racial and ethnic minorities have limited access to
well-maintained or safe parks.
n the presence of parks, open space and other recreational facilities is consistently linked
with higher physical activity levels among children and adolescents.123–125 However, many
studies show that lower-income groups and racial and ethnic minorities have limited access to
well-maintained or safe parks126–132 and recreational facilities.133–135 The low leisure-time physical
activity rates and high risk of obesity among racial or ethnic minority children, and those living
in lower-income areas, can be partially explained by their generally poor access to parks and
private recreation facilities.136, 137 There is, however, very little evidence of a relationship between
playgrounds and activity among youth,138 or of racial, ethnic, or socioeconomic disparities in
access to safe playgrounds.139
details
research consistently shows that children and adolescents are more active when they have
access to and live near parks, open space and other spaces for recreation.140, 141 For example, one
study finds that adolescent girls who live closer to specific park amenities such as walking paths,
running tracks, playgrounds and streetlights are more likely to get moderate to vigorous physical
activity than those who do not.142
However, lower-income and mostly racial and ethnic minority neighborhoods tend to have fewer
parks and other physical activity resources, and less green space. A two-year assessment of
more than 200 communities across the nation indicates that those with higher poverty rates and
those that were predominantly African-American were significantly less likely to have parks and
green spaces.143 A number of smaller studies demonstrate racial, ethnic and income disparities in
allocation of park funding144 and in park proximity or access,145, 146 quality and safety,147, 148 and
quantity and size.149, 150, 151 For example, case studies of eight parks and surveys of 324 children
ages 7 to 14 in Los Angeles indicate that the inner city had significantly less park space per capita
than more affluent suburban neighborhoods. Inner city park facilities were also less clean and
well maintained.152
economic and racial disparities also exist for other types of recreational facilities, including both
public and private ones. A national sample of more than 20,000 adolescents and nearly 43,000
census-block groups shows that public, private, indoor and outdoor recreational facilities were
all less common in lower-income or African-American neighborhoods than in higher-income or
White ones.153 This study also finds that adolescents in mostly lower-income and racial and ethnic
minority areas were half as likely as those in mostly White and more affluent areas to live close
to at least one public or private recreational facility.154 evidence from another national study155
focusing on commercial facilities such as physical fitness facilities, membership sports and
recreational clubs, dance facilities and public golf courses in more than 28,000 zip codes finds
that neighborhoods with a higher proportion of African Americans, Hispanics or other racial
minorities had significantly fewer such facilities. Further, the study shows that moving from a
neighborhood of nearly all African Americans to a nearly all-White neighborhood would increase
the likelihood of being near at least one private facility or public golf course by almost five times.
Active Living Research | RESEARCh SynthESiS | November 2011 page 8
A national program of the Robert Wood Johnson Foundation, with direction and technical assistance provided by San Diego State University. activelivingresearch.org
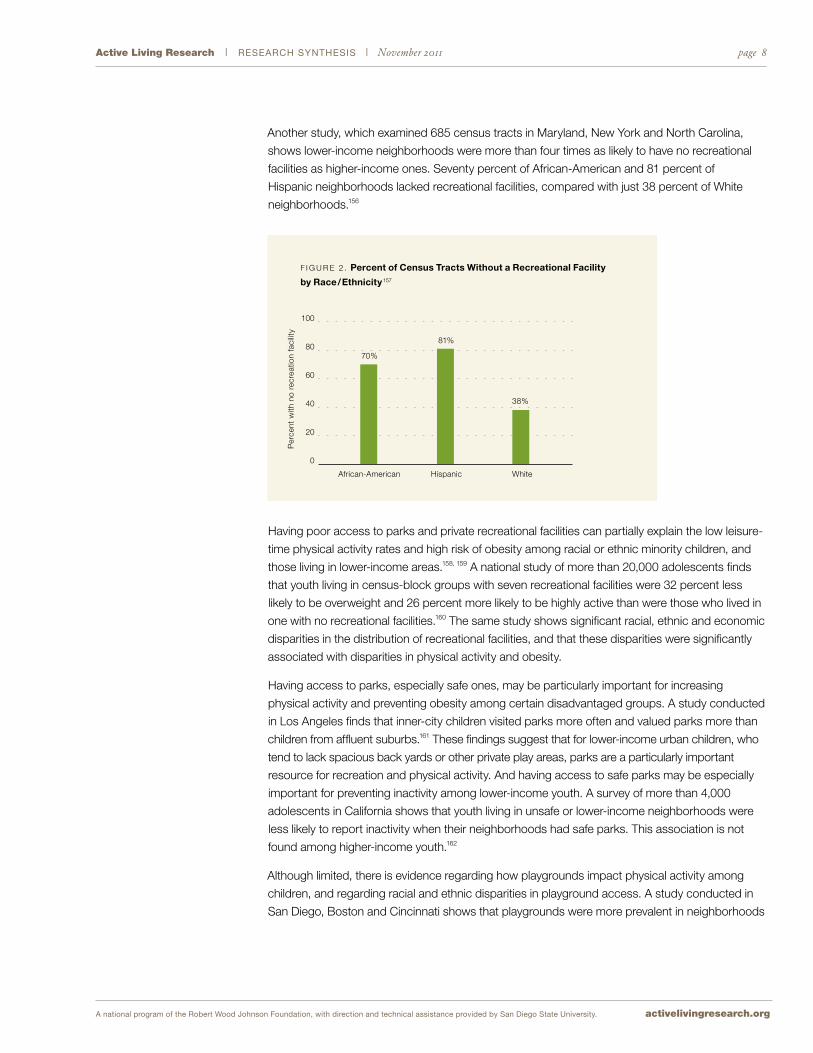
Another study, which examined 685 census tracts in Maryland, New York and North Carolina,
shows lower-income neighborhoods were more than four times as likely to have no recreational
facilities as higher-income ones. Seventy percent of African-American and 81 percent of
Hispanic neighborhoods lacked recreational facilities, compared with just 38 percent of White
neighborhoods.156
0
20
40
60
80
100
F I g U r e 2 . Percent of Census tracts Without a Recreational Facility
by Race / Ethnicity 157
African-American Hispanic White
70%
81%
38%
Per
cent
with
no
recr
eatio
n fa
cilit
y
Having poor access to parks and private recreational facilities can partially explain the low leisure-
time physical activity rates and high risk of obesity among racial or ethnic minority children, and
those living in lower-income areas.158, 159 A national study of more than 20,000 adolescents finds
that youth living in census-block groups with seven recreational facilities were 32 percent less
likely to be overweight and 26 percent more likely to be highly active than were those who lived in
one with no recreational facilities.160 The same study shows significant racial, ethnic and economic
disparities in the distribution of recreational facilities, and that these disparities were significantly
associated with disparities in physical activity and obesity.
Having access to parks, especially safe ones, may be particularly important for increasing
physical activity and preventing obesity among certain disadvantaged groups. A study conducted
in Los Angeles finds that inner-city children visited parks more often and valued parks more than
children from affluent suburbs.161 These findings suggest that for lower-income urban children, who
tend to lack spacious back yards or other private play areas, parks are a particularly important
resource for recreation and physical activity. And having access to safe parks may be especially
important for preventing inactivity among lower-income youth. A survey of more than 4,000
adolescents in California shows that youth living in unsafe or lower-income neighborhoods were
less likely to report inactivity when their neighborhoods had safe parks. This association is not
found among higher-income youth.162
Although limited, there is evidence regarding how playgrounds impact physical activity among
children, and regarding racial and ethnic disparities in playground access. A study conducted in
San Diego, Boston and Cincinnati shows that playgrounds were more prevalent in neighborhoods
Active Living Research | RESEARCh SynthESiS | November 2011 page 9
A national program of the Robert Wood Johnson Foundation, with direction and technical assistance provided by San Diego State University. activelivingresearch.org
that were more supportive of youth physical activity in other ways—walkable neighborhoods were
more likely to have at least five playgrounds than were less walkable ones.163 Also, observations
of African-American children in grades 2 to 8 in New Orleans find that when new playgrounds
were opened and properly supervised, 84 percent of children increased their physical activity
and reduced time spent watching television or playing video games.164 Unfortunately, some lower-
income and racial and ethnic minority communities may be less likely to have playgrounds in
which children are safe from injury. For instance, objective ratings of equipment and supervision
quality at 154 Boston playgrounds indicate that those in areas with more lower-income or
African-American residents were less safe.165
Lower-income groups and racial and ethnic minorities are more likely to live in
areas with higher crime rates and more physical and social disorder.
n Crime, perceptions of safety, neighborhood disorder, traffic and other aspects of
the social environment are associated with less physical activity among children and
adolescents.166, 167 Many studies find that people with lower incomes, and racial and ethnic
minorities, are more likely to live in areas with high crime rates;168–171 perceive their neighborhoods
as less safe;172–176 and report physical and social disorder in their neighborhoods, such as
broken windows, litter, graffiti, loitering and public drinking.177–181 This may be why lower-income
and racial and ethnic minority children tend to be less active than their peers.
details
Having safe places to be active may be particularly important for lower-income and racial and
ethnic minority populations. For example, self-reports from more than 2,000 adolescents in
California find that youth living in unsafe neighborhoods and lower-income youth were more likely
to be active if they had access to a safe park. The same finding does not hold among youth in
safe neighborhoods or those who were more affluent.182 A review of ten studies finds that being
safe from crime could be particularly helpful in supporting activity among African Americans.183
Although the review only considers studies on adults, the findings could have implications for
youth because of the influence adults have on children’s and adolescents’ physical activity.
Neighborhood physical disorder, such as broken windows, litter and graffiti, and social disorder,
such as loitering and public drinking, can make it uncomfortable for people to be physically active
outdoors.184–186 Several studies indicate that such neighborhood disorder is related to activity among
children and adolescents.187–190 For example, a study of roughly 1,300 Chicago-area youths ages
11 to 16 found that those in neighborhoods with more social disorder were less physically active.191
Traffic conditions also can impact children’s walking and biking behavior. One review concludes
that dangerous traffic and intersections were associated with less physical activity among
children.192 For example, a study of 912 Australian elementary school students found that the
presence of an objectively measured busy road barrier (e.g. highway, freeway, or arterial road)
between home and school was related to lower rates of walking or biking to school.193
Lower-income people and racial and ethnic minorities tend to live in areas with higher crime
rates194–197 and to perceive more crime in their neighborhoods.198–203 They also are more likely to
face physical and/or social disorder such as trash, graffiti, unattended dogs, abandoned buildings,
loitering and public drinking,204– 207 and are more exposed to traffic dangers and nuisances, than

Active Living Research | RESEARCh SynthESiS | November 2011 page 10
A national program of the Robert Wood Johnson Foundation, with direction and technical assistance provided by San Diego State University. activelivingresearch.org
are other people.208– 211 For example, objective national data show that African-American and Latino
adolescents are more likely to live in high-crime areas than are White teens. This study also finds
that neighborhoods with more serious crime generally had residents who were less active overall.212
In particular, loose dogs, which can pose a danger to walkers, cyclists and joggers, are a more
common complaint in lower-income or racial and ethnic minority neighborhoods. One study of
nearly 1,200 South Carolina residents finds that lower-income respondents were significantly
more likely than higher-income ones to report that unattended dogs are a big problem for walking
and outdoor activity (39% as compared to 28%).213
More research is needed regarding the association between youth physical activity and crime
and perceptions of safety, as studies so far have been inconsistent.214– 218 Although some studies
indicate that crime and perceptions of safety are related to lower physical activity levels, much of
the research is inconclusive or shows no relationship.
Conclusion Neighborhoods that are densely populated and have mixed land use and well-connected
streets, known as walkable neighborhoods, generally support physical activity. Many such
neighborhoods are home to mostly racial or ethnic minority, or lower-income, people. However,
racial and ethnic minority and lower-income youth have higher rates of obesity and related
health problems, and by some measures get less recreational physical activity, than their
peers. In light of this seeming paradox, it is important to consider that neighborhoods fitting
the definition of walkability may have other features that can discourage activity, especially
among certain populations. For instance, racial and ethnic minority and lower-income people:
n are more likely to live in neighborhoods with fewer and lower-quality sidewalks, and fewer
aesthetic amenities like scenery that make walking safer, easier and more appealing;
n tend to live in neighborhoods with fewer parks and other recreation resources; and
n experience more danger from crime and traffic than others do, and face more barriers
from neighborhood physical and social disorder.
So while walkable neighborhoods do tend to support physical activity, not all such
neighborhoods are equally supportive. And although lower-income and racial and ethnic
minority children are more likely to live in areas that are considered walkable, their neighbor-
hoods are also more likely to have some of the features that we know discourage activity.
We do not yet know for certain if these youths are less active and more likely to be obese
because they live in areas with fewer and poorer sidewalks, fewer parks and open spaces,
and more crime and traffic. But an abundance of research makes it seem likely. In light of this
growing evidence, policymakers should pursue strategies that improve walkability; access to
parks, green space and recreational facilities; and neighborhood safety, and researchers
should examine the precise impact such strategies have.

Active Living Research | RESEARCh SynthESiS | November 2011 page 11
A national program of the Robert Wood Johnson Foundation, with direction and technical assistance provided by San Diego State University. activelivingresearch.org
Areas Where Additional Research is Neededn The majority of the research examining the relationship between the built environment and
physical activity is cross-sectional. There is a need for research using more rigorous
methodological approaches to better determine the influence of environmental factors on
physical activity.
n There may be specific challenges related to increasing physical activity among racial and
ethnic minority and lower-income populations at high risk for obesity, and they may require unique
environmental and policy changes. research is needed to determine whether, how and to what
extent environmental and policy changes work in disadvantaged neighborhoods in particular,
alone or in combination with other interventions.
n Much of the research examining the built environment, physical activity and obesity focuses
on adults. More studies are needed to investigate how neighborhood environments, including
access to recreational facilities, relate to physical activity and obesity among children and youth,
especially those in high-risk groups.
n Additional research should explore the relative importance of crime, traffic safety, physical
disorder and aesthetics, and how these factors might interact in shaping physical activity among
youth in disadvantaged communities.
n Considering the environmental challenges faced by disadvantaged populations, additional
research is needed to test the applicability and reliability of existing measures of the built
environment for these populations, and develop more appropriate measures as needed.
n A better understanding of the disparities in the placement, availability and management of
public parks and playgrounds will be critical to addressing those disparities.
n The majority of available research on physical activity and obesity is on African-American and
Latino groups. More data are needed for other high-risk populations, including American Indians/
Alaska Natives and some Asian Pacific Islander groups.
n racial, ethnic and socioeconomic disparities in environmental supports for physical activity
are less understood in rural communities. More studies should focus on rural environments
and populations.
n evidence on the association between crime and disorder (both actual and perceived) and
youth physical activity is inconsistent. given that racial and ethnic minority and lower-income
communities report more crime and disorder, more research, using more comprehensive models
and improved measures, is needed on social environmental variables in children and adolescent
physical activity.
n Findings from research on physical activity using objectives measures are sometimes
inconsistent with findings from studies based on self-reports. research is needed to examine the
reasons for this discordance.
Active Living Research | RESEARCh SynthESiS | November 2011 page 12
A national program of the Robert Wood Johnson Foundation, with direction and technical assistance provided by San Diego State University. activelivingresearch.org
Policy ImplicationsAs policymakers prioritize efforts to help support physical activity among people in lower-income
communities and communities of color, they should also engage people from the community in
their planning and decision making. Based on these overarching assumptions, policymakers should:
n Increase opportunities for children and families to be physically active by expanding and
maintaining safe parks, protecting open spaces and implementing safe routes to school.
n Prioritize lower-income communities and communities of color when maintaining and creating
new neighborhood parks and pocket parks, open spaces and other destinations for recreational
physical activity.
n Improve sidewalk availability and quality to enhance the walkability of urban and other
neighborhoods.
n Collaborate with public health, law enforcement, planners, and civic groups to develop
strategies that can simultaneously improve neighborhood safety, reduce problems with social
and physical disorder, and encourage physical activity.
n Increase policing in high-crime areas, pedestrian walkways and parks, and implement
alternative policing strategies, such as neighborhood watch groups.
n Develop joint-use agreements that allow community members to use school-owned
recreational facilities. In turn, communities can offer facilities to schools, such as swimming pools.
Additional Resources and ReferencesAmerican Academy of Pediatricians Committee on environmental Health Policy Statement: www.aappolicy.aappublications.org/cgi/content/full/pediatrics;123/6/1591
environmental Justice resource Center at Clark Atlanta University: http://aappolicy.aappublications.org/cgi/reprint/pediatrics;123/6/1591.pdf
Institute of Medicine: Built environment and Physical Activity Special report: www.iom.edu/Reports/2005/Does-the-Built-Environment-Influence-Physical-Activity-Examining-the-Evidence----Special-Report-282.aspx
Let’s Move Campaign: www.letsmove.gov/
National Collaborative on Childhood Obesity research Measures registry: www.nccor.org/measures
NIH Office of Minority Health: http://minorityhealth.hhs.gov
NIH National Institute on Minority Health and Health Disparities: www.nimhd.nih.gov
PolicyLink: www.policylink.org
Trust for Public Land: Park equity and Public Health Toolkit: www.tpl.org/tier2_kad.cfm?folder_id=3548
United States National Physical Activity Plan: http://actrees.org/site/resources/research/trust_for_public_land_launches_park_equity_an.php

Active Living Research | RESEARCh SynthESiS | November 2011 page 13
A national program of the Robert Wood Johnson Foundation, with direction and technical assistance provided by San Diego State University. activelivingresearch.org
Endnotes 1 Ogden CL, Carroll MD, Curtin Lr, Lamb MM and Flegal KM.
“Prevalence of High Body Mass Index in US Children and Adolescents, 2007–2008.” Journal of the American Medical Association, 303(3): 242–249, 2010.
2 Ogden CL, Flegal KM, Carroll MD and Johnson CL. “Prevalence and Trends in Overweight Among US Children and Adolescents, 1999–2000.” Journal of the American Medical Association, 288(14): 1728–1732, 2002.
3 Ogden CL et al., 242–249.
4 Statistical Abstract of the United States: 2006. U.S. Census Bureau, 2005. www.census.gov/prod/2005pubs/06statab/pop.pdf (accessed May 2009) (No authors given.)
5 Budd gM and Hayman LL. “Addressing the Childhood Obesity Crisis: a Call to Action.” MCN American Journal of Maternal and Child Nursing, 33: 111–118, quiz 9–20, 2008.
6 Basch Ce. “Healthier Students Are Better Learners: A Missing Link in efforts to Close the Achievement gap.” Equity Matters: Research Review No. 6. New York: The Campaign for educational equity, 2010. Available online: www.equitycampaign.org/i/a/document/12557_EquityMattersVol6_Web03082010.pdf (accessed May 2009).
7 Taras H. “Physical Activity and Student Performance at School.” Journal of School Health, 75(6): 214–218, 2005.
8 gibson CA, Smith BK, Dubose KD, et al. “Physical Activity Across the Curriculum: Year One Process evaluation results.” International Journal of Behavioral Nutrition and Physical Activity, 5: 36, 2008.
9 Mahar MT, Murphy SK, rowe DA, et al. “effects of a Classroom-Based Program on Physical Activity and On-Task Behavior.” Medicine and Science in Sports and Exercise, 38(12): 2086–2094, December 2006.
10 Sibley BA, Ward rM, Yazvac TS, et al. “Making the grade with Diet and exercise.” AASA Journal of Scholarship and Practice, 5(2): 38–45, 2008.
11 Selected Health Risk Behaviors and Health Outcomes by Race / Ethnicity —National YRBS: 2009. Centers for Disease Control, 2009, http://www.cdc.gov/HealthyYouth/yrbs/pdf/us_disparityrace_yrbs.pdf (accessed December 2009).
12 Whitt-glover MC, Taylor WC, Floyd MF, et al. “Disparities in Physical Activity and Sedentary Behaviors among US Children and Adolescents: Prevalence, Correlates, and Intervention Implications.” Journal of Public Health Policy, 30(Sup): S309–S334, 2009.
13 Troiano rP, Berrigan D, Dodd KW, et al. “Physical Activity in the United States Measured by Accelerometer.” Medicine and Science in Sports and Exercise, 40(1): 181–188, 2008.
14 Barlow S and the expert Committee. “expert Committee recommendations on the Assessment, Prevention, and Treatment of Child and Adolescent Overweight and Obesity: Summary report.” Pediatrics, 120, S254–S288, 2007.
15 Preventing Childhood Obesity: Health in the Balance. Institute of Medicine report, 2005, http://books.nap.edu/openbook.php?record_id=11015 (accessed December 2009).
16 Ogden CL et al., 242–249.
17 Centers for Disease Control. “Prevalence among Low-Income, Preschool-Aged Children—United States, 1998–2008.” Morbidity and Mortality Weekly Report, 58(28): 769–773, 2009.
18 Miech rA, Kumanyika SL, Stettler N, et al. “Trends in the Association of Poverty with Overweight among US Adolescents, 1971–2004.” Journal of the American Medical Association, 295: 2385–2393, 2006.
19 Saelens Be and Handy S. “Built environment Correlates of Walking: A review.” Medicine and Science in Sports and Exercise, (40): 550–566, 2008.
20 Heath gW, Brownson rC, Kruger J, Miles r, Powell Ke, ramsey LT and the Task Force on Community Preventive Services. “The effectiveness of Urban Design and Land Use and Transport Policies and Practices to Increase Physical Activity: A Systematic review.” Journal of Physical Activity and Health, 3:S55–S76, 2006.
21 Salmon J and Timperio A. “Prevalence, Trends and environmental Influences on Child and Youth Physical Activity.” Medicine and Sports Science, 50:183–199, 2007.
22 Davison KK and Lawson C. “Do Attributes of the Physical environment Influence Children’s Level of Physical Activity?” International Journal of Behavioral Nutrition and Physical Activity, 3: 1–17, 2006.
23 Cutts BB, Darby KJ, Boone Cg, et al. “City Structure, Obesity, and environmental Justice: An Integrated Analysis of Physical and Social Barriers to Walkable Streets and Park Access.” Social Science & Medicine, 69(9): 1314–1322, 2009.
24 Lovasi gS, Hutson MA, guerra M, Neckerman KM. “Built environments and Obesity in Disadvantaged Populations.” Epidemiologic Review, 31: 7–20, 2009.
25 ewing r, Brownson rC, Berrigan D. “relationship Between Urban Sprawl and Weight of United States Youth.” American Journal of Preventive Medicine, 31(6): 464–474, 2006.
26 King AC, Castro C, eyler AA, et al. “Personal and environmental Factors Associated with Physical Inactivity among Different racial-ethnic groups of US Middle-Aged and Older-Aged Women.” Health Psychology, 19(4): 354–364, 2000.
27 Heath gW et al., S55–S76.
28 Davison KK and Lawson C, 1–17.
29 Neckerman KM, Lovasi gS, Davies S, et al. ”Disparities in Urban Neighborhood Conditions: evidence from gIS Measures and Field Observation in New York City.” Journal of Public Health Policy, 30(S1): S264–S285, 2009.
30 Owen N, Humpel N, Leslie e, et al. “Understanding environmental Influences on Walking: review and research Agenda.” American Journal of Preventive Medicine, 27(1), 2004, http://ipenproject.org/pdf_file/owenwalkreview.pdf (accessed December 2009).
31 Humpel N, Owen N, Leslie e. “environmental Factors Associated with Adults’ Participation in Physical Activity: A review.” American Journal of Preventive Medicine, 22(3): 188–199, 2002.
32 Brownson rC, Baker eA, Housemann rA, et al. “environmental and Policy Determinants of Physical Activity in the United States.” American Journal of Public Health, 91(12): 1995–2003, 2001.

Active Living Research | RESEARCh SynthESiS | November 2011 page 14
A national program of the Robert Wood Johnson Foundation, with direction and technical assistance provided by San Diego State University. activelivingresearch.org
33 Active Living research. Parks, Playgrounds, and Active Living Research Synthesis, February 2010. www.activelivingresearch.org/files/Synthesis_Mowen_Feb2010.pdf (accessed December 2009).
34 Kaczynski A and Henderson K. “environmental Correlates of Physical Activity: A review of evidence About Parks and recreation.” Leisure Sciences, 29(4): 315–354, 2007.
35 Davison KK and Lawson C, 1–17.
36 gordon-Larsen P, Nelson MC, Page P, Popkin BM. “Inequality in the Built environment Underlies Key Health Disparities in Physical Activity and Obesity.” Pediatrics, 117(2): 417–424, 2006.
37 Loukaitou-Sideris A and Stieglitz O. “Children in Los Angeles Parks: A Study of equity, Quality and Children’s Satisfaction with Neighborhood Parks.” Town Planning Review, 74(4): 467–488, 2002.
38 Active Living research. Parks, Playgrounds, and Active Living Research Synthesis.
39 Powell L, Slater S, Chaloupka F. “The relationship between Community Physical Activity Settings and race, ethnicity and Socioeconomic Status.” Evidence-Based Preventive Medicine, 1(2): 135–144, 2004.
40 Wolch J, Wilson JP, Fehrenbach J. Parks and Park Funding In Los Angeles: An Equity Mapping Analysis. University of Southern California, 2002, http://www.usc.edu/dept/geography/ESPE (accessed December 2009).
41 Loukaitou-Sideris A and Stieglitz O, 467–488.
42 Babey SH, Haster TA, Yu H, Brown r. “Physical Activity among Adolescents: When Do Parks Matter?” American Journal of Preventive Medicine, 34(4): 345–348, 2008.
43 Moore LV, Diez roux AV, evenson Kr, et al. “Availability of recreational resources in Minority and Low Socioeconomic Status Areas.” American Journal of Preventive Medicine, 34(1): 16–22, 2008.
44 gordon-Larsen P et al., 417–424.
45 Powell L et al., 135–144.
46 Babey SH, Hastert TA, Brown er. Teens Living In Disadvantaged Neighborhoods Lack Access to Parks and Get Less Physical Activity. UCLA Health Policy research Brief, March 2007 (accessed December 2009).
47 gordon-Larsen P et al., 417–424.
48 grow H, Saelens B, Kerr J, et al. “Where Are Youth Active? roles of Proximity, Active Transport, and Built environment.” Medicine & Science in Sports & Exercise, 40(12): 2017–2079, 2008.
49 Cradock AL, Kawachi I, Colditz gA, et al. “Playground Safety and Access in Boston Neighborhoods.” American Journal of Preventive Medicine, 28: 357–363, 2005.
50 Salmon J and Timperio A, 183–99.
51 Davison KK and Lawson C, 1–17.
52 gordon-Larsen P, McMurray rg, Popkin BM. “Determinants of Adolescent Physical Activity and Inactivity Patterns.” Pediatrics, 105:e83, 2000. DOI:10.1542/peds.105.6.e83, www.californiaafterschool.org/Pages/articles/Gordon-Larsen_Determinants_of_Adolescent_Physical_Activity_and_Inactivity_Patterns.pdf (accessed December 2009).
53 Neckerman KM et al., S264–S285.
54 Zhu X and Lee C. “Walkability and Safety Around elementary Schools: economic and ethnic Disparities.” American Journal of Preventive Medicine, 34(4): 282–290, 2008.
55 Cutts BB et al., 1314-1322.
56 Brownson rC et al., 1995–2003.
57 Weir LA, etelson D, Brand DA. “Parents’ Perceptions of Neighborhood Safety and Children’s Physical Activity.” Preventive Medicine, 43(3): 212–217, 2006.
58 Boslaugh Se, Luke DA, Brownson rC, et al. “Perceptions of Neighborhood environment for Physical Activity: Is It ‘Who You Are’ Or ‘Where You Live’ ”? Journal of Urban Health, 81(4): 671–81, 2004.
59 gielen AC, DeFrancesco S, Bishai D, et al. “Child Pedestrians: The role of Parental Beliefs and Practices in Promoting Safe Walking in Urban Neighborhoods.” Journal of Urban Health, 81(4): 545–55, 2004.
60 Wilcox S, Bopp M, Oberrecht L, et al. “Psychosocial and Perceived environmental Correlates of Physical Activity in rural and Older African American and White Women.” Journal of Gerontology B: Psychological Sciences and Social Sciences, 58(6): P329–P337, 2003.
61 Franzini L, Taylor W, elliot MN, et al. “Neighborhood Characteristics Favorable to Outdoor Physical Activity: Disparities by Socioeconomic and racial/ethnic Composition.” Health and Place, 16: 267–274, 2010.
62 Sampson rJ and raudenbush SW. “Seeing Disorder: Neighborhood Stigma and the Social Construction of ‘Broken Windows.’ ” Social Psychology Quarterly, 67: 319–342, 2004.
63 Wilson DK, Kirtland KA, Ainsworth Be, et al. “Socioeconomic Status and Perceptions of Access and Safety for Physical Activity.” Annals of Behavioral Medicine, 28(1): 20–28, 2004.
64 Balfour JL and Kaplan gA. “Neighborhood environment and Loss of Physical Function in Older Adults: evidence from the Alameda County Study.” American Journal of Epidemiology, 155(6): 507–515, 2002.
65 Brownson rC, Baker eA, Housemann rA, et al. “environmental and Policy Determinants of Physical Activity in the United States.” American Journal of Public Health, 91(12): 1995–2003, 2001.
66 Selected Health Risk Behaviors and Health Outcomes by Race/Ethnicity — National YRBS: 2009. Centers for Disease Control, 2009, www.cdc.gov/HealthyYouth/yrbs/pdf/us_disparityrace_yrbs.pdf (accessed December 2009).
67 Whitt-glover MC et al., S309–S334.
68 Troiano rP et al., 181–188.
69 Barlow S and the expert Committee, S254–S288.
70 Preventing Childhood Obesity: Health in the Balance. Institute of Medicine report, 2005, http://books.nap.edu/openbook.php?record_id=11015 (accessed December 2009).
71 Ogden CL et al., 242–249.
72 Centers for Disease Control, 769–773.
73 Miech rA et al., 2385–2393.
74 Ogden CL et al., 242–249.
75 Miech rA et al., 2385–2393.

Active Living Research | RESEARCh SynthESiS | November 2011 page 15
A national program of the Robert Wood Johnson Foundation, with direction and technical assistance provided by San Diego State University. activelivingresearch.org
76 Ibid.
77 Ogden CL et al., 242–249.
78 Indian Health Service reporting System. Unpublished FY 2007 data.
79 Selected Health Risk Behaviors and Health Outcomes by Race/Ethnicity — National YRBS: 2009.
80 Troiano rP et al., 181–188.
81 Whitt-glover MC et al., S309–S334.
82 Ibid.
83 Ainsworth Be, Irwin ML, Addy CL, et al. “Moderate Physical Activity Patterns of Minority Women: The Cross-Cultural Activity Participation Study.” Journal of Womens Health Gender Based Medicine, 8(6): 805–813, 1999.
84 Whitt-glover MC et al, S309–S334.
85 Ibid.
86 Summary Health Statistics for US Adults: 2007. Table 31. Centers for Disease Control, 2009, www.cdc.gov/nchs/data/series/sr)10/sr10_240.pdf (accessed December 2009).
87 Stalsberg r and Pedersen AV. “effects of Socioeconomic Status on the Physical Activity in Adolescents: A Systematic review of the evidence.” Scandinavian Journal of Medicine and Science in Sports, 20(3): 368–383, 2010.
88 McDonald NC. “Critical Factors for Active Transportation to School among Low-Income and Minority Students: evidence from the 2001 National Household Travel Survey.” American Journal of Preventive Medicine, 34(4): 341–344, 2008.
89 Saelens Be and Handy S, 550–566.
90 Heath gW et al., S55–S76.
91 Salmon J et al., 183-199.
92 Davison KK and Lawson C, 1–17.
93 Cutts BB et al., 1314–1322.
94 Lovasi gS et al., 7–20.
95 ewing r et al., 464–474.
96 King AC et al., 354–364.
97 Heath gW et al., S55–S76.
98 Davison KK and Lawson C, 1–17.
99 Neckerman KM et al., S264–S285.
100 Owen N et al., 2004.
101 Humpel N, Owen N, Leslie e. “environmental Factors Associated with Adults’ Participation in Physical Activity: A review.” American Journal of Preventive Medicine, 22(3): 188–199, 2002.
102 Brownson rC, Baker eA, Housemann rA, et al. “environmental and Policy Determinants of Physical Activity in the United States.” American Journal of Public Health, 91(12): 1995–2003, 2001.
103 Saelens Be and Handy S, 550–566.
104 Davison KK and Lawson C, 1–17.
105 Ferreira K, van der Horst W, Wendel-Vos S, et al. “environmental Correlates of Physical Activity In Youth: A review and Update.” Obesity Review, 8: 129–154, 2008.
106 Lovasi gS et al., 7–20.
107 Frank LD, Andresen MA, Schmid TL. “Obesity relationships with Community Design, Physical Activity, and Time Spent in Cars.” American Journal of Preventive Medicine, 27: 87–96, 2004.
108 Kerr J, Frank LD, Sallis JF, Saelens Be, et al. “Urban Form Correlates of Pedestrian Travel in Youth: Differences by gender, race-ethnicity and Household Attributes.” Transportation Research Part D: Transport and Environment, 12:177–182, 2007, doi: 10.1016/j.trd.2007.01.006.
109 McDonald NC, 341–344.
110 Lovasi gS et al., 7–20.
111 Davison KK and Lawson C, 1–17.
112 Mota J, Almeida M, Santos P, et al. “Perceived Neighborhood environments and Physical Activity In Adolescents.” Preventive Medicine, 41: 834–836, 2005.
113 King AC et al., 354–364.
114 Ibid.
115 Neckerman KM et al., S264–S285.
116 Zhu X and Lee C, 282–290.
117 Huston SL, evenson Kr, Bors P, et al. “Neighborhood environment, Access to Places for Activity, and Leisure-Time Physical Activity in a Diverse North Carolina Population.” American Journal of Health Promotion, 18(1): 58-69, 2003, www.activelivingresearch.org/alr/files/AJHP_9_Huston.pdf (accessed December 2009).
118 Brownson rC et al., 1995–2003.
119 Neckerman KM et al., S264–S285.
120 Brownson rC et al., 1995–2003.
121 Neckerman KM et al., S264–S285.
122 Franzini L et al., 267–274.
123 Active Living research. Parks, Playgrounds, and Active Living Research Synthesis.
124 Kaczynski A and Henderson K, 315–354.
125 Davison KK and Lawson C, 1–17.
126 gordon-Larsen P et al., 417–424.
127 Loukaitou-Sideris A and Stieglitz O, 467–488.
128 Active Living research. Parks, Playgrounds, and Active Living Research Synthesis.
129 Powell L et al., 135–144.
130 Wolch J et al., Parks and Park Funding In Los Angeles: An Equity Mapping Analysis.
131 Loukaitou-Sideris A and Stieglitz O, 467–488.
132 Babey SH et al., 345–348.

Active Living Research | RESEARCh SynthESiS | November 2011 page 16
A national program of the Robert Wood Johnson Foundation, with direction and technical assistance provided by San Diego State University. activelivingresearch.org
133 Moore LV, Diez roux AV, evenson Kr, et al. “Availability of recreational resources in Minority and Low Socioeconomic Status Areas.” American Journal of Preventive Medicine, 34(1): 16–22, 2008.
134 gordon-Larsen P et al., 417–424.
135 Powell L et al., 135–144.
136 Babey SH et al., March 2007.
137 gordon-Larsen P, et al., 417–424.
138 grow H et al., 2017–2079.
139 Cradock AL et al., 357–363.
140 Davison KK and Lawson C, 1–17.
141 Salmon J and Timperio A, 183–99.
142 Cohen DA, Ashwood JS, Scott MM, et al. “Public Parks and Physical Activity among Adolescent girls.” Pediatrics, 118: e1381–e1389, 2006, http://Pediatrics.aappublications.org/cgi/content/full/118/5/e138.
143 Powell L et al., 135–144.
144 Wolch J et al., Parks and Park Funding In Los Angeles: An Equity Mapping Analysis.
145 Loukaitou-Sideris A and Sideris A. “What Brings Children to the Park?” Journal of the American Planning Association, 76(1): 89–107, 2010.
146 Babey SH et al., March 2007.
147 Loukaitou-Sideris A and Stieglitz O, 467–488.
148 Loukaitou-Sideris A and Sideris A, 89–107.
149 Wolch J et al., Parks and Park Funding In Los Angeles: An Equity Mapping Analysis.
150 Loukaitou-Sideris A and Stieglitz O, 467–488.
151 Cutts BB et al., 1314–1322.
152 Loukaitou-Sideris A and Stieglitz O, 467–488.
153 gordon-Larsen P et al., 417–424.
154 Ibid.
155 Powell L et al., 135–144.
156 Moore LV et al., 16–22.
157 Ibid.
158 Babey SH et al., March 2007.
159 gordon-Larsen P et al., 417–424.
160 Ibid.
161 Loukaitou-Sideris A and Stieglitz O, 467–488.
162 Babey SH et al., 345–348.
163 grow H et al., 2017–2079.
164 Farley TA, Meriwether rA, Baker eT, et al. “Safe Play Spaces to Promote Physical Activity in Inner-City Children: results from a Pilot Study of an environmental Intervention.” American Journal of Public Health, 97: 1625–1631, 2007.
165 Cradock AL et al., 357–363.
166 Salmon J and Timperio A, 183–199.
167 Davison KK and Lawson C, 1–17.
168 gordon-Larsen P, McMurray rg, Popkin BM. “Determinants of Adolescent Physical Activity and Inactivity Patterns.” Pediatrics, 105: e83, 2000. DOI:10.1542/peds.105.6.e83, www.californiaafterschool.org/Pages/articles/Gordon-Larsen_Determinants_of_Adolescent_Physical_Activity_and_Inactivity_Patterns.pdf (accessed December 2009).
169 Neckerman KM et al., S264–S285.
170 Zhu X and Lee C, 282–290.
171 Cutts BB et al., 1314–1322.
172 Brownson rC et al., 1995–2003.
173 Weir LA et al., 212–217.
174 Boslaugh Se et al., 671–681.
175 gielen AC et al., 545–555.
176 Wilcox S et al., P329–P337.
177 Franzini L et al., 267–274.
178 Sampson rJ and raudenbush SW, 319–342.
179 Wilson DK et al., 20–28.
180 Balfour JL and Kaplan gA, 507–515.
181 Brownson rC et al., 1995–2003.
182 Babey SH et al., 345–348.
183 Casagrande SS, Whitt-glover MC, Lancaster KJ, Odoms-Young AM, gary TL. “Built environment and Health Behaviors among African Americans: A Systematic review.” American Journal of Preventive Medicine, 36(2): 174–181, 2009.
184 Miles r. “Neighborhood Disorder, Perceived Safety, and readiness to encourage Use of Local Playgrounds.” American Journal of Preventive Medicine, 34: 275–281, 2008.
185 Brownson rC et al., 1995–2003.
186 King AC et al., 354–364.
187 Molnar Be, gortmaker, SL, Bull FC, et al. “Unsafe to Play? Neighborhood Disorder and Lack of Safety Predict reduced Physical Activity among Urban Children and Adolescents.” American Journal of Health Promotion, 18(5): 378–386, 2004.
188 Franzini L et al., 267–274.
189 Miles r, 275–281.
190 Carver A, Salmon J, Campbell K, et al. “How Do Perceptions of Local Neighborhood relate to Adolescents’ Walking and Cycling?” American Journal of Health Promotion,20(2): 139–147, 2005.
191 Molnar Be et al., 378–386.
192 Davison KK and Lawson C, 1–17.

Active Living Research | RESEARCh SynthESiS | November 2011 page 17
A national program of the Robert Wood Johnson Foundation, with direction and technical assistance provided by San Diego State University. activelivingresearch.org
193 Timperio A, Ball K, roberts r, et al. “Personal, Family, Social, and environmental Correlates of Active Commuting to School.” American Journal of Preventive Medicince, 30(1): 45–51, 2006.
194 gordon-Larsen P, et al. “Determinants of Adolescent Physical Activity and Inactivity Patterns.”
195 Neckerman KM et al., S264–S285.
196 Zhu X and Lee C, 282–290.
197 Cutts BB et al., 1314–1322.
198 Brownson rC et al., 1995–2003.
199 Boslaugh Se et al., 671–681.
200 Wilcox S et al., P329–P337.
201 gielen AC et al., 545–555.
202 Weir LA et al., 212–217.
203 Loukaitou-Sideris A and Sideris A, 89–107.
204 Sampson rJ and raudenbush SW, 319–342.
205 Wilson DK et al., 20–28.
206 Balfour JL and Kaplan gA, 507–515.
207 Brownson rC et al., 1995–2003.
208 Report to The Nation On Child Pedestrian Safety, 2002. National Safe Kids Campaign. www.safekids-centralvalley.org/images/Report_Ped_ReporttoTheNation_Oct2002.pdf (accessed December 2009).
209 Corless J and Ohland g. Caught in the Crosswalk: Pedestrian Safety in California. Surface Transportation Policy report, 1999. www.transact.org/ca/caught99/default.htm (accessed December 2009).
210 Neckerman KM et al., S264–S285.
211 Zhu X and Lee C, 282–290.
212 gordon-Larsen P, et al., “Determinants of Adolescent Physical Activity and Inactivity Patterns.”
213 Wilson DK et al., 20–28.
214 Davison KK and Lawson C, 1–17.
215 Salmon J and Timperio A, 183–199.
216 Molnar Be et al., 378–386.
217 Weir LA et al., 212–217.
218 gomez Je, Johnson BA, Selva M, Sallis JF. “Violent Crime and Outdoor Physical Activity among Inner-City Youth.” Preventive Medicine, 39: 876–881, 2004, doi: 10.1016/j.ypmed.2004.03.019.
This synthesis was prepared by Wendell C. Taylor, Ph.D., M.P.H, associate professor at The University of Texas Health Science Center at Houston School of Public Health and Deborah Lou, Ph.D., Active Living research. Peer review was provided by Myron F. Floyd, Ph.D., North Carolina State University; Melicia C. Whitt-glover, Ph.D., gramercy research group; and gina S. Lovasi, Ph.D., M.P.H., Mailman School of Public Health at Columbia.
For updates and a Web-based version of this synthesis, visit www.activelivingresearch.org.
Active Living Research, a national program of the robert Wood Johnson Foundation, stimulates and supports research to identify environmental factors and policies that influence physical activity for children and families to inform effective childhood obesity prevention strategies, particularly in low-income and racial and ethnic communities at highest risk. Active Living research wants solid research to be part of the public debate about active living.
Active Living research San Diego State University 3900 Fifth Avenue, Suite 310 San Diego, CA 92103-3138 www.activelivingresearch.org

Active Living Research | RESEARCh SynthESiS | November 2011 page 18
A national program of the Robert Wood Johnson Foundation, with direction and technical assistance provided by San Diego State University. activelivingresearch.org
Table of StudiesThe following table provides a brief summary of the studies cited in this synthesis, including
sample characteristics, methods, and strengths and weaknesses.
TA B L e 1. studies Cited in this synthesis
sample study Characteristics Methods + strengths / – Weaknesses
Babey, et al., 2008 4,010 adolescents aged Self-reports + Large sample size representative of state;
12–17 in California sample diverse in race, ethnicity, and language
– relies on self-reported data; examined only parks and open spaces and did not include other recreational facilities that may be relevant to youth physical activity
Boslaugh, et al., 2004 1,073 African-American and Self-administered questionnaires + Examines both individual and neighborhood
White adults in St. Louis, Mo. and 2000 census for characteristics; includes racial composition
neighborhood-level data in analysis; sample included substantial
proportion of African-Americans and lower-
income persons
– reliance on self-reported data; convenience sample limits generalizability; environmental variables used limited to those available in census
Brownson et al., 2001 Nationally representative Cross-sectional analysis + Nationally representative sample; significant sample of 1,818 adults with of telephone survey data; proportion of low-income persons oversampling of low-income self-report individuals – reliance on self-reported telephone survey
data; some survey items not tested for reliability; no objective environmental data; study was cross-sectional
Cradock et al., 2005 154 playgrounds and 591 Cross-sectional analysis of + Survey developed with input from census block groups in Boston observed playground data and community stakeholders; assesses
gIS data playground safety and access city-wide;
direct observation
– Playground age not known; limitations to how playground safety was classified; study did not account for all playgrounds; other potential influences on children’s play and access to safe equipment were not assessed; distance calculation may not be entirely accurate

Active Living Research | RESEARCh SynthESiS | November 2011 page 19
A national program of the Robert Wood Johnson Foundation, with direction and technical assistance provided by San Diego State University. activelivingresearch.org
TA B L e 1. continued
sample study Characteristics Methods + strengths / – Weaknesses
Cutts et al., 2009 City-wide census block Case study assessing local park + Analyzes social factors on a macro-level groups in Phoenix, Ariz. access and walkability of census along with structural factors block groups using gIS method – Measures used as proxies are not able to
provide evidence of systemic differences in quality and safety of walkable neighborhoods; analysis does not fully consider aesthetics
Franzini et al., 2010 632 parents of fifth-grade Survey and neighborhood + Richness of data allowing for comparison children in Birmingham, Ala., observation data to analyze of several block-face characteristics; Houston, Texas, and associations between physical use of multilevel modeling; findings point to Los Angeles, Calif. environment and social processes levers for intervention
and neighborhood-level racial / ethnic and socioeconomic – Neighborhood observation limited to block- composition face on which child resided (therefore not
random); no data collected on physical activity–related resources outside of block-face; cultural and social norms not assessed
Gielen et al., 2004 732 parents of students from Self-administered surveys + Large and diverse sample; findings can four urban elementary schools inform parent education programs for
child safety
– Limited measurement items; low response rates; sample may not reflect school population
Gordon-Larsen et al., 20,745 adolescents in grades randomized telephone survey + Nationwide adolescent population analyses 2006 seven to 12 enrolled in Add with a follow-up mail survey; of relationship between socioeconomic Health, a longitudinal, nationally- cross-sectional, self-report data status, distribution of recreational facilities representative school-based and recommended physical activity; study, and 42,857 census examined association of physical activity block groups to overweight status
– Cross-sectional study, did not assess quality or facility type; did not assess actual use of facilities by youth
huston et al., 2003 1796 North Carolina adults Cross-sectional analysis of + Examines diverse set of environmental randomized household telephone variables; American Indians included in survey data; self-report analysis; assesses contribution of streets to
leisure physical activity
– Causality cannot be inferred; relied on self-reports; only assessed leisure-time physical activity; generalizability may be limited; data on income and neighborhood characteristics were limited; some groups may be underrepresented due to reliance on phone survey

Active Living Research | RESEARCh SynthESiS | November 2011 page 20
A national program of the Robert Wood Johnson Foundation, with direction and technical assistance provided by San Diego State University. activelivingresearch.org
King et al., 2000 Nationally representative Telephone interview data + Study was first effort to evaluate the sample of 2,912 U.S. women relationship between neighborhood
environments and physical activity levels
in a population-based sample
– Possible under sampling of some minority and low-income groups and oversampling of certain types of ethnic groups; interviews conducted in english only; limited ability to compare determinants of physical activity among groups who are intermittently active as opposed to regularly active; potential lack of validity of physical activity variables; number of environmental variables were limited
Loukaitou-sideris 348 parents and 897 middle- Survey and observation data + Large number of parks in sample; use of and sideris 2010 school students in Los Angeles multi-method approach and San Fernando Valley; 100 parks
Loukaitou-sideris eight parks in Los Angeles Quantitative data and spatial + Addresses local context and park design and stieglitz 2002 metropolitan area; 324 children analysis of parks and survey data in light of children’s different needs
– Findings may not be generalizable to other cities
Lovasi et al., 2009 Literature review of 45 peer- Descriptive comparison of key + Focuses on U.S. studies directly related to reviewed articles using three literature based upon study results lower-income individuals, African Americans, public health and transportation showing relationships between and Hispanics / Latinos; examines known databases (Transportation racial, ethnic, and socioeconomic or established environmental correlates research Information Services; disparities in the built and food of activity ISI Web of Knowledge; environments and obesity and U-M Medsearch) physical activity – Lack of agreement on methods for assessing
built environment characteristics and their consequences; omission of some resources; inconsistency in quality of environmental measurement
Molnar et al., 2004 Individual-level data on Observation and longitudinal + Multilevel design examined physical 1,378 youth ages 11 to 16 and survey data activity among adolescents living in different their caregivers in Chicago; neighborhood types; uses both perceived neighborhood-level data on and observed neighborhood data 8,782 residents; videotapes of 15,141 block-faces. – Outcome variable measured by recall; does
not assess perceived safety at school or effect of traffic on physical activity
TA B L e 1. continued
sample study Characteristics Methods + strengths / – Weaknesses

Active Living Research | RESEARCh SynthESiS | November 2011 page 21
A national program of the Robert Wood Johnson Foundation, with direction and technical assistance provided by San Diego State University. activelivingresearch.org
Moore, Diez-Roux Survey of recreational resources Analysis of densities of + Examined types and numbers of available 2008 from 685 census tracts in recreational resources per area resources in three diverse regions Maryland, North Carolina, estimated using kernel density and New York City method – Lack of data on resource quality; findings
may not be generalizable; data not collected on resources located in certain facilities
neckerman 2009 2,172 census tracts in gIS and field observations + Variety of objective measures plus detailed New York city field observation data; controlled for
neighborhood walkability
– Limited to one city; gIS data lacks validity and reliability info; field data limited in size and scope and lacks inter or intra-rater reliability; disparities considered by neighborhood poverty level only
Powell et al., 2007 409 communities drawn from Observational data on outdoor + Expands on existing research by using nationally representative physical activity-related settings nationally-based, objective data school-based, cross-sectional and census data samples of 8th, 10th, and – Data on usage levels of physical activity 12th-grade students from settings not collected; focuses on only one ImpactTeen study potential barrier to physical activity; sample may
not be nationally representative; aggregate nature of data has several limitations
Weir et al., 2006 307 lower-income and Cross-sectional analysis of + Study sheds light on possible factors middle class parents of children self-administered questionnaire limiting inner-city children’s physical activity aged 5–10 years old in New York data – Weather not factored into analysis; study
is cross-sectional; findings may not be representative; relies on parental reports from small sample
Wilcox et al., 2003 Convenience sample of 102 Cross-sectional analysis of + Contributed to evidence on rural African-American or White self-reported data on associations populations; demonstrated importance of women aged 50 years or older between individual, social, considering multilevel influences on behavior.
living in Fairfield County, S.C. and environmental factors and physical activity – Sample not representative; health status and
living arrangements not assessed; physical activity score used does not allow for quantifying leisure-time physical activity from various sources; physical environment was self-reported
TA B L e 1. continued
sample study Characteristics Methods + strengths / – Weaknesses

Active Living Research | RESEARCh SynthESiS | November 2011 page 22
A national program of the Robert Wood Johnson Foundation, with direction and technical assistance provided by San Diego State University. activelivingresearch.org
TA B L e 1. continued
sample study Characteristics Methods + strengths / – Weaknesses
Wilson et al., 2004 1,194 adults in a southeastern randomized phone survey; + Analysis included both perceived and US county (ages 18–96) cross-sectional analysis linked to objective measures of environmental gIS data on trails, sidewalks, supports for physical activity public recreation facilities, and violent crime incidents – Survey response rate was modest (54%);
generalizability may be limited do to sampling frame and weather effect; possible under-representation of certain groups (African-American, very poor, and rural residents) due to unlisted phone numbers; low reliability of some measures
Wolch et al., 2002 324 Los Angeles parks Census and municipal and + Used geospatial analysis to assess government data; data from distribution of parks and recreation funding applications for Prop. K funding and resources
Zhu & Lee 2008 73 elementary school areas Cross-sectional analysis of + New aspects of economic and ethnic in Austin, Texas gIS and field audit data disparities were explored in terms of
walkability and safety around public
elementary schools; findings offered
some insights into the design and policy
interventions that target walking-to-
school behaviors
– gIS data collected at different times and had different levels of accuracy; different units of analyses used for neighborhood- and street-level measures; potential difference between field audits and resident self-reports; walkability was inferred

Active Living Research | RESEARCh SynthESiS | November 2011 page 23
A national program of the Robert Wood Johnson Foundation, with direction and technical assistance provided by San Diego State University. activelivingresearch.org
TA B L e 2 . studies not Cited in this synthesis
sample study Characteristics Methods + strengths / – Weaknesses
Abercrombie LC, Sallis JF, 351 private recreation facilities gIS and census data + Objective measure of resource availability; Conway TL, et al. “Income and 465 public parks in 833 substantial number of block groups with and racial Disparities in block groups in Maryland diverse population; multiple sources to Access to Public Parks and identify private and public recreation facilities; Private recreation Facilities.” adjusted for potential confounding variables American Journal of Preventive Medicine, 34(1): – Inability to distinguish trails from parks; 9–14, 2008 possible incomplete inventory of private facilities; no data on facility quality or fees for
use; did not consider service area size
Joassart-Marcelli P. Parks and recreation Analysis of municipal, state, + First study to systematically analyze funding “Leveling the Playing Field? expenditures in Los Angeles federal, and nonprofit expenditure allocations for local parks and recreation Urban Disparities in Consolidated Metropolitan data on parks and recreation; facilities within a metropolitan area Funding for Local Parks and Statistical Area 2000 Census data recreation in the Los Angeles – Study does not assess link between park region.” Environment and spending and health outcomes and is limited Planning A, 42(5) 1174–1192, to one metro area
2010
estabrooks PA, Lee re, 32 census tracks in small Multivariate analyses performed + Comprehensive assessment of availability gyurcsik NC. “resources for Midwestern U.S. city on gIS data to determine whether and accessibility of physical activity resources Physical Activity Participation: resource availability and acces- in a representative Midwestern U.S. city Does Availability and sibility varied by neighborhood Accessibility Differ by SeS; univariate analyses used to – Did not examine whether differences Neighborhood Socio- determine whether number of pay- in resource availability and accessibility was economic Status?” Annals for-use and free-for-use facilities related to actual physical activity or whether of Behavioral Medicine, differed by neighborhood SeS these differences could possibly explain SeS 25(2):100–104, 2003 differences in physical activity; other secondary
resources related to physical activity (e.g. churches) not considered; census tracts may not reflect true neighborhood boundaries and thus may not be accurate indicator of distribution of resources.
Powell LM, Slater S, 28,050 zip code areas Census and gIS data + National study Chaloupka FJ, Harper D. throughout U.S. “Availability of Physical Activity-related Facilities and Neighborhood Demographic and Socioeconomic Characteristics: A National Study.” American Journal
of Public Health, 96(9): 1676–1680, 2006

Active Living Research | RESEARCh SynthESiS | November 2011 page 24
A national program of the Robert Wood Johnson Foundation, with direction and technical assistance provided by San Diego State University. activelivingresearch.org
TA B L e 2 . continued
sample study Characteristics Methods + strengths / – Weaknesses
romero AJ. “Low-income 74 low-income youth aged Questionnaires administered + Provides empirical evidence on perception Neighborhood Barriers and 10 to 16 years in mid-sized to youth during class and at local of quality, cost, and safety and its impact on resources for Adolescents’ southwestern U.S. city community centers afterschool youth physical activity in low-income settings Physical Activity.” Journal of
Adolescent Health, 36(3), – Small sample size; study is cross-sectional 253–259, 2005
Sister C, Wolch J, Wilson J. 1,674 park service areas Delineation of PSA’s by assigning + Methodology developed with input diverse “got green? Addressing (PSA’s) in Los Angeles every resident in region to his / her set of stakeholders; able to quantify the environmental Justice in Park metropolitan region closest park number of residents potentially served in Provision.” GeoJournal (75): every PSA, providing estimate of potential 229–248, 2010. Available congestion online: www.springerlink.com/
content/g1277273381828l7/ – PSA approach may not accurately assess level of park need