dnt-26a 02-106 nutrition and irrigation management of ramb…
TRANSCRIPT
Nutrition and Irrigation
Management of Rambutan
for Maximisation of Yield and Quality
A report for the Rural Industries Research and Development Corporation
by Chris Wicks
August 2002
RIRDC Publication No 02/106 RIRDC Project No DNT-26A

ii
© 2002 Rural Industries Research and Development Corporation. All rights reserved. ISBN 0642 58505 9 ISSN 1440-6845 Nutrition and Irrigation Management of Rambutan for Maximisation of Yield and Quality Publication No. 02/106 Project No. DNT-26A The views expressed and the conclusions reached in this publication are those of the author and not necessarily those of persons consulted. RIRDC shall not be responsible in any way whatsoever to any person who relies in whole or in part on the contents of this report. This publication is copyright. However, RIRDC encourages wide dissemination of its research, providing the Corporation is clearly acknowledged. For any other enquiries concerning reproduction, contact the Publications Manager on phone 02 6272 3186. Researcher Contact Details Chris Wicks Northern Territory Department of Business, Industry and Resource Development GPO Box 3000 DARWIN NT 0801 Phone: 08 89 992 309 Fax: 08 89 992 049 Email: [email protected]
In submitting this report, the researcher has agreed to RIRDC publishing this material in its edited form. RIRDC Contact Details Rural Industries Research and Development Corporation Level 1, AMA House 42 Macquarie Street BARTON ACT 2600 PO Box 4776 KINGSTON ACT 2604 Phone: 02 6272 4539 Fax: 02 6272 5877 Email: [email protected]. Website: http://www.rirdc.gov.au Published in August 2002 Printed on environmentally friendly paper by Canprint

iii
Foreword The aim of this project is to improve understanding of nutrient and irrigation management in rambutan, with particular emphasis on management through the fruit filling stage. This should lead to improved yield and fruit quality with more efficient use of fertiliser and irrigation inputs and hence increased profitability. A new critical range for rambutan soil and leaf nutrition has been developed, and rambutan growers have successfully taken up soil water monitoring principles and practice. Further work is urgently required on the influence of the environment on rambutan flowering and fruit retention under NT conditions. A final conclusion is that the promotion of discussion and discovery amongst the growers is an excellent method of developing new strategies and facilitating the uptake of new technologies. This project was funded from RIRDC Core Funds which are provided by the Federal Government. This report, a new addition to RIRDC’s diverse range of over 800 research publications, forms part of the New Plant Products R&D program, which aims to facilitate the development of new industries based on plants or plant products that have commercial potential for Australia. Most of our publications are available for viewing, downloading or purchasing online through our website: • downloads at www.rirdc.gov.au/reports/Index.htm • purchases at www.rirdc.gov.au/eshop Simon Hearn Managing Director Rural Industries Research and Development Corporation

iv
Acknowledgements This project was commenced by Yan Diczbalis before he left the NT for the cooler pastures of Far North Queensland. But Yan has kept in contact, especially through his involvement in a similar project with the QLD Rambutan Industry, and his input is (and ever will be) greatly appreciated. This project while started by Yan Diczbalis, is set on the framework provided by Dr T.K. Lim and his colleagues Lana Luders and Mike Poffley. Even though TK left the NT for the much colder pastures of Canberra, his legacy of quality work and concern for the NT Horticultural Industry remain. This project required detailed, repetitive work for which I am grateful to Andrew Hosking for his endeavors and banana cake; and Gerry McMahon and Susan Marte for the time they spent with the project before also moving onto other pastures. Gail Dunker came on board last and managed to see the project out, complete with delays and tribulations. My final and greatest appreciation goes to all the growers who involved themselves so wholeheartedly in this project. A better bunch of people no one could hope to work with.

v
Contents Foreword .................................................................................................................. iii Acknowledgements................................................................................................. iv Executive Summary .............................................................................................. viii 1. Introduction ...................................................................................................... 1
1.1 Rambutan Production ......................................................................................................... 1 1.2 Irrigation Studies ................................................................................................................ 1 1.3 Nutrition Studies ................................................................................................................. 2 1.4 Aims of this project............................................................................................................. 3
2. Nutrition Studies .............................................................................................. 4
2.1 Introduction......................................................................................................................... 4 2.2 Materials and Methods........................................................................................................ 4 2.3 Results and Discussion ....................................................................................................... 6
2.3.1 Review Standards ..................................................................................................... 6 2.3.2 Fertigation vs Broadcast ......................................................................................... 10 2.3.3 Linking Productivity to Nutrition ........................................................................... 11
2.4 Discussion and Conclusion............................................................................................... 14 3. Irrigation Management................................................................................... 15
3.1 Introduction....................................................................................................................... 15 3.2 Materials and Methods...................................................................................................... 15 3.3 Results and Discussion ..................................................................................................... 17 3.4 Discussion and Conclusion............................................................................................... 20
4. Conclusion and Recommendations ............................................................. 21
4.1 Rambutan Nutrition .......................................................................................................... 21 4.2 Rambutan Irrigation Management .................................................................................... 21
5. References...................................................................................................... 23 6. Appendix One................................................................................................. 25
Development of new standards for DRIS analysis for NT rambutan ......................................... 25
vi
List of Tables
Table Title Page
Table 1.1. Environmental conditions in SE Asia and Darwin where rambutans are successfully grown.
1
Table 1.2. Calculated crop factors and water requirements, daily and weekly, for rambutan.
2
Table 2.1 List of participating NT Rambutan growers with their property location and level of involvement in the project.
5
Table 2.2 Laboratory methods used by Chemistry Section (NT DBIRD) to analyse Rambutan soil and leaf for elemental content
6
Table 2.3 A comparison of recommended soil and leaf nutrition levels/ranges for Rambutan in northern Australia.
7
Table 2.4 The segregation of the rambutan growers into three groups based on soil properties.
8
Table 2.5 A comparison of fertiliser application systems (broadcast and fertigation) on rambutan soil and leaf nutrition.
11
Table 3.1 List of participating NT Rambutan growers with their property location and level of involvement in the project.
16
vii
List of Figures
Figure Title Page
Figure 2.1 Levels of Phosphorus in the soil on rambutan properties in the NT at four different sampling times.
9
Figure 2.2 Levels of Phosphorus in the leaf on rambutan properties in the NT at four different sampling times.
9
Figure 2.3 The Calcium:Magnesium for three different groups of rambutan growers in the NT
10
Figure 2.4 Daily maximum and minimum temperatures for Humpty Doo during the flowering season for Rambutan in 1999 and 2000.
12
Figure 2.5 The change in soil pH with time for the Rambutan properties in the NT.
13
Figure 2.6 The change in soil Cation Exchange Capacity (CEC) over time for three groupings of Rambutan properties in the NT.
13
Figure 3.1 Recommended range for tensiometer readings in Rambutan in the NT.
17
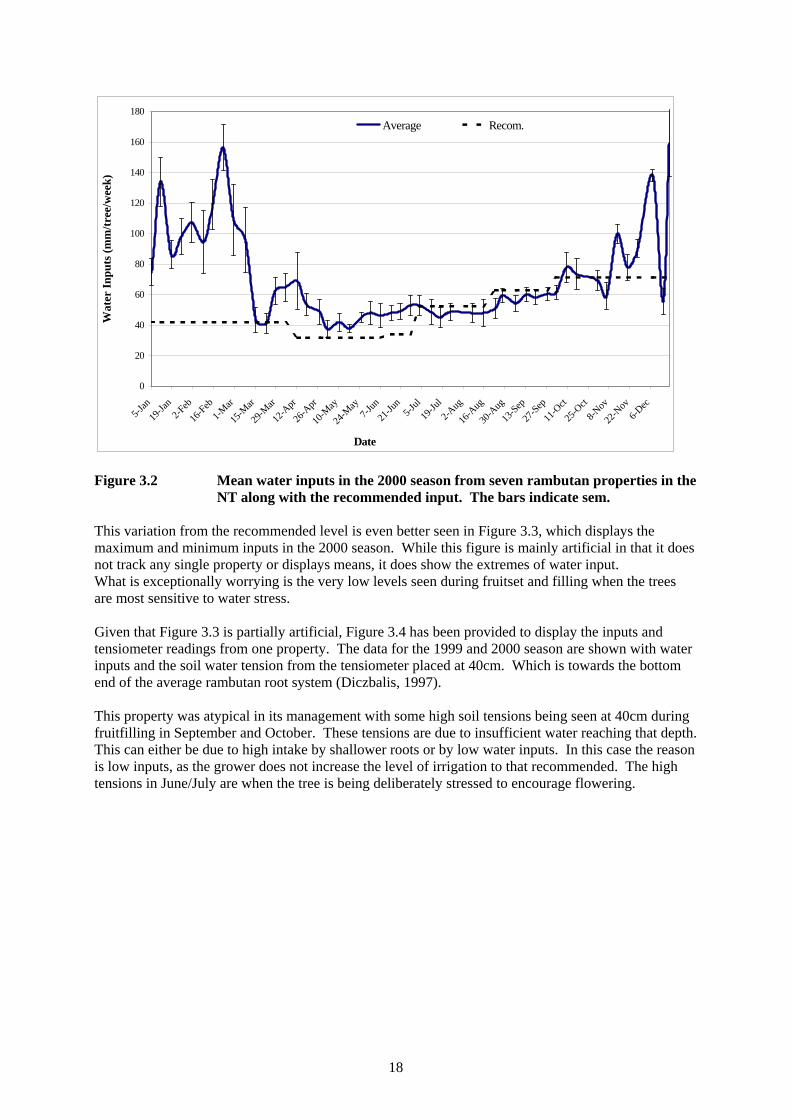
Figure 3.2 Mean water inputs in the 2000 season from seven rambutan properties in the NT along with the recommended input.
18
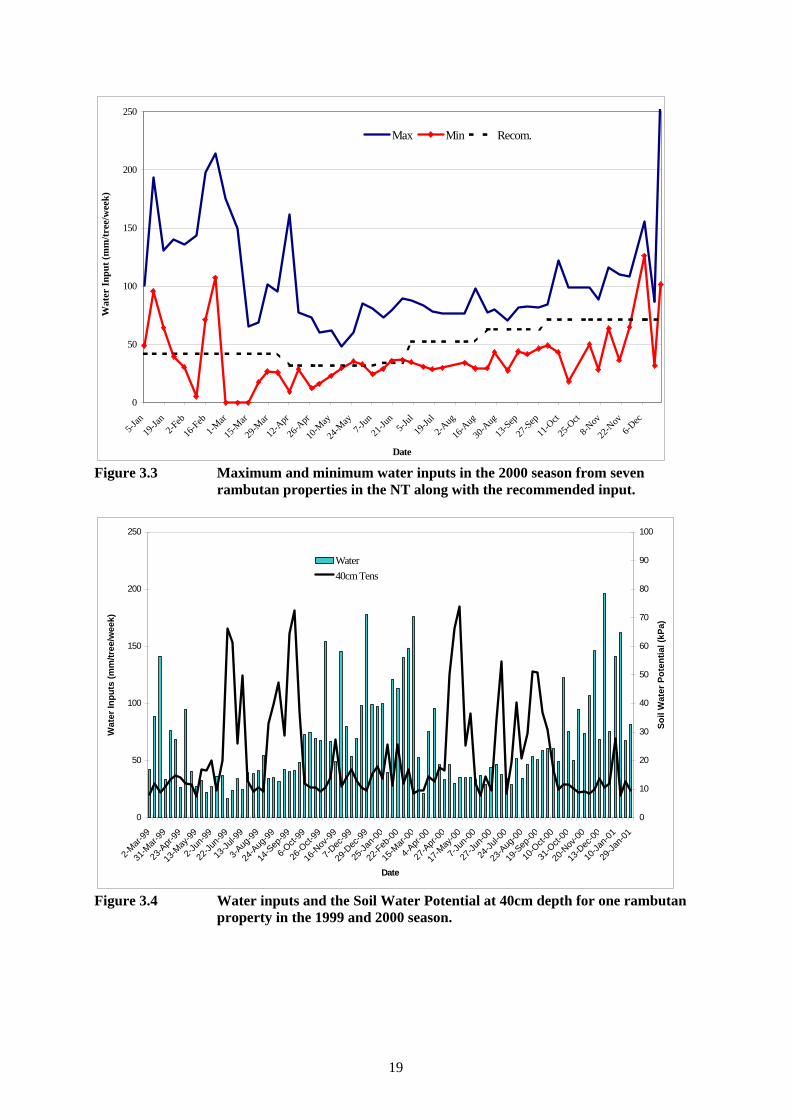
Figure 3.3 Maximum and minimum water inputs in the 2000 season from seven rambutan properties in the NT along with the recommended input.
19
Figure 3.4 Water inputs and the Soil Water Potential at 40cm depth for one rambutan property in the 1999 and 2000 season.
19
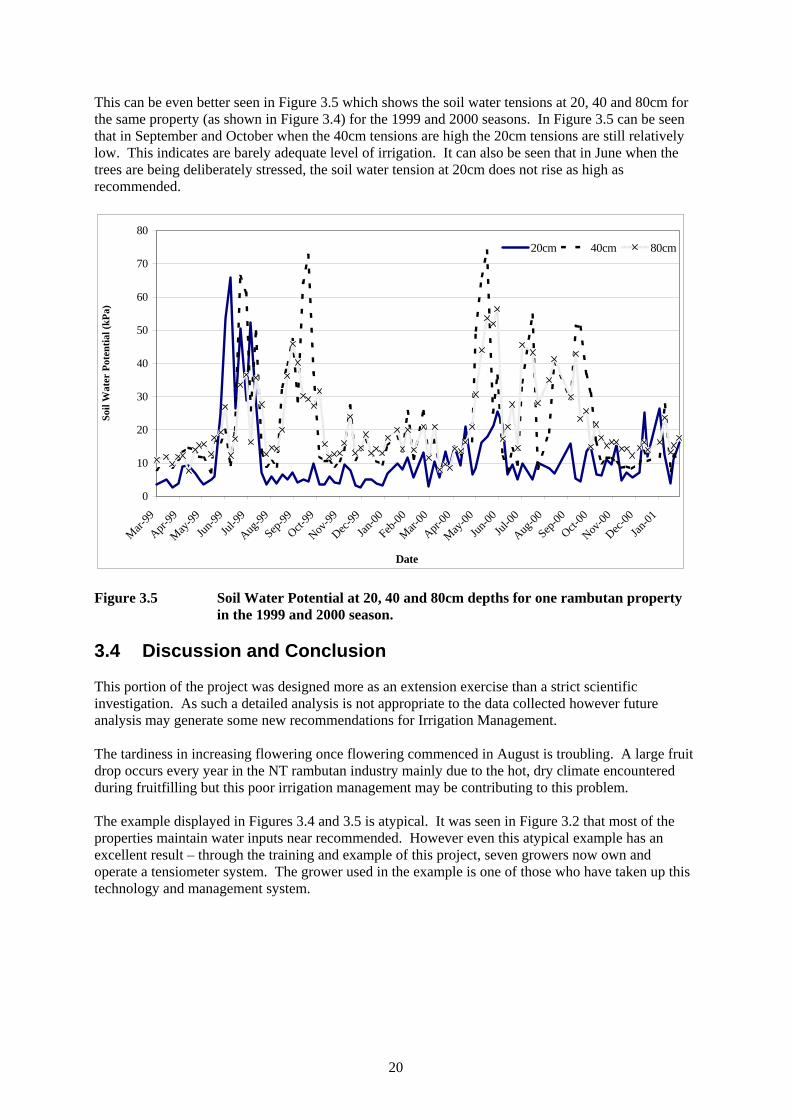
Figure 3.5 Soil Water Potential at 20, 40 and 80cm depths for one rambutan property in the 1999 and 2000 season.
20
viii
Executive Summary The rambutan (Nephelium lappaceum L.) is a large tropical tree that is a member of the Sapindaceae family along with Longan and Lychee. The rambutan is believed to be native to West Malaysia and the islands of Western Indonesia and as such prefers a tropical climate (within 15o of the equator) on land below about 500m elevation. The climate should be warm and wet with few dry periods. The soil should generally well drained and slightly to moderately acidic. In Australia the fruit has grown in popularity and a considerable area has been planted to Rambutan. The rambutan industry was valued at $2.7 M in 1995 with the bulk of the crop being grown in North Queensland. The Northern Territory industry although smaller provides approximately a third of the value of the industry. In the Northern Territory, rambutan is an emerging tropical fruit crop and is profitable to grow with a market value in 1994 of $800,000 with an estimated 12,000 trees planted (140-200 ha). The majority of this development has occurred without a rambutan growing culture or knowledge. Irrigation is a necessary part of production in the wet-dry tropics. In the NT, the dry season (May to September) is the main period during which irrigation is required. Irrigation rates and frequency varies from orchard to orchard. The wet season (October to April) although reliable in terms of total rainfall, is still a period in which irrigation is required due to in-season variability. Previous work has developed an irrigation management strategy for rambutan production in the Darwin region. This strategy includes a droughting period in an attempt to improve flowering. Delayed or poor flowering and poor fruit retention is of major concern to growers in the NT, who are able to exploit a market window which exists in November - December, prior to the onset of fruit availability in Queensland. Better control of flowering and fruiting through improved irrigation management would greatly facilitate income stability for growers in the NT and Queensland. Another area of poor knowledge was in respect to tree nutrition. Much of the literature on fertiliser management of rambutan is practical in nature with few clear scientifically based experiments. Previous work conducted in the NT produced in 1997 the most comprehensive guidelines of rambutan fertiliser requirements to date. That study suggested that in commercially productive rambutan grown the NT, the chief demands are for nitrogen, potassium and phosphorous. The previous work conducted in the NT while excellent was still very basic in comparison to other tree crops grown in Australia. There was still lack of information on fertiliser management, in particular the effect of frequency of application during fruit development. This is something best established in the field. Thus there is much to be gained by monitoring growers with differing practices. The aim of this project is to improve our understanding of nutrient and irrigation management in rambutan, with particular emphasis on management through the fruit filling stage. This should lead to improved yield and fruit quality with more efficient use of fertiliser and irrigation inputs and hence increased profitability. The monitoring and reporting components of the project are closely linked with industry participation hence the uptake of new findings will hopefully be rapid and lead to improvements in productivity. In 1998 a large proportion of the rambutan growers of the NT were requested to take part in this project. In total, 14 growers replied in the affirmative. These grower’s properties plus the Coastal Plains Horticulture Research Farm (CPHRF) (managed by the NT Department of Business, Industry and Resource Development) were all selected for the Nutrition portion of the project. A sub-group of 9 grower properties plus CPHRF were selected for the Irrigation portion of the project.

ix
The field methodology for the Nutrition Trial consisted of sampling soil and leaf from each property four times per year. Thus there were thirteen separate samplings. The sampling times were set so that significant tree behaviour (flowering, flushing, etc.) could be represented. At each sampling a methodology developed by earlier workers was used to reduce variability both in the field and in the laboratory. The results of the laboratory analyses was then combined with yield data and other measures of tree vigour to develop for each nutrient a suitable range for levels in leaf and soil. The methods used to develop these recommended ranges involved using a various techniques proven in other crops. The best method for proofing the new ranges is through linkage to improved yield. Unfortunately this was very difficult to do for this project, as the three years the project covered were mainly poor years. The 1998 season was very promising until a cyclone crossed near Darwin in early December, causing a very large fruit drop with estimates of crop loss ranging between 30 and 75%. While in 1999 and 2000 there were some cold and dry spells just on and after flowering that limited pollination and caused the abortion of young fruit. However analysis of other measures of tree and soil health and balance indicate a large amount of general improvement. This improvement was achieved through group discussions and one-to-one sessions. The growers were keen to be involved and openly discussed management practices. There were over twenty meetings with the growers group throughout the time of the project, which is something of a record for such a small group. This project also showed that there are no significant reasons that fertigation cannot be used instead of broadcast (of granular fertiliser) to provide rambutan with its nutrient requirements. However there was no clear advantage either, so any decision made can be more readily made using economic or time-restraint criteria rather than tree vigour or yield. The significant impact of the environment on this project showed yet again that not enough is known about the influence of the environment (and especially a harsh environment such as is found in the NT) on flowering and fruiting of rambutan. More work needs to be done in this area. With regards to Irrigation Management this project was more like an extension exercise than a strict scientific study. On each of the ten properties selected, three trees of the same variety, age and vigour were selected to be the representative trees. At each of these trees (that were not always the same trees as those sampled for soil and leaf nutrition) a range of soil moisture monitoring devices were installed. Each property also had a water meter installed in a lateral irrigation line. There were also rain gauges and temperature and relative humidity loggers installed at most of the properties. All ten properties were visited once per week and the soil moisture measured and each monitor tree was also visually assessed for gross phenological behaviour (Flushing, Mature/Resting, Flowering, Fruiting). The Tinytalk II loggers were downloaded fortnightly. At each property the latest soil water readings were related to the grower. Wherever possible, the grower accompanied the researcher during the data collection and was introduced to the mechanics and theory of measuring and interpreting soil water status. In the main, most growers were quite good at managing the water inputs provided to their rambutan tree. An analysis of actual inputs versus recommended inputs indicated that once the rain had finished in mid-April the growers were all close to the recommended level. However the level of inputs was still significantly (p=0.01) different from recommended. Most of the difference occurred during the stressing period. In 2000 the flowering was later than normal which could explain the higher inputs, however it is those very years of poor flowering that stressing is meant to be most beneficial

x
A further analysis of water inputs and soil water content showed that there were a number of growers that were either under or over irrigating to a large degree. What was exceptionally worrying is the very low levels seen during fruitset and filling when the trees are most sensitive to water stress. A large fruit drop occurs every year in the NT rambutan industry mainly due to the hot, dry climate encountered during fruitfilling but this poor irrigation management may be contributing to this problem. However even this problem had an excellent result – through the training and example of this project, seven growers now own and operate a tensiometer system. That was one of the main reasons behind this entire water management exercise. Any further work in these areas is best conducted by the growers themselves in consultation with the Horticultural Extension staff of the NT Department of Business, Industry and Resource Development. The main findings of this project are: • A new critical range for rambutan soil and leaf nutrition has been developed. • Growers have successfully taken up soil water monitoring principles and practice. • Further work is urgently required on the influence of the environment on rambutan flowering and
fruit retention under NT conditions • A final conclusion of this project is that cultivating an open air of discussion and discovery
amongst the growers was an excellent method of developing new strategies and facilitating the uptake of new technologies.

1
1. Introduction 1.1 Rambutan Production The rambutan (Nephelium lappaceum L.) is a large tropical tree that is a member of the Sapindaceae family along with Longan and Lychee. The rambutan is believed to be native to West Malaysia and the islands of Western Indonesia (van Welzen and Verheij, 1992; Watson, 1984). The rambutan tree prefers a tropical climate (within 15o of the equator) on land below about 500m elevation. The climate should be warm and wet with few dry periods. In Table 1.1 can be seen a comparison of various climates where rambutan is grown. The soil should generally well-drained and slightly to moderately acidic (van Welzen and Verheij, 1992; Yaacob and Subhadrabanhu, 1995 pp 165). Table 1.1. Environmental conditions in SE Asia and Darwin where rambutans are
successfully grown.
Location
Max. monthly Temp (°C)
Min. monthly Temp (°C)
Av. yearly rainfall (mm)
Av. yearly Evap (mm)
Months
moisture deficit+
Jakarta* (Indonesia)
32.9
22.9
1823
1036
4
Singapore* 31.6 22.8 2161 1610 0 Alor Setar* (Malaysia)
34.4
21.7
2197
1760
4
Darwin# 33.1 19.3 1665 2685 8 ASEAN, (1982); # Bureau of Meteorology, (1993); + Number of months evaporation exceeds rainfall. Taken from Diczbalis, 1997. The crop is now pandemic to the tropics with growing regions through out South East Asia, as well as in southern USA, Central America, Africa and northern Australia. In Australia the rambutan industry is established in Far North Queensland and around Darwin in the Northern Territory. These are areas in Australia where the mean minimum temperature is above 15oC (Diczbalis, 1997). In Australia the fruit has grown in popularity and a considerable area has been planted to Rambutan. The rambutan industry is currently valued at $2.7 M (Lim and Diczbalis, 1995) with the bulk of the crop being grown in North Queensland. The Northern Territory industry although smaller provides approximately a third of the value of the industry. In the Northern Territory, rambutan is an emerging tropical fruit crop and is profitable to grow (Ngo and Baker, 1990) with a market value in 1994 of $800,000 (NT DPIF, 1994) with an estimated 12,000 trees planted (140-200 ha). The majority of this development has occurred without a rambutan growing culture or knowledge 1.2 Irrigation Studies Irrigation is a necessary part of production in the wet-dry tropics. In the NT, the dry season (May to September) is the main period during which irrigation is required. Irrigation rates and frequency varies from orchard to orchard. The wet season (October to April) although reliable in terms of total rainfall, is still a period in which irrigation is required due to in-season variability (Mollah, 1986). There was a lack of knowledge of rambutan water requirements at various growth stages and climatic seasons (Tatt, 1976). This gap was filled by the work of Diczbalis (1997) who developed an irrigation

2
management strategy for rambutan production in the Darwin region. This strategy is summarised and demonstrated in Table 1.2 where different crop factors are assigned to various times of the year. Table 1.2. Calculated crop factors and water requirements, daily and weekly, for
rambutan. Data based on a canopy area of 30 m2.
Period Crop factor Evaporation (mm/day)
Water requirement (mm/day)
L/tree/day L/tree/week
End of Wet to flowering
0.76 7.1 5.4 162 1134
Flowering 0.99 7.4 7.3 219 1533 Fruit filling 1.21 8.0 9.7 291 2037
Harvest to end of Wet
1.0 6.0 6.0 180 1260
*-Taken from Diczbalis, 1997. Delayed or poor flowering is of major concern to growers in the NT, who are able to exploit a market window which exists in November - December, prior to the onset of fruit availability in Queensland. Better control of flowering through improved irrigation management would greatly facilitate income stability for growers in the NT and Queensland. 1.3 Nutrition Studies Another area of poor knowledge was in respect to tree nutrition. Lim et al. (1997) produced the most comprehensive guidelines of rambutan fertiliser requirements to date. Their study utilised the modified Diagnosis and Recommendation Integrated System (m-DRIS) which minimises the effect of physiological age of tissue enabling sampling of a wider tissue age than is permissible under the critical value technique. The m-DRIS approach also considers nutrient interactions and computes nutrient balance indices. Their studies suggested that in rambutan grown in northern Australia (NT), under a relatively high input system, the chief demands are for nitrogen, potassium and phosphorous. In NT orchards a number of micronutrients are also in short supply and include zinc, iron and manganese. Lim et al. (1997) proposed that growers in the NT should consider either four or five applications of fertiliser (chlorine free) per year with higher inputs directly after harvest. Although the option of increased frequency of application via fertigation was suggested, there was no data to suggest it had any advantages over conventional application. A search of the CAB abstracts suggests that the increased efficiency of fertigation over conventional application methods is generally accepted (Haynes 1985, Neumann and Snir 1995) and there are a number of papers outlining the advantages and increased efficiency of fertigation (Boman 1996, Kipp 1988 Bussi et al. 1995). There are however, a number of cases where fertigation has not been shown to provide an increase in efficiency or yield (Layne et al. 1996). Much of the literature on fertiliser management of rambutan is practical in nature with few clear scientifically based experiments. Ng and Thamboo (1967) published data on nutrient requirements based on fruit removal studies. They showed that in a 80 tree orchard yielding 6.7 t/ha, 13.4 kg of N, 1.8 kg of P, 10.2 kg of K, 4.84 kg of Ca and 2.47 kg of Mg is removed. These findings again show the trees high requirement for N and K, which is a common trait among tropical fruit. Belen (1976, cited by Tindal 1994) suggested that fertiliser management can influence fruit size and quality. Fertilisers and application options vary in the main producing countries of SE Asia (Tindal 1994), however, for the most part granular fertilisers applied two to three times per year is the common method. Muchjajib (1990, cited by Tindal 1994) has related fertiliser use to stage of growth with three of the five applications occurring from flowering until 9 weeks after fruit set. The other applications occur prior to flowering and following harvest.

3
The lack of information on fertiliser management, in particular the effect of frequency of application during fruit development, suggests that there is much to be gained by monitoring growers with differing practices. 1.4 Aims of this project The project will improve our understanding of nutrient and irrigation management in rambutan, with particular emphasis on management through the fruit filling stage. This will lead to improved yield and fruit quality with more efficient use of fertiliser and irrigation inputs and hence increased profitability. The monitoring and reporting components of the project are closely linked with industry participation hence the uptake of new findings will be rapid and lead to improvements in productivity.
4
2. Nutrition Studies 2.1 Introduction The rambutan (Nephelium lappaceum L.) is a large tropical tree that is a member of the Sapindaceae family along with Longan and Lychee. The rambutan is believed to be native to West Malaysia and the islands of Western Indonesia (van Welzen and Verheij, 1992; Watson, 1984). In SE Asia the rambutan is grown in large orchards but is still mainly a crop grown by family-based enterprises with little scientific input or management (van Welzen and Verheij, 1992). Much of the literature on fertiliser management of rambutan is practical in nature with few clear scientifically based experiments. Ng and Thamboo (1967) published data on nutrient requirements based on fruit removal studies. They showed that in a 80 tree orchard yielding 6.7 t/ha, 13.4 kg of N, 1.8 kg of P, 10.2 kg of K, 4.84 kg of Ca and 2.47 kg of Mg is removed. These findings again show the trees high requirement for N and K, which is a common trait among tropical fruit. Belen (1976, cited by Tindal 1994) suggested that fertiliser management can influence fruit size and quality. Fertilisers and application options vary in the main producing countries of SE Asia (Tindal 1994), however, for the most part granular fertilisers applied two to three times per year is the common method. Muchjajib (1990, cited by Tindal 1994) has related fertiliser use to stage of growth with three of the five applications occurring from flowering until 9 weeks after fruit set. The other applications occur prior to flowering and following harvest. The lack of information on fertiliser management suggests that there is much to be gained by monitoring growers with differing practices. This portion of the project aims to do that very thing. 2.2 Materials and Methods In 1998 a large proportion of the rambutan growers of the NT were requested to take part in this project. In total, 14 growers replied in the affirmative. These grower’s properties plus the Coastal Plains Horticulture Research Farm (CPHRF) (managed by the NT Department of Business, Industry and Resource Development) were all selected for the Nutrition portion of the project. A sub-group of 9 grower properties plus CPHRF were selected for the Irrigation portion of the project. In Table 2.1 can be seen the name, location and involvement of the properties. The field methodology for the Nutrition Trial consisted of sampling soil and leaf from each property four times per year. The sampling times were set so that significant tree behaviour (flowering, flushing, etc.) could be represented. The sampling times were as follows: July 1998, September 1998, December 1998, February 1999, May 1999, July 1999, October 1999, January 2000, May 2000, July 2000, October 2000, February 2001 and June 2001. All sampling was conducted with in a 7-day period on each occasion.

5
Table 2.1 List of participating NT Rambutan growers with their property location and level of involvement in the project.
Grower Location Nutrition Trial Irrigation Monitoring Dysart Colton Park Yes Yes Doyle Humpty Doo Yes Yes
Sadowski Humpty Doo Yes Yes Driscol Humpty Doo Yes Yes West Darwin River Yes No Philp Berry Springs Yes Yes
Kimbacher Darwin River Yes Yes Eupene Bees Creek Yes Yes
Blackburn Howard Springs Yes No Poffley Humpty Doo Yes Yes Jettner Howard Springs Yes No
Karlson McMinns Lagoon Yes No Clausen McMinns Lagoon Yes Yes Davey Humpty Doo Yes No
CPHRF Middle Point Yes Yes On each property three trees of the same variety, age and vigour were selected to be the representative trees. These trees were sampled on each occasion as well as being measured for tree height, canopy diameter, trunk circumference at 50cm (or as high as possible if the trunk was shorter than 50 cm) and gross phenological condition (Flushing shoots/Mature shoots/Flowering terminals/Fruiting). The sampling procedure was as established by Lim et al (1997). Each tree (i.e. three samples soil/leaf per property) had leaf samples taken from between 1-2m height with the most recent, fully-matured leaflets on the third leaf of the latest flush taken. Where ever possible the sampled flush was resting. This sampling technique required approx. 30 leaflets per sample. Each tree also had approx. 250g of soil (in total) taken from four sites around the tree. The sampling depth was between 5-15cm with leaf litter and fertiliser scrapped away from the site before sampling. All samples were stored for transport in an esky. Upon return to the laboratory the leaves were rinsed in tap water, then washed in a mild solution of dishwashing detergent, then rinsed three times in de-ionized water. The leaves were then dried (in a fan-forced dryer) at 60oC for at least seven days before being milled to pass through 0.5mm mesh. The soil was air-dried (under ceiling fans in a non-air-conditioned workarea) for at least seven days then put through a 2mm sieve. The samples were then handed to the Chemistry Laboratory of the NT Department of Business, Industry and Resource Development for standard analysis. This analysis is summarised in Table 2.2 (Kawaljenko, 2002 (pers. comm)) These results were tabulated and summarised using Microsoft Excel. A spreadsheet was developed that allowed quick DRIS (Diagnostic and Recommendation Integrated System) calculations. Any statistical comparisons were made using SigmaStat software (Jandel Scientific).

6
Table 2.2 Laboratory methods used by Chemistry Section (NT DBIRD) to analyse Rambutan soil and leaf for elemental content
Element Methodology
Nitrogen Sulfuric acid / hydrogen peroxide digestion followed by a flow injection analysis procedure utilising ammonia diffusion across a teflon membrane into a pH indicator. The change in pH is determined by a spectrophotometric detector.
Nutrients: P K Ca Mg Na S Cu Zn Fe Mn Mo B
Nitric acid digestion followed by ICP measurement.
Chloride Extraction of sample with 2 % nitric acid followed by potentiometric titration with silver nitrate.
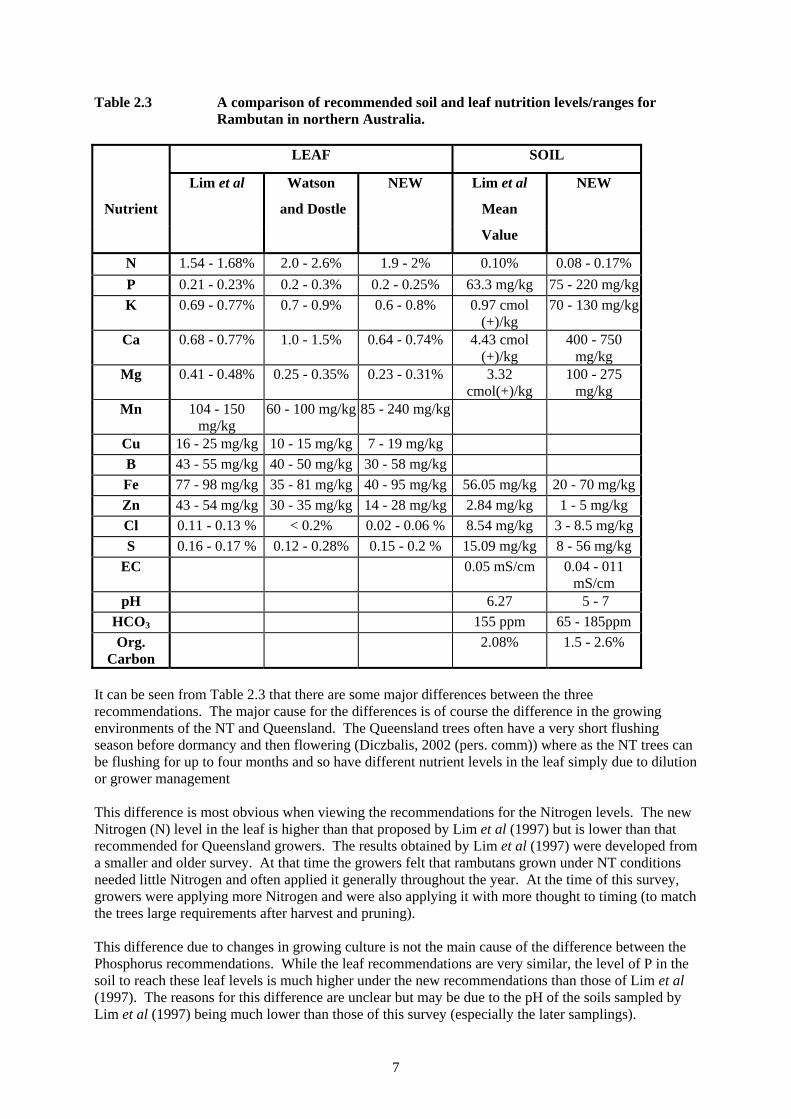
The DRIS analysis is conducted by developing a range of ratios between (leaf) nutrient levels detected and between these nutrient levels and accepted standards. Once complete, the DRIS analysis provides the user with a measure of the relative sufficiency of any element in relation to the others and to a standard (Beverly, 1987; Schaffer et al, 1988; Parent and Granger, 1989; Sumner, 1986). These analyses were then used to determine the nutrient balance (in May) for the major nutrients on the various properties in the project. The properties were then grouped for each element with the three lowest and three highest levels (given no outliers) being used to determine the range of elemental concentration required in the leaf. Once the leaf values had been determined, simple linear regression was used to determine the matching soil elemental level (again given no outliers). The minor nutrients and other factors (pH, CEC) were determined through the use of upper and lower quartiles. All these values were checked against two properties that had received no fertiliser inputs for the duration of the project and against the best producing orchard of each season. To allow linkage of these values to yield and to inputs, the growers were requested to make available their orchard diaries and to also provide an accurate (or as near-as) tallying of yield. The yield figures were usually provided as cartons at the farmgate. This was combined with an estimate of field losses, discards and unpicked fruit to provide an estimated physiological yield. All comparisons were made against the analyses developed from sampling around May as this month was found by Lim et al (1997) to be the most stable. When the statistical and DRIS analyses were being carried out, it became obvious that the properties could be separated into three distinct groupings. These groupings were the result of specific soil and bore-water properties that was strongly influencing the affect of fertiliser inputs to the rambutan trees. The recommendations made here are based on the largest grouping that comprises the grower properties: Dysart, Doyle, Sadowski, Driscol, Philp, Eupene, Karlson, Clausen and CPHRF. 2.3 Results and Discussion 2.3.1 Review Standards As mentioned previously there are only two ranges of nutrition standards for Rambutan currently in press. This project has developed a third that is specific for the NT. In Table 2.3 can be seen a comparison of all three nutrition standards for NT rambutans. In this table the levels labeled Lim et al are those published in 1997 for the Northern Territory (Lim et al, 1997); those labeled Watson and Dostle are those published in 1989 (Watson and Dostle, 1989) for North Queensland; the values labeled as New are those developed during this Project.
7
Table 2.3 A comparison of recommended soil and leaf nutrition levels/ranges for Rambutan in northern Australia.
LEAF SOIL
Lim et al Watson NEW Lim et al NEW
Nutrient and Dostle Mean
Value
N 1.54 - 1.68% 2.0 - 2.6% 1.9 - 2% 0.10% 0.08 - 0.17% P 0.21 - 0.23% 0.2 - 0.3% 0.2 - 0.25% 63.3 mg/kg 75 - 220 mg/kg K 0.69 - 0.77% 0.7 - 0.9% 0.6 - 0.8% 0.97 cmol
(+)/kg 70 - 130 mg/kg
Ca 0.68 - 0.77% 1.0 - 1.5% 0.64 - 0.74% 4.43 cmol (+)/kg
400 - 750 mg/kg
Mg 0.41 - 0.48% 0.25 - 0.35% 0.23 - 0.31% 3.32 cmol(+)/kg
100 - 275 mg/kg
Mn 104 - 150 mg/kg
60 - 100 mg/kg 85 - 240 mg/kg
Cu 16 - 25 mg/kg 10 - 15 mg/kg 7 - 19 mg/kg B 43 - 55 mg/kg 40 - 50 mg/kg 30 - 58 mg/kg Fe 77 - 98 mg/kg 35 - 81 mg/kg 40 - 95 mg/kg 56.05 mg/kg 20 - 70 mg/kg Zn 43 - 54 mg/kg 30 - 35 mg/kg 14 - 28 mg/kg 2.84 mg/kg 1 - 5 mg/kg Cl 0.11 - 0.13 % < 0.2% 0.02 - 0.06 % 8.54 mg/kg 3 - 8.5 mg/kg S 0.16 - 0.17 % 0.12 - 0.28% 0.15 - 0.2 % 15.09 mg/kg 8 - 56 mg/kg
EC 0.05 mS/cm 0.04 - 011 mS/cm
pH 6.27 5 - 7 HCO3 155 ppm 65 - 185ppm Org.
Carbon 2.08% 1.5 - 2.6%
It can be seen from Table 2.3 that there are some major differences between the three recommendations. The major cause for the differences is of course the difference in the growing environments of the NT and Queensland. The Queensland trees often have a very short flushing season before dormancy and then flowering (Diczbalis, 2002 (pers. comm)) where as the NT trees can be flushing for up to four months and so have different nutrient levels in the leaf simply due to dilution or grower management This difference is most obvious when viewing the recommendations for the Nitrogen levels. The new Nitrogen (N) level in the leaf is higher than that proposed by Lim et al (1997) but is lower than that recommended for Queensland growers. The results obtained by Lim et al (1997) were developed from a smaller and older survey. At that time the growers felt that rambutans grown under NT conditions needed little Nitrogen and often applied it generally throughout the year. At the time of this survey, growers were applying more Nitrogen and were also applying it with more thought to timing (to match the trees large requirements after harvest and pruning). This difference due to changes in growing culture is not the main cause of the difference between the Phosphorus recommendations. While the leaf recommendations are very similar, the level of P in the soil to reach these leaf levels is much higher under the new recommendations than those of Lim et al (1997). The reasons for this difference are unclear but may be due to the pH of the soils sampled by Lim et al (1997) being much lower than those of this survey (especially the later samplings).
8
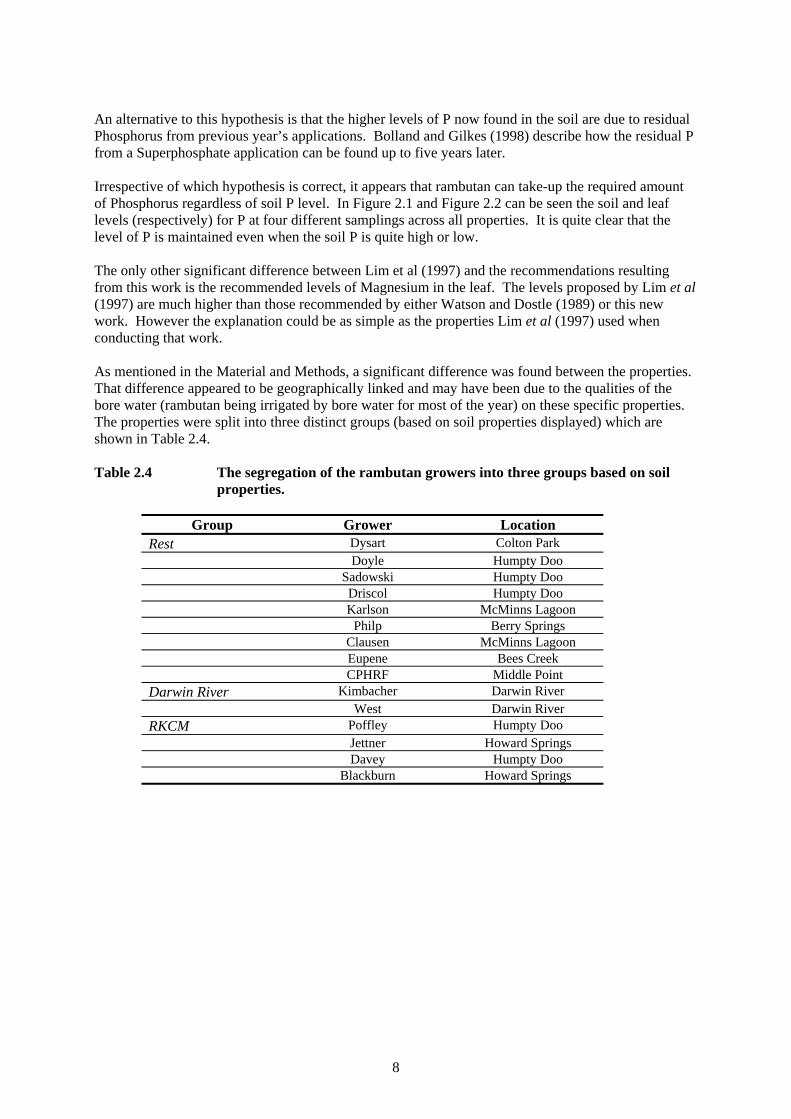
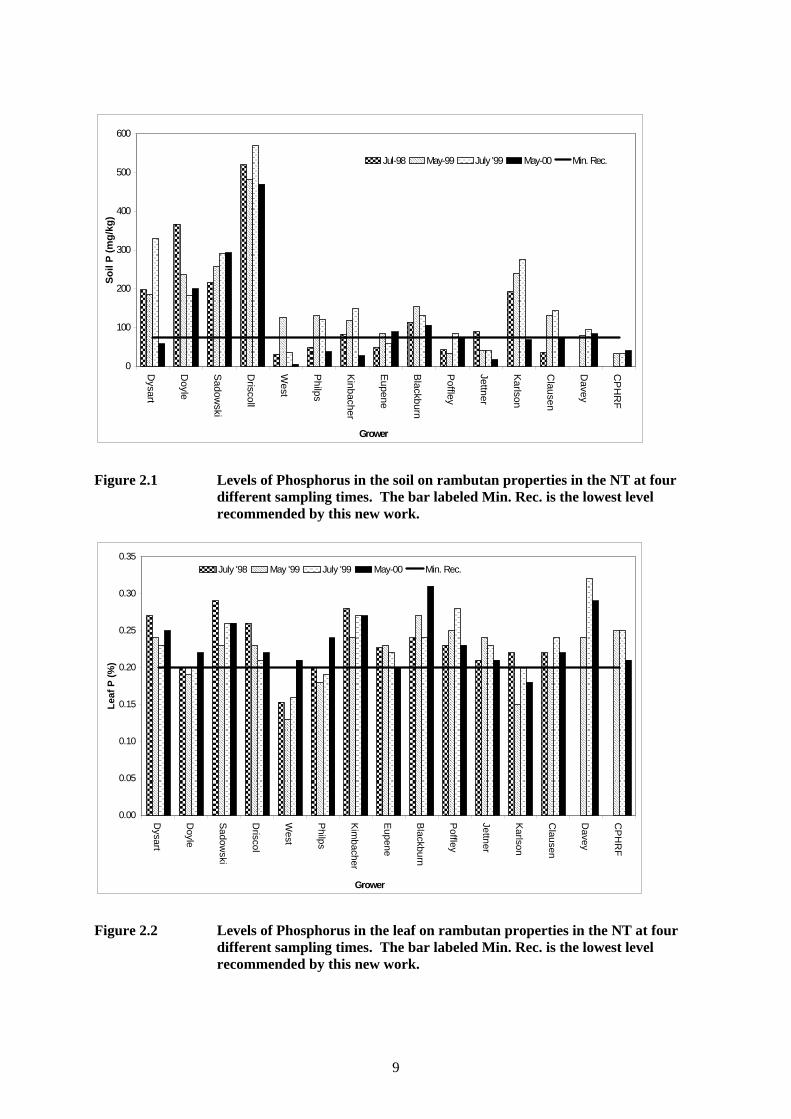
An alternative to this hypothesis is that the higher levels of P now found in the soil are due to residual Phosphorus from previous year’s applications. Bolland and Gilkes (1998) describe how the residual P from a Superphosphate application can be found up to five years later. Irrespective of which hypothesis is correct, it appears that rambutan can take-up the required amount of Phosphorus regardless of soil P level. In Figure 2.1 and Figure 2.2 can be seen the soil and leaf levels (respectively) for P at four different samplings across all properties. It is quite clear that the level of P is maintained even when the soil P is quite high or low. The only other significant difference between Lim et al (1997) and the recommendations resulting from this work is the recommended levels of Magnesium in the leaf. The levels proposed by Lim et al (1997) are much higher than those recommended by either Watson and Dostle (1989) or this new work. However the explanation could be as simple as the properties Lim et al (1997) used when conducting that work. As mentioned in the Material and Methods, a significant difference was found between the properties. That difference appeared to be geographically linked and may have been due to the qualities of the bore water (rambutan being irrigated by bore water for most of the year) on these specific properties. The properties were split into three distinct groups (based on soil properties displayed) which are shown in Table 2.4. Table 2.4 The segregation of the rambutan growers into three groups based on soil
properties.
Group Grower Location Rest Dysart Colton Park
Doyle Humpty Doo Sadowski Humpty Doo Driscol Humpty Doo Karlson McMinns Lagoon Philp Berry Springs Clausen McMinns Lagoon Eupene Bees Creek CPHRF Middle Point
Darwin River Kimbacher Darwin River West Darwin River
RKCM Poffley Humpty Doo Jettner Howard Springs Davey Humpty Doo Blackburn Howard Springs
9
0
100
200
300
400
500
600
Dysart
Doyle
Sadow
ski
Driscoll
West
Philps
Kinbacher
Eupene
Blackburn
Poffley
Jettner
Karlson
Clausen
Davey
CP
HR
F
Grower
Soil
P (m
g/kg
)
Jul-98 May-99 July '99 May-00 Min. Rec.
Figure 2.1 Levels of Phosphorus in the soil on rambutan properties in the NT at four different sampling times. The bar labeled Min. Rec. is the lowest level recommended by this new work.
0.00
0.05
0.10
0.15
0.20
0.25
0.30
0.35
Dysart
Doyle
Sadow
ski
Driscol
West
Philps
Kim
bacher
Eupene
Blackburn
Poffley
Jettner
Karlson
Clausen
Davey
CP
HR
F
Grower
Leaf
P (%
)
July '98 May '99 July '99 May-00 Min. Rec.
Figure 2.2 Levels of Phosphorus in the leaf on rambutan properties in the NT at four different sampling times. The bar labeled Min. Rec. is the lowest level recommended by this new work.

10
This segregation was based on differences in Calcium and Magnesium chemistry, soil pH and Cation Exchange Capacity (CEC). This difference is best described through the use of the example of the Calcium:Magnesium ratio in the soil. The ratio is calculated using the milli-equivalents of the ions rather than the elemental level. This ratio is important because while Magnesium is important to plant growth, it is Calcium that is deposited into the fruit. A low ratio of Calcium to Magnesium in the soil indicates that the tree may become deficient in Calcium. This is due to the Magnesium being a better competitor for retention in the soil water and for being taken up by the tree roots. The Calcium:Magnesium ratio is displayed in Figure 2.3 where the mean and standard error of each of the three groups’ is plotted against the sampling date. The difference between the Darwin River group and the “Rest” group of the growers was significant early in the study, but as these growers became more proficient at managing their soil nutrition, the difference became non-significant. However the RKCM group always had a significantly lower Ca:Mg ratio which was contributing to low calcium in the rambutan trees on those properties.
0.4
0.6
0.8
1.0
1.2
1.4
1.6
1.8
2.0
Jul '98 Sep '98 Dec '98 Feb '99 May '99 July '99 Oct '99 Jan '00 May '00 Jul '00 Oct '00 Feb '01 Jun '01
Date
Ca:
Mg
ratio
Drwn Rvr RKCM Rest
Figure 2.3 The Calcium:Magnesium ratios (calculated using milli-equivalence) for
three different groups of rambutan growers in the NT. The bars are the SEM for each group at each sampling.
2.3.2 Fertigation vs Broadcast The use of granular fertilisers has been the common method of nutritional adjustment used by NT rambutan growers. However with increasing demands on time and an increasing range if products fertigation has become very popular. As part of this study a comparison of Granular vs Fertigation methods of fertiliser application was made. In this study four properties (Doyle, Eupene, Clausen and CPHRF) that were applying granular fertiliser and four properties (Dysart, Sadowski, Driscol and Philp) that were applying fertiliser via fertigation were compared for soil and leaf nutrition status. This analysis is only for the period between July 1998 and January 2000 due to changes in management strategy for most of the properties in 2000.
11
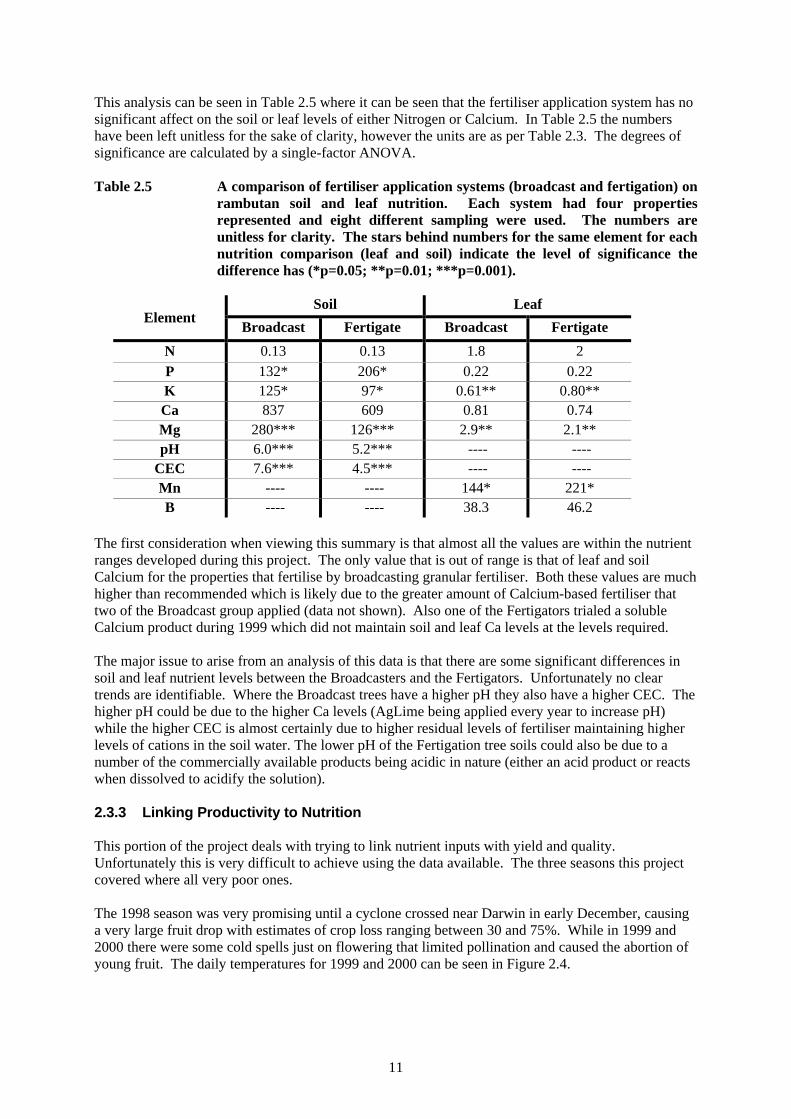
This analysis can be seen in Table 2.5 where it can be seen that the fertiliser application system has no significant affect on the soil or leaf levels of either Nitrogen or Calcium. In Table 2.5 the numbers have been left unitless for the sake of clarity, however the units are as per Table 2.3. The degrees of significance are calculated by a single-factor ANOVA. Table 2.5 A comparison of fertiliser application systems (broadcast and fertigation) on
rambutan soil and leaf nutrition. Each system had four properties represented and eight different sampling were used. The numbers are unitless for clarity. The stars behind numbers for the same element for each nutrition comparison (leaf and soil) indicate the level of significance the difference has (*p=0.05; **p=0.01; ***p=0.001).
Soil Leaf
Element Broadcast Fertigate Broadcast Fertigate N 0.13 0.13 1.8 2 P 132* 206* 0.22 0.22 K 125* 97* 0.61** 0.80** Ca 837 609 0.81 0.74 Mg 280*** 126*** 2.9** 2.1** pH 6.0*** 5.2*** ---- ----
CEC 7.6*** 4.5*** ---- ---- Mn ---- ---- 144* 221* B ---- ---- 38.3 46.2
The first consideration when viewing this summary is that almost all the values are within the nutrient ranges developed during this project. The only value that is out of range is that of leaf and soil Calcium for the properties that fertilise by broadcasting granular fertiliser. Both these values are much higher than recommended which is likely due to the greater amount of Calcium-based fertiliser that two of the Broadcast group applied (data not shown). Also one of the Fertigators trialed a soluble Calcium product during 1999 which did not maintain soil and leaf Ca levels at the levels required. The major issue to arise from an analysis of this data is that there are some significant differences in soil and leaf nutrient levels between the Broadcasters and the Fertigators. Unfortunately no clear trends are identifiable. Where the Broadcast trees have a higher pH they also have a higher CEC. The higher pH could be due to the higher Ca levels (AgLime being applied every year to increase pH) while the higher CEC is almost certainly due to higher residual levels of fertiliser maintaining higher levels of cations in the soil water. The lower pH of the Fertigation tree soils could also be due to a number of the commercially available products being acidic in nature (either an acid product or reacts when dissolved to acidify the solution). 2.3.3 Linking Productivity to Nutrition This portion of the project deals with trying to link nutrient inputs with yield and quality. Unfortunately this is very difficult to achieve using the data available. The three seasons this project covered where all very poor ones. The 1998 season was very promising until a cyclone crossed near Darwin in early December, causing a very large fruit drop with estimates of crop loss ranging between 30 and 75%. While in 1999 and 2000 there were some cold spells just on flowering that limited pollination and caused the abortion of young fruit. The daily temperatures for 1999 and 2000 can be seen in Figure 2.4.

12
0
5
10
15
20
25
30
35
40
45
1-Ju
l
8-Ju
l
15-J
ul
22-J
ul
29-J
ul
5-A
ug
12-A
ug
19-A
ug
26-A
ug
2-Se
p
9-Se
p
16-S
ep
23-S
ep
30-S
ep
7-O
ct
14-O
ct
21-O
ct
28-O
ct
4-N
ov
11-N
ov
18-N
ov
25-N
ov
Date
Tem
pera
ture
(C)
Hdoo 2000 Max Hdoo 2000 MinHdoo 1999 Max Hdoo 1999 Min
Figure 2.4 Daily maximum and minimum temperatures for Humpty Doo during the
flowering season for Rambutan in 1999 and 2000. The effect of cool temperatures and dry conditions are not fully understood in Rambutan and especially not for flowering. However Diczbalis and Menzel (1998) did report that temperatures below 15oC were not conducive to rambutan growth. Much anecdotal and informal analyses (Lim, 1999 (pers. comm)) of fruit drop and poor pollination have pointed to these conditions of low temperature and humidity as being critical. While Manakasem (1995) showed that low temperatures (< 23oC) induced flowering, the low temperatures found in this work, based in Thailand, rarely got below 20oC while there were a number of rain days. In the NT, the temperatures can get below 15oC and there is no rain during the flowering season. Manakasem (1995) provided a Multiple Linear Regression equation that predicted the percentage of flower induction in rambutan with minimum temperature, sunshine hours and rainfall. However only the affect of minimum temperature was significant (at p=0.05) even though the total R2
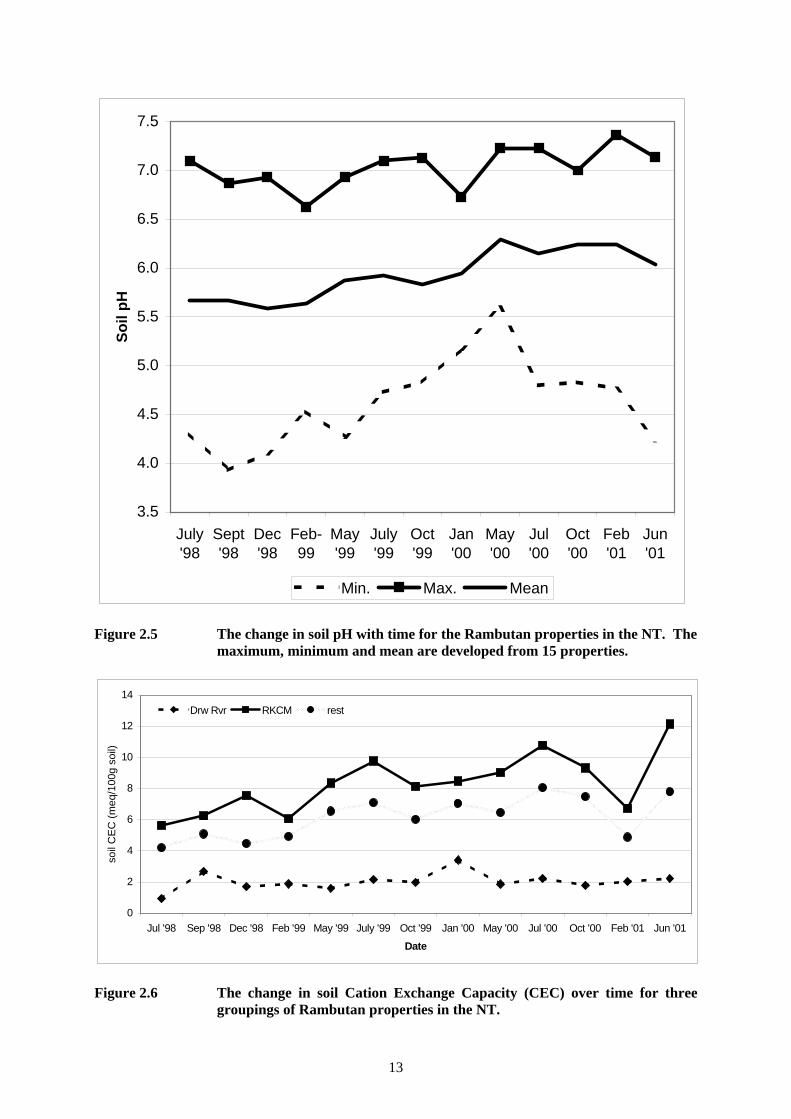
= 0.68, which was significant. This work needs further clarification. Even though it is almost impossible to draw linkages between inputs and yield there are still a number of results (in terms of factors of productivity) from the project that are clear. The main being that CEC and pH have improved. When the project started there were a number of properties with low pH and CEC. As the project has progressed and the growers have become familiar with the principles of nutrition management, most of them have taken it upon themselves to improve the soil and plant health in their orchards. This can be seen in Figure 2.5 where the mean soil pH increases with time for the 15 properties. In Figure 2.5 can also be seen the dramatic reduction in pH that can occur if care is not taken. That reduction in pH is due to one property in particular running into some management difficulties that required a degree of money that was not available at the time. This is an ever-present scenario in the Rambutan industry and especially when yields are down.
13
3.5
4.0
4.5
5.0
5.5
6.0
6.5
7.0
7.5
July'98
Sept'98
Dec'98
Feb-99
May'99
July'99
Oct'99
Jan'00
May'00
Jul'00
Oct'00
Feb'01
Jun'01
Soil
pH
Min. Max. Mean
Figure 2.5 The change in soil pH with time for the Rambutan properties in the NT. The
maximum, minimum and mean are developed from 15 properties.
0
2
4
6
8
10
12
14
Jul '98 Sep '98 Dec '98 Feb '99 May '99 July '99 Oct '99 Jan '00 May '00 Jul '00 Oct '00 Feb '01 Jun '01
Date
soil
CE
C (m
eq/1
00g
soil)
Drw Rvr RKCM rest
Figure 2.6 The change in soil Cation Exchange Capacity (CEC) over time for three
groupings of Rambutan properties in the NT.

14
In Figure 2.6 can be seen the change in soil Cation Exchange Capacity (CEC) for the three groupings of properties discussed earlier. In Figure 2.6 it can be clearly seen that while most CEC levels increase with time and attention (witness the reduction in late 2000 then dramatic increase in 2001) some (specifically the Darwin River group) do not change throughout the time of the project even though an increased level of care and management did occur on those properties. 2.4 Discussion and Conclusion The nutrition portion of this project has developed new, more detailed recommendations for Rambutan leaf and soul nutrition. Growers now have a recommended range to aim for rather than a single level as previously provided. These values could not be confirmed against actual yields, as the three seasons covered by this project were all poor for a variety of other (mainly environmental) reasons. However general soil and leaf health (as measured by nutrient levels and balance) were improved. A number of growers were looking for to record crops before those other factors intervened. This improvement was achieved through group discussions and one-to-one sessions. The growers were keen to be involved and openly discussed management practices. There were over twenty meetings with the grower group throughout the time of the project, which is something of a record for such a small group. This project also showed that there are no significant reasons that fertigation cannot be used instead of broadcast (of granular fertiliser) to provide rambutan with its nutrient requirements. However there was no clear advantage either, so any decision made can be more readily made using economic or time-restraint criteria rather than tree vigour or yield. The significant impact of the environment on this project showed yet again that not enough is known about the influence of the environment (and especially a harsh environment such as is found in the NT) on flowering and fruiting of rambutan. More work needs to be done in this area.
15
3. Irrigation Management 3.1 Introduction The rambutan (Nephelium lappaceum L.) is a large tropical tree that is a member of the Sapindaceae family along with Longan and Lychee. The rambutan is believed to be native to West Malaysia and the islands of Western Indonesia (van Welzen and Verheij, 1992; Watson, 1984). In SE Asia the rambutan is grown in large orchards but is still mainly a crop grown by family-based enterprises with little scientific input or management (van Welzen and Verheij, 1992). Irrigation is a necessary part of production in the wet-dry tropics. In the NT, the dry season (May to September) is the main period during which irrigation is required. Irrigation rates and frequency varies from orchard to orchard. The wet season (October to April) although reliable in terms of total rainfall, is still a period in which irrigation is required due to in-season variability (Mollah, 1986). There was a lack of knowledge of rambutan water requirements at various growth stages and climatic seasons. This gap was filled by the work of Diczbalis (1997) who developed an irrigation management strategy for rambutan production in the Darwin region. However this strategy is complicated and requires good management by growers especially around flowering and fruiting. If this management could be learnt then inputs would be lower and thus profitability increased. Delayed or poor flowering is of major concern to growers in the NT, who are able to exploit a market window which exists in November - December, prior to the onset of fruit availability in Queensland. Better control of flowering through improved irrigation management would greatly facilitate income stability for growers in the NT and Queensland. 3.2 Materials and Methods In 1998 a large proportion of the rambutan growers in the NT were requested to take part in this project. In total, 14 growers replied in the affirmative. These grower’s properties plus the Coastal Plains Horticulture Research Farm (CPHRF) (managed by the NT Department of Business, Industry and Resource Development) were all selected for the Nutrition portion of the project. A sub-group of 9 grower properties plus CPHRF were selected for the Irrigation portion of the project. In Table 3.1 can be seen the name, location and involvement of the properties. On each property three trees of the same variety, age and vigour were selected to be the representative trees. At each of these trees (that were not always the same trees as those sampled for soil and leaf nutrition) the soil water was monitored by a bank (20/40/80cm) of tensiometers, a (100cm) Diviner Probe (Sentek, Adelaide, Australia) site and a (70cm) Gopher Probe site. The sites at each tree were positioned approx. 100cm from both the tree trunk and the sprinkler head.

16
Table 3.1 List of participating NT Rambutan growers with their property location and level of involvement in the project.
Grower Location Nutrition Trial Irrigation Monitoring Dysart Colton Park Yes Yes Doyle Humpty Doo Yes Yes
Sadowski Humpty Doo Yes Yes Driscol Humpty Doo Yes Yes West Darwin River Yes No Philp Berry Springs Yes Yes
Kimbacher Darwin River Yes Yes Eupene Bees Creek Yes Yes
Blackburn Howard Springs Yes No Poffley Humpty Doo Yes Yes Jettner Howard Springs Yes No
Karlson McMinns Lagoon Yes No Clausen McMinns Lagoon Yes Yes Davey Humpty Doo Yes No
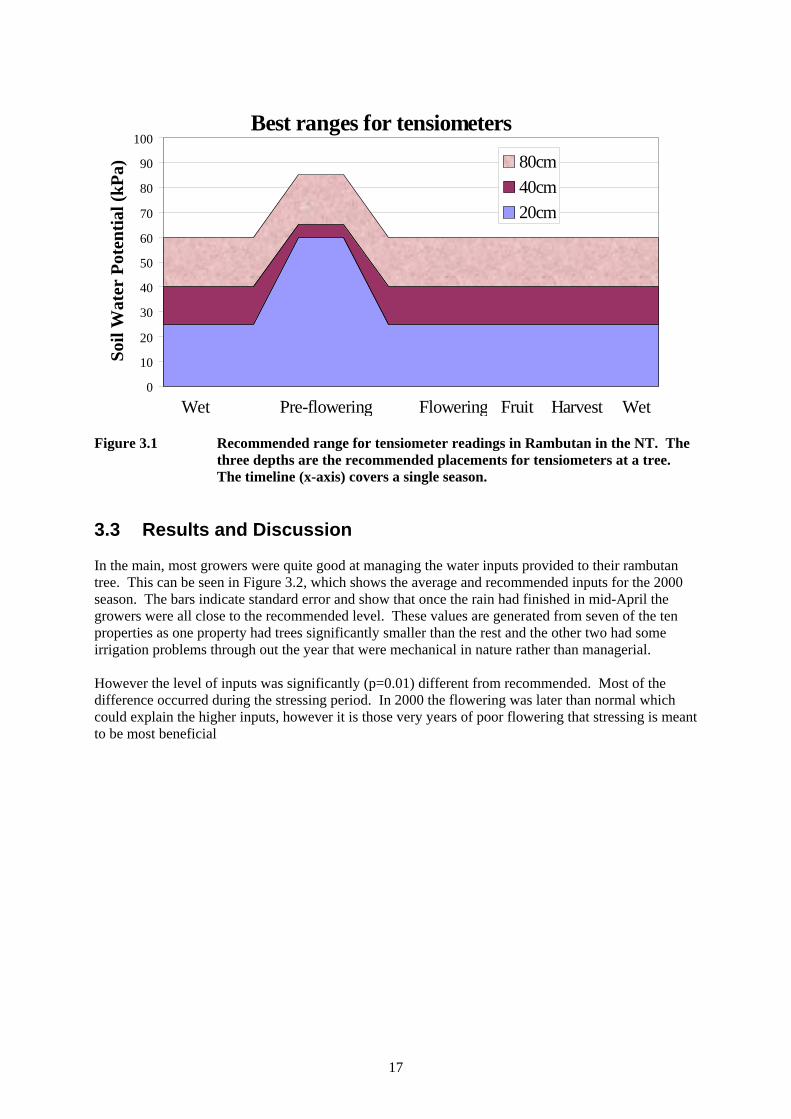
CPHRF Middle Point Yes Yes At most of the properties a Tinytalk II (Gemini dataloggers, USA) Temperature and Relative Humidity logger was installed in a small Stevenson screen and placed in the tree. At the same properties a rain gauge was placed in a clear area with no trees near for at least 10m. The properties that did not have a logger or rain gauge were those of Driscoll and Sadowski as the Doyle property was within 100m of both of them and so much taken to be indicative for all three properties (Doyle, Sadowski and Driscoll). All ten properties were visited once per week. At each visit the tensiometers were read and the Diviner and Gopher probes used and the rain gauge read. Each monitor tree was also visually assessed for gross phenological behaviour (Flushing, Mature/Resting, Flowering, Fruiting). The Tinytalk II loggers were downloaded fortnightly. At each property the latest soil water readings were related to the grower. Wherever possible, the farmer accompanied the researcher during the data collection and was introduced to the mechanics and theory of reading soil water. During this exercise the grower is constantly referred back to the recommended ranges for tensiometer reading throughout the season. These ranges are displayed graphically in Figure 3.1 where it can be seen that at all three tensiometer depths (20, 40 and 80cm) the tensions increase pre-flowering as water stress is used to encourage flowering. These values were developed by Diczbalis (1997).
17
Best ranges for tensiometers
0
10
20
30
40
50
60
70
80
90
100So
il W
ater
Pot
entia
l (kP
a) 80cm40cm20cm
Wet WetPre-flowering Flowering Fruit Harvest
Figure 3.1 Recommended range for tensiometer readings in Rambutan in the NT. The three depths are the recommended placements for tensiometers at a tree. The timeline (x-axis) covers a single season.
3.3 Results and Discussion In the main, most growers were quite good at managing the water inputs provided to their rambutan tree. This can be seen in Figure 3.2, which shows the average and recommended inputs for the 2000 season. The bars indicate standard error and show that once the rain had finished in mid-April the growers were all close to the recommended level. These values are generated from seven of the ten properties as one property had trees significantly smaller than the rest and the other two had some irrigation problems through out the year that were mechanical in nature rather than managerial. However the level of inputs was significantly (p=0.01) different from recommended. Most of the difference occurred during the stressing period. In 2000 the flowering was later than normal which could explain the higher inputs, however it is those very years of poor flowering that stressing is meant to be most beneficial
18
0
20
40
60
80
100
120
140
160
180
5-Jan
19-Ja
n2-F
eb
16-Feb
1-Mar
15-M
ar
29-M
ar
12-A
pr
26-A
pr
10-M
ay
24-M
ay7-J
un21
-Jun
5-Jul
19-Ju
l2-A
ug
16-A
ug
30-A
ug
13-Sep
27-Sep
11-O
ct
25-O
ct8-N
ov
22-N
ov6-D
ec
Date
Wat
er In
puts
(mm
/tree
/wee
k)
Average Recom.
Figure 3.2 Mean water inputs in the 2000 season from seven rambutan properties in the
NT along with the recommended input. The bars indicate sem. This variation from the recommended level is even better seen in Figure 3.3, which displays the maximum and minimum inputs in the 2000 season. While this figure is mainly artificial in that it does not track any single property or displays means, it does show the extremes of water input. What is exceptionally worrying is the very low levels seen during fruitset and filling when the trees are most sensitive to water stress. Given that Figure 3.3 is partially artificial, Figure 3.4 has been provided to display the inputs and tensiometer readings from one property. The data for the 1999 and 2000 season are shown with water inputs and the soil water tension from the tensiometer placed at 40cm. Which is towards the bottom end of the average rambutan root system (Diczbalis, 1997). This property was atypical in its management with some high soil tensions being seen at 40cm during fruitfilling in September and October. These tensions are due to insufficient water reaching that depth. This can either be due to high intake by shallower roots or by low water inputs. In this case the reason is low inputs, as the grower does not increase the level of irrigation to that recommended. The high tensions in June/July are when the tree is being deliberately stressed to encourage flowering.
19
0
50
100
150
200
250
5-Jan
19-Ja
n2-F
eb
16-Feb
1-Mar
15-M
ar
29-M
ar
12-A
pr
26-A
pr
10-M
ay
24-M
ay7-J
un21
-Jun
5-Jul
19-Ju
l2-A
ug
16-A
ug
30-A
ug
13-Sep
27-Sep
11-O
ct
25-O
ct8-N
ov
22-N
ov6-D
ec
Date
Wat
er In
put (
mm
/tree
/wee
k)
Max Min Recom.
Figure 3.3 Maximum and minimum water inputs in the 2000 season from seven
rambutan properties in the NT along with the recommended input.
0
50
100
150
200
250
2-Mar-
99
31-M
ar-99
23-A
pr-99
13-M
ay-99
2-Jun
-99
22-Ju
n-99
13-Ju
l-99
3-Aug
-99
24-A
ug-99
14-S
ep-99
6-Oct-
99
26-O
ct-99
16-N
ov-99
7-Dec
-99
29-D
ec-99
25-Ja
n-00
22-F
eb-00
15-M
ar-00
4-Apr-
00
27-A
pr-00
17-M
ay-00
7-Jun
-00
27-Ju
n-00
24-Ju
l-00
23-A
ug-00
19-S
ep-00
10-O
ct-00
31-O
ct-00
20-N
ov-00
13-D
ec-00
10-Ja
n-01
29-Ja
n-01
Date
Wat
er In
puts
(mm
/tree
/wee
k)
0
10
20
30
40
50
60
70
80
90
100
Soil
Wat
er P
oten
tial (
kPa)
Water40cm Tens
Figure 3.4 Water inputs and the Soil Water Potential at 40cm depth for one rambutan
property in the 1999 and 2000 season.
20
This can be even better seen in Figure 3.5 which shows the soil water tensions at 20, 40 and 80cm for the same property (as shown in Figure 3.4) for the 1999 and 2000 seasons. In Figure 3.5 can be seen that in September and October when the 40cm tensions are high the 20cm tensions are still relatively low. This indicates are barely adequate level of irrigation. It can also be seen that in June when the trees are being deliberately stressed, the soil water tension at 20cm does not rise as high as recommended.
0
10
20
30
40
50
60
70
80
Mar-99
Apr-99
May-99
Jun-99
Jul-99
Aug-99
Sep-99
Oct-99
Nov-99
Dec-99
Jan-00
Feb-00
Mar-00
Apr-00
May-00
Jun-00
Jul-00
Aug-00
Sep-00
Oct-00
Nov-00
Dec-00
Jan-01
Date
Soil
Wat
er P
oten
tial (
kPa)
20cm 40cm 80cm
Figure 3.5 Soil Water Potential at 20, 40 and 80cm depths for one rambutan property
in the 1999 and 2000 season. 3.4 Discussion and Conclusion This portion of the project was designed more as an extension exercise than a strict scientific investigation. As such a detailed analysis is not appropriate to the data collected however future analysis may generate some new recommendations for Irrigation Management. The tardiness in increasing flowering once flowering commenced in August is troubling. A large fruit drop occurs every year in the NT rambutan industry mainly due to the hot, dry climate encountered during fruitfilling but this poor irrigation management may be contributing to this problem. The example displayed in Figures 3.4 and 3.5 is atypical. It was seen in Figure 3.2 that most of the properties maintain water inputs near recommended. However even this atypical example has an excellent result – through the training and example of this project, seven growers now own and operate a tensiometer system. The grower used in the example is one of those who have taken up this technology and management system.
21
4. Conclusion and Recommendations 4.1 Rambutan Nutrition The major conclusion to come from the Rambutan Nutrition study is that a new range of leaf and soil nutrition standards has been developed. These standards have yet to be proven but they do provide the rambutan growers of the Northern Territory finally some clear guidelines for fertiliser application. To proof these new standards it is recommended that follow up surveys of growers should be conducted. Further matching of fertiliser inputs to yield and quality should be attempted. This is an exercise probably best handled by the growers themselves in consultation with the Horticultural Extension staff of the NT Department of Business, Industry and Resource Development. There were two main issues restricting the linkage of fertiliser inputs with productivity. The first was the limited access to farm diaries. This issue is completed outweighed however by the poor seasons seen during the length of this project. There appeared to be some very strong negative impacts of climate upon flowering and fruit retention. While one season was ruined by a cyclone during harvest, this is a recognised risk of fruit production in the Darwin region. The other two seasons were hit by first cold then hot and dry conditions. Both these climatic conditions appear to limit pollination and cause increased fruit abortion. However most of the data supporting this hypothesis is anecdotal. A great deal more work needs to be done on linking environmental constraints to rambutan production in the NT. This has been recognised for some time but little work has been conducted in the NT. There is some work currently being conducted in Queensland that may provide guidance to the NT growers. However, ultimately this work must also be conducted in the NT, as the climate is less beneficial to rambutan production compared to the climate in North Queensland. The study into Fertigation versus Broadcast for the application of fertiliser proved inconclusive. It has been recommended that any decision to use one strategy or another is best based on economic and management principles. 4.2 Rambutan Irrigation Management The Irrigation management study was mainly an extension exercise. The main finding was that while growers were applying water to the rambutan trees in approximately the right amount, there was a significant difference from the recommended rates. In some cases this difference was due to poor irrigation systems but in others it was due to poor management. However the whole point of the exercise was to educate the growers through example and demonstration. This approach appears to be successful as seven of the growers have commenced monitoring water inputs and soil water levels using some of the equipment demonstrated to them during the project. It was found that the weekly visits to properties with a short conversation and practical session with the grower was a successful method for encouraging uptake of this technology and practice. Any further work in this area is best conducted by the growers themselves in consultation with the Horticultural Extension staff of the NT Department of Business, Industry and Resource Development.

22
A final conclusion of this project is that cultivating an open air of discussion and discovery amongst the growers was an excellent method of developing new strategies and facilitating the uptake of new technologies.
23
5. References ASEAN (1982). The ASEAN compendium of climatic statistics. ASEAN sub-committee on climatology, ASEAN committee on Science and Technology, Indonesia. Beverly, R.B. (1987). Modified DRIS method for simplified nutrient diagnosis of ‘Valancia’ oranges. Journal of Plant Nutrition, 10(9-16), 1401-1408. Bolland, M. and Gilkes, R.J. (1998) The Chemistry and Agronomic Effectiveness of Phosphate Fertilizers. in Nutrient Use in Crop Production. (Ed) Zdenko Rengel. Food Products Press, New York. Bureau of Meteorology (1993). Tabulation of climatic averages and extremes - Darwin. Commonwealth of Australia. Diczbalis, Y. (1997). Environmental Factors influencing the growth and yield of rambutan and cupuacu. (Final Report Project DNT-10A). Rural Industries Research and Development Corporation, Canberra , Australia. Diczbalis, Y. and Menzel, C.M. (1998). Low Temperatures decrease CO2 assimilation and growth in the tropical rambutan. Journal of Horticultural Science and Biotechnology, 73 (2), 65-71. DPIF (1991). Northern Territory Primary Industry and Fisheries Statistics 1989-90. NT Department of Primary Industry and Fisheries, Technical Bulletin No. 168. Hobman, F.R. (1984). Preliminary assessment of rambutan clones in Australia. Queensland Journal of Agriculture and Animal Science, Vol. 41 : 115-119. Kawaljenko, V. (2002). Principal Chemist, NT Dept. Business, Industry and Resource Development. Lam, P.F. and Tongumpai P. (1987). Pre-harvest factors affecting post-harvest quality of rambutan in Rambutan : Fruit development, post harvest physiology and marketing in ASEAN. Editor : P.F. Lam and S. Kosiyachinda. ASEAN Food Handling Bureau, Kuala Lumpur. Malaysia. Lim, T.K., and Diczbalis, Y. (1995). Rambutans in: Horticulture Australia. Morescope Publishing. Lim, T.K., Luders, L. and Poffley. M. (1997). Rambutan Nutrient Requirement and Management. Northern Territory Department of Primary Industry and Fisheries, Darwin, Australia. Manakasem, Y. (1995). Changes in apices and effect of microclimate on floral initiation of rambutan (Nephelium lappaceum L.). Suranee Journal of Science and Technology, 2, 81-87. Menzel, C.M., Rasmussen, T.S. and Simpson, D.R. (1989). Effects of temperature and leaf water stress on growth and flowering of litchi (Litchi chinensis Sonn.). Journal of Horticultural Science, 64:739-752. Mollah, W. (1986). Rainfall variability in the Katherine-Darwin Region of the Northern Territory and some implications for cropping. The Journal of the Australian Institute of Agricultural Science, 52 : 28-36. Nakata, S. and Watanabe, Y. (1966). Effect of photoperiod and night temperature on the flowering of Litchie chinensis. Botanical Gazette, 127, 146-152. Ngo, H.T. (1996). Economic assessment of rambutan production in the Northern Territory. NT Department of Primary Industry and Fisheries. Technical Bulletin no. 251.

24
Ngo, H.T. and Baker, I.W. (1990). Rambutan production in the NT Top End : An agronomic and economic evaluation. NT Department of Primary Industry and Fisheries, Technical Bulletin No. 152. Parent, L.E. and Granger, R.L. (1989). Derivation of DRIS Norms from a high-density apple orchard established in the Quebec Appalachian Mountains. Journal of the American Society of Horticultural Science, 114(6), 915-919. Schaffer, B., Larson, K.D., Snyder, G.H. and Sanchez, C.A. (1988). Identification of mineral deficiencies associated with mango decline by DRIS. HortScience, 23(3), 617-619. Sumner, M. (1986). Diagnosis and Recommendation Integrated System (DRIS) as a guide to orchard fertilisation. Food and Fertilizer Technology Center, Taipei City, Taiwan. Tatt, O.H. (1976). Climatic changes in water balance and their effects on tropical flowering. Planter, Kuala Lumpur, 52, 174-179. USDA (1979). Cultivation of neglected tropical fruits with promise. Part 6. The Rambutan. US Department of Agriculture Science and Education Administration Van Welzen, P.C. and Verheij, E.W.M.(1992). Nephelium lappaceum L. in Plant Resources of SouthEast Asia - No. 2: Edible fruits and nuts. Verheij, E.W.M. and Coronal, R.E. (Editors). Prosea, Bogor, Indonesia. Watson, B.J. (1984). Rambutan (Nephelium lappaceum) in Tropical tree fruits for Australia. Editor : P.E. Page. Horticulture Branch, Queensland Department of Primary Industry. Watson, B.J. (1988). Rambutan cultivars in North Queensland. Queensland Agricultural Journal. Jan-Feb 1988. Yaacob, O. and Subhadrabanhu, S. (1995). The Production of Economic Fruits in South-Easy Asia. Oxford University Press, Kuala Lumpur, Malaysia.
25
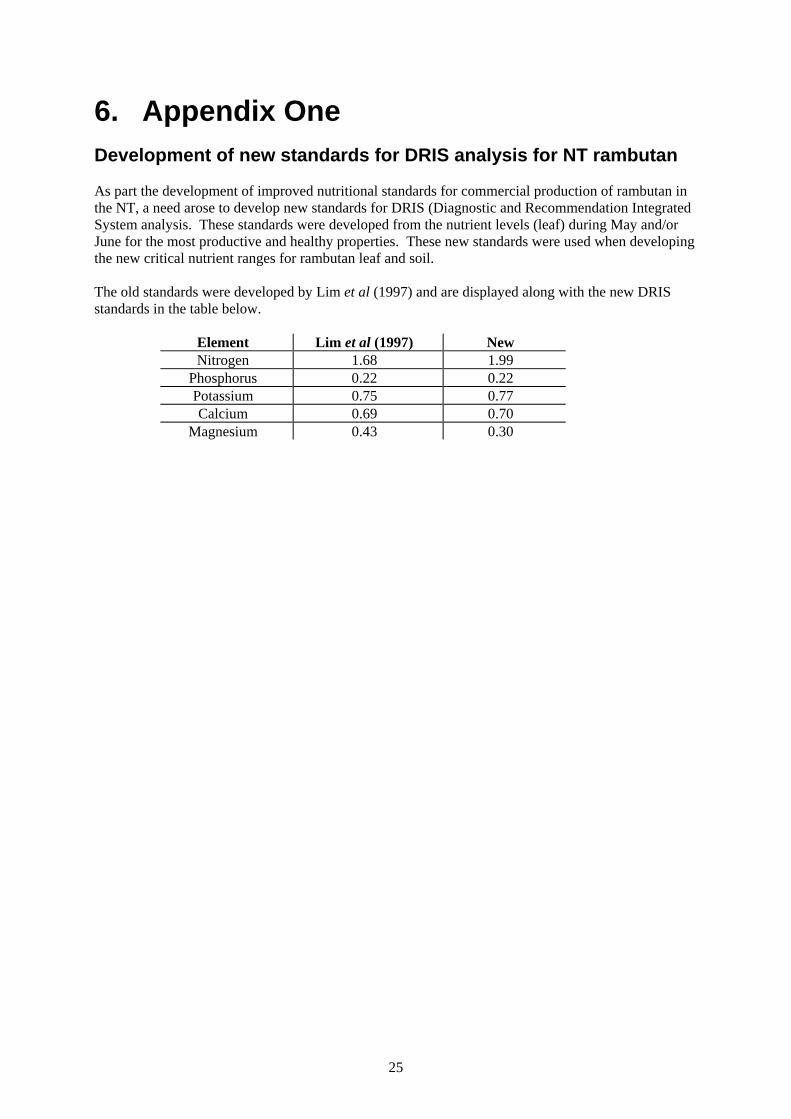
6. Appendix One Development of new standards for DRIS analysis for NT rambutan As part the development of improved nutritional standards for commercial production of rambutan in the NT, a need arose to develop new standards for DRIS (Diagnostic and Recommendation Integrated System analysis. These standards were developed from the nutrient levels (leaf) during May and/or June for the most productive and healthy properties. These new standards were used when developing the new critical nutrient ranges for rambutan leaf and soil. The old standards were developed by Lim et al (1997) and are displayed along with the new DRIS standards in the table below.
Element Lim et al (1997) New Nitrogen 1.68 1.99
Phosphorus 0.22 0.22 Potassium 0.75 0.77 Calcium 0.69 0.70
Magnesium 0.43 0.30