dna electronic supplementary information (esi) …spectrometer (applied photophysics ltd, surrey,...
TRANSCRIPT
Electronic Supplementary Information (ESI)
Neutral red as a specific light-up fluorescent probe for i-motif
DNA
Lijun Xu,ab Jine Wang,a Na Sun,a Min Liu,a Yi Cao,a Zhili Wanga and Renjun Peia
a. Key Laboratory of Nano-Bio Interface, Division of Nanobiomedicine, Suzhou Institute of Nano-Tech and Nano-
Bionics, Chinese Academy of Sciences, Suzhou 215123, China
b. University of Chinese Academy of Sciences, Beijing 100049, China
E-mail: [email protected]
ReagentsDNA oligomers were bought from Genewiz (Suzhou, China). The DNA samples were
dissolved in ultrapure water, and the concentrations were accurately quantified by 260 nm UV absorbance before using. Neutral red hydrochloride and other chemical reagents were purchased from Sinopharm Chemical Reagent Co. Ltd. (Shanghai, China). 10 mM PB (Na2HPO4/KH2PO4) buffer was used in the experiment, if not particularly indicated. Instruments and methods
F-4600 fluorescence spectrometer (Hitachi, Tokyo, Japan) was utilized to record the fluorescence spectra of neutral red. The excitation wavelength was fixed at 550 nm and fluorescence emission spectra were collected from 570 to 750 nm. The absorption spectra of neutral red were recorded on a Lambda 25 spectrometer (PerkinElmer, Singapore) from 365 to 670 nm. The CD spectra of DNA were collected by a Chirascan-plus Circular Dichroism Spectrometer (Applied Photophysics Ltd, Surrey, UK). Three scans from 210 to 320 at 1 nm intervals were accumulated and averaged. Calorimetric titration experiments were performed at 25 ℃ on a MicroCal ITC200 apparatus (Northampton, MA, USA).Melting temperature determination
Melting temperature experiments were performed in 10 mM PB buffer (pH 6.0) using a Lambda 25 spectrometer. For each temperature, the absorbance of hTeloC in the absence and presence of neutral red (15 μM) was measured at 245, 260, 295 and 405 nm (the control wavelength) using 1 cm path length cells, respectively. The temperature was controlled with a PTP-6 Peltier System and LabTech H35W. The net absorbance at 245 nm was obtained by subtracting the absorbance at 405 nm. The 245 nm melting profiles were obtained by plotting the net absorbance at 245 nm versus temperature. Melting temperatures were calculated by fitting logistic equation using the Origin 8.0 software.Binding constant (Ka) calculation
The data from the fluorescence titration assay were modelled by nonlinear curve fitting to the equation below.
Electronic Supplementary Material (ESI) for ChemComm.This journal is © The Royal Society of Chemistry 2016
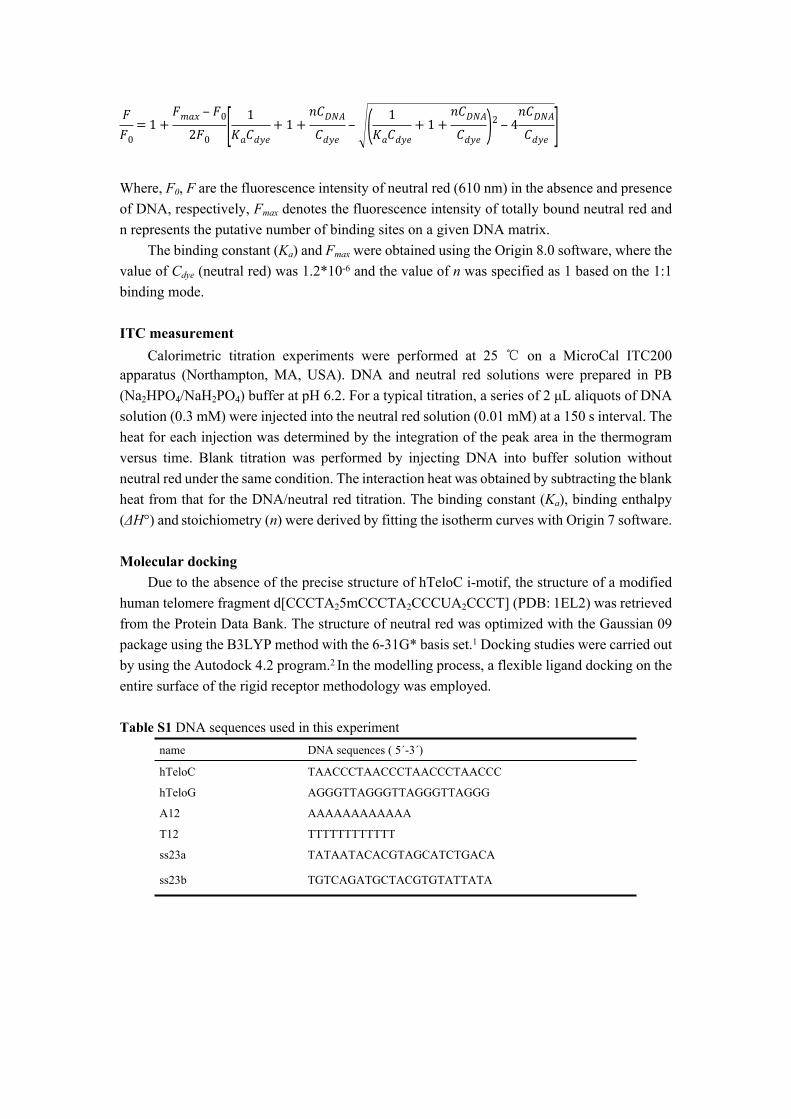
𝐹𝐹0= 1 +
𝐹𝑚𝑎𝑥 ‒ 𝐹02𝐹0 [ 1
𝐾𝑎𝐶𝑑𝑦𝑒+ 1 +
𝑛𝐶𝐷𝑁𝐴𝐶𝑑𝑦𝑒
‒ ( 1𝐾𝑎𝐶𝑑𝑦𝑒
+ 1 +𝑛𝐶𝐷𝑁𝐴𝐶𝑑𝑦𝑒 )2 ‒ 4
𝑛𝐶𝐷𝑁𝐴𝐶𝑑𝑦𝑒 ]
Where, F0, F are the fluorescence intensity of neutral red (610 nm) in the absence and presence of DNA, respectively, Fmax denotes the fluorescence intensity of totally bound neutral red and n represents the putative number of binding sites on a given DNA matrix.
The binding constant (Ka) and Fmax were obtained using the Origin 8.0 software, where the value of Cdye (neutral red) was 1.2*10-6 and the value of n was specified as 1 based on the 1:1 binding mode.
ITC measurementCalorimetric titration experiments were performed at 25 ℃ on a MicroCal ITC200
apparatus (Northampton, MA, USA). DNA and neutral red solutions were prepared in PB (Na2HPO4/NaH2PO4) buffer at pH 6.2. For a typical titration, a series of 2 μL aliquots of DNA solution (0.3 mM) were injected into the neutral red solution (0.01 mM) at a 150 s interval. The heat for each injection was determined by the integration of the peak area in the thermogram versus time. Blank titration was performed by injecting DNA into buffer solution without neutral red under the same condition. The interaction heat was obtained by subtracting the blank heat from that for the DNA/neutral red titration. The binding constant (Ka), binding enthalpy (ΔH°) and stoichiometry (n) were derived by fitting the isotherm curves with Origin 7 software.
Molecular dockingDue to the absence of the precise structure of hTeloC i-motif, the structure of a modified
human telomere fragment d[CCCTA25mCCCTA2CCCUA2CCCT] (PDB: 1EL2) was retrieved from the Protein Data Bank. The structure of neutral red was optimized with the Gaussian 09 package using the B3LYP method with the 6-31G* basis set.1 Docking studies were carried out by using the Autodock 4.2 program.2 In the modelling process, a flexible ligand docking on the entire surface of the rigid receptor methodology was employed.
Table S1 DNA sequences used in this experimentname DNA sequences ( 5´-3´)
hTeloC TAACCCTAACCCTAACCCTAACCC
hTeloG AGGGTTAGGGTTAGGGTTAGGG
A12 AAAAAAAAAAAA
T12 TTTTTTTTTTTT
ss23a TATAATACACGTAGCATCTGACA
ss23b TGTCAGATGCTACGTGTATTATA

Figure S1 Fluorescence spectra of neutral red (1.2 μM) at different pH values.
Figure S2 The linear relationship between pH and fluorescence intensity of neutral red (1.2 μM) with hTeloC (2
μM) at 610 nm.

Figure S3 Circular dichroism (CD) spectra of hTeloC (2 μM) at different pH values in the absence (A) and presence
of neutral red (3.6 μM). (C) Ellipticity of hTeloC (2 μM) at 290 nm at different pH values.
Figure S4 CD spectra recorded for hTeloC DNA (2 μM) with different concentrations of neutral red.

Figure S5 UV melting profiles at 245 nm for hTeloC DNA (3 μM) in the absence (A) and presence (B) of neutral
red (15 μM).
Figure S6 (A) pH dependence of absorption spectra of neutral red (3 μM). (B) Absorbance spectra of neutral red (2
μM) at pH 6.2 upon addition of hTeloC (0-10 μM).
Figure S7 (A) Absorption spectra and fluorescence excition spectra of neutral red (2 μM) in the absence and presence
of hTeloC DNA (30 μM) at pH 8.0. (B) Absorption spectra and fluorescence excition spectra of neutral red (2 μM)
in the absence and presence of hTeloC DNA (10 μM) at pH 6.2.

Figure S8 Job's plots (from fluorescence measurements at 610 nm) for mixtures of NR with hTeloC i-motif. The
total concentration c(NR) + c(hTeloC) = 5 µM.
Figure S9 Fluorescence spectra of neutral red (1.2 μM) at pH 6.2 (A) and pH 8.0 (B) upon addition of hTeloC (0-
30 μM).
Figure S10 (A) Fluorescence intensity of neutral red (1.2 μM) at 610 nm in 10 mM PB buffer (pH 8.0) with different
amounts of hTeloC (■), hTeloG (●), A12 (▲), T12 (▼), single-stranded DNA ss23a (◆) and duplex DNA ds23
(★). (B) Fluorescence spectra of neutral red (1.2 μM) at pH 8.0 upon the addition of hTeloG (0-30 μM).

Figure S11 ITC profiles of 10 μM neutral red in 10 mM PB buffer (pH 6.2) at 25℃. Panel (A): Heat burst curves from titration of hTeloC i-motif into a solution of neutral red. Panel (B): Plots of heat derived by subtracting the
corresponding dilution heats derived from control titrations of the i-motif into buffer without neutral red versus molar
ratio of i-motif to neutral red via a model for one-site fitting.
Figure S12 Energy optimized geometry for neutral red using B3LYP/6-31G basis set in Gaussian 09.1

Figure S13 (A) Stereostructure showing the groove binding mode of the motif for neutral red. (B) Surface contour
depicting the binding locus (neutral red shown in sticks).
References
1. M. J. Frisch, G. W. Trucks, H. B. Schlegel, G. E. Scuseria, M. A. Robb, J. R. Cheeseman, G. Scalmani, V.
Barone, B. Mennucci, G. A. Petersson, H. Nakatsuji, M. Caricato, X. Li, H. P. Hratchian, A. F. Izmaylov, J.
Bloino, G. Zheng, J. L. Sonnenberg, M. Hada, M. Ehara, K. Toyota, R. Fukuda, J. Hasegawa, M. Ishida, T.
Nakajima, Y. Honda, O. Kitao, H. Nakai, T. Vreven, J. A. Montgomery, Jr., J. E. Peralta, F. Ogliaro, M.
Bearpark, J. J. Heyd, E. Brothers, K. N. Kudin, V. N. Staroverov, R. Kobayashi, J. Normand, K. Raghavachari,
A. Rendell, J. C. Burant, S. S. Iyengar, J. Tomasi, M. Cossi, N. Rega, J. M. Millam, M. Klene, J. E. Knox, J.
B. Cross, V. Bakken, C. Adamo, J. Jaramillo, R. Gomperts, R. E. Stratmann, O. Yazyev, A. J. Austin, R.
Cammi, C. Pomelli, J. W. Ochterski, R. L. Martin, K. Morokuma, V. G. Zakrzewski, G. A. Voth, P. Salvador,
J. J. Dannenberg, S. Dapprich, A. D. Daniels, Ö. Farkas, J. B. Foresman, J. V. Ortiz, J. Cioslowski, and D. J.
Fox, Gaussian, Inc., Wallingford CT, 2009.
2. G. M. Morris, R. Huey, W. Lindstrom, M. F. Sanner, R. K. Belew, D. S. Goodsell, and A. J. Olson (2009)
Autodock4 and AutoDockTools4: automated docking with selective receptor flexiblity. J. Computational
Chemistry 2009, 16, 2785-2791.