dna analysis of lcn samples: towards fully integrated str ... · nij forensic dna r&d nij...
TRANSCRIPT

The author(s) shown below used Federal funds provided by the U.S. Department of Justice and prepared the following final report: Document Title: DNA Analysis of LCN Samples: Towards Fully
Integrated STR Profiling
Author(s): Eugene Tan
Document No.: 242180 Date Received: May 2013 Award Number: 2009-DN-BX-K256 This report has not been published by the U.S. Department of Justice. To provide better customer service, NCJRS has made this Federally-funded grant report available electronically.
Opinions or points of view expressed are those of the author(s) and do not necessarily reflect
the official position or policies of the U.S. Department of Justice.

NIJ Forensic DNA R&D NIJ 2009-DN-BX-K256 DNA Analysis of LCN Samples
October 28, 2011 Dr. Eugene Tan, NetBio
FINAL REPORT
Federal Agency: National Institute of Justice
Federal Grant: 2009-DN-BX-K256
Project Title: DNA Analysis of LCN Samples: Towards Fully Integrated STR
Profiling
Principal Investigator: Eugene Tan, VP of Product Development
Submitting Officer: Susan O’Keefe, VP of Finance and Operations
Submission Date: October 28, 2011
Recipient Organization: NetBio Inc.
830 Winter Street, Waltham, MA 02451
Project/Grant Period: 1 December 2010 – 30 June 2011
Signature of Submitting Official:
This document is a research report submitted to the U.S. Department of Justice. This report has not been published by the Department. Opinions or points of view expressed are those of the author(s)
and do not necessarily reflect the official position or policies of the U.S. Department of Justice.

NIJ Forensic DNA R&D NIJ 2009-DN-BX-K256 DNA Analysis of LCN Samples
October 28, 2011 Dr. Eugene Tan, NetBio
EXECUTIVE SUMMARY The goal of this research was to develop two microfluidic components for the analysis of
low copy number (LCN) samples, a post-PCR cleanup component and an optimized
electrophoretic injection component. The components were designed such that they can be
incorporated into a fully-integrated microfluidic system for STR analysis currently in
development. The work consisted of the following tasks:
1. Selection of post-‐PCR cleanup methodology and biochip design and testing
PCR cleanup methodologies were evaluated and a membrane filtration approach was
selected. Two filter membrane materials over a range of filter pore sizes were evaluated, and
single sample biochips for microfluidic cleanup were designed and fabricated. Microfluidic
biochip cleanup showed 6- to 8-fold increase in signal strength compared with untreated
samples. This improvement allowed additional alleles to be called from LCN samples. In
addition, these results showed that NetBio’s DNA purification, thermal cycling, and separation
and detection modules are effective with LCN templates and that the microfluidic UF process is
compatible with these modules.
2. Optimization of injection protocol
Optimized injection protocols (the optimal amount of cleaned PCR sample for separation
and detection and the optimal electrophoretic conditions) were developed. Experiments showed
that injection efficiency increased as the amount of purified PCR product applied to microfluidic
separation and detection was increased. An increase in injection efficiency of 2- to 3-fold was
achieved by allowing the entire PCR product to be loaded for microfluidic separation and
detection. Experiments to optimize the electrophoretic injection parameters showed that an
injection time of 90 seconds and an injection voltage of 175 V were optimal. Furthermore, an
assessment of the dynamic range of Genebench (the microfluidic separation and detection
module of NetBio’s fully-integrated system) with the optimal injection conditions showed that it
can detect PCR samples amplified with 0.006 ng of DNA template (a single human genome
equivalent) and of greater than 10 ng of DNA template without saturating. Taken together, these
results demonstrate the potential of the optimized injection protocol for analyzing LCN samples.
This document is a research report submitted to the U.S. Department of Justice. This report has not been published by the Department. Opinions or points of view expressed are those of the author(s)
and do not necessarily reflect the official position or policies of the U.S. Department of Justice.

NIJ Forensic DNA R&D NIJ 2009-DN-BX-K256 DNA Analysis of LCN Samples
October 28, 2011 Dr. Eugene Tan, NetBio
3. Testing of the LCN profiling system with forensically relevant samples
LCN blood, saliva and buccal cell samples (0.025 ng of DNA template) were analyzed.
These samples were generated to simulate sample types that are commonly collected from
homicide and sexual assault crime scenes. Testing of these samples using microfluidic biochips
and protocols for DNA purification, rapid amplification, ultrafiltration cleanup, and separation
and detection was performed. These results showed that the use of the ultrafiltration cleanup in
tandem with the optimized injection protocols allowed up to 90% of the alleles from a 0.025 ng
template sample to be unambiguously detected. Amplification of LCN templates showed the
presence of allele drop-outs and drop-ins, highlighting the care that must be taken when
interpreting LCN samples. Furthermore, the use of biochip-based technologies show the
potential for integrating these finding in a fully integrated biochip for sample-in to result-out low
copy number analysis.
This document is a research report submitted to the U.S. Department of Justice. This report has not been published by the Department. Opinions or points of view expressed are those of the author(s)
and do not necessarily reflect the official position or policies of the U.S. Department of Justice.

NIJ Forensic DNA R&D NIJ 2009-DN-BX-K256 DNA Analysis of LCN Samples
October 28, 2011 Dr. Eugene Tan, NetBio
Table of Contents EXECUTIVE SUMMARY ................................................................................................. 2
1. Selection of post-PCR cleanup methodology and biochip design and testing ............ 2
2. Optimization of injection protocol .............................................................................. 2
3. Testing of the LCN profiling system with forensically relevant samples ................... 3
INTRODUCTION ............................................................................................................... 5
Goals and objectives ........................................................................................................ 5
Review of Relevant Literature ......................................................................................... 5
Introduction to LCN Analysis. .................................................................................... 5
Technology to Improve LCN Analysis. ...................................................................... 8
NetBio’s Approach to Fully-Integrated STR Analysis. ............................................ 10
OVERVIEW OF RESERCH PLAN ................................................................................. 19
METHODS ........................................................................................................................ 19
Forensically relevant and reference samples ................................................................. 19
Vortex Extraction of DNA from Swabs. ....................................................................... 20
Microfluidic Biochip Purification. ................................................................................ 20
DNA Quantitation and Serial Dilution. ......................................................................... 21
STR Amplification Reaction. ........................................................................................ 21
Microfluidic Biochip Ultrafiltration (UF) ..................................................................... 21
RESULTS .......................................................................................................................... 22
Task 1: Selection of post-PCR cleanup methodology and biochip design and testing.22
Task 2: Optimization of injection protocol ................................................................... 32
Task 3: Testing of the microfluidic cleanup and optimized injection protocol on
forensically relevant samples. ................................................................................................... 36
Dissemination Strategy ...................................................................................................... 43
Implications for Policy and Practice .................................................................................. 44
This document is a research report submitted to the U.S. Department of Justice. This report has not been published by the Department. Opinions or points of view expressed are those of the author(s)
and do not necessarily reflect the official position or policies of the U.S. Department of Justice.

NIJ Forensic DNA R&D NIJ 2009-DN-BX-K256 DNA Analysis of LCN Samples
October 28, 2011 Dr. Eugene Tan, NetBio
INTRODUCTION
Goals and objectives
The goal of this research was to develop two microfluidic components the analysis of low
copy number (LCN) samples. The work consisted of three tasks:
Task 1: Selection of post-PCR cleanup methodology and biochip design and testing.
Task 2: Optimization of injection protocol.
Task 3: Testing of the LCN profiling system with forensically relevant samples.
Review of Relevant Literature
Introduction to LCN Analysis.
DNA profiling techniques employed by forensic scientists to assist in the identification of
individuals were first reported by Sir Alec Jeffreys1,2 and have become effective tools in the
criminal justice system for solving crimes and protecting the innocent. The most prevalent
method of DNA profiling is based on the extraction of human genomic DNA from biological
material, multiplex PCR amplification of genomic DNA at specific short tandem repeat (STR)
loci, and separation and detection of the amplified fragments by electrophoresis for size
determination. The world’s largest DNA database, NDIS, contains over 6.8 million offender and
256 thousand forensic profiles as of February 20093, and the second largest, the UK National
DNA Database, holds over 4.5 million profiles. These database systems have assisted law
enforcement by generating investigative leads from biological evidence collected at crime scenes
and, to date, the CODIS system has generated over 77,000 investigative leads3.
1 Jeffreys, A.J., V. Wilson, and S.L. Thein, Individual-specific 'fingerprints' of human DNA. Nature, 1985. 316(6023): p. 76-9.
2 Jeffreys, A.J., V. Wilson, and S.L. Thein, Hypervariable 'minisatellite' regions in human DNA. Nature, 1985. 314(6006): p. 67-73.
3 http://www.fbi.gov/hq/lab/codis/clickmap.htm
This document is a research report submitted to the U.S. Department of Justice. This report has not been published by the Department. Opinions or points of view expressed are those of the author(s)
and do not necessarily reflect the official position or policies of the U.S. Department of Justice.
NIJ Forensic DNA R&D NIJ 2009-DN-BX-K256 DNA Analysis of LCN Samples
October 28, 2011 Dr. Eugene Tan, NetBio
While collection and use of DNA evidence is standard practice in violent crimes, it is less
commonly used in high volume property crimes such as burglaries and auto-theft. Major barriers
to the collection and analysis of biological evidence in high-volume crimes include personnel
shortages and cost, but the single most important factor is due to the testing and backlog of cases
with higher priority. Several studies sponsored by the National Institute of Justice including “The
National Forensic DNA Study”4, “The Application of DNA Technology in England and
Wales”5, and “The DNA field Experiment”6 have highlighted the value of using DNA evidence
for high volume crimes. A summary of the findings from the three reports include:
• “Property crime offenders have high recidivism rates, their crime and violence can
escalate, and property crime cases often go unsolved4.”
• “Property crime cases where DNA evidence is processed have more than twice as many
suspects identified, twice as many suspects arrested, and more than twice as many cases
accepted for prosecution compared with traditional investigation6”
• “DNA is at least five times as likely to result in a suspect identification compared with
fingerprints6”
• “Solves 0.8 other crimes for each crime solved with DNA, and prevents 7.8 other crimes
for each custodial sentence resulting from a DNA based conviction5”
Biological evidence recovered from high-volume crime scenes for DNA analysis consists
primarily of epithelial cells that are transferred by casual handling of objects, often referred to as
“touch DNA samples”. The amount of DNA that is recovered from touch DNA samples will
often be less than that required for standard DNA analysis (DNA analysis kits are typically
optimized for 1 ng of input DNA template) and is classified as Low Copy Number (LCN) DNA.
LCN DNA typing has been defined as “the analysis of any results below the stochastic threshold
for normal interpretation7” using samples of microscopic amounts (less than 100-200 pg) of
4 Lovrich, N.P., et al., National Forensic DNA Study Report, Final Report. NIJ Final Report No. 203970, 2004. 5 Asplen, C.H., The Application of DNA Technology in England and Wales. NIJ Final Report No. 203971, 2004. 6 Roman, J.K., et al., The DNA Field Experiment: Cost-Effectiveness Analysis of the Use of DNA in the
Investigation of High-Volume Crimes. NIJ Final Report No. 222318, 2008. 7 Budowle, B., et al. Low copy number-consideration and caution. Twelfth International Symposium on Human
Identification. 2001. Biloxi, MS.
This document is a research report submitted to the U.S. Department of Justice. This report has not been published by the Department. Opinions or points of view expressed are those of the author(s)
and do not necessarily reflect the official position or policies of the U.S. Department of Justice.
NIJ Forensic DNA R&D NIJ 2009-DN-BX-K256 DNA Analysis of LCN Samples
October 28, 2011 Dr. Eugene Tan, NetBio
input DNA for analysis8,9 Studies on the application of standard STR analysis methods on LCN
crime scene sample shown that 30 – 50% of the samples will yield an acceptable profile10. LCN
sample analysis is typically performed with non-standard DNA processing techniques including
sample concentration, increased cycling of PCR, PCR sample cleanup, and increased injection
times. These methods are capable of generating acceptable profiles from single cell samples (6
pg of input DNA)11, fingerprints, and LCN casework samples, although samples with small
amounts of DNA do not generally lead to full profiles. LCN DNA typing has aided in the
investigation of major crimes by generating acceptable STR profiles from epithelial cells.
Epithelial cells that were transferred during strangulation12 and skin cells transferred to handles
of weapons recovered at crime scenes13 have been sources of LCN DNA for major crimes.
LCN DNA analysis is susceptible to contamination by background DNA left by an
amalgamation of the individuals (including police officers and forensic scientists) who handled
the object and not necessarily the individual that was the source of the evidence. Furthermore,
interpretation of profiles generated from LCN samples are complicated by the presence of alleles
with signals strengths below the normal calling threshold and PCR artifacts (including alleles
drop-out, allele drop-in, and high levels of stutter). A further difficulty of LCN is the problem of
establishing the presence of a true mixture in order to resolve its donor contributions. Finally, in
order for LCN DNA analysis to be most effective, STR profiles generated form LCN samples
must meet to the SWGDAM STR interpretational guidelines.
Though LCN DNA analysis including DNA collection, profile generation, and profile
interpretation has been the subject of significant technical advances, the field is still quite young
and will benefit from further development of training, policy, and technology. NIJ has supported
8 Gill, P., Application of low copy number DNA profiling. Croat Med J, 2001. 42(3): p. 229-32. 9 Gill, P., et al., An investigation of the rigor of interpretation rules for STRs derived from less than 100 pg of DNA,
Forensic Science International. 2000. p. 17-40. 10 Wickenheiser, R.A., Trace DNA: a review, discussion of theory, and application of the transfer of trace quantities
of DNA through skin contact. J Forensic Sci, 2002. 47(3): p. 442-50. 11 Findlay, I., et al., DNA fingerprinting from single cells. Nature, 1997. 389(6651): p. 555-6. 12 Wiegand, P. and M. Kleiber, DNA typing of epithelial cells after strangulation. Int J Legal Med, 1997. 110(4): p.
181-3. 13 Wickenheiser, R. and C. Challoner, Suspect DNA Profiles Obtained From The Handles of Weapons Recovered at Crime Scenes. , in 10th Annual Symposium on Human Identification. 1999: Lake Buena Vista, FL.
This document is a research report submitted to the U.S. Department of Justice. This report has not been published by the Department. Opinions or points of view expressed are those of the author(s)
and do not necessarily reflect the official position or policies of the U.S. Department of Justice.

NIJ Forensic DNA R&D NIJ 2009-DN-BX-K256 DNA Analysis of LCN Samples
October 28, 2011 Dr. Eugene Tan, NetBio
development of technology, capacity, and training for solving high-volume crimes with LCN
DNA evidence. The New York State Office of Chief Medical Examiner (OCME) has taken a
leading role in maximizing the effectiveness of DNA evidence collected at high-volume crimes
by building a state-of-the-art high-sensitivity facility that can generate a full STR profile from
genomic DNA present within as few as six cells. This capability allows skin cells left on a
smudged fingerprint to be used a biological evidence for STR typing. Widespread adoption of
this mode of analysis by the US forensics community is likely to be based on several factors:
success of early adopters of this technology, cost-effectiveness of testing (including the
economic balance of the cost per test and related prosecution and the savings due to the
concomitant reduction of recidivism), and the ability to increase laboratory capacity to handle
increased sample load in a timely manner.
Technology to Improve LCN Analysis.
Technology for generating LCN DNA profiles is adapted from conventional STR
technology with modifications to improve sensitivity. Such modifications include:
Addition of carrier RNA for DNA purification14. Conventional protocols for DNA
purification of low level DNA samples are inefficient. Purification efficiencies have been
significantly improved with the addition of carrier RNA. The addition of carrier RNA allows
non-specific binding sites in the purification medium to be saturated so that DNA is bound
specifically and can be subsequently eluted from the medium.
Whole genome amplification15. This form of DNA amplification has been used to
replicate low copy human genomic DNA to levels that are acceptable for conventional STR
typing methods.
Concentration of purified DNA. Elution volumes from standard purification kits are
relatively large (20 to 100 µl) and only allow only a fraction of the purified DNA to be applied to
the PCR reaction for STR analysis (a standard PCR reaction can only accept 10 – 12 µl of
15 Hanson, E.K. and J. Ballantyne, Whole genome amplification strategy for forensic genetic analysis using single or few cell equivalents of genomic DNA. Anal Biochem, 2005. 346(2): p. 246-57.
15 Hanson, E.K. and J. Ballantyne, Whole genome amplification strategy for forensic genetic analysis using single or few cell equivalents of genomic DNA. Anal Biochem, 2005. 346(2): p. 246-57.
This document is a research report submitted to the U.S. Department of Justice. This report has not been published by the Department. Opinions or points of view expressed are those of the author(s)
and do not necessarily reflect the official position or policies of the U.S. Department of Justice.

NIJ Forensic DNA R&D NIJ 2009-DN-BX-K256 DNA Analysis of LCN Samples
October 28, 2011 Dr. Eugene Tan, NetBio
purified DNA solution). For LCN samples, where the concentration of the purified DNA can be
less than 0.1 ng/µl, concentrating the purified DNA solution (to a total volume 10 µl or less)
allows more of the purified DNA to be applied to the PCR reaction.
Increasing the number of cycles during amplification11. PCR product yield can be
improved by increasing the number of cycles. Multiplex PCR amplification processes have been
estimated to be between 80 to 100% efficient and that at 34 cycles of amplification, the amplicon
yield from a single copy of input template is sufficient for generating signals that are detectable
by conventional separation and detection instruments.
Reducing PCR volumes.16,17 Reducing the PCR reaction volumes for a given DNA input
result in a higher concentration of DNA in the PCR product for separation and detection analysis.
In addition, reduced PCR reaction volumes may improve hybridization kinetics (particularly
during the early cycles) and reaction efficiency.
Increasing annealing time18. This can result in higher product yield and the generation of
profiles that have improved peak height ratios. As with the reduction of PCR volumes, the goal
is to allow efficient hybridization in a setting in which there are limited genomic targets.
Post-PCR clean-up19. The standard STR analysis process reduces the effect of
competitive loading of ions present in the PCR reaction mix with DNA amplicons by diluting the
reaction product with a high resistivity solvent. The typical dilution is 1 µl of PCR product in 10
µl of high resistivity formamide for injection; though competing ions are reduced significantly,
this approach effectively degrades the limit of detection by an order of magnitude. Furthermore,
competition between the amplicons and primer DNA further reduces the injection efficiency of
amplicons for separation and detection. Post PCR cleanup has been applied to remove ions in the
16 Gaines, M.L., et al., Reduced volume PCR amplification reactions using the AmpFlSTR Profiler Plus kit. J Forensic Sci, 2002. 47(6): p. 1224-37.
17 Leclair, B., et al., STR DNA typing: increased sensitivity and efficient sample consumption using reduced PCR reaction volumes. J Forensic Sci, 2003. 48(5): p. 1001-13.
18 Prinz, M., et al., Maximization of STR DNA typing success for touched objects. Int Congress Ser, 2006. 1288: p. 651-653.
19 Smith, P.J. and J. Ballantyne, Simplified low-copy-number DNA analysis by post-PCR purification. J Forensic Sci, 2007. 52(4): p. 820-9.
This document is a research report submitted to the U.S. Department of Justice. This report has not been published by the Department. Opinions or points of view expressed are those of the author(s)
and do not necessarily reflect the official position or policies of the U.S. Department of Justice.
NIJ Forensic DNA R&D NIJ 2009-DN-BX-K256 DNA Analysis of LCN Samples
October 28, 2011 Dr. Eugene Tan, NetBio
PCR reaction solution by buffer exchange to generate a solution consisting primarily of dye
labeled amplicons in a high resistivity buffer for separation and detection.
Increasing injection voltages and times for separation and detection20. Injection
conditions--specifically the increase in injection voltage and times -- have been applied to
increase the signal strengths of the alleles generated from LCN samples. This functions by
allowing more of the amplicons to enter the separation channel, usually at the cost of decreased
resolution.
Energy transfer dye labeled primers21. Energy transfer dyes have also been applied in
STR analysis to replace the conventional dyes and operate based on fluorescence energy transfer
between two closely-spaced dyes. The net result of energy transfer dyes is a highly efficient dye
macromolecule with concomitant enhancement of the system limit of detection.
The techniques described above have been applied to LCN analysis with varying degrees
of success. Implementation of these techniques can be performed independently or applied in
tandem to generate a cumulative enhancement of system sensitivity and limit of detection geared
to LCN analysis.
NetBio’s Approach to Fully-‐Integrated STR Analysis.
NetBio is developing a fully integrated system for sample-in to STR-profile out DNA
analysis that will allow up to 16 samples to be processed simultaneously in 45 minutes with
minimal user requirements. The system takes advantage of microfluidic technology to
miniaturize and integrate physical, biochemical, and chemical reactions. These advantages
include reductions in transport and mixing times, high capability for integrating and performing
complex fluidic functions, and high degree of parallelization22.
20 Forster, L., J. Thomson, and S. Kutranov, Direct comparison of post-28-cycle PCR purification and modified capillary electrophoresis methods with the 34-cycle "low copy number" (LCN) method for analysis of trace forensic DNA samples. Forensic Sci Int Genet, 2008. 2(4): p. 318-28.
22 Manz, A., N. Graber, and H.M. Widmer, Miniaturized total chemical analysis systems: a novel concept for chemical sensing. Sens. Actuators B, 1990. 1(1-6): p. 244-248.
22 Manz, A., N. Graber, and H.M. Widmer, Miniaturized total chemical analysis systems: a novel concept for chemical sensing. Sens. Actuators B, 1990. 1(1-6): p. 244-248.
This document is a research report submitted to the U.S. Department of Justice. This report has not been published by the Department. Opinions or points of view expressed are those of the author(s)
and do not necessarily reflect the official position or policies of the U.S. Department of Justice.
NIJ Forensic DNA R&D NIJ 2009-DN-BX-K256 DNA Analysis of LCN Samples
October 28, 2011 Dr. Eugene Tan, NetBio
The modules of the NetBio’s fully integrated microfluidic biochip-based STR analysis
system (Figure 1) include: DNA extraction and purification (Module 1a) and quantitation
(Module 1b), multiplexed PCR amplification (Module 2), and separation and detection (Module
3). These integrated modules form a closed analytical system which eliminates contamination
associated with manual sample processing, making this system particularly well-suited to LCN
sample analysis. Several groups including Dr. Richard A. Mathies (UC Berkley)23, Dr. James P.
Landers (U Virginia)24, and Dr. Fredric Zenhausern (Arizona State University) are developing
microfluidic biochip technologies for forensic DNA typing. Only Dr. Richard Mathies (UC
Berkley) has developed technologies that might be applied to LCN DNA analysis including
energy transfer dyes21 and sample cleanup25 (streptavidin-based affinity capture of biotinylated
STR primers allowing full profiles to be obtained with as little as 0.15 ng of DNA template).
NetBio’s development of a microfluidic DNA extraction and purification module, funded
in part by NIJ Award 2007-DN-BX-K184, has been completed successfully. This module applies
a chaotropic/salt purification methodology26 and allows simultaneous purification of multiple
samples in 8 minutes. Biochip DNA purification from mock crime scene and database samples
was completed with the successful DNA purification and subsequent successful inhibitor free
multiplex PCR amplification of blood, saliva, and cellular samples from cotton swabs; touch
samples from cotton swabs; blood, and saliva on cotton, denim, and polyester; and buccal cells
from swabs27.
Development of a microfluidic chip-based multiplex amplification module has also been
completed. NetBio’s custom biochip thermal cycler and associated 16-sample biochip for rapid
biochip based STR amplification is shown in Figure 2. The instrumentation allows rapid and
highly controlled temperature transitions to heat and cool a reaction solution at rates of 15.8°C/s
23 Liu, P., et al., Real-time forensic DNA analysis at a crime scene using a portable microchip analyzer. Forensic Sci Int Genet, 2008. 2(4): p. 301-9. 24 Easley, C.J., et al., A fully integrated microfluidic genetic analysis system with sample-in-answer-out capability. Proc Natl Acad Sci U S A, 2006. 103(51): p. 19272-7. 25 Yeung, S.H., et al., Integrated sample cleanup-capillary electrophoresis microchip for high-performance short tandem repeat genetic analysis. Anal Chem, 2009. 81(1): p. 210-7. 26 Boom, R., et al., Rapid and simple method for purification of nucleic acids. J Clin Microbiol, 1990. 28(3): p. 495-503. 27 Tan, E. DNA Purification From Forensic Samples in a Microfluidic Biochip. in 61th American Academy of Forensics Sciences Annual Meeting. 2009. Denver, CO.
This document is a research report submitted to the U.S. Department of Justice. This report has not been published by the Department. Opinions or points of view expressed are those of the author(s)
and do not necessarily reflect the official position or policies of the U.S. Department of Justice.
NIJ Forensic DNA R&D NIJ 2009-DN-BX-K256 DNA Analysis of LCN Samples
October 28, 2011 Dr. Eugene Tan, NetBio
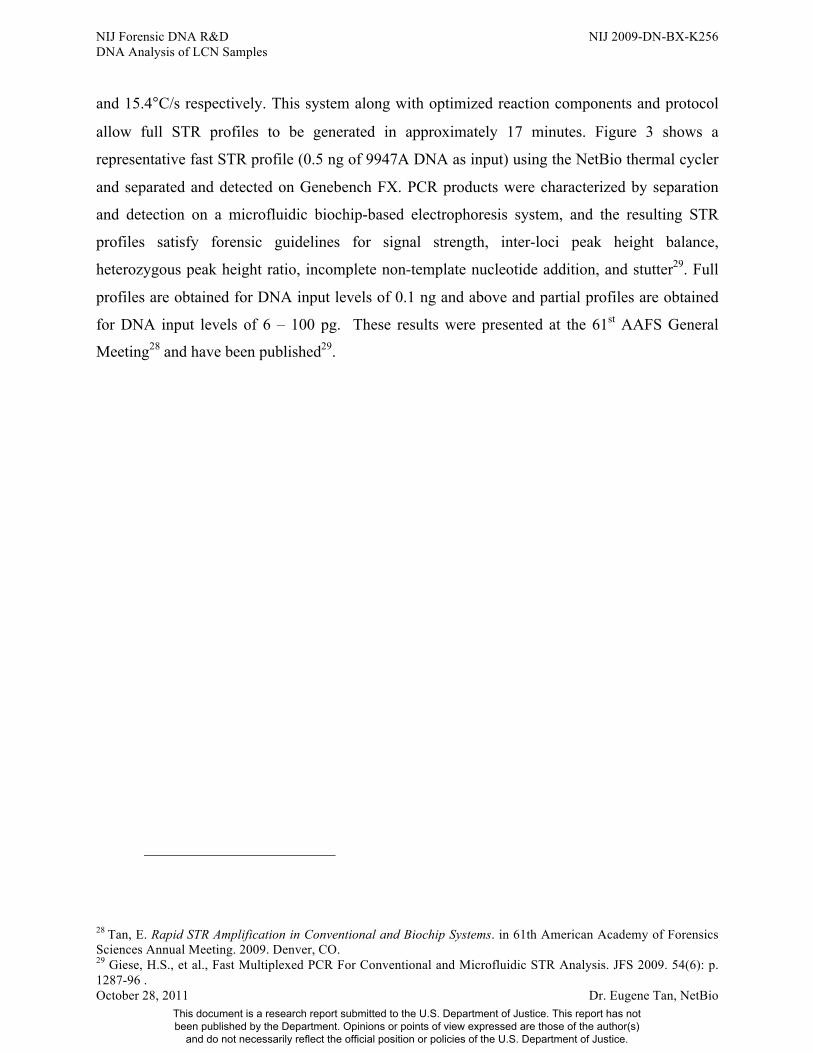
and 15.4°C/s respectively. This system along with optimized reaction components and protocol
allow full STR profiles to be generated in approximately 17 minutes. Figure 3 shows a
representative fast STR profile (0.5 ng of 9947A DNA as input) using the NetBio thermal cycler
and separated and detected on Genebench FX. PCR products were characterized by separation
and detection on a microfluidic biochip-based electrophoresis system, and the resulting STR
profiles satisfy forensic guidelines for signal strength, inter-loci peak height balance,
heterozygous peak height ratio, incomplete non-template nucleotide addition, and stutter29. Full
profiles are obtained for DNA input levels of 0.1 ng and above and partial profiles are obtained
for DNA input levels of 6 – 100 pg. These results were presented at the 61st AAFS General
Meeting28 and have been published29.
28 Tan, E. Rapid STR Amplification in Conventional and Biochip Systems. in 61th American Academy of Forensics Sciences Annual Meeting. 2009. Denver, CO. 29 Giese, H.S., et al., Fast Multiplexed PCR For Conventional and Microfluidic STR Analysis. JFS 2009. 54(6): p. 1287-96 .
This document is a research report submitted to the U.S. Department of Justice. This report has not been published by the Department. Opinions or points of view expressed are those of the author(s)
and do not necessarily reflect the official position or policies of the U.S. Department of Justice.

NIJ Forensic DNA R&D NIJ 2009-DN-BX-K256 DNA Analysis of LCN Samples
October 28, 2011 Dr. Eugene Tan, NetBio
Figure 1. Sample-in to results-out process flow of the fully integrated system.
This document is a research report submitted to the U.S. Department of Justice. This report has not been published by the Department. Opinions or points of view expressed are those of the author(s)
and do not necessarily reflect the official position or policies of the U.S. Department of Justice.

NIJ Forensic DNA R&D NIJ 2009-DN-BX-K256 DNA Analysis of LCN Samples
October 28, 2011 Dr. Eugene Tan, NetBio
Figure 2. NetBio’s custom biochip based thermal cycler and associated 16-sample single
disposable pcr biochip (dimension 1”x3”).
This document is a research report submitted to the U.S. Department of Justice. This report has not been published by the Department. Opinions or points of view expressed are those of the author(s)
and do not necessarily reflect the official position or policies of the U.S. Department of Justice.

NIJ Forensic DNA R&D NIJ 2009-DN-BX-K256 DNA Analysis of LCN Samples
October 28, 2011 Dr. Eugene Tan, NetBio
Figure 3. STR profile generated by amplifying 0.5 ng of 9947A DNA in the NetBio
biochip thermal cycler and separated and detected on Genebench FX.
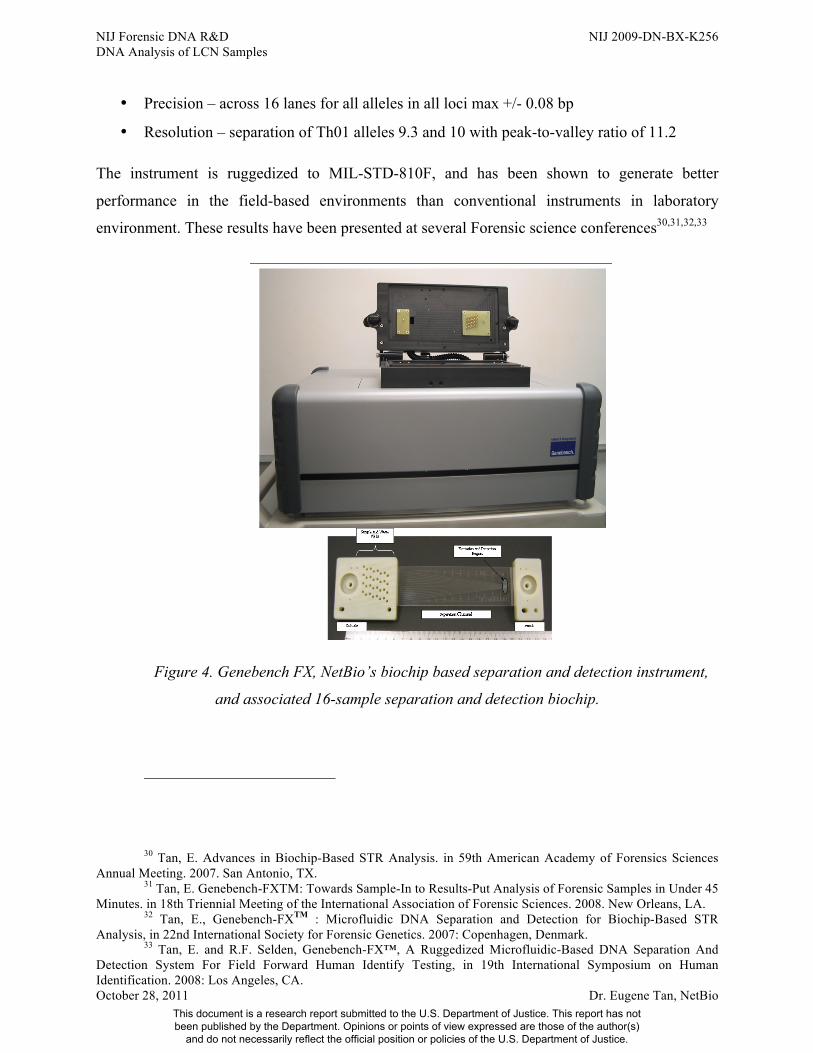
The microfluidic biochip based DNA separation and detection module, Genebench-FXTM
Series 100, has also been completed. Figure 4 shows a photograph of the instrument and
associated 16-sample biochip. The instrument separates DNA based on fragment size by
electrophoresis on microfluidic biochips, and excitation and detection of labeled DNA fragments
is accomplished by laser-induced fluorescence detection. Genebench FXTM Series 100 can be
operated in both the forensic laboratory and in the field, has low power consumption, and is CE
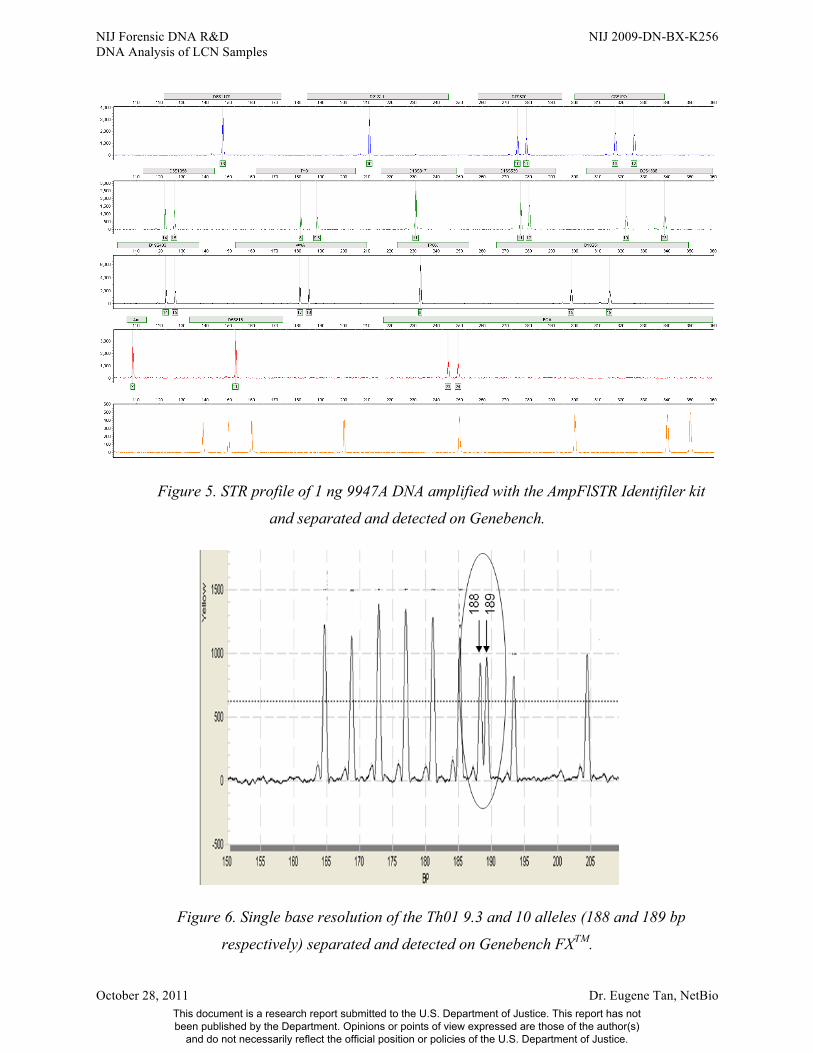
marked under the Low Voltage Directive 73/23/EEC. Figure 5 shows an STR profile using the
Identifiler kit (Applied Biosystems, Foster City, CA) generated on Genebench-FX. In this
experiment, 2.7 µl of PCR product, 0.3 µl of GS500 sizing standard, and 10 µl of HiDi were
mixed together and loaded into the sample wells. The PCR product resulted from the
amplification of 1 ng of 9947A DNA template under the manufacturer’s recommended
condition. Genebench-FX has 5 color detection capability, allowing the instrument to perform 5
color multiplexed DNA fragment sizing assays such as those required by the AmpFlSTR
Identifiler PCR Amplification Kit (Applied Biosystems). Figure 6 shows the resolution of two
fragments that differ in size by one base pair. The high peak to valley ratio between the two
fragments demonstrates that the instrument is capable of better than single base pair resolution.
Genebench-FX is currently able to perform a separation assay for up to 500 base pair fragments
in 17 minutes, and work is under way to reduce that time by several minutes. A summary of
Genebench-FX performance:
• Sensitivity – to 0.01 ng DNA template,
• Dynamic range – up to 8 ng of DNA template
This document is a research report submitted to the U.S. Department of Justice. This report has not been published by the Department. Opinions or points of view expressed are those of the author(s)
and do not necessarily reflect the official position or policies of the U.S. Department of Justice.
NIJ Forensic DNA R&D NIJ 2009-DN-BX-K256 DNA Analysis of LCN Samples
October 28, 2011 Dr. Eugene Tan, NetBio
• Precision – across 16 lanes for all alleles in all loci max +/- 0.08 bp
• Resolution – separation of Th01 alleles 9.3 and 10 with peak-to-valley ratio of 11.2
The instrument is ruggedized to MIL-STD-810F, and has been shown to generate better
performance in the field-based environments than conventional instruments in laboratory
environment. These results have been presented at several Forensic science conferences30,31,32,33
Figure 4. Genebench FX, NetBio’s biochip based separation and detection instrument,
and associated 16-sample separation and detection biochip.
30 Tan, E. Advances in Biochip-Based STR Analysis. in 59th American Academy of Forensics Sciences Annual Meeting. 2007. San Antonio, TX.
31 Tan, E. Genebench-FXTM: Towards Sample-In to Results-Put Analysis of Forensic Samples in Under 45 Minutes. in 18th Triennial Meeting of the International Association of Forensic Sciences. 2008. New Orleans, LA.
32 Tan, E., Genebench-FXTM : Microfluidic DNA Separation and Detection for Biochip-Based STR Analysis, in 22nd International Society for Forensic Genetics. 2007: Copenhagen, Denmark.
33 Tan, E. and R.F. Selden, Genebench-FX™, A Ruggedized Microfluidic-Based DNA Separation And Detection System For Field Forward Human Identify Testing, in 19th International Symposium on Human Identification. 2008: Los Angeles, CA.
This document is a research report submitted to the U.S. Department of Justice. This report has not been published by the Department. Opinions or points of view expressed are those of the author(s)
and do not necessarily reflect the official position or policies of the U.S. Department of Justice.
NIJ Forensic DNA R&D NIJ 2009-DN-BX-K256 DNA Analysis of LCN Samples
October 28, 2011 Dr. Eugene Tan, NetBio
Figure 5. STR profile of 1 ng 9947A DNA amplified with the AmpFlSTR Identifiler kit
and separated and detected on Genebench.
Figure 6. Single base resolution of the Th01 9.3 and 10 alleles (188 and 189 bp
respectively) separated and detected on Genebench FXTM.
This document is a research report submitted to the U.S. Department of Justice. This report has not been published by the Department. Opinions or points of view expressed are those of the author(s)
and do not necessarily reflect the official position or policies of the U.S. Department of Justice.

NIJ Forensic DNA R&D NIJ 2009-DN-BX-K256 DNA Analysis of LCN Samples
October 28, 2011 Dr. Eugene Tan, NetBio
Initial work to show proof of concept of microfluidic ultrafiltration was performed by
incorporating an ultrafiltration membrane into a simple microfluidic biochip. This biochip was
designed with a 3 layer construction and was fabricated by CNC machining. The top layer
consists of inlet and outlet ports that serve as both fluidic accesses to the biochip and pneumatic
interface to drive the fluid within the microfluidic channels and chamber. The middle layer
complements the top layer to securely fasten the membrane, while the bottom layer enables
fluidic waste removal from beneath. The layers of the biochip are assembled using thermo-
compression bonding. An initial selection of a 50 KD molecular weight cutoff membrane was
inserted into the cleanup chamber.
PCR samples with 9947A DNA template were amplified in microfluidic biochips using
primers from the AmpFlSTR Profiler-Plus kit. 2.7 µl of PCR sample was subjected to cleanup by
pressure driving it through the membrane in the cleanup chamber. This was followed by a series
of de-ionized water washes. The cleaned-up amplicons were eluted from the membrane and
mixed with 0.3µL sizing standards and 10 µL formamide. Samples were separated on
Genebench following standard protocols. STR profiles of the cleaned and uncleaned samples are
shown in Figure 7. Preliminary results of biochip cleanup showed removal of ions enhanced
signal strength by approximately 8-fold, consistent with the results obtained by Smith19.
(a) (b)
Figure 7. STR profiles of (a) PCR product and (b) PCR product cleaned up by biochip filtration.
PCR product was of 0.25 ng of 9947A DNA amplified by biochip thermal cycling. An
approximately 8 fold increase in signal strength is observed after PCR product cleanup.
This document is a research report submitted to the U.S. Department of Justice. This report has not been published by the Department. Opinions or points of view expressed are those of the author(s)
and do not necessarily reflect the official position or policies of the U.S. Department of Justice.

NIJ Forensic DNA R&D NIJ 2009-DN-BX-K256 DNA Analysis of LCN Samples
October 28, 2011 Dr. Eugene Tan, NetBio
OVERVIEW OF RESERCH PLAN This research builds on the development of a fully integrated sample-in to results-out
system with the goal of adapting it for LCN DNA profiling. The work facilitates the
development of a cost-effective, easy to use system that is capable of routinely generating full
profiles with 30 pg of template DNA and callable partial profiles from template levels of 6 pg to
30 pg. This work develops a method for microfluidic post PCR cleanup and optimizes the
injection protocols for LCN as follows:
Task 1: Selection of Post-PCR Cleanup Methodology and Biochip Design and Testing
1.1 Initial cleanup methodology screening
1.2 Microfluidic testing of two cleanup candidate methodologies
1.3 Design, fabrication, and testing of an automated single sample post-PCR cleanup
module
1.4 Design, fabrication, and testing of a 16-sample post-PCR cleanup module.
Task 2: Optimization of injection protocol
Task 3. Combined testing of the clean-up module with the optimized injection protocols
developed in Tasks 1-3 will be performed with forensically relevant mock casework samples.
METHODS
Forensically relevant and reference samples
Fresh Whole Blood. Fresh whole blood containing EDTA as anticoagulant was obtained
on ice from Research Blood Components, L.L.C. (Brighton, MA). The whole blood sample on
swab was prepared by pipetting 100 µL of blood solution onto a ceramic tile and then wiped off
with swab (SecurSwabs, Bode, Lorton VA) collection head. Microfluidic biochip purification or
Automated Microfluidic Extraction and Purification of DNA from Swabs in the Smart Cartridge
was performed on each sample.
Saliva. Saliva was collected by expectorating into a 50 ml falcon tube. 100 µL of saliva
was pipetted out and placed onto a ceramic surface and then wiped off with a cotton swab
This document is a research report submitted to the U.S. Department of Justice. This report has not been published by the Department. Opinions or points of view expressed are those of the author(s)
and do not necessarily reflect the official position or policies of the U.S. Department of Justice.
NIJ Forensic DNA R&D NIJ 2009-DN-BX-K256 DNA Analysis of LCN Samples
October 28, 2011 Dr. Eugene Tan, NetBio
(SecurSwabs, Bode, Lorton VA). Microfluidic biochip purification or Automated Microfluidic
Extraction and Purification of DNA from Swabs in Smart Cartridge was performed on each
sample.
Buccal cell samples were obtained by moving the swabs (SecurSwabs, Bode, Lorton VA)
up and down on the inside cheek of a human subject. Microfluidic biochip purification or
Automated Microfluidic Extraction and Purification of DNA from Swabs in Smart Cartridge was
performed on each sample.
Approximately 20 samples of each type were subjected to analysis by microfluidic purification,
amplification, ultrafiltration, and separation and detection.
Vortex Extraction of DNA from Swabs.
Swabs were placed in a 2 mL microcentrifuge tube. The swab heads were separated from
the shaft by cutting them off with scissors. 500 µL of NetBio lysis solution was added to the
microcentrifuge tube and the tube was vortexed for 5 seconds. 550 µL of absolute ethanol was
transferred and the solution was again vortexed for 5 seconds. The swab heads were manually
removed using a pair of clean tweezers and discarded.
Microfluidic Biochip Purification.
The biochip consists of two components, a Smart Cartridge (SC) and Integrated biochip
(IB). The SC is comprised of reagent chambers for holding preloaded solutions and process
chambers. One chamber is used to hold the cotton swab with the DNA sample; three of the
chambers are prefilled with lysis solution, ethanol, wash buffer and the fourth is used to load
elution buffer. The final two chambers are used for holding solutions during the DNA extraction
process. The SC biochip is comprised of a network of channels, chambers, flow control
elements, and a purification filter. An automated script pneumatically manipulates solutions
within the SC to extract DNA from a cotton swab that is inserted. Extraction is achieved by
pneumatically driving the lysis solution from the lysis reagent chamber to the swab chamber.
Ethanol was then pneumatically driven from the reagent chamber into the swab chamber to be
mixed with the lysis solution. This mixture was then pneumatically driven through the
purification filter. A washing step immediately followed with 3 mL of wash buffer being passed
This document is a research report submitted to the U.S. Department of Justice. This report has not been published by the Department. Opinions or points of view expressed are those of the author(s)
and do not necessarily reflect the official position or policies of the U.S. Department of Justice.
NIJ Forensic DNA R&D NIJ 2009-DN-BX-K256 DNA Analysis of LCN Samples
October 28, 2011 Dr. Eugene Tan, NetBio
through the purification filter. 100 µL of TE buffer was pneumatically driven through the
purification filter.
DNA Quantitation and Serial Dilution. To ensure that accurate quantities of DNA are tested to
allow development of microfluidic components capable of analyzing LCN samples, starting
DNA solutions (whether purified microfluidically or purchased) were analyzed using a
NanoDrop spectrophotometer. In our hands, this method is accurate for solutions containing as
little as 2-4 µg DNA/µl. Accordingly, starting solutions utilized were generally at DNA
concentrations of 25 µg/µl or greater. These stock solutions were then subjected to serial
dilutions to generate the desired DNA concentrations for testing.
STR Amplification Reaction.
Multiplex PCR reactions were performed with the Identifiler kit (Applied Biosystems,
Foster City, CA). The 7 µL PCR reaction and cycling protocol was prepared as described in
Giese29. Amplification of 16-sample in the microfluidic biochip was completed in approximately
17 minutes and the amplified products were manually retrieved from the individual.
Microfluidic Biochip Ultrafiltration (UF)
The microfluidic biochip UF cleanup was performed by combining 8 µl of PCR product
with 24 µl of deionized water and 0.5uL of GS500 size standard (LIZ, part # 4322679, Applied
Biosystems, CA). This sample was loaded into the inlet port of the UF biochip chip and
pneumatically driven through the UF filter at 10 psig. The filtrate was resuspended with 12 µl of
deionized water loaded into the chip and pneumatically driven from the input port to the output
port by the application of 1 psig. The eluate was then subjected to microfluidic separation and
detection. To 2.7 µl of each amplified product, 10.2 µl formamide and 0.1 µl of Genescan 500
LIZ internal lane standard (both Applied Biosystems) were added.
This document is a research report submitted to the U.S. Department of Justice. This report has not been published by the Department. Opinions or points of view expressed are those of the author(s)
and do not necessarily reflect the official position or policies of the U.S. Department of Justice.

NIJ Forensic DNA R&D NIJ 2009-DN-BX-K256 DNA Analysis of LCN Samples
October 28, 2011 Dr. Eugene Tan, NetBio
RESULTS
Task 1: Selection of post-‐PCR cleanup methodology and biochip design and testing.
The goal of Task 1 was to develop, optimize, and integrate a microfluidic post-PCR cleanup
module to enhance signal strength from LCN samples. This task is divided into 3 subtasks as
described in the following sections.
Subtask 1.1. Screening of Post-PCR Cleanup Methodologies and Biochip Design and Testing
The goal of Subtask 1.1 was to select a post-PCR cleanup methodology that meets the
requirements of the fully integrated system for LCN analysis. These requirements include:
• enhancement of signal strength following separation and detection.
• process time of under 5 minutes.
• compatibility with existing microfluidic processing modules (e.g. purification,
amplification).
• compatibility with microfluidic device fabrication methods (e.g. CNC machining,
injection molding).
Initial screening of four PCR cleanup methodologies was performed by amplifying DNA
template with NetBio’s microfluidic thermal cycling protocols, cleaning up PCR product
following protocols of methods under evaluation, and separated and detecting cleaned up
samples with Genebench FX. A summary of the four methods evaluated follows:
Membrane filtration – This purification method uses a semi-permeable filtration
membrane with fine pore size. Hydrostatic pressure pushes the solution containing molecules
and ions against the membrane. Large molecules such as DNA are retained, while water and low
molecular weight solutes (including ions) pass through the membrane. Initial experiments with
this approach shows that it is capable of removing small molecules from the PCR reaction mix
from 10-50 bp in size molecules and results in an increase in the signal strength of the STR
profile. This membrane filtration format and processing protocols are highly compatible for
incorporation into the fully integrated microfluidic system.
Size exclusion chromatography – This method uses a purification column filled with a
semi-solid polymeric resin. The resin is equilibrated prior to sample loading. The resin admits
This document is a research report submitted to the U.S. Department of Justice. This report has not been published by the Department. Opinions or points of view expressed are those of the author(s)
and do not necessarily reflect the official position or policies of the U.S. Department of Justice.

NIJ Forensic DNA R&D NIJ 2009-DN-BX-K256 DNA Analysis of LCN Samples
October 28, 2011 Dr. Eugene Tan, NetBio
ions and small molecules into their interior but excludes large molecules. A 70 – 130 µl volume
of PCR product sample was loaded on the resin in a spin column and centrifuged at 1000 g for 2
minutes. An elution buffer was flowed through the column and collected. The collected sample
was subjected to separation and detection. This method of purification is effective in removing
ions and small molecules. However, the requirement for relatively large sample volumes is
problematic.
Solid phase extraction – This method relies on binding of large DNA fragments to a solid
phase medium (typically silica for DNA cleanup). The bound molecule is washed and eluted in
an appropriate buffer. Experiments show that this method is capable of removing small ions from
the PCR reaction mix and results in an increase in the signal strength of the STR profile. The
major limitation of the approach is complexity; the number of microfluidic features required to
incorporate a bind-wash-elute protocol is significant. Nonetheless, solid phase cleanup is
compatible with microfluidic devices.
Equilibrium Dialysis – This clean-up method separates sample components by selective
diffusion of small molecules and ions across a porous membrane. The pore size determines
molecular-weight cutoff of the membrane and the molecular weight of the solute retained by the
membrane. The volumetric difference between the sample and dialysis solution and the number
of dialysis solution replacements dictate the degree of cleanup achieved. This approach was
effective in removing small ions from the PCR reaction mix. A significant (up to approximately
2-fold) increase in the volume of the sample within the cassette was observed. This expansion is
problematic in that minimization of the post-PCR sample volume is critical in order to allow
subsequent injection of as much of the volume as possible.
In summary, all four methods were effective in cleaning up PCR product. The
membrane filtration and solid phase extraction approaches were most compatible for
incorporation into a microfluidic format. The membrane filtration protocol is simpler to
implement in a microfluidic format and was selected for further detailed testing. The remainder
of this Task focused on developing this methodology.
Subtask 1.2. Microfluidic Testing and Evaluation of Membrane Filters for Post-PCR Cleanup.
The goal of this task was to evaluate a series of membrane based purification
filters to determine the optimal filter membrane for incorporation into the biochip. Ultrafiltration
This document is a research report submitted to the U.S. Department of Justice. This report has not been published by the Department. Opinions or points of view expressed are those of the author(s)
and do not necessarily reflect the official position or policies of the U.S. Department of Justice.

NIJ Forensic DNA R&D NIJ 2009-DN-BX-K256 DNA Analysis of LCN Samples
October 28, 2011 Dr. Eugene Tan, NetBio
membranes are filters with pore sizes of 0.001 to 0.1 µm and are customarily categorized by a
molecular-weight cutoff (MWCO). Filters with MCWO of 10, 30, and 50 kDA were evaluated
for efficiency of small molecule and ion removal and filter throughput. Initial testing was
performed with fluorescently labeled single nucleotides. Spin columns were fabricated by
punching out discs from sheets of filter membrane, inserting one disc into each column, and
mechanically fastening the discs to the column body with a retaining ring. Dye labeled
oligonucleotide samples were cleaned up by loading onto the membranes within the spin
columns and centrifuging for 2 minutes. The filtrate and retentate were collected and total
fluorescence was measured on a nanodrop 3000 spectrophotometer (Nanodrop Technologies,
Wilmington, DE). Control samples were cleaned by ethanol precipitation.
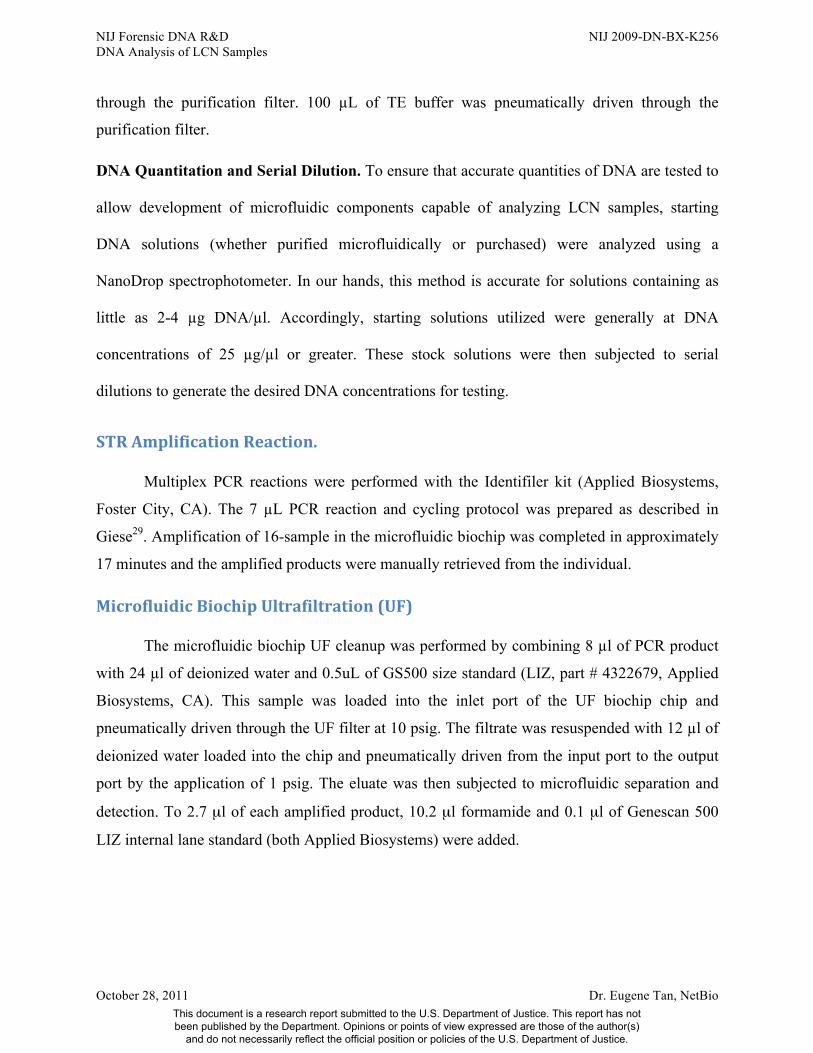
Figure 8 shows the relative amounts of fluorescence in the filtrate and retentate for two
filter types with varying MWCOs. For the large pore size filter, fluorescence in the retentate
decreased with increasing MCWO. Similarly, fluorescence in the filtrate increased with
increasing MCWO. The total fluorescence of the retentate and filtrate components was
approximately 90% that of the unfiltered sample. These results are consistent with a larger
MCWO filter that allows smaller sized oligonucleotides to pass through the filter and into the
filtrate. The second filter showed a similar trend, however, the total of fluorescence of the
retentate and filtrate is between 20 to 50% of the unfiltered sample. This indicates a loss of dyed
molecules, possibly by irreversible binding to the filter membrane but more likely by becoming
entangled within the mesh of the membrane. The ethanol precipitated sample had a low
fluorescence (59 RFU) indicating that most of the small molecules are removed. Finally, a
comparison of filter throughput shows that filter throughput increased linearly with increasing
MCWO.
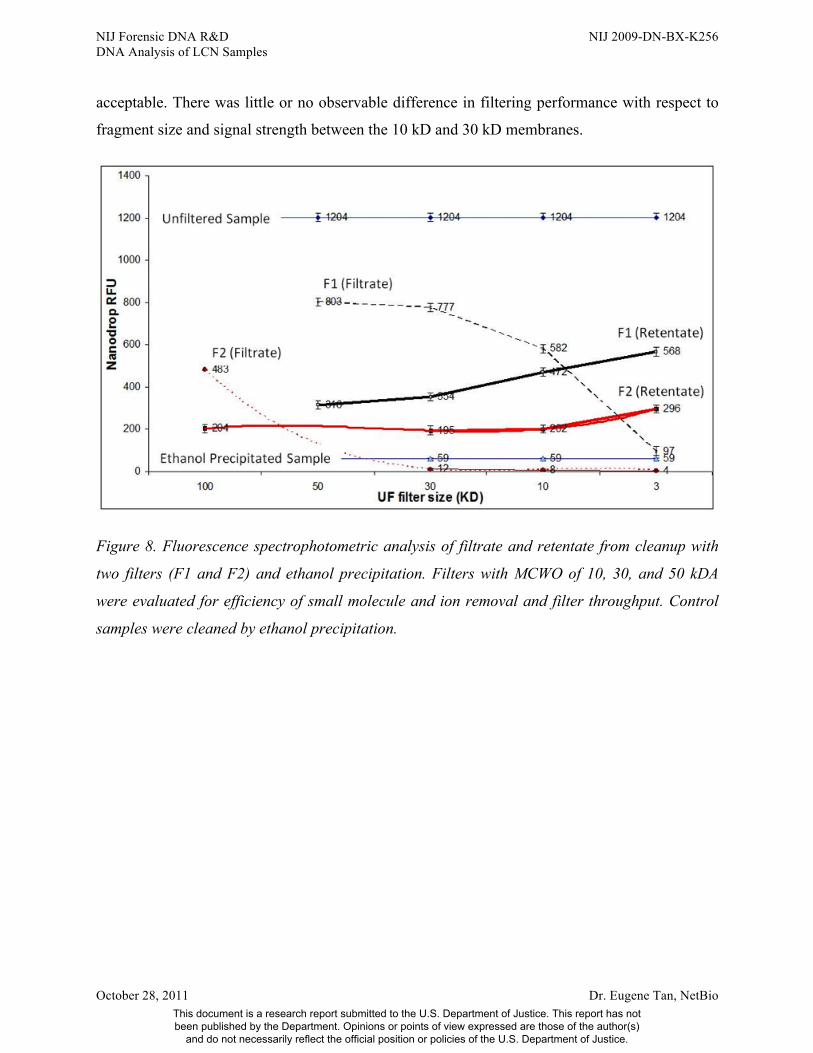
The effect of MCWO on STR performance was assessed by cleaning up sizing standard
samples (GS500, Applied Biosystems, Foster City, CA) with filters of 10, 30, and 50 kDA. The
data show that filtering the sizing standard samples with a membrane of pore size of 50kD
resulted in a reduction in signal strength of the smaller sizing standard fragments relative to the
larger fragments (Figure 9). The signal strength of the 50, 75 and 100 bp fragments were
unacceptably low. In addition, there was an overall reduction in signal strength of all the
fragments. For the 10 kD and 30kD filters, some reduction in the signal strength of the smaller
fragments was observed, however, the signal levels of all sizing standard fragments were
This document is a research report submitted to the U.S. Department of Justice. This report has not been published by the Department. Opinions or points of view expressed are those of the author(s)
and do not necessarily reflect the official position or policies of the U.S. Department of Justice.
NIJ Forensic DNA R&D NIJ 2009-DN-BX-K256 DNA Analysis of LCN Samples
October 28, 2011 Dr. Eugene Tan, NetBio
acceptable. There was little or no observable difference in filtering performance with respect to
fragment size and signal strength between the 10 kD and 30 kD membranes.
Figure 8. Fluorescence spectrophotometric analysis of filtrate and retentate from cleanup with
two filters (F1 and F2) and ethanol precipitation. Filters with MCWO of 10, 30, and 50 kDA
were evaluated for efficiency of small molecule and ion removal and filter throughput. Control
samples were cleaned by ethanol precipitation.
This document is a research report submitted to the U.S. Department of Justice. This report has not been published by the Department. Opinions or points of view expressed are those of the author(s)
and do not necessarily reflect the official position or policies of the U.S. Department of Justice.
NIJ Forensic DNA R&D NIJ 2009-DN-BX-K256 DNA Analysis of LCN Samples
October 28, 2011 Dr. Eugene Tan, NetBio
(a)
(b)
(c)
Figure 9. Clean-up of sizing standard samples with (a) 10 kDa, (b) 30 kDa, and (c) 50 kDa filter
membranes.
Lane 12, 0.16uL dilution, UF 10KD RC filter, Size Std
10000
11000
12000
13000
14000
15000
16000
17000
18000
19000
20000
2000 3000 4000 5000 6000 7000 8000 9000 10000
Counts
Inten
sity
L12Orange
Lane 13, 0.16uL, 30KD RC size std,
10000
11000
12000
13000
14000
15000
16000
17000
18000
19000
20000
2000 3000 4000 5000 6000 7000 8000 9000 10000
Counts
Inten
sity
L13Orange
Lane 14, 0.16ul- 50K RC filter, size std
12000
12500
13000
13500
14000
14500
15000
2000 3000 4000 5000 6000 7000 8000 9000 10000
Counts
Inten
sity
L14Orange
This document is a research report submitted to the U.S. Department of Justice. This report has not been published by the Department. Opinions or points of view expressed are those of the author(s)
and do not necessarily reflect the official position or policies of the U.S. Department of Justice.

NIJ Forensic DNA R&D NIJ 2009-DN-BX-K256 DNA Analysis of LCN Samples
October 28, 2011 Dr. Eugene Tan, NetBio
Subtask 1.3 Design, Fabrication, and Testing of an Automated Single Sample Post-PCR Cleanup Module.
The goal of this task was to incorporate the selected purification membrane in a single
sample biochip and to assess the cleanup performance within a microfluidic biochip. A single
sample microfluidic biochip was designed to allow the clean up of PCR product to generate
sample that can be used for separation and detection. The four biochip was fabricated in plastic
and patterned by computer numerical controlled (CNC) milling. The process flow for
microfluidic cleanup and testing is shown in Figure 10. Sample was prepared by mixing 2.7 µl of
PCR product (generated in NetBio’s microfluidic biochip thermal cycling system) with 9 µl of dI
water. This sample was pneumatically loaded into the microfluidic biochip. As the sample
flowed through the clean-up chamber, small ions and molecules are passed through the UF
membrane to waste. The cleaned-up sample was retained in the cleanup chamber and was
pneumatically driven to the output port for removal. The cleaned up sample was separated and
detection using Genebench.
Sets of PCR product were generated by amplifying 9947A DNA with the Profiler Plus
primer set (Life Technology, Carlsbed, CA) at template levels of 0.025 ng (approximately four
genome equivalents) and 0.006 ng (approximately one genome equivalent) in the NetBio
microfluidic thermal cycling system. Each of the PCR product samples was divided for analysis
with and without microfluidic biochip cleanup. The application of cleanup generates an
approximately 6- to 8-fold increase in signal strength compared with the unclean samples
(Figures 11 and 12).
Next, a set of DNA samples was generated from buccal swabs using NetBio’s
microfluidic DNA purification system. PCR product generated by amplifying with the Profiler
Plus primer set the buccal swab DNA template at levels of 0.025 ng and near single copy (0.006
ng). Each of the PCR product samples was divided for analysis with and without microfluidic
biochip cleanup. Once again, the application of cleanup generated an approximately 6- to 8-fold
increase in signal strength compared with the unclean samples (Figure 13 and 14). This increase
in the signal strength is significant and allows an increase in the number of callable alleles. For
example, cleanup allowed allele 30 of locus D21S11 and allele 15 and 19 of locus D18S51 to be
called in the 0.006 ng sample, whereas they could not be called in the absence of cleanup.
This document is a research report submitted to the U.S. Department of Justice. This report has not been published by the Department. Opinions or points of view expressed are those of the author(s)
and do not necessarily reflect the official position or policies of the U.S. Department of Justice.

NIJ Forensic DNA R&D NIJ 2009-DN-BX-K256 DNA Analysis of LCN Samples
October 28, 2011 Dr. Eugene Tan, NetBio
Taken together, these results together show that the selected microfluidic cleanup method
effects an increase in signal strength of between 6- to 8-fold. This increase in signal strength is
significant in increasing the number of callable alleles from low copy number samples. In
addition, these samples also show that NetBio’s DNA purification, thermal cycling, and
separation and detection modules are effective with LCN templates and that the microfluidic UF
process is compatible with these modules.
Figure 10. Process flow for microfluidic clean-up and testing of PCR product
Add diH2O
Remove cleaned-‐up sample (retentate)
Load sample
Apply pressure
Load 13 µl diH2O
Incubate 1 min
Analyze by microfluidic separation and detection biochip
2.7 µl PCR productPCR from microfluidic chip (sample)
This document is a research report submitted to the U.S. Department of Justice. This report has not been published by the Department. Opinions or points of view expressed are those of the author(s)
and do not necessarily reflect the official position or policies of the U.S. Department of Justice.
NIJ Forensic DNA R&D NIJ 2009-DN-BX-K256 DNA Analysis of LCN Samples
October 28, 2011 Dr. Eugene Tan, NetBio
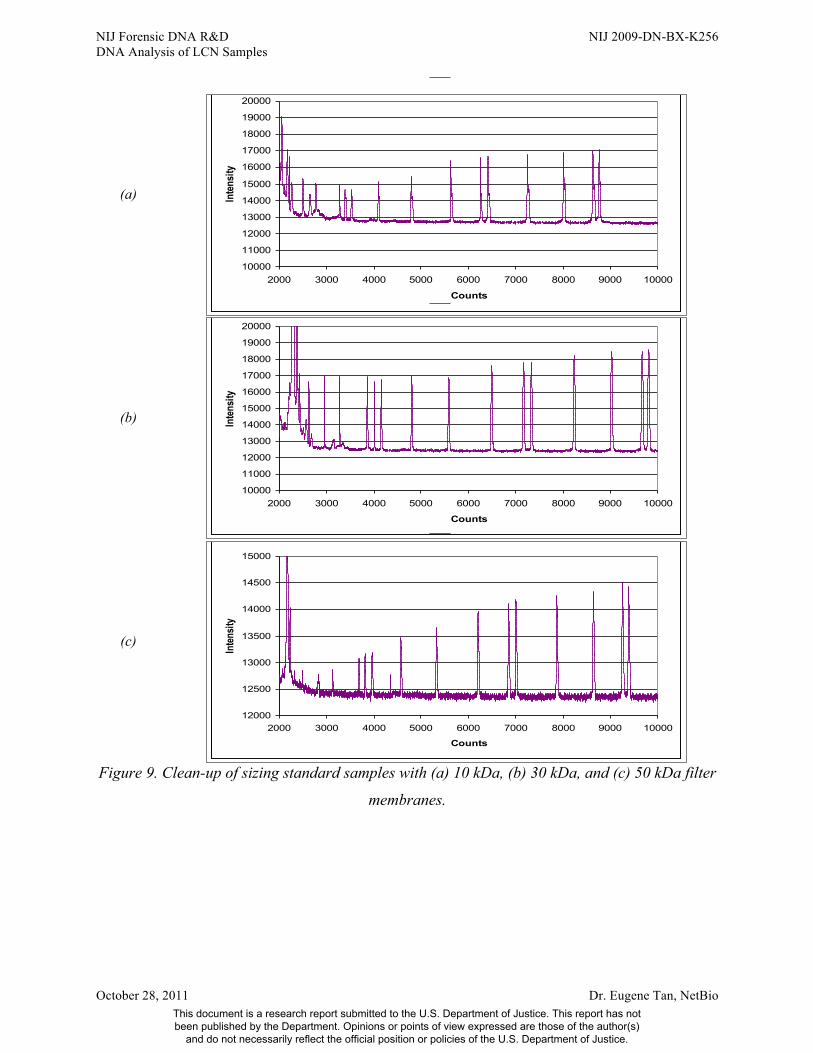
(a) (b)
Figure 11. STR profiles generated from (a) PCR product and (b) cleaned up PCR product. PCR
product was amplified in NetBio’s microfluidic thermal cycling system with 0.25 ng of 9947A
DNA template.
This document is a research report submitted to the U.S. Department of Justice. This report has not been published by the Department. Opinions or points of view expressed are those of the author(s)
and do not necessarily reflect the official position or policies of the U.S. Department of Justice.

NIJ Forensic DNA R&D NIJ 2009-DN-BX-K256 DNA Analysis of LCN Samples
October 28, 2011 Dr. Eugene Tan, NetBio
(a) (b)
Figure 12. STR profiles generated from (a) PCR product and (b) cleaned up PCR product. PCR product was amplified in NetBio’s microfluidic thermal cycling system with near single copy
(0.006 ng) of 9947A DNA template.
This document is a research report submitted to the U.S. Department of Justice. This report has not been published by the Department. Opinions or points of view expressed are those of the author(s)
and do not necessarily reflect the official position or policies of the U.S. Department of Justice.

NIJ Forensic DNA R&D NIJ 2009-DN-BX-K256 DNA Analysis of LCN Samples
October 28, 2011 Dr. Eugene Tan, NetBio
(a) (b)
Figure 13. STR profiles generated from (a) PCR product and (b) cleaned up PCR product. PCR product was amplified in NetBio’s microfluidic thermal cycling system with 0.25 ng of DNA
template purified from a buccal swab using NetBio’s microfluidic purification module.
(a) (b)
Figure 14. STR profiles generated from (a) PCR product and (b) cleaned up PCR product. PCR product was amplified in NetBio’s microfluidic thermal cycling system with near single copy (0.006 ng) of DNA template purified from a buccal swab samples with NetBio’s microfluidic
purification module.
This document is a research report submitted to the U.S. Department of Justice. This report has not been published by the Department. Opinions or points of view expressed are those of the author(s)
and do not necessarily reflect the official position or policies of the U.S. Department of Justice.

NIJ Forensic DNA R&D NIJ 2009-DN-BX-K256 DNA Analysis of LCN Samples
October 28, 2011 Dr. Eugene Tan, NetBio
Task 2: Optimization of injection protocol
The goal of task 2 is to optimize the injection protocols for cleaned-up PCR samples to
maximize signal strength to facilitate identification of loci from LCN samples.
PCR product is comprised of amplified STR fragments, labeled primers, dNTPs, and ions
required for the amplification process. The charged components (ions, primers, and amplified
STR fragments) within the PCR product compete for injection into the separation and detection
channel. In conventional electrophoretic STR analysis, the PCR product must be diluted to
reduce the concentration of fast moving ions in order for sufficient STR fragments to be injected.
For conventional microfluidic separation and detection, the PCR product is diluted to 20% in
formamide. The microfluidic biochip cleanup protocol developed in this program removes ions
and replaces the buffer components with dI water, and the resulting sample is composed
primarily of amplified STR fragments and primers. This elimination of ions allows a larger
fraction of the cleaned PCR product to be loaded for separation and detection without dilution.
The effect of loading increasing amounts of the cleaned PCR product the signal strength
was experimentally determined. The alleles of the D3, vWA, and FGA for a PCR product
generated with Profiler Plus primers using 0.025 ng of DNA template were not detectable when
the PCR product is not cleaned up and loaded according to conventional STR analysis protocols.
The alleles in all loci are distinguishable when the PCR product is cleaned up with the
microfluidic biochip cleanup protocol. Signal strength for the alleles increases linearly with the
amount of cleaned up product loaded is increased. A maximal signal strength was achieved when
all of the cleaned up PCR product was loaded for separation and detection. These results show
that the microfluidic cleanup protocol removes the ions from the sample and STR analysis can be
performed without diluting the sample as is required for conventional STR analysis (Figure 15).
The electrophoretic injection parameters dictate the transfer of sample from the sample
reservoir into the separation and detection channel of the microfluidic separation channel. The
combination of injection voltage and time result in optimal signal strength and resolution.
Loading conditions for Genebench were investigated and an optimized set for microfluidically
cleaned up PCR product was determined.
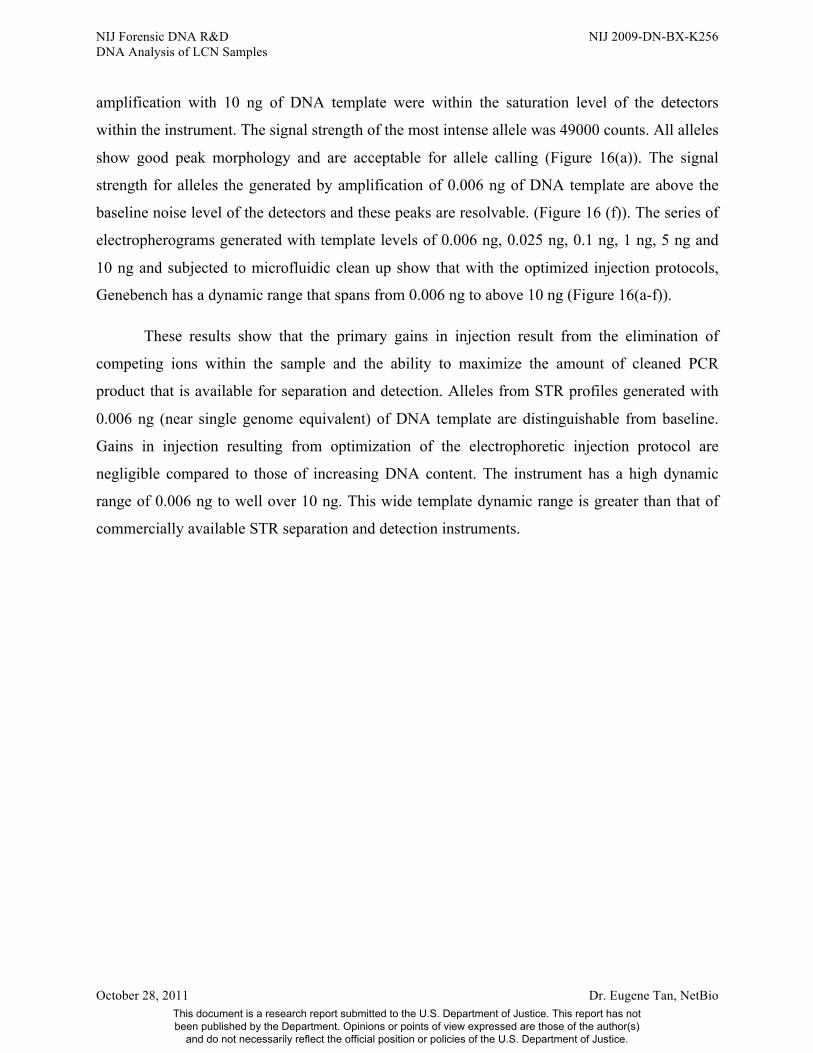
The effect of the optimized injection protocol on the dynamic range of Genebench
was assessed. This signal strength of all the alleles in the electropherograms generated by
This document is a research report submitted to the U.S. Department of Justice. This report has not been published by the Department. Opinions or points of view expressed are those of the author(s)
and do not necessarily reflect the official position or policies of the U.S. Department of Justice.
NIJ Forensic DNA R&D NIJ 2009-DN-BX-K256 DNA Analysis of LCN Samples
October 28, 2011 Dr. Eugene Tan, NetBio
amplification with 10 ng of DNA template were within the saturation level of the detectors
within the instrument. The signal strength of the most intense allele was 49000 counts. All alleles
show good peak morphology and are acceptable for allele calling (Figure 16(a)). The signal
strength for alleles the generated by amplification of 0.006 ng of DNA template are above the
baseline noise level of the detectors and these peaks are resolvable. (Figure 16 (f)). The series of
electropherograms generated with template levels of 0.006 ng, 0.025 ng, 0.1 ng, 1 ng, 5 ng and
10 ng and subjected to microfluidic clean up show that with the optimized injection protocols,
Genebench has a dynamic range that spans from 0.006 ng to above 10 ng (Figure 16(a-f)).
These results show that the primary gains in injection result from the elimination of
competing ions within the sample and the ability to maximize the amount of cleaned PCR
product that is available for separation and detection. Alleles from STR profiles generated with
0.006 ng (near single genome equivalent) of DNA template are distinguishable from baseline.
Gains in injection resulting from optimization of the electrophoretic injection protocol are
negligible compared to those of increasing DNA content. The instrument has a high dynamic
range of 0.006 ng to well over 10 ng. This wide template dynamic range is greater than that of
commercially available STR separation and detection instruments.
This document is a research report submitted to the U.S. Department of Justice. This report has not been published by the Department. Opinions or points of view expressed are those of the author(s)
and do not necessarily reflect the official position or policies of the U.S. Department of Justice.

NIJ Forensic DNA R&D NIJ 2009-DN-BX-K256 DNA Analysis of LCN Samples
October 28, 2011 Dr. Eugene Tan, NetBio
(a)
(b)
(c)
(d)
Figure 15 . STR profiles for 0.025ng of DNA template injected under (a) conventional injection protocols and with (b) 2.7 µl, (c) 8.1 µl and (d) 13 µl of cleaned PCR product in a 13 µl sample that loaded for separation and detection.
This document is a research report submitted to the U.S. Department of Justice. This report has not been published by the Department. Opinions or points of view expressed are those of the author(s)
and do not necessarily reflect the official position or policies of the U.S. Department of Justice.

NIJ Forensic DNA R&D NIJ 2009-DN-BX-K256 DNA Analysis of LCN Samples
October 28, 2011 Dr. Eugene Tan, NetBio
(a) (b)
(c) (d)
(e) (f)
Figure 16. Raw electropherograms of for (a) 10 ng, (b) 5 ng, (c) 1 ng, (d) 0.1 ng, (e) 0.025 ng, and (f) 0.006 ng of DNA template following microfluidic ultrafiltration and separated and
detected using the optimized injection protocols.
This document is a research report submitted to the U.S. Department of Justice. This report has not been published by the Department. Opinions or points of view expressed are those of the author(s)
and do not necessarily reflect the official position or policies of the U.S. Department of Justice.

NIJ Forensic DNA R&D NIJ 2009-DN-BX-K256 DNA Analysis of LCN Samples
October 28, 2011 Dr. Eugene Tan, NetBio
Task 3: Testing of the microfluidic cleanup and optimized injection protocol
on forensically relevant samples.
The goal of task 3 is to test the performance of the microfluidic UF cleanup biochip and
protocol in tandem with the optimized injection protocols for separation and detection on a series
of forensically relevant samples.
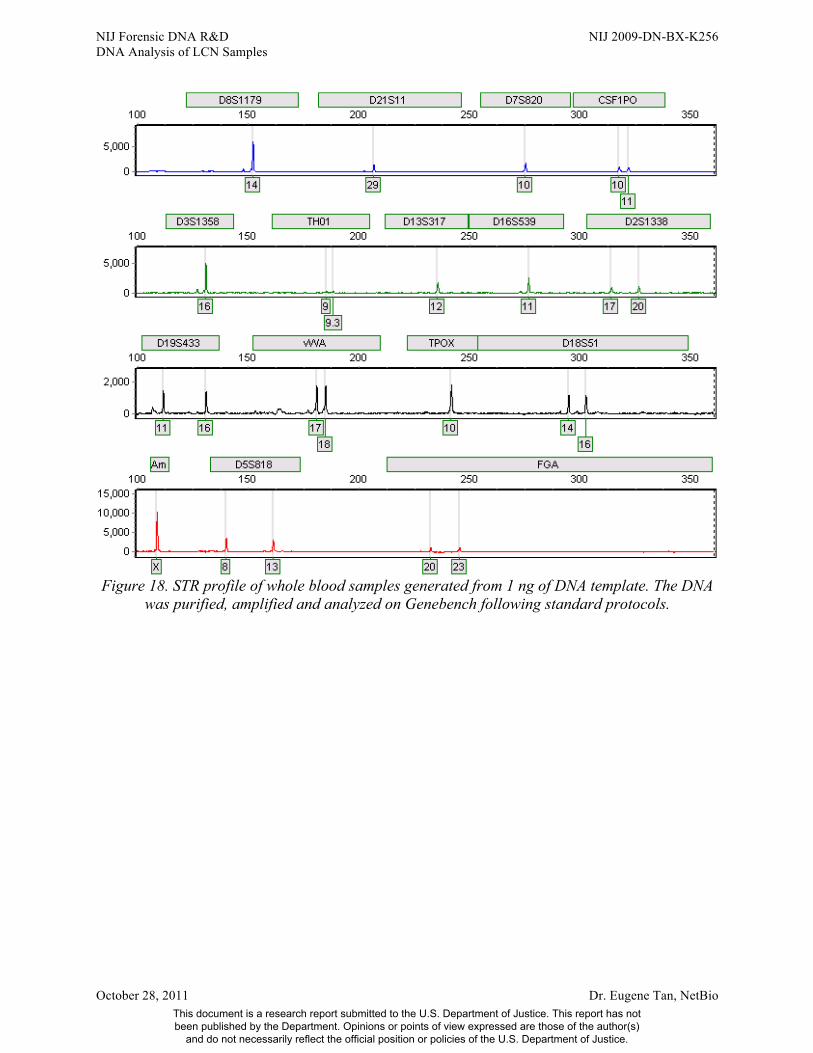
Whole blood. DNA purified from whole blood was quantified and serially diluted to
generate PCR reactions with 0.025 ng and 1 ng of DNA template. The sample preparation and
purification protocols are detailed in the Methods section. PCR reactions were performed in a
microfluidic biochip as detailed in the Methods section. PCR product generated with 0.025 ng
reactions were subjected to post PCR cleanup as detailed in the Methods section. These samples
were injected with the optimized protocol developed in Task 2 and analyzed on Genebench
(Figure 17). The PCR products from the 1 ng reactions were subjected to separation and
detection following standard protocols. Separation and detection samples that were prepared
from PCR product generated with 1 ng reactions were subjected to standard preparations and
analyzed on Genebench (Figure 18). Comparison of Figures 17 and 18 shows 11 of 24 alleles are
present and called. Allele drop-in is observed the D3S1358 locus. Allele drop-out is observed at
loci CFS1PO, Th01, D2S1338, D19S433, vWA, TPOX, D18S51, and FGA. Alleles that are
present and called show signal strengths of 200 to 3000 RFU and are clearly distinguishable
from baseline. The drop-in and drop-outs observed are symptomatic of LCN PCR amplification.
Saliva samples. DNA purified from saliva was quantified and serially diluted to generate
PCR reactions with 0.025 ng and 1 ng of DNA template. The sample preparation and purification
protocols are detailed in the Methods section. PCR reactions were performed in a microfluidic
biochip as detailed in the Methods section. PCR product generated with 0.025 ng reactions were
subjected to post PCR cleanup as detailed in the Methods section. These samples were injected
with the optimized protocol developed in Task 2 and analyzed on Genebench (Figure 19). The
PCR products from the 1 ng reactions were subjected to separation and detection following
standard protocols. Separation and detection samples that were prepared from PCR product
generated with 1 ng reactions were subjected to standard preparations and analyzed on
Genebench (Figure 22). Comparison of Figures 19 and 20 shows 25 of 29 alleles are present and
called. Allele drop-in is observed the D3S1358 locus. Allele drop-out is observed at loci
This document is a research report submitted to the U.S. Department of Justice. This report has not been published by the Department. Opinions or points of view expressed are those of the author(s)
and do not necessarily reflect the official position or policies of the U.S. Department of Justice.
NIJ Forensic DNA R&D NIJ 2009-DN-BX-K256 DNA Analysis of LCN Samples
October 28, 2011 Dr. Eugene Tan, NetBio
D3S1358, D2S1338, TPOX, and Amelogenin. Alleles that are present and called show signal
strengths of 200 to 10000 RFU and are clearly distinguishable from baseline.
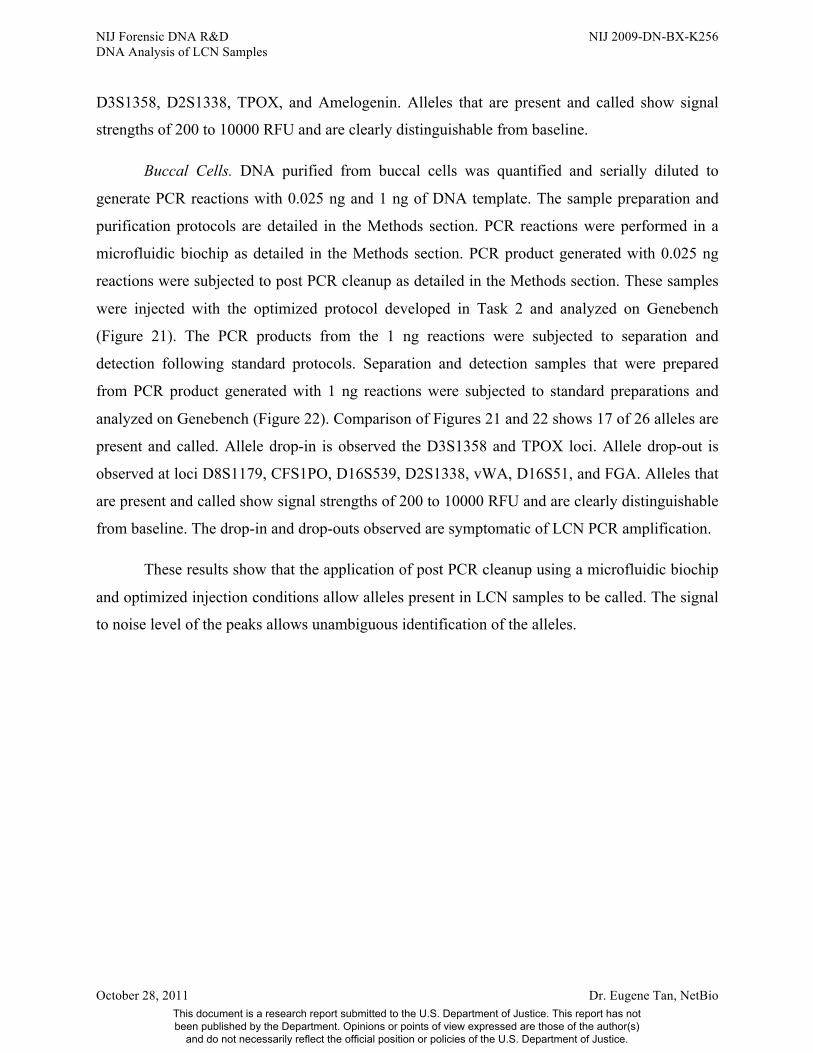
Buccal Cells. DNA purified from buccal cells was quantified and serially diluted to
generate PCR reactions with 0.025 ng and 1 ng of DNA template. The sample preparation and
purification protocols are detailed in the Methods section. PCR reactions were performed in a
microfluidic biochip as detailed in the Methods section. PCR product generated with 0.025 ng
reactions were subjected to post PCR cleanup as detailed in the Methods section. These samples
were injected with the optimized protocol developed in Task 2 and analyzed on Genebench
(Figure 21). The PCR products from the 1 ng reactions were subjected to separation and
detection following standard protocols. Separation and detection samples that were prepared
from PCR product generated with 1 ng reactions were subjected to standard preparations and
analyzed on Genebench (Figure 22). Comparison of Figures 21 and 22 shows 17 of 26 alleles are
present and called. Allele drop-in is observed the D3S1358 and TPOX loci. Allele drop-out is
observed at loci D8S1179, CFS1PO, D16S539, D2S1338, vWA, D16S51, and FGA. Alleles that
are present and called show signal strengths of 200 to 10000 RFU and are clearly distinguishable
from baseline. The drop-in and drop-outs observed are symptomatic of LCN PCR amplification.
These results show that the application of post PCR cleanup using a microfluidic biochip
and optimized injection conditions allow alleles present in LCN samples to be called. The signal
to noise level of the peaks allows unambiguous identification of the alleles.
This document is a research report submitted to the U.S. Department of Justice. This report has not been published by the Department. Opinions or points of view expressed are those of the author(s)
and do not necessarily reflect the official position or policies of the U.S. Department of Justice.

NIJ Forensic DNA R&D NIJ 2009-DN-BX-K256 DNA Analysis of LCN Samples
October 28, 2011 Dr. Eugene Tan, NetBio
Figure 17. STR profile of whole blood samples generated from 0.025 ng of DNA template. The DNA was purified, amplified, and cleaned up in a microfluidic biochip. Analysis on Genebench
was performed with an injection protocol that was optimized for LCN samples.
This document is a research report submitted to the U.S. Department of Justice. This report has not been published by the Department. Opinions or points of view expressed are those of the author(s)
and do not necessarily reflect the official position or policies of the U.S. Department of Justice.
NIJ Forensic DNA R&D NIJ 2009-DN-BX-K256 DNA Analysis of LCN Samples
October 28, 2011 Dr. Eugene Tan, NetBio
Figure 18. STR profile of whole blood samples generated from 1 ng of DNA template. The DNA
was purified, amplified and analyzed on Genebench following standard protocols.
This document is a research report submitted to the U.S. Department of Justice. This report has not been published by the Department. Opinions or points of view expressed are those of the author(s)
and do not necessarily reflect the official position or policies of the U.S. Department of Justice.

NIJ Forensic DNA R&D NIJ 2009-DN-BX-K256 DNA Analysis of LCN Samples
October 28, 2011 Dr. Eugene Tan, NetBio
Figure 19. STR profile of saliva samples generated from 0.025 ng of DNA template. The DNA was purified, amplified, and cleaned in a microfluidic biochips. Analysis on Genebench was
performed with an injection protocol that was optimized for LCN samples.
This document is a research report submitted to the U.S. Department of Justice. This report has not been published by the Department. Opinions or points of view expressed are those of the author(s)
and do not necessarily reflect the official position or policies of the U.S. Department of Justice.
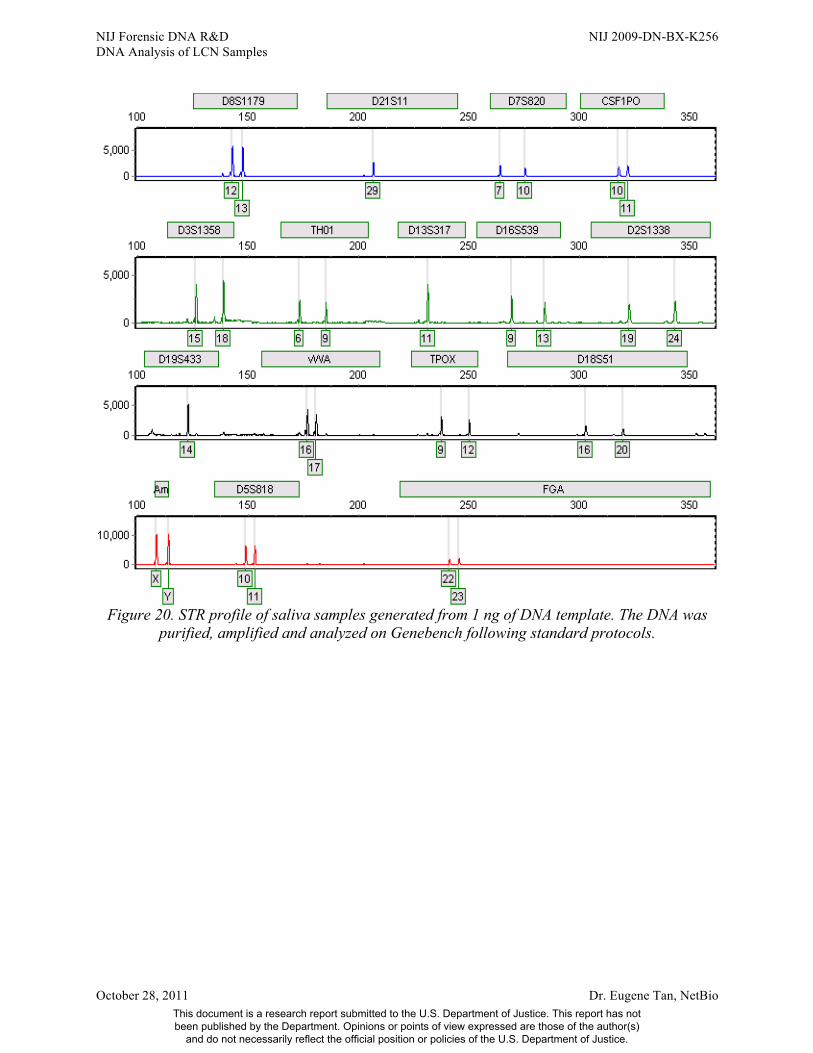
NIJ Forensic DNA R&D NIJ 2009-DN-BX-K256 DNA Analysis of LCN Samples
October 28, 2011 Dr. Eugene Tan, NetBio
Figure 20. STR profile of saliva samples generated from 1 ng of DNA template. The DNA was
purified, amplified and analyzed on Genebench following standard protocols.
This document is a research report submitted to the U.S. Department of Justice. This report has not been published by the Department. Opinions or points of view expressed are those of the author(s)
and do not necessarily reflect the official position or policies of the U.S. Department of Justice.

NIJ Forensic DNA R&D NIJ 2009-DN-BX-K256 DNA Analysis of LCN Samples
October 28, 2011 Dr. Eugene Tan, NetBio
Figure 21. STR profile of saliva samples generated from 0.025 ng of DNA template. The DNA was purified, amplified, and cleaned in a microfluidic biochips. Analysis on Genebench was
performed with an injection protocol that was optimized for LCN samples.
This document is a research report submitted to the U.S. Department of Justice. This report has not been published by the Department. Opinions or points of view expressed are those of the author(s)
and do not necessarily reflect the official position or policies of the U.S. Department of Justice.
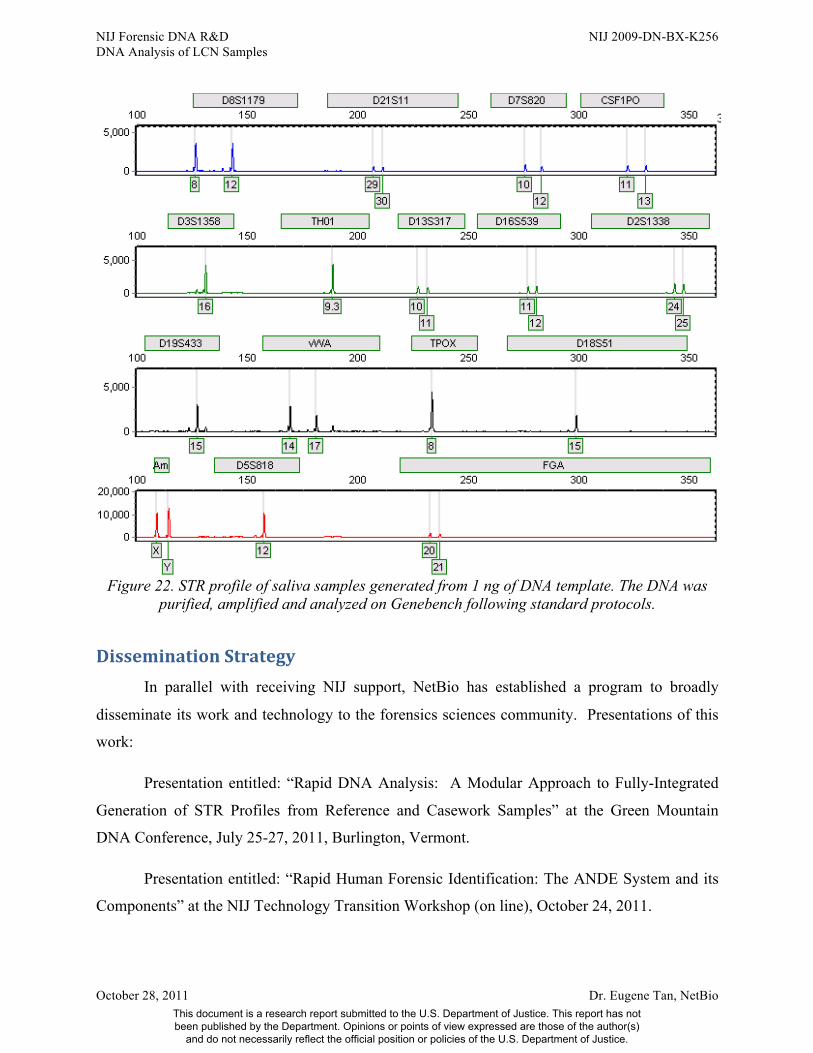
NIJ Forensic DNA R&D NIJ 2009-DN-BX-K256 DNA Analysis of LCN Samples
October 28, 2011 Dr. Eugene Tan, NetBio
Figure 22. STR profile of saliva samples generated from 1 ng of DNA template. The DNA was
purified, amplified and analyzed on Genebench following standard protocols.
Dissemination Strategy In parallel with receiving NIJ support, NetBio has established a program to broadly
disseminate its work and technology to the forensics sciences community. Presentations of this
work:
Presentation entitled: “Rapid DNA Analysis: A Modular Approach to Fully-Integrated
Generation of STR Profiles from Reference and Casework Samples” at the Green Mountain
DNA Conference, July 25-27, 2011, Burlington, Vermont.
Presentation entitled: “Rapid Human Forensic Identification: The ANDE System and its
Components” at the NIJ Technology Transition Workshop (on line), October 24, 2011.
This document is a research report submitted to the U.S. Department of Justice. This report has not been published by the Department. Opinions or points of view expressed are those of the author(s)
and do not necessarily reflect the official position or policies of the U.S. Department of Justice.
NIJ Forensic DNA R&D NIJ 2009-DN-BX-K256 DNA Analysis of LCN Samples
October 28, 2011 Dr. Eugene Tan, NetBio
Implications for Policy and Practice The availability of an STR typing instrument that combines DNA extraction and
purification, amplification, and separation into a single instrument would represent a substantial
advance in forensic DNA analysis. Significant burdens in setting up and operating a forensic
DNA analysis laboratory are the costs of dedicated rooms to prevent PCR contamination,
automating the procedures (either through robotics or dedicated technicians), and validating and
re-validating individual instruments and the entire series of laboratory processes. A fully
integrated instrument has the potential to be faster, more sensitive, less costly, and less labor-
intensive than currently available technologies.
The ability to analyze LCN samples collected from both violent and high-volume crime
scenes would be enhanced if the proposed research is successful. A rapid, fully integrated, easy
to operate, and cost-effective system for DNA analysis of LCN evidence would represent an
important step towards making routine LCN DNA analysis for high-volume crimes a reality and
would allow an extensive and systematic evaluation of LCN evidence in violent crimes as well.
The system would also have the potential to benefit the analysis of trace DNA evidence in
intelligence operations.
The use of LCN DNA in solving high-volume property crime and violent crime
investigations is in its infancy and is not yet widely accepted by the forensics science
community. Reservations to applying this technology are based on the reliability of STR profile
generation from LCN samples and the labor, time, and expense required to generate profiles
from these samples. In addition, policy, training, and procedures to support this mode of DNA
analysis have not yet been fully developed and implemented. A fully integrated, microfluidic
sample-in to results-out STR profiling system has the potential to address these problems by
improving both the quality and throughput of LCN profiles.
This document is a research report submitted to the U.S. Department of Justice. This report has not been published by the Department. Opinions or points of view expressed are those of the author(s)
and do not necessarily reflect the official position or policies of the U.S. Department of Justice.