dmi college of engineering
TRANSCRIPT

DMI COLLEGE OF ENGINEERING
DEPARTMENT OF ELECTRICAL AND
ELECTRONICS ENGINEERING
BASIC ELECTRICAL, ELECTRONICS AND
INSTRUMENTATION ENGINEERING LABORATORY
MANUAL
REG NO
CLASS I YEAR MECHANICAL
SEMESTER II SEM
SUBJECT CODE BE - 8261


BE - 8261
BASIC ELECTRICAL, ELECTRONICS AND
INSTRUMENTATION ENGINEERING LABORATORY
MANUAL

LIST OF EXPERIMENTS
BE 8261 - BASIC ELECTRICAL, ELECTRONICS AND INSTRUMENTATION
ENGINEERING LABORATORY
1. Load test on separately excited DC generator
2. Load test on Single phase Transformer
3. Load test on Induction motor
4. Verification of Circuit Laws
5. Verification of Circuit Theorems
6. Measurement of three phase power
7. Load test on DC shunt motor.
8. Diode based application circuits
9. Transistor based application circuits
10. Study of CRO and measurement of AC signals
11. Characteristics of LVDT
12. Calibration of Rotometer
13. RTD and Thermistor.

LIST OF EXPERIMENTS
CYCLE 1:
1. Verification of Circuit Laws
2. Verification of Circuit Theorems
3. Load test on Single phase Transformer
4. Load test on Single phase Induction motor
5. Load test on DC shunt motor.
6. Temperature Transducer
CYCLE 2:
7. Load test on separately excited DC generator
8. Measurement of three phase power
9. Diode based application circuits
10. Transistor based application circuits
11. Study of CRO and measurement of AC signals
12. Characteristics of LVDT
13. Calibration of Rotometer

INDEX
S.No
Date
Experiment Name Marks Staff
Sign


CIRCUIT DIAGRAMS:
Figure–1.1Verification of KVL
Figure–1.2 Verification of KCL
OBSERVATIONS:
For KVL
Applied
Voltage
V (volts)
V1(volts) V2(volts) V3(volts) V1+V2+V3(volts)
Theoritical Practical Theoritical Practical Theoritical Practical Theoritical Practical
For KCL
Applied
Voltage
V (volts)
I1(A) I2 (A) I3(A) I2+I3(A)
Theoretical Practical Theoretical Practical Theoretical Practical Theoretical Practical

Ex.No:1 VERIFICATION OF KVL AND KCL
Date: AIM:
To verify Kirchhoff’s Voltage Law (KVL) and Kirchhoff’s Current Law (KCL) in a Passive
Resistive Network .
APPARATUS:
S.No Apparatus Name Range Type Quantity
1 RPS
2 Ammeter
3 Voltmeter
4 Resistors
5 Bread Board - - 01
6 Connecting Wires - - As required

THEORITICAL CALCULATION:

PRECAUTIONS:
1. Check for proper connections before switching ON the supply
2. Make sure of proper color coding of resistors
3. The terminal of the resistance should be properly connected.
PROCEDURE:
To Verify KVL
1. Connect the circuit diagram as shown in Figure 1.1
2. Switch ON the supply to RPS.
3. Apply the voltage (say 5v) and note the voltmeter readings.
4. Gradually increase the supply voltage in steps.
5. Note the readings of voltmeters.
6. Sum up the voltmeter readings (voltage drops) , that should be equal to applied voltage .
7. Thus KVL is Verified practically.
To Verify KCL
1. Connect the circuit diagram as shown in Figure 1.2.
2. Switch ON the supply to RPS.
3. Apply the voltage (say 5v) and note the Ammeter readings.
4. Gradually increase the supply voltage in steps.
5. Note the readings of Ammeters.
6. Sum up the Ammeter readings (I1and I2) , that should be equal to total current(I).
7. Thus KCL is Verified practically
RESULT:

CIRCUIT DIAGRAM:
Fig-1 Actual Circuit
Fig-2 Both Voltage Sources are acting
(V1&V2) Fig -3 Voltage Source V1is acting
Alone
Fig -4 VoltageSourceV2is acting alone

Ex.No:2A VERIFICATION OF SUPERPOSITION THEOREM
Date:
AIM:
To Verify principle of Superposition theoretically and practically.
STATEMENT:
In an linear, bilateral network the response in any element is equal to sum of individual responses
While all other sources are non-operative.
APPARATUS REQUIRED:
S.No. Equipment Range Type Quantity
1. Resistors - -
2. Ammeter
3. R.P.S
4. Bread Board - -
5. Connecting Wires required

TABULAR COLUMN:
PARAMETERS WHEN BOTH
V1 &V2≠0 (I)
WHEN
V1≠0 &V2=0 (I1)
WHEN
V1=0&V2≠0
(I2)
I=I1+I2
Current through R3(Theoretical Values)
Current through R3(Practical Values)
THEORITICAL CALCULATION:

PRECAUTIONS:
1. Check for proper connections before switching ON the supply
2. Make sure of proper color coding of resistors
3. The terminal of the resistance should be properly connected
PROCEDURE:
4. Connect the circuit as shown in figure (2) and note down the current flowing through R3and let
it be I.
5. Connect the circuit as shown in figure (3) and note down the ammeter Reading, and let it be I1.
6. Connect the circuit as shown in figure (4) and note down the ammeter reading, and let it be I2.
7. Verify for I=I1+I2.
8. Compare the practical and theoretical currents.
RESULT

CIRCUITDIAGRAM:
NOTE: USE RL VALUE IN DRB
Maximum Power Transfer Circuit
TABULAR COLUMN:
Applied
Voltage
(V)
RL(Ω)
VTH(v)
IL (A) Pmax = IL2*RL
Theoretical Practical Theoretical Practical Theoretical Practical
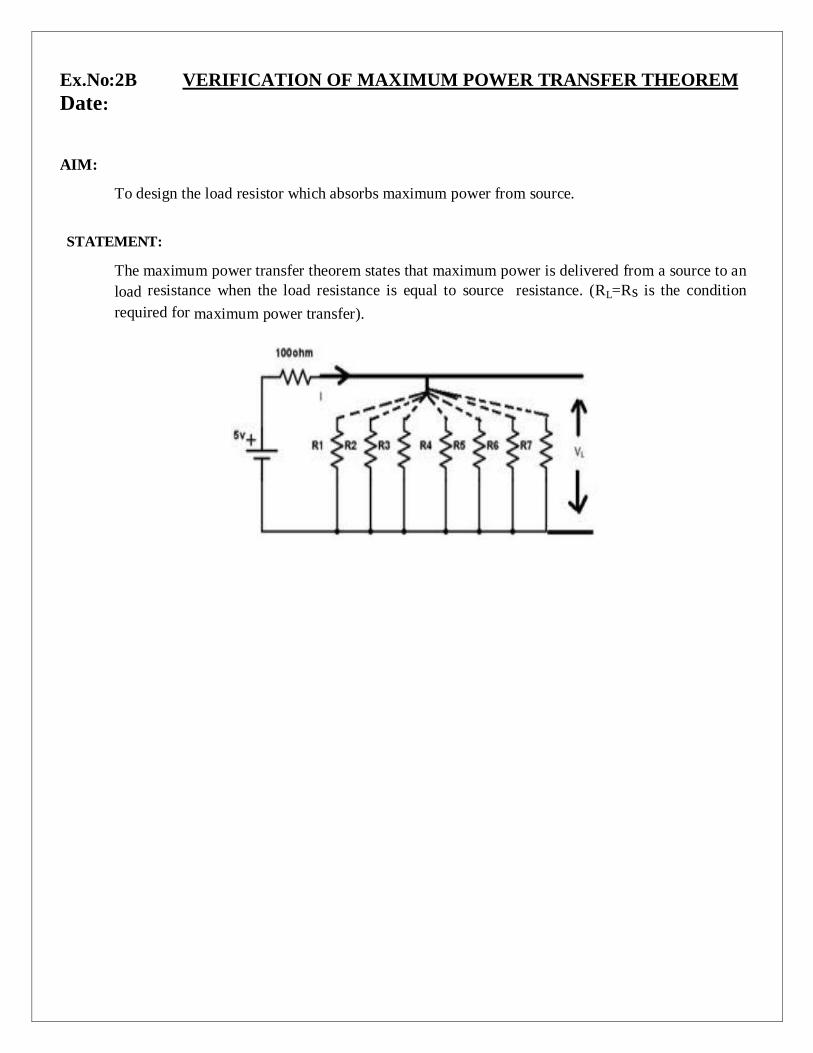
Ex.No:2B VERIFICATION OF MAXIMUM POWER TRANSFER THEOREM
Date:
AIM:
To design the load resistor which absorbs maximum power from source.
STATEMENT:
The maximum power transfer theorem states that maximum power is delivered from a source to an
load resistance when the load resistance is equal to source resistance. (RL=Rs is the condition
required for maximum power transfer).

MODELGRAPH:
Output Graph of Maximum Power Transfer Theorem
THEORITICAL CALCULATION:

PRECAUTIONS:
1. Check for proper connections before switching ON the supply
2. Make sure of proper color coding of resistors
3. The terminal of the resistance should be properly connected
PROCEDURE:
1. Connect the circuit as shown in fig.
2. Vary the load resistance insteps and note down voltage across the load and current flowing
through the circuit.
3. Calculate power delivered to the load by using formula P=V*I.
4. Draw the graph between resistance and power (resistance on X-axis and power on Y-axis).
5. Verify the maximum power is delivered to the load when RL = Rs (i.e Rth) for DC.
RESULT

CIRCUIT DIAGRAM:
fig.1 Actual Circuit
fig. 2 Measurement of VTHor VOC fig.3 Measurement of IL
fig. 4 Thevenin’s Equivalent Circuit: A
RT H =
IL
VTH = B RL =100Ω

Ex.No:2C VERIFICATION OF THEVENIN’S THEOREM
Date:
AIM:
To Verify Thevenin’s theorem.
APPARATUS:
S.No. Equipment Range Type Quantity
1 Ammeter
2 Voltmeter
3 R.P.S
4 Bread Board
5 Resistors
6 Connecting Wires As required
STATEMENT:
Any linear bilateral network with two output terminals AB can be replaced by a simple
equivalent circuit with single voltage source Vth (Thevinin voltage or Open circuit voltage) in series
with a single resistor Rth (Thevenin resistance) or impedance Zth (Thevenin’s impedance in ac
circuit ).
RTH
A A
Linear Bilateral
Active Network
B
VTH
B
Rth = Thevenin’s Resistance (Equivalent resistance between A and B) in ohms
Vth = Thevenin’s Resistance (Open circuit voltage between A and B) in volts
RL = Load resistance connected between A and B in ohms
IL = Load Current = Vth / (Rth + RL) in amps

TABULAR COLUMN:
S.No
Theoretical Value Practical Value
Thevenin’s Voltage VTH
(V)
Current flowing
through RL
(IL)mA
Thevenin’s Voltage VTH
(V)
Current flowing
through RL
(IL)mA
THEORETICAL CALCULATION:

PRECAUTIONS:
1. Check for proper connections before switching ON the supply
2. Make sure of proper color coding of resistors
3. The terminal of the resistance should be properly connected.
PROCEDURE:
1. Connect the circuit diagram as shown in fig.2.2
2. Measure open circuit voltage Voc by open circuiting terminals i.e, Vth
3. Connect the circuit as shown in fig2.3.
4. Measure current in RL.
5. Draw the Thevenin’s equivalent circuit as shown in fig2.4
RESULT:

CIRCUIT DIAGRAM:
Fig –1 Actual Circuit
Fig –2 Norton’s Current Fig –3 To find IL
Fig – 4 Norton’s Equivalent Circuit

Ex.No:2D VERIFICATION OF NORTON’S THEOREM
Date:
AIM:
To verify Norton’s theorem of given Network by experimental and simulation.
APPARATUS:
S.
No.
Equipment Range Type Quantity
1 Ammeter
2 Voltmeter
3 R.P.S
4 Bread Board
5 Resistors
6 Connecting Wires As required
STATEMENT
Any linear bilateral network with two output terminals AB can be replaced by a
simple equivalent circuit with single current source IN or Isc (Norton’s current or Short
circuit current) in parallel with a single resistor RN(Norton resistance) or impedance
ZN (Norton impedance) about the terminals AB.
A A
Linear Bilateral
Active Network
RN
B
IN
B
RN = Norton’s Resistance (Equivalent resistance between A and B)
IN = Norton’s current (Short circuited path current through A and B)in milli amps
RL = Load resistance connected between A and B in ohms
IL = Load Current = (IN x Rth) / (Rth + RL) in milliamps

TABULATIONS:
S. No
Theoretical Value
Practical Value
Norton’s current IN (mA)
Load Current IL (mA)
Norton’s current IN (mA)
Load Current IL(mA)
THEORITICAL CALCULATION:

PRECAUTIONS:
1. Check for proper connections before switching ON the supply
2. Make sure of proper color coding of resistors
3. The terminal of the resistance should be properly connected
EXPERIMENTAL PROCEDURE:
1. Connect the circuit diagram as shown infig.2.
2. Measure the current Isc (or) IN through AB by short-circuiting the resistance between A and
B.
3. Connect the circuit diagram as shown infig.3.
4. Measure the load current IL.
5. Draw Norton's equivalent circuit by connecting IN& RNin parallel as showninfig.4 and find
loadcurrent.
RESULT:


Ex.No:3 LOAD TEST ON A SINGLE PHASE TRANSFORMER
Date:
AIM:
To conduct load test on single phase transformer and to find efficiency and percentage
regulation.
APPARATUS REQUIRED:
S.No. Apparatus Range Type Quantity
1 Ammeter (0-10)A
(0-5) A
MI
MI
1
1
2 Voltmeter (0-150)V
(0-300) V
MI
MI
1
1
3 Wattmeter (300V, 5A)
(150V, 5A)
Upf
Upf
1
1
4 Auto Transformer 1, (0-260)V - 1
5 Resistive Load 5KW, 230V - 1
6 Connecting Wires 2.5sq.mm Copper Few
FORMULAE:
Output Power = W2 x Multiplication factor
Input Power = W1 x Multiplication factor
Output Power
Efficiency % = -------------------- x 100%
Input Power
VNL - VFL (Secondary)
Regulation R % = ------------------------------ x 100%
VNL

TABULAR COLUMN:
S.
N
o.
Loa
d
Primary Secondary Input
Power
W1 x
MF
Output
Power
W2 x
MF
Efficie
ncy
%
%
Reg
ulati
on
V1
(Volts
)
I1
(Amp
)
W1
(Watt
)
V2
(Volt)
I2
(Amp
)
W2
(Watt
)
1.
2.
3.
4.
5.
6.
7
.
8
MODEL GRAPHS:
Eff
icie
ncy
%
Reg
ula
tio
n R
%
R
Output Power (Watts)

PRECAUTIONS:
1. Auto Transformer should be in minimum position.
2. The AC supply is given and removed from the transformer under no load condition.
PROCEDURE:
1. Connections are made as per the circuit diagram.
2. After checking the no load condition, minimum position of auto transformer and DPST
switch is closed.
3. Ammeter, Voltmeter and Wattmeter readings on both primary side and secondary side are
noted.
4. The load is increased and for each load, Voltmeter, Ammeter and Wattmeter readings on
both primary and secondary sides are noted.
5. Again no load condition is obtained and DPST switch is opened.
RESULT:
Thus the load test on single phase transformer is conducted.


Ex.No:4 LOAD TEST ON SINGLE PHASE INDUCTION MOTOR
Date:
AIM:
To conduct the load on single-phase induction motor & to draw its performance
characteristics. APPARATUS REQUIRED:
S.No Name of the Apparatus Range Type Quantity
1 Ammeter (0 – 10A) MI 1
2 Voltmeter (0 – 300)V MI 1
3 Wattmeter 300V,10A UPF 2
4 1 Phase auto transformer 230V/0-
- 1
270V
5 Tachometer _ - 1
6 Connecting Wires _ _ 1 Set
THEORY:
The single phase induction motor is more or less a polyphase induction motor. The only
difference is that is given supply in single phase. This motor connect and motor function without
any initial start the motor having some part which is called starter and rotor. These are two types
of starting a 1 phase induction motor namely capacitor-start and other is split-phase. These motors
are widely used in domestic purpose. FORMULA USED: 1. Torque T=9.81x(f1~ f2) x r (N-M)
2. Output Power = 2ΠNT / 60 3. Input Power =WL (Wattmeter readings in Watts) 4. % Slip =(NS-N) / (NS ) x 100
Where, NS = Synchronous speed = 1500 rpm. 5. Power factor = Input Power / VL IL 6. Efficiency = (Output Power / Input Power) x 100

OBSERVATION TABULATION:
Sl. Line Line
Voltage Current
No
VL(Amps) IL(Amps)
Input Power
Pi (Watts) Reading Actual
Speed Spring Balance
Reading
N(rpm )
F1
F2
( kg ) ( kg )
CALCULATION TABULATION:
Line
Output Input
%
Torque
Power
S.No current p.f % Slip
Power Efficiency
Pi
(N.m)
IL(Amps) P0(Watts) η
(Watts)

PRECAUTIONS:
1. Fuses are checked out
2. Initially the motor should be in no load condition
3. The variac should be in minimum position
PROCEDURE:
1. Connections are given as per the circuit diagram
2. The supply is switched on
3. By adjusting the variac, set the rated voltage across the motor
4. By applying the load take various reading until rated load

MODEL GRAPHS:
MODEL CALCULATION:

RESULT:


Ex.No:5 LOAD TEST ON DC SHUNT MOTOR
Date:
AIM:
To conduct load test on DC shunt motor and to find efficiency.
APPARATUS REQUIRED:
S.No. Apparatus Range Type Quantity
1 Ammeter (0-20)A MC 1
2 Voltmeter (0-300)V MC 1
3 Rheostat 1250, 0.8A Wire Wound 1
4 Tachometer (0-1500) rpm Digital 1
5 Connecting Wires 2.5sq.mm. Copper Few
FORMULAE:
Circumference
R = ------------------- m
100 x2
Torque T = (S1 S2) x R x 9.81 Nm
Input Power Pi = VI Watts
2NT
Output Power Pm = -------- Watts
60
Output Power
Efficiency % = ------------------- x 100%
Input Power

TABULAR COLUMN:
S.No.
Voltage
V
(Volts)
Current
I
(Amps)
Spring
Balance
Reading (S1S2)
Kg
Speed
N
(rpm)
Torque
T
(Nm)
Output
Power
Pm
(Watts)
Input
Power
Pi
(Watts)
Efficie
ncy
% S1
(Kg)
S2
(Kg)
1.
2.
3.
4.
5.
6.
MODEL GRAPHS:
Sp
eed
N
(rp
m)
y
x
Torque T
(Nm)
Sp
eed
N (
rpm
)
To
rqu
e T
(N
m)
Eff
icie
ncy
%
N
T
y3 y2 y1
Output Power
(Watts)

PRECAUTIONS:
1. DC shunt motor should be started and stopped under no load condition.
2. Field rheostat should be kept in the minimum position.
3. Brake drum should be cooled with water when it is under load.
PROCEDURE:
1. Connections are made as per the circuit diagram.
2. After checking the no load condition, and minimum field rheostat position, DPST
switch is closed and starter resistance is gradually removed.
3. The motor is brought to its rated speed by adjusting the field rheostat.
4. Ammeter, Voltmeter readings, speed and spring balance readings are noted under
no load condition.
5. The load is then added to the motor gradually and for each load, voltmeter,
ammeter, spring balance readings and speed of the motor are noted.
6. The motor is then brought to no load condition and field rheostat to minimum
position, then DPST switch is opened.
RESULT:
Thus load test on DC shunt motor is conducted and its efficiency is determined.

Ex.No:6 LOAD CHARACTERISTICS OF SEPARATELY
EXCITED DC SHUNT GENERATOR
Date:
AIM:
To obtain internal and external characteristics of DC separately excited DC shunt
generator.
APPARATUS REQUIRED:
S.No. Apparatus Range Type Quantity
1 Ammeter (0-2)A
(0-20) A
MC
MC
1
1
2 Voltmeter (0-300)V MC 1
3 Rheostats 1200, 0.8A Wire Wound 2
4 Loading Rheostat 5KW, 230V - 1
5 Tachometer (0-1500)rpm Digital 1
6 Connecting Wires 2.5sq.mm. Copper Few
PRECAUTIONS:
1. The field rheostat of motor should be at minimum position.
2. The field rheostat of generator should be at maximum position.
3. No load should be connected to generator at the time of starting and stopping.
PROCEDURE:
1. Connections are made as per the circuit diagram.
2. After checking minimum position of DC shunt motor field rheostat and maximum
position of DC shunt generator field rheostat, DPST switch is closed and starting
resistance is gradually removed.
3. Under no load condition, Ammeter and Voltmeter readings are noted, after
bringing the voltage to rated voltage by adjusting the field rheostat of generator.
4. Load is varied gradually and for each load, voltmeter and ammeter readings are
noted.
5. Then the generator is unloaded and the field rheostat of DC shunt generator is
brought to maximum position and the field rheostat of DC shunt motor to
minimum position, DPST switch is opened.


DETERMINATION OF ARMATURE RESISTANCE:
PROCEDURE:
1. Connections are made as per the circuit diagram.
2. Supply is given by closing the DPST switch.
3. Readings of Ammeter and Voltmeter are noted.
4. Armature resistance in Ohms is calculated as Ra = (Vx1.5) /I
D
P
S
T
S
W
I
T
C
H
+
-
- +
(0-300)V
MC
(0-20)A
MC
Fuse
Fuse
A1
A2
27A
27A
LOAD
5 KW, 230V
G
A
V 220V
DC Supply
+
-

TABULAR COLUMN:
S.N
o.
Voltage
V (Volts)
Current
I (Amps)
Armature
Resistance
Ra (Ohms)
S.No.
Field
Current
If (Amps)
Load
Current
IL (Amps)
Terminal
Voltage
(V) Volts
Ia = IL + If
(Amps)
Eg =V + Ia Ra
(Volts)

FORMULAE:
Eg = V + Ia Ra (Volts)
Ia = IL + If (Amps)
Eg : Generated emf in Volts
V : Terminal Voltage in Volts
Ia : Armature Current in Amps
IL : Line Current in Amps
If : Field Current in Amps
Ra : Armature Resistance in Ohms
MODEL GRAPH:
VL,
E
(Vo
lts)
If, IL (Amps)
V Vs IL
(Ext Char)
E Vs IL
(Int Char)

MODEL CALCULATION:
RESULT:
Thus load characteristics of separately excited DC shunt generator is obtained.

CIRCUIT DIAGRAM:
TABULATION:
LOAD VOLTAGE CURRENT POWER POWER
VL IL
FACTOR
COS ɸ (W)
(V) (A)

Ex.No:7 MEASUREMENT OF 3 PHASE POWER &
POWER FACTOR
DATE
AIM:
To conduct a suitable experiment on a 3-phase load connected in star or delta to
measure the 3-phase power and power factor using 2 wattmeter method.
APPARATUS REQUIRED:
1. Wattmeter rated 10A, 600V UPF – 2 nos.
2. Voltmeter rated 600V of type MI – 1 no.
3. Ammeter rated 10A of type MI – 1 no.
4. Three phase resistive load
5. Three phase inductive load
6. Three phase capacitive load
7. Connecting wires.
THEORY:
Power in a three phase circuit can be measured using two wattmeters. The current coil
of wattmeter 1 is connected in R phase. The voltage coil of wattmeter is connected between
R-phase and Y-phase. The current coil of wattmeter 2 is connected between B and Y-phase.
The current coil of wattmeter 2 is connected in B phase. The sum of two wattmeter readings
indicates the total power in the circuit.
FORMULA:
Vph = VL/√3
IL= Iph
Power = 3* Vph* Iph Cosɸ

PROCEDURE:
1. Connections are made as per the circuit diagram.
2. The three phase AC supply is switched ON for setting the rated voltage in the
voltmeter.
3. At no load condition all the meter readings are noted down.
4. The resistive load is increased in steps and the meter readings are noted down.
5. Repeat the same procedure for inductive and capacitive loads.

MODEL CALCULATION:
RESULT:

CIRCUIT DIAGRAM:
WITHOUT FILTER:
WITH FILTER:
P
1 Transformer
230 V / 12V 1N 4007
1K 100F 1, 230V,
50Hz
AC supply
CRO

Ex.No:8A SINGLE PHASE HALF-WAVE RECTIFIER WITH
CAPACITIVE FILTERS
Date:
AIM:
To construct a Half wave rectifier using diode and to draw its performance
characteristics.
APPARATUS REQUIRED:
S.
No. Name Range Type Qty
1 Transformer 230/(12-0-12)V 1
2 Diode IN4007
1
3 Resistor 1K 1
4 Bread Board 1
5 Capacitor 100µF 1
6 CRO 1
7 Wires As Req.
THEORY:
It converts an ac voltage into a pulsating dc voltage using one half of the applied ac
voltage. The rectifying diode conducts during one half of the ac cycle only.
OPERATION:
During the positive half cycle of the input signal, the anode of the diode becomes
positive with respect to cathode and hence diode D conducts. For an ideal diode, the
forward voltage drop is zero. So the whole input voltage will appear across the load
resistance RL.
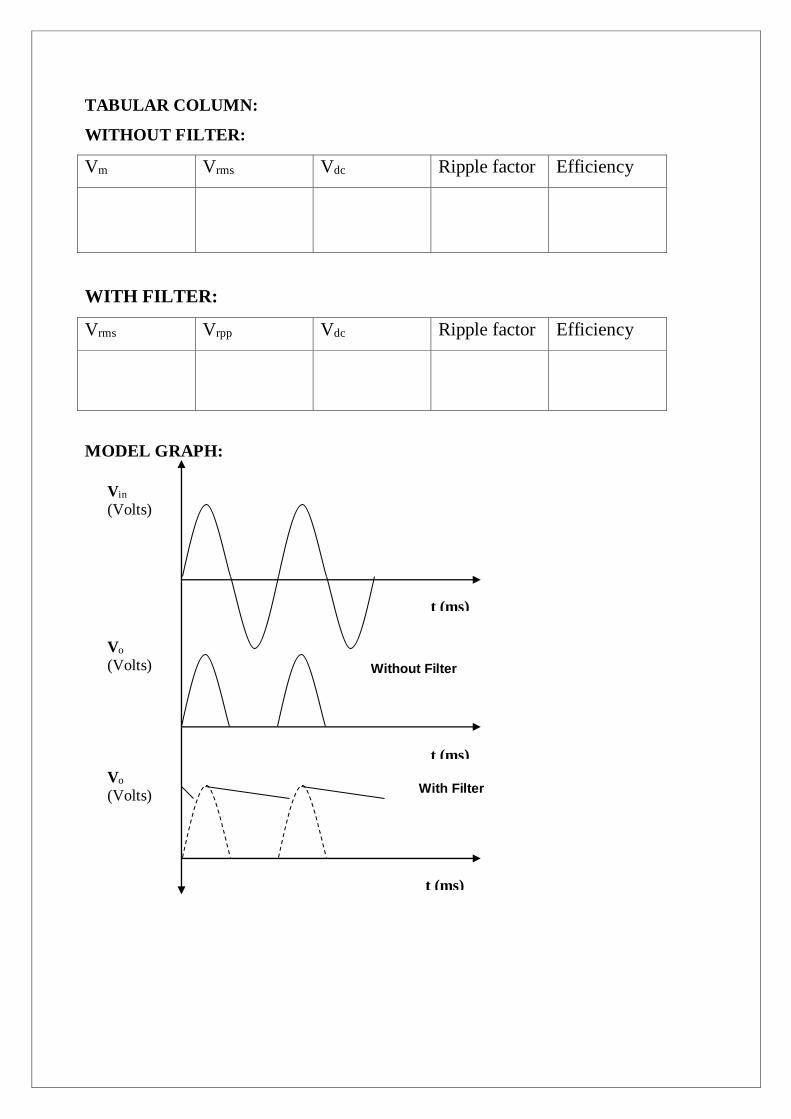
TABULAR COLUMN:
WITHOUT FILTER:
Vm Vrms Vdc Ripple factor Efficiency
WITH FILTER:
Vrms Vrpp Vdc Ripple factor Efficiency
MODEL GRAPH:
Vin
(Volts)
t (ms)
Vo
(Volts)
t (ms)
t (ms)
Vo
(Volts)
Without Filter
With Filter

During negative half cycle of the input signal, the anode of the diode becomes
negative with respect to the cathode and hence, diode D does not conduct. For an ideal diode,
the impedance offered by the diode is infinity.So the whole input voltage appears across the
diode D. Hence, the voltage drop across RL is zero.
FORMULAE:
WITHOUT FILTER:
(i) Vrms = Vm / 2
(ii) Vdc = Vm /
(iii) Ripple Factor = (Vrms / Vdc)2 – 1
(iv) Efficiency = (Vdc / Vrms)2 x 100
WITH FILTER:
(i) Vrms = (Vr,rms’2 + Vdc
2)
(ii) Vr,rms = Vrpp / (3 x 2)
(iii) Vdc = Vm – ( V rpp / 2 )
(iv) Ripple Factor = Vr,rms/ Vdc
(v) Efficiency = (Vdc / Vrms)2 x 100

PROCEDURE:
WITHOUT FILTER:
1. Give the connections as per the circuit diagram.
2. Give 230v, 50HZ I/P to the step down TFR where secondary connected to the
Rectifier I/P.
3. Take the rectifier output across the Load & Plot its performance graph.
WITH FILTER:
1. Give the connections as per the circuit diagram.
2. Give 230v, 50HZ I/P to the step down TFR where secondary connected to the
Rectifier I/P.
3. Connect the Capacitor across the Load.
4. Take the rectifier output across the Load & Plot its performance graph.

CALCULATIONS:
RESULT:
Thus the performance characteristics of 1 Half wave rectifier was obtained.

CIRCUIT DIAGRAM:
WITHOUT FILTER:
WITH FILTER:
1N 4007
1K 100F
1, 230V,
50Hz
AC supply
CRO
1N 4007
1 Transformer
230 V / 6-0-6 V

Ex.No:8B SINGLE PHASE FULL-WAVE RECTIFIER WITH
CAPACITIVE FILTERS
Date:
AIM:
To construct a Full wave rectifier using diode and to draw its performance
characteristics.
APPARATUS REQUIRED:
S.No. Name Range Type Qty
1 Transformer 230/(6-0-6)V 1
2
Diode
IN4007 2
3 Resistor 1K 1
4 Bread Board 1
5 Capacitor 100µf 1
6 CRO 1
7 Wires As Req.
THEORY:
It converts an ac voltage into a pulsating d.c voltage using both half cycle of
the applied ac voltage. It uses two diodes of which one conducts during one half cycle
while the other diode conducts during the other half cycle of the applied ac voltage.
OPERATION:
During positive half of the input signal, anode of diode D1 becomes positive and at
the same time the anode to the diode D2 becomes negative. Hence, D1 conducts and D2
does not conduct. The load current flows through D1 and the voltage drop across RL will
be equal to the input voltage.

TABULAR COLUMN:
WITHOUT FILTER:
Vm Vrms Vdc Ripple factor Efficiency
WITH FILTER:
Vrms Vrpp Vdc Ripple factor Efficiency
MODEL GRAPH :
Vin
(Volts)
t (ms)
Vo
(Volts)
t (ms)
t (ms)
Vo
(Volts)
Without Filter
With Filter
During the negative half cycle of the input, the anode of D1 becomes negative
and the anode of D2 becomes positive. Hence, D1 does not conduct and D2 conducts.
The load current flows through D2 and the voltage drop across RL will be equal to the
input voltage.
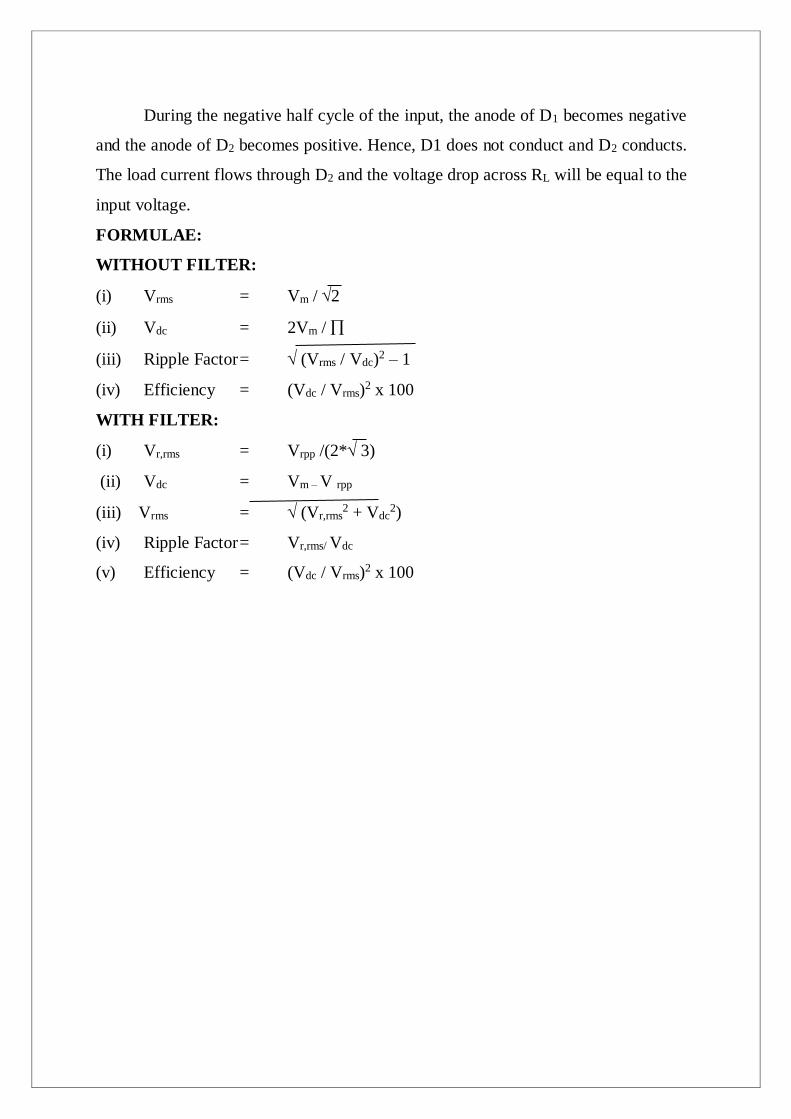
FORMULAE:
WITHOUT FILTER:
(i) Vrms = Vm / 2
(ii) Vdc = 2Vm /
(iii) Ripple Factor = (Vrms / Vdc)2 – 1
(iv) Efficiency = (Vdc / Vrms)2 x 100
WITH FILTER:
(i) Vr,rms = Vrpp /(2* 3)
(ii) Vdc = Vm – V rpp
(iii) Vrms = (Vr,rms2 + Vdc
2)
(iv) Ripple Factor = Vr,rms/ Vdc
(v) Efficiency = (Vdc / Vrms)2 x 100

PROCEDURE:
WITHOUT FILTER:
1. Give the connections as per the circuit diagram.
2. Give 230v, 50HZ I/P to the step down TFR where secondary connected to
the Rectifier I/P.
3. Take the rectifier output across the Load & Plot its performance graph.
WITH FILTER:
1. Give the connections as per the circuit diagram.
2. Give 230v, 50HZ I/P to the step down TFR where secondary connected to the
Rectifier I/P.
3. Connect the Capacitor across the Load.
4. Take the rectifier output across the Load & Plot its performance graph.

CALCULATIONS:
RESULT:
Thus the performance characteristics of 1 Full wave rectifier were obtained.

UJT PIN DIAGRAM
CIRCUIT DIAGRAM:

Ex.No:9 UJT RELAXATION OSCILLATOR FOR
GENERATION OF SAW TOOTH WAVE
Date:
AIM:
To construct the UJT oscillator and obtain the characteristics.
APPARATUS REQUIRED:
S.NO NAME OF THE
EQUIPMENT TYPE RANGE
QUANTITY
1 UJT 2N2646 1
2 Resistor 15 kΩ One from
220 kΩ, 33Ω each
3 Capacitor 0.1 μF 1
4 CRO 1
5 Bread Board 1
6 Connecting wires As Required
THEORY:
The Relaxation UJT oscillator consists of UJT and a capacitor which is
charged through a RE as the supply voltage VBB is switched ON. The voltage
across the capacitor increases exponentially and when the capacitor voltage reach
the peak point voltage Vp, the UJT starts conducting and the capacitor voltage is
discharged rapidly through EB1 and R1. After the peak point voltage of UJT is
reached, it provides negative resistance to the discharge path which is useful in the
working of the relaxation oscillator. As the capacitor voltage reaches zero, the
device then cuts off and capacitor CE starts to charge again. This cycle is repeated
continuously generating a saw tooth waveform across the capacitor. The inclusion
of external resistors R2 and R1 in series with B2 and B1 provides spike waveforms

TABULATION:
S.No. Charging Time, DisCharging Time, Amplitude,Vc(V)
tc(ms) td(ms)
MODEL GRAPH:

When the UJT fires, the sudden charge of current through B1 causes drop
across R1, which provides positive going spikes. Also, at the time of firing, fall of
VEB1 causes I2 to increase rapidly which generates negative going spikes across
R2. By changing the values of capacitance CE or resistance RE, the frequency of
the output waveform can be changed as desired, Since these values control the time
constant RECE of the capacitor changing circuit. The frequency of oscillation can
be obtained by assuming that the capacitor is initially uncharged.
F= 1/T = 2.3 RE CE log 10 [1/(1-η)]
Where, η is intrinsic stand-off ratio
FORMULA USED:
Charging time of capacitance,
T= RC ln [(E - E0)/E - EC]
E = Supply voltage
E0 = Initial capacitor voltage
EC = Capacitance voltage
PROCEDURE:
1. Connections are given as per the circuit diagram.
2. Positive biasing voltage is given to the Emitter and Base-2 terminal.
3. The charging and discharging time of capacitor is observed from the output
waveform of CRO.
RESULT:
Thus the UJT relaxation oscillator circuit was constructed and the output
waveforms were noted. The corresponding graphs are drawn.
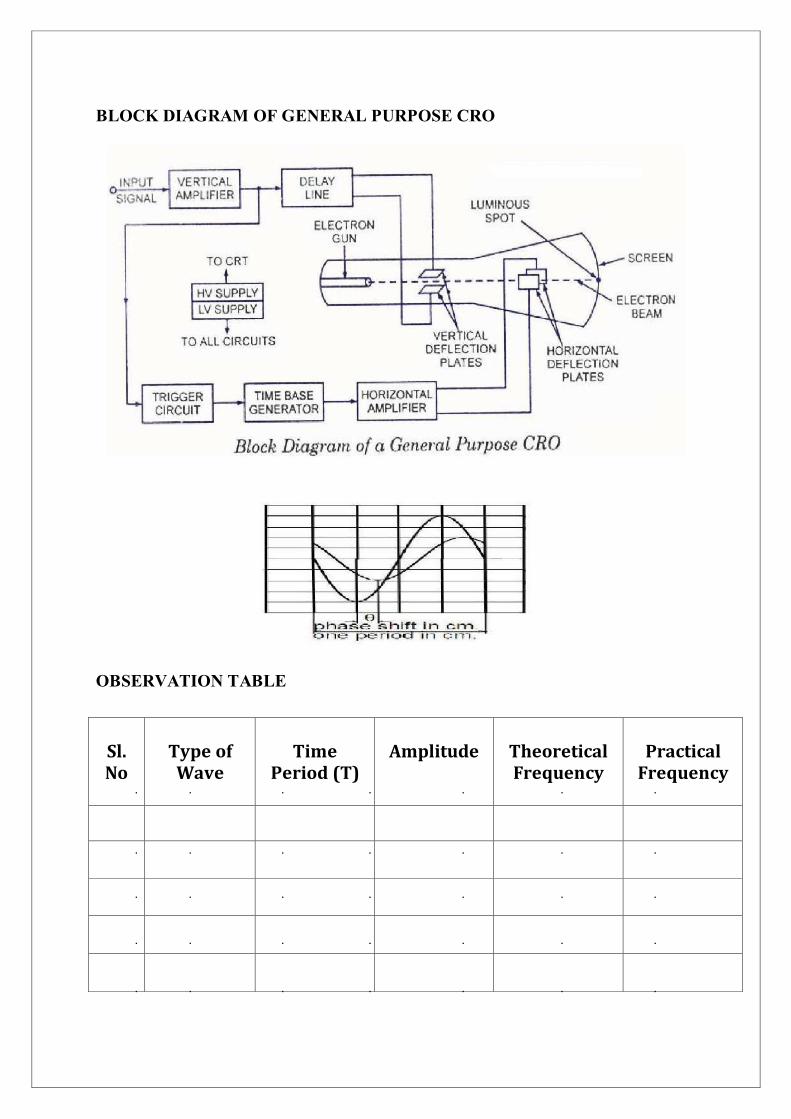
BLOCK DIAGRAM OF GENERAL PURPOSE CRO
OBSERVATION TABLE
Sl. No
Type of Wave
Time
Period (T)
Amplitude
Theoretical Frequency
Practical
Frequency

Ex.No:10 STUDY OF CRO AND MEASUREMENT OF
SINUSOIDAL VOLTAGE, FREQUENCY AND POWER FACTOR
Date:
AIM:
The aim of the experiment is to understand the operation of cathode ray oscilloscope
(CRO) and to become familiar with its usage, also to perform an experiment using function
generator to measure amplitude, time period, frequency & power factor of the time varying
signals using a calibrated cathode ray oscilloscope.
APPARATUS REQUIRED:
S. No
Name of the Qty
Components / Equipment
1. CRO 1
2. Function generator 1
3. Probes 2
THEORY:
The cathode ray oscilloscope (CRO) provides a visual presentation of any waveform
applied to the input terminal. The oscilloscope consists of the following major subsystems.
Cathode ray tube (CRT)
Vertical amplifier
Horizontal amplifier
Sweep Generator
Trigger circuit
Associated power supply
It can be employed to measure quantities such as peak voltage, frequency, phase difference,
pulse width, delay time, rise time, and fall time.
CATHODE RAY TUBE:
The CRT is the heart of the CRO providing visual display of an input signal waveform. A
CRT contains four basic parts:

An electron gun to provide a stream of electrons.
Focusing and accelerating elements to produce a well define beam of electrons.
Horizontal and vertical deflecting plates to control the path of the electron
beam.
An evacuated glass envelope with a phosphorescent which glows visibly when
struck by electron beam.
A Cathode containing an oxide coating is heated indirectly by a filament resulting in
the release of electrons from the cathode surface. The control grid which has a negative
potential, controls the electron flow from the cathode and thus control the number of electron
directed to the screen. Once the electron passes the control grid, they are focused into a tight
beam and accelerated to a higher velocity by focusing and accelerating anodes. The high
velocity and well defined electron beam then passed through two sets of deflection plates.
The First set of plates is oriented to deflect the electron beam vertically. The angle of
the vertical deflection is determined by the voltage polarity applied to the deflection plates.
The electron beam is also being deflected horizontally by a voltage applied to the horizontal
deflection plates. The tube sensitivity to deflecting voltages can be expressed in two ways
that are deflection factor and deflection sensitivity.
The deflected beam is then further accelerated by very high voltages applied to the
tube with the beam finally striking a phosphorescent material on the inside face of the tube.
The phosphor glows when struck by the energetic electrons.
CONTROL GRID:
Regulates the number of electrons that reach the anode and hence the brightness of the
spot on the screen.
FOCUSING ANODE:
Ensures that electrons leaving the cathode in slightly different directions are focused
down to a narrow beam and all arrive at the same spot on the screen.
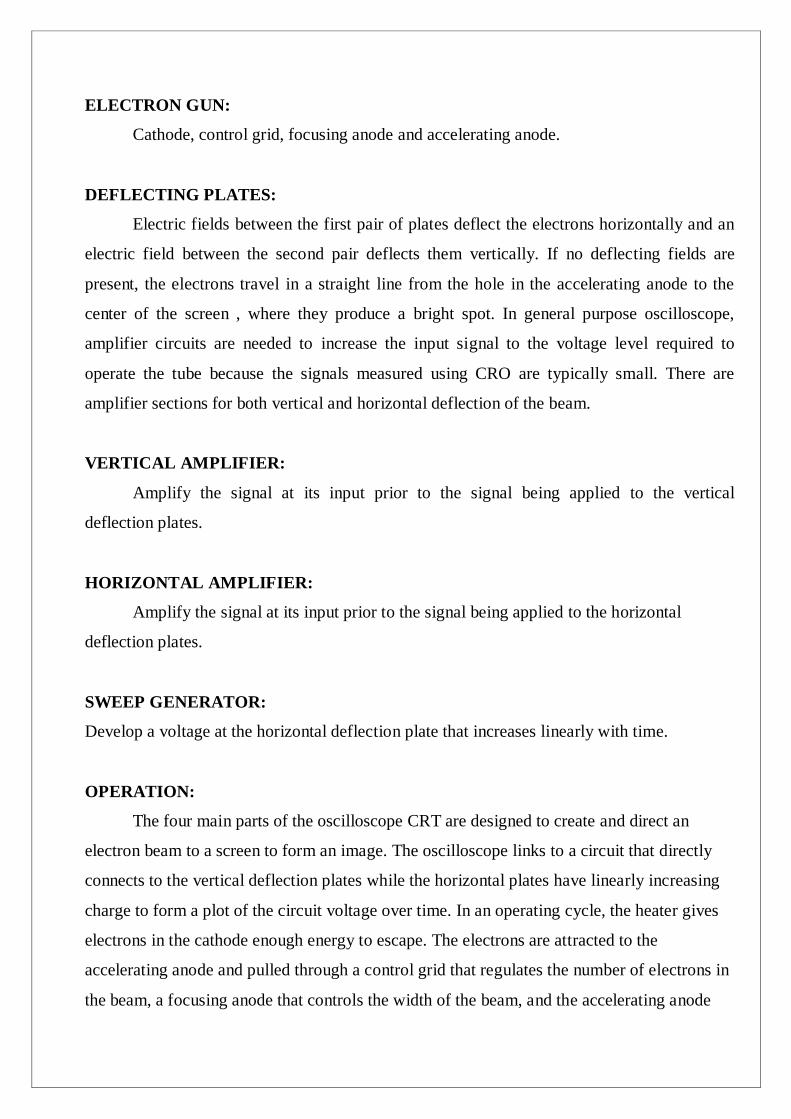
ELECTRON GUN:
Cathode, control grid, focusing anode and accelerating anode.
DEFLECTING PLATES:
Electric fields between the first pair of plates deflect the electrons horizontally and an
electric field between the second pair deflects them vertically. If no deflecting fields are
present, the electrons travel in a straight line from the hole in the accelerating anode to the
center of the screen , where they produce a bright spot. In general purpose oscilloscope,
amplifier circuits are needed to increase the input signal to the voltage level required to
operate the tube because the signals measured using CRO are typically small. There are
amplifier sections for both vertical and horizontal deflection of the beam.
VERTICAL AMPLIFIER:
Amplify the signal at its input prior to the signal being applied to the vertical
deflection plates.
HORIZONTAL AMPLIFIER:
Amplify the signal at its input prior to the signal being applied to the horizontal
deflection plates.
SWEEP GENERATOR:
Develop a voltage at the horizontal deflection plate that increases linearly with time.
OPERATION:
The four main parts of the oscilloscope CRT are designed to create and direct an
electron beam to a screen to form an image. The oscilloscope links to a circuit that directly
connects to the vertical deflection plates while the horizontal plates have linearly increasing
charge to form a plot of the circuit voltage over time. In an operating cycle, the heater gives
electrons in the cathode enough energy to escape. The electrons are attracted to the
accelerating anode and pulled through a control grid that regulates the number of electrons in
the beam, a focusing anode that controls the width of the beam, and the accelerating anode

itself. The vertical and horizontal deflection plates create electric field that bend the beam of
electrons. The electrons finally hit the fluorescent screen which absorbs the energy from the
electron beam nad emits it in the form of light to display an image at the end of the glass
tube.
PRECAUTIONS:
1. Do not leave a ‘bright spot’ on the screen for any length of time.
2. Do not apply signals that exceed the scopes voltage rating.
3. Do not try make accurate measurements on signals whose frequency is outside the
scope’s frequency specifications.
4. Be aware that the scope’s input circuitry can cause loading effects on the circuitry
under test-use correct probe for the work.
PROCEDURE:
1. Measurement of Voltage Using CRO: A voltage can be measured by noting the Y
deflection produced by the voltage; using this deflection in conjunction with the Y-gain
setting, the voltage can be calculated as follows : V = ( no. of boxes in cm. ) x ( selected
Volts/cm scale )
2 .Measurement of Current and Resistance Using a CRO: Using the general method, a
correctly calibrated CRO can be used in conjunction with a known value of resistance R to
determine the current I flowing through the resistor.
3 Measurement of Frequency Using a CRO: A simple method of determining the
frequency of a signal is to estimate its periodic time from the trace on the screen of a CRT.
However this method has limited accuracy, and should only be used where other methods are
not available. To calculate the frequency of the observed signal, one has to measure the
period, i.e. the time taken for 1 complete cycle, using the calibrated sweep scale. The period
could be calculated by T = (no. of squares in cm) x (selected Time/cm scale) Once the period
T is known, the frequency is given by f (Hz) = 1/T (sec).

4. Measurement of Phase: The calibrated time scales can be used to calculate the phase
shift between two sinusoidal signals of the same frequency. If a dual trace or beam CRO is
available to display the two signals simultaneously (one of the signals is used for
synchronization), both of the signals will appear in proper time perspective and the amount of
time difference between the waveforms can be measured. This, in turn can be utilized to
calculate the phase angle θ, between the two signals.
Referring to the fig. the phase shift can be calculated by the formula;
θ°=
MEASUREMENT OF POWER FACTOR:
The power factor is calculated by the formula
Pf= VI COSϕ
RESULT:

CIRCUIT DIAGRAM:
Study Of Displacement Transducer - LVDT
GENERAL DIAGRAM

Ex.No:11 CHARACTRISTICS OF LVDT
DATE
AIM: To study the displacement transducer using LVDT and to obtain its characteristics
APPARATUS REQUIRED:
Sl.No Name of the Apparatus Qty
1 LVDT Trainer kit 1
2 Connecting Wires 1
3 Digital Multimeter 1
4 Screw gauge 1
FORMULA USED: %ERROR = [ (Displayed Displacement – Actual Displacement)/ Actual Displacement] x100 PRECAUTIONS:
1. While taking reading on scale parallel error has to be avoided.
2. Smooth gradual movement of the core to be ensured.
PROCEDURE:
1. Switch on the power supply to the LVDT module.
2. Connect the CRO at T1 to check the input sine wave signal. Adjust the frequency
to kHz.
3. Place the LVDT at the null position (10mm) and adjust the offset to display
zero on the DVM(actual displacement).calibrated in displacement of the core.
Gradually move the core of the LVDT in the positive direction (20mm) and
Note the reading on the display (mm).It should be around 10mm, if it not adjust
the gain to display 10mm.
4. Repeat step 4 in the opposite direction.

5. Tabulate the readings of actual displacement and displayed on the
DVM. The LVDT core may be moved through a distance of 20mm.
TABULATION:
ACTUAL
OUTPUT
VOLTAGE DISPLAYED
Vo DISPLACEMENT % ERROR
DISPLACEMENT
volts Dd (mm)
Da(mm)
1
2
3
4
MODEL GRAPH:
Vo
Displacement in mm

RESULT: Thus the displacement and characteristics of transducer are studied using LVDT

TEMPERATURE MEASUREMENT USING THERMISTOR:
TEMPERATURE MEASUREMENT USING RTD:

Ex.No:12 TEMPERATURE TRANSDUCER
DATE
AIM: To measure temperature using RTD & Thermistor
APPARATUS REQUIRED:
1. Trainer kit 2. Thermistor 3. RTD 4. Electric Kettle 5. Thermometer 6. Patch cords
THEORY:
Temperature Sensors measure the amount of heat energy or even coldness that is
generated by an object or system, allowing us to “sense” or detect any physical change to that
temperature producing either an analogue or digital output.
The Thermistor is another type of temperature sensor, whose name is a combination
of the wordsTHERM-ally sensitive res-ISTOR. A thermistor is a special type of resistor
which changes its physical resistance when exposed to changes in temperature. Thermistors
are generally made from ceramic materials such as oxides of nickel, manganese or cobalt
coated in glass which makes them easily damaged. Their main advantage over snap-action
types is their speed of response to any changes in temperature, accuracy and repeatability.
Another type of electrical resistance temperature sensor is the Resistance
Temperature Detectoror RTD. RTD‟s are precision temperature sensors made from high-
purity conducting metals such as platinum, copper or nickel wound into a coil and whose
electrical resistance changes as a function of temperature, similar to that of the thermistor.

TABULATION:
TEMPERATURE MEASUREMENT USING THERMISTOR:
S.
NO Temperature in degree Temperature in degree Error
(Measured by THERMOMETER) (Measured by
THERMISTOR)
01 Room temperature ( )
02
03
04
05
TEMPERATURE MEASUREMENT USING RTD:
S.
NO Temperature in degree Temperature in degree Error
(Measured by THERMOMETER) (Measured by RTD)
01 Room temperature ( )
02
03
04
05

PROCEDURE:
TEMPERATURE MEASUREMENT USING THERMISTOR
Connect thermistor probe one end to P1 terminal of trainer
Connect thermistor probe other end to P2 terminal of trainer
Connect thermistor P4 terminal to P5 terminal in trainer
Connect thermistor P6 terminal to P7 terminal (Display input) in trainer
Insert THERMISTOR probe in water kettle & ensure thermistor probe fully immersed in
water
Insert GLASS Thermo meter probe in water kettle & ensure probe fully immersed in water
Note down initial (ROOM) temperature value in display ,now switch ON water heater kettle
Note down & tabulate the Trainer display reading & Thermometer reading Switch OFF the trainer .
TEMPERATURE MEASUREMENT USING RTD
Connect RTD Probe –WHITE-1 color wire to P 09 terminal of trainer
Connect RTD Probe –WHITE-2 color wire to P10 terminal of trainer
Connect RTD Probe –Red color wire to P11 terminal of trainer
Connect thermistor P12 terminal to P13 terminal (Display input) in trainer
Insert RTD probe in water kettle & ensure RTD probe fully immersed in water
Insert GLASS Thermo meter probe in water kettle & ensure probe fully immersed in water
Note down initial (ROOM) temperature value in display ,now switch ON water heater kettle
Note down & tabulate the Trainer display reading & Thermometer reading
Switch OFF the trainer
RESULT:

CIRCUIT DIAGRAM:

Ex.No:13 CALIBRATION OF ROTAMETER
DATE
AIM:
To measure the Water Flow Rate in LPM by using Rota meter
APPARATUS REQUIRED:
1. Flow measurement trainer 2. Scale
3. Rota meter 4. Stop Clock
THEORY:
The rotameter's operation is based on the variable area principle: fluid flow raises a
float in a tapered tube, increasing the area for passage of the fluid. The greater the flow, the
higher the float is raised. The height of the float is directly proportional to the flowrate. With
liquids, the float is raised by a combination of the buoyancy of the liquid and the velocity
head of the fluid. With gases, buoyancy is negligible, and the float responds to the velocity
head alone. The float moves up or down in the tube in proportion to the fluid flowrate and the
annular area between the float and the tube wall. The float reaches a stable position in the
tube when the upward force exerted by the flowing fluid equals the downward gravitational
force exerted by the weight of the float. A change in flowrate upsets this balance of forces.
The float then moves up or down, changing the annular area until it again reaches a position
where the forces are in equilibrium. To satisfy the force equation, the rotameter float assumes
a distinct position for every constant flowrate. However, it is important to note that because
the float position is gravity dependent, rotameters must be vertically oriented and mounted.

TABULATION:
Rotameter Error Constant = 0.3333 ( CONSTANT VALUE)
Level of Water
in
Time taken to
fill
Rotameter
Reading
Actual Reading of Calculated
litre Rotameter = LPM = T ( Rotameter Reading
x
/60
error constant)

PROCEDURE:
1. Drain all the water in Tank -1 using S1 switch
2. Fill the water in Tank -2
3. Switch ON Power ON/OFF Switch (S1)
4. Switch ON Pump speed adjustment regulator & Adjust slowly
5. Now the water is flow from Tank-2 to Tank-1 through Rota meter
6. Rota meter indicate the Flow rate in LPM
7. To Vary the Flow Rate adjust any one of the Below
1. Rotameter Knob
2. S2-Valve
3. Pump speed adjustment regulator
8. By adjusting any one of the above ,the Flow Rate of water will be varied &
corresponding Rotameter Reading in LPM ( Litre per Minutes) will vary. Observe the
reading. RESULT: