dlr investor-day-presentation-10-06-15-final
TRANSCRIPT

1
Investor Day | October 6, 2015

AgendaDigital Realty 2015 Investor Day
Strategic Vision A. William Stein, Chief Executive Officer
Digital Operating Model Jarrett Appleby, Chief Operating Officer
Strategy in Action: Ashburn Matt Miszewski, SVP, Sales & Marketing
Lunch Bryan Chong, VP West Coast Sales
Capital Allocation Scott Peterson, Chief Investment Officer
Financial Overview Andrew Power, Chief Financial Officer
Questions & Answers
Property Tour
2

StrategicVision
3

WE SAID
• Successful Execution on All Fronts
Lease-up existing inventory and improve ROIC
– Align our leasing efforts and sales incentive program
to bring inventory back into equilibrium
Recycle capital to focus on the core
– Sell non-strategic assets to refine our portfolio focus,
improve ROIC and fund future capital requirements
– Explore additional joint venture opportunities
Improve asset utilization and deliver innovative
product offerings
– Focus on mid-market and colocation, Open IX and
ecosystem initiatives
Transition to Just-in-Time Inventory
– Know returns with certainty before building
– Commit capital only for projects that meet return
thresholds
Unleash the intellectual capital and creative
energies of the Digital Realty team
Improved ROIC by 120 bps from 4Q13-2Q15
– Reduced finished inventory balance by nearly 50%
WE DID
Promoted from within and brought on
additional senior leadership
Substantially completed capital-recycling program
– Sold ~ $200 million in 1H15, generating $95 million gain
– Under agreement to sell an additional ~ $150 million
Reached an agreement to acquire Telx
– Instantly establishes leading colocation and
interconnection platform
Development pipeline over 80% pre-leased
– Initial cash yields on 2014-2015 vintage
development projects over 100 bps better than
2012-2013 era projects
The Way ForwardSuccessful Execution on All Fronts
4

1 SUPERIOR RETURNS
Deliver superior risk-adjusted
total shareholder returns
2 CAPITAL ALLOCATION
Prudently allocate capital to
opportunistically extend global
campus footprint
3 PRODUCT OFFERINGS
Drive higher returns on the
asset base by diversifying
product offerings
4 OPERATING EFFICIENCIES
Achieve operating efficiencies
to accelerate growth in cash
flow and value per share
Our FocusOur philosophy is to deliver superior returns to our
shareholders by capitalizing on our core competencies and
tailoring them to meet the ever growing and evolving data
center needs of our customers
The Next HorizonThree-Year Guideposts
5

Who Are Our Target Customers?Addressing Growing Global Data Center Requirements
SMACC + NETWORK(Social, Mobile, Analytics, Cloud & Content)
FINANCIAL SERVICES& OTHER LARGE USERS IT SERVICES
6

Our Core CompetenciesCapitalizing on our competitive advantages that include large scale campuses,
network-dense interconnection hubs and diversified product offering on a global basis
REAL ESTATE
EXPERTISE
COMPLEMENTARY
PRODUCT MIX
EXPANSIVE
GLOBAL REACH
Critical part of customer
supply chain that starts with
the real estate
Not going up the stack to compete
or staffing to sell direct to broader
enterprise customers
Meet our target customers’
needs for large and growing
footprints on a global basisCampus approach to land and grow
our customers – Singapore, Ashburn,
London and beyond
Seamless delivery of a
complementary
product mixScale, colocation and connectivity
Aligning Core Competencies with Customers Global Real Estate Reach, Complementary Product Mix
7

Ma
inta
in C
ore
Stre
ng
th
Establishing Colocation + Connectivity OfferingsEnhancing Customer Value, Capturing Greater Share
8
1) Rental revenue based on annualized rent as of June 30, 2015, which represents the monthly contractual base rent (defined as base rent before abatements) under existing leases as of June 30, 2015 multiplied by 12.
Tenant improvements represent 2Q15 annualized. Wholesale data center revenue includes rent from Turn-Key Flex ®, Powered Base Building ®, pro rata share of utility tenant improvements and other tenant reimbursements.
Colocation revenue includes colocation remaining pro rata share of utility tenant reimbursements.
2) On a pro forma basis, Telx would have contributed $170.8 million and $167.7 million of 2Q15 LQA colocation and interconnection revenue, respectively.
InterconnectionColocationScale Data Center
Expand
Product
Offering
Digital Realty’s Product Growth & Diversification
$102MMColocation
$161MMInterconnection
$264MMColocation
77%14%
9%93%
7%
Combined Platform Supports Growth of Communities of Interest with > 59,000 Cross-Connects
Digital Realty
Standalone Annualized (1) Pro Forma
(2)

INTERNET GATEWAY FACILITY CAMPUS CONNECT FACILITY INDIVIDUAL PROPERTY
CUSTOMER FOCUS
• SMACC
• Network Providers
• IT Services
• Financial
Services
CUSTOMER FOCUS
• SMACC
• Network Providers
• IT Services
• Financial
Services
CUSTOMER FOCUS
• Customers requiring abundant space
and power
FACILITY EXAMPLES FACILITY EXAMPLES FACILITY EXAMPLES
TARGETED CUSTOMER EXAMPLES TARGETED CUSTOMER EXAMPLES TARGETED CUSTOMER EXAMPLES
56 MARIETTA STAtlanta, GA
ASHBURN CAMPUSAshburn, VA
55 MIDDLESEX TURNPIKEBoston, MA
2260 EL SEGUNDO BLVD.El Segundo, CA
350 EAST CERMAKChicago, IL
DALLAS CAMPUSDallas, TX
Colocation
Scale
Facility Classification OverviewInternet Gateway, Campus Connect and Individual Property
9

CAMPUS LOCATIONS
Ashburn New York Dallas
Singapore
Chicago
Silicon Valley London
IT & Cloud Services Network & Mobility Media & OtherFinancial Services
KEY CUSTOMER ECOSYSTEM
Global Campus Network Attractive Environments for Customers to Land and Grow
10

Power of Connection StrategyCreating Environments for Customers to Come Together
11
Capitalize on
Campus Footprint
• Enable multiple
deployments on
contiguous parcels
• Tether proximate
Internet Gateways
1
Deploy Colocation
+ Connectivity
Product Offerings
• Provide connectivity
to major carrier
hotels
• Facilitate major
network operator
deployments
2
Foster Ecosystems
with Communities
of Interest
• Highlight key magnet
customers to attract a
broader array of large-
and small-footprint
requirements
• For example, enable
Netflix to directly
connect to Akamai’s
network for efficient
delivery of content to
end users
3
Extend Global
Network
• Bring Telx
capabilities and
product offerings to
global campus
network
4

Cloud On-Ramp Campus
Ashburn
Connect@Scale suites,
Powered Base Building,
Connect@Campus
colocation
Proximate Campus Chicago
Connect@Scale suites,
Powered Base Building,
Connect@Gateway
colocation
Density at Scale and at HubsExpand, Tether, and Densify Data Center Campuses
12

The Power of the Ecosystem“Magnets” Drive Value via Interconnection
Colocation + Interconnection Expected to Enhance Returns on Prospective Projects
13
Illu
str
ati
ve
Un
leve
red
Cas
h Y
ield
on
Co
st
0%
5%
10%
15%
20%
Large-Footprint Development Yield
Ecosystem / Colocation Tethering + Interconnection
Pro Forma Yield
Note: For illustrative purposes only; actual results may vary. Assumptions are based on management estimates.

• Andy will leverage his extensive capital markets
expertise and relationships in the financial community
to support our longer-term growth while prudently
managing our balance sheet
• Andy is responsible for the company’s financial
functions, including capital markets, tax, investor
relations, and financial planning and analysis
Senior Leadership Team EstablishedDeepening Our Bench, Strengthening Our Culture
ANDREW POWER CHIEF FINANCIAL OFFICER
• Jarrett is responsible for ensuring alignment between
corporate strategy and operations while enhancing
our ability to deliver the most efficient and effective
solutions to our customers
• Jarrett is responsible for property and technical
operations, design & construction, EMEA and APAC
operations as well as product development
JARRETT APPLEBY CHIEF OPERATING OFFICER
• Michael will facilitate the use of information and
technology to unlock more value for Digital Realty’s
employees, customers and shareholders
• Michael is responsible for all aspects of the
company's IT infrastructure, including business
intelligence, internal business applications, and
information security
MICHAEL HENRY CHIEF INFORMATION OFFICER
• Bill has served as Digital Realty’s Chief Executive
Officer since November 2014 and as Chief Financial
Officer from July 2004 until April 2015
• Prior to Digital Realty, Bill was with GI Partners,
Digital Realty’s predecessor private equity fund
• Bill previously served as CFO of TriNet, a publicly
traded triple net lease REIT
A. WILLIAM STEIN CHIEF EXECUTIVE OFFICER
• Scott is responsible for overseeing the company’s
capital allocation decision-making process
• Scott is a co-founder of the company and previously
served as the company’s Chief Acquisitions Officer
• Prior to Digital Realty, Scott was a Managing Director
of GI Partners
SCOTT PETERSON CHIEF INVESTMENT OFFICER
• Matt joined Digital Realty in January 2013 and is
responsible for overseeing the company’s sales and
leasing efforts as well as marketing activities globally
• Matt was previously responsible for Global Public
Sector sales at Salesforce.com and Worldwide
Government Sales at Microsoft. Matt was formerly
CIO for the State of Wisconsin and partner in a
law firm
MATT MISZEWSKI SVP, SALES & MARKETING
14

Digital Realty DifferentiatorsUnique Ability to Execute on a Global Scale
Leading Global
Data Center Platform
1 Focus on large and growing customers aligned
with our core competencies – SMACC +
Network, IT Services, Financial Services and
Other Large Users
2 Expand within our existing and new data
center campus environments worldwide
3 Deploy new diversified product offering
including colocation and interconnection, in
addition to core Scale offering (i.e., TKF / PBB)
4 Connect our data center campus environments
to Internet Gateway properties creating vertical
ecosystems globally
5 Drive stronger value proposition for our
customers that translates into higher overall
risk-adjusted returns
15

DigitalOperating Model
16

Digital Operating ModelKey Themes
17
MEGA TRENDS
Follow the Internet, Subsea Cable, Cloud & Private Networking and Applications
FOCUS ON CUSTOMERS THAT ALIGN WITH OUR CORE COMPETENCIES
Digital Economy (SMACC + Network), IT Services, Financial Services and Other Large Users
EVOLVING PRODUCT & DESIGN – SCALE, COLOCATION and CONNECTIVITY
Comprehensive Customer-Focused Product Suite to Support the Major Technology Trends
CAPITALIZING ON OUR FUTURE OPPORTUNITY
Ability to Provide Highly Attractive Hybrid Cloud Value Proposition for Our Customers
TELX INTEGRATION UPDATE
Timing, Acceleration of Strategy, Synergies, and Line of Business
NEW OPERATING MODEL
Global Service Delivery – Product Standardization & Centralization of Operations, IT Dependencies,
Cost & Scalability Transition

Mega TrendsEvery 60 Seconds…
18
Nearly Three-Fourths of Digital Realty’s 2014-2015 Sales Have Been in Support of this Digital Economy
60SECONDS
IN
694,445
SEARCH
QUERIES
13,000+ HOURS
MUSIC
STREAMING
100+
NEW
ACCOUNTS
695,000+
STATUS
UPDATES
79,364
WALL
POSTS
98,000+
TWEETS
320+
NEW
ACCOUNTS
370,000+
MINUTES
VOICE
CALLS
600+
NEW
VIDEOS
25+ HOURS
TOTAL
DURATION
6,600+ NEW
PICTURES
UPLOADED
1,700+
FIREFOX
DOWNLOADS
168 MILLION
EMAILS
SENT
12,000+
NEW ADS
POSTED
20,000+
NEW
POSTS
Source: Go-Globe.com.

Mega TrendsGrowth of the Internet, Video, Cloud and Mobile
19Source: Cisco Visual Networking Index (VNI) and Ericsson Mobility Report.
Global Data Center Traffic (2013 – 2018)
Zettabytes
1.5 ZB 2.1 ZB
1.6 ZB
6.5 ZB
3.1 ZB
8.6 ZB
–
3
6
9
2013 2018
Traditional Cloud
Global IP Video Traffic (2013 – 2018)
Exabytes Per Month
51
62
76
91
110
132
30
70
110
150
2013 2014 2015 2016 2017 2018
Global IP Traffic (2014 – 2019)
Exabytes Per Month
60
72
88
109
136
168
30
80
130
180
2014 2015 2016 2017 2018 2019
Internet Video (OTT)
Cloud Mobile
Mobile Data Traffic (2014 – 2020)
Exabytes Per Month
3 5
8
12
17
24
31
2
12
22
32
2014 2015 2016 2017 2018 2019 2020

Outsourcing Driving Significant DemandDigital Realty Positioned to Serve as Partner of Choice
20Source: Gartner.
Hybrid
Public PrivateComplexity
By 2017, buyers will have shifted 50% of their IT Services sourcing portfolio to managed services
Partners
Enterprise

The Outside-In View
21
Digital Realty Global Footprint

Broad Coverage, Key Locations
22
Digital Realty Global Footprint
* Under Letter of Intent to be sold.
*

Strategic Assets
23
Digital Realty Internet Gateways
1) To become an Internet Gateway upon the consummation of the acquisition of Telx Holdings, Inc.
2) Under Letter of Intent to be sold.
Strategic Assets
24
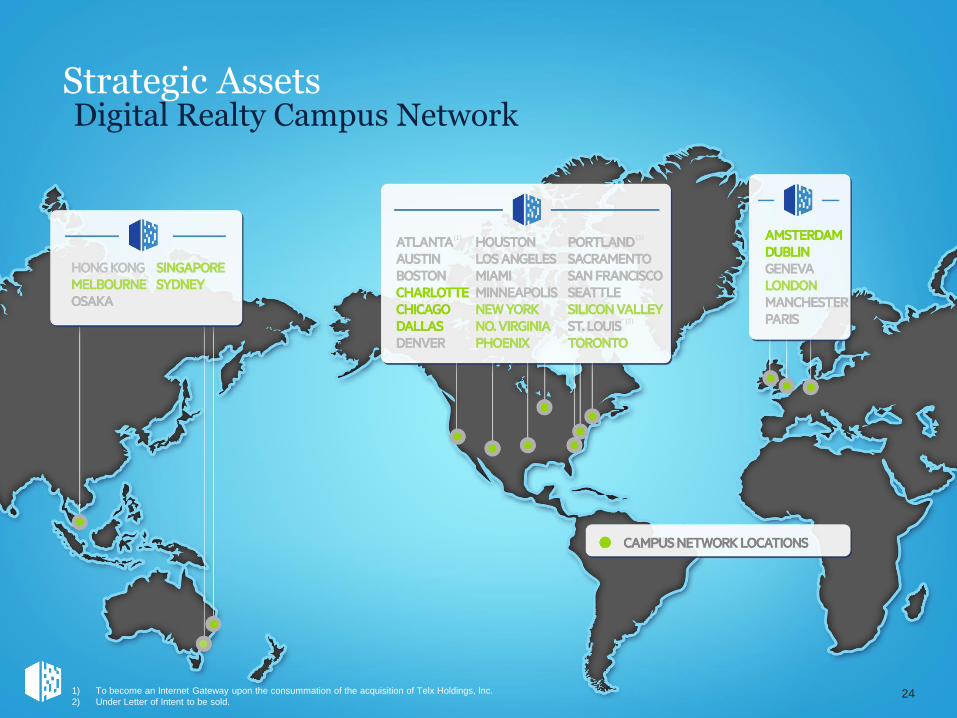
Digital Realty Campus Network
1) To become an Internet Gateway upon the consummation of the acquisition of Telx Holdings, Inc.
2) Under Letter of Intent to be sold.
(1) (1)
(2)

25
The Growth of the Global InternetSubsea Fiber and Landing Points
1) To become an Internet Gateway upon the consummation of the acquisition of Telx Holdings, Inc.
2) Under Letter of Intent to be sold.

Cloud Epicenters Growing Nearly 4.5-fold
26
Digital Realty: Foundation to Support Growth
Global cloud IP traffic will increase nearly 4.5-fold over next 5 years Cisco
Nearly 50% of large enterprises will have hybrid cloud by 2017 Gartner
Enterprises will spend $921B on public cloud services over the next 5 years Gartner

The Foundation for the Digital EconomyDigital Realty + Telx
271) To become an Internet Gateway upon the consummation of the acquisition of Telx Holdings, Inc.
2) Under Letter of Intent to be sold.

Our CustomersThe Digital Economy Lives Here, in Digital Realty Data Centers
SMACC +
NETWORK
FINANCIAL
SERVICES &
OTHER LARGE
USERS
IT
SERVICES
Focus on the Digital Economy through Social,
Mobile, Analytics, Cloud, Content and Network
Significant growth of customers’ core business
requires large footprint with room to expand in
Digital Realty campus environments
Network-dense connectivity hubs for high impact
delivery aligned with Digital Realty’s Internet
Gateways
30%Digital Realty
Standalone
38%Digital Realty
+ Telx
38%Digital Realty
Standalone
33%Digital Realty
+ Telx
32%Digital Realty
Standalone
29%Digital Realty
+ Telx
Digital Realty provides the real estate foundation
for large-scale customers who go “up the stack” to
serve the broader enterprise customer base
Digital Realty empowers IT Service providers to
provide a range of value-add services directly to
enterprise customers who lack the skills to manage
IT requirements
International corporations with advanced and
varied Information Technology demands met by
Digital Realty in campus and individual-property
environments
28Source: Company disclosure and management estimates as of June 30, 2015.

FUNNEL APPROACH TOWARDS CUSTOMERS
ADVANCED
SERVICESCloud Hosting
Cloud Apps
MANAGED
SERVICESNetwork Security
Business Continuity
FOUNDATIONAL
SERVICESScale / Colocation
Connectivity
Compliance
Global Service Infrastructure PlatformDeliver Basic Services, Enable Partners
29
Digital Realty is Focused on Foundational Services to Enable Customers & Partners to Service Thousands of Their Customers
Customers
& Partners
Thousands
of
Customers
FOCUSED ON FOUNDATIONAL SERVICES

COLOCATION CONNECTIVITY
Focused PursuitComprehensive Customer Focused Product Suite
30
Connecting customers & partners
inside the data center
Connecting across data centers in
the same metropolitan area
Privately and securely connecting to
cloud services
Enabling Internet peering and multi-
cloud access
Enabling small (1 Cab) to medium
(75 Cab) data center deployments
Provides agility to quickly deploy
computing infrastructure in days,
contract for 2-3 years
Consistent designs and operational
environment and consistent power
expenses
Leverage optional skilled remote
hands and on-site customer support
Solution to scale from a medium
300+ kW to very large compute
deployments
Can execute a solution for medium to
large deployment in weeks,
contracting for 5-10+ years
Customize data center environment
to specific deployment needs
Due to size of deployments,
customers sometimes opt to have
their own on-site staff
SCALE

Agility to support
dynamic workloads
Differentiated SLA’s
Captures 2X market
opportunity
Drives operational
efficiency
New Product Design Launch (“Scale”)Unique Elastic Design to Meet the Zettabyte Era
31
MECHANICAL & ELECTRICAL
MMR
AGILE FOUNDATION
SCALE
2N
SCALE
N+1COLO
SUITE
KEY ATTRIBUTES CAMPUS CONNECT FACILITY

Directly Connect Internet and Network to Large Compute Engines on Campus
Connected CampusMeeting Growth and Ecosystem Needs
32
MECHANICAL & ELECTRICAL
MMR
AGILE FOUNDATION
SCALE
2N
SCALE
N+1COLO
SUITE
111 8th AvenueNew York, NY
INTERNET GATEWAY CAMPUS CONNECT FACILITY

Elastic Hybrid CloudDirectly Connect to SoftLayer in < 1.5 Milliseconds
33
MECHANICAL & ELECTRICAL
MMR
AGILE FOUNDATION
SCALE COLO
SUITE
OVERVIEW CAMPUS CONNECT FACILITY
IBM as a partner can
scale Elastic Hybrid Cloud
and Storage to Enterprise
built around the
connected campus
Directly connect to
SoftLayer in less than
1.5 milliseconds
Provide secure 10G direct
cross-connect from
customers to SoftLayer
Cloud

Telx Integration UpdateMinimizing Disruption in 2015, Targeting Growth in 2016
DAY ONEEnsure Day One transition occurs smoothly
PEOPLERetain top talent
CUSTOMERSProtect and grow revenue
PRODUCTMaximize product offerings to meet customer demand
INFRASTRUCTUREOne commercial relationship and integrated platforms
SYNERGIES$15 million in cost saving synergies
+
The acquisition of Telx Holdings, Inc. is expected to close later this year, subject to the satisfaction of closing conditions. There can be no assurance that the Telx acquisition will be
consummated on the anticipated schedule or at all. Please see the risks described under the heading “Risks Related to the Proposed Telx Acquisition” in the Current Report on
Form 8-K filed by Digital Realty Trust, Inc. and Digital Realty Trust, L.P. on July 14, 2015.
34

Operating EfficienciesCentralize Functions and Optimize Operations / Service Delivery
35
Operating
Efficiencies
Process
Long-Term Approach for Future Operating Efficiencies with IT & Process Engineering to Scale the Business
Re-align Operating
Leadership team to
the future Digital
Realty strategy
Launch new product for
“Scale” for core business;
prioritize new "Colo” and
“Connect” services
Leverage Telx acquisition to centralize functions and
optimize global operations and service delivery

Chris will be responsible for driving ROIC via the
Global Services Connectivity Platform and creating
Service Enablement Architecture for new ecosystem
services
Previously, Chris was responsible for cloud
innovation at Equinix, where he led the development
of innovative cloud services solutions and next-
generation exchange and interconnection solutions
Integrated Operational Delivery TeamLeadership Team in Place to Drive Innovation and Strategy
36
Phil will be responsible for Digital Realty’s global &
market strategic roadmap as well as developing on-
going competitive analysis for key global markets
and supporting any M&A initiatives
Over 15 years of experience, most recently in the
Asia Pacific region with 21Vianet
John will be charged with leading and managing
product requirements and lifecycle management of
Digital Realty’s Data Center Services
Most recently, John was responsible for global
product management & development at Equinix and
previously held senior positions at top network
providers, including Qwest Communications and
Verizon Business
Danny is Head of Global Operations. He joined Digital
Realty in 2005 and is responsible for overseeing
property, technical and security operations across
Digital Realty’s international portfolio
Prior to joining Digital Realty, Danny managed data
center and telecom portfolios for CB Richard Ellis and
CoreSite (formerly CRG West)
DANIEL LANE VP, PROPERTY OPERATIONS
Steve provides leadership to drive lean principles
and collaboration within the Design & Construction
Teams, and is responsible for all Feasibility and
Master Plan studies
Steve joined Digital Realty in 2004. He is a
licensed Architect whose entire career has been
focused on advanced technology facilities
STEVE KUNDICH SVP, GLOBAL DESIGN
Anthony joined Digital Realty in 2008 and is
responsible for overseeing all datacenter
construction activities in North America
Anthony is a registered architect in New York, and
has more than 30 years of data center construction
experience
ANTHONY CARACINO VP, GLOBAL CONSTRUCTION
CHRIS SHARP
CTO, SERVICE INNOVATION
PHILIP LIN
SVP, GLOBAL STRATEGY
JOHN SHULTZ SVP, GLOBAL PRODUCT MANAGEMENT & DEVELOPMENT

37
Strategy in ActionDigital Ashburn
Campus Case
Study

$ M
$20 M
$40 M
$60 M
1Q
08
3Q
08
1Q
09
3Q
09
1Q
10
3Q
10
1Q
11
3Q
11
1Q
12
3Q
12
1Q
13
3Q
13
1Q
14
3Q
14
1Q
15
3Q
15
Turn-Key Flex® 159,208 $186 $29.6 million
Powered Base Building® - - -
Custom Solutions - - -
Colocation 11,784 $240 $2.8 million
Non-Technical 8,831 $27 $0.2 million
Total 179,823 $182 $32.6 million
Type of Space Total s.f. Signed (1) Annualized GAAP Annualized GAAP
Base Rent / s.f. (2)
Base Rent (2)
Healthy Leasing Activity in 3Q15Digital Economy Customer Concentration Consistent with Strategy
Note: Represents leases signed as of 9/30/15.
1) Includes signings for new and re-leased space.
2) GAAP rental revenues include total rent for new leases and expansion.
3) Represents $12 million direct lease with a former sub-tenant at a Powered Base Building in Santa Clara.
Historical Signings – Annualized GAAP Base Rent (2)
$ in millions
(3)
38

($ in millions)
2015 Year-to-Date Leasing ActivityLeasing by Market and Vertical (1) (2)
39
Note: Represents leases signed as of September 30, 2015. Represents annualized GAAP base rent.
1) Includes signings for new and re-leased space.
2) GAAP rental revenues include total rent for new leases and expansion.
Boston $0.9 $0.0 $0.3 $0.4
Chicago $14.3 -- $0.1 $0.2
Dallas $20.3 -- $0.1 $0.6
Houston $0.0 -- $0.0 $0.6
Northern Virginia $18.8 $5.0 $1.2 $0.0
New York Metro -- $0.2 -- $1.0
Phoenix $0.8 $0.7 $0.0 $4.0
Silicon Valley $0.3 -- $2.8 $0.7
Market SMACC Financial IT Other

Robust Demand in NoVAHistorical Supply and Absorption
40
36
28
49 51
31
1811
51
3233
11
53
2720
2835
31 28
0
20
40
60
2007 2008 2009 2010 2011 2012 2013 2014 1H15
Northern Virginia Data Center Market (1)
Deliveries Absorption
1813
825
12 120
15
30
2013 2014 1H15
Digital Realty Northern Virginia Portfolio
Deliveries Absorption
Inventory 421 MW ( 3.6 MW) 64.4 MW ( 4.8 MW)
Vacancy 15.5 MW / 3.7% ( 27.7%) 0.97 MW / 1.5% ( 2.2%)
Absorption 9.4 MW ( 11.4 MW) 7.4 MW ( 2.9 MW)
NoVA Data Center Market (1) NoVA Digital Realty Portfolio
in Megawatts
in Megawatts
1) Source: CBRE Data Center Market Overview. Based on second quarter 2015 data.
1Q15 vs. 2Q15

Ashburn Market HighlightsLeading U.S. Data Center Market
41
STRONG MARKET DYNAMICS DRIVING DEMAND AND RETURNS
Dense
Connectivity
• 70% of global internet
traffic flows through
Loudon County
• Access to +1,000 network
carriers
• Extensive fiber networks
established in the area
(MAE East)
Attractive Costs and
Accommodative
Location
• Cost competitive utility rates
and abundance of power
• Minimal exposure to natural
hazard risk - outside of the
500 year flood plain
• Tax exemptions on data
center building materials
and IT equipment
High Capacity
and Demand
• 592 MW total data center
inventory
• 56 MW leased in 2014
(25% of 2014 national
data center demand)

Digital Ashburn CampusVirtual Tour
42

Fiber
Future Building
Data Center
Digital Economy Lives HereDiverse Customer Base Seeking Scale and Connectivity
43

Dark Fiber Connects Campus to GatewaysSeamless Connection to Numerous Network Providers
44
Close proximity to the MAE
East Internet Exchange Point
providing premier
connectivity and access to an
extensive fiber network
already in place
Connectivity to over 1,000
network providers
Network Ecosystem
seamlessly connecting over
40 Digital Realty data centers
Multiple Cloud Connectivity
Options
19.2 MW of critical IT
capacity
Power provided by on-site
utility substation
Secure data center campus
with 24x7 onsite security
INTERNET
GATEWAY

Digital Ashburn CampusMaster Plan
45
Eight Existing Buildings:
approximately 1.5 million sq. ft.
Expansion: Master-planned for two
additional two-story buildings (H & J)
25+ additional 1.2 MW suites
Two 230 kV / 34.5 kV utility substations
on property
Access to over 1,000 network providers
Ecosystem connects 40+ Digital Realty
data centers globally
Multiple Cloud Connectivity Options
Web portal based Global Cloud
Marketplace
Dedicated Cloud Connect to select
cloud providers facilitated through
our network service supplier
partnerships
FACILITY CONNECTIVITY
FUTURE /
PLANNED
UNDER
DEVELOPMENT
FINANCIAL METRICS
Current Investment $955 M
Total Expected Investment $1,255 M
Current NOI $90 M
Stabilized NOI $148 M
Current Return 9.4%
Stabilized Return 11.8%

Our New StrategyUnique Ecosystem Built on Unrivaled Real Estate Expertise
46
We built the global standard for technical real estate,
developing a unique capability to acquire, manage, and scale
data center campuses. Now, Digital Realty is building a
unique ecosystem of open solutions powering customer
growth.
TELX BRINGS THE PROMISE OF
DIGITAL + REALTY TO LIFE
We expect to become the choice where customers find the
solutions that best fit their needs. In addition, we will be able
to connect them to their critical partners on an open platform.
The new Digital Realty will combine unparalleled service
delivery, interconnection, real estate acumen, and financial
stability to deliver unique power of choice and value when, and
where, our customers need it.
EcosystemsBuilding and connecting
communities of interest around our
customers’ businesses builds value
for them and for Digital Realty.
CampusesData center campuses across the
globe tether to major Cloud+Internet
hubs to provide massive connectivity
and maximum customer value.
Products + PartnersOur open solutions are purposefully
designed to marry our products and
our partners’ services to meet
customer needs now and in the
unpredictable future.

Our New BrandProduct Names
47
Digital Realty’s Global Campus Environment
provides agile business solutions - from partial
or full Data Center Suites to entire buildings
Colocation at the largest selection of Internet
Gateways delivers massive network-dense
connectivity paired with Exceptional Service
Directly linked to Internet Gateways, our unique
Connected Campuses deliver maximum value
along with a full range of technical services
Interconnection to 1,000+ carriers, ISPs,
content providers and enterprises – plus
the hybrid power of our cloudXCHANGE

Lunch
48

Capital Allocation
49

KEY INVESTMENT CRITERIA FOR EXPANSION
Prudent Capital AllocationGoverned by the Return on Invested Capital
50
Strategic and
Complementary
132PROPERTIES
Prudently
Financed
30+MARKETS
Financially
Accretive
24MILLION RENTABLE
SQUARE FEET
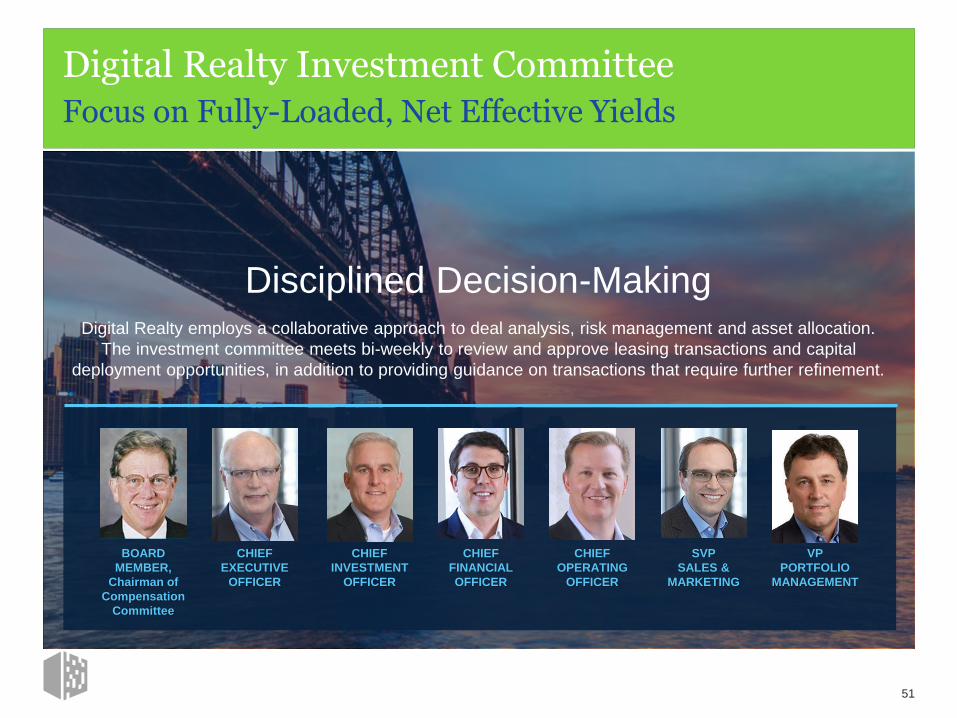
Digital Realty Investment CommitteeFocus on Fully-Loaded, Net Effective Yields
51
Disciplined Decision-MakingDigital Realty employs a collaborative approach to deal analysis, risk management and asset allocation.
The investment committee meets bi-weekly to review and approve leasing transactions and capital
deployment opportunities, in addition to providing guidance on transactions that require further refinement.
SVP
SALES &
MARKETING
CHIEF
OPERATING
OFFICER
CHIEF
FINANCIAL
OFFICER
CHIEF
EXECUTIVE
OFFICER
CHIEF
INVESTMENT
OFFICER
VP
PORTFOLIO
MANAGEMENT
BOARD
MEMBER,
Chairman of
Compensation
Committee

KEY ELEMENTS OF INVESTMENT UNDERWRITING
Stringent Acquisition CriteriaMarket Fundamentals, Accessibility, Stability and Risk
52
Market
Fundamentals
Core markets / major central
business districts
Supply & demand dynamics
Customer verticals
Land availability
Construction costs
Utility rates
Financial projections
Accessibility /
Internet Proximity
Access to fiber
Access to power
Proximity to major airports
Broadband penetration
Subsea cable landings
Business-Friendly /
Stable Locations
Accommodative local utility
providers
Ease of doing business
Reasonable entitlement
approval process
Low natural disaster-
prone areas
Respect for property rights
and rule of law
Tax regime

Inventory ManagementMeeting Customer Needs While Minimizing Carry
53
North
America
Europe
Asia
Pacific
SELLABLE INVENTORY:
DEVELOPABLE LAND:
87 MW
200+ MW
SELLABLE INVENTORY:
DEVELOPABLE LAND:
9 MW
40+ MW
SELLABLE INVENTORY:
DEVELOPABLE LAND:
19 MW
30+ MW
Source: Company disclosure and management estimates as of June 30, 2015.

Capital Recycling InitiativeRedeploying Accretively, Enhancing Portfolio Quality
54
23
4
7
5
6
Property Square Feet (1) Occupancy
Kato & Page 199,352 100%
Gold Camp 63,791 63%
900 Walnut 112,266 91%
210 Tucker 336,047 50%
1807 Michael Faraday 19,237 100%
251 Exchange 70,982 100%
200 Quannapowitt 211,095 59%
1
2
3
4
5
6
7
Two properties under contract
Five additional properties in
contract negotiations
1
1) Includes Net Rentable Square Feet, Space Under Active Development and Space Held for Development. For some of our properties, we calculate occupancy based on factors in addition to
contractually leased square feet, including available power, required support space and common area.

Financial Overview
55
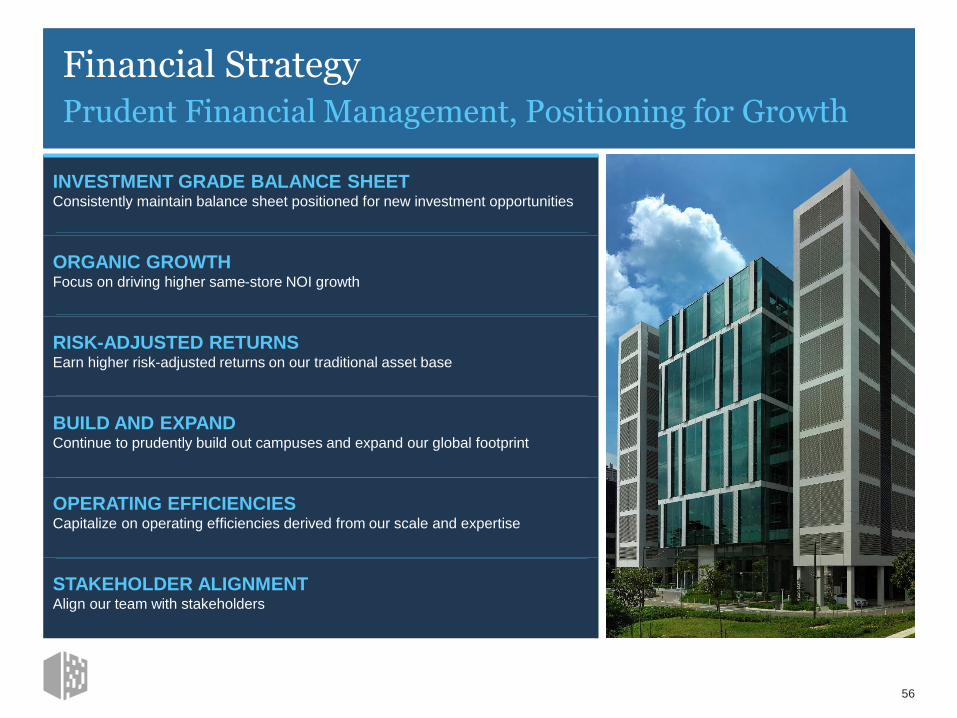
INVESTMENT GRADE BALANCE SHEETConsistently maintain balance sheet positioned for new investment opportunities
ORGANIC GROWTHFocus on driving higher same-store NOI growth
RISK-ADJUSTED RETURNSEarn higher risk-adjusted returns on our traditional asset base
BUILD AND EXPANDContinue to prudently build out campuses and expand our global footprint
OPERATING EFFICIENCIESCapitalize on operating efficiencies derived from our scale and expertise
STAKEHOLDER ALIGNMENTAlign our team with stakeholders
Financial StrategyPrudent Financial Management, Positioning for Growth
56

Bridge Credit FacilityObtained $1.9 billion unsecured bridge credit facility commitment to maintain liquidity
Common EquityExecuted forward sale agreements for $714 million of common equity gross proceeds concurrent
with Telx transaction announcement
Preferred EquityRaised $250 million of perpetual preferred equity gross proceeds at a 6.35% coupon in August 2015
Investment Grade BondsRaised $950 million of investment grade bond gross proceeds at a blended 4.0% coupon in
September 2015
Credit RatingsBBB / Baa2 / BBB credit ratings and stable outlook reaffirmed
57
Recreate S&U on
previous page in
Column Graphs
Executed on Acquisition Finance PlaybookSuccessfully Raised $1.9 Billion of Capital
Successful 2015 Capital Raising InitiativesMeet / Exceed Underwriting

Committed to Conservative Capital StructureMaximizing Capital Menu Options, Minimizing Cost
1) As of June 30, 2015.
2) Using data and exchange rates as of June 30, 2015. Includes DLR’s share of four unconsolidated JV loans. As of June 30, 2015 , $476.6M of the Term Loan was fixed rate and $484.5M was floating rate. Global Revolving
Credit Facility balance was $709.7M, net of unrestricted cash of $59.2M, excluding letters of credit totaling $8.1M as of June 30, 2015. Closing common stock price was $65.73 as of October 2, 2015. Pro forma for the
common stock offering of 10.5M shares in July 2015 at a price of $68 per share subject to forward sale agreements and pro forma for the $250M Series I preferred stock offering in August and pro forma for the $950M Note
offering in October.
3) Closing stock price was $65.73 as of October 2, 2015.
4) LQA Adjusted EBITDA represents second quarter 2015 Adjusted EBITDA annualized, pro forma for the Telx acquisition and related financings.
5) Fixed charge coverage ratio is Adjusted EBITDA divided by total fixed charges. Total fixed charges include interest expenses, capitalized interest, scheduled debt principal payments and preferred dividends.
Equity57%
Preferred8%
Fixed Rate Debt
28%
Variable Rate Debt
7%
Leverage Metrics Target
Net Debt / LQA Adjusted EBITDA (4) ~ 5.5x
Fixed Charge Coverage Ratio (5) > 3.0x
Maintain Conservative Leverage (2)
58
$1.2 billion available under $2.0 billion multi-currency
revolving credit facility (1)
Raised ~ $1.5 billion of investment grade bonds in 2015 to date to fund
acquisition and business, including green initiatives
Diversified Sources of Capital
Ample and Growing Liquidity
Access to public and private equity, equity-linked securities, perpetual
preferred, investment grade bonds and secured debt
Issued $500 million Green Bonds in June 2015
Risk Mitigation
Target < 20% of debt as floating rate
Natural hedge of FX risk through non-USD financings
$1.2 billion of non-USD debt outstanding (1)
Contemplating potential Euro bond within the next 12 months
DLR Equity Market Capitalization (2)(3) $9.8 Bn
TEV Pro Forma for Telx Acquisition (2) $17.2 Bn
Pro Forma Capitalization (2)
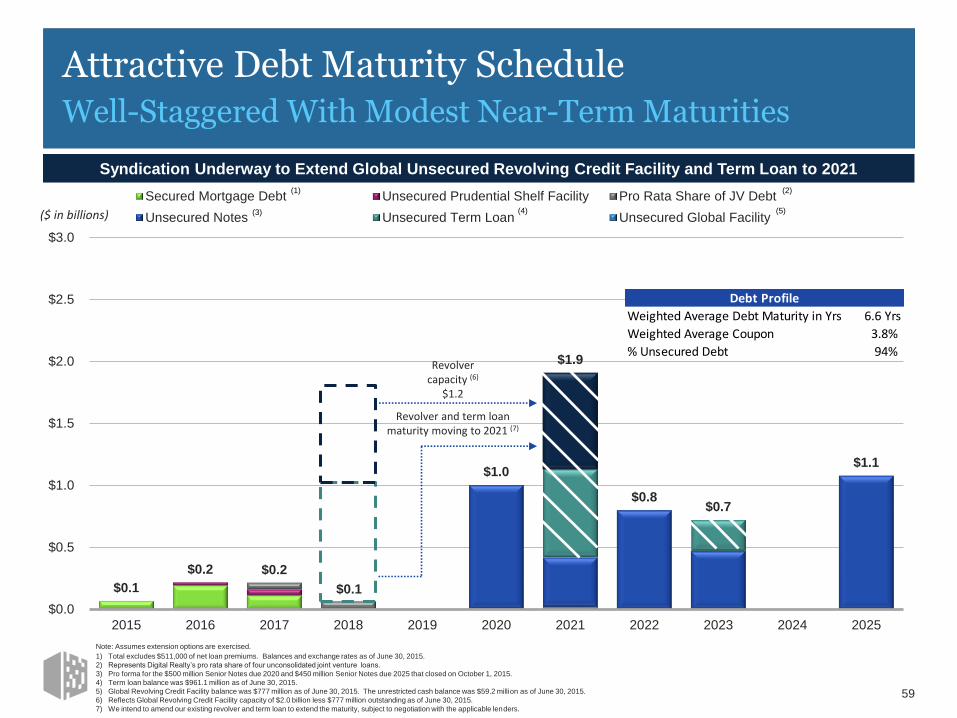
Attractive Debt Maturity ScheduleWell-Staggered With Modest Near-Term Maturities
59
$0.1
$0.2 $0.2
$0.1
$1.0
$1.9
$0.8 $0.7
$1.1
$0.0
$0.5
$1.0
$1.5
$2.0
$2.5
$3.0
2015 2016 2017 2018 2019 2020 2021 2022 2023 2024 2025
Secured Mortgage Debt Unsecured Prudential Shelf Facility Pro Rata Share of JV Debt
Unsecured Notes Unsecured Term Loan Unsecured Global Facility
Revolver capacity (6)
$1.2
(1)
Syndication Underway to Extend Global Unsecured Revolving Credit Facility and Term Loan to 2021
Revolver and term loan maturity moving to 2021 (7)
(2)
(4) (5)
Debt Profile
Weighted Average Debt Maturity in Yrs 6.6 Yrs
Weighted Average Coupon 3.8%
% Unsecured Debt 94%
(3)($ in billions)
Note: Assumes extension options are exercised.
1) Total excludes $511,000 of net loan premiums. Balances and exchange rates as of June 30, 2015.
2) Represents Digital Realty’s pro rata share of four unconsolidated joint venture loans.
3) Pro forma for the $500 million Senior Notes due 2020 and $450 million Senior Notes due 2025 that closed on October 1, 2015.
4) Term loan balance was $961.1 million as of June 30, 2015.
5) Global Revolving Credit Facility balance was $777 million as of June 30, 2015. The unrestricted cash balance was $59.2 million as of June 30, 2015.
6) Reflects Global Revolving Credit Facility capacity of $2.0 billion less $777 million outstanding as of June 30, 2015.
7) We intend to amend our existing revolver and term loan to extend the maturity, subject to negotiation with the applicable lenders.
Note: Figures and ranges presented represent company estimates and projections as of October 5, 2015. Actual results may vary materially.
1) Assumes dividends are paid from cash flow generated from operations.
60
Recreate S&U on
previous page in
Column Graphs
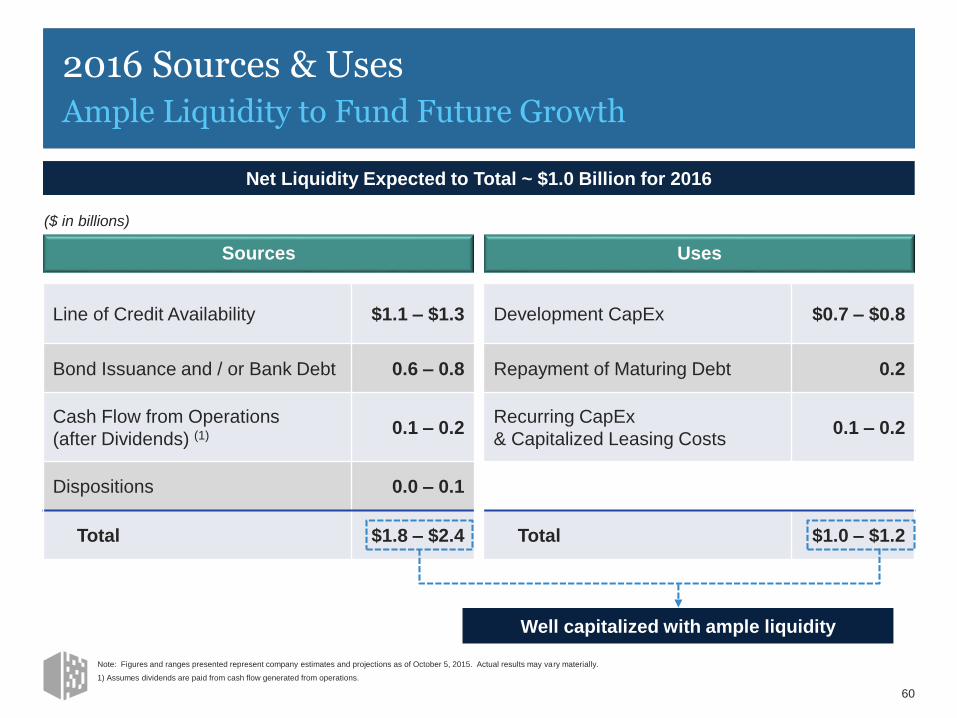
2016 Sources & UsesAmple Liquidity to Fund Future Growth
Development CapEx $0.7 – $0.8
Repayment of Maturing Debt 0.2
Recurring CapEx
& Capitalized Leasing Costs0.1 – 0.2
Total $1.0 – $1.2
(1)
Net Liquidity Expected to Total ~ $1.0 Billion for 2016
Line of Credit Availability $1.1 – $1.3
Bond Issuance and / or Bank Debt 0.6 – 0.8
Cash Flow from Operations
(after Dividends) (1) 0.1 – 0.2
Dispositions 0.0 – 0.1
Total $1.8 – $2.4
Sources Uses
Well capitalized with ample liquidity
($ in billions)

Building Blocks of Organic GrowthCompounding Growth Drivers
61
Source: Based on company filings as of June 30, 2015.
1) Company calculation based on information as of July 23, 2015.
2) Based on top 25 customers.
93.5%Portfolio
Occupancy
6.3Year Average
Remaining
Lease Term
8%Average Annual
Lease Expiration
MTM Gradually
Improving Cash Re-Leasing
Spreads
~ 80%Average Tenant
Retention
2%-3%Average Rent
Bumps (1) 3%Auto-Renewal
Uplift
0.6% Gross Monthly
Churn
9.2Year Average
Customer Life (2)
68%Utilization;
Upside From
Lease-Up
DIGITAL REALTY STANDALONE TELX CONTRIBUTION

Improving Data Center Market RentsModest Rent Growth Anticipated over the Forecast Period
62
Source: Company disclosure and management estimates.
1) GAAP rents on signed Digital Realty data center leases for 2007-2014. 2015E-2018E for illustrative purposes only; assumptions are based on management estimates and actual results may vary materially from these
estimates.
North America Data Center Market Rents (1)
2007 2008 2009 2010 2011 2012 2013 2014 2015E 2016E 2017E 2018E
Data Center Market Rents / Estimates/
Healthy Recovery in Net Effective Rents Underway

Improving Data Center Market RentsThe Cycle Has Entered Expansion Phase
63
Source: Company disclosure and management estimates.
1) GAAP rents on signed Digital Realty data center leases for 2007-2014. 2015E-2018E for illustrative purposes only; assumptions are based on management estimates and actual results may vary materially from
these estimates.
2007 2008 2009 2010 2011 2012 2013 2014 2015E 2016E 2017E 2018E
North America Data Center Market Rents (1)
Healthy Recovery in Net Effective Rents Underway
Data Center Market Rents/ Data Center Market Rents / Estimates
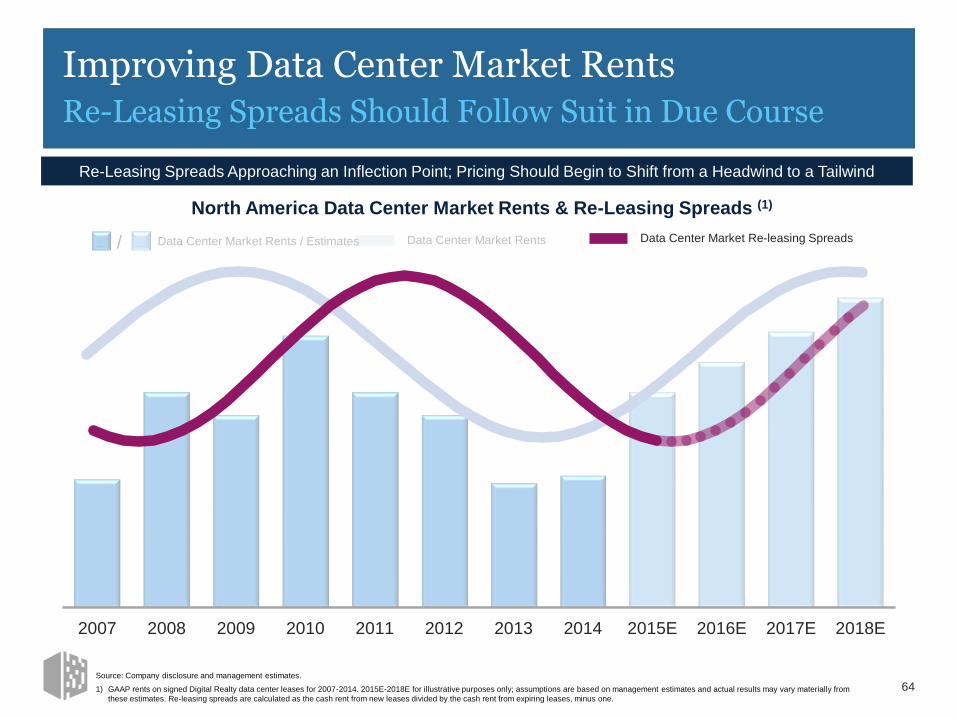
Improving Data Center Market RentsRe-Leasing Spreads Should Follow Suit in Due Course
2007 2008 2009 2010 2011 2012 2013 2014 2015E 2016E 2017E 2018E
64
Data Center Market Re-leasing Spreads
North America Data Center Market Rents & Re-Leasing Spreads (1)
/ Data Center Market Rents / Estimates Data Center Market Rents
Source: Company disclosure and management estimates.
1) GAAP rents on signed Digital Realty data center leases for 2007-2014. 2015E-2018E for illustrative purposes only; assumptions are based on management estimates and actual results may vary materially from
these estimates. Re-leasing spreads are calculated as the cash rent from new leases divided by the cash rent from expiring leases, minus one.
Re-Leasing Spreads Approaching an Inflection Point; Pricing Should Begin to Shift from a Headwind to a Tailwind

Focus on Operating EfficienciesTargeting 200 bps EBITDA Margin Expansion by 2018
Source: Company disclosures.
Note: Assumptions are based on management estimates and actual results may vary materially from these estimates.
1) As of June 30, 2015.
Current (1)
Margin
Expansion
Underwritten Expense Synergies from Telx Acquisition +
Increased Utilization at Telx Facilities +
Targeted Operating Plan Efficiencies to be Achieved in 2016 +
Margin Expansion from Development Properties Coming Online +
Target Target 2018 Adjusted EBITDA Margin+ 200 bps
Margin
Expansion
59% 34% 55% Pro Forma
Adjusted EBITDA Margin
Telx
Adjusted EBITDA Margin
Standalone
Adjusted EBITDA Margin
65

Exceptional Risk-Adjusted Growth Track RecordSteady Growth, Low Volatility
Source: Company calculations based on data from SNL Financial and FactSet for the 144 constituents in the MSCI RMS Total Return Index.
1) 10-year FFO and dividend per share CAGR calculated using 2015 consensus estimates and 2005 actuals. Standard deviation calculated using annual 10-year FFO per share and dividend per share growth rates.
66
(15.0%)
0.0%
15.0%
0.0 1.0 2.0(15.0%)
0.0%
15.0%
0.0 1.0 2.0
(Standard Deviation)
(10
-Ye
ar F
FO /
Sh
are
CA
GR
)
(10
–Ye
ar D
ivid
end
/ S
har
e C
AG
R)
10-Year Dividend / Share Risk-Adjusted Growth (1)10-Year FFO / Share Risk-Adjusted Growth (1)
Consistently Delivered Healthy Growth in FFO and Dividends per Share, with Low Volatility
(Standard Deviation)
DLR DLRAbove-average
growth relative to volatility
Above-average growth relative to
volatility
Below-average growth relative to
volatility
Below-average growth relative to
volatility

Uninterrupted Growth throughout the CycleCounter-Cyclical Performance Compares Favorably
Sources: SNL Financial and FactSet.
1) 10-year FFO per Share CAGR calculated using 2005 actuals and 2015E consensus estimates. Index value starts at 100 and increases or decreases by annual percent FFO per share growth.
67
0
100
200
300
400
2005 2006 2007 2008 2009 2010 2011 2012 2013 2014 2015E
Nine Consecutive Years of Positive Growth
AVB: 8.0%
BXP: 2.4%
EQR: 3.2%
PSA: 9.2%
DLR: 14.2%
SPG: 7.3%
KIM: (2.7)%
2005 – 2015E FFO /
Share CAGR (1)
Financial Crisis

Cash Flow Poised to Outpace EarningsSteady, Improving and High-Quality Growth
68
1) Forecasts are based on current estimates; actual results may vary from current estimates. Growth expectation for 2016 core FFO per share is relative to 2015 guidance of $5.05-$5.15.
2) Core FFO and AFFO are non-GAAP financial measures. Please see Appendix for definitions of Core FFO and AFFO and reconciliations to their closest GAAP equivalent.
Double-Digit
Growth
Mid
Single-Digit
Growth
Low Volatility, High Quality of Earnings, Accelerating Growth Profile
PRICE INCREASESContractual bumps and improving rent growth
LEASE-UPOpportunity to generate upside from vacancy,
particularly in legacy Telx facilities
DEVELOPMENTDelivery and stabilization of value-creating pipeline
INTERCONNECTIONHigh-growth and high-margin business
fundamentals
MARGIN EXPANSIONLease-up, efficiencies and stabilization
SYNERGIESAcquisition-related expense synergies, longer-term
revenue synergy upside potential
FINANCIAL OUTLOOK (1) Accelerating Growth from Compound Drivers
2015 2016 2017 2018
AFFO (2)
Core
FFO (2)
Target
accelerating
growth in
out-years
Cash flow contribution from Telx and straight-line rent burn-off drive
double-digit AFFO growth in ‘16

Significant Upside PotentialIncremental Value & Improved Asset Utilization in Existing Portfolio
Migration of DLR Internet Gateways to Telx
$
$$
$$$
Note: All amounts are based on current estimates. Actual results may vary materially.
1) Based on 150 million pro forma diluted shares and units outstanding. Please read the note regarding Forward Looking Statements in the Appendix for additional information.
69
+ $40 mm
Incremental Value at:6.75% – 7.25% Cap RateLess: CapitalNet Value
$552 – $593(340)
$212 – $253
+ 30 bps
$1 – $2
+ $250 mm
Incremental Value at:6.75% – 7.25% Cap RateLess: CapitalNet Value
$3,450 – $3,700(2,200)
$1,250 – $1,500
+ 80 bps
$8 – $10
+ $55 mm
Incremental Value at:7.75% – 8.75% Cap RateLess: CapitalNet Value
$629 – $710(90)
$539 – $620
+ 80 bps
$4 – $4
Potential Incremental NAV / Share (1)
2016 Backlog & Beyond
Lease-Up of DLR Finished, Shell, & Land Inventory
Lease-Up of Telx Inventory
2
3
$12 – $16 – $$$
ROICNOI2016 to 2018
1
Telx Roll-Out in New Markets
Tethering Internet Gatewaysto Facilitate Hybrid Cloud
5
6
Long-Term Plan
4
($ in millions, except per share amounts)

Components of NAV: Telx ContributionTelx Acquisition Accretive to Net Asset Value
70
$178 million 2016E Telx NOI
Internet Gateway50% of Total NOI
5.0%-6.0% cap rate
Leased / Non- Gateway50% of Total NOI
7.75%-8.75% cap rate
Telx Real Estate Value($ in billions)
$1.9 BnPurchasePrice
NAV / Share Accretion from Telx Acquisition
$3.68
$4.99
$6.53
6%
8%
10%
0.0%
3.0%
6.0%
9.0%
12.0%
15.0%
$0.00
$1.50
$3.00
$4.50
$6.00
$7.50
Low Value Mid Value High Value
Accretion $ / Share (left axis)
Accretion % to Current Stock Price (right axis)
$1.5 $1.6 $1.8
$1.0 $1.1
$1.1
$2.5 $2.7
$2.9
$0.0
$1.0
$2.0
$3.0
Low Value Mid Value High Value
Internet Gateway Leased / Non-Internet Gateway

Valuation OverviewPremium Track Record at a Discounted Valuation
Metric DLR REIT Average (1)
Spread
Implied Cap Rate 7.2% 5.9% 1.3%
Dividend Yield 5.3% 4.0% 1.3%
Premium / (Discount) to NAV (5.0%) (4.7%) (0.3%)
2015E AFFO (2)
/ Yield 6.8% 5.4% 1.3%
Price / 2015E FFO (2) 12.7x 16.4x (3.7x)
EV / LQA Adj. EBITDA (2) 18.2x 19.0x (0.8x)
Source: Citi Investment Research. Note: Pricing as of October 1, 2015.
1) REIT universe defined as a weighted average based on equity market capitalization of the publicly listed U.S. REITs in the following sectors: malls & outlets, shopping centers, triple net, apartments, student
housing, home, single family, storage, healthcare, office, industrial, mixed office, lab office, data center, diversified, specialty and lodging.
2) AFFO, FFO and Adj. EBITDA are non-GAAP financial measures. Please see Appendix for definitions of AFFO, FFO and Adj. EBITDA and reconciliations to their closest GAAP equivalents. 71

Think Like an Owner TodayCommitted to Shareholder-Friendly Governance
72
Three recent corporate initiatives further enhance corporate governance
April 2014: Long-Term Incentive Plan
Market performance-based award plan created to align
executives’ incentives to total shareholder return
2014 2015
November 2015: Employee Stock Purchase Plan
Will allow employees to increase their company share
ownership
August 2015: Minimum Ownership Requirements
Guidelines require senior management to own company stock

1 SUPERIOR RETURNS
Deliver superior risk-adjusted
total shareholder returns
2 CAPITAL ALLOCATION
Prudently allocate capital to
opportunistically extend global
campus footprint
3 PRODUCT OFFERINGS
Drive higher returns on the
asset base by diversifying
product offerings
4 OPERATING EFFICIENCIES
Achieve operating efficiencies
to accelerate growth in cash
flow and value per share
Our FocusOur philosophy is to deliver superior returns to our
shareholders by capitalizing on our core competencies and
tailoring them to meet the ever growing and evolving data
center needs of our customers
The Next HorizonThree-Year Guideposts
73

Appendix
74

Forward-Looking Statements
The information included in this presentation contains forward-looking statements. Such statements are based on management’s beliefs and assumptions made based on information currently
available to management. Such forward-looking statements include statements relating to: our economic outlook; the acquisition of Telx Holdings, Inc. and our expected benefits from the acquisition;
opportunities and strategies, including ROIC, recycling assets and capital, and sources of growth; the expected effect of foreign currency translation adjustments on our financials; business drivers;
sources and uses; our expected development plans and completions, including timing, total square footage, IT capacity and raised floor space upon completion; expected availability for leasing
efforts, sales incentive program, mid-market and colocation initiatives; organizational initiatives; joint venture opportunities; occupancy and total investment; our expected investment in our
properties; our estimated time to stabilization and targeted returns at stabilization of our properties; our expected future acquisitions; acquisitions strategy; available inventory and development
strategy; the signing and commencement of leases, and related rental revenue; lag between signing and commencement of leases; our expected same store portfolio growth; our expected growth
and stabilization of development completions and acquisitions; our expected mark-to-market rates on lease expirations, lease rollovers and expected rental rate changes; our expected yields on
investments; our expectations with respect to capital investments at lease expiration on existing Turn-Key Flex space; barriers to entry; competition; debt maturities; lease maturities; our expected
returns on invested capital; estimated absorption rates; our other expected future financial and other results, and the assumptions underlying such results; our top investment markets and market
opportunities; our ability to access the capital markets; expected time and cost savings to our customers; our customers’ capital investments; our plans and intentions; future data center utilization,
utilization rates, growth rates, trends, supply and demand, and demand drivers; datacenter outsourcing trends; datacenter expansion plans; estimated kW/MW requirements; growth in the overall
Internet infrastructure sector and segments thereof; the market effects of regulatory requirements; the replacement cost of our assets; the development costs of our buildings, and lead times;
estimated costs for customers to deploy or migrate to a new data center; capital expenditures; the effect new leases and increases in rental rates will have on our rental revenues and results of
operations; lease expiration rates; our ability to borrow funds under our credit facilities; estimates of the value of our development portfolio; our ability to meet our liquidity needs, including the ability
to raise additional capital; credit ratings; capitalization rates, or cap rates, potential new markets; dividend payments and our dividend policy; projected financial information and covenant metrics;
annualized, projected and run-rate NOI; other forward-looking financial data; leasing expectations; Digital Realty Ecosystem, our connectivity initiative; Digital Open Internet Exchange; our
expectations and underlying assumptions regarding our sensitivity to fluctuations in foreign exchange rates and energy prices; and the sufficiency of our capital to fund future requirements. You can
identify forward-looking statements by the use of forward-looking terminology such as “believes,” “expects,” “may,” “will,” “should,” “seeks,” “approximately,” “intends,” “plans,” “pro forma,” “estimates”
or “anticipates” or the negative of these words and phrases or similar words or phrases which are predictions of or indicate future events or trends and discussions which do not relate solely to
historical matters. Such statements are subject to risks, uncertainties and assumptions, are not guarantees of future performance and may be affected by known and unknown risks, trends,
uncertainties and factors that are beyond our control that may cause actual results to vary materially. Some of the risks and uncertainties include, among others, the following: the impact of current
global economic, credit and market conditions; current local economic conditions in our geographic markets; decreases in information technology spending, including as a result of economic
slowdowns or recession; adverse economic or real estate developments in our industry or the industry sectors that we sell to (including risks relating to decreasing real estate valuations and
impairment charges); our dependence upon significant tenants; bankruptcy or insolvency of a major tenant or a significant number of smaller tenants; defaults on or non-renewal of leases by
tenants; our failure to obtain necessary debt and equity financing; risks associated with using debt to fund our business activities, including re-financing and interest rate risks, our failure to repay
debt when due, adverse changes in our credit ratings or our breach of covenants or other terms contained in our loan facilities and agreements; financial market fluctuations; changes in foreign
currency exchange rates; our inability to manage our growth effectively; difficulty acquiring or operating properties in foreign jurisdictions; the occurrence of any event, change or other circumstance
that would compromise our ability to complete the acquisition of Telx within the expected timeframe or at all; our failure to successfully integrate and operate acquired or developed properties or
businesses, including Telx; the suitability for our properties and data center infrastructure, delays or disruptions in connectivity, failure of our physical infrastructure or services or availability of power;
risks related to joint venture investments, including as a result of our lack of control of such investments; delays or unexpected costs in development of properties; decreased rental rates, increased
operating costs or increased vacancy rates; increased competition or available supply of data center space; our inability to successfully develop and lease new properties and development space;
difficulties in identifying properties to acquire and completing acquisitions; our inability to acquire off-market properties; our inability to comply with the rules and regulations applicable to reporting
companies; our failure to maintain our status as a REIT; possible adverse changes to tax laws; restrictions on our ability to engage in certain business activities; environmental uncertainties and risks
related to natural disasters; losses in excess of our insurance coverage; changes in foreign laws and regulations, including those related to taxation and real estate ownership and operation; and
changes in local, state and federal regulatory requirements, including changes in real estate and zoning laws and increases in real property tax rates. The risks described above are not exhaustive,
and additional factors could adversely affect our business and financial performance, including those discussed under the heading “Risks Related to the Proposed Telx Acquisition” in our Current
Report on Form 8-K filed on July 14, 2015, in our annual report on Form 10-K for the year ended December 31, 2014, and subsequent filings with the Securities and Exchange Commission. We
expressly disclaim any responsibility to update forward-looking statements, whether as a result of new information, future events or otherwise.
75
Digital Realty and Digital Realty Connect marks are trademarks of our company. All other trademarks or trade names appearing in this presentation are the property of their respective owners.

Definitions of Non-GAAP Financial Measures
The information included in this presentation contains certain non-GAAP financial measures that management believes are helpful in understanding our business, as further described below. Our definition and
calculation of non-GAAP financial measures may differ from those of other REITs, and, therefore, may not be comparable. The non-GAAP financial measures should not be considered an alternative to net
income or any other GAAP measurement of performance and should not be considered an alternative to cash flows from operating, investing or financing activities as a measure of liquidity.
FUNDS FROM OPERATIONS (FFO)
We calculate Funds from Operations, or FFO, in accordance with the standards established by the National Association of Real Estate Investment Trusts, or NAREIT. FFO represents net income (loss)
(computed in accordance with GAAP), excluding gains (or losses) from sales of property, impairment charges, real estate related depreciation and amortization (excluding amortization of deferred financing
costs) and after adjustments for unconsolidated partnerships and joint ventures. Management uses FFO as a supplemental performance measure because, in excluding real estate related depreciation and
amortization and gains and losses from property dispositions, it provides a performance measure that, when compared year over year, captures trends in occupancy rates, rental rates and operating costs. We
also believe that, as a widely recognized measure of the performance of REITs, FFO will be used by investors as a basis to compare our operating performance with that of other REITs. However, because
FFO excludes depreciation and amortization and captures neither the changes in the value of our properties that result from use or market conditions, nor the level of capital expenditures and capitalized leasing
commissions necessary to maintain the operating performance of our properties, all of which have real economic effect and could materially impact our financial condition and results from operations, the utility
of FFO as a measure of our performance is limited. Other REITs may not calculate FFO in accordance with the NAREIT definition and, accordingly, our FFO may not be comparable to such other REITs’ FFO.
Accordingly, FFO should be considered only as a supplement to net income computed in accordance with GAAP as a measure of our performance.
ADJUSTED FUNDS FROM OPERATIONS (AFFO)
We present adjusted funds from operations, or AFFO, as a supplemental operating measure because, when compared year over year, it assesses our ability to fund dividend and distribution requirements from
our operating activities. We also believe that, as a widely recognized measure of the operations of REITs, AFFO will be used by investors as a basis to assess our ability to fund dividend payments in
comparison to other REITs, including on a per share and unit basis. We calculate AFFO by adding to or subtracting from FFO (i) non-real estate depreciation, (ii) amortization of deferred financing costs, (iii)
amortization of debt discount/premium, (iv) non-cash compensation, (v) deferred compensation related to equity acceleration, (vi) loss from early extinguishment of debt, (vii) straight line rents, net, (viii) above-
and below-market rent amortization, (ix) change in fair value of contingent consideration, (x) gain on sale of investment, (xi) non-cash tax expense/(benefit), (xii) capitalized leasing compensation, (xiii) recurring
capital expenditures and (xiv) capitalized internal leasing commissions. Other REITs may not calculate AFFO in a consistent manner. Accordingly, our AFFO may not be comparable to other REITs’ AFFO.
AFFO should be considered only as a supplement to net income computed in accordance with GAAP as a measure of our performance
CORE FUNDS FROM OPERATATIONS
We present core funds from operations, or core FFO, as a supplemental operating measure because, in excluding certain items that do not reflect core revenue or expense streams, it provides a performance
measure that, when compared year over year, captures trends in our core business operating performance. We calculate core FFO by adding to or subtracting from FFO (i) termination fees and other non-core
revenues, (ii) gain on sale of investment, (iii) significant transaction expenses, (iv) loss from early extinguishment of debt, (v) change in fair value of contingent consideration, (vi) equity in earnings adjustment for
non-core items, (vii) severance accrual, equity acceleration, and legal expenses and (viii) other non-core expense adjustments. Because certain of these adjustments have a real economic impact on our
financial condition and results from operations, the utility of core FFO as a measure of our performance is limited. Other REITs may not calculate core FFO in a consistent manner. Accordingly, our core FFO
may not be comparable to other REITs' core FFO. Core FFO should be considered only as a supplement to net income computed in accordance with GAAP as a measure of our performance.
CONSTANT CURRENCY CORE FUNDS FROM OPERATIONS:
We calculate "constant currency" core funds from operations by adjusting the core funds from operations for foreign currency translations.
NET OPERATING INCOME (NOI) AND CASH NOI
NOI represents rental revenue and tenant reimbursement revenue less rental property operating and maintenance expenses, property taxes and insurance expenses (as reflected in statement of operations).
NOI is commonly used by stockholders, company management and industry analysts as a measurement of operating performance of the company’s rental portfolio. Cash NOI is NOI less straight-line rents and
above and below market rent amortization. Cash NOI is commonly used by stockholders, company management and industry analysts as a measure of property operating performance on a cash basis.
However, because NOI and cash NOI exclude depreciation and amortization and capture neither the changes in the value of our properties that result from use or market conditions, nor the level of capital
expenditures and capitalized leasing commissions necessary to maintain the operating performance of our properties, all of which have real economic effect and could materially impact our results from
operations, the utility of NOI and cash NOI as measures of our performance is limited. Other REITs may not calculate NOI and cash NOI in the same manner we do and, accordingly, our NOI and cash NOI may
not be comparable to such other REITs’ NOI and cash NOI. Accordingly, NOI and cash NOI should be considered only as supplements to net income computed in accordance with GAAP as measures of our
performance.
76

Reconciliation of Non-GAAP Items To Their Closest GAAP Equivalent
Digital Realty Trust, Inc. and Subsidiaries
Reconciliation of Net Income Available to Common Stockholders to Funds From Operations (FFO)
(in thousands, except per share and unit data)
(unaudited)
(2) For all periods presented, we have excluded the effect of dilutive series E, series F, series G and series H preferred stock, as applicable, that may be converted upon the occurrence
of specified change in control transactions as described in the articles supplementary governing the series E, series F, series G and series H preferred stock, as applicable, which we
consider highly improbable. In addition, the 5.50% exchangeable senior debentures due 2029 were exchangeable for 0, 0 and 1,122 common shares on a weighted average basis for
the three months ended June 30, 2015, March 31, 2015 and June 30, 2014, respectively, and 0 and 3,948 for the six months ended June 30, 2015 and June 30, 2014, respectively . See
below for calculations of diluted FFO available to common stockholders and unitholders and weighted average common stock and units outstanding.
June 30, 2015 June 30, 2014 June 30, 2015 June 30, 2014
Net income (loss) available to common stockholders 117,055$ 41,510$ 218,783$ 75,696$
Adjustments:
Noncontrolling interests in operating partnership 2,377 873 4,403 1,566
Real estate related depreciation and amortization (1) 130,198 135,939 258,021 265,435 Real estate related depreciation and amortization related to investment in
unconsolidated joint ventures 3,187 1,802 5,790 3,430
Impairment of investments in real estate - - - -
Gain on sale of properties (76,669) (15,945) (94,489) (15,945)
Gain on contribution of property to unconsolidated joint venture - - - (1,906)
FFO available to common stockholders and unitholders (2) 176,148$ 164,179$ 392,508$ 328,276$
Basic FFO per share and unit 1.27$ 1.20$ 2.83$ 2.45$
Diluted FFO per share and unit (2) 1.26$ 1.20$ 2.82$ 2.41$
Weighted average common stock and units outstanding
Basic 138,568 136,615 138,488 133,894
Diluted (2) 139,759 137,912 139,243 137,979
(1) Real estate related depreciation and amortization was computed as follows:
Depreciation and amortization per income statement 131,524 137,092 260,597 267,712
Non-real estate depreciation (1,326) (1,153) (2,576) (2,277)
130,198$ 135,939$ 258,021$ 265,435$
Six Months EndedThree Months Ended
77

Reconciliation of Non-GAAP Items To Their Closest GAAP Equivalent
Digital Realty Trust, Inc. and Subsidiaries
Reconciliation of Funds From Operations (FFO) to Core Funds From Operations (CFFO)
(in thousands, except per share and unit data)
(unaudited)
(3) Includes one-time fees, proceeds and certain other adjustments that are not core to our business.
(4) Relates to earn-out contingency in connection with Sentrum Portfolio acquisition.
(5) Relates to severance charges related to the departure of company executives.
(6) Includes reversal of accruals and certain other adjustments that are not core to our business.
June 30, 2015 June 30, 2014 June 30, 2015 June 30, 2014
FFO available to common stockholders and unitholders 176,148$ 164,179$ 392,508$ 328,276$
Add: 5.50% exchangeable senior debentures interest expense - 675 - 4,725
FFO available to common stockholders and unitholders -- diluted 176,148$ 164,854$ 392,508$ 333,001$
Weighted average common stock and units outstanding 138,568 136,615 138,488 133,894
Add: Effect of dilutive securities (excluding 5.50% exchangeable senior debentures) 1,191 175 755 137
Add: Effect of dilutive 5.50% exchangeable senior debentures - 1,122 - 3,948
Weighted average common stock and units outstanding -- diluted 139,759 137,912 139,243 137,979
Three Months Ended Six Months Ended
June 30, 2015 June 30, 2014 June 30, 2015 June 30, 2014
FFO available to common stockholders and unitholders -- diluted 176,148$ 164,854$ 392,508$ 333,001$
Termination fees and other non-core revenues (3)
(313) (873) 1,260 (2,920)
Significant transaction expenses 3,166 755 3,259 836
Loss from early extinguishment of debt 148 293 148 585
Change in fair value of contingent consideration (4)
352 766 (42,682) (2,637)
Equity in earnings adjustment for non-core items - - - 843
Severance accrual and equity acceleration (5)
1,301 260 2,697 12,690
Other non-core expense adjustments (6)
(29) 651 (59) 651
CFFO available to common stockholders and unitholders -- diluted 180,773$ 166,706$ 357,131$ 343,049$
Diluted CFFO per share and unit 1.29$ 1.21$ 2.56$ 2.49$
Three Months Ended Six Months Ended
78

Reconciliation of Non-GAAP Items To Their Closest GAAP Equivalent
Digital Realty Trust, Inc. and Subsidiaries
Reconciliation of Net Income Available to Common Stockholders to Earnings Before Interest, Taxes,
Depreciation and Amortization (EBITDA) and Adjusted EBITDA
(in thousands)
(unaudited)
June 30, 2015 June 30, 2014 June 30, 2015 June 30, 2014
Net income (loss) available to common stockholders 117,055$ 41,510$ 218,783$ 75,696$
Interest 46,114 49,146 91,580 96,520
Loss from early extinguishment of debt 148 293 148 585
Taxes 2,615 1,021 4,290 2,859
Depreciation and amortization 131,524 137,092 260,597 267,712
Impairment of investments in real estate - - - -
EBITDA 297,456 229,062 575,398 443,372
Change in fair value of contingent consideration 352 766 (42,682) (2,637)
Severance accrual and equity acceleration 1,301 260 2,697 12,690
Gain on sale of properties (76,669) (15,945) (94,489) (15,945)
Gain on contribution of property to unconsolidated joint venture - - - (1,906)
Gain on sale of investment - - - -
Noncontrolling interests 2,486 993 4,628 1,798
Preferred stock dividends 18,456 18,829 36,911 30,555
Adjusted EBITDA 243,382$ 233,965$ 482,463$ 467,927$
Six Months EndedThree Months Ended
79
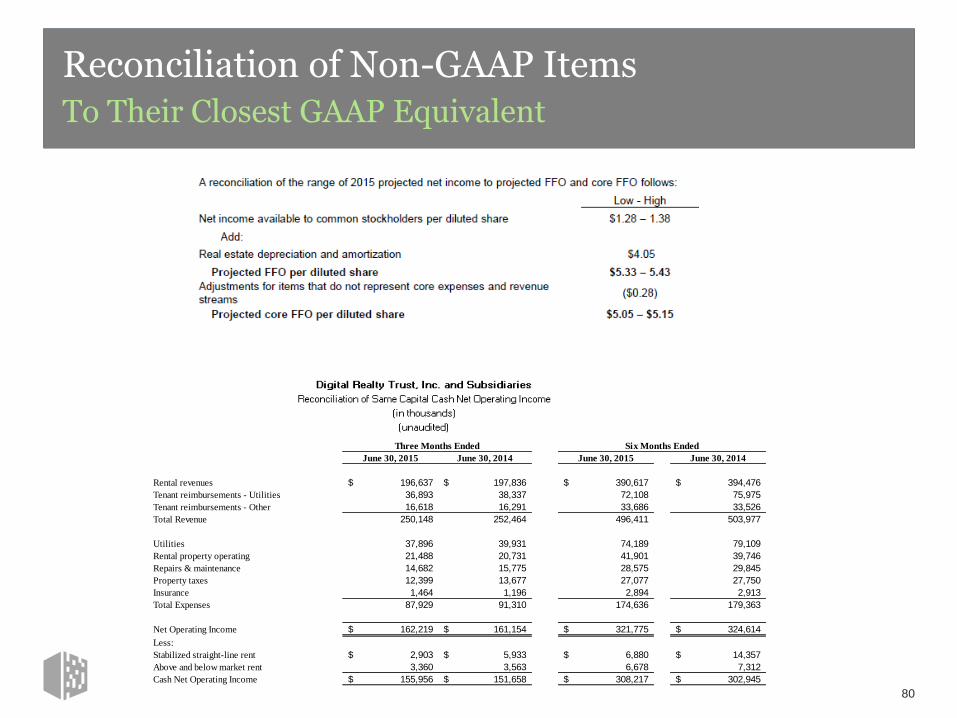
Reconciliation of Non-GAAP Items To Their Closest GAAP Equivalent
June 30, 2015 June 30, 2014 June 30, 2015 June 30, 2014
Rental revenues 196,637$ 197,836$ 390,617$ 394,476$
Tenant reimbursements - Utilities 36,893 38,337 72,108 75,975
Tenant reimbursements - Other 16,618 16,291 33,686 33,526
Total Revenue 250,148 252,464 496,411 503,977
Utilities 37,896 39,931 74,189 79,109
Rental property operating 21,488 20,731 41,901 39,746
Repairs & maintenance 14,682 15,775 28,575 29,845
Property taxes 12,399 13,677 27,077 27,750
Insurance 1,464 1,196 2,894 2,913
Total Expenses 87,929 91,310 174,636 179,363
Net Operating Income 162,219$ 161,154$ 321,775$ 324,614$
Less:
Stabilized straight-line rent 2,903$ 5,933$ 6,880$ 14,357$
Above and below market rent 3,360 3,563 6,678 7,312
Cash Net Operating Income 155,956$ 151,658$ 308,217$ 302,945$
Three Months Ended Six Months Ended
80
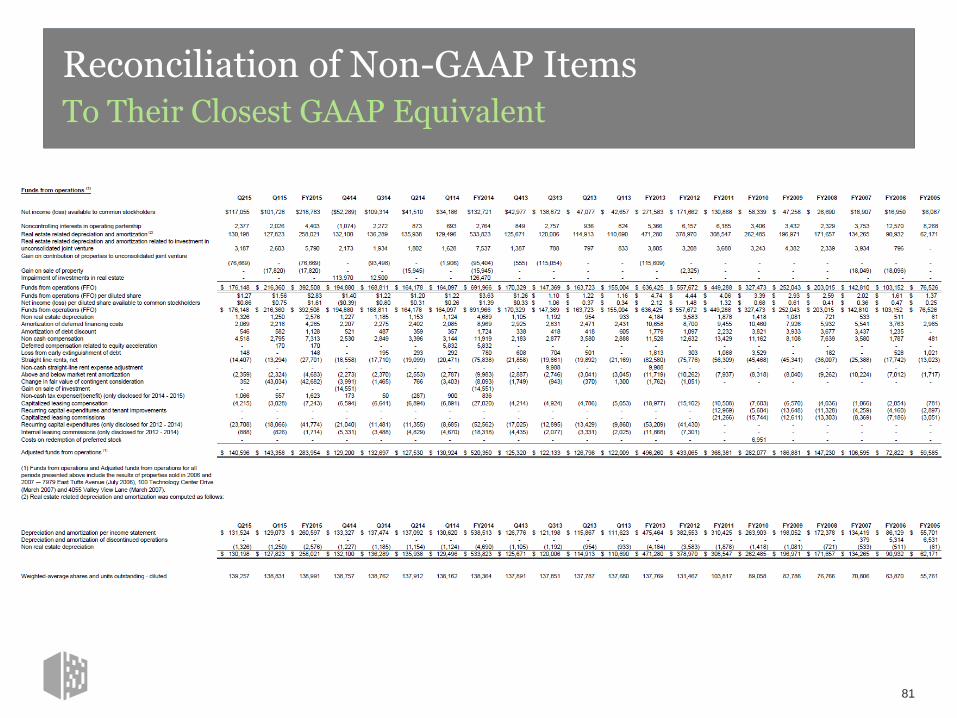
Reconciliation of Non-GAAP Items To Their Closest GAAP Equivalent
81

Reconciliation of Non-GAAP Items To Their Closest GAAP Equivalent
82
December 31, 2014 December 31, 2013 December 31, 2012 December 11, 2011 December 31, 2010 December 31, 2009
FFO available to common stockholders and unitholders 691,966$ 636,426$ 557,672$ 449,288$ 327,473$ 252,043$
Add: Series C convertible preferred dividends - - 1,402 6,077 7,656 7,656
Add: Series D convertible preferred dividends - - 8,212 13,394 18,962 18,968
Add: 5.50% exchangeable senior debentures interest expense 4,725 16,200 16,200 16,200 16,200 11,248
FFO available to common stockholders and unitholders -- diluted 696,691$ 652,626$ 583,486$ 484,959$ 370,291$ 289,915$
Weighted average common stock and units outstanding 136,124 130,463 119,861 103,053 89,261 81,715
Add: Effect of dilutive securities (excluding series C and D convertible preferred stock
and 5.50% exchangeable senior debentures) 282 187 289 764 1,738 1,071
Add: Effect of dilutive series C convertible preferred stock - - 814 3,017 3,671 3,617
Add: Effect of dilutive series D convertible preferred stock - 471 4,017 6,242 8,271 8,215
Add: Effect of dilutive 5.50% exchangeable senior debentures 1,958 6,650 6,486 6,328 6,218 4,345
Weighted average common stock and units outstanding -- diluted 138,364 137,771 131,467 119,404 109,159 98,963
December 31, 2014 December 31, 2013 December 31, 2012 December 11, 2011 December 31, 2010 December 31, 2009
FFO available to common stockholders and unitholders -- diluted 696,691$ 652,626$ 583,486$ 484,959$ 370,291$ 289,915$
Termination fees and other non-core revenues (2)
(5,668) (402) (9,034) (2,953) (4,446) 463
Gain on insurance settlement - (5,597) - - - -
Gain on sale of investment (14,551) - - - -
Significant transaction expenses 1,303 4,605 11,120 5,654 6,381 720
Loss from early extinguishment of debt 780 1,813 303 1,088 3,529 -
Costs on redemption of preferred stock - - - - 6,951 -
Significant property tax adjustments, net (3)
- - - - (1,835) (1,882)
Straight-line rent expense adjustment attributable to prior periods - 7,489 - - -
Change in fair value of contingent consideration (4)
(8,093) (1,762) (1,051) - - -
Equity in earnings adjustment for non-core items 843 - - - -
Severance accrual and equity acceleration (5)
12,690 - - - -
Other non-core expense adjustments (6)
2,692 63 1,260 174 (48) -
CFFO available to common stockholders and unitholders -- diluted 686,687$ 658,835$ 586,084$ 488,922$ 380,823$ 289,216$
Diluted CFFO per share and unit 4.96$ 4.78$ 4.46$ 4.09$ 3.49$ 2.92$
(2) Includes one-time fees, proceeds and certain other adjustments that are not core to our business.
(3) Includes reassessments, appeals or supplemental taxes.
(4) Relates to earn-out contingency in connection with Sentrum Portfolio acquisition.
(5) Relates to severance charges related to the departure of the company’s former Chief Executive Officer.
(6) Includes reversal of accruals and certain other adjustments that are not core to our business.
Year Ended
Year Ended
(unaudited)
Digital Realty Trust, Inc. and Subsidiaries
Reconciliation of Funds From Operations (FFO) to Core Funds From Operations (CFFO)
(in thousands, except per share and unit data)