dli training ontario region april 3, 2008 carleton university · pdf fileloaded onto a test...
TRANSCRIPT
DLI Training – Ontario Region April 3, 2008 Carleton University
An Introduction to

No statistics Do I want to
use Statistics? NO
Flowchart: ‘Do I want to use statistics?’

Lead institutions in <odesi> are Carleton and Guelph,
with in-kind assistance from Queen’s University.
First step was developing a Canadian ‘best practices’
document for cataloguing data files using DDI –
analogous to AACR2 for MARC.
Next, survey files were ‘marked up’ (catalogued) and
loaded onto a test server at Guelph.
The team at Scholars Portal is working with <odesi> to
establish a data server and load data files.
4
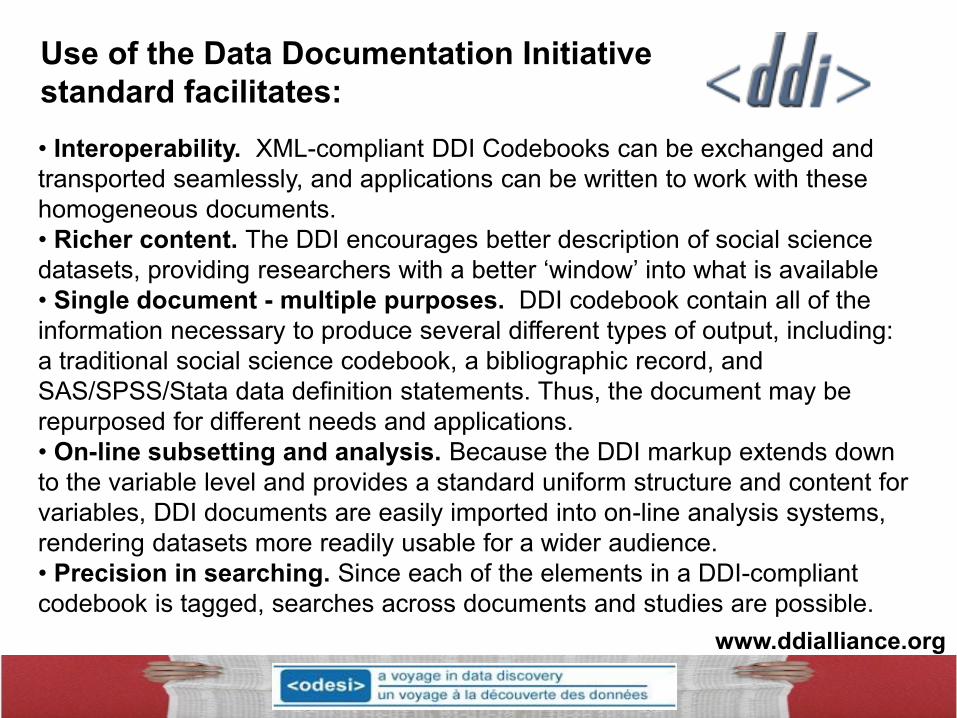
Use of the Data Documentation Initiative
standard facilitates:
• Interoperability. XML-compliant DDI Codebooks can be exchanged and
transported seamlessly, and applications can be written to work with these
homogeneous documents.
• Richer content. The DDI encourages better description of social science
datasets, providing researchers with a better ‘window’ into what is available
• Single document - multiple purposes. DDI codebook contain all of the
information necessary to produce several different types of output, including:
a traditional social science codebook, a bibliographic record, and
SAS/SPSS/Stata data definition statements. Thus, the document may be
repurposed for different needs and applications.
• On-line subsetting and analysis. Because the DDI markup extends down
to the variable level and provides a standard uniform structure and content for
variables, DDI documents are easily imported into on-line analysis systems,
rendering datasets more readily usable for a wider audience.
• Precision in searching. Since each of the elements in a DDI-compliant
codebook is tagged, searches across documents and studies are possible.
www.ddialliance.org

5
SOFTWARE CHOSEN NESSTAR Developed by the “Norwegian Social Science Data Services”
-- Networked Social Science Tools and Resources
• In use internationally (Europe, UK, US, Canada)
• In Ontario: Queens, Guelph, Carleton, Windsor, Ottawa,
U. of T. and Statistics Canada use Nesstar
• DDI compliant
• Search by keyword for surveys and survey questions
• Do basic data exploration and analysis on the web
• Download full datasets or subsets in popular formats
• Export tables and charts

http://www.esds.ac.uk/
http://www.nsd.uhttp://www.nsd.uib.no/cessda/home.html
http://zacat.gesis.org/webview/index.jsp
http://ess.nsd.uib.no/webview/index.jsp
ZA Online Study Catalogue

7
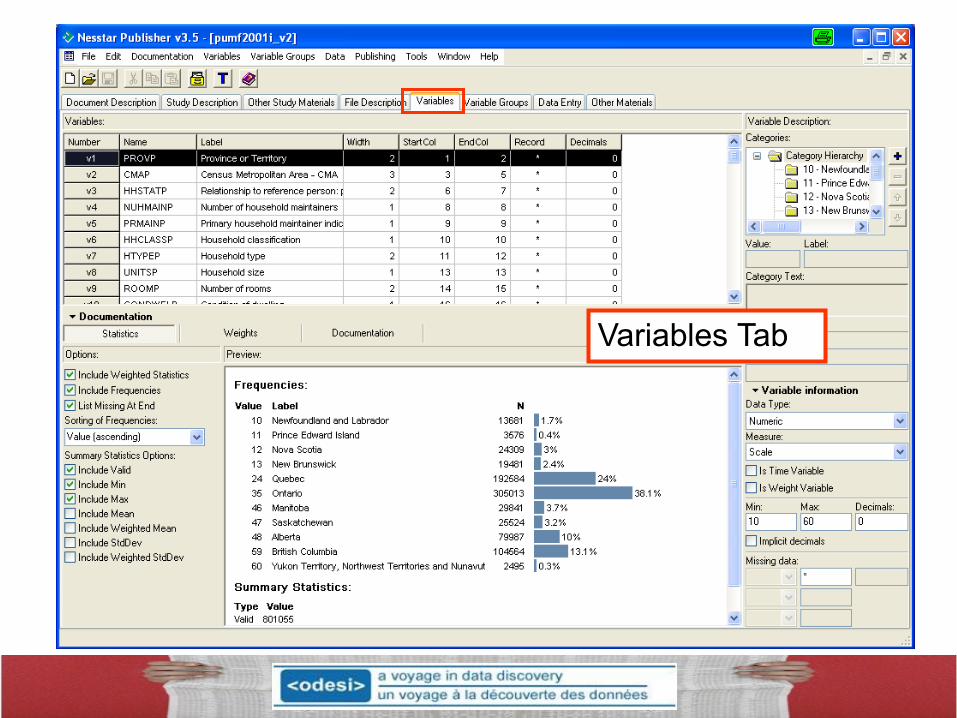
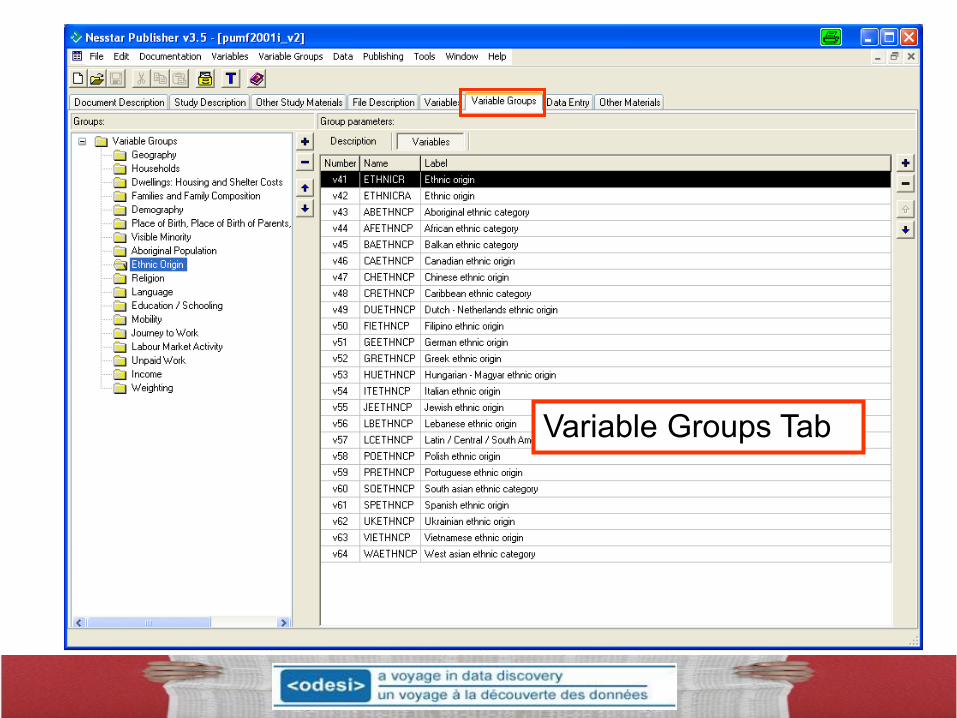
Nesstar Publisher produces DDI-compliant metadata using
a set of structured tags, grouped into ‘tabs’ in Publisher.

Document Description Tab

9
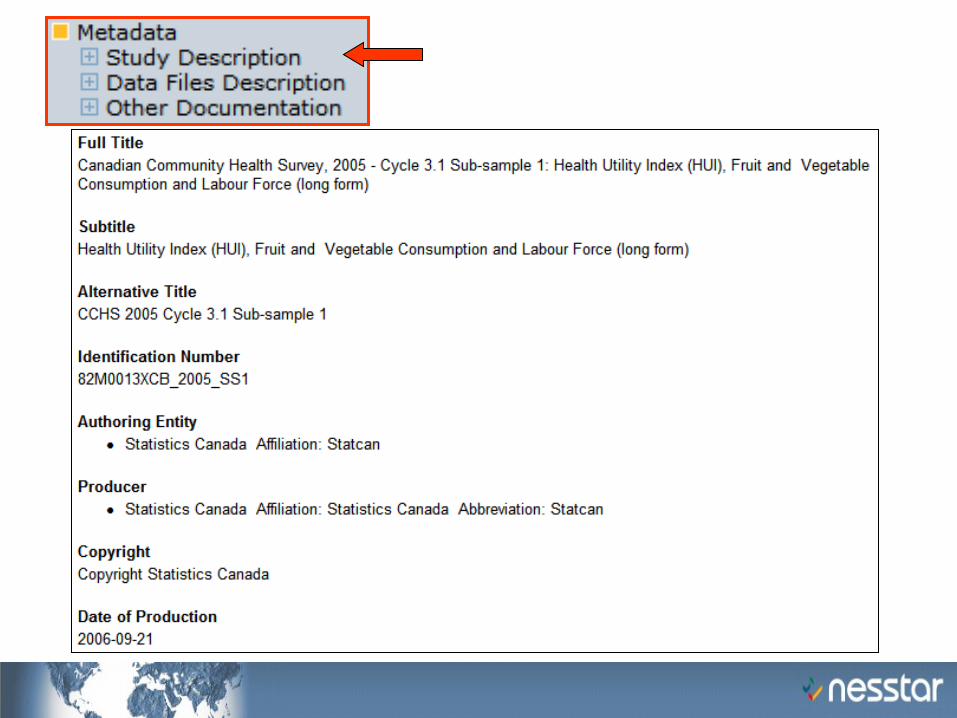
Study Description Tab

10
Other Study Materials Tab

11
File Description Tab
12
Variables Tab
13
Variable Groups Tab

14
Data Entry Tab

15
Other Materials Tab

16
The “<odesi> Best Practices
Document” is designed to guide
you through the ‘cataloguing’
process.
It is available on the <odesi>
WIKI at URL: odesi.ca

17
Once ready, a ‘marked up’
survey file is ‘published’ to the
Nesstar Server where it
becomes available through
Nesstar Webview.
It is at this point that most of you
will walk on stage…

Let’s take a look at how <odesi> can be used to answer a research question.
How do men and women differ in perceptions of their health (using weight as
an example).
Concepts? Health
Body Mass Index (BMI) Weight
Males/Females

Starting point: A simple search on the Statistics Canada web site…


22
23

24

25

26

27
Variable
‘groups’ Variables

28
Basic ‘frequencies’ or ‘marginals’ for categorical variables…
29
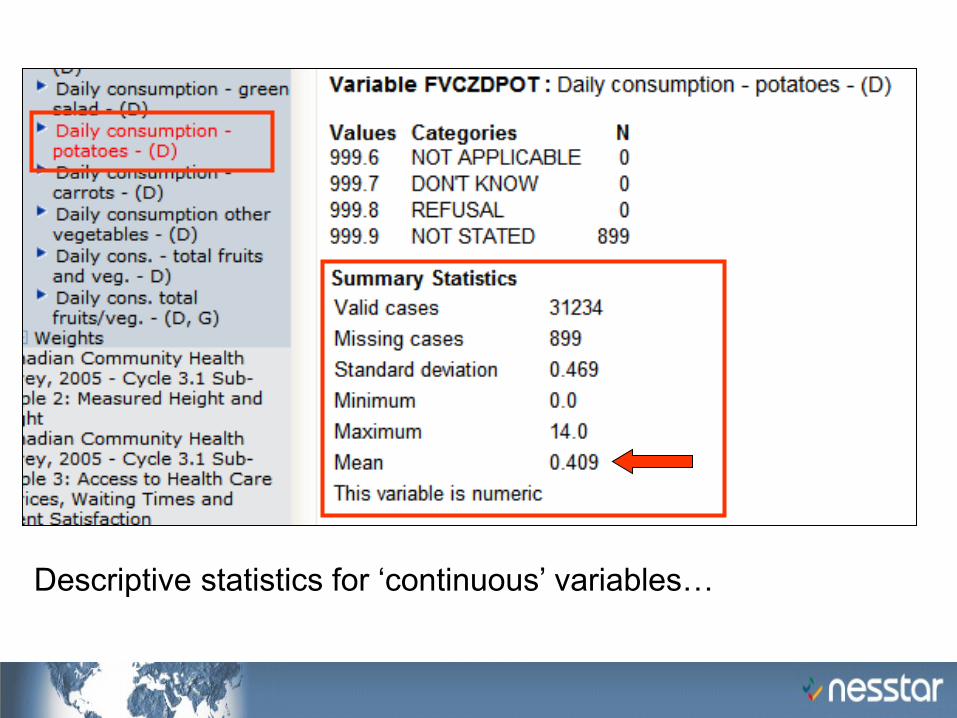
Descriptive statistics for ‘continuous’ variables…

30
But what if we want to look at
more than one variable at a time?
Say, for instance,
the issue of weight and
gender?
31

32
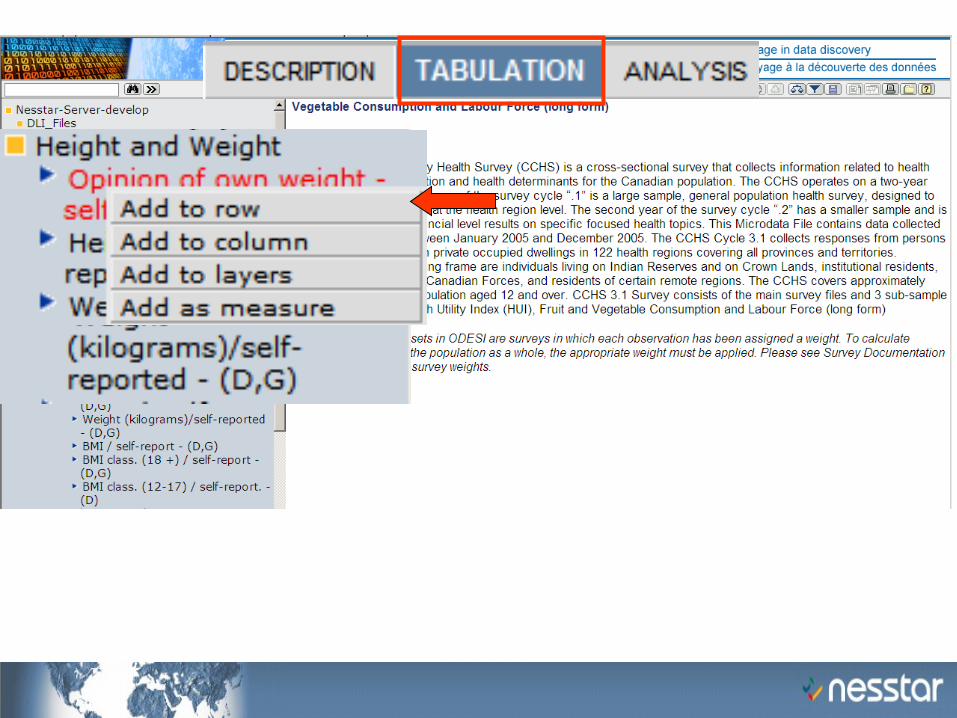
OK… now we want to add gender as a variable.

33
34
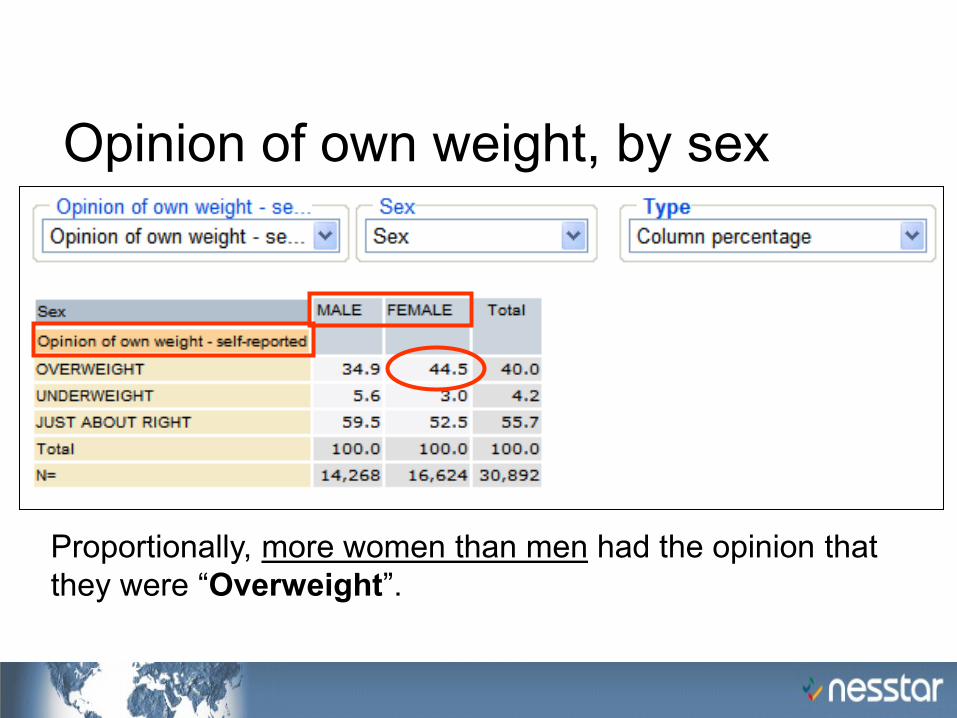
Opinion of own weight, by sex
Proportionally, more women than men had the opinion that
they were “Overweight”.
35
OK, but how does this change if
we add an ‘objective’ measure of
weight, such as ‘Body Mass Index’
(BMI)?
36
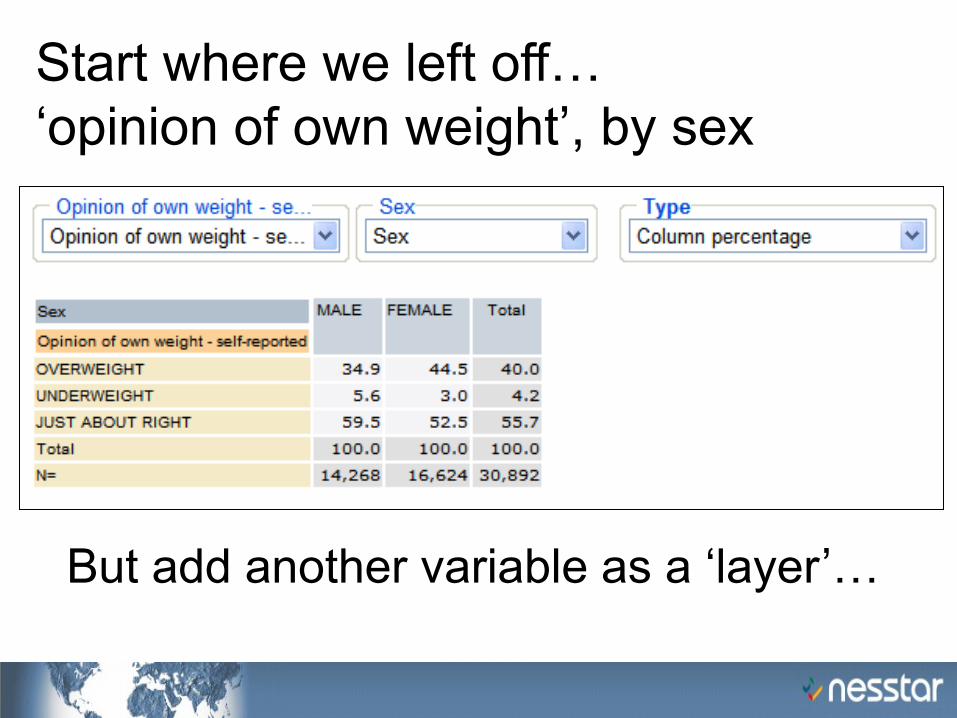
Start where we left off…
‘opinion of own weight’, by sex
But add another variable as a ‘layer’…
37
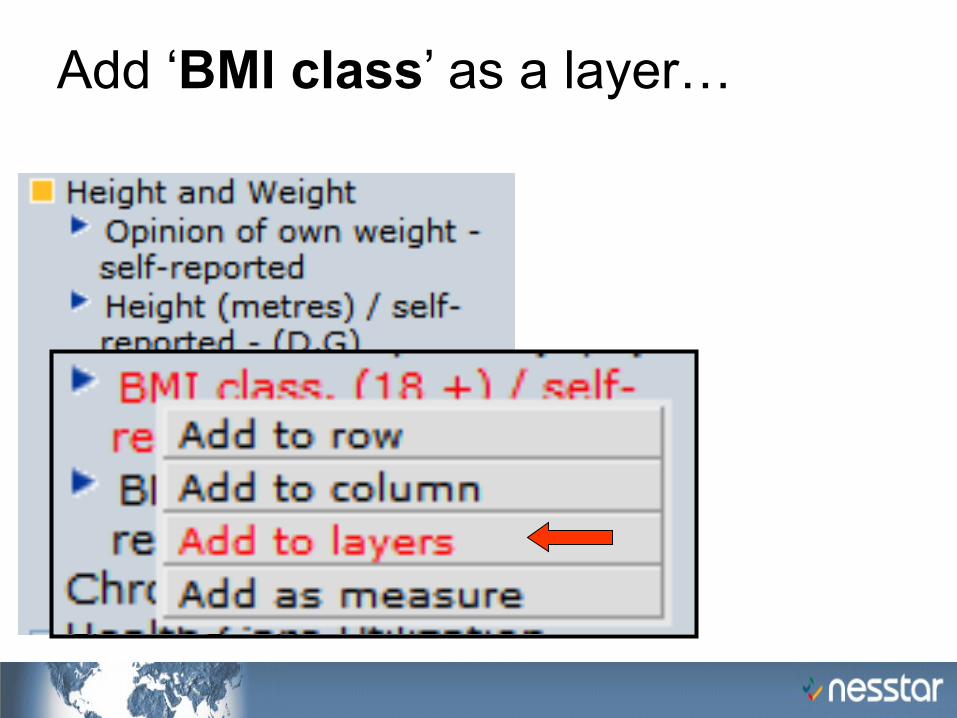
Add ‘BMI class’ as a layer…

38
Of respondents who were ‘objectively’ underweight,
proportionally more women than men had the ‘subjective’
opinion that they were “Just About Right”.
Layer = those with a
BMI indicating
‘underweight’
39
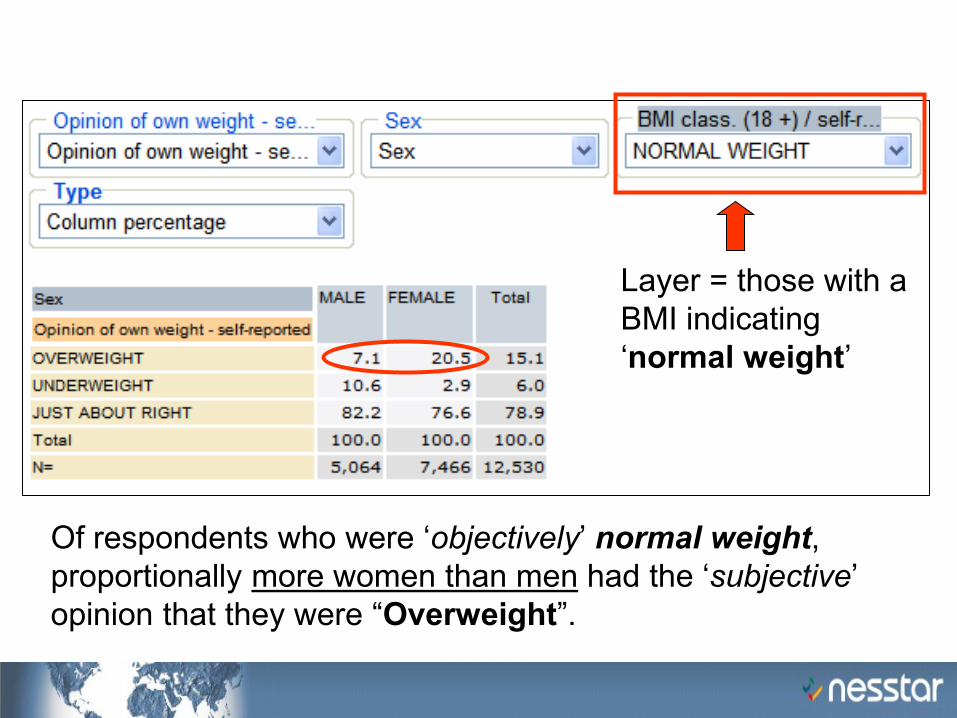
Of respondents who were ‘objectively’ normal weight,
proportionally more women than men had the ‘subjective’
opinion that they were “Overweight”.
Layer = those with a
BMI indicating
‘normal weight’
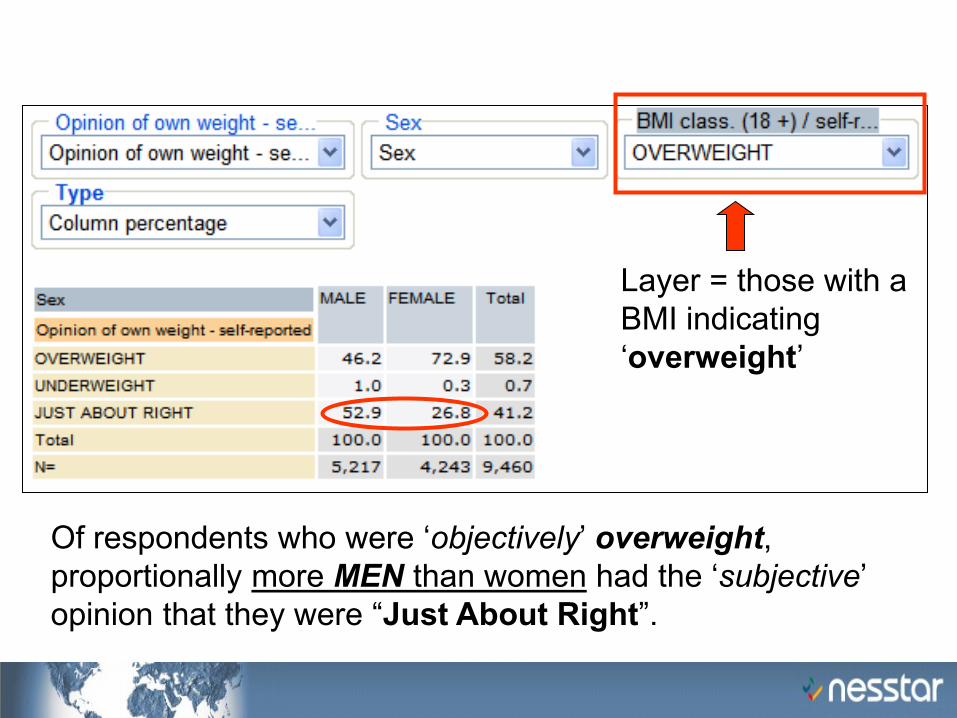
40
Layer = those with a
BMI indicating
‘overweight’
Of respondents who were ‘objectively’ overweight,
proportionally more MEN than women had the ‘subjective’
opinion that they were “Just About Right”.

OK, I have an
confession to make…

Statistical Weight…
All the previous slides ignored an important concept… that of
weight.
Not ‘weight in kilograms’ but rather ‘statistical weight’.
We don’t want to describe the sample… we want to describe
the population at large (in this case, Canadians 18+).
Statistical weights are assigned by statisticians, not
surprisingly, to each individual in a sample, based on a variety
of demographic and sampling considerations. These weights
reflect how many people a given respondent ‘represents’ in
the population being studied.
Sample count Population Estimate Statistical weight

Weight ‘off’: Note
the sample sizes
Weight ‘on’:
Note the
sample sizes
But also note the
differences in
percentages…

In general, you must apply the
Statistical Weight in order to get
valid results.
It is easy to turn weight ‘on’ in
Nesstar ( ), or other statistical
packages (e.g. SPSS, SAS, STATA).
BUT READ THE DOCUMENTATION

They say a picture is worth a
thousand words…
If this is true, then a good chart
has to be worth at least a couple of
hundred…
Let’s revisit our data visually using
the ‘bar chart’ feature of Nesstar.
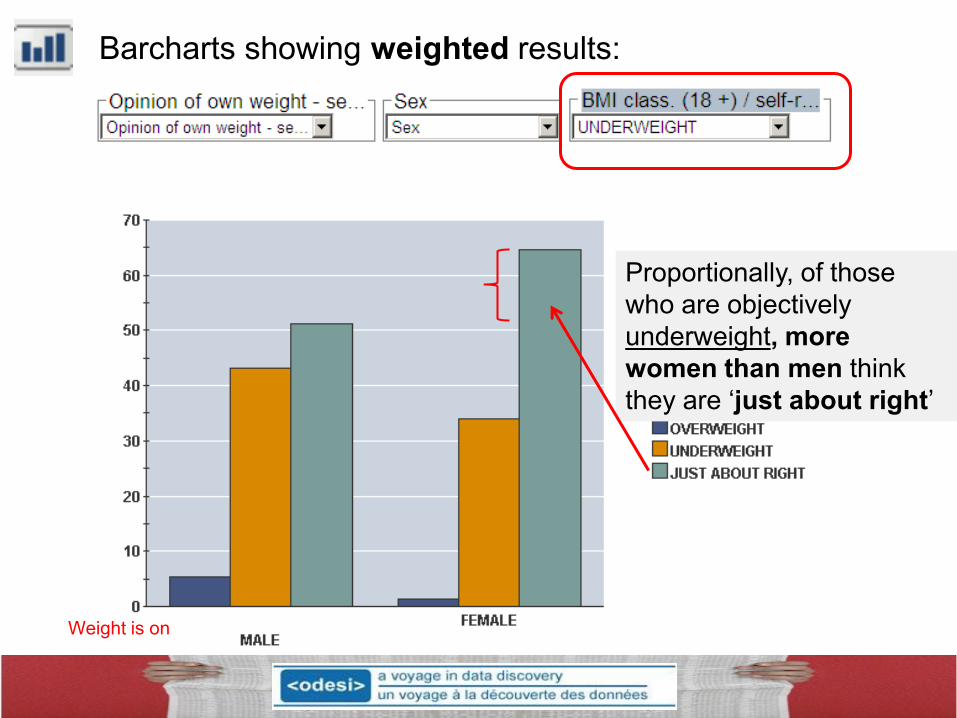
Weight is on
Barcharts showing weighted results:
Proportionally, of those
who are objectively
underweight, more
women than men think
they are ‘just about right’

Weight is on
Barcharts showing weighted results:
Proportionally, of those
who are objectively
normal weight, more
women than men
think they are
overweight
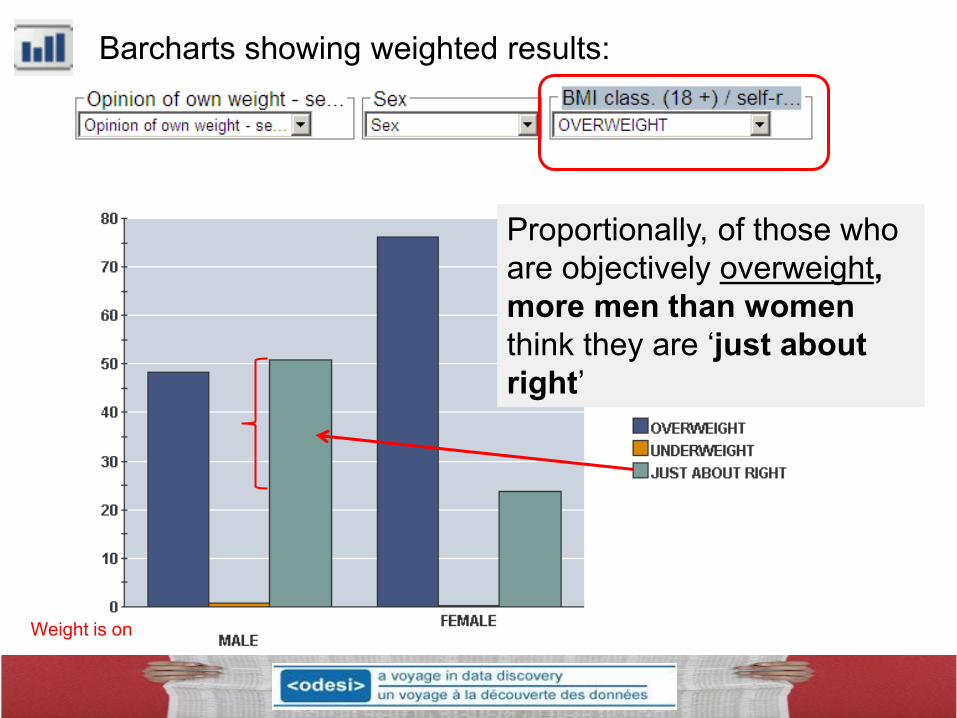
Weight is on
Barcharts showing weighted results:
Proportionally, of those who
are objectively overweight,
more men than women
think they are ‘just about
right’

Searching for ‘questions’ in Nesstar:
Simple Search
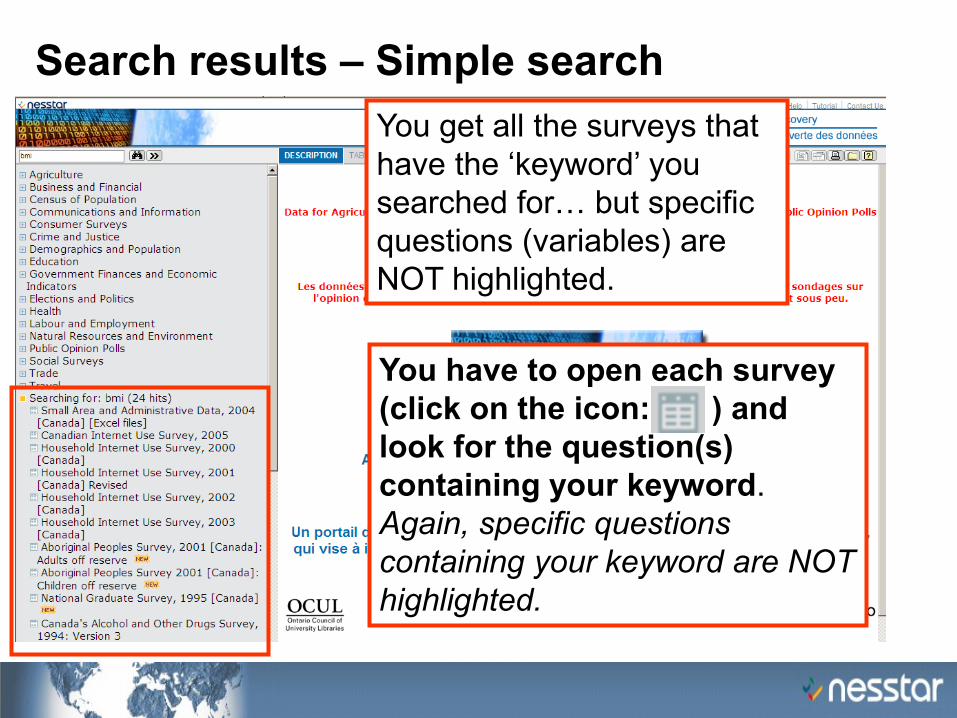
Search results – Simple search
You get all the surveys that
have the ‘keyword’ you
searched for… but specific
questions (variables) are
NOT highlighted.
You have to open each survey
(click on the icon: ) and
look for the question(s)
containing your keyword.
Again, specific questions
containing your keyword are NOT
highlighted.
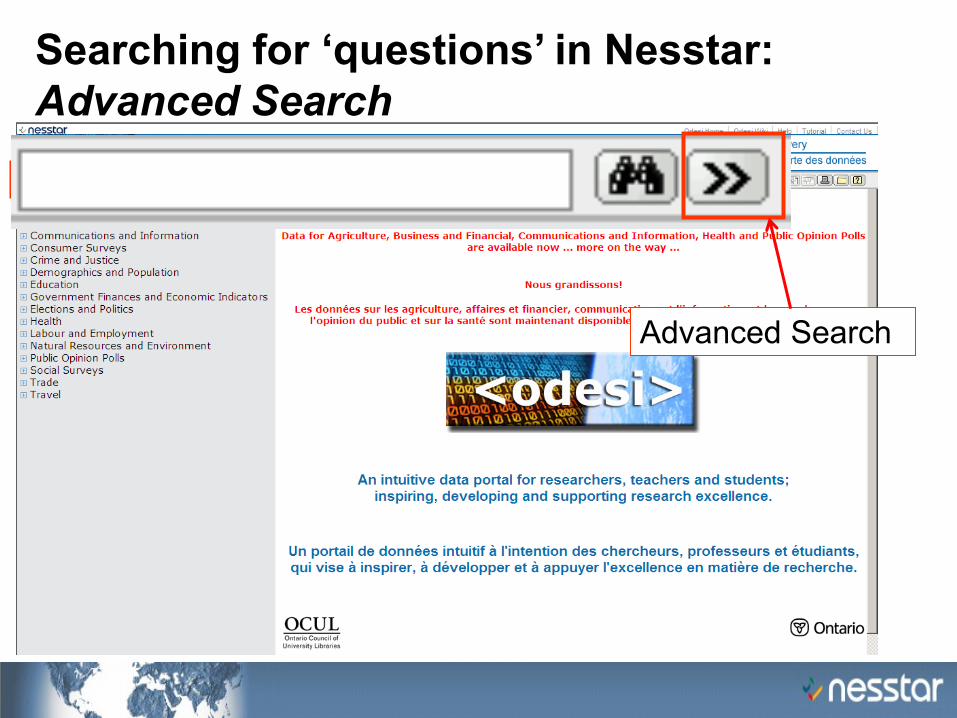
Searching for ‘questions’ in Nesstar:
Advanced Search
Advanced Search
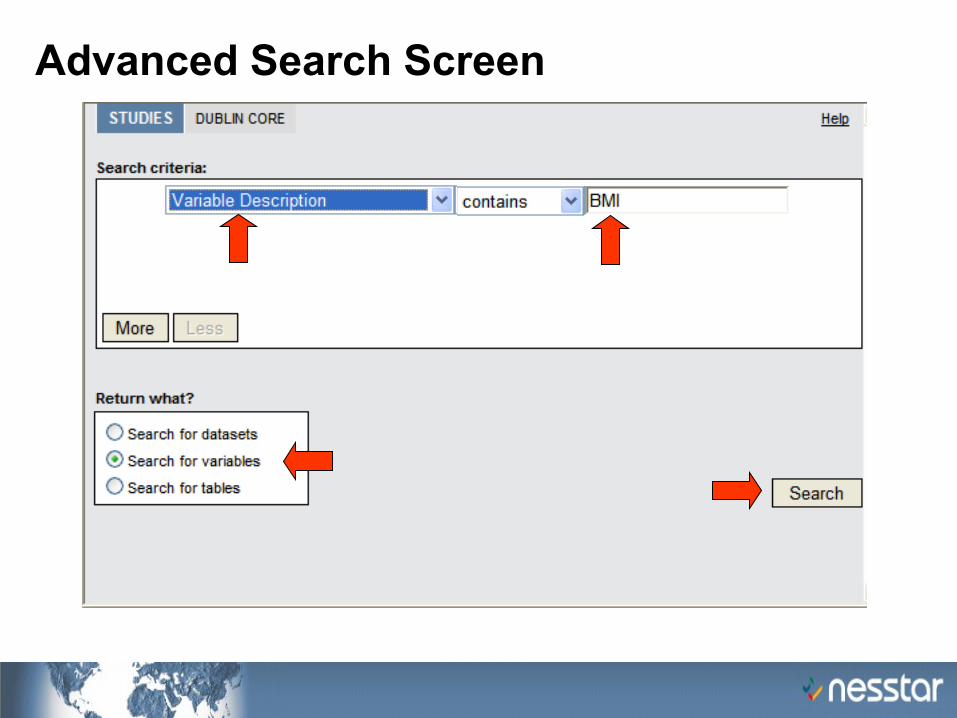
Advanced Search Screen
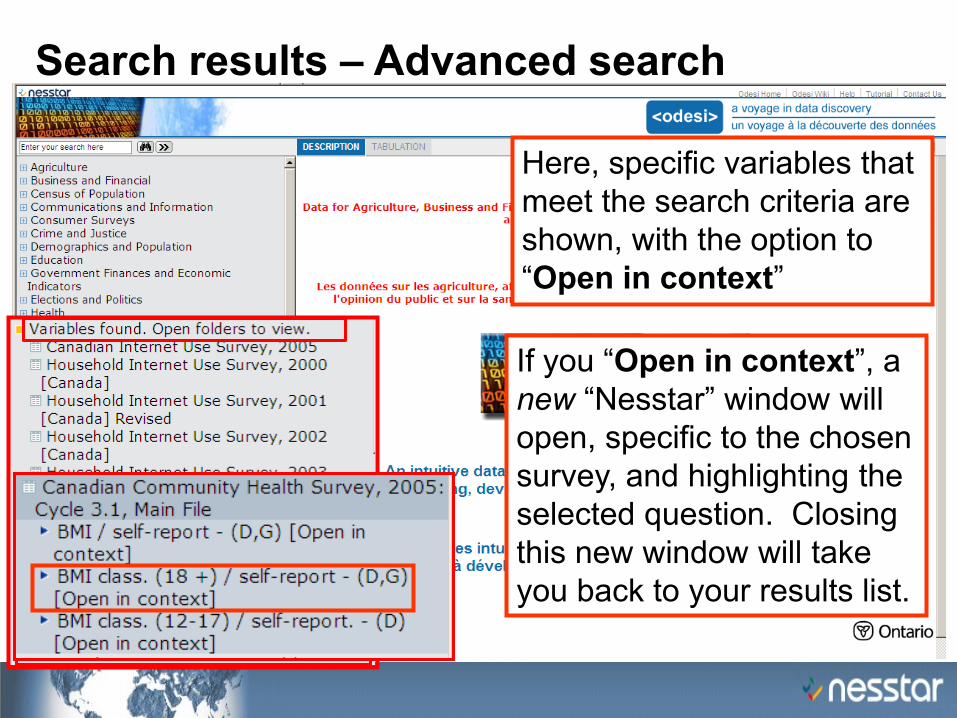
Search results – Advanced search
Here, specific variables that
meet the search criteria are
shown, with the option to
“Open in context”
If you “Open in context”, a
new “Nesstar” window will
open, specific to the chosen
survey, and highlighting the
selected question. Closing
this new window will take
you back to your results list.
54
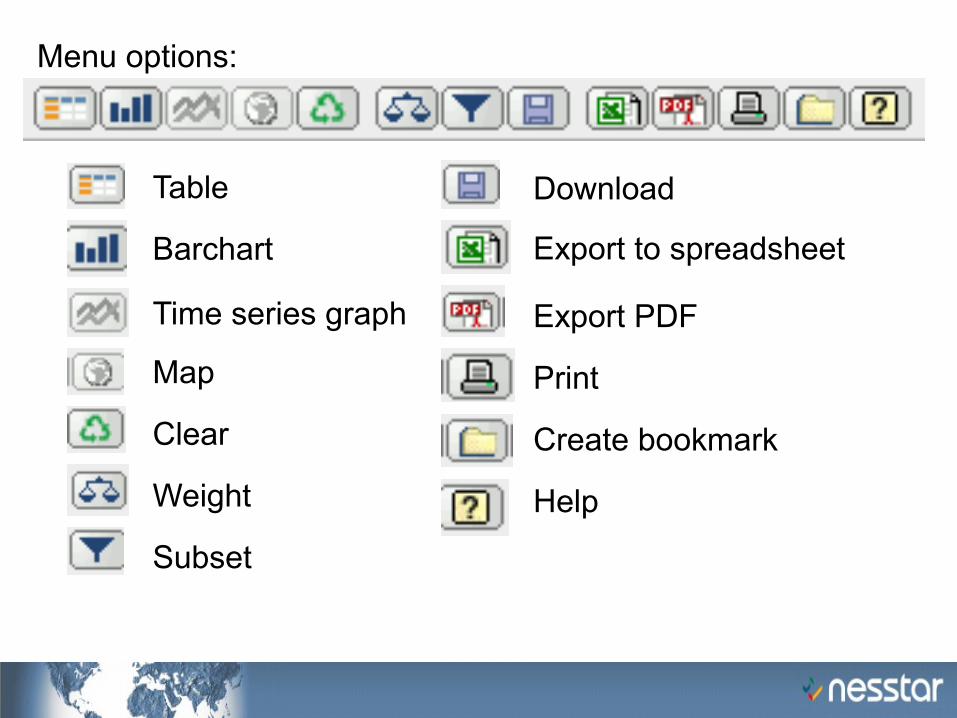
Barchart
Table
Time series graph
Map
Clear
Weight
Subset
Export to spreadsheet
Download
Export PDF
Create bookmark
Help
Menu options:

OK, so what kind of data can I expect
to find using ODESI?
1. Statistics Canada survey files released through the Data
Liberation Initiative (Census PUMF’s, Special Surveys,
General Social Surveys, and more)
2. Public Opinion Polls (e.g. Gallup, CRIC, Ipsos Reid)
3. Survey files from other sources (academics,
government)… coming soon.
These surveys and polls include questions on all manner of
topics (politics, health, work, leisure, education, drug use,
aging, spending, internet use, and many more)…

Let’s take a look at some Gallup
questions…
Dataset: Canadian Gallup Poll, August 1951, #212
In some cities in Canada, horsemeat is now
being sold, because of the high price of other
meats. If horsemeat were available here,
would you be willing to try it?
35.9% of respondents said “Yes” they’d be willing.
Of course, this questions begs for a yea or ‘neigh’ answer

Dataset: Canadian Gallup Poll, September 1956, #251
WOULD YOU FAVOR REQUIRING EVERY
ABLE-BODIED YOUNG MAN IN THIS
COUNTRY, WHEN HE REACHES THE AGE
OF 18, TO SPEND ONE YEAR IN MILITARY
TRAINING AND THEN JOIN THE RESERVES
OR MILITIA?
65.7% favoured this.

$41-50
UP TO $40
OVER $100
$71-80
$81-100
$61-70
$51-60
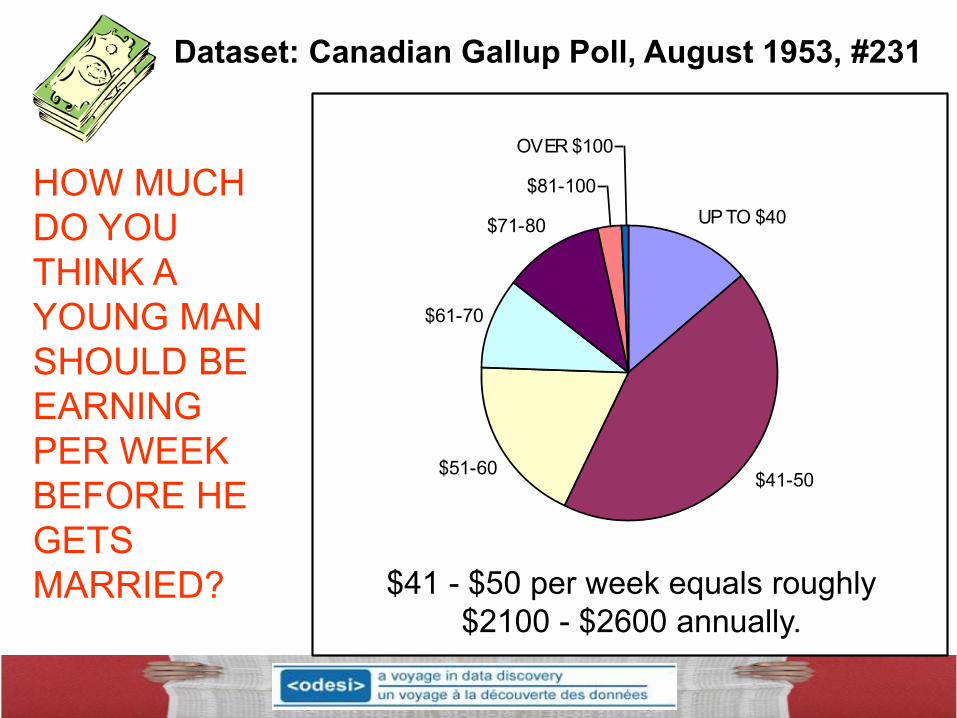
Dataset: Canadian Gallup Poll, August 1953, #231
HOW MUCH
DO YOU
THINK A
YOUNG MAN
SHOULD BE
EARNING
PER WEEK
BEFORE HE
GETS
MARRIED? $41 - $50 per week equals roughly
$2100 - $2600 annually.


Dataset: Canadian Gallup Poll, August 1953, #231
THERE'S AN
ATTEMPT BEING
MADE BY SOME
FASHION LEADERS
TO SHORTEN
WOMEN'S SKIRTS.
DO YOU THINK THAT
WOMEN
SHOULD FOLLOW
THIS LEAD - AND
WEAR SKIRTS
SHORTER THAN
THEY ARE NOW?
13% Shorter
82 % About the same
5 % Longer
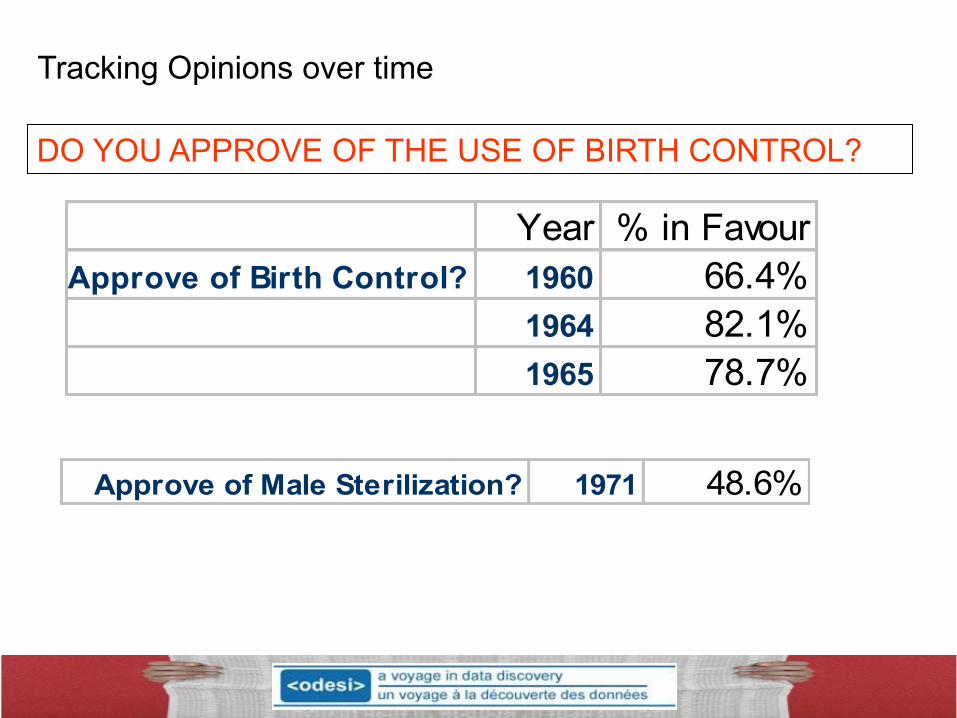
Year % in Favour
Approve of Birth Control? 1960 66.4%
1964 82.1%
1965 78.7%
Approve of Male Sterilization? 1971 48.6%
DO YOU APPROVE OF THE USE OF BIRTH CONTROL?
Tracking Opinions over time
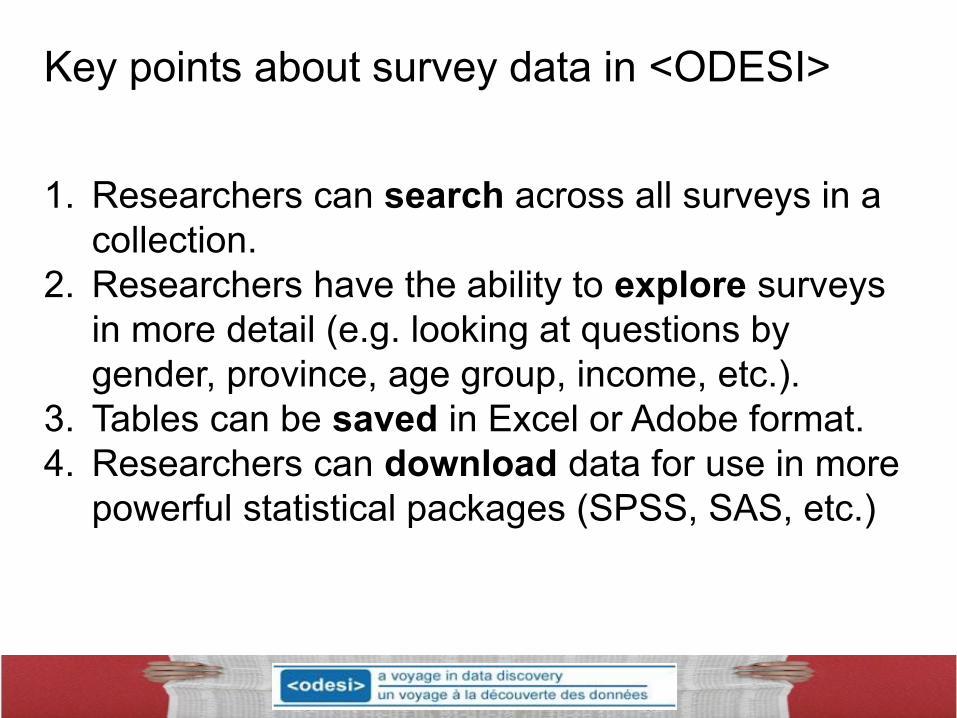
1. Researchers can search across all surveys in a
collection.
2. Researchers have the ability to explore surveys
in more detail (e.g. looking at questions by
gender, province, age group, income, etc.).
3. Tables can be saved in Excel or Adobe format.
4. Researchers can download data for use in more
powerful statistical packages (SPSS, SAS, etc.)
Key points about survey data in <ODESI>

In conclusion, <odesi> will:
1. Provide a more level ‘data’ playing field for Ontario
Universities.
2. Provide students and researchers with access to a
substantial and growing body of survey and polling
data, both current and historical.
3. Provide an easy, yet powerful, search and
exploration tool (Nesstar) that will serve both
beginners and ‘power users’.
4. Encourage cooperation and sharing of data and
metadata in Ontario.
5. Serve as a potential model for other jurisdictions.
<odesi.ca>

Description: The Health Status Index or Health Utility INDEX (HUI) is
a generic health status index that is able
to synthesize both quantitative and qualitative aspects of health. The
index, developed at McMaster University’s
Centre for Health Economics and Policy Analysis, is based on the
Comprehensive Health Status Measurement
System (CHSMS). It provides a description of an individual’s overall
functional health, based on eight attributes:
vision, hearing, speech, mobility (ability to get around), dexterity (use of
hands and fingers), cognition (memory
and thinking), emotion (feelings), and pain and discomfort.
http://www.statcan.ca/english/sdds/document/3226_D5_T9_V3_E.pdf
HUI ranges from zero to one, with zero being ‘death’ and one being
‘perfect health’. Statistics Canada has yet to explain those folks who
have negative scores… ‘die hard, with a vengeance’…