dlhe longitudinal survey 2006/07 technical report
TRANSCRIPT

DLHE Longitudinal Survey 2006/07 – Technical Report
Prepared for The Higher Education Statistics Agency By IFF Research
Contact details
Jan Shury, David Vivian and Catherine Riley IFF Research Ltd Chart House 16 Chart Street London N1 6DD Tel +44(0)20 7250 3035 Fax +44(0)20 7490 2490

Contents
Sector Name HESA
Contents
1 Introduction 5
2 Summary 6
Survey coverage 7 Drawing the starting sample (sample „A‟) 7 Contacting HEIs 9 Pilot exercise 9 The online survey 9 The telephone survey (sample „A‟ only) 11 The postal survey (sample „A‟ only) 12 Data coding 14 Building the data files 14
3 Accessing Contact Details 15
Participation of HEIs 15 Volume and “type” of contact details provided 15 Sample „A‟ 15 Sample „B‟ 17
4 Survey Response and Non-response 19
Overall response – sample „A‟ 19 Online Survey – sample „A‟ 23 Quality of e-mail contact details 23 Online response rate and differences by demographics 24 Telephone Survey – sample „A‟ 25 Quality of telephone contact details 25 Telephone response rate and differences by demographics 26 Sample outcomes 27 Postal Survey – sample „A‟ 28 Postal response rate and differences by demographics 28 Sample „B‟ 29 Quality of e-mail contact details 29 Online response rate and differences by demographics 29
5 Changes to the questionnaire 33
Portfolio Careers 33 Multiple jobs 33 Employability questions 33 Other changes 34
6 Weighting / combining the samples 36
Logistic Regression Model for Weighting „Sample A‟ and „Sample B‟ 36 HEI weights 37
7 Appendices 39
Appendix A – Postal Questionnaire 39 Appendix B – E-mail Invitation and reminders 55

Contents
Sector Name HESA
Appendix C – Text invitation and reminder 58 Appendix D – Postal invitation, reminder and data protection form 59 Appendix E – Data Editing and Cleaning Protocol 64 Cleaning postal data 64 Detailed quality checks, editing and cleaning carried out against final files 64 Appendix F – Confidence Intervals for Key Survey Sub-Groups 65 Appendix G(1) – Response Rates by Key Demographics – Sample „A‟ 69 Appendix G(2) – Response Rates by Key Demographics – Sample „B‟ 72 Appendix H(1) – Quality of e-mail addresses and online response rates by key demographics (Sample
„A‟) 75 Appendix H(2) – Quality of e-mail addresses by key demographics (File B) 82 Appendix I – Quality of telephone number and telephone response rates by key demographics 85 Appendix J – Postal response rates by key demographics 93
8 List of Figures
Figure 2.1: Summary of survey process and outcomes ....................................................................... 6 Figure 4.1: Survey response rates by subject of study .......................................................................21 Figure 4.2: Overall completes and response rates by HEI (File A).....................................................22 Figure 4.3: Overall completes and response rates by HEI (File B).....................................................32
9 List of Tables
Table 2.1: DLHE Longitudinal 2006/07 Survey sampling frame (A sample) ....................................... 8 Table 3.1: Number of HEIs providing contact details of different types for sampled (A) graduates in
different proportions ..........................................................................................................16 Table 3.2: Number of HEIs providing contact details of different types for unsampled (B) graduates in
different proportions ..........................................................................................................18 Table 4.1: Number of HEIs for which different levels of response rate achieved ..............................22 Table 4.2: Detailed sample outcomes of telephone stage .................................................................27 Table 4.3: Number of HEIs for which different levels of response rate achieved (File B) .................31

Learning and Skills HESA 5
1 Introduction
1.1 The Destinations of Leavers from Higher Education (DLHE) survey is a survey of graduates from
Higher Education. It investigates the early career patterns of HE graduates.
1.2 The survey is conducted in two parts. The first stage, or early survey, asks all leavers what they are
doing six months after they qualified from their HE course. It is carried out by HEIs, which try to contact
all recent leavers six months after leaving, and the data collected by HEIs is returned to HESA. These
data are used to prepare statistics about the destinations of qualifiers by HEIs.
1.3 The second stage, or longitudinal survey, to which this technical report relates, is a follow-up survey
that looks at the destinations of leavers up to three and a half years after they qualify.
1.4 This is the third time the longitudinal survey has been undertaken. The first full-scale longitudinal
survey was of alumni who left in 2002/03 and took place in winter 2006/07 and the second DLHE
longitudinal survey took place two years later and was of graduates who left HE in 2004/05. This third
survey interviewed those who had graduated from an HEI in 2006/07. All three surveys have adopted
a sequential mixed methodology approach incorporating online, postal and telephone fieldwork
elements.
1.5 As well as drawing a sample of those completing the early survey and attempting to contact these
leavers via e-mail, post or telephone, all graduates not in the drawn sample but for whom an email
address was available were also invited to take part in the online element, therefore resulting in a
much larger cohort for little additional cost. This report refers to the drawn graduates henceforth as
„sample „A‟‟ and the remaining (non-drawn) graduates as „sample „B‟‟.
1.6 The aims of this technical report are to describe the various elements of the survey methodology and
to provide a full understanding and transparency of the mechanics involved at each stage. The report
covers a number of different aspects:
A summary of the sampling and fieldwork process (chapter 2)
A review of the outcomes of the process of obtaining graduate details from HEIs (chapter 3)
An analysis of survey response and non response (chapter 4)
A summary of the changes to the questionnaire (chapter 5)
A description of the weighting / sample combination process (chapter 6)

Technical Report
Learning and Skills HESA 6
2 Summary
2.1 A total of 49,063 graduates took part in the 2006/07 DLHE Longitudinal survey. The survey sampled
just under 71,000 2006-07 graduates from 164 HEIs, achieving a total of over 29,000 interviews and
an overall response rate of 41% (44% based on all graduates for whom contact details were secured).
These individuals form sample „A‟.
2.2 Of the remaining 260,000 graduates not in the drawn sample, e-mail addresses were obtained for
approximately 154,000 2006/07 leavers. Of these, over 19,000 graduates completed an online survey
(a response rate of 13%). These individuals form sample „B‟. The graphic below illustrates the core
approach taken to the survey, and the level of response at each phase.
Figure 2.1: Summary of survey process and outcomes
2.3 Some form of contact detail was provided for 67,210 sample „A‟ graduates, or 95% of the initial starting
sample. This was consistent with the previous DLHE Longitudinal for which contact details were
available for 94% of the starting sample.
2.4 In line with the previous DLHE longitudinal survey, the proportion of email addresses supplied
increased once again. An email address was supplied for 59% of all sample „A‟ graduates for this
3
•164 HEIs supplied contact details for total of 67,210 records
•59% have email
•92% have postal address
•82% have a telephone number
•5% have no contact details at all
70,958 records drawn
by HESA
•164 HEIs supplied email addresses for 153,631records
•59% have email
261,152 records
not drawn for ‘A’
sample
Online survey
41,875 graduates emailed
Postal survey
37,545 graduates mailed
Telephone survey
54,074 graduates called
Online survey153,631 graduates emailed
All 3
32
,11
0 Early Su
rvey respo
nd
ents
5,423 13%
3,661 10%
20,254 37%
19,725 13%
‘A’
‘B’
Number of responses
Response rate
+
+
=29,338 44%Overall ‘A’ responses and response rate

Technical Report
Learning and Skills HESA 7
survey, compared to just over a third (36%) supplied for the 2004/05 DLHE Longitudinal survey. This
indicates that HEIs are continuing to gradually build up more complete alumni databases over time,
however the question mark still persists over how up to date these databases actually are.
2.5 The same proportion of email addresses (59%) was supplied for graduates in the „B‟ sample, also up
from 36% since the 05/06 DLHE Longitudinal Survey.
Survey coverage
2.6 The survey captures a snapshot of the activities that people who graduated during the 2006/07
academic year were engaged in on 29th November 2010.
2.7 Where students‟ main activity was either employment or study, training or research, a detailed
description was obtained of:
Employment Education
When first obtained the particular job When first started the course of study,
training or research
Employer‟s name, and location of
employment Name and type of HEI
Job role / title and industry working in Qualification aim and subject
Terms and conditions of contract / salary Nature of study (full vs. part-time, by
research or teaching, length of course)
Size of employing organisation Funding source
Role of qualification(s) in gaining
employment Motivations for undertaking further study
Motivations for taking the job
How first found out about position
2.8 In addition, the interview gained details of other qualifications that these graduates had obtained since
2006/07, and explored how they now feel about the course from which they graduated in the academic
year 2006/07 and whether or not they considered it good value for money.
2.9 The 2006/07 DLHE Longitudinal survey remained largely unchanged from the previous survey but for
the exception of the removal of the careers grid which was replaced with a few questions summarising
the number of jobs, incidence of and length of time unemployed, periods of study and highest
qualification attained (if any) since graduating in 2006/07. The theme of portfolio careers was also
introduced to the 2006/07 DLHE Longitudinal survey as well as some questions on the extent to which
the higher education experience had prepared graduates for (self) employment.
2.10 These along with other additions are discussed further in Chapter 5.
2.11 A copy of the postal questionnaire used is included in Appendix A to this report.
Drawing the starting sample (sample „A‟)
2.12 A random sample of leavers was drawn from the DLHE 2006/07 respondents using the proportions
detailed below.

Technical Report
Learning and Skills HESA 8
Table 2.1: DLHE Longitudinal 2006/07 Survey sampling frame (A sample)
Type of leaver DLHE Sample size Actual proportion sampled (Sample ‘A’)
Ethnic Group
Black 12043 41.7%
Asian 25152 23.3%
Mixed 6100 75.2%
Other Ethnic Group 2702 100.0%
Research Students
Doctorate and Masters
Research 7352 100.0%
Sampling for HEIs in
England
HNC leavers 1870 100.0%
HND leavers 3574 60.7%
Foundation leavers 8011 32.6%
Sandwich – Industrial
placement 12936 51.0%
Sandwich – Year abroad 447 51.7%
FE-ITT Bursary 782 100.0%
Leavers in receipt of DSA 10212 35.3%
Unemployed in DLHE
06/07 13014 42.4%
Self-employed in DLHE
06/07 7937 42.3%
TDA 22710 5.0%
Other* 153862 5.0%
Sampling HEIs in Wales
HEIs in Wales 18398 26.5%
Wales domiciled 15560 40.2%
Sampling for HEIs in
Scotland
HEIs in Scotland 31504 26.7%
Scotland domiciled 27834 25.7%
Sampling for HEIs in
Northern Ireland
HEIs in NI 8626 61.0%
NI domiciled 10905 60.7%
Total 332110 21.4%
*= not ethnic minority; not domiciled from Wales, Scotland nor NI, not sandwich students who
did an industrial placement nor year aboard; no disability student allowance; not a TDA student;
not self employed nor unemployed, not FE ITT; not PhD nor Masters Research; not HND, HNC
nor foundation leaver.

Technical Report
Learning and Skills HESA 9
Contacting HEIs
2.13 HEIs were contacted by the IFF Research Project Team by e-mail and then through a series of follow-
up telephone conversations, which were pursued until a database of graduate contacts was
successfully received at IFF‟s offices and/or the HEI declared its intention not to participate. The initial
e-mail included reassurances as to the Data Protection implications of providing contact details, a
template database indicating how the contact details would ideally be provided / formatted and a
telephone number and reply e-mail address for the Project Team at IFF. All HEIs were given the name
of a dedicated “handler” at IFF, who was their first point of contact.
2.14 All 164 HEIs participated in the project providing contact details for a total of 67,210 Sample „A‟
graduates (41,875 with e-mail addresses, 65,085 with postal addresses and 57,853 with telephone
numbers) and e-mail addresses for 153,631 sample „B‟ graduates.
Pilot exercise
2.15 A small scale telephone pilot exercise was undertaken to test changes to the questionnaire structure
and format that have been made since the 2004/05 survey, in particular the new portfolio career
questions, as well as a couple of questions about how well the higher education experiences had
helped progress career aspirations. The sample for the pilot was purposively sampled and included
only those who had graduated from a Higher Education course in the last five years.
2.16 As the main change to the questionnaire for this year was the inclusion of questions and question
codes relating to multiple employment and portfolio careers, the pilot exercise deliberately sought
respondents with non-typical career trajectories. In total 12 interviews were completed; of these six
respondents held multiple jobs at that time and one was pursuing a portfolio career. These interviews
were conducted by members of the project team on the telephone to allow for the inclusion of a
cognitive element which asked respondents about their interpretation of the new questions.
The online survey
2.17 Following some minor revisions around the wording of these new questions, all sample „A‟ graduates
for whom we held a (valid) e-mail address were sent an invitation to participate in the online survey on
29th November 2010. The invitations included a link to the dedicated survey web-site, and were
individualised.
2.18 The survey website comprised several pages explaining the background to the project, information on
HESA and IFF Research and a page on data protection information which contained links to HESA‟s
data protection policy and their registration on the Information Commissioner‟s website.
2.19 After a week, a reminder e-mail was sent out to all of those who had not already responded to the first
invitation. After another few days, a second reminder was sent. A final reminder was sent towards the
end of the fieldwork period on 10th March 2011. Copies of the e-mail invitations form Appendix C of the
report.
2.20 A total of 41,875 „A‟ invitations were sent to sample „A‟ graduates for whom IFF held at least one email
address. A total of 5,423 graduates responded to the survey online giving a response rate of 13%.

Technical Report
Learning and Skills HESA 10
A total of 153,631 invitations were sent out to sample „B‟ graduates a week after sample „A‟ initial invites.
Again, these graduates were sent 3 reminders with a total of 19,725 completing the survey also yielding a
response rate of 13%.
2.21 One of the key questions coming out of the previous survey, and indeed one of the major changes
impacting on both online and telephone research over the last few years, is the impact of mobile
phones on responses rates – and in particular the impact of internet-enabled mobiles. Reflecting this,
the survey sought to explore whether invitations to participate sent by text message could encourage
and improve response.
2.22 Text messages were sent to three groups of graduates. The initial mobile invitation text was sent to a
group of 300 graduates for whom a mobile address was held but no an email address. These were
sent out on 30th November 2010, a day after the launch of the online fieldwork. Only 3 graduates went
on to complete the online survey.
2.23 A further two groups of 300 graduates for whom both an email address and mobile telephone number
were held were sent a reminder text on 10th December 2010 – two weeks after the launch of the
online survey (by which time the effect of the initial email invite and reminder would have been
negligible). One group received an alert just containing text reminding them to take part and the
second received a text reminder which contained an individualised link straight to the online survey.
2.24 Of those sent the reminder text with no individualised link, just one completed the survey online and of
those sent the reminder text which did contain an individualised link five went on to complete.
2.25 Each text group were matched in size and in terms of gender, ethnicity, course type, HEI location and age group and representative of the mobile population as a whole. IFF also made sure that the online survey was user friendly on mobile devices.
Recommendations for future DLHE Longitudinal Surveys – Email sample
In the context of heightened sensitivity to data security and the information people
are willing to share online, requesting that HEIs send out the initial email invitations
asking their own graduates to take part in the survey may have the effect of bringing
up the overall online response rate.
Whilst we have taken steps to reassure graduates about the provenance of the email
by incorporating the HEI name into the “sender name” (where HEIs have given their
permission for us to do so) graduates would be more likely still to open and respond
to an email that has been sent directly from their former HEI.
The potential gains this approach could bring should however be weighed up against
several issues, those being that there will be an increased burden on HEIs that in
some cases already struggle to provide sample information in a timely fashion; that
we would no longer be able to track deliverability of the emails sent (assuming that
HEIs do not have access to this sort of software); and that we would have to rely on
HEIs to adhere to the timetable.
Technical Report
Learning and Skills HESA 11
2.26 More information on the content of the text message can be found in Appendix C.
The telephone survey (sample „A‟ only)
2.27 The third DLHE Longitudinal survey differed significantly from previous surveys in terms of the
sequence of data collection methodologies. Whereas in the previous surveys a postal phase followed
on from the online survey, with a telephone phase “mopping up”, the 06/07 DLHE Longitudinal survey
switched the order of the postal and telephone elements.
2.28 The rationale behind switching these elements was driven in the main by declining postal response
rates across the industry and the subsequent increased expense associated with multiple mailings
compared to the cost of telephone interviews. The environmental impact of these mailings and higher
quality responses rendered from online and telephone were also considered.
2.29 Any sampled graduate who had not responded online or by post by w/c 13th December 2010 and for
whom we had a telephone number was then contacted by telephone. Calls were generally made over
the weekend or on weekday evenings between 5 and 9pm1.
2.30 Contact by telephone was attempted for a total of 54,074 graduates, with 20,254 agreeing to
participate in the survey and completing the telephone questionnaire (37% response rate).
1 To account for graduates living abroad calls were made at all hours.
Recommendations for future DLHE Longitudinal Surveys – Mobile telephone
sample
Despite the relatively poor levels of response to the text message exercise, given the
relatively high proportion of graduates for whom we were provided a mobile number
and the anticipated increase in mobile numbers supplied by HEIs in future waves it is
worth considering introducing a permanent stage to the survey methodology during
which graduates with a mobile telephone number (and haven‟t already completed
the survey online) are invited to take part in the survey via text message.
Should character limitations allow, incorporating the name of the HEI from where the
respondent graduated into the mobile invitation / reminder text may have the effect of
yielding higher response rates from the mobile sample.
The potential impact this additional survey stage could have on response rate should
however be balanced against its drawback being a more invasive method of contact
and the unknown the impact that receiving a text may have on graduates‟ perception
of the survey and in their likelihood of taking part. An additional methodological
stage would also result in increased costs.

Technical Report
Learning and Skills HESA 12
2.31 12,682 records proved to be unusable (i.e. telephone numbers were unobtainable or the named
graduate was not known at the number and forwarding contact details were not available). This
represents 23% of the total amount of available sample at the start of fieldwork. Excluding these
records would produce an effective telephone sample population of 41,392 and therefore a response
rate of 50%.
2.32 3,298 graduates refused to take part in the survey (6% of all telephone sample, 8% excluding
unusable sample). Further information on the detailed outcomes of the rest of the telephone sample
can be found in Table 4.2.
The postal survey (sample „A‟ only)
2.33 The postal survey launched in two phases. The first mailing targeted those graduates for whom we
held only a postal address and neither a telephone number nor an email address. This acted as a pilot
during which various postal reminders were tested. The initial invitation was sent out w/c 6th
December 2010 to 4,244 graduates.
2.34 The initial mailing comprised invitation letter, data protection notice, a paper questionnaire and a reply-
paid envelope. The mailing also included instructions and a password for responding to the survey
online. Copies of the letter and of the Data Protection statement make up Appendix D.
2.35 The reminder mailings were sent out to those who had not responded to the initial mailing by w/c 3rd
January 2011 and were split into three different types;
A full pack reminder – this included another copy of the questionnaire, another reply-paid envelope a
reminder letter and data protection notice;
A reminder letter and data protection notice only – this asked people to use the questionnaire and
reply-paid envelope they had already been sent; it also re-iterated their Survey ID number;
A reminder postcard – this also asked people to use the questionnaire and reply-paid envelope they
had already been sent, but did not include their Survey ID number for security reasons.
2.36 Each reminder group were matched in size and in terms of gender, ethnicity, course type, HEI location and age group.
2.37 Both the full pack reminder and the reminder letter produced comparable response rates (5% and
5.2% respectively) with the reminder postcard yielding a lower response rate of 3.2%. Given the
financial and environmental gains of reducing the full reminder pack, it was agreed that the second
phase of the postal survey would proceed with just the reminder letter.
2.38 The second phase of the postal survey took place w/c 7th February 2011 during which any graduate
for whom a postal address was held as well as an email address and / or telephone number, but had
not already responded online or on the telephone were sent out a full initial mailing.
2.39 HEI-specific logos were used on postal materials sent out to a sub-sample of graduates from four
universities to gauge the effectiveness of familiar branding in relation to response rate. Invitation and
reminder letters were adapted to include the appropriate HEI logo in addition to the HESA and IFF
logos.
2.40 Samples were composed of all graduates at an HEI who had not already taken part by telephone or
online at the time of the test. 50% of the postal sample at each HEI received the HEI branded letter,
and 50% formed a control group, receiving the normal letter. Postal samples within each of the four

Technical Report
Learning and Skills HESA 13
HEIs were split to be evenly matched between test and control groups, on gender, age, ethnicity and
degree type.
2.41 Graduates who received a branded letter were slightly more likely to respond by post, though this was
not statistically significant. Online and telephone response rates were not influenced by the type of
postal communication sent.
2.42 A reminder letter and data protection form was mailed out a month later to those who did not respond
to the initial mailing. Across both phases a total of 37,545 questionnaires were sent out in the original
mailing, with a further 33,542 reminders sent out. A total of 3,661 graduates responded – a response
rate of 10%.
Recommendations for future DLHE Longitudinal Surveys – Postal sample
In light of the relative success of the reminder letter in sustaining postal response rates
and the associated financial and environmental gains, it is worth considering revising the
composition of the initial postal invitations sent. Instead of sending out a full invitation
pack comprising an invitation letter, data protection notice, a paper questionnaire and a
reply-paid envelope it may well be that a single invitation letter with the graduate‟s key
number and instructions on how to complete the survey online would yield a comparable
response rate to that achieved by sending out paper questionnaires, whilst significantly
reducing costs.
Transferring respondents away from postal self completion to a structured and routed
online survey would also have the advantage of producing better quality data.
Given the slightly higher propensity of graduates who received a postal pack branded
with their HEI‟s insignia to respond to the survey, consideration will also be given to the
extension of branding postal invitations to graduates of all HEIs (although this will need
to be considered in the context of increased administrative costs).

Technical Report
Learning and Skills HESA 14
Data coding
2.43 Subsequent to fieldwork (i.e. the receipt of online or postal responses, or the conduct of a telephone
interview) verbatim responses were coded to official classifications (in the case of industry, occupation
and/or education data) and/or to code frames developed by IFF to classify responses to some of the
more open survey questions (e.g. activities engaged in on 29th November).
2.44 The approach to coding Standard Industrial Classification (SIC) and Standard Occupational
Classification (SOC) descriptions was modified from the previous wave of the survey, reflecting the
importance of these responses to the principal survey questions and the challenges of coding these
sorts of data, particularly when collected through a self-completion approach. The modified approach
involved the use of a “triangulation” method whereby employer name, description of employer‟s
business activity and job title and role were looked at alongside one another. This allowed for a more
complete picture when coding SIC and SOC2.
2.45 Records were also grouped together in peer groups (e.g. research students) as a way of maximising
the data available.
Building the data files
2.46 In advance of building the final data file IFF and HESA agreed to a test delivery of raw data w/c 31st
January 2011. This enabled HESA to test the data upload process and the checking procedures that
would be carried out on the final dataset. Part of this process involved the production of a technical
specification which detailed the following;
Field names, types and widths
Valid field values and labels
Information on the data validation process
2.47 The final phase of producing a data file was to quality control / logic check the combined data file,
making amends to correct for one-off and systematic errors in responses.
2.48 A more detailed description of the process of building the data files is included in Appendix E.
2 As an example by using the triangulation approach, a respondent providing a job title of “Head of prime brokerage
funding. Running teams responsible for moving the bank's funds”, but failing to provide either an employer name or SIC
description could now be assigned a banking SIC code as opposed to leaving the SIC code being left blank.

Technical Report
Learning and Skills HESA 15
3 Accessing Contact Details
3.1 In this chapter we review the outcomes of the process of obtaining sample (graduate contact details)
from HEIs.
Participation of HEIs
3.2 A total of 164 HEIs were approached to participate in the survey, all of which provided contact details
for graduates in Sample „A‟. 163 of these HEIs were also required to provide email addresses for
Sample „B‟ graduates: all bar 1 managed to do so as they did not hold any email addresses for their
alumni.
3.3 A total of eight HEIs felt it necessary to conduct an opt-out exercise amongst their graduates before
passing contact details to IFF, up from four in the 04/05 DLHE Longitudinal survey.
Volume and “type” of contact details provided
Sample „A‟
3.4 HEIs were asked to provide as many e-mail and postal addresses and telephone numbers as possible
- for the specified sample of 2006/07 graduates. In total, contact details were sought for a total of
70,958 sample „A‟ graduates.
3.5 Some form of contact detail was provided for 67,210 of these graduates, or 95% of the initial starting
sample. This was comparable to the 2004/05 Longitudinal Survey for which contact details were
available for 94% of the starting sample.

Technical Report
Learning and Skills HESA 16
3.6 Table 3.1 shows the number of providers supplying different proportions of (different types of) contact
details for sampled graduates.
Table 3.1: Number of HEIs providing contact details of different types for sampled (A)
graduates in different proportions
Proportion of contact details provided
File A HEIs
Any form of contact
Postal address Telephone
number E-mail address
100% 76 15 23 11
95 to 99% 44 72 42 8
90 to 94% 17 27 15 7
80 to 89% 21 35 43 23
70 to 79% 2 9 13 24
60 to 69% 3 3 11 21
50 to 59% 1 2 5 18
40 to 49% 0 0 2 14
30 to 39% 0 1 3 10
20 to 29% 0 0 2 15
10 to 19% 0 0 3 10
1 to 9% 0 0 1 2
0% 0 0 1 1
Proportion of all sample
95% 92% 82% 56%
Total number of contacts
67,210 65,085 57,853 41,875
Base: all HEIs (164)
3.7 All HEIs provided some form of contact detail for at least half the graduates in their sample. Indeed, 76
participating HEIs (just under half of the total of participating HEIs) provided some form of contact
detail for all of the graduates for whom contact details were sought and three quarters gave contact
details for 95% or more graduates.
3.8 Postal addresses remained the most common form of contact detail provided and were supplied for
92% of graduates in the starting sample (65,085 graduates in total).
3.9 Telephone numbers were also commonly provided, but were missing for one in five contacts returned
(18%). This is broadly consistent with the 04/05 DLHE Longitudinal survey for which a telephone
number was supplied for 21% of graduates.
3.10 Twenty-three HEIs provided telephone numbers for all contacts, although a further 100 provided
telephone contacts from between 80 and 99% of their (sampled) graduates. Twelve HEIs provided
telephone contact details for fewer than half of their graduates, and only one of these provided no
telephone contacts at all.

Technical Report
Learning and Skills HESA 17
3.11 Looking specifically at the breakdown of types of telephone numbers provided, a landline was supplied
for almost two-thirds (63%) of the sample (77% of sample with any telephone number) and a mobile
number was supplied for almost half (47%) of the total sample (57% of the sample with any telephone
number).
3.12 Whilst the proportions of graduates for whom postal addresses and telephone numbers were supplied
remained consistent with the 04/05 DLHE Longitudinal survey , the proportion of graduates for whom
e-mail addresses were provided increased by around two-thirds. Whereas e-mail addresses were
available for 36% of the total sample in the 04/05 DLHE Longitudinal survey, that number rose in this
to 59% for this survey, which confirms that HEIs are relying on email contact more and more to stay in
touch with their alumni.
3.13 E-mail addresses were nevertheless the least frequently supplied form of contact. Fifty HEIs provided
email addresses for less than half of their graduates, but only one could provide no e-mail addresses
at all, an improvement from the 04/05 DLHE Longitudinal survey where 5 HEIs (including 2 that did not
take part) provided no email addresses.
3.14 In summary, the sampling process was highly successful. For the first time all HEIs participated and
provided some form for at least half of their graduates. At an overall level some form of contact detail
was provided for 95% of those graduates in Sample „A‟.
3.15 Accordingly, the effective sample, at overall level and in terms of postal addresses, closely
represented the starting sample. The usable sample of contactable graduates closely mirrored the
initial survey sample in most respects. That is, there were no particular demographic sub-groups for
whom we were markedly less able to gather contact details, and there was no marked skew in the
usable sample3. Most sub-groups of graduates were represented in similar proportions in the effective
sample.
Sample „B‟
3.16 In addition to supplying as many forms of contact detail as possible for the selected sample „A‟, HEIs
were also asked to provide email addresses for the rest of the cohort who had completed the Early
DLHE Survey, i.e. sample „B‟. As the total Early DLHE population comprised 332,110 graduates and
70,958 were in sample „A‟, this meant asking for contact details for a further 261,152 graduates.
3 Although the purposive sample design means that the sample was not wholly representative of the Class of 2006/07.

Technical Report
Learning and Skills HESA 18
3.17 Table 3.2 shows the number of providers supplying different proportions of e-mail addresses for details
for sample „B‟ graduates.
Table 3.2: Number of HEIs providing contact details of different types for unsampled (B)
graduates in different proportions
Proportion of contact details provided Number of HEIs
100% 8
95 to 99% 14
90 to 94% 9
80 to 89% 21
70 to 79% 24
60 to 69% 19
50 to 59% 17
40 to 49% 13
30 to 39% 7
20 to 29% 19
10 to 19% 8
1 to 9% 3
0% 2
Proportion of all sample 59%
Total number of contacts 153,631
Base: all HEIs (164)
3.18 As one might expect, the proportion of sample „B‟ graduates for which e-mail addresses were available
was the same as for sample „A‟ graduates, at 59%, meaning a further 153,631 email addresses were
provided. Slightly fewer HEIs were able to provide email addresses for all their graduates (8 compared
to 11 for the „A‟ sample).
3.19 In combining samples „A‟ and „B‟, total contact details were acquired for 220,841 graduates,
representing 66% of the total Early DLHE population (up from 49% for the 04/05 DLHE Longitudinal
survey).

Technical Report
Learning and Skills HESA 19
4 Survey Response and Non-response
4.1 This chapter discusses the response rate to the survey, i.e. the number of graduates that completed
the survey expressed as a proportion of those that were eligible to take part. It looks at which particular
groups of graduates (in terms of their demographic and qualification information) were more or less
likely to respond to the survey, first at an overall level, before discussing the response patterns relating
to each of the data collection methods in turn.
4.2 A total of 49,063 graduates completed the 2006/07 DLHE Longitudinal Survey. The sections below
provide a more detailed breakdown of response by sample type beginning with sample „A‟. Response
rates among the „B‟ sample are considered from paragraph 4.59 onwards
Overall response – sample „A‟
4.3 Among the „A‟ sample, 29,338 questionnaires were completed, representing a response rate of 41%
against the starting sample. Looking just among those graduates for whom contact details were
provided (the „contactable sample‟) a response rate of 44% was achieved.
4.4 This is higher than that achieved in the 2004/05 DHLE Longitudinal Survey (where response rates of
37% and 39% respectively were achieved).
4.5 At an overall level (before adjusting for design effects), findings from sample „A‟ can be reported with a
statistical error of ±0.6% (at the 95% confidence level, for findings of 50%) – a very high degree of
statistical confidence. That is, if the survey reports that 50% of all 2006/07 graduates share a
characteristic or experience, the “real” value is 95% likely to lie between 49.4% and 50.6%.
4.6 The extent of statistical confidence for various sub-groups of the sample naturally drops below these
overall levels. The table in Appendix F shows the confidence intervals with which findings can be
reported for some of the key survey sub-groups. In each case, the figure given (±XX%) indicates the
statistical error associated with findings of 50% for the sub-group in question, at the 95% confidence
interval. Thus we can be 95% confident that a finding of 50% associated with graduates in Subjects
Allied to Medicine means that the true response / finding lies between 48.3% and 51.7% (i.e. the SE is
±1.7%).
4.7 It should be noted that for findings which are considerably above or below 50%, the statistical error will
reduce. By contrast, where reported findings relate to questions not asked of all of the sub-group (e.g.
if one is looking at findings among all black graduates who were engaged in study, training or research
on 29th
November 2010) then the statistical error will increase – and sometimes considerably.
4.8 There was some variation in response rates among different sub-groups of graduates (see tables in
Appendix G). Response rates given below and in the Appendix tables refer to the response rate
among the contactable sample (i.e. all those that were given an opportunity to respond), rather than
the response rate all those in the starting sample (i.e. those that were selected for inclusion in the
initial survey sample).
4.9 In line with both previous DLHE Longitudinal surveys, women were more likely to respond than men
(45% vs. 42% response). Additionally, nearly three in five (56%) of both the starting and the
contactable sample were female.
4.10 Older graduates were particularly likely to respond to the survey; among those in the contactable
sample, 51% of those aged 41 to 50, and 60% of those aged 51 or more, completed a survey.
Technical Report
Learning and Skills HESA 20
4.11 White graduates were more likely to respond than non-white graduates and Black graduates remained
the least likely to respond; just over a third (36%) of black graduates for whom contact details were
provided responded.
4.12 Approaching half (47%) of those graduating from a higher research degree responded to the survey.
As found previously, the lowest response rates were found among those obtaining diplomas or
certificates (39%). However whereas those who had obtained a professional qualification were also
among those least likely to respond to the 04/05 DLHE Longitudinal survey they were in fact most
likely to respond to the 2006/07 DLHE Longitudinal survey (52%).
4.13 As observed in the 2004/05 DHLE Longitudinal Survey, response rates by subject of study tended to
vary somewhat with a difference of 19 percentage points between the highest and lowest response
rate. Figure 4.1 illustrates the range of response rates by subject of study for the 2006/07 survey.
4.14 There is little change in response rate between the two surveys. The highest response rate was
observed among graduates of education and multiple subjects and those graduating from Law being
least likely to respond.
4.15 However, graduates of mathematical and computer science subjects and creative arts and design are
now relatively more likely to respond compared to the previous DHLE Longitudinal Survey (previously
both 35% and now 45% and 43% and respectively).

Technical Report
Learning and Skills HESA 21
Figure 4.1: Survey response rates by subject of study
4.16 At an HEI level, the response rate varied considerably, from 86% to 14%, although responses from
graduates of most HEIs clustered between 40% and 57% (Table 4.1 / Figure 4.2). Thirty HEIs with at
least 50 graduates in their starting sample achieved a response rate of at least 50% (compared to just
four at the 04/05 DLHE Longitudinal survey).4
4 Response rates by HEI were generally quite similar in the DLHE Longitudinal Surveys conducted in 2006/07 and
2008/09, although there were examples of HEIs for which the response rate either increased or decreased significantly.
55%
50% 49% 49%47%
45% 45% 44% 44% 44% 44% 44% 44% 43% 42% 42% 41% 40% 40%
36%

Technical Report
Learning and Skills HESA 22
Table 4.1: Number of HEIs for which different levels of response rate achieved
Response rate achieved Number of HEIs
60%+ 9
50 to 59% 39
40 to 49% 79
30 to 39% 29
20 to 29% 5
10 to 19% 2
1 to 9% 0
0% 1
Base: all HEIs (164)
Figure 4.2: Overall completes and response rates by HEI (File A)
0
200
400
600
800
1000
1200
0%
10%
20%
30%
40%
50%
60%
70%
80%
90%
100%
Completes Response Rate (%)

Technical Report
Learning and Skills HESA 23
4.17 In terms of HEI location, graduates from HEIs in Wales and Northern Ireland (46% and 48%
respectively) were more likely to respond than graduates from HEIs in England and Scotland (both
43%).
Online Survey – sample „A‟
4.18 Email addresses were supplied for 41,875 sample „A‟ graduates. A staggered invitation to participate
in the online survey was sent out to all of these graduates throughout w/c 29th November 2010.
4.19 The invitations included a link to the dedicated survey web-site, and were individualised. After a week,
a reminder e-mail was sent out to all of those who had not already responded to the first invitation.
After another few days, a second reminder was sent. A final reminder was sent out on 10th March 2011
a few weeks before the survey was closed. Copies of the e-mail invitations form Appendix B of the
report.
4.20 From this total of 41,875 sample „A‟ graduates with email addresses, a total of 5,423 graduates
responded to the survey online, representing 13% of graduates we had an email address for. The
online response rate was down from the previous survey which achieved on online response rate of
19%. This decline in online response has been observed across the industry but can in part, be
attributed to the quality of email addresses supplied (including a relatively high level of .ac.uk
addresses supplied) as well as concerns about opening emails from unfamiliar senders.
Quality of e-mail contact details
4.21 Prior to being used, all email addresses went through a „cleaning‟ process to identify emails which
were not in the correct format (e.g. missing an „@‟ sign) or with common typos (e.g. „hotmail.con rather
than hotmail.com) and where possible these errors were corrected.
4.22 However, in total, 7,604 graduates for whom we held an email addresses were unreachable via this
method either because they were classified as undeliverable (e.g. because the address was not
known), or because they were „soft bounce backs‟ (where the email was successfully sent but a
message was later received from the recipient's mail server saying that it could not be delivered for
example because their inbox was full)5. This represents a fifth (18%) of all sample for which an email
address was held. For the remainder of this report „undeliverables‟ includes emails that bounced back
as well as those where the address was not known.
4.23 Further to these undeliverables there will also have been an unknown number of e-mails that will have
been successfully sent but that will have not been read by the intended recipient, for example because
the graduate no longer uses that e-mail account although it is still „live‟, because they did not check it
during the fieldwork period or because they may delete emails from unfamiliar senders (particularly in
the case of those accessing emails on smart phones).
4.24 Tables in Appendix H(1) provide more information on the quality of e-mail contact details supplied by
HEIs detailing the proportion of undelivered e-mails by a number of key demographics.
5 Where two email addresses were supplied for a graduate, then both had to be unreachable to be included in this
category.

Technical Report
Learning and Skills HESA 24
4.25 As seen in the 2004/05 survey, there was considerable variation in e-mail quality by HEI. Looking at
email quality by HEI location shows that over half (57%) of graduates from HEIs in Northern Ireland for
whom an email address was supplied proved unreachable and is due to the disproportionally high
level of .ac.uk addresses provided (96% for HEIs in Northern Ireland compared to 18% overall).
4.26 However, email quality in Wales improved since the last survey with the proportion of sample to whom
an email was undeliverable declined from 50% for the 04/05 DLHE Longitudinal Survey to 25% for the
06/07 survey.
4.27 Scotland continued to provide the best quality email addresses with just 12% of graduates with an
undeliverable email address.
4.28 There was relatively little variation in e-mail quality with respect to gender and ethnicity. A slightly
higher proportion of e-mails sent failed to reach female graduates (19% versus 17% of all e-mails
belonging to male graduates) while those belonging to Asian, mixed and „other ethnic minority‟
backgrounds were slightly more likely to be successfully delivered than those belonging to white or
black graduates.
4.29 As seen in the 2004/05 DHLE Longitudinal Survey, younger graduates typically had better quality
email addresses than older graduates although the difference between the groups has lessened (18%
of graduates 30 or under had an email address that it was not possible to deliver to compared with
20% of those over 40.
4.30 By course type, the highest proportions of undeliverable emails were observed among those who
studied / graduated from postgraduate diplomas or certificates (20%) or first degrees. (19%).
4.31 By subject those who studied multiple subjects (28%) and Education (25%) were more likely to have
poor quality email addresses.
Online response rate and differences by demographics
4.32 An online survey was completed by 5,423 graduates in total. This equates to a response rate of 13%
of those for whom e-mail addresses were provided and 16% of those for whom an email was
successfully delivered.
4.33 As a proportion of all sample supplied (irrespective of whether this came with any contact details, or of
the types of contact details provided) this represents a response rate of 8% (comparable to that
achieved in the 2004/05 Longitudinal Survey (7%)).
4.34 Further tables in Appendix G(1) show how the online response rate (expressed both as a proportion of
all sample, and as a proportion of sample with email addresses) varied by key demographics.
4.35 Looking among the sample of graduates that had an email address, key variations in online response
rate were:
As observed at the 04/05 DLHE Longitudinal survey, older graduates aged 51 or over were
more likely to respond online than their younger counterparts (18% compared with 13%). The
response rate among the youngest age groups (25 and under) again fell significantly to below
the overall level (11% compared to 13%) and continue to look to be the group behind the
decline in online response rates.
Conversely, despite being more likely to have an undeliverable email address, white graduates
were no less likely to complete an online survey (8%).

Technical Report
Learning and Skills HESA 25
Those who had completed PhDs or DPhils were particularly likely to respond online (29% of
those for whom we had an e-mail address did).
As observed at the 2004/05 DLHE Longitudinal survey, those who had studied Physical
Sciences (21%) and European languages (22%), as well as those who had studied Eastern,
Asiatic, African, American and Australasian Languages, Literature and related subjects (22%)
were particularly likely to respond online.
Overall, online response rate by subject was broadly in line with that reported at the 04/05
DLHE Longitudinal survey.
In terms of HEI location, graduates from universities in Scotland were particularly likely to
respond online (18%), followed by England (14%).
4.36 It should be noted that some of the graduates who completed an online survey did not actually have
an email address on the original sample, but completed an online survey after receiving a telephone
call or postal invite - this is true for 237 (or 4%) of the total online completes down. During the
telephone interview, graduates were told that if they preferred to complete the survey online they could
do so and were given appropriate details if this was of interest. Similarly, the covering letter to the
postal questionnaire explicitly stated that graduates could complete the survey online and provided the
web-site address and an online ID.
4.37 Calculating the response rate of all online completes as a total of sample with an email address
therefore produces a slightly inflated response figure (in terms of calculating response to the email
invite in isolation) given this impact of the telephone and postal elements of the survey on the online
response rate. Looking at the number of graduates who completed an online survey and who had an
email address as a proportion of all those with email addresses produces a response rate of 12% (still
broadly comparable with the response rate of sample „B‟).
4.38 However, it should also be noted that some of these will similarly be graduates who did not initially
reply to an email invite, but who were prompted to do so later in the fieldwork by a telephone call or
postal invite. In terms of estimating the „pure‟ response rate to just the online element of the survey, it
is best to explore response patterns among sample „B‟ who were not exposed to either the postal or
telephone approaches.
Telephone Survey – sample „A‟
4.39 Telephone interviewing commenced on 7th December 2010. Initially telephone number details for all
those who had supplied just a landline number and neither a mobile number nor an email address
were loaded into the CATI software.
4.40 Telephone interviews with all other graduates for whom a telephone number was held (landline and /
or mobile) and had not already completed or actively refused to take part in the online survey began
w/c 13th December 2010. This meant that the total contactable sample available for the telephone
stage of fieldwork was some 54,074 graduates.
Quality of telephone contact details
4.41 In total, some 12,682 records proved to be unusable (i.e. telephone numbers were unobtainable, or
the named graduate was not known at the number and forwarding contact details were not available).

Technical Report
Learning and Skills HESA 26
This represents approaching quarter the total amount of available sample at the start of fieldwork
(23%).
4.42 Tables in Appendix I provide more information on the quality of telephone contact details supplied by
detailing the proportion of unusable telephone numbers by the key sample demographics.
Telephone response rate and differences by demographics
4.43 The starting sample available for the telephone fieldwork phase comprised 54,074 graduates. Of
these, 20,254 completed the survey over the telephone. This represents a response rate of 37% for
this method an increase of 8 percentage points from the 04/05 DLHE Longitudinal Survey.
4.44 As a proportion of all sample supplied (irrespective of whether this came with an e-mail, postal
address or phone number) the telephone response rate is 30% - an increase of 10 percentage points
from the 04/05 DLHE Longitudinal survey.
4.45 Further tables in Appendix I show how levels of response varied by a number of key demographics
and are summarised below:
There are no differences by gender in terms of telephone response rates
Older graduates were again more likely to respond than their younger counterparts with
response rates particularly low amongst those aged between 26 and 40 (36%, compared with
48% among those over 40).
Whilst Asian graduates were among those least likely to respond to either the online or postal
survey, they were among the groups (along with White graduates) who were more likely to
complete a telephone interview. The response rate for White and Asian graduates were 39%
and 36%.
Those who had completed PhDs or DPhils had a lower than average telephone response rate
(35%) – a reversal of the pattern seen in the online and postal methods.
There were relatively few variations by course subject studied with law graduates remaining the
least likely to respond (32%).
There was much variation in response rate by HEI.
4.46 Perhaps a more useful response rate to focus on is one that is calculated excluding all records where
the number is unusable and/or the graduate was not known. This provides a better feel for the
proportion of all interviews that would be achieved if HEIs had been able to provide up to date and
more accurate records.
4.47 Excluding 12,682 records would produce an effective telephone sample population of 41,392 and
therefore a response rate of 49%.
Technical Report
Learning and Skills HESA 27
Sample outcomes
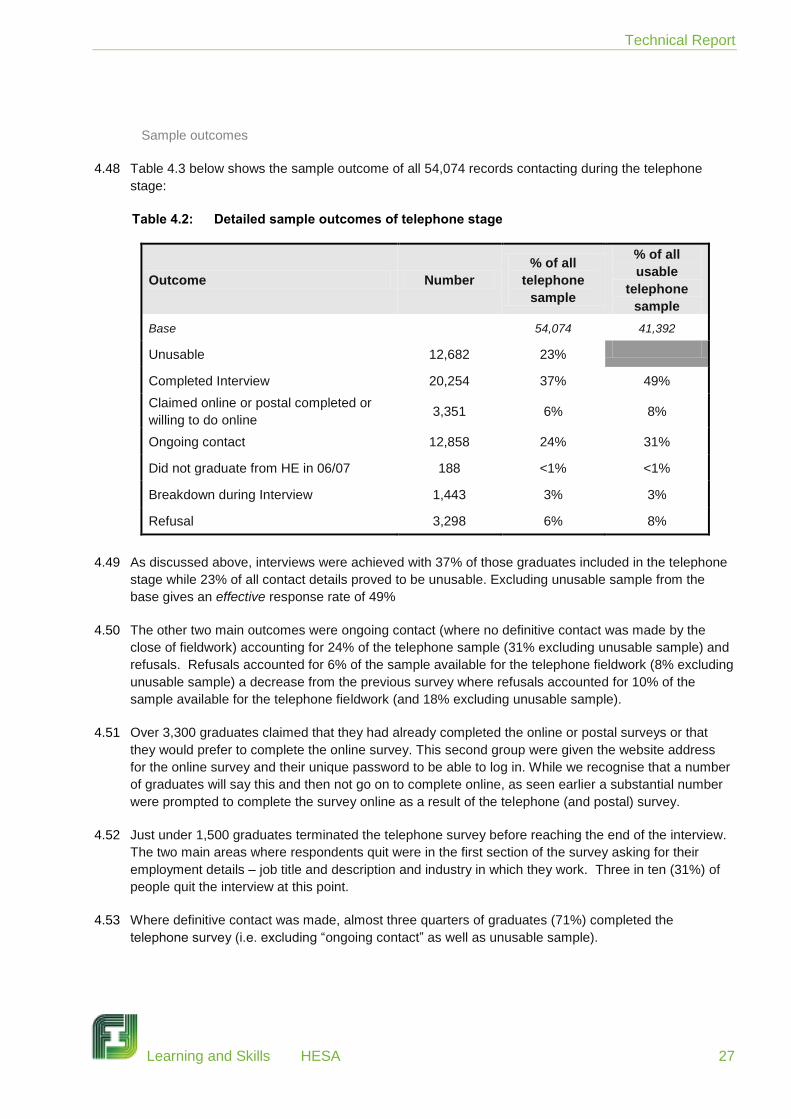
4.48 Table 4.3 below shows the sample outcome of all 54,074 records contacting during the telephone
stage:
Table 4.2: Detailed sample outcomes of telephone stage
Outcome Number
% of all
telephone
sample
% of all
usable
telephone
sample
Base 54,074 41,392
Unusable 12,682 23%
Completed Interview 20,254 37% 49%
Claimed online or postal completed or
willing to do online 3,351 6% 8%
Ongoing contact 12,858 24% 31%
Did not graduate from HE in 06/07 188 <1% <1%
Breakdown during Interview 1,443 3% 3%
Refusal 3,298 6% 8%
4.49 As discussed above, interviews were achieved with 37% of those graduates included in the telephone
stage while 23% of all contact details proved to be unusable. Excluding unusable sample from the
base gives an effective response rate of 49%
4.50 The other two main outcomes were ongoing contact (where no definitive contact was made by the
close of fieldwork) accounting for 24% of the telephone sample (31% excluding unusable sample) and
refusals. Refusals accounted for 6% of the sample available for the telephone fieldwork (8% excluding
unusable sample) a decrease from the previous survey where refusals accounted for 10% of the
sample available for the telephone fieldwork (and 18% excluding unusable sample).
4.51 Over 3,300 graduates claimed that they had already completed the online or postal surveys or that
they would prefer to complete the online survey. This second group were given the website address
for the online survey and their unique password to be able to log in. While we recognise that a number
of graduates will say this and then not go on to complete online, as seen earlier a substantial number
were prompted to complete the survey online as a result of the telephone (and postal) survey.
4.52 Just under 1,500 graduates terminated the telephone survey before reaching the end of the interview.
The two main areas where respondents quit were in the first section of the survey asking for their
employment details – job title and description and industry in which they work. Three in ten (31%) of
people quit the interview at this point.
4.53 Where definitive contact was made, almost three quarters of graduates (71%) completed the
telephone survey (i.e. excluding “ongoing contact” as well as unusable sample).

Technical Report
Learning and Skills HESA 28
Postal Survey – sample „A‟
4.54 Across both phases a total of 37,545 questionnaires were sent out in the original mailing, with a further
33,542 reminders sent out.
Postal response rate and differences by demographics
4.55 In total, 3,696 postal questionnaires were returned. Of these 35 have been removed because they
were either spoiled, were duplicates of online returns or had been completed twice, leaving a final
postal completion figure of 3,661 and an overall postal response rate of 10% (as a proportion of all
postal questionnaires sent6). As a proportion of all sample supplied (irrespective of whether this came
with an e-mail, address or phone number) this represents a response rate of 5%.
4.56 Tables in Appendix J show how the response rate (based on all sample included in the mailout) varied
by key demographics
4.57 Key variations in patterns of response include the following:
Women were more likely to respond than men (12% versus 7%).
Black (6%) and Asian (5%) graduates and those from other ethnic backgrounds (6%) were the
least likely to respond by post. This compares with a postal response rate of 11% among white
graduates.
Those who had completed PhDs or DPhils were particularly likely to respond (15% compared to
9% of those with First degrees).
Additionally, those who had completed a professional qualification (and were among those least
likely to complete via post previously) were also more likely to return a postal questionnaire
(14%).
Graduates aged over 50 were much more likely to respond than younger graduates, with just
over a fifth (21%) of all those 51 or over responding to the postal survey compared with one in
ten (9%) of those 30 or under.
Those who had studied multiple subjects (15%), Physical Sciences (13%), Medicine and
Dentistry (13%), and Historical and Philosophical Studies (15%) were particularly likely to
respond.
In terms of HEI location, graduates HEIs in Scotland and Wales (both 11%) were a little more
likely to respond to the postal invitation than those who graduated from an HEI in England (9%).
4.58 The response rate for this element of the fieldwork remained consistent with the 04/05 DLHE
Longitudinal survey (previously 11% and currently 10%).
6 All those who had already completed an online survey or who had actively refused in this stage of the research were
taken out of the mailout and are thus effectively removed from this response rate calculation.

Technical Report
Learning and Skills HESA 29
Sample „B‟
4.59 An invitation to complete the survey online was also emailed to over 153,000 sample „B‟ graduates a
week after the sample „A‟ email initial invites had been sent. Again, these graduates were sent three
online reminders with a total of 19,725 completing the survey.
Quality of e-mail contact details
4.60 The quality of email addresses for sample „B‟ graduates closely mirrored that of the „A‟ sample. In total,
25,878 e-mails failed to reach their intended destination representing 17% of all e-mails sent to sample
„B‟.
4.61 Quality of email addresses with respect to gender and age follow the same trends previously
discussed in relation to sample „A‟. As previously seen with sample „A‟, those who studied combined
subjects (30%) were more likely to have poorer quality email addresses, as well as graduates from
HEIs based in Northern Ireland (59%).
Online response rate and differences by demographics
4.62 Among the „B‟ sample, 19,725 questionnaires were completed, representing a response rate of 13%
against a contactable sample of 153,631. This is consistent with the online response rate achieved
amongst sample „A‟ graduates as a proportion of all sample supplied, i.e. all graduates not included in
the drawn sample „A‟, but lower than the sample „B‟ response rate achieved for the previous survey
(17%). As a proportion of all sample supplied, i.e. all graduates not included in the drawn sample „A‟
4.63 At overall level, findings from sample „B‟ can be reported with a statistical error of ±0.7% (at the 95%
confidence level, for findings of 50%) – again, as with sample „A‟, a very high degree of statistical
confidence. That is, if the survey reports that 50% of all 2006/07 graduates share a characteristic or
experience, the “real” value is 95% likely to lie between 49.3% and 50.7%7.
4.64 The table in Appendix F shows the confidence intervals with which findings can be reported for some
of the key survey sub-groups.
4.65 There was some variation in response rates among different sub-groups of graduates (see tables in
Appendix G(2)). Response rates given below and in the Appendix tables refer to the response rate
among the contactable sample (i.e. all those that were given an opportunity to respond), rather than
the response rate all those in the starting sample (i.e. all those taking part in the Early DLHE Survey
not in the drawn sample „A‟).
4.66 Key variations in patterns of response include the following:
Older graduates within sample „B‟ were particularly likely to respond to the survey; among those
in the contactable sample, 19% of those aged 51 and older completed a survey. This mirrors
the high levels of response seen amongst the oldest group in sample „A‟
Response rate by ethnicity broadly mirrored that seen for Sample „A‟ with White graduates
being more likely to respond (14%) and Black and Asian gradates less likely (8% and 7%
respectively).
7 Again, not taking into account design effects and assuming an infinite population

Technical Report
Learning and Skills HESA 30
Those graduating from a research degrees and higher taught degrees were most likely to
respond to the survey (20% and 17% respectively). As with sample „A‟, the lowest response
rates were found among those obtaining diplomas or certificates (6%), other qualifications (8%),
and no formal qualifications (9%).
Those who had studied Physical Sciences (19%), Veterinary Sciences, Agriculture and related
subjects (18%) and Engineering (18%). This is a little different from the patterns observed for
the Sample „A‟ online response rates.
Graduates of Subjects Allied to Medicine, Architecture and Law were least likely to respond
online Creative Arts and Design were the least likely to respond (11%). Again these patterns
deviate slightly from those seen earlier with regards sample „A‟.
In terms of HEI location, graduates from universities in Scotland were particularly likely to
respond online (15%) as they were if they were included within sample „A‟ and responded
online. Again, perhaps as a consequence of a high proportion of email addresses from HEIs in
Northern Ireland being undeliverable, online response rate among graduates from HEIs in
Northern Ireland was low at just 3%.
4.67 There are no differences by gender in terms of online sample „B‟ response rates (13% of men vs. 13%
of women).

Technical Report
Learning and Skills HESA 31
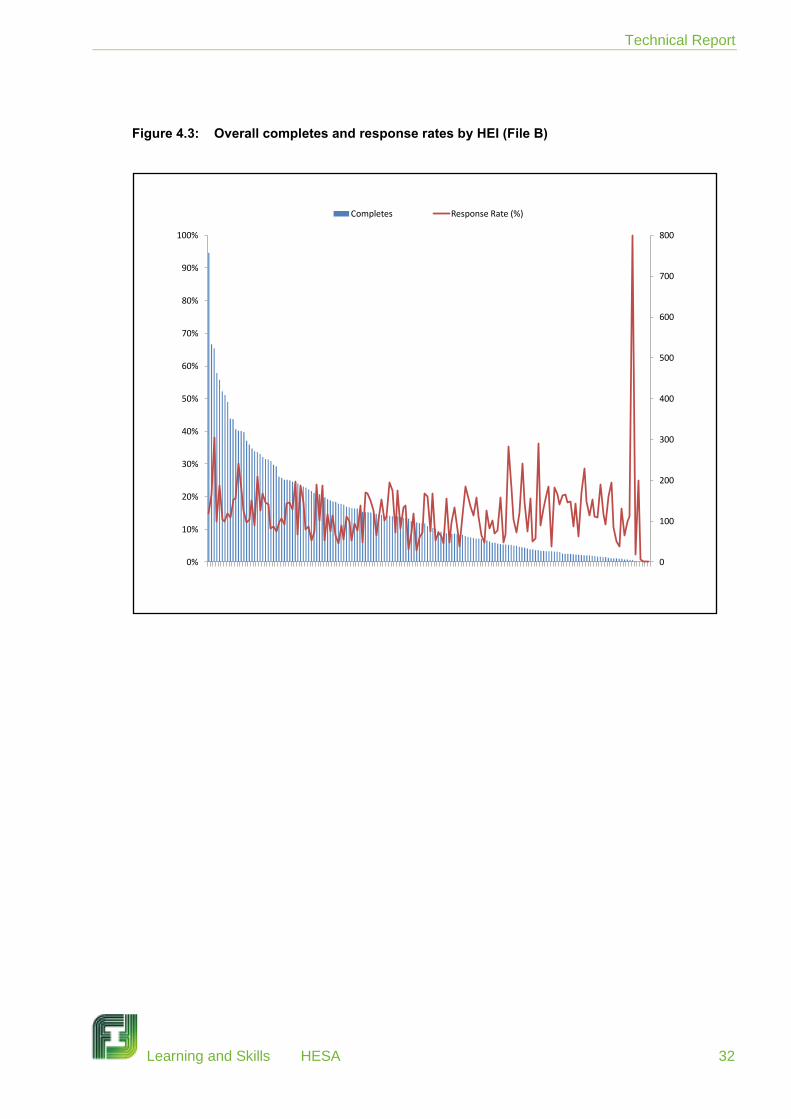
4.68 At an HEI level, the response rate varied considerably, from 100% (38% removing the outlier which
had a small sample size) to 0% although responses from graduates of most HEIs clustered between
5% and 23% (Table 4.4 and Figure 4.3). Five HEIs with at least 50 graduates in their starting sample
achieved a response rate of at least 30%.
Table 4.3: Number of HEIs for which different levels of response rate achieved (File B)
Response Rate Number of HEIs
100% + 1
90 to 99% 0
80 to 89% 0
70 to 79% 0
60 to 69% 0
50 to 59% 0
40 to 49% 0
30 to 39% 5
20 to 29% 35
10 to 19% 79
1 to 9% 41
0% 38
Base: All HEIs supplying „B‟ sample (164)
8 Including 2 HEIs which did not supply any email addresses.
Technical Report
Learning and Skills HESA 32
Figure 4.3: Overall completes and response rates by HEI (File B)
0
100
200
300
400
500
600
700
800
0%
10%
20%
30%
40%
50%
60%
70%
80%
90%
100%
Completes Response Rate (%)

Technical Report
Learning and Skills HESA 33
5 Changes to the questionnaire
Portfolio Careers
5.1 In light of growing interest in the idea that employment may no longer be a graduate‟s main activity
after leaving university and in an attempt to harmonise the Early DLHE and DLHE Longitudinal
surveys, the 2006/07 included additional questions on „portfolio‟ careers.
5.2 A new code „Creating a professional portfolio‟ was added to the two opening questions in Section A
which ascertained what graduates were doing on the census date and what they regarded as their
main activity.
5.3 Graduates that were creating a professional portfolio alongside work were later asked for their reasons
for doing this (Q20), and online graduates were asked for further detail about the professional portfolio
they were preparing. Most commonly these graduates were working in art, photography and fashion.
5.4 However, in a number of cases, respondents interpreted a “portfolio career” to mean continuing
professional development (CPD). This was particularly apparent among those in the healthcare and
teaching professions who explained that maintaining a professional portfolio was a pre requisite to
becoming more qualified or securing a promotion.
5.5 A relatively low proportion of graduates selected the new „portfolio careers‟ codes in Section A – 2.3%
of graduates said they were creating a professional portfolio at Q1, and only 0.4% of graduates
regarded this as their main activity at Q2.
Multiple jobs
5.6 Related to this was the issue of „multiple jobs‟. In previous DLHE surveys, respondents were not asked
about any other employment other than their main job. There was a feeling that working in more than
one job could be becoming increasingly common amongst graduates, particularly in the current
economic climate.
5.7 New questions were added to Section B - „Your employment on 29 November 2010‟. These aimed to
clarify whether graduates were working in more than one job and, if so, how many jobs they were
working in on the census date. In addition, graduates were asked about their reasons for having more
than one job, for an estimate of total annual earnings across all jobs and online graduates were asked
for further detail about what their additional job(s) involved.
5.8 A relatively large proportion of graduates said that they worked in more than one job on the census
date. 11% of respondents said they worked in more than one job, equating to 13% of the graduate
population (weighted figures).
Employability questions
5.9 Two questions were added to Section E – „Satisfaction‟ in order to gauge graduate perceptions of how
their course prepared them for progressing their career aspirations (Q44A) and becoming self
employed or setting up their own business (Q44B).
Technical Report
Learning and Skills HESA 34
Other changes
5.10 Other changes made to the questionnaire were as follows:
Activity on 29 November 2010 (Q1/Q2). Third code changed from „Engaged in study or
training‟ to „Engaged in study, training or registered as a research student‟ to maintain
consistency with Early DLHE
Name of organisation instructions (Q7). An interviewer note and online instruction were
added to the telephone and online versions which asked for the name of employment agency
rather than placement organisation for those working through temping agencies.
Basis on which graduate was employed (Q12): Verbatim removed here to maintain
consistency with Early DLHE.
Hourly salary (Q15). A new question was added for those paid hourly which asked for the
number of hours worked per week. This allowed us to calculate salary to a more accurate level;
previously all hourly data was multiplied by a standard factor.
Reasons for taking job/becoming self employed (Q18): Codeframe changed to maintain
consistency with Early DLHE
How found out about job (Q19): Verbatim removed here for online and postal surveys to
maintain consistency with Early DLHE.
Which describes study, training or research undertaken (Q27): Third code „Engaged in
private, unsupervised study‟ added and verbatim removed to maintain consistency with Early
DLHE. The code „Preparing a professional portfolio of my work to submit for accreditation‟
removed to reflect focus on „portfolio careers‟ in previous questions.
Main source of funding for course of study, training or research (Q28): Was previously two
questions, combined into one to ask for main source of funding rather than variety of sources as
well as main source.
Non-financial employer benefits (Q29): New question added to capture any other benefits
that the employer provided the graduate with while undertaking study, training or research.
Section D - What else have you been doing since finishing your course in 2006/07:
Previously Section D comprised a careers grid which aimed to capture the details of up to 7
activities a graduate had undertaken since leaving university. For the 2006/07 DLHE
Longitudinal Survey, the section was shortened; it combined the previous Section D (What have
you been doing since finishing your course) and Section E (Other qualifications obtained since
graduating). The number of jobs the graduate has had since graduating was captured but the
details of previous employment was not asked for, while only the highest level of qualification
achieved was focused on in contrast to the detail that was captured for every qualification
achieved previously. In addition, new questions focussing on periods and accumulated length of
unemployment were included.
Section F – Research Degree: The Research Degree Section was extended slightly to allow
the graduate to express additional reasons for undertaking their degree, sources of funding for

Technical Report
Learning and Skills HESA 35
fees and sources of funding for maintenance. Previously, the questionnaire only asked for the
main reason and main sources of funding. New codes were also added to Q52 and Q54.
Where graduates first heard about survey (Q60): New question added for telephone
graduates only asking from which sources they first heard about the survey.
Technical Report
Learning and Skills HESA 36
6 Weighting / combining the samples
6.1 After an exploration into the similarities and differences between sample A and sample B, the decision
was taken that it was appropriate for the samples to be combined and analysed as one. The samples
were weighted, firstly to correct for selection bias and then to correct for response bias, to ensure
that the weighted survey findings were representative of the early DLHE population.
6.2 An additional weight was also developed for use when conducting analysis at individual HEI level.
6.3 The remainder of this chapter describes in detail the specific weighting methodology that was used.
Logistic Regression Model for Weighting „Sample A‟ and „Sample B‟
6.4 The method used to weight the Sample A and Sample B completes followed that used for the 2002/03
and 2004/05 DLHE Longitudinal Surveys. The method was as follows:
A preliminary weight to correct for selection criteria was computed by inversing the sampling fraction.
Non-response behaviour (i.e. whether they responded to the survey or not) was then modelled using binary logistic regression. The regression model was run on all issued DLHE Longitudinal Survey graduates, weighted by the inverse of the selection weight. A weight was generated using the predicted probabilities saved from the non-response model.
6.5 The following variables were used in the model:
Country of HEI (England, Northern Ireland, Scotland, Wales),
Level of Qualification Obtained – the 8 way split was used (Higher degree by research,
Higher degree by taught course, Postgraduate diploma or certificate, First Degree, Other
diploma or certificate, Professional qualification, Other qualification, No formal qualification);
Classification of Degree (First class honours, Upper second class honours, Lower second
class honours, Third class honours / Pass, Unclassified, FE level qualification, Classification not
applicable)
Employment categories at Early Survey (Full-time paid work only (including self-employed),
Part-time paid work only, Voluntary/unpaid work only, Work and further study, Further study
only, Assumed to be unemployed, Not available for employment, Other)
Subject of Original Course (Architecture Building and Planning; Biological Sciences; Business
and Administrative studies; Creative Arts and Design; Eastern, Asiatic, African, American and
Australasian Languages, Literature and related subjects; Education; Engineering; European
Languages, Literature and related subjects; Historical and Philosophical studies; Law;
Linguistics, Classics and related subjects; Mass Communications and Documentation;
Mathematical and Computer Sciences; Medicine and Dentistry; Physical Sciences; Social
studies; Subjects Allied to Medicine; Technologies; Veterinary Sciences, Agriculture and related
subjects; Multiple subjects)
Student Type (Research PhD and Masters students, Foundation students, HND (England HEIs
only), TDA funded students, General).

Technical Report
Learning and Skills HESA 37
Method of Data Collection for the Early Survey (Standard questionnaire: first mailing,
Standard questionnaire: second mailing, Telephone survey: graduate, Telephone survey: third
party, Own HEIs student record, Other)
Contacts available - mail (yes, no), email (yes, no), and telephone (yes, no),
Gender (female, male)
Age (25 or under; 26 – 30; 31 – 40; 41 -50; 51+)
Ethnicity (Asian; Black; Mixed; Other; White)
Number of contact methods
6.6 Method of Completion was not used as it is a tautological variable.
6.7 The logistic regression model generated the probability of a graduate participating in the survey given
their „type‟ (based on the predictor variables described above). Not all the variables that were used in
the model necessarily made it into the final model.
6.8 After these weights were calculated, the top and bottom 2.5% were trimmed. Finally, a calibration of
age bands was required. Apart from age band, all other key variables had very similar distributions to
the unweighted population of 332,110.
6.9 The Sample A and B weights were calculated separately, and together provide national level weighting
for the all 49,063 interviews completed.
HEI weights
6.10 As well as national weights a set of HEI specific weights were calculated to correct for response bias
at HEI level. This was done on the combined completed interviews from Sample „A‟ and „B‟. The
process for calculating HEI weights was based on that used for the previous DLHE Longitudinal
Survey, and differentiated depending on the number of interviews completed for that HEI.
6.11 For HEIs with 400 or more DLHE Longitudinal Survey respondents the survey data are weighted so as
to give a close percentage match between the survey and the census in terms of broad subject group,
the part-time/full-time split; and the postgraduate/undergraduate split.
6.12 The broad subject groups us DLHE Longitudinal Studyed were: health and welfare; science and
agriculture; engineering, manufacture and construction; social science, business, law and combined;
humanities and arts; education.
6.13 For HEIs with between 200 and 399 DLHE Longitudinal Survey respondents the survey data were
weighted so as to give a close percentage match between the survey and the census in terms of the
part-time/full-time split; and the postgraduate/undergraduate split.
6.14 For HEIs with between 100 and 199 DLHE Longitudinal Survey respondents the survey data are
weighted so as to give a close percentage match between the survey and the census in terms of the
postgraduate/undergraduate split.
6.15 For HEIs with fewer than 100 DLHE Longitudinal Survey respondents no HEI level adjustment has
been made.

Technical Report
Learning and Skills HESA 38
6.16 Finally, all HEI weights also include an adjustment so that the when they are applied each HEI is
scaled in proportion to the number of responses for that HEI in the unweighted data. This means that
the weighted base for each HEI is equal to its unweighted sample size.

Technical Report
Learning and Skills HESA 39
7 Appendices .
Appendix A – Postal Questionnaire

Technical Report
Learning and Skills HESA 40

Technical Report
Learning and Skills HESA 41

Technical Report
Learning and Skills HESA 42

Technical Report
Learning and Skills HESA 43

Technical Report
Learning and Skills HESA 44

Technical Report
Learning and Skills HESA 45

Technical Report
Learning and Skills HESA 46

Technical Report
Learning and Skills HESA 47
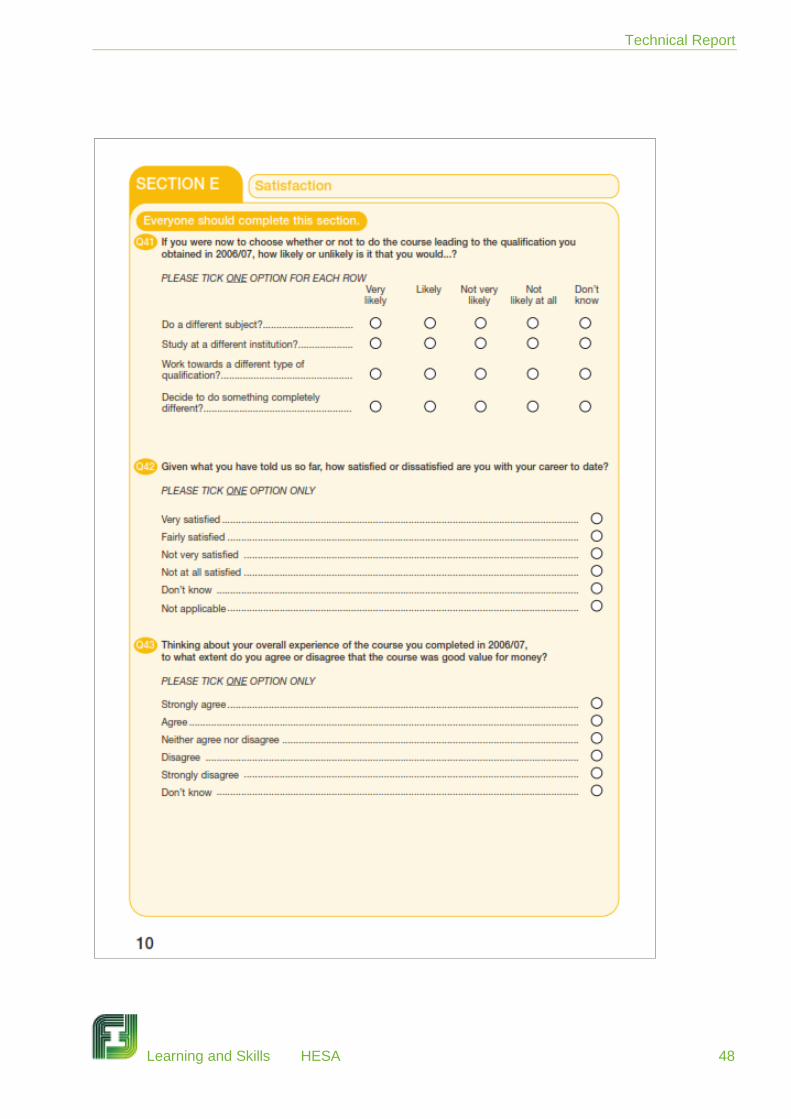
Technical Report
Learning and Skills HESA 48
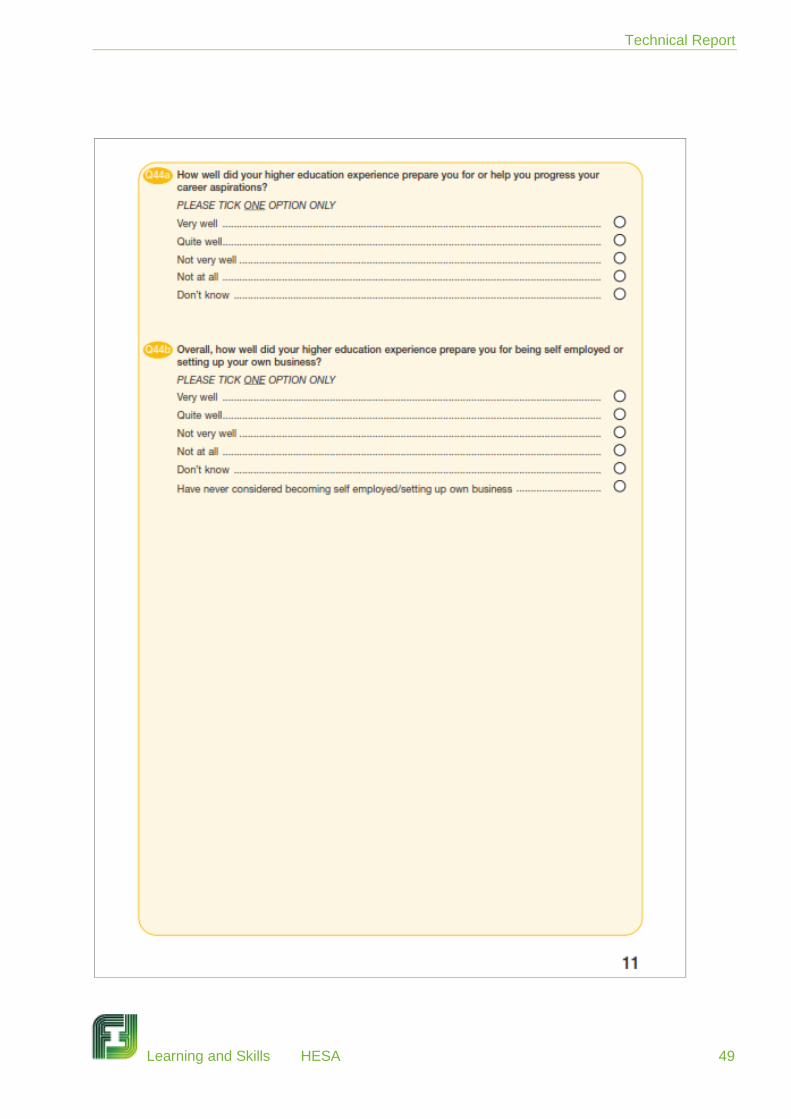
Technical Report
Learning and Skills HESA 49

Technical Report
Learning and Skills HESA 50

Technical Report
Learning and Skills HESA 51

Technical Report
Learning and Skills HESA 52

Technical Report
Learning and Skills HESA 53

Technical Report
Learning and Skills HESA 54

Technical Report
Learning and Skills HESA 55
Appendix B – E-mail Invitation and reminders
Dear <GRADUATE FIRST NAME>,
Destinations of Leavers from Higher Education Longitudinal Survey
We are writing to invite you to take part in an important survey of people who graduated from higher
education in the academic year 2006/07.
You helpfully completed a questionnaire about six months after you graduated which asked what you had
been doing in terms of work and further study. You have now been selected to take part in a follow-up survey
to find out what has happened to you since then.
To complete the survey please follow this link which will automatically log you in:
<INDIVIDUALISED LINK>
If following this link does not work on your computer, please go to www.graduate-destinations.co.uk and log
in using your unique online ID:
Online ID: <SAMPLE ID IDENTIFIER >
If you have any technical difficulties accessing the survey, you may find the following information useful:
http://www.iffresearch.com/Longitudinal_DLHE_survey_instructions_for_IE6_users.doc
Ultimately, this survey will help improve the opportunities and support available to graduates in the future.
The survey is being conducted by IFF Research, an independent market research agency working on behalf
of the Higher Education Statistics Agency (HESA) and various statutory organisations. If you have any
further queries about the research you can call the IFF Research helpline on 0800 054 2377 or email IFF on
More information about the survey can be found online at http://www.hesa.ac.uk/graduatefaq or
www.graduate-destinations.co.uk.
The data protection page at www.graduate-destinations.co.uk explains exactly how your responses will be
used, and who by.
Thank you in advance for your help with this important study.
To complete the survey please follow this link:
<INDIVIDUALISED LINK>
Best wishes,
Catherine Riley
Project Manager
IFF Research Ltd.

Technical Report
Learning and Skills HESA 56
Dear <first name>,
Destinations of Leavers from Higher Education Longitudinal Survey
We are writing to remind you of the opportunity to take part in an important survey of people who graduated
from higher education in the academic year 2006/07. The survey was sent to you a few weeks ago but we
have not received a response from you yet.
IF GRADUATE HAS LOGGED IN TO SURVEY BUT NOT COMPLETED IT: We see that you have had an
initial look at the survey, but did not go on to complete it. We would really appreciate you taking the time to
complete the survey; your participation is valuable.
IF GRADUATE IS PART WAY THORUGH THE SURVEY AND NOT COMPLETED: We see that you have
already started the survey, but not yet finished it. We would really appreciate it if you could now complete it;
your participation is valuable. You will only have to give responses to the questions you haven‟t yet
answered.
To complete the survey please follow this link which will automatically log you in:
<Individualised Link>
If following this link does not work on your computer, please go to www.graduate-destinations.co.uk and log
in using your unique online ID:
Online ID: <Key>
You helpfully completed a questionnaire about six months after you graduated which asked what you had
been doing in terms of work and further study. You have now been selected to take part in a follow-up survey
to find out what has happened to you since then.
If you have any technical difficulties accessing the survey, you may find the following information useful:
http://www.iffresearch.com/Longitudinal_DLHE_survey_instructions_for_IE6_users.doc
The survey is being conducted by IFF Research, an independent market research agency working on behalf
of the Higher Education Statistics Agency (HESA) and various statutory organisations. If you have any
further queries about the research you can call the IFF Research helpline on 0800 054 2377 or email IFF on
More information about the survey can be found online at http://www.hesa.ac.uk/graduatefaq or
www.graduate-destinations.co.uk.
The data protection page at www.graduate-destinations.co.uk explains exactly how your responses will be
used, and who by.
To complete the survey please follow this link:
< Individualised Link>
Thank you in advance for your help with this important study.
Best wishes,
Catherine Riley
Project Manager
IFF Research Ltd.

Technical Report
Learning and Skills HESA 57
Dear <first name>,
Destinations of Leavers from Higher Education Longitudinal Survey
We‟ve written to you a couple of times but haven‟t heard anything from you yet. We would really like to
encourage you to participate in this important study by letting us know what you have been doing since
leaving university and sharing your experiences with us.
IF GRADUATE HAS LOGGED IN TO SURVEY BUT NOT COMPLETED IT: We see that you have had an
initial look at the survey, but did not go on to complete it. We would really appreciate you taking the time to
complete the survey; your participation is valuable.
IF GRADUATE IS PART WAY THORUGH THE SURVEY AND NOT COMPLETED: We see that you have
already started the survey, but not yet finished. We would really appreciate it if you could now complete it.
You will only have to give responses to the questions you haven‟t yet answered.
To complete the survey please follow this link which will automatically log you in:
<Individualised Link>
If following this link does not work on your computer, please go to www.graduate-destinations.co.uk and log
in using your unique online ID:
Online ID: <Key>
The survey is being conducted by IFF Research, an independent market research agency working on behalf
of the Higher Education Statistics Agency (HESA) and various statutory organisations. If you have any
further queries about the research you can call the IFF Research helpline on 0800 054 2377 or email IFF on
More information about the survey can be found online at http://www.hesa.ac.uk/graduatefaq or
www.graduate-destinations.co.uk.
The data protection page at www.graduate-destinations.co.uk explains exactly how your responses will be
used, and who by.
To complete the survey please follow this link:
< Individualised Link>
Thank you in advance for your contribution to this important study.
Best wishes,
Catherine Riley
Project Manager
IFF Research Ltd.
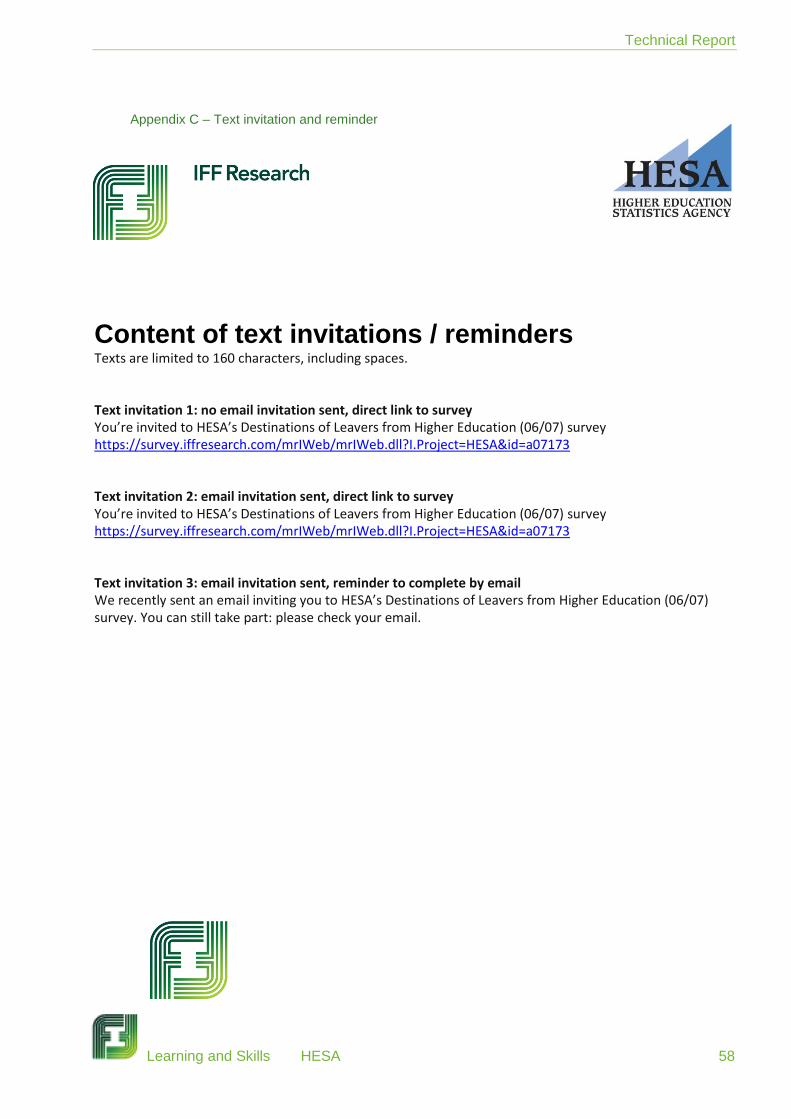
Technical Report
Learning and Skills HESA 58
Appendix C – Text invitation and reminder
Content of text invitations / reminders Texts are limited to 160 characters, including spaces. Text invitation 1: no email invitation sent, direct link to survey You’re invited to HESA’s Destinations of Leavers from Higher Education (06/07) survey https://survey.iffresearch.com/mrIWeb/mrIWeb.dll?I.Project=HESA&id=a07173 Text invitation 2: email invitation sent, direct link to survey You’re invited to HESA’s Destinations of Leavers from Higher Education (06/07) survey https://survey.iffresearch.com/mrIWeb/mrIWeb.dll?I.Project=HESA&id=a07173 Text invitation 3: email invitation sent, reminder to complete by email We recently sent an email inviting you to HESA’s Destinations of Leavers from Higher Education (06/07) survey. You can still take part: please check your email.

Technical Report
Learning and Skills HESA 59
Appendix D – Postal invitation, reminder and data protection form
<contact>
<add1>
<add2>
<add3>
<add4>
<add5>
<postcode>
<country>
Survey ID: <ID>
<date letter will go in the post>
Dear <fname>,
Destinations of Leavers from Higher Education Longitudinal Survey
We are writing to invite you to take part in an important survey of people who graduated from higher education in
the academic year 2006/07. You will find a questionnaire enclosed, along with a reply-paid envelope for you to
return it to us - there is no need to use a stamp.
If you would prefer to complete the survey online, please go to www.graduate-destinations.co.uk and enter your
survey ID, which you will find above.
You may remember completing a questionnaire asking what you were doing about six months after you
graduated. You have been selected from those who took part in this earlier survey to take part in a follow-up
survey to help us build up a picture of what you are doing three years on, as well as what you have been doing
over the last few years.
The information from the earlier study was very useful for advising students on career paths and for investigating
career patterns of those leaving higher education. Ultimately this follow-up survey will help improve the
opportunities and support available to graduates in the future.
Two Longitudinal surveys have been carried out and so far the careers of over 50,000 graduates have been
tracked. The first took place in winter 2006/07 and the second two years later, in winter 2008/09. You may have
come across some findings from these surveys in the news. For more information about the findings please visit
www.graduate-destinations.co.uk/results.
This third follow-up survey is being conducted by IFF Research, an independent market research agency
working on behalf of the Higher Education Statistics Agency (HESA) and various statutory organisations.
More information about the survey can be found online at http://www.hesa.ac.uk/graduatefaq or www.graduate-
destinations.co.uk. If you have any further queries about the research you can call the IFF Research helpline on
0800 054 2377 or email IFF on [email protected]. You can also contact IFF if you would
like to receive a Welsh language version of the questionnaire.
We would strongly encourage you to take part in this follow-up survey. You participation will help us understand
what happens to graduates three and a half years after leaving university. Thank you in advance for your time
spent on it.

Technical Report
Learning and Skills HESA 60
If you are interested in seeing the results from this survey, they will be available online at www.graduate-
destinations.co.uk after the fieldwork has been completed in spring 2011.
The data protection notice overleaf explains exactly how your responses will be used, and who by.
Best wishes,
Catherine Riley
IFF Research
If you recently received an email with the subject line „Destinations of Leavers from Higher Education Longitudinal Survey‟
inviting you to complete this survey online and have not yet done so, the online survey is still open and you can complete
either the online or the paper version. If you have completed the online survey already there is no need to complete a paper
version too.

Technical Report
Learning and Skills HESA 61
<contact>
<add1>
<add2>
<add3>
<add4>
<add5>
<postcode>
<country>
Survey ID: <ID>
<date letter will go in the post>
Dear <fname>,
Destinations of Leavers from Higher Education Longitudinal Survey
We are writing to offer you a further opportunity to take part in an important survey of people who graduated from
higher education in the academic year 2006/07.
We are interested in hearing from you even if the HE course you completed in 2006/07 was not your first HE
course or the course you were studying for was not a degree course, and would be really grateful if you would
return the questionnaire we recently sent, using the pre-paid envelope we supplied.
If you would prefer to complete the survey online, please go to www.graduate-destinations.co.uk and enter your
survey ID, which you will find above.
The findings of this survey will be used to advise students on career paths and improve the opportunities and
support available to graduates. They will also be used by various statutory organisations investigating career
patterns of those leaving higher education.
Two Longitudinal surveys have been carried out and so far the careers of over 50,000 graduates have been
tracked. The first took place in winter 2006/07 and the second two years later, in winter 2008/09. You may have
come across some findings from these surveys in the news. For more information about the findings please visit
www.graduate-destinations.co.uk/results.
This third follow-up survey is being conducted by IFF Research, an independent market research agency
working on behalf of the Higher Education Statistics Agency (HESA) and various statutory organisations.
More information about the survey can be found online at www.graduate-destinations.co.uk. If you have any
further queries about the research you can call the IFF Research helpline on 0800 054 2377 or email IFF
Research on [email protected]. You can also contact IFF Research if you would like to
receive a Welsh language version of the questionnaire.
So far we have heard from over 15,000 people who graduated at the same time as you. However, in order to be
able to understand the opportunities different courses in different universities open up, we're really keen to hear
from even more of you, and really hope that you can find time to help.
If you are interested in seeing the results from this survey, they will be available online at www.graduate-
destinations.co.uk/results after the fieldwork has been completed in spring 2011.

Technical Report
Learning and Skills HESA 62
Best wishes,
Catherine Riley
IFF Research
If you recently received an email with the subject line „Destinations of Leavers from Higher Education Longitudinal Survey‟
inviting you to complete this survey online and have not yet done so, the online survey is still open and you can complete
either the online or the paper version. If you have completed the online survey already there is no need to complete a paper
version too.

Technical Report
Learning and Skills HESA 63

Technical Report
Learning and Skills HESA 64
Appendix E – Data Editing and Cleaning Protocol
Cleaning postal data
The nature of the postal survey was such that graduates were not led or directed through the questionnaire
in the same way as those who responded to the online or telephone surveys. Critically, this meant a greater
degree of routing error, and also that people were able to give more than one response to questions which
were intended to be single response. The first stage of data cleaning was to eliminate these structural errors
in the data, via the following steps:
a) Where both „employed‟ and „unemployed‟ were selected check Section B. If filled in then accept
„employed‟. If left blank, accept „unemployed‟.
b) Where an answer was not provided at Q2 (main activity on 29th November 2010), and Q1 was either
multi-coded or blank, and answers were provided at either Section B or Section C (but not both), then
Q2 was forced accordingly (to either “employed” if Section B was completed and Section C was not
completed, or to “engaged in study” if Section C was completed and Section B was not completed).
c) Where an answer was not provided at Q2 (main activity on 29th November 2010), and Q1 was either
multi-coded or blank, and answers were not provided in Section B or Section C then Q2 was forced
accordingly to „doing something else‟.
d) Where an answer was not provided at Q2 (main activity on 29th November 2010), and Q1 was either
multi-coded or blank, and answers were provided at both Section B or Section C, records were forced in
the following order (1. Employed 2. Engaged in study 3. Doing something else 4. Creating a professional
portfolio 5. Unemployed). Decisions were made about main activity at Q2 on the basis of this order e.g. if
„engaged in study‟ and „creating a professional portfolio‟, Q2 was forced to „engaged in study‟.
e) Where single code questions were multi-coded, responses were forced in line with the rules and/or
principles of the Early DLHE survey
Detailed quality checks, editing and cleaning carried out against final files
a) Filters were applied to each variable so that all the bases are „clean‟ and responses to questions that
shouldn‟t have been answered were forced to blank.
b) Derived variables created.
c) Edits resulting from call-backs regarding the salary questions (e.g. for particularly high or low values)
and inconsistent information given in Section D (for example the main activity described in Section C
being repeated in Section D and unlikely periods or length of unemployment).

Technical Report
Learning and Skills HESA 65
Appendix F – Confidence Intervals for Key Survey Sub-Groups
Statistical error for findings by gender
File A
Completes
File A
Statistical Error
File B
Completes
File B
Statistical
Error
Combined
Completes
Combined
Statistical
Error
Male 12521 ±0.8% 7869 ±1.1% 20390 ±0.6%
Female 16817 ±0.7% 11856 ±0.9% 28673 ±0.5%
Statistical error for findings by age
File A
Completes
File A
Statistical Error
File B
Completes
File B
Statistical
Error
Combined
Completes
Combined
Statistical
Error
25 or under 10086 ±1% 7525 ±1.1% 17611 ±0.7%
26 – 30 9577 ±1% 6075 ±1.2% 15652 ±0.7%
31 – 40 4477 ±1.4% 2545 ±1.9% 7022 ±1.1%
41 – 50 3261 ±1.7% 2064 ±2.1% 5325 ±1.2%
51 + 1932 ±2.1% 1512 ±2.4% 3444 ±1.5%
Statistical error for findings by ethnicity
File A
Completes
File A
Statistical Error
File B
Completes
File B
Statistical
Error
Combined
Completes
Combined
Statistical
Error
Any white 21739 ±0.6% 17602 ±0.7% 39341 ±0.5%
Any black 1685 ±2.2% 348 ±5.2% 2033 ±2.0%
Any Asian 2169 ±2.0% 840 ±3.3% 3009 ±1.7%
Any mixed 1686 ±2.2% 105 ±9.5% 1791 ±2.0%
Other Ethnic
background. 954 ±2.9% 0 _ 954 ±2.9%

Technical Report
Learning and Skills HESA 66
Statistical error for findings by type of qualification
File A
Completes
File A
Statistical Error
File B
Completes
File B
Statistical
Error
Combined
Completes
Combined
Statistical
Error
Higher degree,
mainly by
research
(PhD, DPhil)
2998 ±1.4% 16 ±24.5% 3014 ±1.4%
Higher degree,
mainly taught
course (MA,
MSc)
2512 ±1.9% 3577 ±1.6% 6089 ±1.2%
Postgraduate
diploma or
certificate (inc.
PGCE)
2515 ±1.9% 1975 ±2.2% 4490 ±1.4%
First Degree
(BA, BSc) 17576 ±0.7% 13361 ±0.8% 30937 ±0.5%
Other diploma
or certificate 2521 ±1.8% 475 ±4.5% 2996 ±1.7%
Professional
Qualifications 23 ±19.8% 24 ±19.3% 47 ±13.3%
Other
qualification 1174 ±2.7% 290 ±5.7% 1464 ±2.3%
No formal
qualification 19 ±21.9% 7 ±36.7% 26 ±18.5%

Technical Report
Learning and Skills HESA 67
Statistical error for findings by type of subject studied
File A
Completes
File A
Statistical
Error
File B
Completes
File B
Statistical
Error
Combined
Completes
Combined
Statistical
Error
Medicine and
Dentistry 710 ±3.5% 372 ±5.0% 1082 ±2.8%
Subjects Allied
to Medicine 2991 ±1.78% 1538 ±2.5% 4529 ±1.4%
Biological
Sciences 2551 ±1.9% 1911 ±2.2% 4462 ±1.4%
Veterinary
Sciences,
Agriculture and
related subjects
447 ±4.6% 272 ±5.9% 719 ±3.6%
Physical
Sciences 1349 ±2.57% 1152 ±2.6% 2501 ±1.8%
Mathematical
and Computer
Sciences
2339 ±1.9% 1369 ±2.6% 3708 ±1.5%
Engineering 1844 ±2.1% 1148 ±2.8% 2992 ±1.6%
Technologies 250 ±5.9% 132 ±8.3% 382 ±4.6%
Architecture,
Building and
Planning
934 ±3.0% 390 ±4.9% 1324 ±2.5%
Social studies 2356 ±1.9% 1885 ±2.2% 4241 ±1.4%
Law 1010 ±3.0% 768 ±3.5% 1778 ±2.2%
Business and
Administrative
studies
3726 ±1.5% 2102 ±2.1% 5828 ±1.2%
Mass
Communications
and
Documentation
660 ±3.7% 456 ±4.5% 1116 ±2.7%
Linguistics,
Classics and
related subjects
979 ±3.0% 1078 ±2.9% 2057 ±2.0%
European
Languages,
Literature and
related subjects
446 ±4.5% 434 ±4.5% 880 ±3.0%
Eastern, Asiatic,
African,
American and
Australasian
Languages,
Literature and
134 ±8.1% 124 ±8.4% 258 ±5.6%

Technical Report
Learning and Skills HESA 68
related subjects
Historical and
Philosophical
studies
1267 ±2.6% 1275 ±2.6% 2542 ±1.8%
Creative Arts
and Design 2578 ±1.9% 1575 ±2.4% 4153 ±1.4%
Education 2514 ±1.9% 1445 ±2.5% 3959 ±1.5%
Combined
subjects 253 ±5.9% 299 ±5.4% 552 ±3.8%
Statistical error for findings by HEI location
File A
Completes
File A
Statistical Error
File B
Completes
File B
Statistical
Error
Combined
Completes
Combined
Statistical
Error
England 21278 ±0.7% 17156 ±0.7% 38434 ±0.5%
Scotland 3398 ±1.6% 1537 ±2.4% 4935 ±1.3%
Wales 2171 ±2.0% 961 ±3.1% 3132 ±1.6%
Northern
Ireland 2491 ±1.7% 71 ±11.6% 2562 ±1.6%

Technical Report
Learning and Skills HESA 69
Appendix G(1) – Response Rates by Key Demographics – Sample „A‟
Overall response rate by gender
Total Sample Total Contactable Total Completes Response Rate
Male 31562 29843 12521 42%
Female 39396 37367 16817 45%
Overall response rate by age
Total Sample Total Contactable Total Completes Response Rate
25 or under 24147 23390 10086 43%
26 - 30 24636 23342 9577 41%
31 - 40 11787 10806 4477 41%
41 - 50 6900 6439 3261 51%
51 + 3475 3220 1932 60%
Unknown 13 13 5 38%
Overall response rate by ethnicity
Total Sample Total Contactable Total Completes Response Rate
Any white 49733 47275 21739 46%
Any black 5022 4740 1685 36%
Any Asian 5855 5558 2169 39%
Any mixed 4590 4342 1686 39%
Other Ethnic
background 2702 2543 954 38%
Not known /
Information refused
/ Blank
3056 2752 1105 40%

Technical Report
Learning and Skills HESA 70
Overall response rate by course type
Total
Sample
Total
Contactable
Total
Completes
Response
Rate
Higher degree, mainly by research (PhD, DPhil) 7274 6404 2998 47%
Higher degree, mainly taught course (MA, MSc) 6285 5738 2512 44%
Postgraduate diploma or certificate (inc. PGCE) 5865 5539 2515 45%
First Degree (BA, BSc) 41740 40293 17576 44%
Other diploma or certificate 6840 6421 2521 39%
Professional Qualification 46 44 23 52%
Other qualification 2854 2726 1174 43%
No formal qualification 54 45 19 42%
Overall response rate by course subject
Total
Sample
Total
Contactable
Total
Completes
Response
Rate
Medicine and Dentistry 1914 1745 710 41%
Subjects Allied to Medicine 7075 6665 2991 45%
Biological Sciences 6147 5790 2551 44%
Veterinary Sciences, Agriculture and related
subjects 946 909 447 49%
Physical Sciences 3093 2873 1349 47%
Mathematical and Computer Sciences 5624 5344 2339 44%
Engineering 4433 4238 1844 44%
Technologies 612 601 250 42%
Architecture, Building and Planning 2435 2313 934 40%
Social studies 5718 5385 2356 44%
Law 2937 2776 1010 36%
Business and Administrative studies 9737 9302 3726 40%
Mass Communications and Documentation 1631 1574 660 42%
Linguistics, Classics and related subjects 2301 2180 979 45%
European Languages, Literature and related
subjects 1090 1017 446 44%
Eastern, Asiatic, African, American and
Australasian Languages, Literature and related
subjects
333 304 134 44%
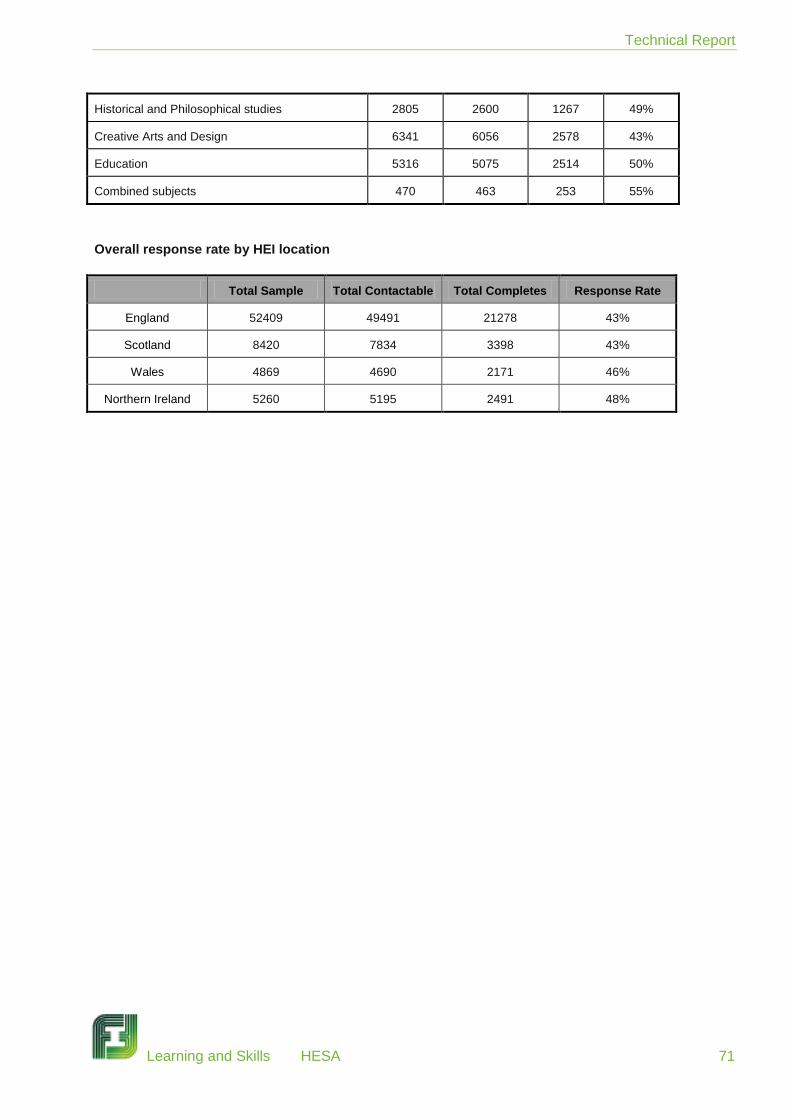
Technical Report
Learning and Skills HESA 71
Historical and Philosophical studies 2805 2600 1267 49%
Creative Arts and Design 6341 6056 2578 43%
Education 5316 5075 2514 50%
Combined subjects 470 463 253 55%
Overall response rate by HEI location
Total Sample Total Contactable Total Completes Response Rate
England 52409 49491 21278 43%
Scotland 8420 7834 3398 43%
Wales 4869 4690 2171 46%
Northern Ireland 5260 5195 2491 48%
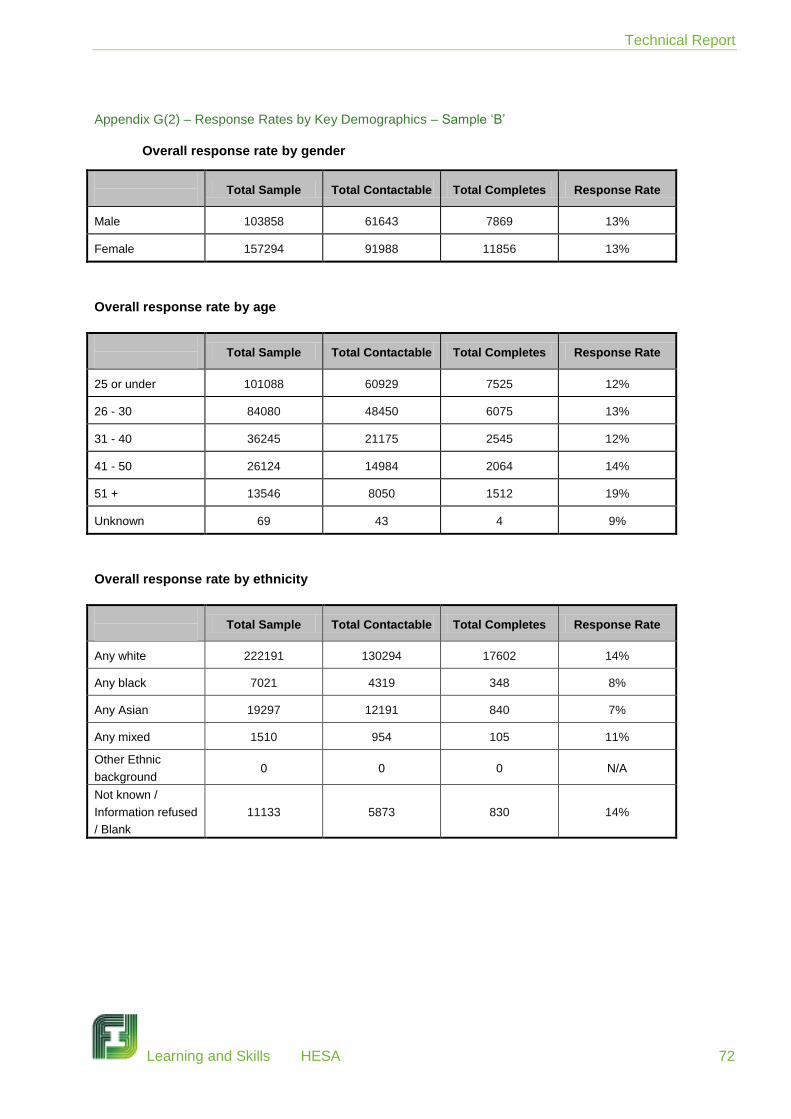
Technical Report
Learning and Skills HESA 72
Appendix G(2) – Response Rates by Key Demographics – Sample „B‟
Overall response rate by gender
Total Sample Total Contactable Total Completes Response Rate
Male 103858 61643 7869 13%
Female 157294 91988 11856 13%
Overall response rate by age
Total Sample Total Contactable Total Completes Response Rate
25 or under 101088 60929 7525 12%
26 - 30 84080 48450 6075 13%
31 - 40 36245 21175 2545 12%
41 - 50 26124 14984 2064 14%
51 + 13546 8050 1512 19%
Unknown 69 43 4 9%
Overall response rate by ethnicity
Total Sample Total Contactable Total Completes Response Rate
Any white 222191 130294 17602 14%
Any black 7021 4319 348 8%
Any Asian 19297 12191 840 7%
Any mixed 1510 954 105 11%
Other Ethnic
background 0 0 0 N/A
Not known /
Information refused
/ Blank
11133 5873 830 14%

Technical Report
Learning and Skills HESA 73
Overall response rate by course type
Total
Sample
Total
Contactable
Total
Completes
Response
Rate
Higher degree, mainly by research (PhD, DPhil) 173 82 16 20%
Higher degree, mainly taught course (MA, MSc) 33885 20621 3577 17%
Postgraduate diploma or certificate (inc. PGCE) 32175 17597 1975 11%
First Degree (BA, BSc) 173280 104009 13361 13%
Other diploma or certificate 15141 7561 475 6%
Professional Qualification 289 202 24 12%
Other qualification 5924 3479 290 8%
No formal qualification 285 80 7 9%
Overall response rate by course subject
Total
Sample
Total
Contactable
Total
Completes
Response
Rate
Medicine and Dentistry 5745 2786 372 13%
Subjects Allied to Medicine 30774 15774 1538 10%
Biological Sciences 23214 13503 1911 14%
Veterinary Sciences, Agriculture and related
subjects 2649 1520 272 18%
Physical Sciences 10040 6039 1152 19%
Mathematical and Computer Sciences 15613 9180 1369 15%
Engineering 10862 6522 1148 18%
Technologies 1662 1099 132 12%
Architecture, Building and Planning 6246 3922 390 10%
Social studies 24055 14066 1885 13%
Law 12554 7660 768 10%
Business and Administrative studies 30443 19123 2102 11%
Mass Communications and Documentation 6846 4215 456 11%
Linguistics, Classics and related subjects 11696 7016 1078 15%
European Languages, Literature and related
subjects 4407 2722 434 16%
Eastern, Asiatic, African, American and
Australasian Languages, Literature and related
subjects
1189 770 124 16%
Historical and Philosophical studies 13060 8030 1275 16%

Technical Report
Learning and Skills HESA 74
Creative Arts and Design 23775 14904 1575 11%
Education 23632 12734 1445 11%
Combined subjects 2690 2046 299 15%
Overall response rate by HEI location
Total Sample Total Contactable Total Completes Response Rate
England 221173 132436 17156 13%
Scotland 23084 10219 1537 15%
Wales 13529 8491 961 11%
Northern Ireland 3366 2485 71 3%

Technical Report
Learning and Skills HESA 75
Appendix H(1) – Quality of e-mail addresses and online response rates by key demographics (Sample „A‟)
Quality of E-mail addresses by gender
Gender Total Sample With Email Total Undeliverable
% Of E-Mail Sample
Undeliverable
Male 18487 3093 17%
Female 23388 4511 19%
Quality of E-mail addresses by age
Age Total Sample With Email Total Undeliverable
% Of E-Mail Sample
Undeliverable
25 or under 14675 2615 18%
26 - 30 14460 2601 18%
31 - 40 6794 1188 17%
41 - 50 3956 802 20%
51 + 1982 396 20%
Unknown 8 2 25%
Quality of E-mail addresses by ethnicity
Ethnicity Total Sample With Email Total Undeliverable
% Of E-Mail Sample
Undeliverable
Any white 29040 5929 20%
Any black 3120 433 14%
Any Asian 3628 432 12%
Any mixed 2850 367 13%
Other Ethnic background 1737 242 14%
Not known / Information
refused / Blank 1500 201 13%
Quality of E-mail addresses by course type
Course
Total Sample
With Email
Total
Undeliverable
% Of E-Mail Sample
Undeliverable
Higher degree, mainly by research (PhD, DPhil) 3750 542 14%
Higher degree, mainly taught course (MA, MSc) 3948 555 14%
Postgraduate diploma or certificate (inc. PGCE) 3350 668 20%
First Degree (BA, BSc) 25301 4918 19%
Other diploma or certificate 3655 592 16%
Professional Qualification 34 6 18%

Technical Report
Learning and Skills HESA 76
Other qualification 1813 320 18%
No formal qualification 24 3 13%
Quality of E-mail addresses by course subject
Course Subject
Total Sample With
Email Total Undeliverable
% Of E-Mail Sample
Undeliverable
Medicine and Dentistry 903 87 10%
Subjects Allied to Medicine 3717 834 22%
Biological Sciences 3500 601 17%
Veterinary Sciences, Agriculture and
related subjects 540 70 13%
Physical Sciences 1716 283 16%
Mathematical and Computer Sciences 3376 556 16%
Engineering 2500 373 15%
Technologies 409 68 17%
Architecture, Building and Planning 1479 289 20%
Social studies 3362 637 19%
Law 1769 289 16%
Business and Administrative studies 6185 1167 19%
Mass Communications and
Documentation 1054 198 19%
Linguistics, Classics and related subjects 1315 215 16%
European Languages, Literature and
related subjects 648 82 13%
Eastern, Asiatic, African, American and
Australasian Languages, Literature and
related subjects
218 28 13%
Historical and Philosophical studies 1590 284 18%
Creative Arts and Design 4052 650 16%
Education 3197 795 25%
Combined subjects 345 98 28%

Technical Report
Learning and Skills HESA 77
Quality of E-mail addresses by HEI location
Location Of HEI Total Sample With Email Total Undeliverable
% Of E-Mail Sample
Undeliverable
England 31271 4235 14%
Scotland 3857 455 12%
Wales 2833 698 25%
Northern Ireland 3914 2216 57%

Technical Report
Learning and Skills HESA 78
Online response rates – File A online completes
File A online response rate by gender
Gender Total Sample
Total Sample
With Email
Total
Completes
Response
Rate
(Sample With
Email)
Response
Rate
(Total Sample)
Male 31562 18487 2520 14% 8%
Female 39396 23388 2903 12% 7%
File A response rate by age
Age Total Sample
Total Sample
With Email
Total
Completes
Response
Rate
(Sample With
Email)
Response
Rate
(Total Sample)
25 or under 24147 14675 1599 11% 7%
26 - 30 24636 14460 1957 14% 8%
31 - 40 11787 6794 1008 15% 9%
41 - 50 6900 3956 509 13% 7%
51 + 3475 1982 349 18% 10%
Unknown 13 8 1 13% 8%
File A online response rate by ethnicity
Ethnicity Total Sample
Total Sample
With Email
Total
Completes
Response
Rate
(Sample With
Email)
Response
Rate
(Total Sample)
Any white 49733 29040 4066 14% 8%
Any black 5022 3120 233 7% 5%
Any Asian 5855 3628 296 8% 5%
Any mixed 4590 2850 373 13% 8%
Other Ethnic
background 2702 1737 180 10% 7%
Not known /
Information
refused / Blank
3056 1500 275 18% 9%

Technical Report
Learning and Skills HESA 79
File A online response rate by course type
Course Total Sample
Total Sample
With Email
Total
Completes
Response
Rate
(Sample With
Email)
Response
Rate
(Total Sample)
Higher degree, mainly by
research (PhD, DPhil) 7274 25301 1085 29% 15%
Higher degree, mainly
taught course (MA, MSc) 6285 3948 672 17% 11%
Postgraduate diploma or
certificate (inc. PGCE) 5865 3350 340 10% 6%
First Degree (BA, BSc) 41740 25301 2987 12% 7%
Other diploma or certificate 6840 3655 217 6% 3%
Professional Qualification 46 34 6 18% 13%
Other qualification 2854 1813 114 6% 4%
No formal qualification 54 24 2 8% 4%

Technical Report
Learning and Skills HESA 80
File A online response rate by course subject
Course Subject Total Sample
Total Sample
With Email
Total
Completes
Response
Rate
(Sample With
Email)
Response
Rate
(Total
Sample)
Medicine and Dentistry 1914 903 162 18% 8%
Subjects Allied to Medicine 7075 3717 343 9% 5%
Biological Sciences 6147 3500 530 15% 9%
Veterinary Sciences,
Agriculture and related
subjects
946 540 84 16% 9%
Physical Sciences 3093 1716 361 21% 12%
Mathematical and Computer
Sciences 5624 3376 495 15% 9%
Engineering 4433 2500 419 17% 9%
Technologies 612 409 47 11% 8%
Architecture, Building and
Planning 2435 1479 144 10% 6%
Social studies 5718 3362 483 14% 8%
Law 2937 1769 171 10% 6%
Business and Administrative
studies 9737 6185 574 9% 6%
Mass Communications and
Documentation 1631 1054 91 9% 6%
Linguistics, Classics and
related subjects 2301 1315 225 17% 10%
European Languages,
Literature and related subjects 1090 648 143 22% 13%
Eastern, Asiatic, African,
American and Australasian
Languages, Literature and
related subjects
333 218 48 22% 14%
Historical and Philosophical
studies 2805 1590 295 19% 11%
Creative Arts and Design 6341 4052 443 11% 7%
Education 5316 3197 333 10% 6%
Combined subjects 470 345 32 9% 7%

Technical Report
Learning and Skills HESA 81
File A online response rate by HEI location
Location Of HEI Total Sample
Total Sample
With Email
Total
Completes
Response
Rate
(Sample With
Email)
Response
Rate
(Total Sample)
England 52409 31271 4325 14% 8%
Scotland 8420 3857 686 18% 8%
Wales 4869 2833 291 10% 6%
Northern Ireland 5260 3914 121 3% 2%

Technical Report
Learning and Skills HESA 82
Appendix H(2) – Quality of e-mail addresses by key demographics (File B)
Quality of E-mail addresses by gender
Total Sample With Email Total Undeliverable
% Of E-Mail Sample
Undeliverable
Male 61643 9885 16%
Female 91988 15993 17%
Quality of E-mail addresses by age
Age Total Sample With Email Total Undeliverable
% Of E-Mail Sample
Undeliverable
25 or under 60929 9700 16%
26 - 30 48450 7690 16%
31 - 40 21175 3786 18%
41 - 50 14984 3056 20%
51 + 8050 1637 20%
Unknown 43 9 21%
Quality of E-mail addresses by ethnicity
Ethnicity Total Sample With Email Total Undeliverable
% Of E-Mail Sample
Undeliverable
Any white 130294 22652 17%
Any black 4319 623 14%
Any Asian 12191 1469 12%
Any mixed 954 158 17%
Other Ethnic background 0 0 N/A
Not known / Information
refused / Blank 5873 976 17%

Technical Report
Learning and Skills HESA 83
Quality of E-mail addresses by course type
Course
Total Sample With
Email Total Undeliverable
% Of E-Mail Sample
Undeliverable
Higher degree, mainly by research (PhD,
DPhil) 82 17 21%
Higher degree, mainly taught course
(MA, MSc) 20621 3276 16%
Postgraduate diploma or certificate (inc.
PGCE) 17597 2815 16%
First Degree (BA, BSc) 104009 17669 17%
Other diploma or certificate 7561 1471 19%
Professional Qualification 202 21 10%
Other qualification 3479 601 17%
No formal qualification 80 8 10%
Quality of E-mail addresses by course subject
Course Subject
Total Sample With
Email Total Undeliverable
% Of E-Mail Sample
Undeliverable
Medicine and Dentistry 2786 348 12%
Subjects Allied to Medicine 15774 2824 18%
Biological Sciences 13503 2147 16%
Veterinary Sciences, Agriculture and
related subjects 1520 229 15%
Physical Sciences 6039 988 16%
Mathematical and Computer Sciences 9180 1340 15%
Engineering 6522 879 13%
Technologies 1099 205 19%
Architecture, Building and Planning 3922 664 17%
Social studies 14066 2555 18%
Law 7660 1237 16%
Business and Administrative studies 19123 3178 17%
Mass Communications and
Documentation 4215 771 18%
Linguistics, Classics and related subjects 7016 1170 17%
European Languages, Literature and
related subjects 2722 439 16%
Eastern, Asiatic, African, American and
Australasian Languages, Literature and
related subjects
770 134 17%
Historical and Philosophical studies 8030 1591 20%

Technical Report
Learning and Skills HESA 84
Creative Arts and Design 14904 2380 16%
Education 12734 2190 17%
Combined subjects 2046 609 30%
Quality of E-mail addresses by HEI location
Location Of HEI Total Sample With Email Total Undeliverable
% Of E-Mail Sample
Undeliverable
England 132436 20984 16%
Scotland 10219 1294 13%
Wales 8491 2138 25%
Northern Ireland 2485 1462 59%

Technical Report
Learning and Skills HESA 85
Appendix I – Quality of telephone number and telephone response rates by key demographics
Unusable telephone sample
Unusable telephone sample by gender
Gender Total Sample
Total Contactable
At Start Of
Telephone
Fieldwork Unusable Unusable %
Male 31562 23721 5283 22%
Female 39396 30353 6911 23%
Unusable telephone sample by age
Age Total Sample
Total Contactable
At Start Of
Telephone
Fieldwork Unusable Unusable %
25 or under 24147 19388 4395 23%
26 - 30 24636 18700 4658 25%
31 - 40 11787 8239 2184 27%
41 - 50 6900 5220 1091 21%
51 + 3475 2518 402 16%
Unknown 13 9 4 44%
Unusable telephone sample by ethnicity
Ethnicity Total Sample
Total Contactable
At Start Of
Telephone
Fieldwork Unusable Unusable %
Any white 49733 37874 8657 23%
Any black 5022 4010 1024 26%
Any Asian 5855 4659 1125 24%
Any mixed 4590 3433 899 26%
Other Ethnic
background 2702 2060 502 24%
Not known /
Information refused
/ Blank
3056 2038 527 26%

Technical Report
Learning and Skills HESA 86
Unusable telephone sample by course type
Course Total Sample
Total Contactable
At Start Of
Telephone
Fieldwork Unusable Unusable %
Higher degree,
mainly by research
(PhD, DPhil)
7274 3885 1021 26%
Higher degree,
mainly taught
course (MA, MSc)
6285 4270 1028 24%
Postgraduate
diploma or
certificate (inc.
PGCE)
5865 4656 1047 22%
First Degree (BA,
BSc) 41740 33339 7668 23%
Other diploma or
certificate 6840 5484 1363 25%
Professional
Qualification 46 35 4 11%
Other qualification 2854 2371 593 25%
No formal
qualification 54 34 10 29%

Technical Report
Learning and Skills HESA 87
Unusable telephone sample by course subject
Course Subject Total Sample
Total Contactable
At Start Of
Telephone
Fieldwork Unusable Unusable %
Medicine and Dentistry 1914 1241 319 26%
Subjects Allied to Medicine 7075 5562 1259 23%
Biological Sciences 6147 4462 1082 24%
Veterinary Sciences, Agriculture
and related subjects 946 757 158 21%
Physical Sciences 3093 2063 513 25%
Mathematical and Computer
Sciences 5624 4279 1040 24%
Engineering 4433 3312 821 25%
Technologies 612 493 107 22%
Architecture, Building and
Planning 2435 1858 441 24%
Social studies 5718 4251 1030 24%
Law 2937 2253 565 25%
Business and Administrative
studies 9737 7775 1795 23%
Mass Communications and
Documentation 1631 1363 303 22%
Linguistics, Classics and related
subjects 2301 1654 391 24%
European Languages, Literature
and related subjects 1090 725 205 28%
Eastern, Asiatic, African,
American and Australasian
Languages, Literature and
related subjects
333 206 64 31%
Historical and Philosophical
studies 2805 1922 440 23%
Creative Arts and Design 6341 5227 1211 23%
Education 5316 4261 908 21%
Combined subjects 470 410 82 20%

Technical Report
Learning and Skills HESA 88
Unusable telephone sample by HEI location
Location of HEI
Total
Sample
Total Contactable
At Start Of
Telephone
Fieldwork Unusable Unusable %
England 52409 38720 9259 24%
Scotland 8420 6317 1630 26%
Wales 4869 4046 943 23%
Northern Ireland 5260 4991 909 18%

Technical Report
Learning and Skills HESA 89
Telephone response rates
Telephone response rate by gender
Gender Total Sample
Total Contactable
At Start Of
Telephone
Fieldwork Total Completes Response Rate
Male 31562 23721 8783 37%
Female 39396 30353 11471 38%
Telephone response rate by age
Age Total Sample
Total Contactable
At Start Of
Telephone
Fieldwork Total Completes Response Rate
25 or under 24147 19388 7203 37%
26 - 30 24636 18700 6504 35%
31 - 40 11787 8239 2864 35%
41 - 50 6900 5220 2368 45%
51 + 3475 2518 1311 52%
Unknown 13 9 4 44%
Telephone response rate by ethnicity
Ethnicity Total Sample
Total Contactable
At Start Of
Telephone
Fieldwork Total Completes Response Rate
Any white 49733 37874 14794 39%
Any black 5022 4010 1272 32%
Any Asian 5855 4659 1700 36%
Any mixed 4590 3433 1115 32%
Other Ethnic
background 2702 2060 688 33%
Not known /
Information refused
/ Blank
3056 2038 685 34%

Technical Report
Learning and Skills HESA 90
Telephone response rate by course type
Course Total Sample
Total Contactable
At Start Of
Telephone
Fieldwork Total Completes Response Rate
Higher degree,
mainly by research
(PhD, DPhil)
7274 3885 1374 35%
Higher degree,
mainly taught
course (MA, MSc)
6285 4270 1523 36%
Postgraduate
diploma or
certificate (inc.
PGCE)
5865 4656 1875 40%
First Degree (BA,
BSc) 41740 33339 12447 37%
Other diploma or
certificate 6840 5484 2057 38%
Professional
Qualification 46 35 14 40%
Other qualification 2854 2371 949 40%
No formal
qualification 54 34 15 44%

Technical Report
Learning and Skills HESA 91
Telephone response rate by course subject
Course Subject Total Sample
Total Contactable
At Start Of
Telephone
Fieldwork
Total
Completes
Response
Rate
Medicine and Dentistry 1914 1241 415 33%
Subjects Allied to Medicine 7075 5562 2253 41%
Biological Sciences 6147 4462 1639 37%
Veterinary Sciences, Agriculture and
related subjects 946 757 307 41%
Physical Sciences 3093 2063 776 38%
Mathematical and Computer Sciences 5624 4279 1635 38%
Engineering 4433 3312 1236 37%
Technologies 612 493 173 35%
Architecture, Building and Planning 2435 1858 701 38%
Social studies 5718 4251 1544 36%
Law 2937 2253 714 32%
Business and Administrative studies 9737 7775 2674 34%
Mass Communications and
Documentation 1631 1363 489 36%
Linguistics, Classics and related
subjects 2301 1654 631 38%
European Languages, Literature and
related subjects 1090 725 230 32%
Eastern, Asiatic, African, American and
Australasian Languages, Literature and
related subjects
333 206 67 33%
Historical and Philosophical studies 2805 1922 796 41%
Creative Arts and Design 6341 5227 1897 36%
Education 5316 4261 1888 44%
Combined subjects 470 410 189 46%

Technical Report
Learning and Skills HESA 92
Telephone response rate by HEI location
Location of HEI
Total
Sample
Total Contactable
At Start Of
Telephone
Fieldwork
Total
Completes
Response
Rate
England 52409 38720 14276 37%
Scotland 8420 6317 2246 36%
Wales 4869 4046 1603 40%
Northern Ireland 5260 4991 2129 43%

Technical Report
Learning and Skills HESA 93
Appendix J – Postal response rates by key demographics
Postal response rate by gender
Gender Total Sample Total In Mailout Total Completes
Total Response
Rate
Male 31562 16742 1218 7%
Female 39396 20803 2443 12%
Postal response rate by age
Age Total Sample Total In Mailout Total Completes
Total Response
Rate
25 or under 24147 13350 1284 10%
26 - 30 24636 13458 1116 8%
31 - 40 11787 6292 605 10%
41 - 50 6900 3169 384 12%
51 + 3475 1271 272 21%
Unknown 13 5 0 0%
Postal response rate by ethnicity
Ethnicity Total Sample Total In Mailout Total Completes
Total Response
Rate
Any white 49733 25542 2879 11%
Any black 5022 3141 180 6%
Any Asian 5855 3264 173 5%
Any mixed 4590 2591 198 8%
Other Ethnic
background 2702 1492 86 6%
Not known /
Information
refused / Blank
3056 1515 145 10%

Technical Report
Learning and Skills HESA 94
Postal response rate by course type
Course Total Sample Total In Mailout Total Completes
Total Response
Rate
Higher degree,
mainly by research
(PhD, DPhil)
7274 3499 539 15%
Higher degree,
mainly taught
course (MA, MSc)
6285 3109 317 10%
Postgraduate
diploma or
certificate (inc.
PGCE)
5865 2959 300 10%
First Degree (BA,
BSc) 41740 22677 2142 9%
Other diploma or
certificate 6840 3764 247 7%
Professional
Qualification 46 21 3 14%
Other qualification 2854 1491 111 7%
No formal
qualification 54 25 2 8%

Technical Report
Learning and Skills HESA 95
Postal response rate by course subject
Course Subject
Total
Samp
le Total In Mailout Total Completes
Total Response
Rate
Medicine and Dentistry 1914 1044 133 13%
Subjects Allied to Medicine 7075 3674 395 11%
Biological Sciences 6147 3328 382 11%
Veterinary Sciences, Agriculture
and related subjects 946 458 56 12%
Physical Sciences 3093 1594 212 13%
Mathematical and Computer
Sciences 5624 2954 209 7%
Engineering 4433 2287 189 8%
Technologies 612 347 30 9%
Architecture, Building and
Planning 2435 1303 89 7%
Social studies 5718 3040 329 11%
Law 2937 1666 125 8%
Business and Administrative
studies 9737 5492 478 9%
Mass Communications and
Documentation 1631 913 80 9%
Linguistics, Classics and related
subjects 2301 1173 123 10%
European Languages, Literature
and related subjects 1090 597 73 12%
Eastern, Asiatic, African,
American and Australasian
Languages, Literature and
related subjects
333 184 19 10%
Historical and Philosophical
studies 2805 1361 176 13%
Creative Arts and Design 6341 3339 238 7%
Education 5316 2573 293 11%
Combined subjects 470 218 32 15%

Technical Report
Learning and Skills HESA 96
Postal response rate by HEI location
Location of HEI Total Sample Total In Mailout Total Completes
Total Response
Rate
England 52409 28399 2677 9%
Scotland 8420 4296 466 11%
Wales 4869 2522 277 11%
Northern Ireland 5260 2328 241 10%