djamila
TRANSCRIPT

3rd International Conference on Advances in Engineering & Technology
Dr. Harimi Djamila
26th and 27th December 2014
Thermal Comfort Scales in the Equatorial Fully Humid Climate of Malaysia

2
OUTLINE OF THE PRESENTATION
TITLE: Thermal Comfort Scales in the Equatorial Fully Humid Climate of Malaysia

OUTLINE OF THE PRESENTATION
• Definition: Thermal Comfort
• Parameters
• Thermal Comfort Scales
• Thermal Preference Scales
• Current Investigation
• Observations
• Conclusions

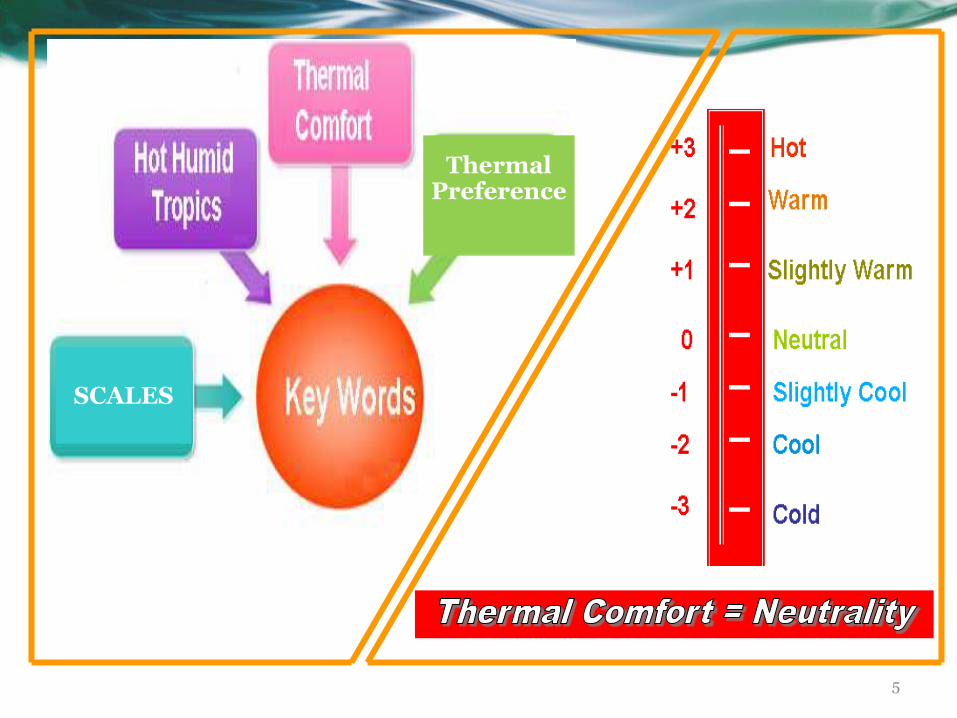
4
Definition: Thermal Comfort
TITLE: Thermal Comfort Scales in the Equatorial Fully Humid Climate of Malaysia
5
SCALES
Thermal Preference

Parameters
Thermal Comfort
Air Temperature
Air Movement
Clothing Insulation
&
Metabolic Rate
Mean Radiant
Temperature
Relative Humidity

7
Thermal Comfort Scales
TITLE: Thermal Comfort Scales in the Equatorial Fully Humid Climate of Malaysia

Table 2 SHASE Scale
Table 1 ASHRAE Scale
Table 3 Bedford Scale
Table 4 Subjective Scale of Warmth Sensation
Excessively
cold
Cold cool Comfortably
cool
Comfortable
and neither
cool nor
warm
Comfortably
warm
Warm Hot Excessively Hot
Much too
cool
Too cool Slightly cool Comfortable Slightly
warm
Too warm Much too
warm
Very cold Cold Slightly Cold Neutral
(neither cold not hot)
Slightly
hot
Hot Very hot
Cold Cool Slightly
Cool
Neutral Slightly
warm
Warm Hot

- Is ASHRAE scale is a universal scale?
- Should the scale be adjusted according to thepopulation under investigation?
- Which is the best methodology to approach thisissue? For instance when it is better to increase thenumber of scale points?
Questions raised:

The implication of each question on subjects’ votes
• How do you feel about the indoor air temperature
at this moment?
• How do you feel just now ?
• How do you perceive the temperature in this space
at this moment?
• Now, how do you feel the air temperature?

11
Thermal Preference Scales
TITLE: Thermal Comfort Scales in the Equatorial Fully Humid Climate of Malaysia

Table 5: McIntyre Preference Scale
Warmer No change Cooler
Table 6: Adjusted McIntyre Preference Scale
Comfortably cool comfortable
(neither cool nor
warm)
Comfortably warm Others, please
specify
Table 7: Five-point Preference Scale
Much
warmer
A bit warmer No change A bit cooler Much cooler

13
Thermal Preference Scales
TITLE: Thermal Comfort Scales in the Equatorial Fully Humid Climate of Malaysia

Table 5: McIntyre Preference Scale
Warmer No change Cooler
Table 6: Adjusted McIntyre Preference Scale
Comfortably cool comfortable
(neither cool nor
warm)
Comfortably warm Others, please
specify
Table 7: Five-point Preference Scale
Much
warmer
A bit warmer No change A bit cooler Much cooler

Cold Cool Slightly
Cool
Neutral Slightly
warm
Warm Hot
Cold Cool Slightly
Cool
Neutral Slightly
warm
Warm Hot
How do you find the indoor thermal environment now
How do you prefer the indoor thermal environment now

16
Current Investigation
TITLE: Thermal Comfort Scales in the Equatorial Fully Humid Climate of Malaysia

Current Issue
The aim of the study is to investigate thedesired ASHRAE thermal sensation versus theASHRAE sensation scale in the hot (warm?)humid tropics of Malaysia. This study wascarried out in university classrooms by meansof both objective and subjective approaches.

Map of Sabah That Zooms In the Location of UMS

Location of Engineering Faculty in UMS

Typical Classrooms in Block A of Engineering Faculty

Equipment

22
Observations
TITLE: Thermal Comfort Scales in the Equatorial Fully Humid Climate of Malaysia

Date Month Time
Survey
location
Air
Conditioning
NO OF
STUDENTS
7 5 15:45 BT9 ON 24
7 5 19:45 BT5 ON 26
7 5 21:30 BT9 OFF 28
8 5 8:50 BT18 ON 25
8 5 10:48 BT14 ON 10
8 5 14:45 BT23 OFF 21
8 5 19:50 BT4 ON 22
Table 8 Description of the collected data

Table 9 Descriptive statistic of air temperature
Statistic Std. ErrorMean 28.93 .169
95% Confidence Interval for Mean
Lower Bound 28.60
Upper Bound 29.27
5% Trimmed Mean 28.96
Median 27.90
Std. Deviation 1.909
Minimum 26
Maximum 31Skewness -.168 .215Kurtosis -1.291 .427

Table 10 Descriptive statistics of thermal sensation (ASHRAE scale)
StatisticStd. Error
Mean .55 .130
95% Confidence Interval for Mean
Lower Bound .29
Upper Bound .80
5% Trimmed Mean .57
Median .00
Std. Deviation 1.468
Minimum -3
Maximum 3
Skewness .225 .215Kurtosis -.493 .427

Table 11 Descriptive statistic of the desired thermal sensation (ASHRAE scale)
Statistic Std. ErrorMean -.81 .095
95% Confidence Interval for Mean
Lower Bound -1.00
Upper Bound -.62
5% Trimmed Mean -.81
Median -1.00
Std. Deviation 1.070
Minimum -3
Maximum 3
Skewness -.030 .215
Kurtosis -.154 .427

Some Observations…
The minimum and maximum record of air-temperature varies from 26 to 310C having a range of 60C
The mean votes when using ASHRAE scale was 0.55 whereas the desired mean votes is –0.81 which is almost close to one scale unit
Students may have preferred lower indoor temperature below neutrality when subjected to a mean temperature value of 28.90C
This certainly will affect the energy consumption as reported by the same authors

Cold Cool Slightly cool Neutral Slightly warm Warm Hot
•How do you feel at the moment?
Scale Discrete Continuous
Similar observation was reported earlier by Humphreys andHancock for their case study carried out in the UK. They reportedthat the desired thermal sensation could on occasion lead to up toone scale unit in their estimate how much warmer or cooler peoplewould like to feel.
Some Observations
0-1-2-3 1 2 3

29
Conclusions
TITLE: Thermal Comfort Scales in the Equatorial Fully Humid Climate of Malaysia

Conclusions
• Scale
• Preference Versus Neutral
• Further Future Investigations

Q.A.
Thank You