division of aging (da) - · pdf filedivision of aging (da) participant experience survey ......
TRANSCRIPT

Division of Aging (DA)
PARTICIPANT EXPERIENCE SURVEY (PES) RESULTS QUARTERLY REPORT
1st QUARTER FY 2014
September 30, 2013
REPORT PREPARED BY: Liberty of Indiana
440 N. Meridian Street, Suite 200 Indianapolis, IN 46204
317-974-0980
Michael J. Thomas, Assistant Project Director Christopher S. Baglio, Project Director
Karen Peret, Vice President, Operations, IDD Division

1
Participant Experience Survey Results Quarterly Report
July 2013 – September 2013
INTRODUCTION
The Participant Experience Survey (PES) was designed by MEDSTAT Group for the federal Centers for Medicare and Medicaid Services, an Agency of The Department of Health and Human Services. This has proved to be a functional tool for Indiana to 1) drive the waiver participant Person Centered Comprehensive assessment Tool (PCCT) and 2) gauge waiver participant satisfaction. For participants of the Aged and Disabled (A&D) and Traumatic Brain Injury (TBI) waivers Liberty of Indiana conducts the PES on a statistically valid sample of waiver participants proportionate by Area Agency.
This report summarizes PES data collected since October 1, 2011, through September 30, 2013. To date Liberty has collected satisfaction data for two years on participants with Brain Injury (BI) and who are Elderly and Disabled (ED). For Child and Youth (CY) participants, data has been collected since January 1, 2012, one quarter shy of two years.
Respondents’ answers from last quarter 07/01/2013-09/30/2013 are listed below for each grouping of satisfaction questions (data listed in bullet points). In addition bar graphs are included with data from 10/01/2011-09/30/2012 compared to 10/01/2012-09/30/2013 under each grouping of questions for ED and BI. Bar graphs are included with data from 01/01/20/12-12/31/2012 compared to the past three quarters under each grouping of questions for CY. Additional bar graphs and pie charts are included for specific quarterly performance areas
During this quarter 31 ED and three (3) CY satisfaction interviews were completed with participants of the A&D waiver. Twenty-six (26) BI and one (1) CY satisfaction interview(s) was completed with participants of the TBI waiver. A summary and analysis follows.
Elderly and Disabled – 31 Interviews
The Elderly and Disabled PES tool has four sections of questions, for a total of 66 questions as defined in the attached PES Data Table. These are as follows:
A. Access to Care B. Choice and Control C. Respect/Dignity D. Community Integration/Inclusion.
Section five has a place for interviewer comments, but does not ask any questions of the person being interviewed.
Based on certain criteria such as age or the answers that precede it, not all questions are answered by all people. For example, people who are over 65 are not required to complete the section that asks about work.

2
SECTION A: Access to Care
This section has a total of 35 questions divided into 11 different groupings of questions. “Groupings” refer to items that are related to one another and follow a chain of questions to reflect participants’ access to care. Group #1 Assistance with Bathing (questions 1-3): In this first Grouping, the questions are: Does respondent need assistance to bathe, if so, do they ever go without bathing and if so, is this because they lack the necessary supports? The first question has 4 available responses: Yes, No, Unclear, and No Response. The other 2 questions have 5 available responses: Yes, No, Unsure, Unclear, and No Response. Critical concerns and respondent data for the last quarter include the following:
Assistance Needed to Bathe – 26 Goes Without Bathing – 6 Supports Unavailable to Bathe – 3
Group #2 Assistance with Dressing (questions 4-6): In this second Grouping, the questions are: Does respondent need assistance to dress, if so, do they ever go without dressing, and if so, is it because they lack the necessary supports? The first question has 4 available responses: Yes, No, Unclear, and No Response. The other 2 questions have 5 available responses: Yes, No, Unsure, Unclear, and No Response. Critical concerns and respondent data for the last quarter include the following:
Assistance Needed to Dress – 20
Goes Without Dressing – 4
Supports Unavailable to Dress – 2
89%
14%27%
83%
27%
63%
0%20%40%60%80%
100%
Assistance Needed to Bathe
Goes Without Bathing Supports Unavailable to Bathe
Bathing
10/01/11 ‐ 09/30/12
10/01/12 ‐ 09/30/13
75%
11%
50%64%
11%
73%
0%20%40%60%80%
100%
Assistance Needed to Dress
Goes Without Dressing Supports Unavailable to Dress
Dressing
10/01/11 ‐ 09/30/12
10/01/12 ‐ 09/30/13

3
Group #3: Assistance to get out of Bed (questions 7-9): In this third Grouping, the questions are: Does respondent need assistance to get out of bed, if so, do they ever go without getting out of bed and if so, is this because they lack the necessary supports? The first question has 4 available responses: Yes, No, Unclear, and No Response. The other 2 questions have 5 available responses: Yes, No, Unsure, Unclear, and No Response. Critical concerns and respondent data for the last quarter include the following:
Assistance to Get Out of Bed – 13
Goes Without Getting Out of Bed – 2
Supports Unavailable to Get Out of Bed – 1
Group #4: Assistance to eat (questions 10-12): In this fourth Grouping the questions are: Does respondent need assistance to eat, if so, do they ever go without eating and if so, is this because they lack the necessary supports? The first question has 4 available responses: Yes, No, Unclear, and No Response. The other 2 questions have 5 available responses: Yes, No, Unsure, Unclear Response and No Response. Critical concerns and respondent data for the last quarter include the following:
Assistance to Eat – 6
Goes Without Eating – 2
Supports Unavailable to Eat – 0
Group #5: Assistance to make meals (questions 13-15): In this fifth Grouping the questions are: Does someone need assistance to make meals, if so, are they ever unable to make a meal and if so, is this because they lack the necessary supports? The first question has 5 responses including NA because they receive their food via a G-
48%
9%20%
34%
13%
57%
0%
20%
40%
60%
80%
100%
Assistance Needed to Get Out of Bed
Goes Without Getting Out of Bed
Supports Unavailable to Get Out of Bed
Getting Out of Bed
10/01/11 ‐ 09/30/12
10/01/12 ‐ 09/30/13
30%
0% 0%
20% 16%0%
0%20%40%60%80%
100%
Assistance Needed to Eat Goes Without Eating Supports Unavailable to Eat
Eating
10/01/11 ‐ 09/30/12
10/01/12 ‐ 09/30/13

4
tube. The other 2 questions have 5 available responses: Yes, No, Unsure, Unclear, and No Response. Critical concerns and respondent data for the last quarter include the following:
Assistance to Make Meals – 26
Goes Without Making a Meal – 3
Supports Unavailable to Make a Meal – 3
Group #6: Assistance to Get Groceries (questions 16-18): In this sixth Grouping the questions are: Does respondent need assistance to get groceries, if so, are they ever unable to get groceries and if so, is this because they lack the necessary supports? The first question has 5 responses, including NA because they receive their food via a G-tube. The other 2 questions have 5 available responses: Yes, No, Unsure, Unclear, and No Response. Critical concerns and respondent data for the last quarter include the following:
Assistance to Get Groceries – 30
Goes Without Getting Groceries – 2
Supports Unavailable to Get Groceries – 1
Group #7: Assistance to do Housework (questions 19-21): In this seventh Grouping the questions are: Does someone need assistance to do housework, if so, are they ever unable to get housework done and if so, is this because they lack the necessary supports? The first question has 4 available responses: Yes, No, Unclear, and No Response. The other 2 questions have 5 available responses: Yes, No, Unsure, Unclear, and No Response. Critical concerns and respondent data for the last quarter include the following:
Assistance With Housework Needed – 31
89%
6%
33%
86%
8%
64%
0%20%40%60%80%
100%
Assistance Needed to Make a Meal
Goes Without Making a Meal
Supports Unavailable to Make Meals
Making a Meal
10/01/11 ‐ 09/30/12
10/01/11 ‐ 09/30/12
97%
9%
64%
92%
9%
69%
0%20%40%60%80%
100%
Assistance Needed to Get Groceries
Goes Without Getting Groceries
Supports Unavailable to Get Groceries
Getting Groceries
10/01/11 ‐ 09/30/12
10/01/12 ‐ 09/30/13

5
Goes Without Housework Getting Done – 9
Supports Unavailable to Get Housework Done – 7
Group #8: Assistance to do Laundry (questions 22-24): In this eighth Grouping the questions are: Does respondent need assistance to do laundry, if so, are they ever unable to get laundry done and if so, is this because they lack the necessary supports? The first question has 4 available responses: Yes, No, Unclear, and No Response. The other 2 questions have 5 available responses: Yes, No, Unsure, Unclear, and No Response. Critical concerns and respondent data for the last quarter include the following:
Assistance Needed with Laundry – 28
Goes Without Laundry – 6
Supports Unavailable to Get Laundry Done – 2
Group #9: Assistance to take medicine (questions 26-28): In this ninth grouping the questions are: Does someone need assistance to take medicine, if so, are they ever unable to take their medicine and if so, is this because they lack the necessary supports? The first question has 4 available responses: Yes, No, Unclear, and No Response. The other 2 questions have 5 available responses: Yes, No, Unsure, Unclear, and No Response. Critical concerns and respondent data for the last quarter include the following:
Assistance Taking Medication – 19
Goes Without Medication – 3
Supports Unavailable to Take Medication – 1
95%
20%
43%
97%
16%
72%
0%
20%
40%
60%
80%
100%
Assistance Needed With Housework
Goes Without Housework Getting Done
Supports Unavailable to Get Housework Done
Housework
10/01/11 ‐ 09/30/13
10/01/12 ‐ 09/30/13
92%
17%
42%
93%
15%
59%
0%
20%
40%
60%
80%
100%
Assistance Needed With Laundry
Goes Without Laundry Getting Done
Supports Unavailable to Get Laundry Done
Laundry
10/01/11 ‐ 09/30/12
10/01/12 ‐ 09/30/13

6
Group #10: Get to or use the Bathroom (questions 29-31): In this tenth Grouping the questions are: Does respondent need assistance to get to or use the bathroom, if so, are they ever unable to get to or use the bathroom and if so, is this because they lack the necessary supports? The first question has 4 available responses: Yes, No, Unclear, and No Response. The other 2 questions have 5 available responses: Yes, No, Unsure, Unclear, and No Response. Critical concerns and respondent data for the last quarter include the following:
Assistance to Get to, or Use Bathroom – 12
Goes Without Bathroom – 4
Supports Unavailable to Get to, or Use Bathroom – 1
Group #11: Equipment or changes to make life easier (questions 33-35): In this eleventh Grouping the questions are: Does someone need equipment or changes in their home to make life easier and, if so, did they get the equipment or were changes made to the home to make their life easier? Number 33 has five available responses: Yes, No, Unsure, Unclear, and No Response. Number 34 asks the person to describe any changes they have requested or were completed. Number 35 also has a response of “in process”. Critical concerns and respondent data for the last quarter include the following:
Equipment Needed – 21
Equipment Not Received – 2
71%
13%
45%
68%
14%
47%
0%
20%
40%
60%
80%
100%
Assistance Taking Medication
Goes Without Medication
Supports Unavailable to Take Medication
Medication
10/01/11 ‐ 09/30/12
10/01/12 ‐ 09/30/13
52%
27% 29%39%
23% 29%
0%20%40%60%80%
100%
Assistance With Bathroom
Goes Without Bathroom Supports Unavailable to Use Bathroom
Bathroom
10/01/11 ‐ 09/30/12
10/01/12 ‐ 09/30/13

7
Section A: Access to Care also has 2 additional questions, #25 and #32, unrelated to any grouping: # 25: “Can the person always go to the places they want such as the doctor, work, shopping or a friend’s house?” This item has five available responses: Yes, No, Unsure, Unclear, and No Response. Critical concerns and respondent data for the last quarter include the following:
Yes – 29
No – 11
Unsure – 1
Unclear – 0
No Response – 0
#32 “Think about the people who are paid to help you with the everyday activities we have been discussing. Do they spend all the time with you that they are supposed to?” This item has six available responses: Yes, No, Unsure, Unclear, No Response, and No Home Support Staff.
Yes – 25 No – 0 Unsure – 0 Unclear – 1 No Response – 0 No Home Support Staff – 5
57%
9%
61%
12%
0%
20%
40%
60%
80%
100%
Equipment Needed Equipment Not Received
Equipment
10/01/11 ‐ 09/30/12
10/01/12 ‐ 09/30/13
84%
12%
78%
20%
0%
20%
40%
60%
80%
100%
Get to go to places you want Doesn't get to go to places you want
Community Outings
10/01/11 ‐ 09/30/12
10/01/12 ‐ 09/30/13

8
SECTION B: Choice and Control:
This section has a total of nine questions categorized into three Groupings. In this section, we will focus on those questions that reflect the Positive responses because those yield more useful information.
Group #1: Choice of Paid Support Staff (questions 36-38): In this group the questions are: Does the person choose his/her personal care staff? If not would they like to choose their personal care staff? Do they know they can choose their personal care staff? The first question has six available responses: Yes, No, Unsure, Unclear, No Response and No Personal Care staff. The other two questions have five available responses: Yes, No, Unsure, Unclear, and No Response. Respondent answers from last quarter are as follows:
Chooses Personal Care Staff – 13
Wants to Choose Personal Care Staff – 11
Knows They Can Change Personal Care Staff – 35
Group #2: Tells staff what they want help with (questions 39-40): In this group the questions are: Does the person tell staff what they want help with? For those who did not, would they like to tell them what they want help with? Question 39 has 6 available responses: Yes, No, Sometimes, Unclear, Unsure and No Response. Respondent answers for last quarter are as follows:
Tells Staff What They Want Help With – 24
Would Like to Tell Staff What They Want Help With – 0
42%25%
82%
36%24%
78%
0%20%40%60%80%100%
Chooses Personal Care Staff
Would Like to Choose Personal Care Staff
Knows They Can Change Personal Care Staff
Personal Care Staff Choice
10/01/11 ‐ 09/30/12
10/01/12 ‐ 09/30/13
82% 84%85% 87%
0%
20%
40%
60%
80%
100%
Tells Staff About Needs Would Like to Tell Staff
Tells Staff About Needs
10/01/11 ‐ 09/30/12
10/01/12 ‐ 09/30/13
9
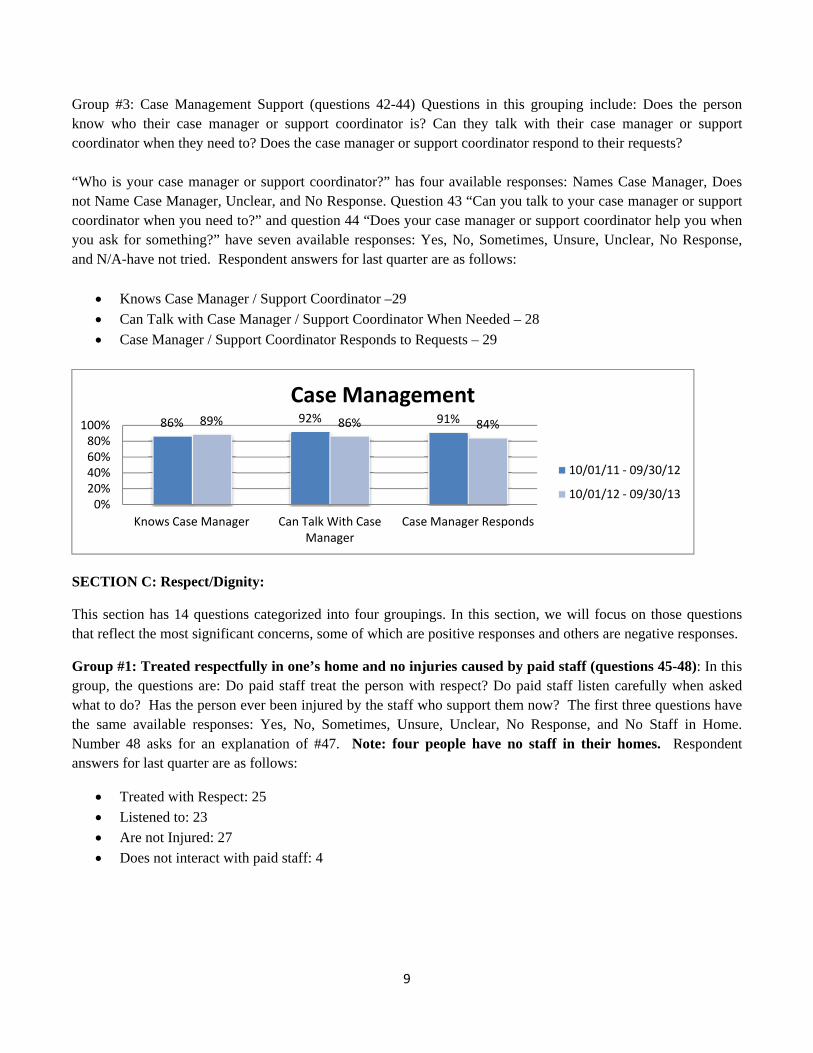
Group #3: Case Management Support (questions 42-44) Questions in this grouping include: Does the person know who their case manager or support coordinator is? Can they talk with their case manager or support coordinator when they need to? Does the case manager or support coordinator respond to their requests? “Who is your case manager or support coordinator?” has four available responses: Names Case Manager, Does not Name Case Manager, Unclear, and No Response. Question 43 “Can you talk to your case manager or support coordinator when you need to?” and question 44 “Does your case manager or support coordinator help you when you ask for something?” have seven available responses: Yes, No, Sometimes, Unsure, Unclear, No Response, and N/A-have not tried. Respondent answers for last quarter are as follows:
Knows Case Manager / Support Coordinator –29
Can Talk with Case Manager / Support Coordinator When Needed – 28
Case Manager / Support Coordinator Responds to Requests – 29
SECTION C: Respect/Dignity:
This section has 14 questions categorized into four groupings. In this section, we will focus on those questions that reflect the most significant concerns, some of which are positive responses and others are negative responses.
Group #1: Treated respectfully in one’s home and no injuries caused by paid staff (questions 45-48): In this group, the questions are: Do paid staff treat the person with respect? Do paid staff listen carefully when asked what to do? Has the person ever been injured by the staff who support them now? The first three questions have the same available responses: Yes, No, Sometimes, Unsure, Unclear, No Response, and No Staff in Home. Number 48 asks for an explanation of #47. Note: four people have no staff in their homes. Respondent answers for last quarter are as follows:
Treated with Respect: 25
Listened to: 23
Are not Injured: 27
Does not interact with paid staff: 4
86% 92% 91%89% 86% 84%
0%20%40%60%80%
100%
Knows Case Manager Can Talk With Case Manager
Case Manager Responds
Case Management
10/01/11 ‐ 09/30/12
10/01/12 ‐ 09/30/13

10
Group #2: No one treats the person unkindly or takes items without asking (questions 49-52): In this group the questions are: Are staff mean to the person? Has staff taken things without asking? Questions 49 and 51 are the only ones with quantifiable responses; the others are sections for comments from the person regarding the events. Question #49 has six available responses: Yes, No, Sometimes, Unsure, Unclear, and No Response. Question #51 does not ask if this occurs sometimes. Respondent answers for last quarter are as follows:
Staff are not mean to the person: 27
Staff do not take things without asking: 26
Group #3: Person attends day program and is treated with respect (questions 53-55): The questions in this grouping include: Does the person attend a day program? Do paid staff treat the person with respect? Do paid staff listen carefully when asked what to do? Number 53 has five available responses: Yes, No, Unsure, Unclear, and No response. Questions 54 and 55 have six available responses: Yes, No, Sometimes, Unsure, Unclear, and No Response. If the person does not attend a day program, then questions 54 and 55 are not answered. Respondent answers for last quarter are as follows:
Attends day program: 0
Treated respectfully by paid staff at the day program: 0
Listened to by paid staff at the day program: 0
88% 84%95%89%
82%94%
0%
20%
40%
60%
80%
100%
Treated With Respect Listened To Are Not Injured by Staff
Respect / Injury
10/01/11 ‐ 09/30/12
10/01/12 ‐ 09/30/13
91% 93%92% 91%
0%
20%
40%
60%
80%
100%
Staff Are Not Mean to Person Staff Do Not Take Things Without Asking
Staff Behavior
10/01/11 ‐ 09/30/12
10/01/12 ‐ 09/30/13

11
Group #4: Person rides a van or uses other transportation services and is treated with respect (questions 56-58). Questions in this grouping are: Does the person use a van or other transportation services? Does paid staff treat the person with respect? Does paid staff listen carefully when asked what to do? Number 56 has five available responses, Yes, No, Unsure, Unclear, and No response. Questions 57 and 58 have six available responses: Yes, No, Sometimes, Unsure, Unclear, and No Response. If the person does not use a van or other transportation services, then questions 57 and 58 are not answered. Respondent answers for last quarter are as follows:
Uses van or other transportation services: 4
Is treated with respect by paid staff: 4
Is listened to by paid staff: 4
SECTION D: Community Inclusion and Integration:
This section has seven questions categorized into two groupings. In this section, we will focus on those questions that reflect the most significant concerns, some of which are positive responses and others are negative responses.
Group #1: Person wants to do something outside the home that they do not do now (questions 59-60): Questions in this grouping are: Does the person want to go anywhere that they do not go now? Only #59 has available responses. These are: Yes, No, Unsure, Unclear, and No Response. Question 60 is available for any comments by the person being interviewed.
Wants to go somewhere they don’t go now – 15
8%
90% 89%
6%
100%80%
0%20%40%60%80%
100%
Attends Day Program Treated Respectfully by Paid Staff
Listened to by Paid Staff at Day Program
Day Program / Respect
10/01/11 ‐ 09/30/12
10/01/12 ‐ 09/30/13
39%
85% 89%
25%
95% 93%
0%
20%
40%
60%
80%
100%
Use Van or Other Transportation Service
Is Treated With Respect by Paid Staff
Listened to by Paid Staff
Use of Transportation / Respect
10/01/11 ‐ 09/30/12
10/01/12 ‐ 09/30/13

12
Group #2: Work related items (questions 61-65): Questions in this grouping are: Does the person work? Do they want to work? Did they help pick their current job? Do they like their job? Question 61 asks if the person is working now. If the response is No, then questions 64-65 are skipped. Additionally, this section is not completed for those 65 and older. There were 19 respondents for this section. Question 62 does not have an available response but asks the person what kind of work they do. All other questions have five available responses: Yes, No, Unsure, Unclear, and No Response. Respondent answers for last quarter are as follows:
Has a Job: 0 (0%)
Wants to work: 4 (27%)
Helped pick their current Job: 0 (0%)
Likes their Job: 0 (0%)
CONCLUSIONS/ANALYSIS:
Quarterly Period 07/01/2013 – 09/30/2013 The Elderly and Disabled PES data from this quarterly period was provided along with data collected from 10/01/2011-09/30/2012 compared to 10/01/2012-09/30/2013. Overall participants’ satisfaction in the areas of Choice and Control showed improvement in year II. Community Integration and Respect and Dignity maintained consistent levels of satisfaction in years I and II. Satisfaction in Access to Care declined in Year II. In most cases respondents were more satisfied with their independence and need for fewer services in Year II than in year one; however, the level of satisfaction with accomplishing personal care or getting assistance with personal care was less favorable in year II than in year I. This could likely be a result of receiving less service due to greater independence. The Division should consider assessing Level of Care determination to ensure personal care needs are adequately assessed. In addition, case managers may facilitate an increase in natural supports that may provide a level of assistance when paid staff are not available.
Bathing:
Increase in percentage of participants interviewed in year II who go without bathing.
Increase in percentage of participants interviewed in year II who go without bathing because supports are unavailable.
Dressing: Increase in percentage of participants interviewed in year II who go without dressing because supports are unavailable.
Getting out of bed:
Increase in percentage of participants interviewed in year II who go without getting out of bed.
Increase in percentage of participants interviewed in year II who go without getting out of bed because supports are unavailable.
Eating: Increase in percentage of participants interviewed in year II who go without eating because supports are unavailable.
Meals:
Slight increase in percentage of participants interviewed in year II who go without making meals.
Increase in percentage of participants interviewed in year II who go without making meals because supports are unavailable.
Groceries:
Slight increase in percentage of participants interviewed in year II who go without groceries because supports are unavailable.
13
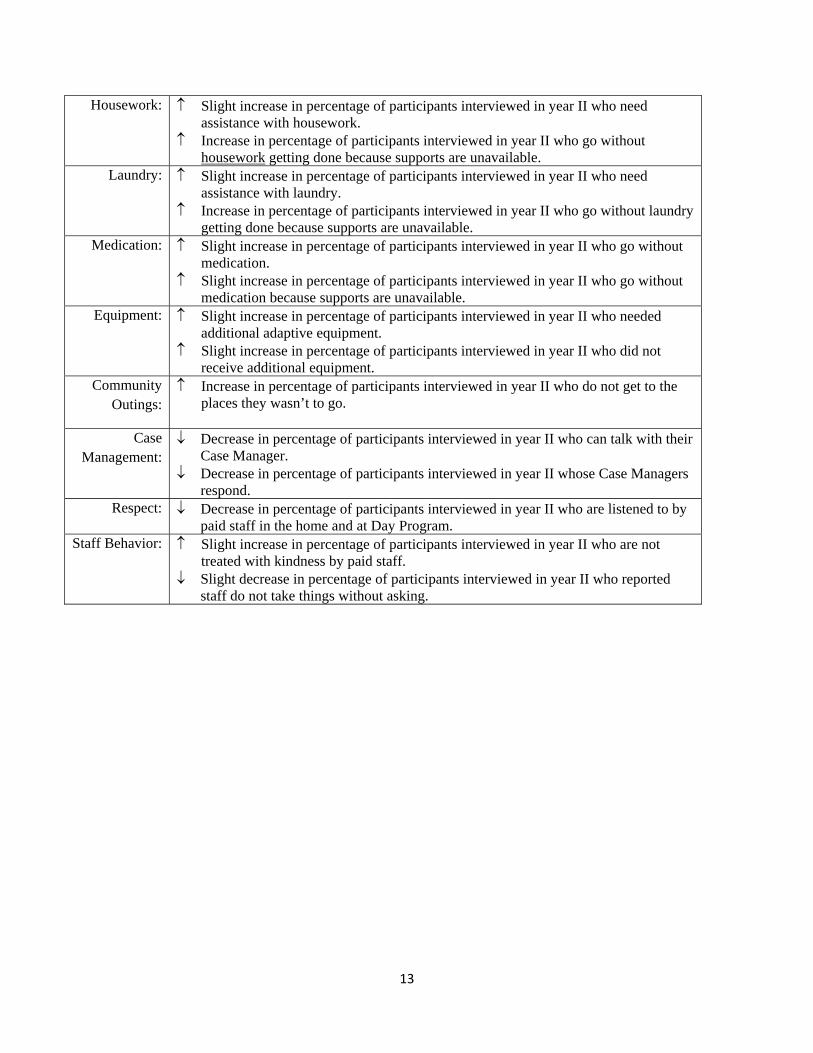
Housework:
Slight increase in percentage of participants interviewed in year II who need assistance with housework.
Increase in percentage of participants interviewed in year II who go without housework getting done because supports are unavailable.
Laundry:
Slight increase in percentage of participants interviewed in year II who need assistance with laundry.
Increase in percentage of participants interviewed in year II who go without laundry getting done because supports are unavailable.
Medication: Slight increase in percentage of participants interviewed in year II who go without medication.
Slight increase in percentage of participants interviewed in year II who go without medication because supports are unavailable.
Equipment: Slight increase in percentage of participants interviewed in year II who needed additional adaptive equipment.
Slight increase in percentage of participants interviewed in year II who did not receive additional equipment.
Community Outings:
Increase in percentage of participants interviewed in year II who do not get to the places they wasn’t to go.
Case Management:
Decrease in percentage of participants interviewed in year II who can talk with their Case Manager.
Decrease in percentage of participants interviewed in year II whose Case Managers respond.
Respect: Decrease in percentage of participants interviewed in year II who are listened to by paid staff in the home and at Day Program.
Staff Behavior: Slight increase in percentage of participants interviewed in year II who are not treated with kindness by paid staff.
Slight decrease in percentage of participants interviewed in year II who reported staff do not take things without asking.

14
Brain Injury – 26 Interviews
The Brain Injury PES has 102 questions categorized into the following five sections:
A. Program Supports B. Choice and Control C. Respect and Dignity D. Community Activities/Integration E. ADL/IADL
Section six has a place for interviewer comments, but does not ask any questions of the person being interviewed.
Based on certain criteria such as age or the answers that precede it, not all questions are answered by all people. For example, people who are over 65 are not required to complete the section that asks about work.
SECTION A: Program Supports
There are a total of 16 questions categorized into 3 groupings. “Groupings” refers to items that are related to one another and follow a chain of questions to reflect the access to care for that area. Group #1: Participant Living Arrangements (questions 1-6): Respondent answers for last quarter are as follows: Do you like where you live?
Like where they live: 25
Like who you share home with (if applicable): 21
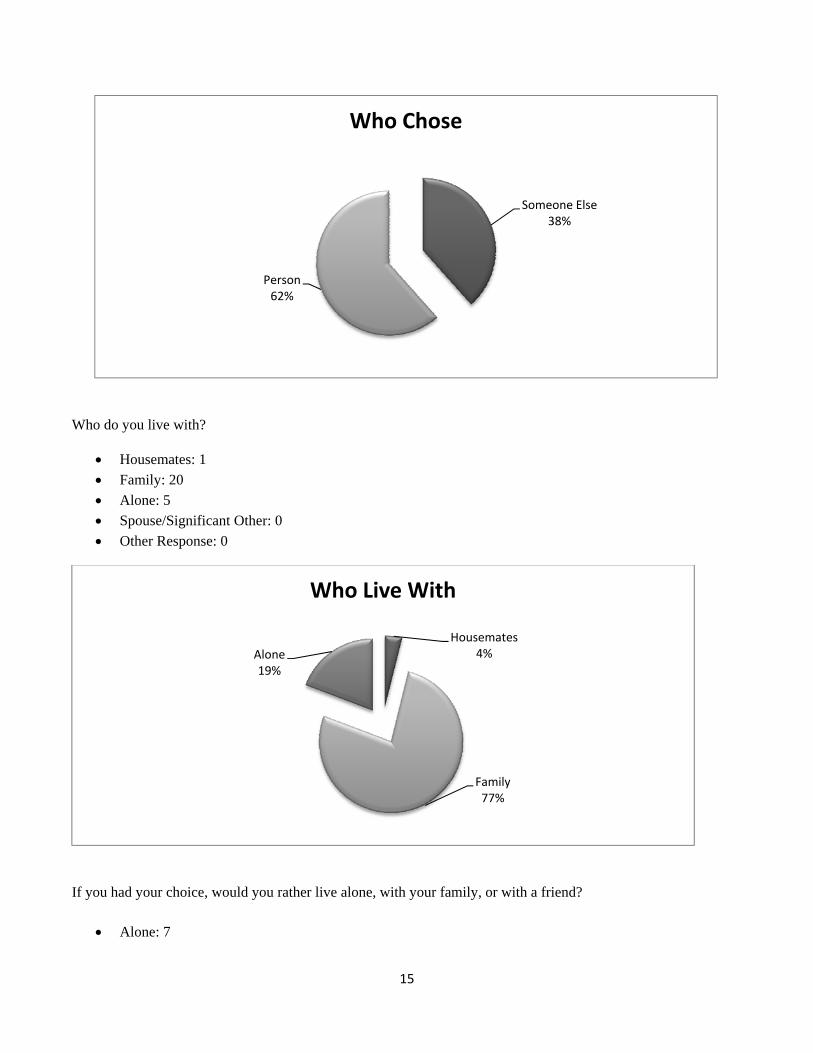
Who chose (this/that) place to live?
I did or I helped to choose: 16
Someone else did: 10
Unsure or I don’t remember: 0
79% 75%87%
67%
0%
20%
40%
60%
80%
100%
Like Where They Live Like Who They Share Home With
Living Arrangements
10/01/11 ‐ 09/30/12
10/01/12 ‐ 09/30/13
15
Who do you live with?
Housemates: 1
Family: 20
Alone: 5
Spouse/Significant Other: 0
Other Response: 0
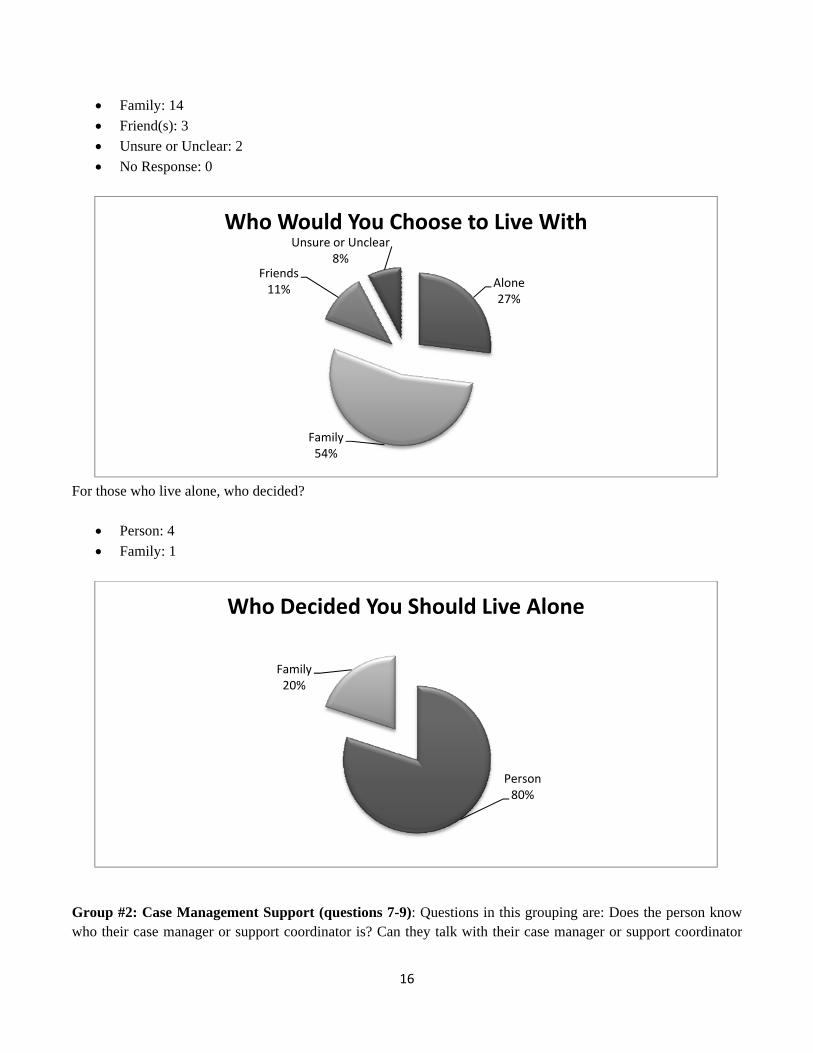
If you had your choice, would you rather live alone, with your family, or with a friend?
Alone: 7
Someone Else38%
Person62%
Who Chose
Housemates4%
Family77%
Alone19%
Who Live With
16
Family: 14
Friend(s): 3
Unsure or Unclear: 2
No Response: 0
For those who live alone, who decided?
Person: 4
Family: 1
Group #2: Case Management Support (questions 7-9): Questions in this grouping are: Does the person know who their case manager or support coordinator is? Can they talk with their case manager or support coordinator
Alone27%
Family54%
Friends11%
Unsure or Unclear8%
Who Would You Choose to Live With
Person80%
Family20%
Who Decided You Should Live Alone

17
when they need to? Does the case manager or support coordinator respond to their requests? Respondent answers for last quarter are as follows:
Knows case manager/support coordinator by name: 21
Can talk with case manager/support coordinator when needed: 23
Case manager/support coordinator responds to requests: 23
Group #3: Equipment/Services or changes to make life easier (questions 10-15): Questions in this grouping are: Does respondent need equipment or changes in their home to make life easier and, if so, did they get the equipment or were changes made to the home to make their life easier? The same questions were asked about services. Questions 11 and 14 don’t have formal responses. Respondent answers for last quarter are as follows:
Equipment or changes needed: 18
Equipment or changes not made: 8
Services requested: 7
Services not provided: 4
SECTION B: Choice and Control:
There are a total of nine questions, eight questions categorized into two groupings and one question that is unrelated to either grouping. Group #1: Choice of Paid Support Staff (questions 16-18): Questions in this grouping are: Does the person choose his/her personal care staff? For those who didn’t would they like to choose their personal care staff? Do
79%91% 85%
69% 75% 80%
0%
20%
40%
60%
80%
100%
Knows CM/SC Can Talk With CM/SC CM/SC is Responsive
Case Manager
10/01/11 ‐ 09/30/12
10/01/12 ‐ 09/30/13
45%
67%
37%
63%47% 42% 47% 42%
0%
20%
40%
60%
80%
100%
Equipment or Changes Needed
Equipment Changes Made
Services Requested
Services Provided
Equipment / Services
10/01/11 ‐ 09/30/12
10/01/12 ‐ 09/30/13

18
they know they can choose their personal care staff? Note: two people have no personal care staff. Respondent answers for last quarter are as follows:
Chooses Personal Care Staff: 17 Wants to choose Personal Care Staff: 5
Knows they can change Personal Care Staff: 24
Group #2: Tells staff what they want help with (questions 19-24): Questions in this grouping are: Does the person tell staff what they want help with? If not, would they like to tell them what they want help with? Do the people paid to help you do a good job helping you? Do the people paid to help you spend all the time with you that they are supposed to? Do you think the people paid to help you understand what it is like to have a brain injury? Respondent answers for last quarter are as follows:
Tells staff what they want help with: 23
Would like to tell staff what they want help with (if currently not telling): 23
Staff do a good job helping: 21
Staff spend required time with person: 22
Staff understand what it is like to have a brain injury: 11
Question 23 asks who the respondent would contact to get any problems “fixed.” Respondent answers for last quarter are as follows:
No One: 1
Family/Friend: 11
43%24%
86%
56%
20%
85%
0%20%40%60%80%
100%
Chooses Personal Care Staff
Wants to Choose Personal Care Staff
Knows They Can Change Personal Care Staff
Staff Choice
10/01/11 ‐ 09/30/12
10/01/12 ‐ 09/30/13
84% 91% 89% 84%
39%
82% 84% 87% 91%
47%
0%20%40%60%80%
100%
Tells Staff
What They
Want Help
With
Would
Like to Tell
Staff
Staff do a
Good Job
Helping
Staff
Spen
d
Req
uired
Time With
Person
Staff
Empathize
With TBI
Tells About Help
10/01/11 ‐ 09/30/12
10/01/12 ‐ 09/30/13

19
Case Manager/Support Coordinator/Other Staff: 13
Other: 10
SECTION C: Respect/Dignity:
This section has a total of 17 questions categorized into two groupings. In this section, we will focus on those questions that reflect the most significant concerns, some of which are positive responses and others are negative responses.
Group #1: Treated respectfully in one’s home/workplace by paid staff (questions 25-32): Questions in this grouping are: Do paid staff in the home treat the person with respect? Do paid staff in the home listen carefully when asked what to do? Do staff enter room only with permission? Do staff take things without permission? Do paid staff at work/day program treat the person with respect? Do paid staff at work/day program listen carefully when asked what to do? Respondent answers for last quarter are as follows:
Treated with Respect by Home Staff: 23
Listened to by Home Staff: 22
Come into Room Only With Permission: 23
Do not Take Things Without Permission: 25
Day Staff Treat person with Respect: 5 of 6
Day Staff Listen: 5 of 6
**N/A for day staff, no day staff outside home
Group #2: No one treats the person inappropriately (questions 35-41): Questions in this grouping are: Is anyone mean to the person? Does anyone injure the person? Does anyone ever touch the person in ways that they don’t like? Respondent answers for last quarter are as follows:
Those mean to the person (sometimes): 0
Those injure the person: 0
Those inappropriately touch the person: 1 (participant couldn’t elaborate, but is getting support for the issue)
83% 85% 85%95%
72% 67%85% 82% 89% 96%
50% 50%
0%20%40%60%80%
100%
Home Staff
Treat With
Respect
Home Staff
Listen
Enter Room
With
Permission
Do Not Take
Things
Without
Permission
Day Staff
Treat With
Respect
Day Staff
Listen
Respect
10/01/11 ‐ 09/30/12
10/01/12 ‐ 12/31/13

20
SECTION D: Community Inclusion and Integration:
This section has a total of 22 questions categorized into three groupings. In this section, we will focus on those questions that reflect the most significant concerns, some of which are positive responses and others are negative responses.
Group #1: Paid or volunteer work, day programming (questions 42-46): Questions in this grouping are: Do you have a job or other activity you do during the day, like school or a day program? Do you like your job/day program/volunteer work/other? Who chose the (job/day program/volunteer work/other) you go to now? If not do you want to do volunteer or paid work or another activity, such as school? Note that question 43 does not have an available response that can be analyzed. Respondent answers for last quarter are as follows:
Has a Job or Other Activity During Day: 6
Likes Job or Day Activity: 6
Would Like Volunteer or Paid Work or Another Activity: 5
Who chose the (job/day program/volunteer work/other)?
I Did or I Helped: 4
Someone Else: 2
8%1% 0%4% 0% 4%
0%
20%
40%
60%
80%
100%
Mean Caused Injury Touched Inappropriately
Staff Behavior
10/01/11 ‐ 09/30/12
10/01/12 ‐ 09/13/13
40%30% 38%
24% 20%38%
0%20%40%60%80%
100%
Has Job or Other Day Activity
Likes Job or Day Activity Would Like Volunteer, Paid Work or Other
Activity
Job or Day Activity
10/01/11 ‐ 09/30/12
10/01/12 ‐ 09/30/13

21
Group #2: Community Access (questions 47-51): Questions in this grouping are: Do you always have a ride to the places you need to go? Are you allowed to go out in your community without supervision when you want to? If not do you know why not? Do you have a chance to do things in your community when you want to? Can you do more for yourself now than when you first started receiving services? Note, question 48 asks if the person is allowed to go out in their community without supervision when they want. Unless the response is No or Sometimes, then question 50 is skipped. Respondent answers for last quarter are as follows:
Always able to have a ride to places the person needs to go: 23
Allowed to go in community without supervision: 10
For those who cannot, they are aware of the reason: 13
Can do things in the community when desired: 16
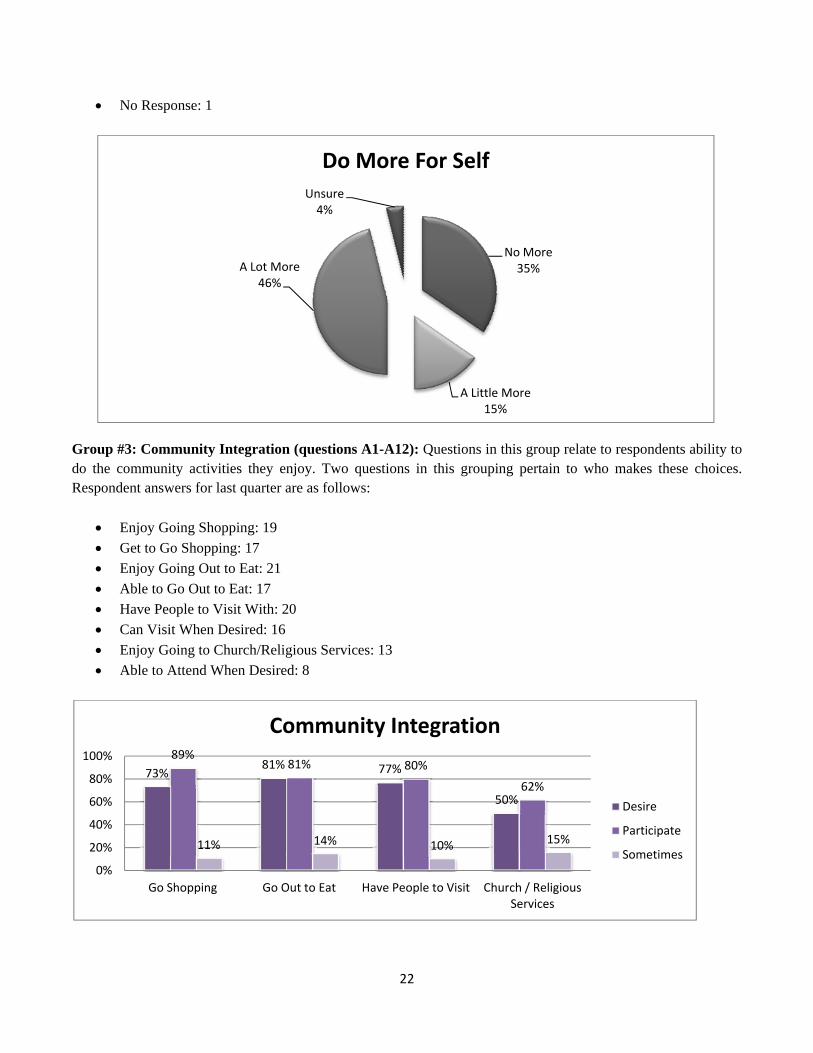
Can you do more for yourself now than when you first started receiving services from this program?
No More: 9
A Little More: 4
A Lot More: 12
Person67%
Someone Else33%
Who Chose Your Job
70%
23%
69%53%
85%
33%
84%
58%
0%20%40%60%80%100%
Always Able to Have a Ride
Allowed to Go on Community Without
Supervision
For Those who Cannot, They
Know Reason Why
Can Do things in Community When
Desired
Community Access
10/01/11 ‐ 09/30/12
10/01/12 ‐ 09/30/13
22
No Response: 1
Group #3: Community Integration (questions A1-A12): Questions in this group relate to respondents ability to do the community activities they enjoy. Two questions in this grouping pertain to who makes these choices. Respondent answers for last quarter are as follows:
Enjoy Going Shopping: 19
Get to Go Shopping: 17
Enjoy Going Out to Eat: 21
Able to Go Out to Eat: 17
Have People to Visit With: 20
Can Visit When Desired: 16
Enjoy Going to Church/Religious Services: 13
Able to Attend When Desired: 8
No More35%
A Little More15%
A Lot More46%
Unsure4%
Do More For Self
73%81% 77%
50%
89%81% 80%
62%
11% 14% 10% 15%
0%
20%
40%
60%
80%
100%
Go Shopping Go Out to Eat Have People to Visit Church / Religious Services
Community Integration
Desire
Participate
Sometimes

23
SECTION E: Adaptive Daily Living (ADL/IADL):
This section has a total of 38 questions categorized into 11 groupings. In this section, we will focus on those questions that reflect the most significant concerns, some of which are positive responses and others are negative responses.
Group #1: Assistance with Bathing (questions B1-B4): Questions in this grouping are: Do you need assistance to bathe? Does anyone ever make you shower or take a bath when you are not ready? Do you sometimes not get a bath or shower when you need one? If so, is this because they lack the necessary supports? Respondent answers for last quarter are as follows:
Assistance with Bathing: 21
Made to Shower or Bathe: 2
Goes without Bathing: 2
Supports Unavailable to Bathe: 0
Group #2: Assistance with Dressing (questions B5-B8): Questions in this grouping are: Does you need assistance to dress? Does anyone ever make you dress when you are not ready? Are you sometimes unable to get dressed when you need to? If so, is this because you lack the necessary supports? Respondent answers for last quarter are as follows:
Assistance Needed to Dress: 20
Made to Dress: 1
Goes without Dressing: 1
Supports Unavailable to Dress: 1
70%
8% 2%
50%64%
9% 6% 0%0%20%40%60%80%
100%
Assistance Needed to Bathe
Made to Shower or Bathe
Goes Without Bathing
Supports Unavailable to
Bathe
Bathing
10/01/11 ‐ 09/30/12
10/01/12 ‐ 09/30/13

24
Group #3: Assistance Getting out of Bed (questions B9-B12): Questions in this grouping are: Do you sometimes need assistance to get out of bed? Does anyone ever make you get out of bed when you are not ready? Are you sometimes unable to get out of bed when you need to? If so, is this because you lack the necessary supports? Respondent answers for last quarter are as follows:
Assistance Getting Out of Bed: 11
Made to Get Out of Bed: 2
Unable to Get Out of Bed: 1
Supports Unavailable to Get Out of Bed: 0
Group #4: Assistance to Eat (questions B13-B17): Questions in this grouping are: Do you need assistance to eat? Does anyone ever make you eat when you are not ready? Are you sometimes unable to eat when you need to? If so, is this because you lack the necessary supports? Respondent answers for last quarter are as follows:
Assistance Needed to Eat: 9
Unable to Eat: 0
Supports Unavailable to Eat: 0
57%
10% 4% 0%
58%
3% 6%
100%
0%20%40%60%80%
100%
Assistance Needed to Dress
Made to Dress Goes Without Dressing
Supports Unavailable to
Dress
Dressing
10/01/11 ‐ 09/30/12
10/01/12 ‐ 09/30/12
41%22%
6%
50%40%
23%9%
50%
0%20%40%60%80%
100%
Assistance Needed to Get Out of Bed
Made to Get Out of Bed
Goes Without Getting Out of Bed
Supports Unavailable to Get
Out of Bed
Getting Out of Bed
10/01/11 ‐ 09/30/12
10/01/12 ‐ 09/30/13

25
This grouping also included a question for those who indicated the required assistance, Who chooses what you eat? One respondent reported requiring assistance needed to eat and that someone else choose what they ate.
Group #5: Assistance to Make Meals (questions B18-B20): Questions in this grouping are: Do you need assistance to make meals, if so, are you ever unable to get a meal, and if so, is this because you lack the necessary supports? Respondent answers for last quarter are as follows:
Assistance to make Meals: 25
Goes without making a Meal: 0
Supports Unavailable to make a Meal: 0
Group #6: Assistance to Get Groceries (questions B21-B24): Questions in this grouping are: Do you need assistance to get groceries, if so do you choose your own groceries, if so, are you ever unable to get groceries and if so, is this because you lack the necessary supports? Respondent answers for last quarter are as follows:
Assistance to get Groceries: 24
Chooses Groceries: 19
Goes without getting Groceries: 1
Supports unavailable to get Groceries: 0
33%
7% 0%
29%
0% 0%0%
20%
40%
60%
80%
100%
Assistance Needed to Eat Goes Without Eating Supports Unavailable to Eat
Eating
10/01/11 ‐ 09/30/12
10/01/12 ‐ 09/30/13
79%
1% 0%
80%
2% 0%0%
20%
40%
60%
80%
100%
Assistance to Make Meals
Goes Without Making Meals
Supports Unavailable to Make Meals
Making Meals
10/01/11 ‐ 09/30/12
10/01/12 ‐ 09/30/13

26
Who chooses the groceries you get?
Group #7: Assistance to do House/Yard Work (questions B25-B27) Questions in this grouping are: Do you need assistance to do house/yard work, if so, are you ever unable to get house/yard work done and if so, is this because you lack the necessary supports? Respondent answers for last quarter are as follows:
Assistance to do House/Yard Work: 24
Goes without getting House/Yard Work done:30
Supports Unavailable to complete House/Yard Work: 0
84% 81%
3%
50%
85%77%
6% 0%0%20%40%60%80%
100%
Assistance to Get Groceries
Chooses Groceries Goes Without Getting Groceries
Supports Unavailable to Get
Groceries
Groceries
10/01/11 ‐ 09/30/12
10/01/12 ‐ 09/30/13
I Do79%
Someone Else17%
No Response4%
Who Chooses Groceries

27
Group #8: Assistance to do Laundry (questions B28-B30): Questions in this grouping are: Do you need assistance to do laundry, if so, are you ever unable to get laundry done, and if so, is this because you lack the necessary supports? Respondent answers for last quarter are as follows:
Assistance needed with Laundry: 26
Goes without getting Laundry done: 1
Supports Unavailable to do Laundry: 0
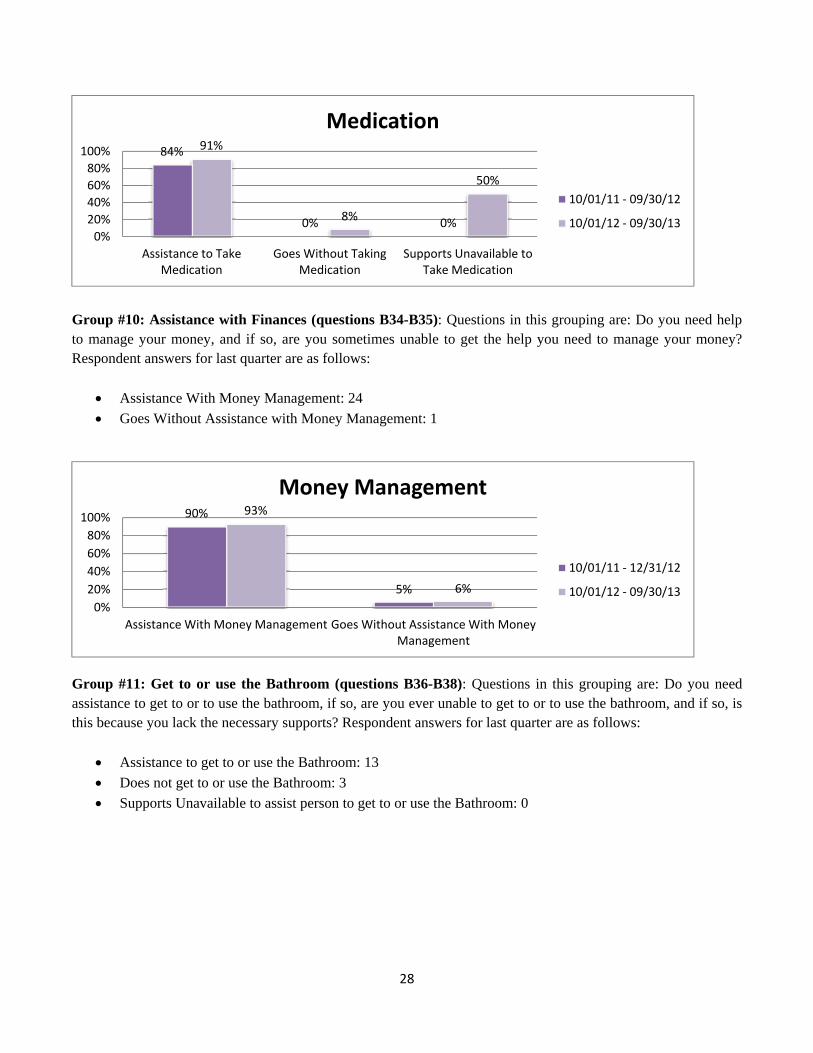
Group #9: Assistance to take medicine (questions B31-B33): Questions in this grouping are: Do you need assistance to take medicine, if so, are you ever unable to take your medicine and if so, is this because you lack the necessary supports? Respondent answers for last quarter are as follows:
Assistance to take Medicine: 23
Goes without taking Medicine: 1
Supports Unavailable to take Medicine: 1
83%
10%29%
87%
10%20%
0%20%40%60%80%
100%
Assistance Needed With House/Yard Work
Goes Without House/Yard Work
Supports Unavailable for House/Yard Work
House / Yard Work
10/01/11 ‐ 09/30/12
10/01/12 ‐ 09/30/13
85%
9%29%
93%
4%
50%
0%20%40%60%80%100%
Assistance Needed With Laundry
Goes Without Laundry Supports Unavailable for Laundry
Laundry
10/01/11 ‐ 09/30/12
10/01/12 ‐ 09/30/13
28
Group #10: Assistance with Finances (questions B34-B35): Questions in this grouping are: Do you need help to manage your money, and if so, are you sometimes unable to get the help you need to manage your money? Respondent answers for last quarter are as follows:
Assistance With Money Management: 24
Goes Without Assistance with Money Management: 1
Group #11: Get to or use the Bathroom (questions B36-B38): Questions in this grouping are: Do you need assistance to get to or to use the bathroom, if so, are you ever unable to get to or to use the bathroom, and if so, is this because you lack the necessary supports? Respondent answers for last quarter are as follows:
Assistance to get to or use the Bathroom: 13
Does not get to or use the Bathroom: 3
Supports Unavailable to assist person to get to or use the Bathroom: 0
84%
0% 0%
91%
8%
50%
0%
20%
40%
60%
80%
100%
Assistance to Take Medication
Goes Without Taking Medication
Supports Unavailable to Take Medication
Medication
10/01/11 ‐ 09/30/12
10/01/12 ‐ 09/30/13
90%
5%
93%
6%
0%
20%
40%
60%
80%
100%
Assistance With Money Management Goes Without Assistance With Money Management
Money Management
10/01/11 ‐ 12/31/12
10/01/12 ‐ 09/30/13

29
CONCLUSIONS/ANALYSIS:
Quarterly period (07/01/2013-09/30/2013) The Brain Injury data from this quarterly period was provided along with data collected from 10/01/2011-09/30/2012 compared to 10/01/2012-09/30/2013. Overall participants’ expressed above average satisfaction in the areas of Choice and Control and Community Activities/Inclusion. Areas with noted decreased satisfaction in year II included Program Supports, Respect and Dignity and Adaptive Daily Living. Further, onsite visits of the day program appear warranted given the reference to staff behavior and reduction in satisfaction within that type of setting. As previously discussed it would behoove the state to assess the LOC determination tools to ensure individuals are receiving optimal services based on required need. Also it may be worth exploring ways to enhance workplace assistance and employment opportunities because there are plenty of able bodied individuals with a desire to earn money who could benefit from such placement. This will likely require oversight and shadowing to ensure the waiver participant is getting the needed support at their workshop or job to be successful. Specific notable changes include: Living Arrangements:
Decrease in the percentage of participants interviewed in year II who like
who they share their home with. Case Management:
Decrease in the percentage of participants interviewed in year II who know
their Case Manager by name. Decrease in the percentage of participants interviewed in year II who can
talk their Case Manager. Decrease in the percentage of participants interviewed in year II who believe
their Case Manager is responsive. Equipment / Services: Decrease in the percentage of participants interviewed in year II who
received necessary equipment changes. Decrease in percentage of participants interviewed in year II who received
additional services requested. Respect:
Decrease in the percentage of participants interviewed in year II who
reported to be treated with respect and listened to by day staff. Job or Day Activity:
Decrease in the percentage of participants interviewed in year II who have a
job or other day activity. Decrease in the percentage of participants interviewed in year II who like
their job or day activity. Bathing: Increase in the percentage of participants interviewed in year II who were
45%
18%
0%
49%
19% 20%
0%
20%
40%
60%
80%
100%
Assistance to Get to/Use the Bathroom
Does Not Get to/Use the Bathroom
Supports Unavailable to Use the Bathroom
Bathroom
10/01/11 ‐ 12/31/12
10/01/12 ‐ 09/30/13

30
made to shower or bathe. Increase in percentage of participants interviewed in year II who go without
bathing. Bed: Slight increase in the percentage of participants interviewed in year II who
were made to get out of bed and go without getting out of bed. Groceries: Increase in the percentage of participants interviewed who require assistance
with getting groceries Decrease in the percentage of participants interviewed in year II who choose
their groceries. Increase in the percentage of participants interviewed who go without
groceries. House/Yard Work: Increase in percentage of participants interviewed in year II who require
assistance with House/Yard Work Laundry: Increase in percentage of participants interviewed in year II who need
assistance with laundry. Increase in percentage of participants interviewed in year II who went
without laundry because supports were unavailable. Medication: Increase in percentage of participants interviewed in year II who needed
assistance to take medication. Increase in percentage of participants interviewed in year II who went
without taking medication. Increase in percentage of participants interviewed in year II who went
without taking medications because supports were unavailable. Money Management: Slight increase in percentage of participants interviewed in year II who need
assistance with money management. Slight increase in percentage of participants interviewed in year II who go
without assistance with money management. Bathroom: Increase in percentage of participants interviewed in year II who need
assistance to use the bathroom. Slight increase in percentage of participants interviewed in year II who do
not get to use the bathroom. Increase in percentage of participants interviewed in year II who do not get
to use the bathroom because supports are unavailable.

31
Children & Youth – 4 Interviews
The Child and Youth PES has a total of 68 questions categorized into the following five sections:
A. Case Management and Service Planning B. Experience with Direct Care Staff C. Health, Welfare and Safety D. Important Long-Term Relationships E. Quality of Life
A sixth section has a place for interviewer comments, but does not ask any questions of the person being interviewed. Based on certain criteria such as the answer to previous questions, not all questions are answered by all youth and their families (e.g., those that pertain to self-directed attendant care). SECTION A: Case Management and Service Planning: There are a total of 17 questions categorized into four groupings. “Groupings” refers to items that are related to one another and follow a chain of questions. Group #1: Respondents reported the following related to Case Management and Communication (questions 1 – 3):
The Case Management Information is Correct: 4
(If no) Knowledge of child’s Case Manager: NA, all info was correct
Family was able to Say What They Wanted During Planning Meeting: 4
Provided Useful Information about Providers During Planning Meeting: 3
Told About Other Services and Programs During Planning Meeting: 3
100%
91%
88%
79%100%
100%
100%
67%100%
100%
100%
100%
100%
100%
75%
75%
0%
20%
40%
60%
80%
100%
Correct CM Info Family Participation in Planning Meeting
Received Useful Provider Info at Planning Meeting
Told About Other Services and Programs at Meeting
Case Management and Communication
01/01/12 ‐ 12/31/12
01/01/13 ‐ 03/31/13
04/01/13 ‐ 06/30/13
07/01/13 ‐ 09/30/13

32
Group #2: Respondents reported the following related to their child’s Plan of Care (questions 4 – 6):
Includes Sufficient Family Input: 4
Plan is Implemented: 4
Question 6 asks the family who they would talk with if they disagreed with, or wanted to change their child’s plan. Respondent answers for last quarter are as follows:
Family or Friend: 0
Direct Care: 0
Case Manager: 4
Other: 0 Group #3: Respondents reported the following related to Case Management Performance (questions 7 – 12):
Case Manager is Available When Needed: 4
Case Manager Treats Family and Child Respectfully: 4
Case Manager Able to Assist with Problems: 4
Services or Support Changes Requested From Case Manager: 3
Requests for Changes Completed by Case Manager: 2 (1 is in process)
Knowledge of Appeal if Requested Services or Supports are Denied: 2
100%91%
100% 100%100% 100%100% 100%
0%
20%
40%
60%
80%
100%
Family Input Into Plan Plan is Implemented
Planning Process
01/01/12 ‐ 12/31/12
01/01/13 ‐ 03/31/13
07/01/13 ‐ 09/30/13
07/01/13 ‐ 09/30/13

33
Group #4: Respondents reported the following related to Case Management Satisfaction (questions 13 – 14):
Satisfied with Case Manager: 4
Knowledge that Family has Ability to Change Child’s Case Manager: 4
SECTION B: Experience with Direct Care Staff: This section has a total of 28 questions categorized into three groupings. The first 19 questions are only applicable for those who receive self-directed attendant care.
Group #1: Respondents reported the following related to Choice (questions 30 – 31):
Are Able to Pick the People Who are Paid to Help Child: 3
(If no) Would like to Pick the People: 1
100%
100%
94%
56% 84%
79%
100%
100%
100%
67%
75%
75%100%
100%
100%
67%
50%
50%100%
100%
100%
75%
67%
67%
0%
20%
40%
60%
80%
100%
CM Available
Family Respectfully Treated by
CM
CM Assists With
Problems
Service Change Request
CM Completed Request
Knowledge of Appeal Process if Denied
Case Management Performance Measures
01/01/12 ‐ 12/31/12
01/01/13 ‐ 03/31/13
04/01/13 ‐ 06/30/13
07/01/13 ‐ 09/30/13
24% 23%
100%
83%
100% 100%100% 100%
0%
20%
40%
60%
80%
100%
Satisfied With CM Knowledge of Ability to Change CM
Case Manager Satisfaction
01/01/12 ‐ 12/31/12
01/01/13 ‐ 03/31/13
04/01/13 ‐ 06/30/13
07/01/13 ‐ 09/30/13

34
Group #2: Respondents reported the following related to Direct Care Staff Performance (questions 32 – 35):
Direct Care Staff Have Enough Time to Fulfill Duties: 4
Direct Care Staff Put in Requisite Time: 4
Direct Care Staff Do a Good Job: 4
Direct Care Staff Treat Child with Respect: 4
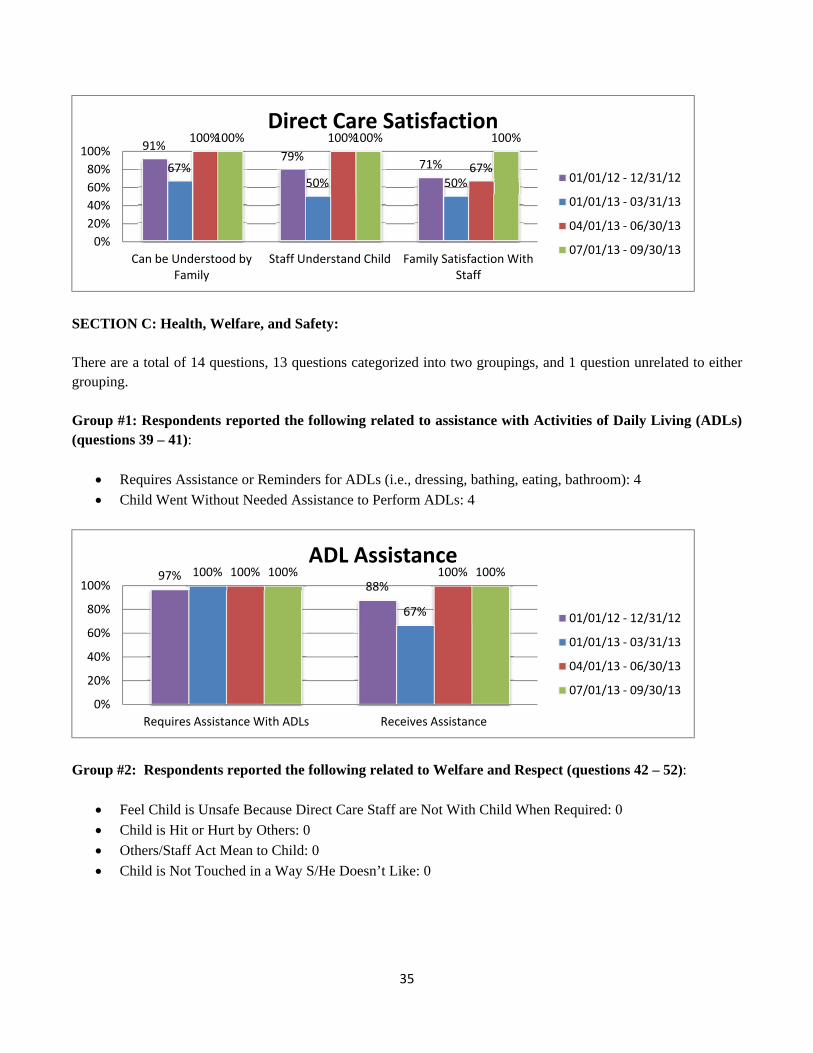
Group #3: Respondents reported the following related to Satisfaction with Direct Care Staff (questions 36 – 38):
Direct Care Staff Can be Understood by Family: 4
Direct Care Staff Understand Child: 4
Satisfaction with Direct Care Staff: 4
68%55%
33%25%
33%
50%
75%
100%
0%
20%
40%
60%
80%
100%
Able to Select Paid Care Givers (if no), Would Like to Select
Care Giver Choice
01/01/12 ‐ 12/31/12
01/01/13 ‐ 03/31/13
04/01/13 ‐ 06/30/13
07/01/13 ‐ 09/30/13
85%
85%
79%
85%
50%
33%
50% 67%100%
100%
100%
100%
100%
100%
100%
100%
0%
20%
40%
60%
80%
100%
Enough Time to Fullfill Duties
Put in Requisite Time
Do a Good Job Treat Child With Respect
Direct Care Performance
01/01/12 ‐ 12/31/12
01/01/13 ‐ 03/31/13
04/01/13 ‐ 06/30/13
07/01/13 ‐ 09/30/13
35
SECTION C: Health, Welfare, and Safety: There are a total of 14 questions, 13 questions categorized into two groupings, and 1 question unrelated to either grouping.
Group #1: Respondents reported the following related to assistance with Activities of Daily Living (ADLs) (questions 39 – 41):
Requires Assistance or Reminders for ADLs (i.e., dressing, bathing, eating, bathroom): 4
Child Went Without Needed Assistance to Perform ADLs: 4
Group #2: Respondents reported the following related to Welfare and Respect (questions 42 – 52):
Feel Child is Unsafe Because Direct Care Staff are Not With Child When Required: 0
Child is Hit or Hurt by Others: 0
Others/Staff Act Mean to Child: 0
Child is Not Touched in a Way S/He Doesn’t Like: 0
91%79%
71%67%50% 50%
100% 100%
67%
100% 100% 100%
0%
20%
40%
60%
80%
100%
Can be Understood by Family
Staff Understand Child Family Satisfaction With Staff
Direct Care Satisfaction
01/01/12 ‐ 12/31/12
01/01/13 ‐ 03/31/13
04/01/13 ‐ 06/30/13
07/01/13 ‐ 09/30/13
97%88%
100%
67%
100% 100%100% 100%
0%
20%
40%
60%
80%
100%
Requires Assistance With ADLs Receives Assistance
ADL Assistance
01/01/12 ‐ 12/31/12
01/01/13 ‐ 03/31/13
04/01/13 ‐ 06/30/13
07/01/13 ‐ 09/30/13

36
Question 52 asks the family who they would talk with if they felt their child was in danger or at risk of being mistreated or abused. Respondent answers for last quarter are as follows:
Family or Friend: 0
Direct Care Staff: 0
Case Manager: 4
Law Enforcement: 0
Other: 0
SECTION D: Important Long-Term Relationships: This section contains a total of 3 questions related to the Importance of Long-Term Relationships (questions 53 – 55). Respondents reported the following:
Child has Friends Who are not Family Members or Paid Staff: 2
Child has a Best Friend, Someone They are Close To: 3
Natural Supports and Unpaid Assistance from Family, Friends, or Neighbors: 2
12% 9% 6% 3%17%
0% 0% 0%0% 0% 0% 0%0% 0% 0% 0%0%
20%
40%
60%
80%
100%
Unsafe Due to Supervision
Child is Hit or Hurt Others/Staff are Mean to Child
Child is Touched in an Inappropriate
Way
Welfare and Respect
01/01/12 ‐ 12/31/12
01/01/13 ‐ 03/31/13
04/01/13 ‐ 06/30/13
07/01/13 ‐ 09/30/13
68%
44%
65%
83%
67%
83%
67% 67% 67%
50%
75%
50%
0%
20%
40%
60%
80%
100%
Child has Friends Child has a Best Friend Unpaid Natural Supports in Place
Long‐Term Relationships
01/01/12 ‐ 12/31/12
01/01/13 ‐ 03/31/13
04/01/13 ‐ 06/30/13
07/01/13 ‐ 09/30/13

37
SECTION E: Quality of Life: This section contains a total of three questions related to the Impact of Services (questions 56 – 58):
As a Result of Child’s Health, Family Members had to: o Quit a job or retire early: 2 o Change jobs: 2 o Change or reduce work hours: 3 o Not take a job in order to care for child: 2 o Turn down a better job or promotion: 0 o None of the above: 0
Services Provided Have Made the Child’s Life: o Better: 4 o About the same: 0 o Worse: 0 o Unclear: 0 o No Response: 0
Paid Support Has Helped Child Do For Themselves: o No more: 2 o A little more: 2 o A lot more: 0 o Unclear response: 0
32%
32% 47%
24%
18%
26%
33%
17%
17%
17%
33% 50%67%
0%
67%
67%
0%
0%50%
50% 75%
50%
0%
0%
0%
20%
40%
60%
80%
100%
Quit Job or Early
Retirement
Change Job Change or Reduce
Work Hours
Not Take a Job
Turn Down a Better Job
None
Impact of Child's Health on Family
01/01/12 ‐ 12/31/12
01/01/13 ‐ 03/31/13
04/01/13 ‐ 06/30/13
07/01/13 ‐ 09/30/13

38
Self Directed Attendant Care Self-directed Attendant Care service is not available under the TBI waiver
CONCLUSIONS/ANALYSIS:
Quarterly period (07/01/2013-09/30/2013) The Children and Youth data from this quarterly period was provided along with data collected from 10/01/2011-09/30/2012 compared to 10/01/2012-09/30/2013. Overall participants’ expressed above average satisfaction in the areas of Case Management and Service Planning, Experience and Direct Care Staff, Health Welfare and Safety, Important Long-Term Relationships and Quality of Life. The only notable issues that stand out include a decrease in children who have friends and an increase in the percentage of respondents who left their job or reduced work hours to take care of family member. Notable changes include: Impact of Child’s Health on Family:
Decrease in the percentage of respondents children who have
friends. Increase in the percentage of respondents who left their job or
reduced their work hours to take care of their child.
No More50%
A Lot More50%
Impact of Support on Independence