divisicns the four - eric · section iv-. laboratory control. m. ... troubleshooting if you have a...
TRANSCRIPT
DOCUMENT RESUME
ED '!53 763 SE 023'479
TITLE Process Control Manua] fcr Aerckic Eiolnicalwastewater Treatment Facilities.
INSTITUTION Environmental Protect4cr igerc.y. hasWingt61, D.C.Cffice cf Water Prograus.
EEPOR210 'ErA-430/9-777-006 ,
PUB DATE Mar 77NOTE 373p.; Contains occasicral matgimal legikility in
-Tables and figures; Phctographessay net ;Eprbduce-I well 3 .
-. -4.
EDES'FRICE MF-30.83 HC-S19.4 rlts restage. .
.
DESCRIPTORS Environmental Educati4n; *Invitermental Technicians;Government PublicaticLs; *Maruals;.Onificipalities;*Sanitary Facilities;'*Sanitation Isprovesent;Wastes; *Water Polluticr'Centrcl;jiater Resource's'
Atit3t.Environmena Protecticp gency; j
/
IDENTIFIERS
ABSTRACT `.
This Environmental Erctecticn,lOncy'(EPA)publication is an operations manual fcr activated iTudge and . -
trickling ,filter wastewater treatment facilities; Ile stated purpose :
of the manual is to provide an on-the4--jcb retereice ter 6Ieratcrs cf -
these tuto types of treatsent plants. The overall objective of th -
manual is to &id the operator in determining 440t process ccntrclland . .
operational measures may to most effective in optimizing th4performance" of his/her particular treatment plant. The manual is .
presented in three major divisicns: (1) activated sludge process, (2y Ak. ,
.
trickling filter process, and (3) appendices. The first two divisions*are each divided' into four sections: (1) trouble'sbocting,r (2) process 1control, (3) fundamentals, and, (4) laboratory centrol. Each section w"concludes with a list of selected references. Ibis publicatidn ,
assumes familiarity with these two aerctic treatment preeesses,r.
but %
ithincludes fundamentals sections in the first two divisicns fortdo.se who may be unfamiliar with these processes. The four ppendicescontain materialon operational records,.plart visit; late atoryequipment, and a glossary. (MR)
r
.**************************************44**********4********************* Reproductions supplied by EDRS axe the best ttat car ke made *
from the origira3 decumett.r*
**************4*********************44*********************************
4 /
V
ft

4
I
41.
c::PnOCESa COM& MANUAL FOR
BEST COPY AYAILNILE
b
4
e
sro_'SP.
*; Art .6sI
I
MUNICIPAL OPERATIONS BRANCHOFfieralfatFOREIVIA OPERATIONSWASHINGTON.0.6720460
4
4
$
I
1
to

A
0
[swim trstostassoutom
1
PROCESS CONTROL MANUALFOR AEROBIC BOILI)GICAL WASTEWATER
TREATMENT FACILITIES
1 1
130001142 WOE MUSS 111{410.106 Ft1381
11
Mlles to lasso tot rams Irmom romouomtiou tAmoaresCarnet Camot.J
44ecrle1-11101 / stows 2.01Isteedftettes IssmOeftt401
f
slams 1.01ItAAANAOAOt4090104A 1
smite 2.02
pNN
team 2.03fottioroamaIf*Igottea
$7=tWM, 2.1
nom 2.051*.t.tlemol
14(am:44.011
sutio4 3.03of ft.........
I
hats WOO tlTIOLALLOOMPIC MOM
COMM
ttO-. TIOrn1 I SLOWS 2.011tatcodratttie. totfO4441111:*
abk1.02tow tw
014ol tof
1tattoo 21OperatIowelOotfes
ttittetilaitom..tosestptio.
1f.,tfo.f. .ft Clamlf ......40
.4,44041
tattoo 2.031 tistcoato 3.03
stctsts 2.041&cave..coottet
tam" ZStoe404foromtar.
1 sumo 2.011
OiAtIttmt1101..
1
StC1100 Iv
eaesxIJACSAIOAT
mom 4.01
091111103
scam 1.02OftATIOIALSASOMIK2OAC0104
I stow 1.03* swift* OwtAtA twittaiew
stroke 1.04tOTSOOOfOtIOMOf OiV0i01

r
ACKNOWLEDGMENTS'
This manual was prepared for the Municipal Operations Branch of the Office of WaterProgram Operations of the United States Emfirbnmental Protection Agency Develop-ment and preparation of the manual was carried out by the firm of James M. Montgomery, Consulting Engineers, Inc., Walnut Creek, California under the direction of
:.. Ronald A. Tsugita, Dennis C.W. DeCoite, and Larry L Russell. Special appreciationis also due R. Rhodes Trusseif, Mark L Cardoza, and Donovan F. Werner for theirassistance in coauthoring the manual. The understanding and encouragement ofLetin J. Potter, Project plficer, Water Program Operations of the EPA is greatlyappreciated..
.
Recognition is also due to the many operators for their time and assistance in pro--viding operations information during the plant visits, and to the folloWing individualsfor their review and comments,
4
".
Mr. Edward Becker San Jose, CaliforniaMr. Fred Delvecchio Clemson UniversityMr. Larry Freitas *OroLoma Sanitary District, CaliforniaDr. David Jenkins -University of California, BerkeleyMr. William Loftin Livermore, CaliforniaMr. Jack L Muir Tolleson, Arizona
NOTICE...
. ;
, .
The mention of trade, names of commercial products in this publication is for illustra-tion.purp9ses and does not constitute endorsement and recommendation fcif use bythe U.S. Environment Protection Agency,
)
*
e
..
/,
1
.
(
ttr
I
4,
A
4
F

t
I
(
..
A. PURPOSE AND INTENT A
INTRODUCTION
- The purpose of this manual is to provide an onthe-job reference for operatorsof activated sludge and trickling filter wastewater treatment plants. It is intendedto assist operators in establishing process control techniques and in optimizingthe performance of these two aerobic biological treatment system'. Other aerobicbiological systems such as aerated lagoons, rotating biodiscs and oxidationponds are not included in this manual.
t
^-,
a
Aerobic biological treatment facilities and the conditions under which theyoperate can vary considerably. Although treatment plants may be designed alike,they may not necessarily perform alike. in the past, many control strategies havebeen the result of trial and error tests performed by operators and engineers. ...
.
Development of this manual consisted of visiting several operators at,their treat-ment Plants throughout the United States. Their practical experiences andknowledge in plant operations and process control have been incorporated in'themanual. in addition, extensive use was made of the literature contributed overthe years by thoke individuals, agencies, and institutes seeking to advance andexplain the state-of-the-art of operating aerobic biological wastewater treatmentfacilities. , .
The overall objective of. this manual is to.aid the operator in determining whatprocess control and operational measures may be most effective in optimizingthe performance of his particular treatment plant. The manual should also serve
i as a basis from which the operator may develop new ideas for process controland better understand the varicius measures by relating his own experiences tothe material presented. For this reason, theoretical material has been limited tothat required for basic understanding of aerobic biological treatment.
a. MANUAL 'ORGANIZATION! -o . I
The manual is presented in three major dividions:
The Activated Sludge ProcessThe Trickling Filter ProcessAppendices
The Activated Sludge and Trickling Filter Process divisions are each divided intothe folloiving sections:
1
-,Section 1 TroubleshootingSection it Process ControlSection ill - FundamentalsSection IV-. Laboratory Control
M
These sections'emphasize the fundamentals of operating and controlling aerobicblologicallreatmeWprocesses. Each of the sections are presented in sufficientdetail to allow the reader to use 'them independently. References have been
Appended,to.each section for those who wish to gain further Insight to the topicscovered in ,the manual. These references were selected because of their clarityand value to an operator as an information source. .
I
i'1
Ii'
c
4
l
. . .
1
.

Inside frontCover.
.keywords.
.i.Inside back ..cover.
Abbreviations..
Aro youfamiliar withaerobictreatment?
SECTION I
SECTION II.
SECTION III
SECTION IV
C.
.*
Included on the inside front cover le, a quick regrence index to the major topicsin each dlv:sion section of the manual. After finding the section you desire, go tothe Table Of Contents for the subsection of Interest. Once you are in the appropri-
I ate subsection, thumb down the left hand margin of the text until you find thekey words which best fit your interest! Key words ere presented in the mannershown to the left of thisaragraph. .
. .The inside back cover presents a Metric Reference for those unit 'expressionswhich are commonly used foiprooess control parameters. This reference may beused for converting 5riglish and Metric Unit expressions.
....5 ,
Abbreviations have been kept to a minimum in the Fnanual. Only those which arecommonly used are included in the text.
. USE OF THE'MANUAL, .
. This manual assumes that the reader is familiar with the activated sludge andtrickling filter processes as well as their various modes of operation. For thosewho are not quite 'familiar enough, you are encouraged to study Section III,"FUNDAMENTALS", in each process division. ,.
IAs stated earlier, each process division is brmen down into tour sections. Thesesections maybe used independently or systematically.
TROUBLESHOOTING if you have a problem, go to the troubleshooting guidewhich best describes your situation. Follow the guidance as outlined. If you stillhave problems or desire more information on the guidance provided, use thereference indicated in thilast column on the troubleshooting guide. This refer-erica will lead you into the text of2the manual to provide ydu with more insight, aswell as addktional references to get more information. Your next best alternativewould be to seek outside help. ,
PROCESS CONTROL 7- This section presents the various strategies commonlyused for controlling the activated sludge and trickling filter processes. Routineoperational procedures as well as process loadings, evaluations, and .common,problems are presented here. Step-by-step examples of calculating, interpretingand. applying control tests to process control parameters are alsapresented.
FUNDAMENTALS This section is where it all begins. Without a sound back-ground ir4 understanding the concepts 4:if aerobic biological treatment,-a suc-cessful process control and operational program is difficult to achieve. As aresult, the quality of plant effluent suffers the consequences. Therefore, befamiliar with the fundamentals and the references that show you where to getmore information.
LABORATORY CONTROL This section is a must. If you want to know why,read it and follow its guidance because it will help You establish and implementa successful sampling, testing, .and monitoring program for your aerobic treat-ment facility: ",
2
7i
1

)
r
-
.*:::: t .
Four appendices are provided to supplement the manual.0 s
<
APPENDIX A Includes work sheets which may be removecl and duplicated for actual use. Italso provided information to developen opprational records system.
APPENDIX a Presents flow, diagrams, operational data, and summary descriptions of those. treatment plants which were visited during development of the manual. Check
them over to see how you compare. . ,.
. .
.APPEN0IXC Is a suggested list of laboratory;quipment, supplies and chemicals needed toperform process control tests discussed in the manual.
APPENDIX 0 Is a glpssary which defines the important terminology commonly used indiscussing amebic biological treatment.
7
operators' During the plant visits, four characteristics were observed of those treatmentresponsibility plants producing a good-quality secondary effluent.to achieve bestprocess control
1- Practice of day-to-day process control any' operational control procedures.and operation.2. Special effort is made tor training and upgrading of plant personnel.3. Industrial waste discharge ordinances are actively enforced.4. Process control and operational data is used in direct application to plant
operations.
HOW DO YOU GOMPARE?
3
t

ACTIVATED SLUDGE PROCESSTABLE OF CONTENTS
Top19.-z-
SECTION I- TROUBLESHOOTIAG
Page
1.01 INTRODUCTION 1 -1
1.02 TROUBLESHOOTING GUIDES 11
No. 1 Aeration Syilem Problems 1-4
No. 2 - Foaming ProblOs . 1-6
-No. 3 Solids Wash9u0B)Ilowing SolidsNo.4- Bulking SludgeP 1-13
No. 5 Sludge Clumping.,,No. 6- Cloudy Secondary Effluent I
1 -16
1.17
'No. 7 Ashing, Pinpoint/Straggier Floc 119I
SECTION II PROCESS CONTROI.2.01 INTRODUCTION .2.02 OPERATIONAL Giuipts -'
A
No. 1 Aeration lstemNo. 2 -.6econdaritClarif ler .
Ill11.2
11-4
i 11.7
No. 3 - Pumping Equipment and Piping In RAS and WAS Systems, .
II.8
2.03 PERFORMANCE EVALUATION 11.2
Review of In-Plant ReCycled Flows 11.9
Aeration Performance/Solids Inventory 1111
/ Calculating the Solids Inventory 1142
COD/BOD and Suspended Matter Removal II.15Process Kinetics 11.16
Kinetic Relationships 1116
Nitrification 11.204 Secondary Clarifiers 11.22
Surface Overflow Rate 11.23
Solids Loading Rate lir23
2.04 PROCESS CONTROL 11:24
Aeration and D.O. Control 11.24
Return Activated Sludge Control 11.25
Constant RAS Flow Rate Control 11-27
Constant Percentage RAS Flow Rate Control 11.27
Comparison of bath RAS Control Approaches 11.27
Methods of RAS Flow Rate Control 11.29
SludgeSlaiiket Depth 11.29
Mass Balance Approach 11.30
Settleability Appioach 11.31
SVI Approach 11.34.
Return Ratas witneparate Sludge Reaeration 11.35
Waste Activated Sludge Control 1.35
Methods of Sludge WastingConstant MLVSS Control
1461-39
Constant Gould Sludge Age Control 1.41
Constant F/M Control 1.42"Constant MCRT Control 1.49
1

.
e
k, , ,
ACTIVATED SLUDGE PRO ESSTABLE OF CONTENTS(coiteuty
.(Topic /Sludge Quality C ritrol
Mass Balance by Centrifuge, Settleometer
. Visual Observations
.1
I
TurbidityDepth of BlanketMicrostopic Examination
I
2.05 OPERATIONAL PROBLEMSAeration System problemsFoaming Pioblems
Stiff White FoamExcessive Brown Foam
Solids Washout - .
t Equipment MalfunctionHydraulic Overload ...
Solids OverloadTemperature Currents L.
Bulking SI:idgeFilamentous Microorganisms PresentNo Filamenjoas Microorganilms Present'
Clumping/Rising SludgeCloudy-Secondary Effluent
Protozoa Are PresentProtozoa Are Not Present
'!Ashing-
;Pinpoint FlocStragglerslBillowing Solids
SECTION III - FUNDAMENTALS1
Page
1-54
1-54
1-64
!-701-70
1-70
1-71
1-72
11-72
11-75
0-7511-76
11-77
-, 11-77
11-78
0-8011-81
' 11-82
11-83
11.90
11-90
11-93
11.93
11-93
11-95
11-97
11.97
3,01 INTRODUCTION 111.1
Definitions 111-1
3.02 PROCESS DESCRIPTION
Aeration SystemDiffused Air_Syitem
Fine Bubble DiffusersCoarse Bubble Diffusers
..#
Mechanical Aeration SystemsSurface AeratorsTurbine Aerators
Sedimentation System
/i
3.03 ACTIVATED SLUDGE PROCESS VARIATIONSProcess Loading Ranges .,
gHigh RateConventional RateExtended Aeration Rate
,
1 0
Pto
/
. ,.. t. .,,

V
4
A
ACTIVATED SLUDGE PROCESSTABLE OF CONTENTS (Continued)
Topic Page
Physical Arrangements of the Process III.12
Complete Mix Activated Sludge III12Plug-Flow Activated Sludge III-14Activated Sludge with Sludge Reaeration III-15
A SECTION IV- LABORATORY CONTROL4.01 INTRODUCTION IV t1
4.02 LABORATORY SAMPLING AND TESTING PROGRAM IV-1
Grab Samples 11/-1
Composite Samples IV-3
MLSS SamplingLaboratory Control Program
4.03 LABORATORY CONTROL TESTSBiochemicil Oxygen DemandChemical Oxygen DemandSoluble COD and BODSettleable MatterTotal Suspended MatterVolatile Suspended MatterNitrite NitrogenNitrate N"rogenTotal Kjeidahl NitrogenAmmonia Nitrogen30-Minute Settling Test
Observations During TestTotal PhosphorusDissolved OxygenHydrogen Ion'Concentrations pHTemperatureMicroscopic Examination
AmoeboidsFlagellatesCiliatesFree Swimming CiliatesStalked CiliatesEvaluation of Microscopic ExaminationSelection of a MicroscopeUse of the MicroscopeProcedures for Examination
Flow-Sludge Blanket MeasurementCentrifuge Test
Suspended Matter CorrelationTurbidity
11
IV-3
IV-5
IV-5
IV-7
IV-8
IV-9
IV-9
IV -t0
IV-10
Iv' -11
IV-12
IV-12
IV-13
IV-14
IV-14
IV-15
IV-16
IV-17
IV -18
IV-18
IV-19
IV-20
IV-20
IV-21IV-21
IV-22
IV-23IV-23IV-25
IV-25
IV-27
IV-29
IV-30
IV30 ,J

ACTIVATED SLUDGE PROCESSLIST OF FIGURES 4
Figure No. Description Page
1.1 Pictorial Reference of Settling Test Observations 1.3
11.1 Five-Day Moving Average Trend Plots for the 11.3
Activated Sludge Process
11.2 Wastewater Nitrogen Cycle 11.21
11.3 Aeration Tank Mass Balance 11.30
11.4 Estimating Return (RAS) from Settieability Test 11.33
11-6 Graphical Approach to F/M Calculations for Wastewater Flowsof Oto5mgd
11.45
11.6 Graphical Approach to FIM Calculations for Wastewater Flowsof 0 to 10 ingd
11.46
11.7 Graphical Approach to F/M Calculations for Wastewater Flowsof 0 to50 mgd
11.47.
11.8 Graphical Approach to WAS Calculations not Including Secondary 11.51
Effluent Suspended Solids11.9 Graphical Approach to WAS CalCulation Including Secondary 11.62
Effluent Suspended Solids
11.10 Daily Data Sh3et for an Activated Sludge Plant 11.65
11.11 Plotting Sludge Settling Characteristics 11.67
11.12 Plotting Process Variable Trends 11-69
11.13 Violent Aeration Tank Surface Turbulence 11.73
11.14 Foaming in Aeration Tank 11.74
11.15 Solids Washout in Clarifier 11.78
11.16 Settling Test Obs.,riations for Case 1 and 2 11.79
11.17 Sludge Bulking in Clarifier 1182
11.10 Microscopic Observations 11.84
11.19 Clumping in Clarifier 11.92
11.20 Settling Test Observations for Case 3 and 4 11.91
11.21 Asking in Clarifier 11.95
11.22 Settling Test Observations for Case 5 and 6 11.96
111.1 Typical Activated Sludge Process 111.1
111.2 Sketches of a Nylon Sock and a Saran Wrapped.Tube Diffuser 111.5
1113 Sketches of a Sparger and a Disc Type Coarse Bubble Diffuser 111.5
014 Typical Floating and Platform Surface Aerator 111.6
111.5 Typical turbine Aerator 111.7
111.6 Sludge Collector with Suction Draw Tubes 111-8
111.7 Sludge Settleability vs. Organic Loading 11110
111-4 Complete Mix Activated Sludge Process 111.14
111.0 PlugFlow Activated Slu"je Process 111.15
iti10 Contact Stabilization Activated Sludge Process 111.16
111.11 Step Feed Activated Sludge Process 111.17
12
14

)
Figure No.
ACTIVATED SLUDGE PROCEFSLIST OF FIGURES (continuous ,
Description Page
IV1 Wastewater Sampling Guidelines IV2 :
IV2 TypiOal Sampling and.Testing Program IV13
IV3 Amoeboids IV19
IV4 Flagellates IV20
IV5 Free Swimming Ciliate IV21
tV8 Stalked Ciliate IV22
. IV7 Relative Number of Microorganisms vs. Sludge Quality 3 IV24
IV-8 Worksheet for Microscopic Examination of Activated Sludge IV26
IV9 Sludge Blanket Indicators IV28
IV-10 -Correlation of Centrifuge and Suspended Solids Concentration IV31
1 C)
I
a

ACTIVATED SLUDGE. PROCESSLIST OF TABLES
table No. . Page,
11.1 Guiq to Successful Process Control 11-1 .11.2 . Typical Air Requirement Parameters 11.10
- 11-3 Approximate Relationship of the COD F/M to the MCRT 11-19 ,-
1141 Approximate Relationship of the BOO F!M to the MCRT 1911-5 Typical,Design Parameters for Secondary Clarifiers 11-22 .. -
114 Sandard Operating Procedures for Aeration and 0.0. Control 11-26
11-7 A Guide to Typical RAS Flow Rates 11-'25
11-8 Standard Operatingrating Procedures for RAS Control 11-28
11.9 Standard Operating Procedures for WAS Control 11-37
11-10, Typical Ranges for F/M Loadings 11-43
11-11 MCRT Needed to Produce a Nitrified Effluent as Related to the 11.49Temperature
1112 Allowable Concentrations of Heavy Metals 11-94..
14

1
Select themeasure withleast adverseeffect.
N..
Know theprocess.
Commonproblems withactivatedsludgeprocesses.
ACTIVATED iLLIODE PROCESS tiSECTION I TROUBLESHOOTING
1.0i INTRODUCTION
This section of the manual presents troubleshooting procedures for solvingcommon operating problems experienced in the activated sludge process.With each problem, or observation, a list is Included for the probable causes,checks to determine the cause, and the suggested corrective measures. You,the operator, must determine and select one or more of the corrective meas-ures that will restore the process to full efficiency with the least adverseeffect on the-final effluent quality. In order to evaluate the problem and selectthe best _corrective measure, you must be thoroughly familiar with youractivated sludge process anti how it fits into the overall treatment plantoperation. In addition, you must be familiar with the influent wastewatercharacteristics, plant flow rates and patterns, design and actual loadingparameters, performance of the overall plant and individual processes, andcurrent maintenance procedures. For those operators who are not familiarwith the activated sludge process, refer to Section III, "FUNDAMENTALS"before attempting to use the troubleshooting guides.
1.02 TROUBLESHOOTING GUIDES
r
There are seven problems presented that frequently, occur in operating theactivated sludge process. These problems are listed below and are referencedto the troubleshooting guides which begin on the following pages.
Note that the problems are categorized between the aeration tank and secon-dary clarifier tank. The troubleshooting guides presented for the secondaryclarifier tank are associated with the activated sludge characteristics andquality, as can be observed when performing the sludge settleability test.The operator must realize that all observations made during the'settleabilitytest are not necessarily indicative of conditions occurring in the secondaryclarifier tank. In all of the guides presented, the probable causes giVen for theobservation should be looked at coi3currently because many times one problemmay be thelesult of several causes.
1
1
11.1
r.4. ,j
%._
i
.

wl
In
ACTIVATED SLUDGE PROCESSSECTION I. TROUBLESHOOTING
INDEX TO TROUBLESHOOTING GUIDES
TroubleshootingGuide No: Problem Indicator
Aeration Tank
1 Aeration System ProblemsFoaming Problems
SecondaryClarifier
3 Solids Washout/Billowing Solids 'N. --1.
4 Bulking Sludge .5 Sludge Clumping6 Clotidy Secondary. Effluent7 Ashing, Pinpoint/Straggler Floc
Figure 1.1 presents a pictorial' index of typical settliability test results. Thisindex may be used In comparing actual test results for quick referenceto the troubleshooting guides.
IC
4
rte-

.
30 MIN. .
TROUBLESHOOTING GUIDE. NO. 3
GOOD SETTLING
30 MIN.t
ONE TO TWO HOURS
. TROUBLESHOOTING GUIDE NO. 5
'DEN ITRIFICATI9N
30 MIN.
TROUBLESHOOTING GUIDE NO.7
ASH ON SURFACE
r.
.ACTIVATED SLUDGE PROCESSSECTION I .TROUBLESHOOTING
30 MIN.
(C:)
,TROUBLESHOOTING GUIDt NO. 4
POOR SETTLING
.
SO MIN.
TROUBLESHOOTING GUIDE NO. 6
CLOUDY
30 MIN.
.
4,
TROUBLESHOOTING WIDE NO.7
PIN POINT FLOC & STRAGGLERS
SETTLING TEST OBSERVATIONSFIGURE I-I
I
6
4 ai

9
ACTIVATED SLUDGE PROCESS .
AERATION TANK
TROUBLE SHOOTING GUIDE NO. i - AERATION SYSTEM PROBLEMS
OBSERVATION . PROBABLE CAUSE°.
NECESSARY CHECK REMEDIES REFERENCES
t. Boiling action, violentturbtance, throughoutaeration tank surface.
.Large air bubbles, tor orgreater, apparent.
\A. Overaeration resulting 1
high D.O. and/or flocshearing.
.
1. Generally, D.O. should bein range of t.0 to 3.0 mglithroughout tanks.
,
.
1) Reduce air SCFM rate tomairittri_SzCZ In properrange.
.
pg II24 &41.72
, . .
2. Uneven surface aeration.pattern, Dead spots or'inadequbte mixing in someareas of tank.
0
. .
1
A Plugged diffusers./
,
a
B. Underaeration resulting inlow D.O. And/or septicodors.
t-
.
1, Check maintenancerecords for last cleaning ofdiffusers,i
2. Spot check diffusers in'tank for plugging.
1. Check 0.0., should be inrange of t.0 to 3.0 mglithroughout tank.
2. Check for adequate mixingin aeration tank.
3. Check RAS rates andsludge blanket depth inclarifier,
t) If diffusers have not beencleaned in the last 12months, do so.
2) If several are plugged.clean all diffusers in tank.
1) increase air SCFM rate tomaintain D.O. In properrange.
2)1 Calculate SCFM of air per. linear foot of diffuser
header pipe. Minimumrequirement is 3 SUMlinear IL Adjust air Wpmrate as necessary tomaintain adequate D.O.and mixing.
3) Adjust RAS rate to maintainsludge blanket depth of 1to 3 lot in clarifier.
pg 11.72
.
pg 11.72
pg 11.24
P9 119
p911-29
1.

4
ACTIVATED SLUDGE PROCESSAERATION TANK
TROUBLE SHOOTING GUIDE ho. 1 AERATION SYSTEM PROBLEMS (continued)
OBSERVATION"
4*PROBABLE CAUSE ,. . NECESSARY CHECK
st .
REMEDIES REFERENCES
3.
.
Excessive air rates beingused with .no apparentChange in organic orhydraulic loading. Difficultto maintain adequate 0.0.level.
..
.
A. Leaks in aeration systempiping.
.
-.
B. Plugged diffusers. Air'discharging from diffuserheader blow-of f .pipescausing local boiling tooccur on surface neardiffuser header pipe.
.)
C. Insufficient or inadequateoxygen transfer.
.
-
D. High organic loadings(BOD, COD. Suspendedmatter) from Inplant sidestream flows. '.
i
1.
1.
2.
1.
1.
Check air eilpe and jointconnection; listen for airleakage or soap test flangesand watch for bubblingcaused by air leaking.
.
tCheck maintenance recordfor last cleaning ofdiffusers.
.
Spot check diffusers intank for plugging.
.
Check aeration systemperformance.
a. Diffused aeration systemshould provide betweenWO to 1500 cu. it. air perpound SOD removed.
b.Mechanical aerationsystem shpuld providebetween 1 tb 1.2 poundsoxygen per pound BOOremoved.
4
Check to see If organicloading from side streamflows contributes algalcanny to overall processloading.
.
.
1) Tight& hang offs andlorreplace Hang gaskets.
'
.
.
1) if diffusers have iidt beencleaned in last 12 months,
.do so.
2) if Savona, are plugged, cleanall diffusers in tank.
* .
1) Replace with more &Mclive diffusers or mechanicalaerators.
2) Add more diffusers ormechanical aerators.
%. ..
4 '
4 if loadings are greathr 1than 25%, optimize opera-110 nal performance orupgrading of other inplantprocesses will be required.
.
,
pg 11.72
pg 11.72
pg 119 & III-4,
. pg 11.9 & 1114
-
pg 114
.
,
20/' '
21.

J.ACTIVATED SLUDGE PROCESS
AERATION TANK
TROUBLESHOOTING GUIDE NO. 2 FOAMING PROBLEMS
OBSERVATION PROBABLE CAUSE NECESSARY CHECK REMEDIES REFERENCES
1. White, thick, billoveirig orsudsy foam on aerationtank surface.
.
.
,
.
A.
S.
Overloaded aeration tank(low MLSS) due to processstartup. Do not be alarmed,this probiein usually occursduring process startup.
'-'-
I
.Excessive sludge wastingfrom process causingoverloaded aeration tank(Low MLSS).
.
a
1. Check eorklon tank BODloading (lbsklay) and lbsMLVSS in aeration tank.
'Calculate NM 'ratio todetermine lbs/day MLVSSinventory for current BOO
- loading.,----/
2. Check secoridary' clarifiereffluent lot solids carryover.
, Effluent will look cloudy.
. '
aeration tank3. Check .D.O. levels in
..
. ,4
1. Check and monitor fortrend changes which occurin the following:
a. Decnia in MLVSS mg/I.
b. Decrease in MCRT,Gould Sludge Age.
c. Increase In FM ratio.
d. D.O. levels maintainedwith less air rates.
e. Increase in WAS rates,
1
1) After calculating the FIMgut lbs MLVSS needed,you will !Ind that the NM 'ratio is' high and the ibiMLVSS Inventory is tow.Therefore, do not wastesludge from the process ormaintain the minimumWAS rate possible if a
wasting has already started.
2) Maintain sufficient RASrates to minimize solidscarryover esplcially duringpeak flow periods.
3) Try '.o maintain D.O. levelsbetween 1.0 to 3.0 mg/I.'Alpo be surf that adequatemixing is be ng provided Inthet aeration tank while'attempting to maintainD.O. levels.
...1) Reduce WAS rate by not y
more than 10% per dayuntil process approachesnormal control parameters.
.
2) Increase RAS rate to mini-min( effluent solids carry.over from secondary
. clarifier. Maintain sludgeblanket depth of 1 to 3 feetfrom clarifier hoor.
pg1115.1112
P
I
pg 11.29
...
11411'24
pg !136
.
-
P911 -29
.
& 11.42
,
.
-

'4
I
ACTIVATED SLUDGE PROCESSAERATION TANg
TROUBLESHOOTING GUIDE NO. 2 FOAMING PROBLEMS (continued) y
1 .OBSERVATION PROEABLE CAUSE NECESSARY CHECK I
.d REMEDIES REFERENCES
I,
C. Highly toxic waife, such 1. Tab MISSsample and test - 13)\ Reestablish new culture of pg 11.93 & 11.94
as metals or bacteriocide,or colder wastewatertemperatures, or severe
for metals and bacteriocide,and temperature.
3/4\
oirr.liviled sludge. Ifsible, waste sludge f mprocess without rrItu ing
temperature variations to other Inplant systems.resulting In reduction of Obtain seed sludge fromMISS. . % other plant, if possible.
.. '.
\ 2. Monitor plant influent farsignificant variations intemperature.
2) Actively enforce IndustrialWaste Ordinances. ,
pg 1114
D. Hydraulic washout of 1. Check hydraulic detention 1) Refer to Troubleshooting pg 113 &11.78solids from secondaryclarifier,
time in aeration tank andsurface, overflow rate insecondary clarifier.
Guide No.3, Observation 1.
i
E. Improper influent waste- 1. Check and monitor for 1,K MISS and RAS concentra pg11781.1V3water and/or RAS flow significant differences In tions, and 0.0.1 between
.distribUtion causing MISS concentrations multiple tanks should befoaming in one or more between multiple aeration reasonably consistent.
A aeration tanks. tanks.
2. Check and monitor primary 2) Modify distribution larlii pg Ill&effluent and for RAS flowrates to each to aerationbasin.
ties. as necessary to mainfain GAO Influentwastewater and/o RASflow rates to aerationbasins.
.. 1
. -
... . -
24
4
1
25

ACTIVATED SLUDGE PROCESS'AERATION TANK
TROUBLESHOOTING GUIDE NO. 2 FOAMING PROBLEMS (continued)
...I OBSERVATION PROBABLE CAUSE NECESSARY CHECK REMEDIES REFERENCES .
2. Shiny, dark tan foam onaeration tank surface.
A Aeration tank approachingunderloaded (high MLSS)condition due to Insuffic-ient sludge wasting fromthe process.
t. Check and monitor for trenuChanges which occur Inthe following:a. Inbrease I .aLvss mgl
b. Increase in MCRT,Gould Sludge Age.
p. Decrease in F1M ratio.
d. D.O. levels maintainedwith increasing air rates.
e. Decrease in WAS rates.
1) Increase WAS rate by notmore than 10% per dayuntil process approachesnormal control parametersend a modest amount oflight-ten foam Is observedon aeration tank surface.
2) For additional checks andremedies refer to Trouble-shooting Guide No. 5 and 6.
3) For multiple tank oporatloi.refer to Observation No. 1,Probable Cause "e.
pg 11.76 & 11-36
3 Thick. scummy Oark.tanfoam on aeration tanksurf: 4s
A Aeration tank is criticallyunderloaded (MLSS toohigh) due to improper WAScontrol program.
1. Check end monitor fortrend changes which occurIn the following:
a. Increase in MLVSS mgil
b. Increase in MCRT,Gould Sludge Age.
c. Decrease in F1M ratio.
1) Increase WAS rata by notmore than 10% per dayuntil process approachesnormal control parametersand a modest amount oflightten tpam is observedon aeration surface.
po 11.76 & 1136

4.$
io
ACTIVATED SLUDGE PROCESSAERATION TANK
TROUBLESHOOTING GUIDE NO. 2 FOAMING PROBLEMS (continued)
OBSERVATION PROBABLE CAUSE---,_
NECESSARY CHECK ' REMEDIES REFERENCES
,
'
'
d. D.O. levels maintainedwith increasing air rates.
e. Decrease In WAS rates.
f. Secondary effluent nitratelevel above 1.0 mgli.
g. Increase in secondaryeffluent chlorinedemand.
\-..h. Decrease in aeration
tank eff luent pH.
2)
3)
For additional checks andremedies refer to Troubla-sqooting Guide Po. 5 and 7.
For multiple tank operationrefer to Observation No. 1,Probable Cause "EP: of thisguide.
.
4.
.
Dark brown, almostblackish sudsy foam onaerie n tank surface.Mixed liquor color is verydark -brown to &Most black.Detection of septic or sourodor from aeration kink.
A. Anaerobic conditionsoccurring In aeration tank.
1.
.
Refer to TroubleshootingGuide No. 1, ObservationNo.2 and 3.
2c,
29

12;
0 30
II ...at
ACTIVATED SLUDGE PROCESSSECONDARY CLARIFIER
TROUIILESHOOTING GUIDE NO. 3 7 SOLIDS WASHOUT1BILLOWING SOLIDS
a
OBSERVATIONt___. PROBABLE CAUSE , NECESSARY CHECK REMEDIES REFERENCES ,
;I. Localized clouds of Om-°Denims sludge soillrising. in certain areas fthe clarifier. Mixed liquorIn settloabiilty test settlesfairly well with a clearsupernatant.
P
A. Equipment malfunction.
-..
/
41. Refer to Troubleshooting
Guide No. 1, ObservationsVA, 2A, and2B. i
4
2. Check the followingequipment for abnormaloperation.
a. Calibration of flewmeters.
b.Plugged or partiallyplugged PEAS or...WASpumps and Irene& hoes.
c. Sludge collectionmechanisms, such asbroken or worn outflights, chains, sprock-ets, squeegees, plugged
" sludge withdrawal tubes.
3. Check sludge removal rateand sludge blanket depthin clarifier.
.
2)
.
3)
3
.Repair or replace abnormaloperating equipment
1.
t
L...
.
Adjust RAS rates an ...:
sludge collector mochaism speed to maintalsludge blanket depth at 1to Vest from clarifier floor.
pg 1147-
pg II-29
.

t
-
ACTIVATED SLUDGE PROCESSSECONDARY CliARIFIER
TROUBLESHOOTING GUIDE NO. 3'-- SOLIDS WASHOUT/BILLOWING SOLIDS (continued)
A
.
OBZERVATION
_
7"PROpABLE CAUSE
.
, NECES$ARY CHECK REMEDIES r .4 REFERENCES
st
4
.
I
6. Air or gas entrapment insludge floc or depltrification occurring.
.
.
.
C. Temperiture currents.
Ir
D. Solids washout due tohydraulic overloading,
1. Pertain sludge setileability. test and gently stir sludge
when settling to see ifbubbles are released.
2. if liubbled art, released,'check nitrate mgfl in-secondary effluent to see ifthe process is nitrifying.
1. Perform temperature andD.O. profiles in clarifier.
2. Check inlet and outletbaffling for proper solidsdistribution in clarifier.
1. Check hydraulic detention .time in aeration tank and'clarifier, and surface over-flow rate In clarifier.
.
t) If the process is not Md-lying, refer to ProbableCause A above, andtroubleshooting Guide No.7, Observation 2.
2) If the process Is nitrifying,refer to TroubleshootingGuide No. ,5, probableCause A.
1) It temperatures exceed 1to 2 degrees between topand bottom of clarifier, use,an additional aeration tankand clarifier if possible. r
2) Modify or install *anions,baffili.g in clarifiers.
3) Refer to Probable CauseAli and A2 above. .
1) if hydraulic loadings exceeddesign capability, use ,.additional aeration tanksand clarifiers if possible.
2% Reduce RAS rate to main-tain high sludge blanketdepth in clarifier.
3) Irpossible, change processoperation to sludge reaera-lion or contact stabilizationmode.
4) Refer to Probable CausesS-1, 13-2, and C2 above.
t
pg II90
pg Wet
7 .
pg 11431
po 11.78
pg 11.29 .
pg III.15I
-,
.
3233

ACTIVATED SLUDGE PROCESSSECONDARY CLAIIIP111
TROUBLESHOOTING GUIDE NO. 3 SOLIDS WASHOUTIBILOWING SOLIDS (continued)
OBSERVATION, .
PROBABLE CAUSE NECESSARY CHECK.
REMEDIES REFERENCES.
2. Localized clouds of fluffyhomogendus sludge risingin certain areas of the
A. Overloaded aeration tankQat/ MISS) resulting in a9oung,lovr density sludge.
1. Check and monitor trendchanges whIctl occur Inthe following:
,
1) Decries° WAS rates by notmore than 10% per day tobring proces back to
pg1197&1136 ,
clarifier. Mixed liquor Insettleability test settlesslowly, leaving stragglers
optimum pars ors..,
In supernatant. . Ia Decrease in MIVSS, mg11.
6. Decrease in MCRT,Gould Sludge Age.
c. Increase in PM ratio..
d. Lower air SCFM rate to.
_maintain 0.0.1evel.. .
,
- -
J .
. .
4
..
r.
i
35

.
,5.
ACTIVATED. SLUDGE PROCESS'SECONDARY CLARIFIER.--
N.,,..,..._,TROUBLESHOOTING GUIDE NO. 4 BULKING SLUDGE
6
..!
OBSERVATION PROBABLE CAUSE NECESSARY CHECK REMEDIES REFERENCES
1. i Clouds of billowing horn-ogedous sludge riqing
. and extending throughoutthe clarifier tank. Mixedliquor settles slowly andcompacts poorly in settle-ability test, but supernatantIs fairly clear,
A.
B.
Improper organic loadingor D.O. level.
,,,
Filamentous organisms.
..
.
1. Check and monitor trendchanges which occur ihthe following:
a. Decrease in MLVSS mg/i.
b. Decreaee In MCFIT,Gould Sludge Age.
c*c. Increastin PIM ratio.
d. Change in D.O. levels. ie. Sudden SVI increase
from normal. or decreasein SDI.
1. .Perform MicroscopicexamlnatIOn of mixedliquor and return sludge.If possible, try to Identifytype of filamentous organ-Isms, either fungal orbacterial.
2. if fungal Is identified,check industries for wasteswhich may cause Problems.
I
1) Decrease WAS rates by notmore than 10% per dayuntil process approachesnormal operating para-meters.
2) Temporarily increase RASrates to minimize solids ,carryover from clarifiertank. Continue until normal ,
Control parameters areapproached.
.
3) D.O. level throughout sera-lion tank greater than 0.5mgIl, preferably 1 to 3 IV.
1) if no filamentous organisms, are observed. refer to
Probable Cause "A" above.
2) Enforce Industrial WasteOrdinance to eliminatewastes. Also see Remedy4 below.
pg11-82S1136
...
pg 1125
pg 11.24
PO11.83
..
.
36.
;
37 .
,

ACTIVA TED 'SLUDGE PROCESSSECONDARY CLARIFIER
TROUBLESHOOTING GUIDE NO. 4 BULKING SLUDGE (continued).
OBSERVATION PROBABLE CAUSE NECESSARY CHECK REMEDIES REFERENCES
3. If bacterial are Identified,check Influent wastewaterand Inlent side streamflows returning to processfor massive filamentousorganisms.
3) Chlorinate inflUont waste-water at 5 to '10 mgtldosages.
1
if higheLdosages, are re-quIred, use 'extreme cawtion. Increase dosage at 1to 2 mgll increments.
4) Chlorinate RAS at 2 to 3lbs1day/t00(Vbs MLVSS.
pg 11.891
5) Optimized operationalperformance or upgradingof other InPlant unit pro-cessis will be required if
pg 119
,
filamentous organisms arefound in side stream flows.
4
..-
C. Wastewater nutrient de-ficiencies.
t. Check nutrient levels Ininfluent wastewater. TheBOO to nutrient ratiosshould be tO0 parts BOO
t) If nutrient levels are kmthan average ratio, fieldtests should be Performedon the influent wastewaterfor addition of nitrogen in
Pg11-83.11/.12. /111/-15
to 5 parts total nitrogen tot part phosphorus to 0.5Iron.
the form a anhydrousammonia, phosp rus Inthe farm of Ids diumphoiphate andtor on inthe torm of ferric chl ride.
..
2. Perform hourly ML^Settleability tests.
2) Observe teals for Improve-ment In sludge settlingcharacteristics with the
pg11/.14
addition of nutrients. .

ACTIVATED SLUME PROCESSSEC NDARY CLARIFIER
TROUBLESHOOTING GUIDE NO. 4 BULKING SLUDGE (continutec
OBSERVATION PROBABLE CAUSE NECESS\RY CHECK
Low D.O. in aeration tank 1. Check 0.0. at varicusMations throughout thetank.
REMED;iS REFERENCES
1) if averege D.O. Is less than0.5 mg/I. Increase air SCFMrate until the D.O. level in-creases to between 1 and 3moll throughout the tank.
2) If .0. levels are nearly,zeto In some parts of the
s.hank, but 1 mgli or more inI Other 'locations, balancethe air distribution systemor clean diffusers. Refer toTroubleshooting Guide No.1, Observation 2.
1) If pH is less than 6.5, Con-duct Industrial survey toidentify source. If possible,stop or neutralize dis-charge at source.
E pW in aeration tank is lessMon 6 5
1. Monitor slant influent pH.
2. Check it process is nitrify-ing due to warm wastewatertemperature or tow FIMloading.
po 11-83
2) if the above is not possible,raise pH by adding an silkline agent such as 0011Csoda or lime to the aerationinfluent.
1) If nitrification is n't re.(Wired, increase WA.; rateby not more than 101; perday to stop nitrification
2) if nitrification is requiretraise pH by adding an alkaline agent such as causticsoda or lime to the aerationinfluent
po 11.86
p411:20.11.36 IV 12
penes
4U 41
ACTIVATED SLUDGE PROCESSSECONDARY CLARIFIER
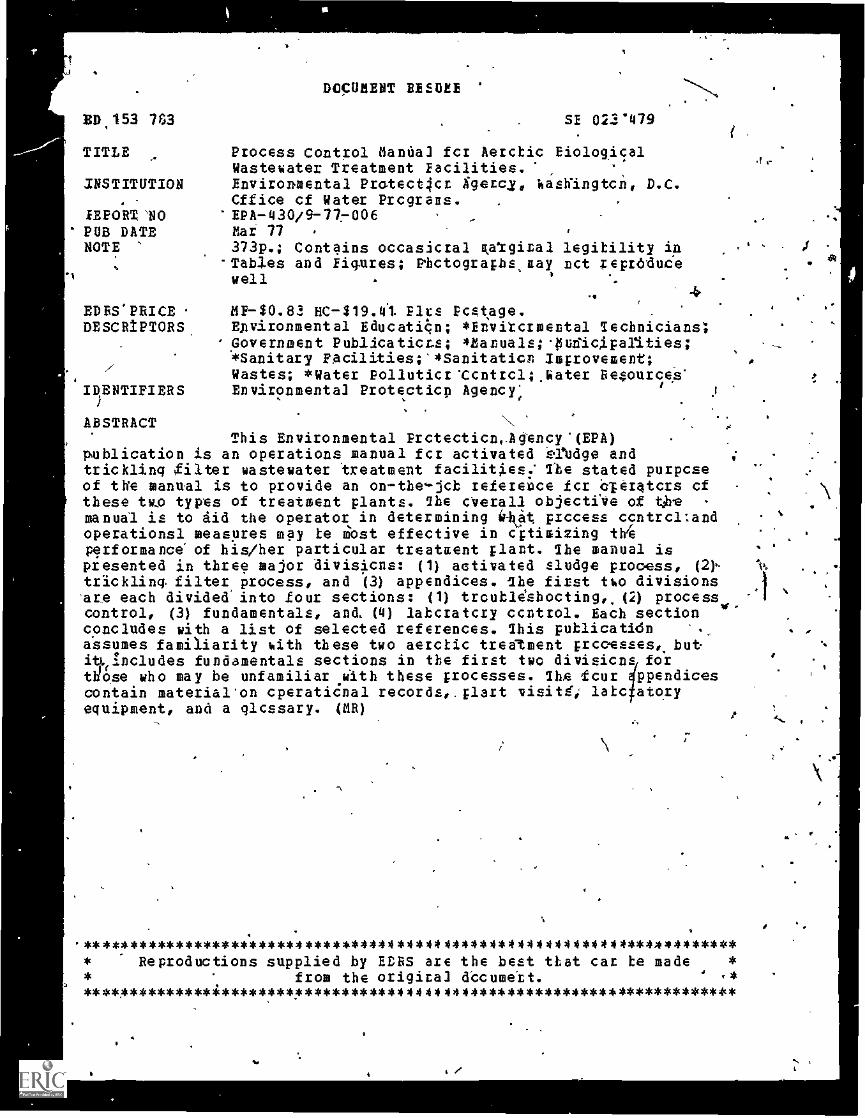
so TROUBLESHOOTING GUIDE NO. 5 SLUDGE CLUMPING
a>
v. 42
OBSERVATION PROBABLE CAUSE . NECESSARY CHECK REMEDIES REFERENCES
1.
.
Sludge clumps (from sizeof a golf ball to as large asa basketball) rising to anddispersing on clarifiersurface. Bubbles noticedon clarifier surface. MixedIlquor in settleability testsettles fairly well, howevera portion of and /or all ofthe settled sludge rises tothe surface within fourhours after test is started.
A.
B.
Denitrification in clarifier.
.
Septicity occurriRg inclarifier.
1. Check for increase inseconder,' effluent nitratelevel.
2. Check loading parameters.
.
3. Check D.O. and tempera.ture leiels le . "^ aerationtank. --,
4. Check RAS rates andsludge blanket depth inclarifier.
1. Refer to TroubleshootingGuide No. 1, ObservationNo.2
2. See 3 and 4 above.
1)
2)
3)
4)
Increase WAS rate by notmore than 10% per day toreduce or eliminate level ofnitrification. If nitrificationis required, reduce to/a'.towable minimum.
Maintain WAS rates to keel..process within properMCRT, Gould Sludge Age.r--andr.IM ratio.
Maintain D.O. at minimumlevet (11 mgll). Be sureadequate mixing is pro.vided in the aeration tank.
Adjust RAS rate to maintainsludge blanket depth of 1to 3 feet in clarifier.
.
Pg 11-90 &II-36
pg 11.36
pg 11-24
pg 1149
-
A el4...,

4
S.
S.
t
ACTIVATED SLUDt.E PROCESSSECONDARY CLARIFIER -
TROUBLESHOOTING GUIDE NO. 6 CLOUDY SECONDARY EFFLUENT
OBSERVATION PROBABLE CAUSE NECESSARXCHECKt-N,
.4
1. Refer to TroubleshobtimGuide No. 2, Observation °No 1.
.1.. Perform microscopic
examination on mixed-liquor and return sludge.Check for presence ofprotozoa.
.
2. Check organic loading onprocess,
3. Check D.O. level in aerationtank
1 Perform microscopicexamination on mixedliquo, and return sludge,Check for presence of in-active protozoa,
REMEDIES
t
I4') If no protozoa are present.
possible shock organicloading has occurred.
.
2) Reduce WAS rate by notmore than 10% per day tobring process ,back toproper loading parametersand increase RAS rates tomaintain t to 3 foot sludgeblanket in clarifier.
3) Adjust air SCFM rate tomaintain D.O. level within11.0 to 3.0 mg&
t) If protozoa are inactive.possibility of recent toxicload on process.
2) Refer to TroubleshootingGuide No. 2. ObservationNo S.C.
REFERENCES
1)9103 IS IV 18
Pa t142 & 11.36
an ii 24
p011.93 .
1. Secondary effluent fromclarifier is cloudy andcontains suspended matter.
- Mixed liqugin settleabilitytest settles poorly. leavinga cloudy supernatant.
A.
II
C
MLSS in leration tank lowdue to process startup.
increase in organic loading.
.
Toxic shock loading
-'
4445

46
-aCo
4
ACTIVATED SLUDGE PROCESSSECONDARY CLARIFIER
TROUBLESHOOTING 'VIDE NO. 6 CLOUDY SECONDARY EFFLUENT (continued)
OBSERVATION PROBABLE CAUSE NECESSARY CHECK' REMEDIES I REFERENCES
t I
.
.0.
iD. Overaeratton causing
mixed liquor floc to shear.: .
.-
E. Improper 6.0. levelsmaintain:6 in aeration tank.
.
,
4r
1; Perform microscopicexamination on mixedliquor. Check for dlipersedor fragmented floc andpresence of activeprotozoa.
.
1. Refer to TroubleshootingGuide No. 1, ObservationNo.2.
t
.
1) Refer to TroubleshootingGuide No. 1, ObservationNo.114.
.._.
pg IV18
.
.
47
s.
CDi
P o
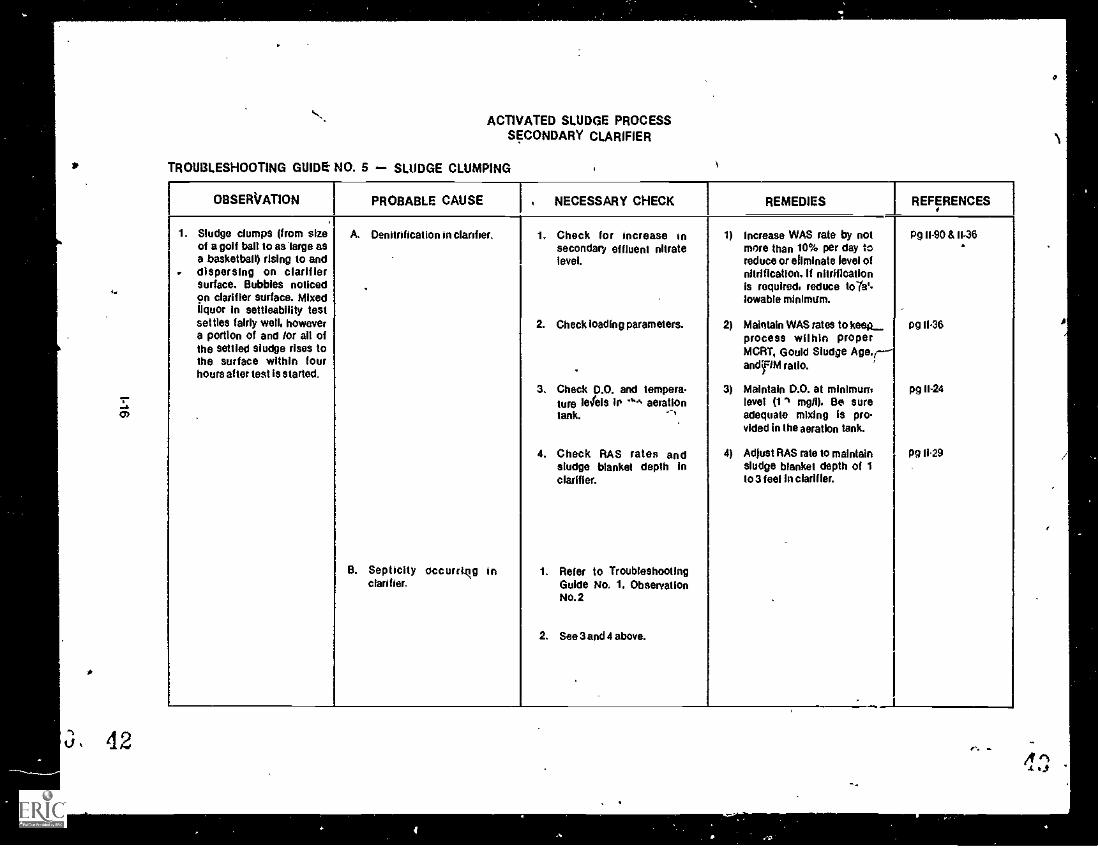
ACTIVATED SLUDGE PROCESSSECONDARY CLARIFIER.
TROUBLESHOOTING GUIDE NO. 7 AMINO AND PINPOINT/STRAGGLER FLOC
I
OBSERVATION PROBABLE CAUSE NECESSARY CHECK REMEDikS REFERENCE*
1. Fine dispersed floc (aboutthe size of a pinhead)extending throughout theclarifier with little Islandsof sludge accutztliated on
A. Aeration tank approachingunderloaded conditions(High MLSS) because ofold sludge in system.
1. Check and monitor trendchanges which occur inthe folk:wing:
1) Increase-WAS r by notmore than 10% pe totiring process fik..1optimum cOntre parameters for average anic
pg1147f 1146
the surface and dischargingover the weirs. Mixed liquor
a. Increse In MLVSS mgfl. loading.
in settleability test, settles`...:.:;','.11. Sludge is dense
_ h. Increase in MORT,Gould Sludge Age.
._
at bottom with fine particlesof floc suspended in fairlyclear supernatant.
C. Decrease In FIM ratio.
d, D.O. love's maintainedwith lamming aerationfates.
. 1
& Decreaselin'INAS rates.
. f. Decree e in organicloadin (130D/COD inprim effluent).. .
.
2. Check for foaming inaeration tank.
2) Refer to TroubleshootingGuide No. 2 for any foamsing which may be occurringin aeration tank. 1
. ..
'
3) Adjust RAS rates to main-tain sludge blanket depthof 1 to 3 feetin clarifier.
pg II-29
4) Refer to Troubioshooting'Guide No. 1 for additionalobservations.
48 4)
.4.
4
Ott
C
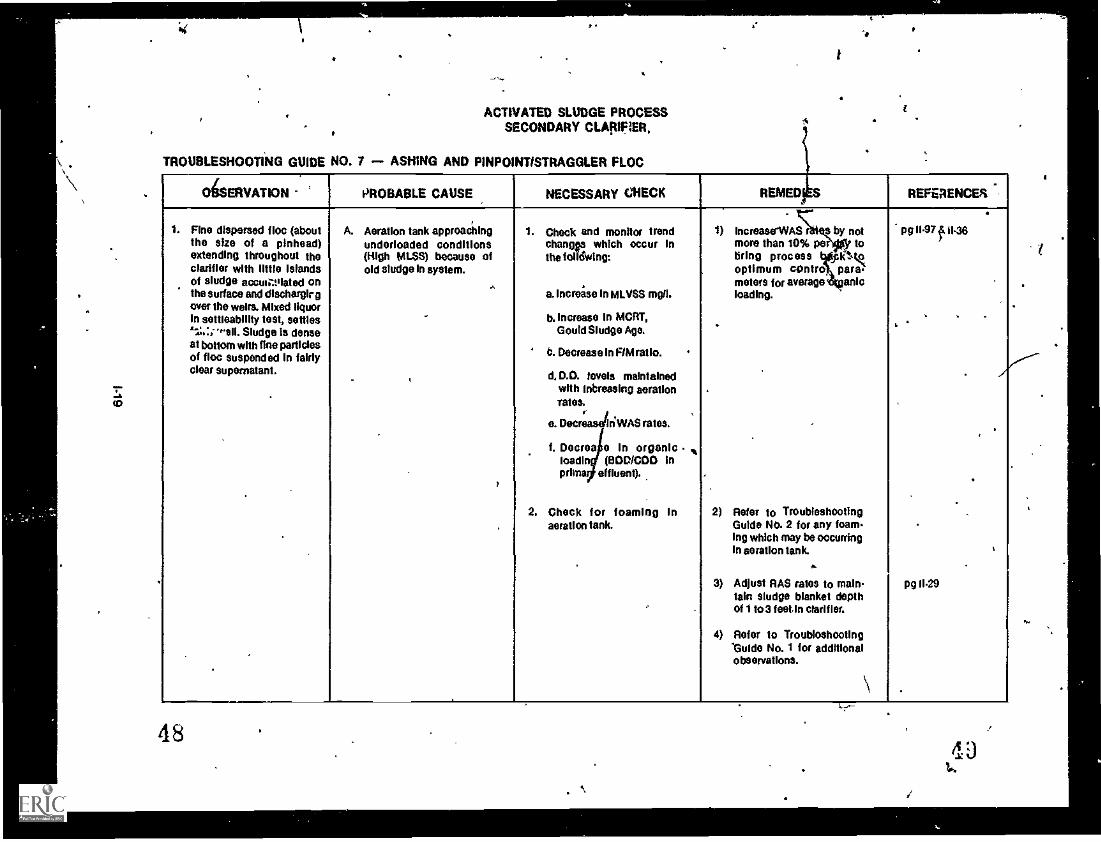
ACTIVATED SLUDGE PROCESSSECONDARY CLARIFIER
TROUBLESHOOTING GUIDE NO. 7 ASHING AND PINPOINTISTRAGGLER FLOC (con ued)
OBSERVATION PROBABLE CAUSE
--NECESSARY CHECK REMEDIES . REFERQICES
s
2.
`1
6
Small particles of ashiikematerial floating on clarifiersurface.
- -F
A.
S.
Beginning of den i kit 1-cation,
_
Excessive amounts ofgrease in mixed liquor,
1,1
.._
1. Stir floating floc on surfaceof 30telnute settling test.
...
1. Perform a grease analystson MSS, and check scumbaffles in primary tank
2. Check grease content Inraw wastewater.
i
1) If floating Hoc releasesbubbles and settles; see*oubieshooting Guide No5, Probable Cause A.
2) If ft does not settle, referto Probable Cause B, below.
1) It the grease content ex-coeds 15 percent by weightof the MISS, repair or re-place scum baffles asneeded:
2) If grease' content is excessive. implement anindustrial waste monitoringand enforcement program.
,
pg 11-95 &II-93
pg 11.95
.
pg 11.95
11

4
ACTIVATED SLUDGE PROCESSSECONDARY CLARIFIER
TROUBLESHOOTING GUIDE NO. 7 ASHING AND PINPOINTISTFIAGGLEIi FLOC (continued)
OBSERVATION. PROBABLE-CAUSE NECESSARY CHECK REMEDIES REFERENCES
3. Particles of straggler flocabout 1/41 .or larger,extending throughout theclarifier and dischargingover the weirs. Mixed liquorIn settleability test, settlesfairly well. Sludge does notcompact well at the bottomwith chunks of floc-suspended in fairly clearsupernatant.
.
.
A. Aeration tank slightlyunderioaded (Low MISS)due to organic loadchange.
1.
2.
Check and monitor trendchanges which occur inthe following:
a. Decrease in WYSS mgfl.
b. Decrease in MCRT.Gould Sludge Age.
c. Increasein FIM ratio.
d. Less aerat;cin, rate usedtomalntain D.O.
e. Increase in WAS rates.
f. Increase or decrease indrganic,losclIng(00D/COD in primaryeffluent).
Check for foaming inaeration tanks.
1)
2)
3)
4)
Decrease WAS rates by notmore than:10% per day tobring process back tooptimum control par.ameters for average organicloading.
,
Refer to TroubleshootingGuide No. 2 for eny foam.ing which may be occurringin aeration tank.
Adjust FrAirates to main.tein sludge blanket depthof 1 to; feetin clarifier.
Decrease aeration SCFMrates to maintain minimumD.O. of only 1.0 mei inaeration tank. Refer toTroubleshooting Guide No.1 for additionalobservations.
pg11.97 &11-36
.
.
r g11.29
pg 0.24
-.
r)
5253
A
O
ACTIVATED SW 00E-PROCESSSECT:01,4 PTROUSLESHOOTING
REFE-INCES
Eckentelder, W.W., Biological Waste Treatment, Peigamon Press, New York, 1961.
Hawkes. The Ecology of Waste Water Treatment, Peigamon Press, Oxford, 1963.
Kerri, Kenneth D., of at., (A Field Study Training Program', Operation 01 WastewaterTreatment Plants. (Chapter 7), Sacramento Scats College Department of CivilEngineering.
McKinney, Ross E.. Microbiology lot Sanitary Engineers, McGraw1-iiii Book CompanyInc.. New York,1962,
Stevens. Thompson, Runyan, inc.. Operator's Pocket Guide to Activated Sludge,Parts I and II. Published by the Authors. 5505 S.E. Mi$waukie Avenue, Portland,Oregon 97202,1975,
Water Pollution Control Federation, Operation of Wastewater Treatment Plants,Manual of Practice No 11,1078.
West. Alfred W., Operational Conti°, F:ocedures for the Activated Sludge Process,Parts I. II, VIA, and IIIB, U.S. EPA, National Training and Operational TechnologyCenter, Cincinnati, Ohio, 1975.
I.2,z 54
rat

lmportanaeoi eproperlycontrolledoceretIon.
AcceptablefaRget OMgiven herein
ACTIVATED SLUDGE PROCESSSECTION 0 PROCESS CONTROL
2.01 INTRODUCTION
The activated sludge process is reliable and has the ability to handle shockloads. It requires much more monitoring and control than the trickling biterprocess. Therefore, proper operation and control is essential to achieveoptimum performance and to avoid operational problems. Table 0.1 presentsguidelines to achieving successful process control.
The operating parameters given in this section are Intended as acceptableranges to guide the operator in achieving operational control at his plant.Operation and control of a particular activated sludge process should be basedon its response and performance as related to the control techniques applied.The success or failure in achieving the best posSibie performance from thetreatment plant is dependent on the operator. There are five process controltechniques presented under Waste Activated Sludge Control in this sectionof the manual. The operator should study each of these technqiees and applythe waste control program which he feels will provide the best effluent quality.
TABLE111
GUIDE TO SUCCESSFUL PROCESS CONTROL
REQUIREMENT
1. Sound operational and preventivemaintenance measures.
2. Laboratory monitoring
REFERENCE
Section 2.02,OPERATIONAL GUIDES
Section 4.02,LABORATORY SAMPLING ANDTESTING PROGRAM
3. Accurate, up-to-date records.
4.. Evaluation of operational and laboratorydata.
Appendix A,CPERATIONAL RECORDS
5. AppiicatIon of data to adjustment of theprocess.
B. Troubleshooting problems before theybecome serious.
Section 4.03.LABORATORY CONTROL TESTS
Section 2.04.PROCESS CONTROL
Section 1.02,TROUBLESHOOTING GUIDES

Competentpreventivemaintenanceprogram Isessential.
Competentprocesscontrolincludesonivalion ofprecastperformance
Many factorsaffect Processperformance
ACTIVATED SLUDGE PROCESSSECTION II. PROCESS CONTROL
2.02 OPERATIONAL GUIDES
Operational guides are prro.:eed on the following pages to aid the operator inestablishing routine operational procedures for his activated sludge process.
Performance of the routine operational procedures is by no means completewithout a competent preventive maintenance program. Every item of operatingequipment requires frequent attention, with particular emphasis on lubrica-tion and other preventive maintenance requirements essential to a troublefree operation and minirrium maintenance costs. A good preventive maintenanceprogram helps to ,mprove process performance through a longer moredependable equipment life.
2.03 PERFORMANCE EVALUATION
Evaluation of proses: performance is an essential part of compentent processcontrol and operation. The evaluation is helpful in determining processresponse io various modes of operation, developing performance trends, andidentifying the causes of operational problems. For the activated sludgep acess. performance evaluation consists of reviewing the BOO, COD, sue.pended matter, and nitrogen removal efficiencies to the mode of operation,NM parameters, and RAS and WAS rates in relationship to control parameterssuch as MCRT, Gould Sludge Age, and sludge quality. The review and applicalion of lab testing results is further discussed in Section IV "LABORATORYCONTROL" and "APPENDIX A".
Performance of the activated sludge process is affected by many factorssuch as. hydraulic and organic loadings, method of wastewater distributionto multiple tanks, characteristics of applied wastewater (temperature, pH,toxicants, etc.), and performance of other treatment units in the plant. Aneffective means of reviewing your plant performance is to maintain dailycharts or graphs reflecting such data against time. The charts presented InFigure 11:1 serve as visual aids in identifying the optimum control parametersand make any trends or changes immediately evident. The preparation anduse of these trend charts are discussed further in ",'APPENDIX A".
Conclusions reached during the process evaluation are then applied to theWe stment of the process (basically adjustment of RAS, WAS and aerationrates) for an efficient and economical operation. Whenever possible, only one
completesImportance 0 process adjustment should be made at a time to allow sufficient time between:idaccurate each change for the process to respond and stabilize. This is especially truerecords. when decisions are made to adjust FFM, MCRT and Gould Sludge Age, since
these parameters are directly related to changes in WAS rate. Complete andaccurate records of all phases of plant operations and maintenance areessential far accurate performance evaluation and process control. Thepreparation of operational records is discussed further in "APPENDIX A ",
56
11.2

ACTIVATED SLUDGE PROCESSSECTION 11- PROCESS CONTROL
I HI 11111.
1 III
II'L "u"Int
wE
0150
100
50
0 5 10 15DAY
20 25 so
ACTIVATED SLUDGE: DAGC ss(Five -day moving averate tron4 plata)
1I3
-FIGURE II-1
;4

0 5C.
ACTIVATED SLUDGE PROCESS
OPERATIONAL GUIDE NO. 'I - AERATION SYSTE
EQUIPMENT
A ,
SUGGESTED STEI1PROCEDURES DETAILS 1 FREQUENCY REFERENCE
A. Aeration tank. 1. Inspect for proper operation. la. Mechanical equipment.
lb. Presence of foaming on surface.
TwIcefshift
TO No. 24 4 I
lc. Boiling or uneven surface aerationpattern.
TO No. 1
2. Check D.O. level. 2a. D.O. In range of 1.0 to 3.0 mg/I. Every 2 hrs. pg 0.26
3. Perform routine washdown. 3a. Hose down inlet channels, tank wallsespecially at the water line, effluentbaffles, weirs and channels, and otherappurtenant equipment at water line.
Daily toweekly
/
4. Check control gates and gate operatorsfor proper operation.
4a. Operate gates and operators to fullopen and close position. Adjust gatesto proper position to equalize flowdistribution.
Twice:monthto monthly
4b. Lubricate as recommended by man.ufacturer.
5. Check froth spray system. if provided. Sa. Uhllug spray nozzles as necessary andcheck for proper spray angie.
Twicefshift
0. Inspect baffles and sf fluerit weirs. Ba. Maintain baffles in good condition. Monthly pp II.78Maintain effluent weirs at equalevaluation.
.
.

it .
ACTIVATED SLUDGE PROCESS
OPERATIONAL. GUIDE NO. 1 AERATION SYSTEM (c ntInued)
EQUIPMENT SUGGESTED STEP PROCEDURES
_DETAILS FREQUENCY REFERENCE/
B. Aeration Piping. 1. Inspect piping for teaks. ta. Visually observe and listen for leaks at Daily TG No. t, pipe and joint connections. 1 Observation
No.32 inspect diffuser header assemblies. 2a. Remove header assemblies from tank. Twice/year pg 1114
Check diffusers and connections fordamage and plugging.
^ 3. Check aeration pipe valves and diffuser 3a. Operate valves to full open and close Monthly TG No. t..-0 header assembly control valves for
Proper operation.position. Adjust valves to properposltons.
ObservationNo.2
4 Check air flow meters, gauges andcondensate traps.
4a. Check and calibrate meters and gaugesas recommended by manufacturer.
4b. Drain condensate traps. Daily
C Air Compressors(Centrifugal and positivePlacement)
t. Check air filters.,
la, Clean or replace filters as recommendedby manufacturer. . Generdily
dictated byclimaticconditions
2 Check operation of compressors andmotors.
2a. Check for excessive vibrations, unusualnoises, lubricant leakage, bearingoverheating
Twicelshift
2b. Check oil levels, if so equipped, main.Min proper levels.
2c. Check packing, mechanical sealsadjust and maintain as recommendedby manufacturer.
2d. Check compressor intake and dischargevalves for proper position. .
60 6J.

ACTIVATED SLUDGE PROCESS
OPERATIONAL -OUIDE NO. 1 AERATION SYSTEM (continued)
EQUIPMENT SUGGEfTED STEP PROCEDURES DETAILS FREQUENCY REFERENCE
4.-.
.
D. Mechanicalaerator,S.
....-,
.
3. Check compressor air discharge backpressure.
4. Perform regualr maintenance as recom.mended by manulactbrer.
5. Alternate compressors in service.
1. Check units for proper operation.
i
2. Maintain uni.s properly.
3a. Record back pressure. Increasing pressure is indicative of diffuser plugging:
...
I
la. Check for excessive vibration, unusualnoises, motor and gear box overheating.
lb.. Check for proper oil level in gear boxand proper motor lubrication.
lc. Check condition of bafflesif soequipped, and repair or replace asrequired.
2a. Follow manufacturer's instructions.
Daily
Daily :oweekly
Twice/shift
TO No. I.ObservationNo.3 .
S
ACTIVATED SLUDGE PROCESSD.
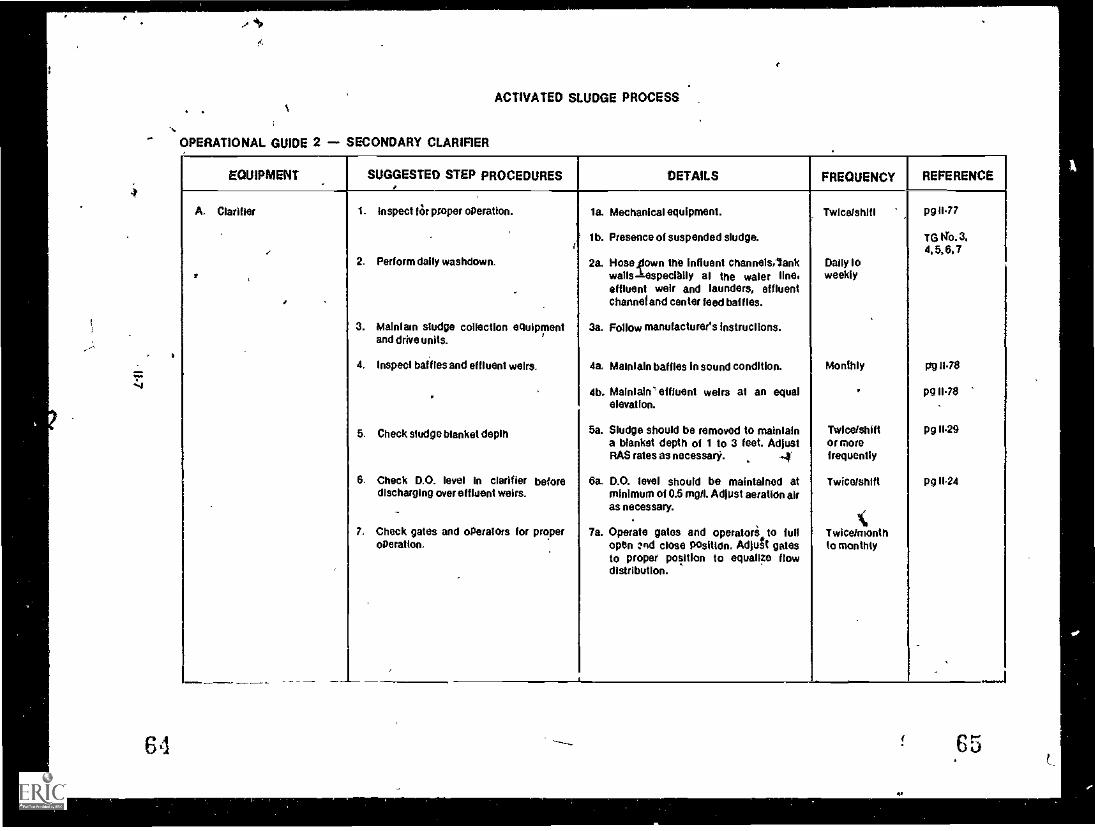
" OPERATIONAL GUIDE 2 SECONDARY CLARIFIER
EQUIPMENT . SUGGESTED STEP PROCEDURES,
DETAILS FREQUENCY REFERENCE
A. Clarifier 1. Inspect for proper operation.
t
la. Mechanical equipment.
lb. Presence of suspended sludge.
Twice/shift pg 11.77
TG t'To. 3,4.5,6.7
2. Perform daily washdown. 2a. Hosoulown the influent channels,lankwalls Aespecibily at the water line,effluent weir and launders, effluent
Daily toweekly
,
3. Maintain sludge collection equipmentand drive units.
4. Inspect baffles and effluent weirs.
channel and center feed baffles.
3a. Follow manufacturer's instructions.
4a. Maintain baffles in sound condition. Monthly pg 11.78
5. Check sludge blanket depth
6. Check D.O. level in clarifier beforedischarging over effluent weirs.
4b.. Maintain' effluent wain at an equalelevation.
5a. Sludge should be removed to maintaina blanket depth of 1 to 3 feet. AdjustRAS rates as necessar.
6a. D.O. level should be maintained atminimum of 0.5 mg11. Adjust aeration airas necessary.
Twice/shiftor morefrequently
TwicWshift
p911.78
pg 11.29
pg 1144
7. Check gates and operators for properoperation,
7a. Operate gates and operatoria to fullopen ;Ind close Position. Adjust gatesto proper position to equalize flowdistribution.
Twicelmonthto monthly
____ .. ... _._ ......_
64 65
4.
1fl

s
)
ACTIVATED SLUDGE PROCESS
....,,OPERATIONAL GUIDE 3 PUMPING EQUIPMENT AND PIPING IN RAS D WAS SYSTEMS
EQU MENT
A. Pumps
,._
SUGGESTED STEP PROCEDURES DETAILSseFREQUENCY
I. Check operation of the pumps andmotors. .
2. Aternate pumps in service.
3. Maintain pumping units.
4. Fully open and close all valves%
5. Check Operation of air vacuum and airrelief valves.
r6. Check Op Oration of any pump controls
and instrumentation, such as flowmeters, density meters. control Signalloop. .
to Check for excessive vibre)on. unusualnoises. lubricant Pakage, andoverheating. -1.1.
lb. Check oil reservoir levelif so equipped.
lc. Check oil feed rateif 30 equipped.
Id. Check packing or mechanical sealsmake adjustment per manufacturer'sinstructions.
le. Check position of suction and dischargevalves.
lf. Check pump suction and discharge .pressureIf so equipped.
3a. Foy low manufacturer's instructions.
4a. Make necessary adjustments or repairs.
4b. Maintain valves and operators accordingto manufacturer's instructions.
Sa. Maintain accord' 4 to manufacturer'sinstructions.
6a. Maintain according to manufacturer'sInstructions.
Tvecefshift
Daily toweekly
Monthly
Weekly
Daily
REFERENCE
NI
...
.

flocycled tioilt4may OHMCfferbedid2-
littelIresue theafflict *4/*cycled ili:AkA
Astatioit isimpritmt topritcrocroill...i.
lye:bask:catamontre*iouie
ACTIVATED SLUDGE PROCESSSECTI011 li PROCESS CONTROL
Review el In-Plant Recycled Flows
In evaluating the performance of the process or In trying to solve problems.Careful consideration should be given to all in-plant recycled lions. Often,in.plant recycled flows are the cause of organic or hydraulic overloading. ThesludGa processing Operations may return decants from digesters, thickeners,Centrifuges, or vacuum filters The waste backwash water from effluent sandNitration processes may also cause hydraulic overloading or other processCOMM' problbms_ The recycled flow from improperly operated sludge pro-cessing units may account for as much as 25 percent of the total plant organicloading. Usually, the majority -of recycled flows are passed back 10 pyjmarySedimentation units where it is hoped organic Solids will settle out In most'Cases this practice is the major cause of overloading biological processesdue to poor removal of solids in the recycled flows Sent to the primary Sethmentation units
The adc.iitionai loading .wit then result in a greater sludge nroduction, andSubsequently an increased loading upon the sludge proceosing operation,in the activated sludge process, excessive BOO or COD ICie rigs will even.tually reduce effluent quality and possibly cause artaervom conditions tooccur in the process
Some guidelines that w.11 reduce the eliecis of recycled flows On the activatedsludge process include the following
I Add flow continuously or during low night flows to avoid shock 'odds,....., Improve efficiency of sludge handling process3 Utilize a lae0on or drying bed k moor quality decants from sludgc
processing operations4 Avoid pumping ex ess water to sludge handling processes5 Aerate or pretreat recycled flows to reduce oxygen demands
Aeration Performance
A great deal can be learned about the operation of an actuated sludge processby re..iew.ng aeration requirements and performance. Basically, the mixedliquor ., a s%'spenS,on of microorganism that consume the organic matter inthe wastewater while utilizing Ca isSolved oxygen and releasing caibon dioxideto produce new Cell growth
The air 'equii ernent is dependent upon 'the. oxygen transfer rate to the mixedliquor and the utilization of the eissolved oxygen by the microorganisms. Theoxygen transfer rate is chiefly dependent on the design of the. aeration systern. The rate of dissolved oxygen utilization is dependent uron the it io-organIsm activity as it relates to organic loading. pH, temperature. aer,.t. inperiod and availability of dissolved oxygen The am requirements may be basedon more than one parameter The most frequently used parameters by opeiators include the amount of air applied per pound COD or SOD removed (CFairilb removed) in the prce ss and the amount of air applied per gallon of:fiaSiewatet treated (CF airiciali Typr_tai aeration rates tor these parametersare prekleoled in Table H
I ! 4

r.
Astalonrequirementschange whenProcess isnitrifying.
How tocalculate CFMali) removed.
tocalculateAirtgal
ACTIVATED SLUDGE PROCESSSECTION II PROCESS CONTROL
TABLE h-.
TYPICAL AIR REQUIREMENT PARAMETERS
Diffused AerationSystem
CF Air/Gal
Mechanical Aeration SystemSystem
lbs 02 lbs RemovedCF Air/lb Removed
COD BOD COD BOD
1000 2000 PO -16600 0.5 - 3.0 1.5.1.8 1.0 1.2
When evaluating aeration requirements, remember that the 6day BOD, andthe COD only reflect the carbonaceous portion of the organic loading and notthe nitrogenous portion of the organic loading. The aeration requirementswill be affected by the degree of nitrification as it relates to the nitrogenousstrength of the organic loading as well as by the wastewater temperatureand pH.
The aeration performance parameters can be determined as follows:
Example Calculation
A. Data Required1. COD or BOD removed, lbsiday = 22,000 BOD2. Total Air applied, CF /day = 31,900,000
B. Determine CF wall) COD or BOD removed.
CF Alrlib removed Total air applied
BOD, lbsIday
31,900,000
22,000
= 1450
Example Calculation
A. Data Required:1. Total air applied, CF/day = 31,900,0002. Total influent flow/day to aeration tank, gpd = 13,000,000
(exclude RAS flow rate)
B. Determine CF aidgal wastewater treated
CF airlgal = Total air appliedTotal flow, gpd
31,900,000
13,000.000
_2.4
110

Now tocalculatotbcOtilbramoyadtieingmechanicalaerators.
Microorganismsrelationshipto MLVSS
Typically10-110% delaMLSS in vslatila
4
ACTIVATED SLUDGE PROMSSECTION II. PROCESS CONTROL
Example Calculation
A. Data Required1. COD or BOD removed, lbs/day = 7200 BOD2. n = Number of aerators In service = 33. hp = horsepower per aerator = 1004. FTR = Field transfer rate, each aerator, ibs 02/hp/hr = 2
(supplied by aerator manufacturer)5. T = Time aerators in service, days = 0.83*
'This is determined by dividing the time each aerator is in service by
24 hourslday: Hours in services days24 hourslday
B. Determine lbs 0211b COD or BOD removed
lbs 021lb removed = (n x hp x FTR x T x_24 hrslday)COD 1r BOD removed, lbs/day
..(3x100x2x0.83x24)7200
15,936
7200
= 1,6
Solids Inventory
The amount of suspended matter (SS) that makes up the mixed liquor consistsof living and nonliving organic matter. The living organic matter is referred toas being active." The "active" portion of the SS is of major Importance be.cause inclueed in this portion a:e the rr.frroorganisms responsible for treatingthe wastewater. The more accurately the concentration of active micro-organisms is known, the more consistently the activated sludge process canbe controlled.
Many attempts have been made to accurately measure the "active" concentration of the SS. The most common means of estimating the microorganismconcentration is the measurement of volatile suspi nded matter (VSS). All theorganic material in the SS burns to carbon dioxide and water in the VSSdetermination. Typically, 70.80 percent of the MLSS will be VSS. The VSSdetermination provides a crude approximation of the concentration of livingbiological solids because the VSS also.iticiudes a rionliving fraction. Even so,the VSS has been found to be an acceptable representation of "active" livingmicroorganisms in activated sludge.

s
A key tosuccessful ,
Process controlIs representativeMLSS sampling.
Accurst*PALVSS samplesvery important
MLSS samplesused gocalculate theVolatile Solidsinventory
SOW, inventorycedes directlywith MCRT
Should toilds Ithe clingier beroJasured Irsolidsinventory?
1-
ACTIVATED SLUDGE PROCESS .SECTION II PROCESS CONTROL
Samples of MLSS must be taken at several locations in the aeration tank toensure that a representative sample of the microorganism concentration iscollected. In general, each compartmenlof an aeration tank must be sampled_Similarly, aeration tanks that are long and narrow must be sampled at bothends and at a midpoint to ensure that a representative sample of the mixedliquor is collected. Sampling techniques to obtain representative MLSSsamples are discussed in Section IV "LABORATORY CONTROL".
Good sampling procedures are essential for making a meaningful estimate ofthe microorganism concentration, and samples for MLSS must be takenusing a consistent technique. There are two acceptable approaches forobtaining a mixed liquor sample:
1. Composite samples may be taken at consistent intervals throughoutthe day from the same locations in the aeration tank.
2. Grap samples taken at the same time each day at the Same locationsin the aeration tank.
Either of these approaches will produce suitable samples:The first methodrequires a refrigerated automatic sampleovhile the second method has theacrontages of not depending on a sophisticated sampler and of developinga r tine for sampling and observation of the aeration tank. Other m3thods ofsaMpling, such as grab samples taken at various times will produce lesssatisfactory estimates of the MLSS.
The importance of the MLSS samples cannot be over emphasized. It is important to remember that accurate and representative samples are the key tocontrolling the activated sludge process.
Calculating the Solids inventory
The purpose of collecting samples of MLSS is to develop an estimate ofthe amount of microorganisms in the treatment system by determiningthe VSS content in the MLSS. The amount of microorganisms (VSS) in thetreatment system is the .14-lide Inventory. The solids inventory must beknown in order to properly control the activated sludge process.
The solids inventory is used to determine NM, MCRT and the amount ofactivated sludge that should be wasted. The solids Inventory varies directlywith the WRT, that is as the MCRT increases the solids inventory in-creases. It also varies inversely with the NM, that is, as the NM increasesth 3olids Inventory decreases.
A reourrino discussion in the technical literature involves the question ofwhether the solids in the clarifier should be considered as pad of thesolids inverlorv. At Present, there is no one answer to the question;however, ail ca. ,tions involving NM or MCRT must be made using thesame solids inventory.

Argumentsagainst.
Argument for.
In genera,, noneed tomeasure thesesolids.
How toosier:lets solidsInventory In theaeration tank.
How tocalculate thesecondaryolerifler solidsInventory.
ACTIVATED SLUDGE PROCESSSECTION II PROCESS CONTROL
There are three basic arguments for not Including the solids in the clarifier.First, the microorganisms in the system cannot grow due to food andoxygen limitations when they are in the clarifier. Second, loading para-meters for the activated sludge process were first developed on the basisof pounds of SOD applied per 1,000 cubic feet of aeration tank, whichIgnores the solids in the clarifier. Third, the amount of solids in the clarifieris not a very significant (less than 10 percent of the total) fraction of thetotal solids in the process.
The argument in favor of including the clarifier solids in the soilds Inven-tory lesimply that these solids are significant and they cannot be Ignored.Additionally, if all of the scalds are included in the calculations there isless likelihood of making an error in the total solids Inventory that existsin the process. Finally, errors In the inventory amount would most likelybe significant at times when operational problems are ex*erienced I.e.when the sludge is not settling well in the clarifier.
The consequences of ignoring the solids in the clarifier will not affectprocess control adjustments In most cases; and It is suggested thatoperators use this approach when determining the solids inventory. Ifignoring the solids in the clarifier makes process control Inconsistent asobserved by variations in effluent quality, then the operator should con-sider including the clarifier solids when he determines the solids inventory
Solids .nventory for a typical activated slue.,e process may be calculatedas follows:
Example Calculation
A. Data Required:1. Aeration tank volume, mg = 1.22. Number of tanks In service = 23. MLSS concentration, mgrl = 22004. Percent VSS in MSS, .72
100B. Determine total pound" VSS In aeration lank,
lbs VSSInventory = (Aft. Tank Vor)(No, of tanks) (MLSS) (% VSS)(8.341boldol.)Mr. tank
= (1.2) (2) (2200) (.72) (8.34)
= 31,705
if the clarifier is included in determining the solids inventory, the volumeof sludge in the clarifier must be determined by measuring the sludgeblanket in the clarifier and obtaining an average depth. The depth meas-urement from the water surface to the top of the sludge blanket is substraced from the average clarifier depth to determine the average sludgedepth in the clarifier. The average sludge depth Is then multiplied by thesurface area of the clarifier to obtain the volume expressed as cubic feetwhich must be multiplied by 7.48 gallcu ft and divided by ona million toconvert the volume to million gallons (mg) of sludge.
11.13
ti
'`hACTIVATED SLUDGE PROCESSSECTION II - PROCESS CONTROL
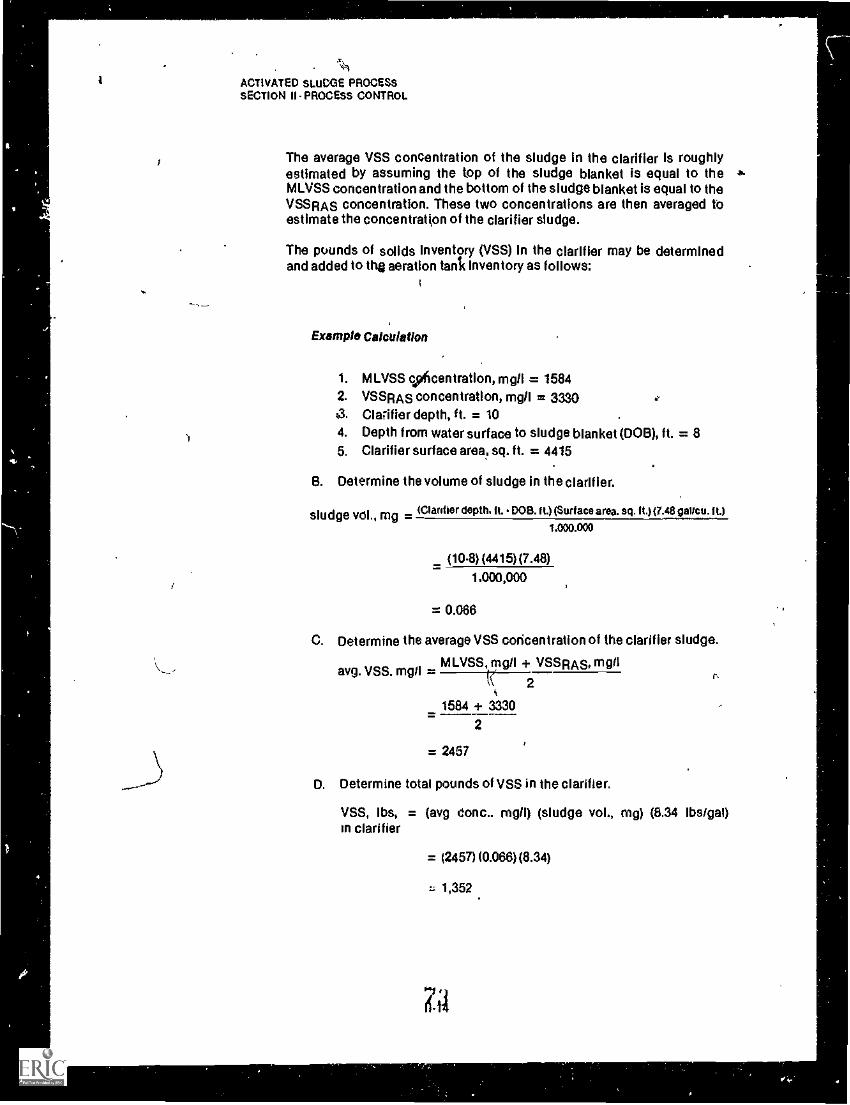
The average VSS concentration of the sludge In the clarifier is roughlyestimated by assuming the top of the sludge blanket Is equal to theMLVSS concentration and the bottom of the sludge blanket is equal to theVSSRAS concentration. These two concentrations are then averaged toestimate the concentration of the clarifier sludge.
The pounds of solids inventory (VSS) in the clarifier may be determinedand added to the aeration WI inventory as follows:
Example Calculation
1, MLVSS cAcentration, mg/I = 15842. VSSRAS concentration, mgll = 3330a Clarifier depth, it. = 104. Depth from water surface to sludge blanket (DOB), ft. = 85. Clarifier surface area, sq. ft. = 4415
B. Determine the volume of sludge in the clarifier.
sludge vol., mg (Clarifier depth. ft. DOB. IL) (Surface area. sq. it.)(7.48 gallcu. fl)
1.000.000
(10.8) (4415) (7.48)
1,000,000
= 0.066
C. Determine the average VSS concentration of the clarifier sludge.
avg. VSS. mgllMLVSS, mgll VSSRAs, mgll
2
1584 + 3330
2
= 2457
D. Determine total pounds of VSS in the clarifier.
VSS, Ibs, = (avg dom.. mgll) (sludge vol., mg) (8.34 lbsigal)in clarifier
= (2457) (0.066) (8.34)
1,352

Whet NO therellebteIndicators ofprocessperformance?
Suspendedmatter isrelated to SOD.
COWOODramous!expressed es 1/4
° ACTIVATED SLUDGE PROCESSSECTION II PROCESS CONTROL
E. Determine the total VSS inventory by adding the clarifier VSSinventory to the aeration tank VSS inventory.
* ,
Total VSS, lbs - MLVSS, lbs + Clarifier VSS, lbs
= 31,705 + 1,352
33,057
CO01000 and Suspended Matter Removal
The activated sludge process is designed to remove a high percentage of theCOD/BOD and suspended matter when operated within the proper loadingrange. The removal efficiency of these constituents are very reliable indicatorsof process performance. If the efficiency dtops below the expected designperformance, action should be taken to locate the reason for the decreasedefficiency. Operational records, process control parameters, lab analysis, andwastewaterlaracteristics should be reviewed and analyzed when trying tolocate the pr blem. The information gained from the evaluation should beimplemented into the operation of the unit process. The best practice whenmaking operational changes Is to make one change at a time and then allowsufficient time (usually two to four weeks) between changes for stabilizationof the biological process.
The activated sludge process is also designed to produce an effluent having asuspended matter content of 20 mg/I or less when operated within the properloading range. Much of the secondary effluent SOD will be directly related tothe amount of suspended matter that has escaped with the clarifier effluentflow. Careless operational procedures will result in an increased secondaryeffluent BOD. Hence, the evaluation of the unit process performance in regardto the suspended matter removal is valuable in improving both the suspendedmatter and CODIBOD removals. An increase of the secondary effluent suspended matter is an indication that the process is not performing as ifoshould.The process control parameters, operational records, and wastewater chapacteristics should be reviewed and analyzed to determine what action shouldbe taken to restore the desired process performance. For guidance in thetroubleshooting of high effluent suspended solids, refer to Section I, -TROD.BLESHOOTING".
The COD/80D and suspended matter removals are normally expressed aspercentages. These parameters should be recorded daily. The CODIBOD andsuspended matter removals are all calculated by using the same formula. Theexample calculation given below shows how to determine the suspendedmatter removal efficiency.
11.157,

v,
Kinetics eremath shorthand lorcontrollingthe process.
NIA
MCRT
MK PAC RT.
Km T
t,
t
ACTIVATED, SLUDGE PROCESSSECTION II PROCESS CONTROL
Example Calc..:atlon
A. Data Required
, 1. Primary effluent suspended matter, mgll = 160 (COD cd BOO)
2. Secondary effluent suspended matter; mgll = 14 (CODor BOO)
B. Determine percent removal of suspended matter.
Removal efficiency, % Influent SS. effluent SS x 100Infuent SS
= 16° '14 x 100160
= 91
Process Kinetics
A great deal of effort and a large number of Publications have been put forthto describe the activated sludge process. The major accomplishment of theseefforts has been the development of an approach to activated sludge designand operation that is based on the kinetics of microorganism growth. Theterm kinetics normally refers to the rate at which chemical or biologicalreactions occur, however, microorganism growth kinetics are nothing morethan expressions that relate organic leading to the production of new micro-organisms,
The concepts c.. activated sludge kinetics enables engineers to design waste-water treatment plants on a logical and systematic basis.
There are two basic concepts, the food to microorganism ratio (FIM) and themean cell residence time (MCRT), that are expressed in the form shown below,
Food to microorganism ratio = F/M. <. lbs COD applied per day
lbs VSS inventory
Mean cell residence time = MCRT =lbs solids inventory
lbs VSS produced per day
Kinetic Relationships
The F/M and the MCRT are related by two constants that are called theYield coefficient, Y and the Endogenous Decay coefficient, KD. The Yieldcoefficient expresses the ratio of the amount of microorganisms producedto the amount of food (BOO or COD) consumed. The Yield aefficient ismeasured by operating the activated sludge process at several values ofMCRT. Typical values of Y based on COD, for domestic wastewater rangefrom 0.3 to 0.4 lbs VSS produced/lb COD removed. The Endogenous Decaycoefficient expresses the decrease in active mass of microorganism-Meto endogenous metabolism. This coefficient is typically about 0.06 lbsVSS decayed per day/lb solids inventory.

WAT relatedto the Flit
How tocalculate MCRT.
ACTIVATED SLUDGE PROCESSSECTION It PROCESS CONTROL
The MCRT is related to the F/M as shown below:
MCRT, days =1 ,
(V) (FIM) (Removal efficiency) KD
where,y = lbs. VSS produced per lb. COD removed per day
Foil lbs. COD applied per day
lbs. VSS inventory
Influent COD, mg/I - Effluent COD*, mg/IRemoval efficiency , x 100Influent COD, mg/I
KD = lbs. VSS decay per day per lb. VSS inventory
'Soluble COD, see Section IV, "LABORATORY CONTROL".
The following example calculations show the interrelationihip of MCRT,microorganism growth, and FIM.
Example Calculation
A. Data Required1. F/M = 0.55 lbs COD applied/day/lb MLVSS2. Y = 0.35 lbs VSS prOduced per lb COD removed3. . KD = 0.05 lbs decay per day/lb MLVSS
4. Eff. x COD removal efficiency x 90% (0.90)5. MCRT = 8.1 days6. Ynet = Net sludge yield = 0.249 lbs VSS per lb COD
removed/day
B. Determine the MCRT using kinetics.
MCRT, days =1
(Y)(F/M)(eff) K D
I(0.35) (0.55) (0.90) 0.05
= 1 , 1= ...____0.173 - 0.65 \ 0.123
= 8.1
I
This indicates that an amount of VSS equal to the solids inventory mustbbl wasted from the process in a 8.1 day period to maintain a constantMCRT.
7C

How tocalculate Y ass ratio.
Howiocsicuiate Y as%Iday.
How tocalculate FIMwhen MCRT,end'.efficiency Isknown.
ACTIVATED SLUDGE PROCESSSECTION II PROCESS CONTROL
C. Determine the net sludge yield (net growth rate) expressed as aratio of lbs VSS/lb COD removed/day.
Ynet, ratio = 1
(MCRT)(F/M)(Ef f.)
1
(841) (0.55) (0.90)
= 0.249 lbs VSS/Ib COD removpdiday
D. Determine the net sludge yield (net growth rate) expressed aspercent of the solids inventory (SI).
Ynet, %lday = (Ynet, ratio) (FIM) (Eff) (100%)
= (0.249) (0.55) (0.90) (100%)
= 12.3 % of solids inventory
OR
Ynet, %lday = [(Y) (FIM) (Eff)- KD) 100%
= ((0.35) (0.55) (0.90) 0.051 100%
j0.173 0.05) 100%
= 12.3% of solids inventory
This indicates that about 12.3 percent of the solids inventory would haveto be wasted per day to maintain a constant MLVSS or FIM assurtiing thatether conditions are not changing significantly.
E. Determine the FIM when the MCRT, net sludge yield, and removalefficiency are known.
.F/M= 1
(MCAT) (Ynet} (Eff.)
1
(,81) (0.249) (0.90)
= 0.55 lbs COD applied/lb solids Inventory
Solids inventory All the kinetic calculations must be based on the same solids in-must always be ventoryeither the MLVSS under aeration or the total VSS in thecalculated .activated sludge process.awn. War.
1,4-7
11.181

ApproximaterelationahlP elthe MCAT latheFU..
ACTIVATED SLUDGE PROCESSSECTION 11-PROCESS CONTROL
Table 11.3 presents the relationship of MCRT to FIM for two values of the Yieldcoefficient.
MCRT
TABLE I1-3
..
APPROXIMATE RELATIONSHIP OF THEF1M TeTHE MCRT(K0 = 0.05 per day)
"FIM Range (COO)
A
Y = 0.3 Y = 0.4
20 0.33 0.25it .* 0.39 0.2910 0.50 0.38
7:5 0.61 0.46
5 0.83 0.63
2.5 1.50 1.13
A similar table can be developed for the relationship of MCRT and FIM whenBOO is used instead of COD. A typical range of values for the Yield coefficientfor domestic wastewater on a BOO basis is 0.5 to 0.6 lbs MLVSS pro'uced per .lb of BOO removed. The value of KO remains at 0.05 per day. Table 114 presehtsthejelationship of the MCRT to the F!M for two values of the Yield coefficient:
TABLE 04
APPROXIMATE RELATIONSHIP OF THE =.FIM TO THE MCRT(KD = 0.05 per day)
)
MCRT
F!M Range (BOO)
Y = 0.5 Y = 0.6
20 0.20 0.17
15 0.23 0.19
10 0.304
0.25
7.5 0.37 0.30
0.50 0.423 0.77 0.64
"FIM expressed as lbs removed/day/lb VS inventory,., o express the FIM aslbs appliedldayllb VSS inventory, divide the FIM presented in the Table bythe removal efficiency (as 'A) of the treatment process.

SOMjdisiond tonitrify.
Whitestablish"'nitrification?
How do'snitrificationoccur?
Whit schlvisnitrificanon?
I
Whit affectsnitrification?
ACTIVATED SLUDGE PROCESSSECTION II PROCESS CONTROL
Nitrification
Many activated siudga procassas ara dasigned to attain a high degraa ofnitrification. This section is denied to evaluation of tha process parformancabasad on nitrification.
The degree of nitrificationtihat must be attained' in the activatad aludgaprocass is dictatad by tha maximum allowabla limit of ammonia nitrogendischarged with the final efflukit. This limit is usually govarnad by the NPDESparmit issued by Stata or Facceral ragulatory agancias.
In fresh wastawater tha nitrogan prasent predominatas as organic nitrogan.Aa tha organic mattar in tha wastawatar decomposes, a portion of tha organicnitrogan is convarted to ammonia nitrogan. Whan the waatewater is sufflcianty aeratad, nitrifying bactaria will convert the ammonia nitrogen to nitritanitrogen and subsaquently to nitrata nitrogen. Nitrate represants tha finalform of nitrogan resulting from tha oxidation of nitrogenous compounds inthe wastewater. The nitrogan cycle is illustrated in Figura IR.
To achlave the desired degree of nitrification, the Maan Cap Rasidenca Timemust be long anouqh (usually 10 days plus) to allow tha nitrifying bacteriasufficient time to cqnvart nitroganous compounds to nitrate nitrogan. Sincethe nitrifying bacteria grow much slower than tha bactaria utilizing the car-bonaceous compounds, it is possible to wasta the nitrifying bacteria from thasystem at a highar rata than their growth rata.
The factors af (acting the growth rate of tha nitrifyinb bactaria are primarily,DO, pH, temparatura, and the availability of nitrogenous food.
The DO in tha aaration tank must usually ba 1.0 mglI or greatar whan oparatingthe process to nitrify. Nitrification exerts a substantial oxygen raquirement.The oxygen iequirament may be calculated as follows:
NH3, oxidation = lbs NH3 x 4.6 = 021baiday
Tha optimum pH ranga is 7.9 to 8.9; however, tha range of 7.6 to 7.8 is recom-mended in ordar to allow eacape of tha carbon dioxide to the atmoaphere.Theoretically, 7.1 lbs of CaCO3 alkalinity ara destroyad per pound of ammonianitrogen oxidized, thua resulting in a decraaaing pH within the aaration tank.
Tha optimum temperature range is 15° to 35° C. Tha growth rite of nitrifyingbacteria increasas as tha wastewater temperatura Increasas and converadyit dacreases as the waatewataf temparature decreaaee. Since theca is nocontrol ovar tha wastawater temperature, compensation for aiower wintargrowth rates by incraasing the MCRT and maintaining the pH within tharecommandad rang must be mada.
The growth rata of nitrifying bacteria is affectad vary little by tha organicload applied. Howaver, tha population of the nitrifying bactaria will ba ilmitadby tha amount of nitrogenous food aval:abla in the wastewater.
1120 7,9
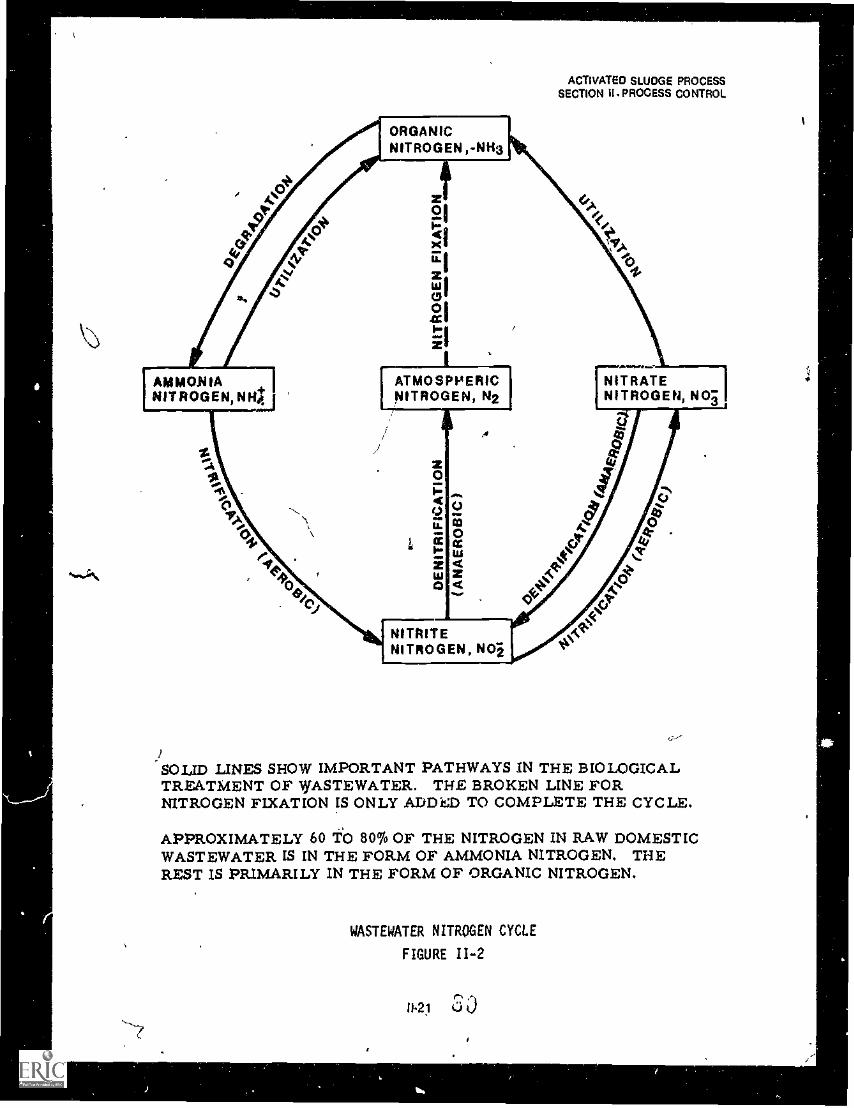
ACTIVATED SLUDGE PROCESSSECTION II. PROCESS CONTROL
ATMOSPHERICNITROGEN, N2
i
iSOLID LINES SHOW IMPORTANT PATHWAYS IN THE BIOLOGICALTREATMENT OF WASTEWATER. THE BROKEN LINE FORNITROGEN FIXATION IS ONLY ADDED TO COMPLETE THE CYCLE.
APPROXIMATELY 60 TO 80% OF THE NITROGEN IN RAW DOMESTICWASTEWATER IS IN THE FORM OF AMMONIA NITROGEN. THEREST IS PRIMARILY IN THE FORM OF ORGANIC NITROGEN.
WASTEWATER NITROGEN CYCLE
FIGURE I1-2

e
Considerationsfornitrilication.
Clarifiers servea dualpurpose.
How tocalculatesurfaceoverflow rate.
ACTIVATED SLUDGE PROCESSSECTION 11 PROCESS CONTROL
When reviewing the performance of the activated sludge process for theselection of an optimum F/M ratio; MCRT or Gould Sludge Age must beconsidered along with nitrification requirements. These barometers shouldbe selected to provide the degree of nitrification required by the dischargepermit. IF the ammonia nitrogen limit is beim" exceeded, the MCRT or GouldSludge Age should be increased. Increasing these parameters will increasethe MLVSS and consequently decrease the NM ratio. With the other condi-tions constant, a definite relationship will exist between the weight ratio ofthe ammonia nitrogen oxidized per day to the MUSS under aeration.
The growth of cell mass from the oxidation of ammonia is about 0.05 lbs perlb of ammonia nitrogen oxidized. As a result the degree of nitrification willhave little effect on the next sludge yield and WAS rates.
Secondary Clarifiers
iClarifiers in the activated sludge process serve dual purpose. They mustprovide a clarified effluent and a cOnCentra source of return sludge formaintaining process control. Adequatea a and depth is essential to allowthe aeration tank effluent (MLSS) to-ofttie and compact without carry over ofsolids in the clarified lifluent.Tprevent solids carry °lief, secondary clari-fiers are designed to beppe-(ated within given parameters. These parametersinclude the surface overflow rate (gpdlsq. ft.) and solids loading rate (lbssot idsidayisq. ft.). Typical ranges for these parameters are prepented in Table11.5.
TABLE 11-5
TYPICAL DESIGN PARAMETERS FOR SECONDARY CLARIFIERS
Process 1
Variation
Surface Overflow' 1
Rate
igpdlsq ft
SolidsLoadingt
lb solidsldaylsq ft
DepthAverage Peak Average,
Peak-- -
High rateConventional andSludge Reaeration
400.800
_
1,000-1,200 20-30 50
ft
12-15
Extended Aeration 200.400 800 20.30 50 12.15
1 Allowable solids loadings are generally governedassociated with cold weather operations.
' Source: "Design Manual for Upgrading ExistingEPA Technology Transfer, 1974.
11.22 81.
by sludge settling characteristics
Wastewater Treatment Facilities",
,
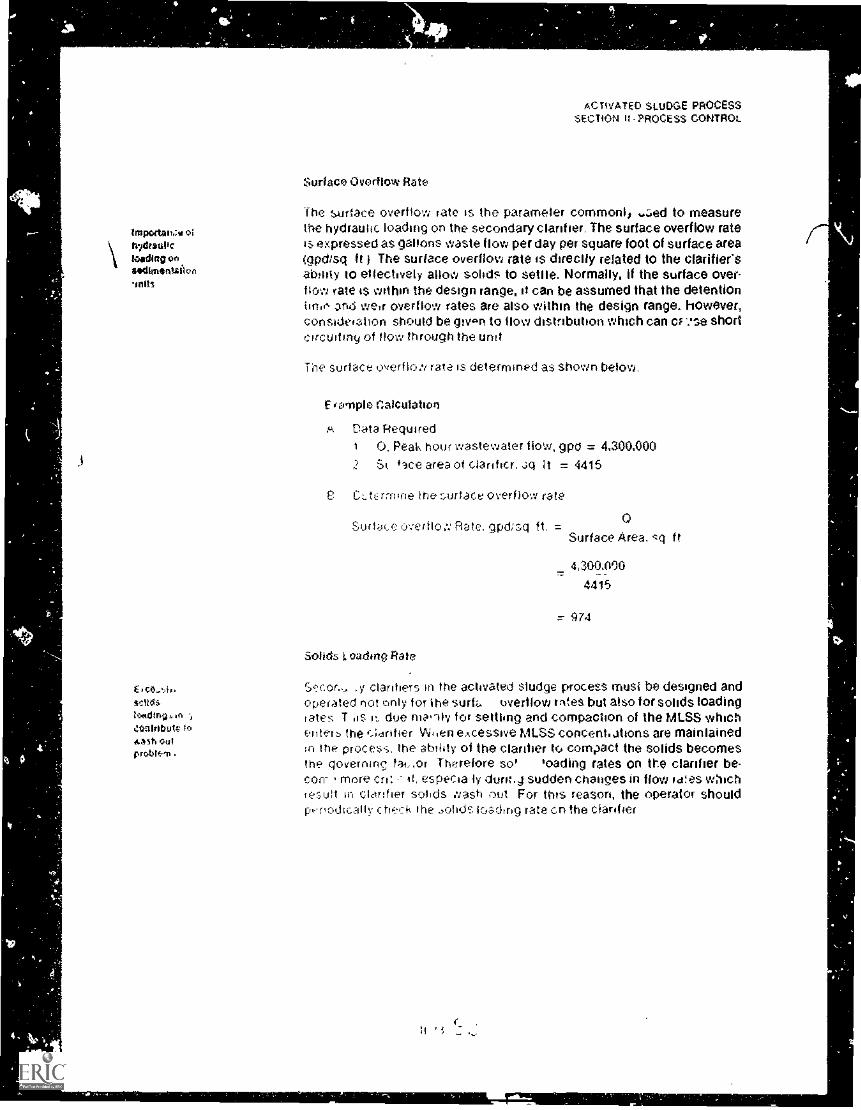
8
V
irtsporisim;troltridesulictoadlitavn
laws
tarrritngertatribUttwaxA rutprobit,r1
ACT4VATE0 SLUDGE PROCESSSECTION It- PROCESS CONTROL
Surface Overflow Rate
The surface overflow rate is the parameter commonly ,..5ed to measurethe hydraulic loading on the secondary clarifier. The surface overflow rate*expressed as gallons waste flow per day per square foot of surface area(opdisct ft ) The surface overflow rate is directly related to the clarifier'sability to effectively allow solids to settle, Normally, if the surface over-flow rate is within the design range, st can be assumed that the detentiontime, one weir overflow rates are also within the design range, however,consideration should be givan to flow distribution which can Cf ?Se shortcircuitirry of flow through the unit
The surface overfloN rate is determined as shown below.
E ample: Calculation
Data Required1 0. Peal. hour wastewater flow, gpd = 4,300,0002 St face area of clanficr. Jo it = 4415
6 C:.tcrrrnne the :-..urtace overflow rate
surt;:ice overflo:. Rate. gpd;sg ft. = 0
Solids 1. oarien9 Rate
Surface Area, ft
4,300,000
4415
974
y clarifiers in the activated sludge process must be designed andoperated not only for the surf4 overflow rites but also for solids loadingrates T iis it due 11)211y for settling and compaction of the MLSS whichenters the (.;arifier eAcessive MLSS comenhattorts are maintainedin the process. the ability of the clarifier to compact the solids becomesthe governing fai.or Therefore so' oading rates on the clarifier be-con- more crr: it, especia ly clurn.4 sudden changes in flow rates whichfe.sult in clarifier solids wash out For this reason, the operator should
check the ,olitisictscling rate cn the clarifier

S
00 above
ACTIVATED SLUDGE PROCESSSECTION II PROCESS CONTROL
The solids loading rate is determined as shown below:
Example Ceculation
mgli A. Cola Required1. CI, Peak hour wastewater flow, mgd = 4.32. ORAS, RAS flow rate, mgd = 1.33. MISS concentration, mgli = 29004. Surface area of clarifier, sq. ft. = 4415
Selectoperatingparameters forbestpe rformancewith least cost.
Proper D.O.
Frequency ofD.O. monitoring.
B. Determine solids loo ingrate.
(C) CIRAS)(MLSS)(8.34 bs/gal)lbs solidsiday/sq ftSurface Area, sq. ft.
(4.3 + 1.3) (2900) (8.34)
4415
104,ob0
4415
= 23.5
2.04 PROCESS CONTROL
Control of the activated sludge process cor sist of reviewing operating dataand lab test resims to select the proper operational parameters (such as FIM,MCAT, Gould Sludge Age, MLSS concentrations, and sludge cuality in relationto RAS and WAS control rates) that provide the best performance at the leastcost. The plant operator must be both cost-conscious and concerned with theconst.ution of power as well as the production of an effluent that will meetdischarge r _ wirements. For example, to conserve power and minimize oper-ational costs, the operator should select and utilize the control parameterswhich will provide the required performance so as not to reduce the quality ofactivated sludge and subsequently the quality of secondary effluent.
Aeration and D.O. Control
The J.Q. concentration in the alration tank should normally be maintainedbetween 1.0 and 3.0 mg/I. It is belicived that a D.O. concentration greater than1,0 mgli should be maintained in the aeration tank at all times to get adequatemixing and microorganism activity. If nitrification is required and the D.O.concentration is allowed to drop below 1.0 mg/I, nitrifying microorganismswill become less active and may possible die off. Conversely, cveraerationmay result in the breakup of the MLSS floc particles which will appear on thesecondary clarifier surface.
It is very important that the operator monitor the aeration, tank 0.0. levels andair flow rates perioaically (every 2 hours is suggested) to make aopropriatt- etcrate adjustments as required. if 0.0. monitoring instrument' :son' isit is imperative that it be properly maintained a,xicalibrated to provide valuesthat are valid and reliable.
11-24
b"..3

Effect ofexcessive airrein.
Need wellflitting MUSSto return loth,mixed liquor.
ACTIVATED SLUDGE PROCESSSECTION Ii PROCESS MOROI.
Since the power costs for operating the activated sludge process are h,gh,excessive air rates are not only wasteful but also expensive and may result inpoor sludge settling characteristics in the secondary clarifiers.
The concentration of D.O. In the mixed liquor must be sufficient to ensurethat oxygen is available for the microorganisms. When oxygen limits thegrowth of the micmorgan,sms, the settleabllity and quality of the activatedsludge may be poor, Poor sludge settling has bt.aq associated with 0,0. concentrations below 0.5 mg/I in the aeration basin. Ikocedures for monitoringand mall; raining aeration and D.O. control are prelsnted In Table 11.6 Theoperator may develop detailed standard operating procedures (SOP) for hisplant by utilizing this table.
Return Activated Sludge Control
To properly operate the activated sludge process, a good settling mixed liquormust be achieved and maintained. The MLSS are settled in a clarifier, andthen returned to the aeration tank as the Return Activated Sludge (RAS). TheRAS makes it possible for the microorganisms to be In the treatment systemlonger than the flowing wastewater. For conventional activated sludge oper.ations. the RAS flow is generally about 20 to 40 percent of the incomingwastewater flow. Changes in the activated sludge quality will require differentRAS flow rates due to settling characteristics of the sludge. Table 11.7 showstypo-al ranuis of RAS flow rates for some activated sludge process variations.
TABLE II.7
A GUIDE TO TYPICAL P.AS FLOW RATE PERCENTAGES
(Ref: Recommended Standards for Sewage Works, p. 62)
RAS flow rate as % of incoming wastewaterflow to aeration tank
Tyre of ActivatedSludge Process Average Lower Limit Upper Limit
Conventional 30 15 75
Modified or "'high rate" 20 10 50
Step feed 50 20 75
Contact stabilization 100 50 150
Extended aeration 100 50 200
Basic conceptsfor RAS control.
There are two basic approaches that can be used to control the RAS flow rate.These approaches are based on the following;
1) Controlling the RAS flow rate independently from the influent flow.2) Controlling the RAS flow rate as a constant percentage of the influent
flow
11.25

raCM
TABLE 11-6
STANDARD OPERATING PROCEDURES
AERATION AND D.O. CONTROL
PROCEDURE FREQUENCY METHOD RAKE CONDITION PROBABLE CAUSE RESPONSE
CHECK D.O.LEVEL
I
EVERY2 HOURS
0.0. METER
1DOMETRICe..THOD*
NORMALLYTO 3 mg/1
HIGH
SATISFACTORY
LOW
TOO MUCH AERATION
'
DECREASE AERATION
CONTINUE MONITORING
INCREASE AERATIONTOO LITTLE AERATION
CHECK UNIFORMITYOF AERATIONPATTERN IXAERATIONTANK
DAILY 'VISUALOBSERVATIONS
UNIFORM MIXING &ROLL PATTERN, &AIR BUBBLEOISBURSEMENT
DEAD SPOTS
UNEVEN ROLLPATTERN
LOCALILED BOILING
IMPROPER DISTRIBUTIONOF AIR
IMPROPER DISTRIBUTIONOF AIR
DIFFUSER MALFUNCTION
PERFORM D.O. PROFILES
AND BALANCE AIRDISTRIBUTION WITHHEADER VAtVES
PULL ANO CHECK FORPLUGGED DIFFUSERS
CHECK AIRREQUIREMENT(DIFFUSE°
AERATION) '
DAILY CALCULATIO1
SCF/LB COD ORLB BOO REMOVE°
SEE TABLE II-2
HIGH
SATISFACTORY
LOW
POOR 02 TRANSFER. 2
OR NITRIFICATION
CHECK UNIFORMITY OF AERATION
CHECK FOR HITRIcICATION
CONTINUE MONITORING
RECALIBRATE 0.0. METERCHECK LAO ANALYSIS
.....
INACCURATE 0.0., COD,OR BOO MEASUREMENT
CHECK AIR REQUIRE- MONTHLYMENT (MECHANICALAERATION)
L,...---A...
CALCULATIWLBS 0
2/CB
COO OR LB DODREMOVED
SEE TABLE 114
HIGH
SATISM-TORV
LOW
LOW LOADING REDUCE NUMBER OF UNITSIN OPERATION--CHEC4 FORADEQUATE MIXING.
IMPROVE PRIMARY TREATMENTINCREASE NUMBER OF WITSIN OPERATION
HIGH LOADING,INSUFFICIENT AERATIONCAPACITY
ACOPPER SULFATE-SULFAMIC ACID FLOCCULATION MODIFICATION
1
Jr

ACTIVATED SLUDGE PROCESSSErlION II - PROCESS CONTROL
Constant RAS Flow Rate Control
Effect of Setting the RAS at a constant flow rate that is independent of the aerationconstant RAS tank influent wastewater flow rate results in a continuously varying MLSSon PALS&
concentration will be at a minimum during peak influent flows and amaximum during minimum influent flows. This occurs because the MLSSare flowing into the clarifier at a higher rate during peak flow when theyare being removed at a constant rate. Similarly, at minimum influent flowrates, the MLSS are being returned to the aeration tank at a higher ratethan they are flowing into the clarifier. The aeration tank and the secondary clarifier must be looked at as a system where the MLSS are storedin the aeration tank during minimum wastewater flow and then trans-ferred to the clarifier as the wastewater flows initially Increase. in essence,
Effect of tne clarifier acts as a storage reservoir for the MLSS, and the clarifier hasconstant PAS a constantly changing depth of sludge blanket as the MLSS moves fromon sludge the aeration tank to the clarifier and vice versa. The advantage of usingblanket depth. this approach is simplicity, because it minimizes the amount cf effort for
control. It is also especially advantageous for small plants because oflimited flexibility.
Constant %more complex.
Effect of nowproportionalHAS controlon MLSS.
Constant HASadvantages.
ConstantpercentageMSadvantages.
Disadvantage
Disadvantageof flowproportionalHAS control.
Constant Percentage RAS Flow Rate Control
The second approach to controlling RAS flow rate requires a programmedmethod for maintaining a constant percentage of the aeration tank influentwastewater flow rate. The program may consist of an automatic flowmeasurement device, a programmed system, or frequent manual adjust-ments. The programmed method is designed to keep the MLSS moreconstant through high and low flow periods.
Comparison of Both RAS Control Approaches
The advantages of the constant RAS flow approach are the following:1) Simplicity.2) Maximum solids loading on the clarifier occurs at the initial start
of peak flow periods.3) Requires less operational time.
The advantages of the constant percentage RAS flow are the following:1) Variations in the MLSS concentration are reduced and the F!M
varies less.2) The MLSS will remain in the clarifier for shorter time periods,
which may reduce the possibility of denitrification in the clarifier.
A disadvantage of using the constant flow approach is that the FiM isconstantly changing. The range ot NM fluctuation due to the effect ofshort term variation in the MLSS (because of hydraulic loading) is genesmall enough that no significant proPlems arise due to using the constantflow approach.
The most significant disadvantage of the second approach is that theclarifier 13 subjected to maximum solids loading when the clarifier con-tarns the maximum amount of sludge. This may result in solids washoutwith the effluent
11-27
4.2

TABLE 11-8
STANDARD OPERATING PROCEDURES
RAS CONTROL
PROCESS CONTROLMETHOD
MODE OFOPERATION
WHAT TOCHECK
FREOUENCIr OF
ADJUSTMENTWHEN TOCHECK
CONDITION PROBABLECAUSE
RESPONSE
,
CONFUTEKIX ORPLUG FLOW
.
CONSTANT FLOW MANUAL SLUDGE BLANKET DAILY EVERY 8 HOURS HIGH
SATISFACTORY
LOW
LOW RAS RATE INCREASE RETURN
CONTINUE MONITORING
DECREASE RETURd
-----
HIGH RAS RATE
CONSTANTOF INFLUENTFLOW
MANUAL 1 OF INFLUENTFLOW
2 MRS EVERY 2 HRS HIGH
SATISFACTORY
LOW
VARIATIONSIN DAILYINFLUENTFLOW
ADJUST TO DESIRED1 OF INFLUENT FLOW
SLUDGE BLANKET OAILY EVERY 8 MRS HIGH
SATISFACTORY
LOW
1 OF FLOWTOO TOW
INCREASE t OF FLOW
CONTINUE MONITORING
:DECREASE g OF FLOWe-
a OF FLOWTOO HIGH
CONSTANT :OF INF0ENEFLOW
AUTOMATIC 5!OOGE BLANYET DAILY-
EVERY 8 HRS HIGH
SATISFACTORY
IOW
t OF FLOW INCREASE . OF MEVTOO IOW
CONTINUE MONITORING
; CF ROW DECREASE A Of FLOWTOO HIGH
CONTROL BYSLUDGE
BLANKETLEVU
AUTOMATIC SEUOGE BLANKET DAILY EYEkY 8 HRS HIGH OR 104
SATISFACTORY
CONTROLLERMAIEONCTioN
FIR CONTROLLER ORMANUALLY ADJUSTACCORDINGLY
CONTINUE MONITORING
DECREASE RETURN
(MIME MONITORING
INCREASE RETURN
REAFRATION CONSTANT .
Of FLOWAoTOMATIc RADIO OF
MLSS/RASc
(cENTAlfoGE
TEST)
EVERY ? HAS FVERY 7 HRS Higm RATIO
SATISFACTORY
LOW RATIO
RETURN TOOHIGH
RETURN ToOLOW

Y
Smaller plantsbenefit fromconstant RAS
How to developstandardoperatingprocedures.
Commonapproaches forRAS control.
,
The beatmethodmeasureblanket depthIn clarifier.
Increasingbianketsolutionon Short Tent isto increase RASbut Long TermJahr decreasesolids inventor)by wasting.
Measurementssame time eachday- duringmaximum flow.
ACTIVATED SLUDGE PROCESSSECTION II PROCESS CONTROL
In general, it appears that most activated sludge operatirNis perform welland require less attention when the constant RAS flow rate approach isused. Activated sludge plants with flows of 10 mgd or less are oftensubject to large hydraulic surges, and performance Of these plants willbenefit the most from the use of this approach.
Procedures for monitoring and maintaining RAS flow gates are presentedin Table 11. The operator may develop detailed standard operatingprocedures (SOP) for his plant by utilizing this table.
Methods of RAS Flow Rate Control
For either RAS flow rate control approaches discussed above, there are anumber of techniques which may be used to set the rate of sludge returnflo.v. The most commonly used techniques are listed below:
1) Monitoring the depth of the sludge blanket.2) Mass balance approach.3) Settleability approach.4) SV I approach.
Sludge Blanket Depth
Monitoring the depth of the sludge blanket in the clarifier is the mostdirect method available for determining the RAS flow rate. The sludgeblanket depth and uniformity may be checked routinely by the methodsdescribed in Section IV, "LABORATORY CONTROL." The blanket depthshould be kept to less than onfourth of the clarifier sidewall water depth.The operator must check the blanket depth on a routine basis, makingadjustments in the RAS to control the blanket depth.
if it is observed that the depth of the sludge blanket is increasing, OVrever,-an increase in the RAS flow can only solve the problem on a s t
term basis. Increases in sludge bla-1/4et depth may result from having too "-much activated sludne in the trea.ment system, andlor because of apoorly settling sludge. Longterm corrections must be made that willimprovethe settling characteristics of the sludge or remove the excesssolids from ti,o treatment system. If the sludge is settling poorly, increasing the RAS flow may even cause more problems by further increasingthe flow through the clarifier. If the sludge is settling poorly due to bulking,the environmental conditions for the microorganisms must be improved.If there is too much activated sludge in the treatment system, the excesssludge must be wasted.
Measurements of the sludge blanket depth in the clarifier should be madeat the same time each day. The best time to make these measurements isduring the period of maximum daily flow, because the clarifier is operatingunder the highest solids loading rate. The sludge blanket should bemeasured daily, and adjustments to the RAS rate can be made as neces-Sary. Adjustments in the RAS flow rate should only be needed occasionallyif the activated sludge process Is operating properly.
11-29
P s.... .1.
,

c)
alenket depthpoints outsludgecollectionsystemmalfunctions
Constantblanket Wel.
c en estimate'RAS tiqw fromMLVSS/RASesti°.
Oasis of amess betimes.
ACTIVATED SLUDGE PROCESSSECTION It. PROCESS CONTROL
An additional advantage of monitoring the sludge blanket depth is thatproblems, such as improperly operating sludge collection equipment, willbe observed due to irregularities in the blanket depth. A plugged pickupon a clarifier sludge collection system would cause sludge depth toincrease in the area of the pickup, and decrbase in the areas where theproperly operating pickups are located. These irregularities in sludgeblanket depth are easily monitored by measuring profiles of blanket depthacross the clarifier with th' methods and equipment discussed in SectionIV, "LABORATORY CONTROL."
Mass Balance Approach
The mass balance approach is a useful tool for calculating the RAS flowrate; however, it does assume that the level of the sludge blanket in theclarifier is constant.
A side benefit of the mass balance approach to RAS flow rate control isthat in plants without functioning FIAS flow meters, the RAS flow can beestimated from the measured MLSS to FIASss cOnclntration relationships.
The calculations used in this approach are based on a ',Vass balanceperformed on the suspended matter in the activated sludge process. Amass balance is performed by accounting for all of the suspended matterthat enter and leave the process. A typical mass balance around an aera-tion tank is shown in Figure 11.3.
CLARIFIER
RETURN SLUDGE FLOW, R
RASSS
AERATION TANK MASS BALANCE
FIGURE 11-3

What os eludessottioabeity7
How Is itdatormInsde
4.
ACTIVATED SLUDGE PROCESSSECTION II PROCESS CONTROL
Example Calculation
A. Data Required1. a, influent wastewater flow, mgd = 7.5
2. MLSS concentration, mgll = 20093. RASES Return Sludge concentration, mg/I = 7500
S. Determine RAS flow rate based on MISS to RAS ratio.;
a x MISS. kmgdRASss MLSS
7.5 x 20007500 - 2000
15,000
5500
= 27 or
= 2.7 x 100 = 32% of influent flow rate75
Settleability Approach
Another method of calculating the RAS. flow rate is based on the resultof me 30minute settling test. Settleability is defined as the percentage ofvolume occupied by the Sludge after settling for 30 minutes.
If after 30 minutes of settling, the final sludge volume were 275 ml in a oneliter graduate, the RAS flow rate would be calculated as follows:
Example Calculation
A. Data Required1. 0, influent wastewater flow, mgd = 7.52. SV, sludge settling volume in 30 minutes, mill = 275

Limited value
ACTIVATED SLUDGE PROCESS`SECTION II PROCESS CONTROL
B. Determine RAS flow rate based on 30-minute sludge settleabilltytest.
Qms, mgd = SV x 1001900 SV
275 ix 1001000 276
/275 x 100725
(
= 37.9 or 38% of influent flow rate
Thus,
ORAS, mgd = .38 x 7.5
= 2.8
Figure 11-4 can be used to calculate the RAS flow as a percentage of theinfluent flow. All the operator does is determine the SV mill at 30minutesand then read the RIQ off of the vertical axis. To calculate the QRAS,multiply the RIQ term by Q.
The settleability method is somewhat less accurate than the solidsbalance approach, as it suffers from the assumption that measurementsmade with a I. oratory settling cylinder will model the settling in a clarifler.This assumption will seldom (if ever) lie true because of the effects of thecylinder walls and the quiescent nature of the liquid In the cylinder.Some operators have found that gently stiffing (44 rpm) the sludge duringthe settling test reduces these problems.
11.32

100
80
60
40
20
ACTIVATED SLUDGE PROCESSSECTION II. PROCESS CONTROL
R .
riSV
ic7a7.-sv,x 100%
3.sammiswastormsratmen.fiessila anaa
Ua
aUUs
a,.__jj_lt__1111 111111111 11111
--,
1, Iii0TT100 200 300
SV,SETTLED VOLUME,m1/1
400
ESTIMATING RETURN FROM SETTLEABILITY TEST
FIGURE 11-4
(.1 e)II-33
500

ACTIVATED SLUDGE PROCESSSECTION II PROCESS CONTROL
SVI Approach
Value of SVI
les process
stability
indicator " Not
for Reacatbuletions.
To determine the RAS l!,jw rate using the Sludge Volume Index (SVI), it isnecessary to com1-00e the mass balance and settleabillty approach. Thismethod is subject to the same limitations as the settleability method.
This method is based on using the SVI to estimate the suspended solidsconcentration in the RAS. This value for RASES is then used in a massbalance to determine the RAS flow rate. The RAS flow rate may be deter-mlnea as follows:
Example Calculation
A Data Required1. SV1 = 1202. 0, Influent Wastewater flow, mgd = 7.53. MI-SS concentration, mgll = 2000
B. Determine flASss concentration based on SVI.
RASss, mg/I 1,000,000
SVI
1,000,000
120
7., 3333
C. Determine RAS flow rate based on SVI
(IRAs, mgd 0 x MLSSRASss MLSS
7.6 x 200088)3 - 2000
15.000
6333
2.4 Of
2 4 x 100 = 32% of influent flow rate7.6
NOTE. The SVI value was chosen to make the calculated RAS flowssimilar to those calculated in the previous examples.
The real value in the SVI is not In calculating the RAS flow, but in Itsuse as a process Stability indicator, Changes in the SVI at constantMLSS are more important than the SV1 value. Never be concernedabout comparing the SVI of different treatment plants, because theSVI value that indicates good operation In one plant may not neces-sarily apply to good operation in other plants.
11.34
9 1-4
ti
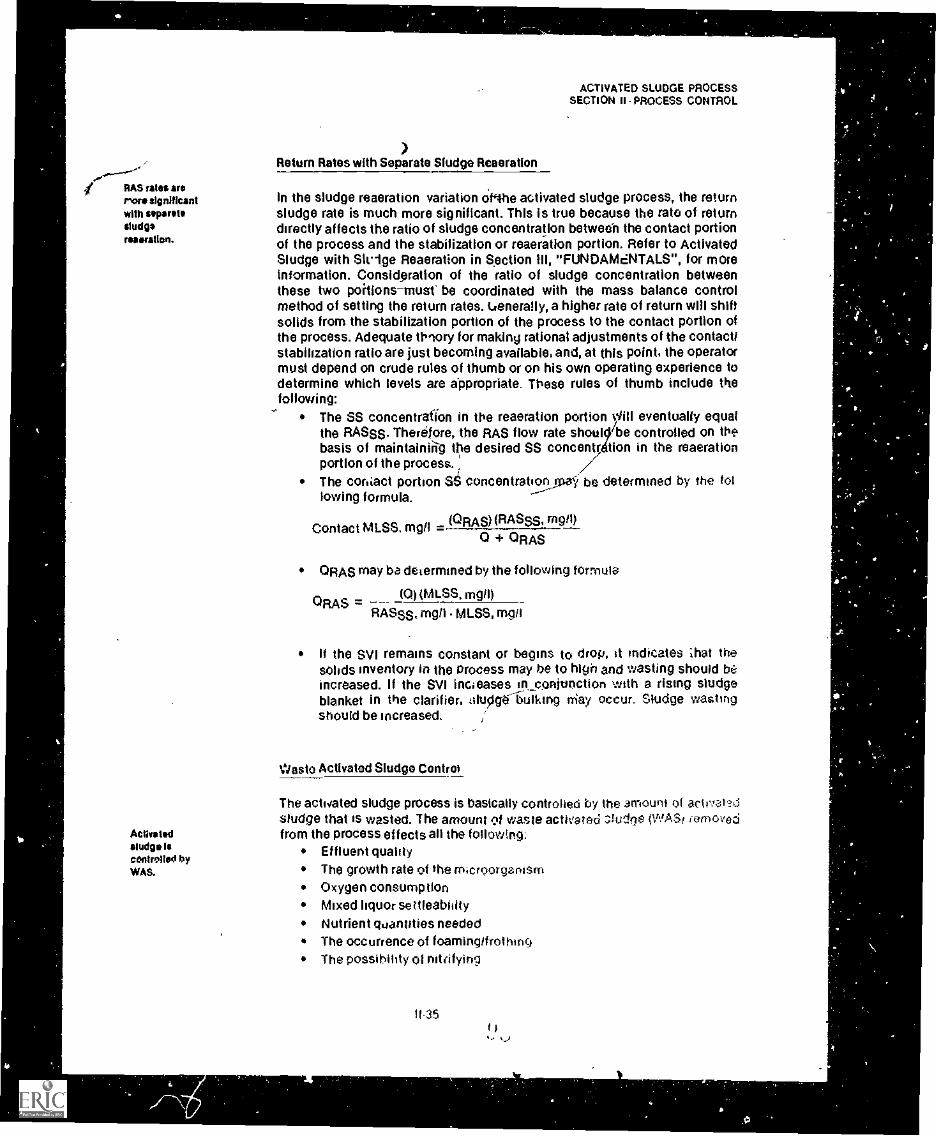
RAS rates arerove aigniticantwith upstatesludgereaeration.
Activatedsludge iscontrolled byWAS.
ACTIVATED SLUDGE PROCESSSECTION 11 -PROCESS CONTROL
Return Rates with Separate Sludge Reaeration
In the sludge reaeration variation oribe activated sludge process, the returnsludge rate is much more significant. This is true because the rater of returndirectly affects the ratio of sludge concentration between the contact portionof the process and the stabilization or reaeration portion. Refer to ActivatedSludge with Stulge Reaeration in Section ill, "FUNDAMdNTALS", for moreInformation. Consideration of the ratio of sludge concentration betweenthese two poitions-must be coordinated with the mass balance controlmethod of setting the return rates. LRenerally, a higher rate of return will shiftsolids from the stabilization portion of the process to the contact portion ofthe process. Adequate thiory for making rational adjustments of the contact/stabilization ratio are just becoming available, and, at this point, the operatormust depend on crude rules of thumb or on his own operating experience todetermine which levels are appropriate. These rules of thumb include thefollowing:
The SS concentration in the reaeration portion VIII eventually equalthe RASES. Therefore, the RAS flow rate shout controlled on thebasis of maintaining the desired SS concentration in the reaerationportion of the process.The cor.iact portion S6 concentratiaY be determined by the totlowing formula.
(ORAS) (RASES, mgrs)Contact MISS. mgll =
mgrs)
Q + ORAS
ORAS may ba determined by the following formula
ORAS(0) (MLSS, mgIl)
RASES, irngfl MLSS, mgr!
it the $V1 remains constant or begins to drop, it indicates ',hat thesolids inventory in the process may he to high and wasting should beincreased. If the SVI Increases in,sonfunction with a rising sludgeblanket in the clarifier, aludatibulking May occur. Sludge wastingshould be increased,
Wasto Activated Sludge Control
The activated sludge process is basically controlled by the 3n-iouni of acts: at.?dsludge that is wasted. The amount of waste activated :.s.ludfie (WAS, removedfrom the process effects all the following:
Effluent qualityThe growth rate of the mcroorganismOxygen consumptionMixed liquor seltleablillyNutrient quantities neededThe occurrence of foamingifrothingThe possibility of nitrifying
11-35

ACTIVATED SLUDGE PROCESSSECTION II. PROCESS CONTROL
fThe objective of wasting activated sludge is to maintain a balance betweenthe microorganisms and the amount of food such as COD and SOD. It is knownthat when the microorganisms remove BOO from wastewater, .the amountof ctivatedsludge increases (microorganisms grow and multiply). The rateat
WAS Is used which these microorganisms grow is called the growth rate and is defined astantalite% the increase in the amount of activated sludge that takes place ih-one day.*desiregrowth rate. Thi objective of sludge wasting is to remove just that amount of micro -
organisms that grolv. When this is done the amount of activated sludge formeby the microorganism growth is just balanced by that which is removed fromi ' the process. This therefore allows the total amount of activate gl sludge in the
Attempt to , process,to remain somewhat cdnstant. This condition Is called `steadymaintain . which is a desirable condition for operation. Howdver, "steadystate" can
/tsady-state. only be approximated because of the variations in the nature and quantity ofthe food supply (GOD) and of the microorganism pdpulation. It is -the objective 1
oFprocess control to approach a pUrticular."steady-state" by controlling anyone or a Combination of the following controlsparameters:
MCAT ,.
F/MGould Sludge Age ,
Volatile solids inventory) r
MLVSS concentration g -\Sludge Quality Control
C /
WAS is normallya portion of RAS.
Alternate forwasting sludge.
Westing onIntermittent orcontinuous
- baste.
The best mode of process control will produce a high quality effluent withconsistent treatment at a minimal cost. ,
Wasting of the activated sludge id normally done by removing a portion of theRAS flow. The waste activated sludge is &thar pumped to thickening facilitiesand then to a digester, or to the primary clarifiers where it is puMped to a'digester with the raw sludge. Procedures for making WAS adjustments are'presented in Table ii -9 which the operator may use to develop an SOP.
An alternate method for wasting sludge I frolft the mixed liquor in the aerationtank. There is much higher concentration of 'suspended matter in the RASthan there is in the mixed liquor. Therefore, when wasting is practiced 'fromthe mixed liquor larger sludge handling facilities are require* Wasting frotinthe RAS takes advantage of the gravity settling and thickening of-the sludgethat occurs in the secondary clarifier. However, wasting from the mixed liquorhats the advantage of hot wasting excessive amounts of sludge because ofthe large quantity 4f sludge involved. The extra security of wasting from themixed liquor should not be underestimated. Unfortunately, many plants dOnot I eve the flexibility to waste from the mixed.ilquor nor are there sufficientsludge handling facilities to handlir tDe morfedilute sludge.
Methods of Sludge Wasting
Wasting of the activated sludge can be done on an intermittent or cone,tinous, basis. The intermittent wasting of sludge means that wasting isconducted on a.batch basis from day to day.
11.36 9 6
1

I TABLE 11-9STANDARD OPERATINGPROCEDURES FOR WAS CONTROL
METHOD OFCONTROL
PROCESSOPERATION
WHAT TOCHECK
WHEN TOCHECK
CALCULATIONS FREQUENCY OFADJUSTMENT
CONDITIONS PROBABLECAUSE RESPONSE
*
CON TANT
4
HIGH RATE
CONVENTIONALRATE
EXTENDEDAERATION
ALvss sINFLUENT DAILY
F/01 BASED ON -
S DAY AVG. COODAILY
-
ACTUAL UM:HIGH
SATISFACTORY
LOW
EXCESSIVE '
WASTINGREDUCE WAS
INCREASEWAS
S DAY AVG. MUSS
INSUFFICIENTWASTING
COUSTANTIILVSS
NIGH RATE
CONVENTIONALRATE
EXTENDEDAERATION
NLVSSINFLUENTCOO OR800
DAILYVOLATILESOLIDS
INVENTORY . DAILY
ACTUALNLYSS:
NIGH
SATISFACTORY
LOW
INSUFFICIENTWASTING
EXCESSIVEWASTING
INCREASS E
WA
REDUCE WAS
CONSTANTWig
HIGH RATE
CONVENTIONAL
EXTENDEDAERATION
MISS,
WAS SS''SS'
OWASAEFFLss
DAILY-
S DAY AVGSOLIDS INVENTORY
S DAY AVERAGE OFSOLIDS IN WAS
S OAY AVERAGE OFSOLIDS IN EFFLUENT
DAILY
ACTUAL NCRT:
HIGH
SATISFACTORY
LOW
INSUFFICIENTWASTING
EXCESSIVEWASTING
INCREASEWAS
REDUCE WAS
C&NWONSTANT
SLUDGEAGE
HIGH RATE
CONVENTIONALRATE
EXTENDEDAERATION
INFLUENTSSA NLSS
DAILY5 DAY AVG OFSS INVENTORY ASS IN INFLUENT .
DAILY
ACTUAL GSA:
HIGH
SATISFACTORY
LOW
INSUFFICIENTWASTING
EXCESSIVEWASTING
INCREASE'WAS t
REDUCE WAS
I
*Response - Calculations should be made to determine the WAS rate. However, when increasing or
decreasing daily WAS rates, any changes should not exceed 10 to IS percent of the previous day's
WAS rate. This is necessary to Irliad the process to stabilize.,
a
. 4:
0

0
4
ACTIVATED SLUDGE PROCESSSECTION II. PROCESS CONTROL
4
. I, At wasting is done from the RAS, the operator must measure the volatile
suspended mattes in the RAS to obtain average concentrations. if the. volatile content in the RAGS concentration-is decreasing, the VITAS now rate
must be increased proporlionally to waste the proper "amount of VSS.*Similarly, if there is an inc pase.in the RAS volatile content, the WAS Pow...
. a)rate must be decreased prdportionaliy. .
. .
When continuous wasting is practiced, the opardor should check theRASvss at least.once every shift and make the appropriate awAs adjust-ment. :'
1
Example Calculation,
A. Data Required
mow to . - 1. awAS, Current waste sludge flow rate, mgd.= 0.05calculate dolly 2. RASVSSI Concentration first day, mg/1 = 6000OWASadjustments. 3. RASvse2 Concentration second day, mg/1 = 750Q
A(
B. Determine the adjusted WAS flow rate based on RASvsS increasefrom 6000 to 7600 mg/i.
. . OwAS, mgd adjusted -'RASvSS1 x OwASRASvSS2t .
= 6°500
CA x 0.057
= 0.80 x 0.05
= 0.04I
When intermittent wasting is practiced the operator must check the. RASVSS to calculate the necessary OWAS. in addition this calculation
must be readjusted fothe reduced time of wasting.
Example Calculation
Howie A. Data RequiredceicumteawAs
1. OWAS, adjusted from above, mgd = 0.04for Intermittentwasting. 2. P, Selected wasting perrod,hrsklay = 4
B. Determine the WAS flow rate for the four hour wasting period.
OwAS mgd hrsidaYd 0 4 hours = x uwAs, adjustedhrslday
= 24 x0.04,4
= 6 x 0.04
= 0.24
11.38
. 98
t.

./
Less ear/allot) Inthe SS duringthe wastingPorted oil*'Intermittentwaatlng.
ACTIVATED SLUDGE PROCESSSECTION II PROCESS C9NTAOL
,
The operator would repeat the OwAs calculation for each wasting period..-to takeinto account the RASVSS variations.
Intermittent,wasting of:sludge has the advantage that less variation In thesuspended matter concentration will occur during the wasting period,and the amount of sludge wasted will be more accurately known. Thedisadvantages of intermitltent *fasting are that the sludge handling facili-ties in the treated plant may be loaded at a higher hydraulic loading rateand that the 'activated sludge processis out of balance fdr a period of time 4until the microorganisms regrow to replace those wasted over the shorterperiod of time.. . ,
,
lb using either'of these methods for wasting, the operator does not have ,
complete control of the amount of activated siddge wasted due to theS1411S Istotiow
for , solids lost in the effluent. This "wasting" of activated sludge in the effluenttha.6
effluent. must be accounted for with any method of processtontrol or the system,will always be slightly out of balbnce. The loss of activated sludge in ilia'effluent generally accounts for less than five percent of the total solids .
that need tobe wasted; however, it is necessary"to be aware of this lossEspecially . and to be able to take it intoaccount by the methods stiown in the cork.Important if stant MCRT control section. The need for taking into' account the sPlidshigh effluent SS. Post in the effluent is especially important if one encounters situations
4here large concentrations of SS are washed out in the t ecOridary effluent.
Proper control of the WAS will produce a high quality effluen't with minimuni operational difficulties. There are five techniques that are commonlyused for controlling the WAS. These techniques are listed below in theorder of heir-frequency of use in this country. . rjk
Frequency of Use* . %-
1. . Constant'MLVSS Control2. Constant GOuid Sludge Age Control3. Constant NM Control4. 'Constant MCIlt Control5. Sludge Quality Control
Developed on the basis of, those treatment Plants 'which Were visitedduring development of the manual.'
.6
Five techniques'of control.
Conitant MLVSS Control
This technique for process control is dsediby many operators because itis simple to understand and - involves a Minimum amount of laboratorycontrol. The MLVSS control technique usually: produces. flood qualityaffluent as long as the incoming wastewater oharacteristics ire fairlyconstant with minimal variations in influent flow-fates.
z<
.
With 'this technique, the operatOr Wei to maintalYt'a constant MLVSS ,concentration in the aeration tanklo treat the incoming wastewaterocganic load. To put it in simple terms, if it IS found that a MLVSS conceniration of 200a 9g/1 produces a good quality effluent, the Opetator must,
11.39
90
4mq
sf
1 .
!.

.
,
r
164
(
.
"4-
.
1
.
f
A
.
,
.
.
.
.
,
.
.
4.
ACTIVATED SLUDGE PROCESS .,
SECTION II. PROCESS CONTROL
1
waste sludgi from the process to maintain that concentration. If 0'0MLVSS level increases above the desired concentration, more sludge fswasted until the desired level is reached again.
tThe laboratory control tests and operational data involved in using thistechnique include the following:
MLVSS concentrationRAS VeS concentrationInfluent wastewater flow rateVolumb of aeration tank
o
Whether a new plant is being started or the operation of an existing plantis being checked, this control technique is inert to indicate when activatedsludge should be wasted. In most cases it is not the most reliable tech-nique because it ignores process"variables,such as F!M and microorganismgrowth rate necessary for maintaining optimum system balance. Whenoperational prdblems odcur,the operator is unable to make rational pro
( cdss adjustments due to the lack of process control data.P ( .
k
The control technique is implementeckhy choosing an MLVSS concentration which' produces the highest qdality effluent while maintaining 9
I stable and economical operation. WAS flow rates are determined as follows:
4
.
I
Example Calculation
. A. Data Required__ . ,.,
I1. SI1, paired solids inventory in aeration tank, lbs = 20,016 .
. :--,,,i S12, Current solids inventory in aetation. tank, lbs = 21,716
3. RAS concentration, nig/I = 6200 4..
.
. 4...S. Determinsimdge to he wasted perday from RAS system.
SI2-S11OWAs, nlgd =
RAS x '8.34 HA/gal
6200 x13.34
. 1700=L81;708
, .
-= .032,
/ *Refer to Section 2.03 for solids inventory calculations in,aerati
. li .
1
t
.
.
1.
1.0 0,,
;
1140i
,
4.
S.
I,i
F
.
1, 0
xrus
I1,
,
,

a
't 01
/
. ACTIVATED SLUDGE PROCESSSECTION II 'PROCESS CONTROL
a
4 .1
-%
lA
*,
N
Constant Gould Sludge Age Control ). .
The concept of sludge age is i:ised on the ratio of the lbsiday of influentwastewater suspended matter to the solidi inventory in the aeration tank.Gould tirs't developed the sludge age for use in the Tallmans Island Treat-ment Plant in New York City. Thus, sludge ageNis also known as theGould Sludge Age (GSA) and it should not,beaconfused with the MCRT.The GSA is based the assumption that the ratio between the GOD andsuspended niatter is fairly constant in the wastewater.. Difficulties arecommonly experienced using the GSA control technique when the 800to solids ratio in the wastewater changes. The GSA ranges from 3 to 8days in'most activated sludge plants. The control technique is accomplished , %.t-
by wasting sludge to.maintain a constantGSA which produces the besteffluerit quality. it is determined as tollows:
Example Calculation
..
up
1 w'
1, . A. Data Required' ,
1. Influent wastewater or primary effluent suspended matterconcentration? mg,t = 100
2. Q, Influent olprimary effluent flowrate, mgd =. 7.53. SI, solids inventory in aeration tank, lbs = 20,u16
e
ia.
..
i
.
ee
%
8. Determine GouldISludge Age in days.#. .
'GSA, days = SI(pd. ell!. mg11) (0 mg/I) (8.34 Ibslgal) r
.,
.0
a.
,r
=(100) (7.5) (8.34)
20,016
6255
= 3.2 .
20,016'
, *
.
.
!
a
P
A
r
up
4
.
I
t
e
S.

ACTIVATED SLUDGE P Amiss -SECTION II- PROCESS CONTROL
WAS flow rate using the GSA control technique is determined as follows:
Example Calculation
A., Date Required.
1. DesireAGSA, day = 52. Influitit or primary effluent suspended matter, lbs' per day
(from above calculation) = 6255.3. SI, Solids inventory in aeration tank, lbs.= 33,Q75'
4. RASES concentration, mgll = 6300
B. Determine desired pounds of MLSS to be maintained in aeration-4, tank at a 5 day GSA.
-*
MLVS,lbs desired = GAS x Pri, effl., lbs/day
= 5 x 6255
= 31,275
C. Determine WAS flow rate to maintain desired GSA.
SL MLSS desiredOwAs, mgd = RAS x 8.34 lbs/9al-
_ 33 075 - 31,Z75
6300 >c 8.34
1800.52tt42
= .034
Refer o Sectioq 2.03.
Constant FIA Control .Constant FIM control is used to ensure th'at the activatedsludge process
FM ensures is being loaded at a rate that the microorganisms in the MLSS are able toproper argotic utilize most of the food supply in the wastewater being treated. If tooloading.
much or too little 'food is applied for the atnount..of microorganisms,operating problims may occur and the effluent qtiality may degrade.
There ma four things that should be remembered abdut the RM. ,.1. The food concentration to estimated with the COD (or Kt) tests.
The oxygen demand tests p_rovIde crude but reliable approxima-tions of the actual aMount of COD removed by the microorganisms.
Food applied.2. The amount of food applied id important to calculate the F/M.
It3
Food measuredby COO or SOD.
11)2

ACTIVATED SLUDGE PROCESSa, *SECTION II PROCESS CONTROL
. FIIN based on 3. The quantity of microorganisms can be represented by the quantityPALM and not of IkALVSS. IdVally, the living Or active microorganisms wouldMISS. simply be counted, but this is not feasible, and ,studies have
shown.that the MLVSS is a good approximation of the micro.thou,. day organisms concentrations In the MLSS. .moving 4.* The data obtained to calculate the NM should bqbased on a fiveswages 10calculate FIN. day moving average.
The range of organic loading of activated sludge plants is deicribed by, the FN. The three ranges of organic loading are conventional, extended
aeration, and high rate. These ranges have been shpwn to produce acts.-sled sludge that settles well
FIM leedlag
And la,Tinton-10.
Table 11.10 presents the ranges of FIM that have beerused successfullywith the three loading conditions. The FIM values shown eve expressed In
* terms of BOD, COD and Total. Organic Carbon, (TOC). The TOC is an. additional means of estimating orgaric-loading. The values indicated are
guidelines for, process control, and they should tot be thought of asminimums or maximums.
TABLE 11.10
a
TYPICAL RANGES FOR FIM LOADINGS
Conventional ,Extended N High RateAS Range Aeration Range
. FIM FIM . FIM
BOD 0.1 to 0.5 0.05 to 0.1 0.5 to 2.5
COO) 0.06 to 0.3 0.03 to 0.06 0.3 to 1.5
TOC (2)2s) 0.25 to 1:5 0.1 to 0.25 1.5 to 6.0
Assumes BO =OD for settled wastewaters = 0.6 .-
(2) Assumes BO DITOC for settled wastewaters = 2.5
The FIM Is calculated from the amount of COD or GOD applied each dayand frcm the solids inventory In the aeration,taak. Refer to Section 2.03for solids Inventory Calculations.
O
4,
I

.
I
1
ui
'How to**Uinta Mt
. ,
.
ACTIVATED SLUDGE PROCESS. SECTION II PROCESS CONTROL
'Gesphical isolution for iFIM calculation!
1
Stsbrstop.
I
I a
Ie.
.
Example Calculation
A. Data Required1. COD or BOO concentration in wastewater applied to the aera .
tion tank, mglI = 1002. 0;influentor primary effluent flow rate, mgd = 7.53. SI,Solid lnventbry in aeration tank, ibe = 21,017
a.. -,
B. Determinthe FIM ratio axpiessed as pounds ca orbOD applied.'per pound MLVSS. ' l
.
pm (SOD;mg/i) (Cis mgd) (8.34 lbsigal)
i SI .(100)7.5)(8.34) ,)
.1.
i 21 ,017
.. 1
6255 1=21,017
:.
= 0.297AP
Figures 11.5, 11.6, III can also be used to, calculate the FIM as determinedin the above example problem. These figures are for pla,nts having averageinfluent flows of up fo 5, 10, and 50 mgd. The following illustration willshow how to determine the FIM ratio with these figures. Data from Figure11.61s used: . ,
.
1. Use the figure with a maximum flow range near the floW in yourplant. In this case use Figure 116, which has a maximum flow of \'10Imgd, which is the most accurate curve for the flow of 7.5 mgd.
2. Referring to Figure114Find the flow. 7 p mgdDriw aline vertically to the BOD or COD applied 100 mg/1
Draw a line parallel Who bottom axis to .
Intersect the MINSS line 41 2,000 mgliDraw aline vertically downward to the Factor 0.37
it Divide the factor by the aeration tank volume 1.26 mil galThe F/M 1$ equal to: ,
ibe BOD Applied/day0.2! =lbs. MLVSS ,
The F/M Is essentially equal to the F/M calculated previously. The differ.once between 0.29 and 0.207 la not significant..
The use of Figures II-5, 'he, IR Is strongly recommended: The figures canbe"made to read FIM directly for an individual plant by multiplyinb thefactor by the aeration tank volume and writing anew values in place of thefactor. The use of a clear plcistic sheet to cover the figure and a crayon likemarker will extend the life of a particular sheet. Additional sheets canalso be printed from the original.
11-64
,
1
.
0
Ow
46

gttrol."167.11,,.1,
000 Appueamonvoi
egatFACTOR AWLS
s %.
wiesusip±votom E
s.,
weft OOH
reiio.29
t 4

i. --T-.
I1.20
GIVER:
arFACTOR .0.27
FACTOR
RIa 823 me!
IMES *2.000 rag/1
AERA21011 TANKVOLUME t1.26 411 gal
BOO APPLIED100 40
Sta
AA.VOLUME 44
1--
A4.F/Mst
0
11111141F,4$10.20
i
4.°
POIV- 100
04. k.,..irvid
111§ii ....... tt me 000010111 0111111111111111116Fliii°11°
Ilim Nim, /_=.ggisifint:somnween10
FLOW,
0.1 0.2 04 0 4
F/M CALCULATIONS
FIGURE III
0.5 04 0 0 0 OA 1.0
FACTOR

I
.0
GIVEN;
0 *375 mod
1ALVSS 42.000048/1 I lb `
I
AERATION TANK . .. 1,...- c.w.o., ........ A
wOLIONE 85.3 mu R41 , r tooROO AIIPLIE0100 m2/1 0fo,
6Ov
MgFACTOR 41.85
"4114 CLINIIIIE
1 85F/112 w
FA1*025
6447
i .s04,
6
0
1
I 64,
,..-
I S
."
1 s
z
i
45 0 $ 30 25 20 15 10 1 0 1.4 2.0 2.8 $ 0 3.5 4 0 4.5 S 0
FLOW. mqdF/M CALCULATIONS
FIGURE 11-7
107V)
\,
FACTOR
1

i
Now tocatottlats theMUM menmodal tot thedulled FDA
FlitooPtrot bootand with MCRTcontrol.
ACTIVATED SLUDGE PROCESS 'RECTION 11 PROCESS CONTROL
r 1
The determination of WAS flow rate using the constant NM controltechnique is calculated in the same manner as for the constant MLVSSand Gould Sludge Age techniques. However, the solids inventory for theaeration tank can be more logically determined based on the COD ocl30Dconcentration of the wastewater to be treated when using the NMprocess c'ontrol.c'ontrol. This is determined as follows:
Example Calculation
A. Date Required1. Desired NM = 0.292. COD or BOD concentrationorgil =' 1003. 0, influent or primary effluent flow rate, efigd = 7.5
4. QA, Aeration tank volume mg = 1.285. Percent MLVSS r 10
B.
w
Determine pounds of ivtLVSS for desired NM.
MLVSS, ibs = (BOD, mg/1),(0, mod) (8.34 lbsigal)FIM desired
(100) (7.5) (8.34)
0.29
8255
0.29
= 21,569 (equal to approx. 2000 mgli of MLVSS)
C. Determine MLSS mgli required in the aeration tank ifthe MLVSS is 70%.
MLSSmgnMLVSS, lbs
(OA) (% MLVSS) (834 I bsigal)
21589(1.28)(1)(8.34)
21,569
7.35
= 2931
The FIM control technique for sludge wasting is best used in conjunctionwith the constant MCRT control technique. Control to a constant MCRT isachieved by wasting an amount of the aeration tank solids inventorywhich in turn fixes or provides a constant FIM ratio.
1 081148

MORT Is usedto oaloulsts
"smountofsludosto be .
wasted
ExpressosResidence Von -
of solidi.
him controletype ofmforoomsolsmIn process.
p
4.
Constant MCRT Control
ACTIVATED SLUDGE PROCESSSECTION PROCESS CONTROL.
Current technology considers MCRT to be he beet process control tech- 'nIque available to the plant operator. By using the 'MORT, the operator cancontrol the organiC loading (FIM). In addition, he can calculate the amount \of activated sludge that should be wasted in a logical rt.anner. It is recorn-mended that operators become familiar with the use arconstant MORTcontra).
Basically, the MCRT expresses the average time that a microorganismwill spend In the activated sludge process. The MORT. value sheik' beselected to provide the best effluent quality. This value should,correspbrldto the NM loading for whichathe process Is-designed. For example; aprocess designed to operate at conventional FIM loading rates may notproduce ((high quality effluent if it is operated ate low MCRT because theFIM may be too high for Its design. Therefore the operator must find the ,best MORT for his process by relating it to the FIM as well as the effluentCOD, BOO and suspended matter concentrations.
The MORT also determines the type of microorganisms that predominate inthe activated'sludge, bemuse it has a direct influence on the-degree ofnitrification which' may occur in the process. A plant operated at e longerMCRT of 15-20 days will generally produce a nitrifled effluent. A plantoperating with en MORT of 5-10 days mey not produce a nitrified effluentunless wastewater temperatures are unusually high. Table 11.11 presentsthe typical range of MORT values that will enable nitrification et variouswastewater temperatures. The-values shown eve been used successfulIfto produce nitrifled effluents at numerouOlants. 0
TAKE 11.11
MCRT NEEDED TO PRODUCE A NITRIFIED'EFFLUENT AS RELATED TO THE TEMPERATURE
Temperature, *0 MCRT, Days
10 3015 20 /20 151,17
25 10
30 7
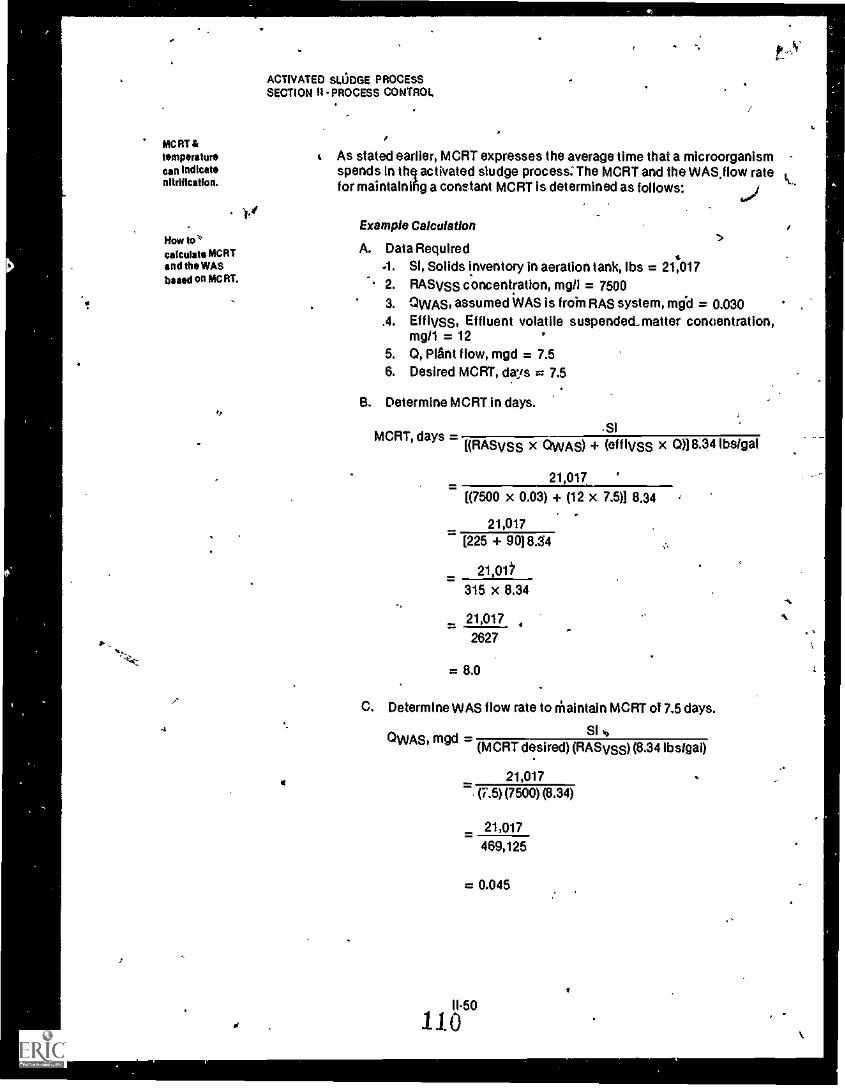
MCRT &temperaturecan Indicatenitrification.
Now tocalculate MCRTand the WASbased on MCRT.
4
tfr
ACTIVATED SLODGE PROCESSSECTION It PROCESS CONTROL
k As stated earlier, MCRT expresses the average time that a microorganismspends In thq activated sludge process: The MCRT and the WAS.flow rate it..for maintaining a constant MCRT is determined as follows:
Example Calculation
A. Data Required.1. SI, Solids inventory in aeration tank, lbs = 21:0172. RASVSS concentration, mgli = 75003. OWAS, assumed WAS is froin RAS system, mid = 0.030.4. Eff IvSS, Effluent volatile suspended., matter concentration,
mg/1 = 125. 0, Plant flow, mgd = 7.56. Desired MCRT, days = 7.5
B. Determine MCRT in days.
MCRT, days =.Si
[(RASVSS X ()WAS) + (off IvsS X 0)18.34 lbsigal
21,017
((7500 x 0.03) + (12 x 7.5)1 8.34
21,017(225 + 9018.34
21,01'315 x 8.34
21,017
2627
= 8.0
C. Determine WAS flow rate to maintain MCRT of 7.5 days.
SI k,()WAS, mgd
(MCRT desired) (RASVSS) (8.34 lbsIgai)
21,017(7.5) (7500) (8.34)
21,017
469,125
= 0.045
118'

9.000 ,2400
ACTIVATED sump PROCESSSECTION II .PROCE4S CONTROL
01.
0 1.500 1
MLVSS. mg./1
010EN:
1ALVSS = 2.000 019/1
NM: 7.5 DAYS
VSS WAS x 7.500 "A
00 56o -
AERATION VOLUME : 1 20 mil eal
9
500 1.000 1.500 2.000 s 2.500, 9.000
1\\ 4:P;'414,
1
0 4tUk, Six..4.2
0
OO
S
"lobbo 00 02 itil&. w arRt9 e
0413
IniZiiilti&0 04
005-1 WE N
0 01
00
FROMWASTE FLOW FACTOR s 0 035 0 00
OWAS :WASTE FLOW FACTOR x VOL
0 07DwAs 0.035 It 1.20
OwAg s 0 044 mod 0 0
WASTE ACTIVATED
SLUDGE CALCULATIONS
FIGURE 11-8
0.0S
1.10
0.1 1 -
0 12
0-13 EMI11.51
1:

ACTIVATED SLUDGE PROCESSSECTION 0 - PROCESS CONTROL
4 '
11140(400144404.144440**,
3.000 2i00 2.000 1
MOSS. mo/1.
MEM047.5 modmuss I 2.06a1ACItT s 7-5 DAYS
1/SSW z 7.500 mwel
-.10SSErs :10 mo/I
AERATION VOLUME s 1.28 mu qo,t
051/SSoFFalt.3411b/os1EFFLUENT FACTOR a AERATION VOLUME
75 1014834 .4ss1W17--FROM
WASTE 'FLOW FACTOR 0.028I3wAs :WASTE FLOW FACTOR s VOL,
OwAs 0.0211m I-26ClwAs room+ mod
1. 00 500
0.01
0WASTE ACTIVATED 41.
uo
SLUDGE CLACUCATIONS41
FIGURE 11-9 .
0 02
0-03
0.04
0.05
0.06
0.07
0.05
1.10
041
0.12
0-13
. 11.52
112

What doe* allthesecalcutstiork, mean?
0
Graphicalsolution forWAScalculations.
stsp),--,stap.
4
S
ACTIVATED SLUDGE PROCESSSECTION II PROCESS CONTROL
This means that for the next 8 days approximately 45,000 gallons per dalshould be wasted from the RAS system.' However, the WAS flow rateshould be determined and adjusted daily, to maintain the desired MCRT.
s,Figures 114 and 11.9 present graphical te3hnique for making WAS flowrate o iculations for 'Maintaining a constant 'MCRT. These figures areidenti al except the Figure 11.8 evludes the volatile suspended mattercontain efll ir) the effluent. This is done because some operators feel a verylow amoWt of solids in the effluent does not significantly effect the-MCAT while others do. Figure 11.9 includes the correction for effluent
k
0
solids.
The following illustration will show how to determine the Waflow ratewith these figures.
1. Refer to Figure11-8.
Locate the MLVSS concentration for your plantin the MLVSS axis. 2000 mgllDraw a line that is parallel to the btld verticalaxis. Stop at the sloping bold line.Procepedilluallefto the MLVSS axis to the MCRTbeing used for operation. 7.5 daysNote that the MCRT valves range from 2.5 to20 days, in 1 day increments up to 15 days and 2.5day increments up to 20 days.Draw a line parallel to the bold vertical axis andintersect the VSSWAS for your plant. Note thatthe concentrations are shown in increments of500 mgll with a range of 500 to 10,000 mgll.Thus these figures can be used for calculationsinvolving wasting from the RAS or the mixedliquor. In Figure II9when you get to the effluentfactor axis, deduct the lbslday solids in theeffluent then proceed to the VSSWAS for yourplant. 7500 mgllAt the intersection with the VSSWAS line, drawa line parallel to the MLVSSaXis. Reg] the valueindicated on the axis labeled waste flow factor' = 0.035
Now multiply-the factor by the aeration tankvolume of youplant to determine th AS flowrate 0.044 mgd
This value of OyvAs is very closi to the value caicuPteo in the exampleproblem. The use *these figures isa convenient and 'a grate methodfor calculating the WAS fl rate.
11311-53
Ii
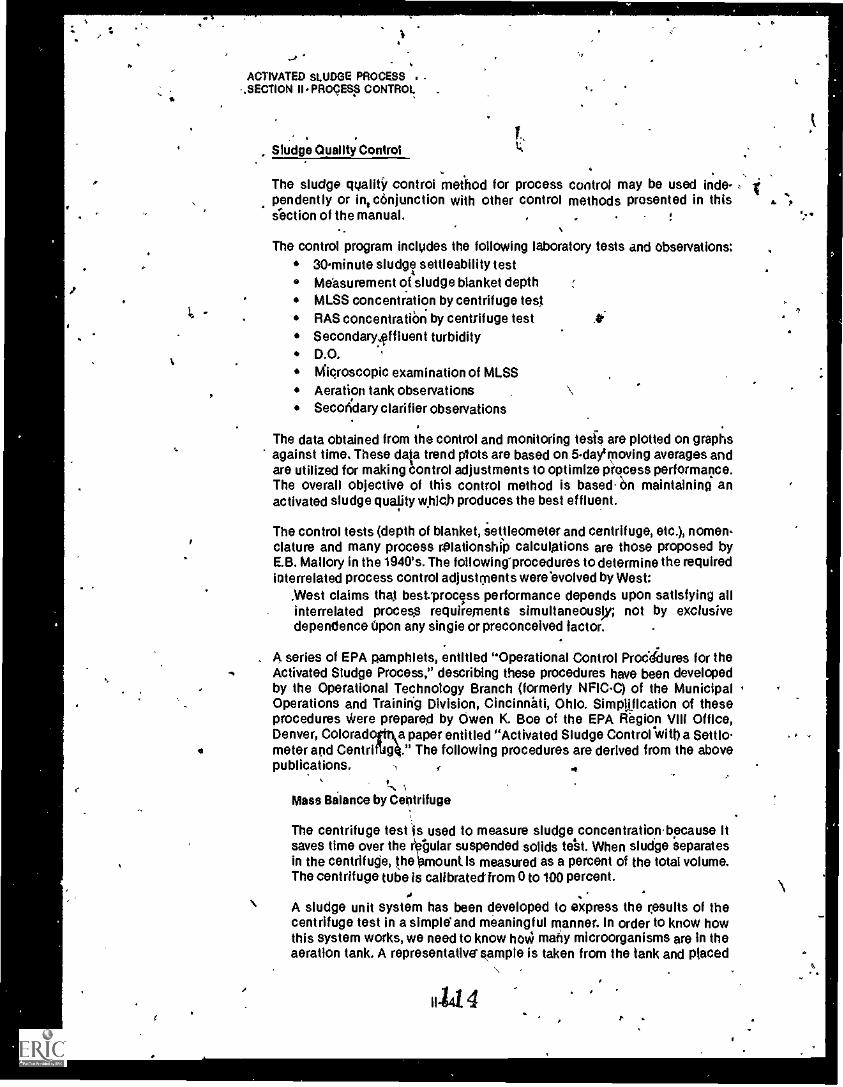
O
ACTIVATED SLUDGE PROCESS . -
SECTION II PROcESS CONTROL
, Sludge Quality Control
The sludge quallti control method for process control may be used inde-pendently or in, conjunction with other control methods presented in thisAction of the manual. . .
The control program includes the following laboratory tests and observations:30minute sludge settleability testMeasurement of sludge blanket depthMLSS concentration by centrifuge testRAS concentration by centrifuge test it
Secondary4ffluent turbidityD.O.
Microscopic examination of MLSSAeration tank observationsSeco(dary clarifier observations
The data obtained from the control and monitoring tests are plotted on graphsagainst time. These data trend plots are based on 5-dayirnoving averages andare utilized for making control adjustments to optimize process performance.The overall objective of this control method is based. on maintaining anactivated sludge quality which produces the best effluent.
The control tests (depth of blanket, settleometer and centrifuge, etc.), nomen-clature and many process relationship calculations are those proposed byE.B. Mallory in the 1940's. The following-procedures to determine the requiredinterrelated process control adjustments were evolved by West:
.West claims that bestprocIss performance depends upon satisfying allinterrelated process requirements simultaneously; not by exclusivedependence Upon any single or preconceived factor.
A series of EPA pamphlets, entitled "Operational Control Procidures for theActivated Sludge Process," describing these procedures have been developedby the Operational Technology Branch (formerly NFIC-C) of the MunicipalOperations and Training Division, Cincinnati, Ohio. Simplification of theseprocedures *ere prepared by Owen K. Boe of the EPA Region VIII Office,Denver, Coloradofttka paper entitled "Activated Sludge Control wit() a Settiometer and Centriflig4." The following procedures are derived from the abovepublications.
Mass Bilance by Centrifuge
The centrifuge test Is used to measure sludge concentration, because itsaves time over the tabular suspended solids test. When sludge separatesin the centrifuge, the Ismount is measured as a percent of the total volume.The centrifuge tube is calibratedfrom 0 to 100 percent.
A sludge unit system has been developed to express the results of thecentrifuge test in a simple and meaningful manner. In order to know howthis system works, we need to know holt) many microorganisms are in theaeration tank. A representative sample is taken from the tank and placed
NU 4r .

$
.
...
I
f 4.
ACTIVATED SLUDGE 'PROCESSSECTION II PROCESS CONTROL
into the centrifuge. A 15 minute spin reveals that the level of separatedsludge Is 1,0 percent of the Iolunie in the centrifuge tube. However, beforethe microorganisms measured can be compared to the microorganisms
o , in the aeration tank, we must have a sysfem to calculate this quantity.Looking at our aeration tan)( system we see that the centrifuge reads 1.0percent and the tank volume is 1.0 MG (million gallons). Therefore, thisqtiantity.of microorganisms is defined as 1.0 sludge unit, or as shown inthe formula: ._ .
. 1.0% x 1.0 MG = 1.0 Sludge Unit. '
i.
.."4
.
. INOTE: It should be noted by the reader that the centrifuge results are
- recorded in percent; however, the decimal percent expression is disre.garded in order to simplify the calculations.
To understand how this systein works, let's look at a couple more examples:1. Suppose the same aeration tank had twice as many microorganisms
present. Now, when we run the sample on the ceRtrifugq we findthat the separated Madge made 2.0%. Now, the sludge units arecalculated to be:
2.0% x 1 MG ;.-. 2 Sludge Units I.
which shows twice as many microorganisms as before.2. Let's also consider what would happen if we had two aeration
tanks instead of one. if both aeration tanks had a reading of 1percent sludge, then the sludge units would calculate to:
1st tank .1% x 1 MG = 1.0 Sludge Unit '.2nd tank 1% x I MG = 1.0 Sludge UnitTotal Sludge Units = 2.0 -
$ .We now have a system which can be used to measure the quantity of. microorganisms in the plant which only involves two numbers. The firstnumber is the percent reading taken from the centrifuge-and the secondnumber is the volume of the aeration tank (in million golions). Since thevolume of the tank usually stays the same, all that is needed to determinethe quantity of microorganisms is a reading from the centrifuge, and thisreading only takes a few minutes to determine.
If we wanted to, we could convert the sludge units to pounds, of sludge,All that is needed for this is to run a Suspended solids (SS) test and a spintest on the same sample. For the previous example, which had a spin of1%, the SS were found to be 1000 mg/I. This gives a spin ratiq of 1000mg1I11%. To calculate pounds, use the following tot' ula:
lbs = % spin x spin ratio x 8.34 x Vpl (mil ion gallons)
So, as in the previous example where the tank volume was 1 MG and thespin ratio was 1000 mg/I/1'%, we hive: r-
ibs (1 %) (MO Me (8.34 lbs) (1 mg)1% ' gal 7 .
Therefore:4 lbs = 8340 lbs
C:. ..11.55
115
I.
.

. . ..,
et
.
,
1:,
"ACTIVATEo'SLUME PROCESSSECTION II. PROCESS CONTROL f
1,
go.
1..
I
.
. ,
The studde unit tystem may sound a little different at first and may soundlike more work, but It actually provides the plant operator with a tool thatcan be used over and over and in many different ways with relatively littletime Involved. Also, as will be shown later, the use of these units and dataobtained from the settleometer providethe operator with 'very usefuldata for controlling return sludge rates.
Some gobs examples of how the centrifuge and the sludge unit systemmay be used for process control and evaluation are described below.
1. Aeration Sludge Units ASUThis Is a measurement of the amount of sludge found in the aerationtanks. ASU's are calculated by multiplying the aeration tank volume inmillions of gallons (AVG) by the daily average aeration tank concentra-tion (ATC). The Aeration Sludge Unite-are determined as follows:
Example Calculation
A. Data Required t1. AVG = Aeration volume, million gallons = 1.02. ATC = Aeration tank Conc., % r- 3.0.
B: Now deterine the Aeration sludge Units.ASU = (AVG) (ATC)
7, (1.0) pm
= 3 units .
2. Clarifier Sludge Units CSUThis is a measurement of the amount of sludge found In the clarifier.CSU'e are calculated by multiplying the 'volume of sludge In theclarifier In millions of gallons (CVG) by the Average concentration ofI the sludge in ,ihe clarifier. The Volume of sludge in the clarifier isfound by findiagtne fraction of the total clarifier volume that Is filledWith sludge.
The volume of sludge Is determined by the following formulainddefiningCVG es volume of clarifier andDOB as the measured distance from thewater surface to the top of the shidge blanket. Therefore:
Sludge Volume = Clarifier- DOB
Average depth of Clarifier
The average sludge blanket Concentration Is found by assuming the con-4 centratlon at the top of the blanket is equal to the aeration tank concen
tration (ATC) and the concentration at the bottdm of the blanket Is equal.. to the Aturn,sludge concentration (RSC). These assumptions are made
sinceme know the sludge is compacting at the bottom of the clarifier, butwe can't really measure the average concentration. The average concen *tration is then assumed to be: *
'll.513
" 116...
1
0
tv

1. A
i
I
i
1,
ACTIVATED SLUDGE PROCESSSECTION II. PROCESS CONTROL ai
r
s l'4'*Average Sludge Concentration, ATC + RSC .
2
Now in order to find the total clarifier sludge units, multiply the peicentsludge by the average sludge concentration. Clarifier sludge units arethen determined as follows:
Example Calculation t
. A. Data Required1: CVG = Clarifier volume, million gallons = 0.702. ATC = Aeration tank concentration, % =. 33. RSC '= Return sludge concerltration, % = 12 a
4. DOB = Depth of sludge blanket, ft. = 85. ACD = Aveurge clarifier depth, ft. 2= 10
. B. Determine the volume of sludge in the clarifier.
%.
s
i
, . I
t
is
Sludge Volume (ACD D013)_:GVG
gD(10 - 8) 0.70
10
= (0.2)(0.70)
= 0.14
C. Determine the average sludge blanket concentration.. . =_,ATC + RSCAverage Sludge Concentration
i. 2
.3 + 1.22
= '7,5
D. Now determine the Clarifier Sludge Units.0,1,
:9SU = (Sludge Volume) (Avedge Sludge Cbnc.)
= (0.14) (7.5)
= 1.05 units
`Perform the carculations within parenthesis first.
,
.. I
3. Total Sludge Units -TSU ,This is the measurement of the total amouqf of activated sludge in thesystem. The varying amounts of sludge in the clarifier are included inthis measurement.
ii -57 1 1. 7I,

I
.
. .
. . ACTIVATED SLUDGE PROCESSSECTION H-PROCESS CONTROL
4,
)
e
. t.
,
'Total sludge units are determined as follows:'*Example Calculation
A. Data Requiredt ASU = Aeration sludgeunit :.-... 3.02. CSU = Clarifier sludge unit :, -- 1.05
B. Now getermine the total sludge units.
t TSU = ASU + CSU a4
... = 3.0 + 1.05..
= 4.05 units
J .
I
la
I
ml,
4. Return Sludge Units Rai ..
Thisis the measurement oithe daily average of sludge units retuinedfrom the clarifier to the aeration tank.
The return sludge units are determinedas follows:-.,
0 r
Example Calculation
A. Data Required1. FISC = AVerage return sludge conitration, % = 142. RSF = Average return sludge tlQw, mgd = 2
- .
ot
.
. .
B. Now determlf5the return sludge units.
RSU = (RSC) (RSF)
= (12) (2)
= 24 units/day
,
)5. Clarifier Sludge Flow Demand CSFD .
Assuming that the sludge settling concentrations' (SSCt) determinedin the settleometer test relate to the returnI,Iticige concentration (ifthe sludge had stayed in the clarifier for thd%ame length of time), therequired return sludge flow rate can be determined as follows: ,
. 48,11.
,
A
.
I
I
?'1
t
al.
I

i
ACTIVATED SLUDGE PROCESSSECTISIN II-PROCESS CONTROL'
r
.Example Caeutation
A. Date Required1. Q = Plantilow rate, mgd =.4 .
2. RSF = Re urn slydge flow, mgd = 23. RSC = Return sludge concentration, °'b= 12
'4. ATC = Aeration tank concentration, % = 3.0
N5- sse60 = 60 minute'sludge settling concentration, % = 10
asscn= (Aeration tank conc., %)(1000 mill)Sludge settling volumet, mill
= time
B. Now determine the clarifier sludge flow demand.
CdFD (RSF) (RSC ATC)
SSCt ATC
(2)(12 3)10.3
(2) (9)
7 ,
.= 2.6 dI
Therefore, the return sludge flow rate should be increased from 2 to aboutmgd. The sludge blanket depth measurement in the final clarifier
should be taken into consideration before making any changes in thereturn sludge flow rate.
Some trial and 'err° adjustments may be required using the sludge blanketdepth measurement a e final gifitdec.-.
In general, the following rules of thumb can be applied when comparingthe return sludge concentration (RSC) to the 60 minute and 30 minutesludge settlinconcentration (SSC):
If the RSC is greater than the SSC60, increase the return sludgerates.If the RSC is less than the SSC30, decrease the returnludge
Like all rules of thumb, other-plant conditions have to be 6onsidered,such as flexibility in the return sludge system, clarifier sludge Wankeldepth measurements, aeration detention times, etc.
1
11.69 11 9
0

k
ACTIVATED sl MOE PROCESSSECTION H. PROCESS CONTROL
6. Waste Sludge Units -WSU
This is the measurement-of the total quantity of sludge wasted fromthe system each day. Sludge wasting can occur intentionally by pump-sing sludge to a digester or it can occur unintentionally by being carriedover the clarifier ?mire. Usually the amount of sludge lost .over theclarifier weirs is small in c9mparisoh to that which is intentionallywasted. However, to check this out or to measure the quantity of thesludge unit system, we can make use of the spin ratio.
Effluent sludge units (ESU) are calculated by measuring the total suspended solids In the effluent, dividing by the spin ratio, and multiplyingby the plant daily average flow. Therefore:
ESU =(TSS) (Flow)
Spin Ratio
Intentio9arsludge wasting (XSU) is calculated by taking the daily averageconcentration of sludge wasted (WSC) and multiplying the volume (Inmillion gallons) of sludge wasted (WSF). Therefore:
XSU = WSC x WSF .
The total sludge wasted (WSU) is then determined by adding the effluentsludge units to the intentional sludge units. The total sludge wasted unitsaredetermined as follows:
Example Calculation
A. Data Required1. TSS = Tota suspended solids in clarifier effluent, mail = 302. Flow = Plantdally average flow, mgd = 43. Spin Ratio = Suspended solids conc., mg/i/centrifuge sludge
conc., % = 1000114. WSC = Average waste sludge concentration, % = 155. WSF = Average waste sludge flow, mgd '= 0.05
4
B. Determine the effluent sludge units.
(TSS) (Flow)ESU = -Spin Ratio
(30) (4)(30) (4)
1000/1 1000
= 0.120 units/day
C. Determine the units of sludge intentionally wasted.
XSU = (WSC) (WSF)
= (15) (0.05)
= 0.75 units/day
1160
20

ACTIVATED SLUDGE PROCESSSECTION IlPROCESS CONTROL .
D. Now determine the total sludge wasted.
WSU = ESU + XSU
= 0.12 + 0.76
= 0.87 units/day
Sludge westing is regulated on the basis of maintaining a "normal eat-tling", good quelitV sludge es measured by the settleometer and on thebasis of visual observations of the aeration tank and clarifier surfaces.The following is a summary of Sludge Waste Control.
Sludge westing should normally be started, or Increased, if end when:,a. Mixed liquor settles too rapidly in the settleometer end ssceo '
rises significantly above 20.b. "Ash" or "clumps" start rising to thalinal clarifier surface.c. A darkbrown, scummy foam appears on the aeration tank surface.d. A sludge blanket, composed of good -quality normally settling
sludge, rises too niose to the clarifier water surface.
Sludge wasting should be reduced, if and when:a. Mixed liquor settles too slowly in the settleometer and 55C60
values fell to 10 or less. (This will normally be accompanied by arising clarifier sludge blanket.) .,
b. Large billows of white foam start forming on the aeration tanksurface.
'nom (Aeration tank conc., %) (1000 mill)
Sludge settling volume60, mill
Changes in the wasting rate should be made a little each day (16 to 15percent per dey). Since sludge quality responds slowly to process controlchanges (usually about three days after the adjustments are made),process control changes should not be made rapidly or Irregularly.
About a week is usually required following the control adjustments beforethe trend in the process response can be positively confirmed. And finally,two to four weeks before the biological process etebillzes.
7. Sludge Age Age .
Sludge Age or mean cell residence time (MCAT) hes been used bymany authors as an operational tool. The purpose is to define enaverage time that activated sludge stays in the plant. To find sludgeage we need only to divide the total sludge units by the total sludgewasted per day.
11.81
121I
a

ACTIVATED SLUDGE PROCESSSECTION PROCESS CONTROL.
V
This may be calculated as follows:
Example Calculation
A. Data Required1. TSU = Total sludge units in system = 4.052. WSU = Total sludge wasted, units/day = 0.87
B. Now determine the Mudge age.
TSU"Age =yl/SU
4.05= --0.87
= 4.7 days
In the Sludge Quality method of process control, conventional parameterssuch as FIM and MCRT are calculated for monitoring and comparativepurposes; but are not used as control parameters.
8. Sludge Detention Time in the Clarifier SDTcThis is a measurement of the average time that the activated sludgeactually spends in the clarifier at any given .time. SDTu is found bydividing the clarifier sludge units by the average daily return sludgeunits and multiplying by 24 hrslday to obtain the time in hours.
Example Calculation
A. Data Required1. CSU = Clarifier sludge unitsIday = 1.052. RSU = Return sludge units/day = 24
B. Now determine the sludge deterition time in the clarifier.
SDTc (CSU) (24 hrWday)
RSU
(1.05) (24)
24
= 1.05 hours
Sludge detention time in the clarifier should be greater than 30 minutes toprovide time for compaction. Any time less than 30 minutes will usuallyrequire a high return rate which will reduce the sludge detention time inthe aerators. (See discussion of SDTa, No. 9 below.) The sludge detentiontime in the clarifier should be less than efl minutes to preserve an "activebiomass ,
I
".e1 22
.

ACTIVATED SLUDGE PROCESSSECTION U-PROCESS CONTROL
9. Sludge Detention Time in the Aerator -SineThis is the measurement of the average time that the activated sludgeactually spends in the aerator mixing with wastewater. The sludgedetention time affects the efficiency of the organisms to absorb andmake use of the BOD by changing the contact time with the BOD. Acomparison of sludge. detention times in the aeration tank to theclarifier also provides important information for controlling sludgequality. The operator can control or change his sludge detention timesby chqnging return rates.
A rule of thumb has been developed which relates thletydge detentiontime in the aeration tank toihe detention time in the final clarifier:
SDTa = value must be greater than 1SDTc
This rule of thumb is based on observations of sludge quality in variousplants where it has been noticed that as SDTa becomes closer toADTc,that sludge quality is much more difficult to control.
Tank design, especially in some complete mix plants, may limit the abilityof the.opeeator to controilhis ratio above one, but ,this still should be agoal of plant operations.
SDTa is found by dividing the aeration sludge units by the sludge unitsbeing sent to the clarifier per day, and multiplying by 24 Uday. Thesludge flow to the Clarifier is found by adding the plant fl . (0) to thereturn flow (RSF) and multiplying by the aeration tank concentration (ATC).
4,
The sludge detention time in the aeration tank is determinea as follows:
Example Calculation
A. Data Required1. ASU = Aeration Sludge Units = 3.02. 0 = Plant flow rate, mgd z. 43. RSF = Return sludge flow, mgd =4. ATC = Aeration tank concentration, % = 3.0
B. Now determine the sludge detention time irothe aeration tank.
SDTa = (ASU) (24 hrslday)
(C) RSF) ATC)
(3.0) (24)
(4 + 2) (3.0)
= 4 hours
11.831 A.+n
V
4

.
1
,
.
.
ACTIVATED SLUDGE PROCESSSEdTION II . PROCESS CONTROL
,
Settleometer
The settleometer (also called the sludge settleability test) is the ke-i---.Indicator for observing sludge quality. Diligent use of the settleometercan provide an experienced.operator with days advance warning of animpending disruption or change in process control. This advance warningprovides the operator with valuable time to make appropriate processchanges. The settleometer information can also be Instrumental whenrecovering from an unavoidable operational upset.
in this case the advanced indicators can guide the operator through aseries of process adjustments without wasting excess time waiting forresults from process changes or without trying to make a major adjust-ment in too short a time.
The two things an operator should look at when running the settleometertest are the floc formation and the blanket formation. Through experience,an operator will soon learn that within a few minutes he can detect certaincharacteristics which will describe the sludge quality. Is the floc granular,compact, fluffy or feathe? Does the Ile settle individually or does itfirst form a blanket? Is the blanket ragged and lumpy, or uniform on thesurface?
After the operator has looked at these characteristics he then shouldobserve settling rates and compaction characteristics. Is the blanketsettling uniformly, or are segments settling faster than others? Is theblanket entrapping the majority of the material or are straggler floc escap-ing? Is the sludge compacting and squeezing out water, or is it maintaininga constant density throughout?
Observations such as these are important to the operator. They are noteasily translated to numbers, so he should make appropriate notes on hisdata sheet for future reference. There are, however, numerical observa-tions which can be made. Figure II.10 presents a typical data sheet whichcan be used to record appropriate sludge settling paraMeters. Observations and recordings are made every 5 minutes for the first half hour. andthen every 10 minutes for the second half hour. More observations aremade in the first half hour to ensure that the operator is taking the timeto observe the floc formation and blanket characteristics.
If the operator also measures the concentration from the original aerationtank sample with the centrifuge (ATO) he can make some - informativecalculations from the data.e
The calculation of interest is the conversion of the sludge settling volume(SSV) to sludge settling concentrations (SSC) which is determined for anygiven time (t) of settling as follows:
124
1164

hem, Clear Creek
Oar Satur4
ACTIVATED SLUDGE PROCESSSECTION II PROCESS CONTROL
Dote 6/12/73
SETTLEONETER TEST INFORMATION ITC ISC DOB IMO & ILO INFORMATION
toe oftest 1 I
TIME 008.-.tI I
6.0
3- 14A
.Turfs...ITU
I
3.211 3.713.5! ,1
3.011
irir I
FLO
1 . 5I
la 1414;1 syr "1'14 :3 r ii.9-re",, '4:-ATC-%
0 1000 I 3.4 1-0 I IOC? I 2.8 1 0 1 1000 1 9004 3.4 )8.6100E 2 .113119.15000 3.01 19.1
950 3.58 S 910 1 3.08r S I
13.82 WI 820 1 3.4214 i
830 4.10 IS 740 1 3.79 01 i 1000L 3_] 114 reZ0 770 4.42 ?11 670 I 4.181 ?Ol I I I
720 4.73 I ?) 620 I 4.52 31 . 1
680 5.00 131 570 I 4.92120 I I - I40 620 5.48 101 490 I 5.72110 I i .Sit7;ii
_....1I I I
-,
SO
60
570520
5:97 I SOI 430 6.52 se r-----i-m-cm I
6.54 60 380 I 7. 38I SIT I Ate/ 13.1 ln 4 3,3.A2WASTING INfOVIATION
-IISF INfORMATIO
TimeWastingBegan
TimeWasting
Ended
Te2w304taw
Flow.1141ICPM
CellottsINesttel
1
eCALt
WSCSe3an.c's e
WSCEndedet'oe
Arsine-WSctoo)
tIvdte.1.17114
oe..10Li 0
timeBegan
TineEnded
Totil 1 IISF
lime tatoreCat:IN:41
TOM1(0113
700a 201. 300 00 27ennin 11,3 0 1 800a 800a 1440 1000 ,
111111
i
1 1111R
111111 111111=1MI= MEI 1
T.1.1 To,' 1 1,'-'BOOS TEST INFORMATION TSS IVSS TEST INFORMATION
rumetef I BLX PH ametct I I
Tone I IW ilt it I Tate 2: I
%Oiluljen REM Tyre &Solids MoT.
Tilt iT. I
I11111141 0.0. I
FINI 0.0. ---- De y WedsWI
00. 01111. I I Aib WT. 1
;ItriTirelii:itActor
.Fut of Silifti.'"AO 0005 1 IsTe,DI
VS S MO.10M.1.w
1
MISC. InfORSIATIOU -47i3f-----
I
to F :.geoltejitcoa esatiotearloids tsettligieheievo ISLA? llenitti.
ACTIVATED SLUDGE PLANT
DAILY DATA SHEET
FIGURE II-10
1165
25

I
a%
:;ACTIVATEISLU E PROCESSSECTIONS PROCESS CONTROL
Example Calculation
A. Data Required1. ATC = Aeration tank concentration, % = 3.42. SSV(t) = Sludge settling volume at any time, mill = 680 (at
30 min.) 4
3.7(A) = Length of time of settling, minutes = 30
B. Now determine the sludge settling concentration.
(ATC) (1000 m111)SSC(t) =SSV {t)
SSC30 = (ATC) (1000 m1/1)
tS1/30
(3.4) (1000) .
I' ..680
= 5%
This means that after 30 minutes the sludge has settled to a concentra7-tion of only 5%.
The sludge settling concentrations can be calculated for various timesand plotted (v shown in Figure 11.11) corresponding to the time and daythey were obierved. When several days of data have been plotted, a trendwill have been developed which graphically relates to the settling char-acteristics observed in the settleometer. Often, it is found that the 5minute, 30 minute, and 60 minute SSG's adequately represent the settlingcharacteristics.
The 5 minute sludge settling concentration is an indicator of the criticalfloc and blanket formation stage. Here the operator's observations andnotes are very important for future reference.
The majority of the settling occurs before the 30 minute reading, thereforethe distance settled.reflects the settling rate of the sludge. For example,a 30 minute sludge settling volume of 200 would indicate a fast settlingskidge, while a settling volume of 600 would represent a very slow settlingsludge. .
The 60 minute sludge settling concentration is indicative of the level ofcompaction that can be expected from the sludge. Therefore, there is arelationship between this cons titration and the concentration of thereturn sludge that is actually obberved in the plant. These numbers willseldom be the same due to flow characteristics and other physical dif-ferences found in the clarifiers. The Important online, however, is thatthe settleometer characteristics are reproducible for similar sludge qualitycharacteristics. this then enables the operator to make some decisionson return sludge flows form settleometer data.
11162 6
e-

4;..
S
I
900
800
700
12 600
'-c; 500
N4004
a 300
200
100
10 20 30 40 50 60
Time, minutes
20
18
16
14
12
10
8
6
4
0
ACTIVATED SLUDGE PROCESSSECTION II PREDESs CONTROL
I
. -
Y
i
t,
10 20 30 40 50 61
Time, minutes
4
PLOTTING SLUDGE SETTLING CHARACTERISTICS
FIGURE 11-11 .
11.67 Omi
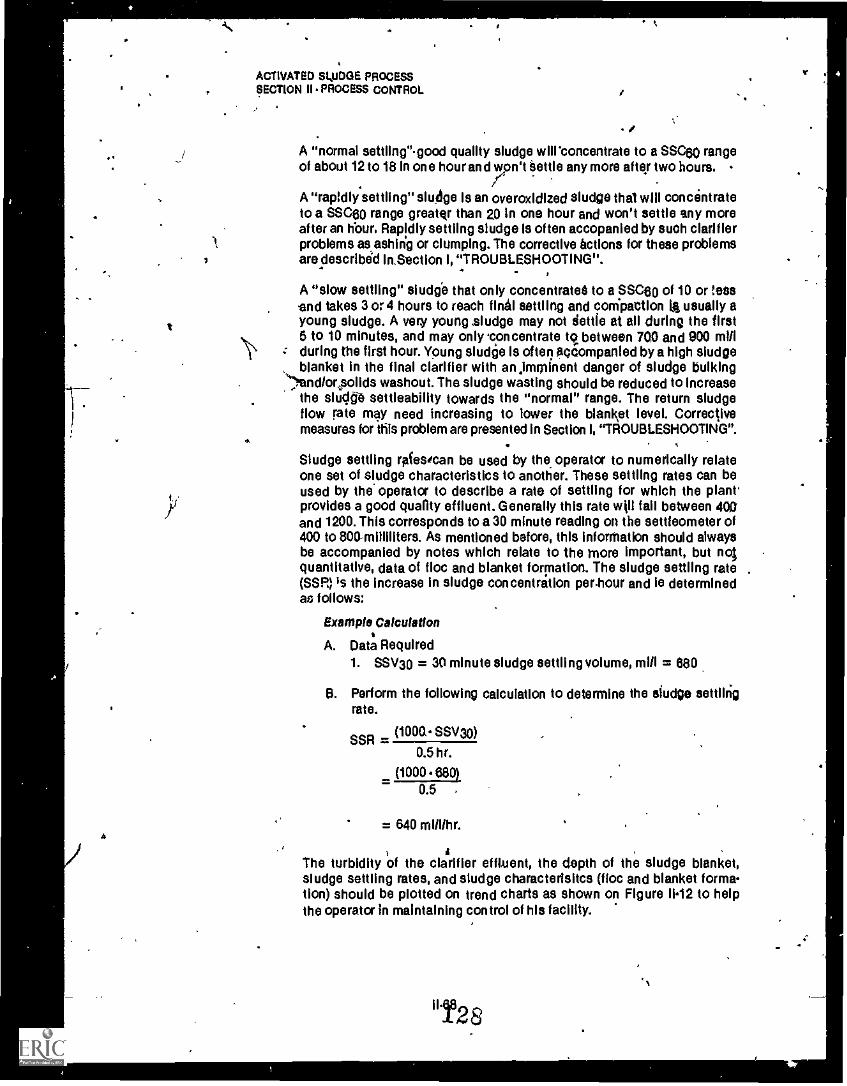
A
,
4%
ACTIVATED SLUDGE PROCESS-. SECTION 0 PROCESS CONTROL I
*
,
. 4
,A "normal settling"good quality sludge will' concentrate to a SSC80 rangeof about 12 to 18 In one hour and won't bottle any more after two hours.
A "rapidly settling" sludge Is an overoxidized sludge that will concentrateto a SSC80 range greater than 20 In one hour and won't settle any moreafter an hbur. Rapidly settling sludge is often accopanied by such clarifierproblems as, ashing or clumping. The corrective actions for these problemsare describeb laSection I, "TROUBLESHOOTING".
A "slow settling" sludge that only concentrate8 to a SSC80 of 10 or !assand takes 3 or 4 hours to reach final settling and compaction 14 usually ayoung sludge. A very young sludge may not settle at all during the first5 to 10 minutes, and may only concentrate to between 700 and 900 m1/Iduring the first hour. Young sludge Is often accompanied by a high sludgeblanket in the final clarifier with animminent danger of sludge bulking
')and/orpolids washout. The sludge wasting should be reduced to Increasethe sludgy settleability towards the "normal" range. The return sludgeflow rate may need Increasing to lower the blanket level. Correctivemeasures for this problem are presented in Section I, "TROUBLESHOOTING".
Sludge settling Wes/can be used by the operator to numerically relateone set of sludge characteristics to another. These settling rates can beused by the operator to describe a rate of settling for which the plant'provides a good quality effluent. Generally this rate will fall between 409and 1200. This corresponds to a 30 minute reading on the settleometer of400 to 800.milliliters. As mentioned before, this information should alwaysbe accompanied by notes which relate to the more important, but notquantitative, data of floc and blanket formation. The sludge settling rate(SSP.) is the increase in sludge concentration perhour and le determinedas follows:
Example Calculation
A. Data Required1. SSV30 = 30 minute sludge settling volume, mill = 880
B. Perform the following calculation to determine the sludge settlingrate.
.
SSR(1000 SSV30)
0.5 hr.
(1000.68M0.5
= 640 m1/11hr.
Ii
The turbidity of the clarifier effluent, the depth of the sludge blanket,sludge settling rates, and sludge charactedsitcs (floc and blanket forma-tion) should be plotted on trend charts as shown on Figure 1112 to helpthe operator In maintaining control of his facility.
128
If

ACTIVATED SLUDGE PROCESSSECTION II PROCESS CONTROL
10.0
9.0
8.0
7.0
6.0
5.0
4.0
3.0
2.0
1.0
10.0
44: 9.0
8.0
7.0
A m .0
5.0.
4.0
3.0
2,0
1.0
I.: 1800
1600
ri 1400
1200
1000trt
800
600
0N, 400
II' 200w
.4.5 40 15 r tO 25 . 30
05 10 15 20 25 30
1I I,
0 5 10 15
Time/Days
20 25 30
PROCESS VARIABLE TRENDS
FIGURE 11-12
0439
129

44
.
.
' I
ACTIVATED SLUDGE PROCESSS' 'ION II. PROCESS CONTROL..
Visual Observations
A modest accuniulation of light colored, orispappearing foam on theaeration tanks Is usually indicative of good operation.
During good operation the final clarifier effluent will be relatively clearwith the sludge blanket in the lower half of the clarifier (generally 1 to 3feet).
--4
.. For those observations that are indicative of Operational problems, seeSection 4, "TROUBLESHOOTING".
.
4
,,
.
Turbidity .
Turbidity is a quick and convenient indication of the activated sludge.process performance. A well performing'activated sludge plant should beproducing an effluent with a settled turgidity of less than 3 JTU*s and,sometimes down to 1 JTU. Turbidity measurements can also be used tomeasura the degree of severity of pin floc or other solids. Short term v zia-tions due to these type problems may be attributable to hydraulic problemsin the clarifier rather than deterioration of the sludge quality.
)
.
Depth of Blanket
Within the final clarifier, a separation of the liquid and solids takes place.The solids settle, to the bottom of the clarifier'while the clear liquid isdisplaced over the clarifier effluent weirs. If the settled solids are notremoved from the tank at a rate equal to or greater than solids input bythe aeration effluent flow, a blanket of sludge will accumulate untileventually the solids are washed out in the clarifier effluent flow.,
The location of the sludge blanket in relation to the clarifier depth may bedeterMined by various types of devices - -sortie are commercially,available, .
while others must be improvished by the operator.
Determining the sludge blanket depth in the final clarifier in conjunctionwith other measurements, such as the plant flow, aeration tank concen-tration (ATC), sludge settling concentration (SSC),and the return sludgeflow (RSF) and concentration (RSC) provides valuable ipformation thatcan be used tb control the return sludge flow rates. Additional) Y; thesemeasurements can be used to evaluate the operation of multiple units, forinstance the sludge blanket depth in two ciarifrers operating In parailbl(both receiving flow from same aeration basin) having equal return Aludgeflow rates should be comparable. If the sludge blanket In one clarifier wasrising while the blanket in the other clarifier was fallireg, it could be con-cluded that the aeration tank effluent flow was being unevenly distributedto the clarifiers. Depth of blanket measurements are important for anoperator so he can have early warning to clarifier malfunctions and toproblems associated with long storage times in the clarifier. An averagevalue for each clarifier Is usually sufficient for process control, but
.
,3
.
Ir

ACTIVATED SLUDGE PROCESSSECTION II PROCESS CONTROL
,
measurements should be ;periodically made at various locations in theclarifiet to detect any localized problems. Coning or plugging of suctionports can lead to areas in the clarifier whet% the sludge blanket will build.A rising blanket may indicate an'inadequate sludge return rate, unbalanceddistribution of "aeration tank- effluent flow, inadequate sludge wastingrates, or a poorly settling sludge.
The presence of a poorly settling sludge could beyerified with the SSCvalue. To correct a rising blanket, the operator first determines the reasonsby a review Of the lab test results, operational logs, and process controlparameters. After determining the possible reason for the increasedblanket depth, the operator should then take the appropriate correctivemeasures. -. A
, The procedures for making the sludge blanket measurement are given inSection IV, "LABORATORY CONTROL".
Microscopic Examination
MicroScoplb examination of the MLSS can be a significant aid in theevaluation of the activated sludge' process. The presence of variousmicroorganisms within the. sludge floc can rapidly indicate good or poortreatment. The most important of these microorganisms are the hetero-tropic and autotrophic bacteria which are responsible for purifying thewastewater.
In addition, protozoa play an important role in clarifying the w tewaterand act as indicators of the degree of treatment. The presence f rotifersis alb an indicator of effluent stability. A predominance of protozoa(ciliates) and rotifers in the MLSS is a Mgr) of good sludge quality.
Inversely, a predominance of filamentous organisms and a limited numberof ciliates is characteristic of a poor quality activated sludge. This condi-tion is commonly associated with a sludge that settles poorly.
There are many other organisms such as nematodes4 (worms) and water-borne insect larvae which may be found; however, these do not signif-icantly affect the quality of treatment.
The microorganisnis which are important*to the operator are the protozoaand rotifers. The protozoa eat the bacteria and help to provide a cleareffluent. Basically, the operator should be concerned with three groups of
- protozoa, each of which have significance in the treatment of wastewater.A discussion of these groups and the procedures for performing a micro-scopic examination are presented in Section 1V, "LABORATORY CONTROL".
4
t
MI
Commonoperationalproblems.
%ft
correctionscan be merle by
logicalapproach.
The 30-minutesettling testprovides datafor problemsolving.
Why le aerationImportant?
Uniformt`aeration &mixing isessentIsl.
Perform D.O.Profile.
ACTIVATED SLUDGE PROCESSSECTION II PROCESS CONTROL
2.05 OPERATIONAL PROBLEMS
.
tions made.during the e 30.mlnute settle alit test. This test is used to indicate,the settling characteristics of the mixestliqtfor under controlled conditions.Figures 11.16 , 11.20, and 11.22 present pictorial guides for interpretation andapplication of the various settling test observations. The procedures forperforming the settleability lest can be found in Section IV, "LABORATORYCONTROL."
This section of the manual discusses operational problems, cbfnmonly ex-perienced in the activated sludge process. in general, these problems can beclassified by conditions which, the operator can see in the aeration tank andsecondary clarifier.
.Aeralion Tank:1) Aeration Tank:2) Foaming Problems
Secondary Clarifier3) Solids Washout4) Bulking Sludge
S--------
5) Clumping/Rising Sludge(6) Clouding Secondary Effluent
7) Ashing8) Pinpoint Floc9) Stragglers/Billowing Solids
Correction of these problems can be approached in it logical manner, byusing sound operational control practices and by maintaining proper equip-ment operation. Troubleshooting procedures covering these problems areprovided in an easy-topfoliow format in Section I, "TROUBLESrOTING."
The problems occurring in the clarifier can often be associated with observe.
.
AerationSystem Problems (Refer to Figure 11.13)
Aeration and mixing of the MLSS is essential to maintain the environmentfor the microorganisms to remain active and healthy. In addition, mixing ofthe aeration tank contents is necessary in order to bring these microorganismsin contact with all the organic matter in the wastewater being treated.
Mixing in the aeration tank can generally be checked by observing the 4ur.bulence on the aeration tank surface. The surface turbulence should IXreasonably unitprm throughout the tank. Dead spots and nonuniform mixingpatterns will generally indicate a clogged diffuser or that the diffuser headervalves need adjustment to balance the air distribution In the tank. An illustration of violent turbulence in an aeration tank Is shown in Figure 11-13.
Periodically, (generally monthly to every 6 months) a D.O. profile should beperformed in aeration tanks which are equipped with the diffusedtyPe ofaeration system. The air distribution shotild be adjusted to maintain a D.O. ofno less than 0.5 mg/I, preferably 1 to 3 mg/I, throughout the aeration tank.
1142
132.

y
0
Some to usesforestationproblems.
yeorrectivoaction formotionprObloms.
I
1
. 2..
ACTIVATED SLUDGE PROCESSSECTION 11 PROCESS CONTROL
`Some probable causes of nonuniform aeration include the following:1. Alr rates too high or low for proper operation of the diffuser.2. Valves need adjustment to balance the air distribution.
3. Diffusers (or mechanical aerators) need repair andlor cleaning. Masses .of air rising over the locationOf the diffuser blowoff legs (If so equipped)generally indicates that the diffusers need cleaning. Figure II-131s anindication of this problem. r r
4. Mechanical equipment limitations.--.
The following applicable measures should be implemented to correct aerationprat:Am: + . --.
Adjust air SCFM ree to mal4taln the D.O. in the prof tir range (1 to 3ing11). The SCFM of air per linear foot of diffuser header pipe should begreater than3SCFM/linear ft. to ensure adequate aeration and irtiXingof tank contents.
,
Adjust diffuser header valves to balance air distribution and to eilminaledead spots.
'Clean and chick the diffusers. Diffusers should be cleaned on a routinebasis to maintain good aeration performance. Generally eve6i, sixmonths to one year. , -if fine bubble diffusers are extremely troublesome, consider replacingthem 'with a coarse bubble type of diffuser. Coarse bubble diffusersrequire a greater air SCFM ratibecause of the reduced oxygen transferefficiency; therefore, it must be determined dot an adequate airsupply Is available before making this modification. Outsitle helpshould be obtained.Relocate andlor increase the number'of diffusers (or mechanicalaerators) to properly mix and aerate the tank contents.
aY
_ .
Figure 0.13
1143 133
Ad
4r 4
J.
s

7
L
t.
i
t
r
STIFF WHITE FOAMING
..
waraii......
u
-ow..
GREASY BROWN FOAMING CARRYOVER OF BROWN FOAM IN CLARIFIER
FOAMING PROBLEMS
FIGURE 11-14
1301

, e
4
Minor foamingIs normal inaeration tanks.
Two types offoamingconditions canoccur.
Foaming canmats unsafe
1 workingconditions.
Cauaas forwhite foam.
ACTIVATED SLUDGE PROCESSSaCTION 11-1,SoCEss CONTROL
Foaming Problems (Refer to Figure 11.14)
The presence of foam on the aeration tank is normal for the activated sludgeprocess. Frequently, 10 to 25 percent of the aeration tank surface is coveredwith film or light froth or foam.
Under certain operating conditions the foam (or froth) can become excessiveand can affect operations. Two types of problem foam are normally seen.These are a thick brown greasy ft.' im and a stiff white foam.
If the foam is allowed to build-up excessively, it can be blown by the windonto walkways and plant structures, causing hazardous working conditions.In addition, it can create an unsightly appearance as well as cause posse, leodors. If the foam is carried over with the flow to the secondary clarifier, itwill tend to build-up behind the influent baffles and create additional cleaningproblems.
Stiff White Foam
The stiff white, billowing foam is indicative of an overloaded plant. Thismeans that the MLSS concentration is too low and the FM is consequentlytoo high. The foam may consist of detergents or proteins which cannot beconverted to food by the young and simple bacteria that grow in the MLSSat a high RM.
1
Some probable causes of stiff white, billowing foam include the following:1. Low MLSS due to process start-up.2. Excessive wasting of activated sludge causing the MLSS concentra-
tion to drop too low for current organic loading.
3. The presence of unflavorabie conditions such as toxic or inhibitingmaterials, abnormally low or high Ph's (pH below 8.5 or above 9.0),insufficient dissolved oxygen,- nutrient deficiencies, or seasonal(summer to winter) wastewater temperature change resulting inreduced microorganism activity and growth.
4. Unintentional wasting of activated sludge in the effluent of thesecondary clarifier. This condition could be caused by the following:
Excessive or shock plant loads.Biological upset.High sludge blanket in sludge clarifier.Mechanical deficiencies in the clarifier.Denitrification in the clarifier.improper distribution of flows or solids loadings to multiple clarifies.
5. Improper distribution of the wastewater and/or the RAS flows tomultiple aeration tanks.
...--- 11-75
1 Q%.,, tj4

Whit ere thecorrectivemeasurer forwhite foaming.
if now metersore notprovided, trythese correctiveMOISMS.
Causes fwbrown foam.
ACTIVATED SLUDGE PROCESSSECTION II PROCESS CONTROL
The following applicable measures should be implemented to correct thefoaming problem:
Reduce the wasting of activated sludge to increase the MLSS concen-tration. Changes in the wasting rate should be made slowly andgradually (see Section 2.04 for waste activated sludge control methodsand procedures).Maintain sufficient RAS rates to keep the sludge blanket in the lowerhalf of the clarifier.,Control the air SCFM rates to maintain 0.0. levels of i to 3 mgl in theaeration tank.industrial waste ordinances must be actively enforced to avoid processupat and deterioration of the pianteffluent.h' odify the piping or structures as necessary to maintain the properdistribution (proportional #o tank volumes) of flows to multiple aerationtanks and secondary clarifiers. The construction of some type of flowdistribution structure may be required.
If flow mete a not provided, compare the following measurements:The sludge blanket levels in each clarifier.The suspended muster concentration of each clarifier's RAS flow.The MLSS cAncentration in each aeration tank.
The corresponding measurements should be nearly equal if the wastewater,aeratior effluent. and RAS flows are being properly distributed.
if the aeration tanks are equipped with water sprays for froth control,operate the water sprays when there is danger of the foam being blownonto the walkways andior other plant structures.
Excessiie Brown Foam
This type of foam is associated with plants operating between the con-ventional and extended aeration loading ranges. Nitrification and illamentous organisms suctv as Nocardia are often associated with this typeof foam. The thick brown greasy foam is normal at any plant that practicessludge reaeration. The appearance of this type of foam can result inadditional problems In the clarifier by building up behind the influentbaffles and creating a scum disposal problem as shown in Figure 11.14.Scum containing filamentous organisms should not be returned to theaeration tanks. Some probable causes of the foaming problem are asfollows:
1. Aeration tank is being operated at a low NM ratio because WW1cat:on is required by regulatory agency.
2. Build-up of a high MLSS concentration due to insufficient sludgewasting. This conditiln could untentionally occur when theseasonal (winter to summer) wastewater temperature changeresults in greater activity of the microorganism and consequentlygreater sludge production.
3. Operating in the sludge reaeration mode. A thick brown foam isnormal in the sludge reaeration tank.
4. Improper WAS control program. See Section 2.04, "PROCESSCONTROL
11.76
136

What sr thecoffee*:measures forbrown foaming.
Settteabilitytest helps toIdentity solidswashoutproblem.
What arecauses forsolid:washout?
Is theoledllsr workingproperly?
ACTIVATED SLUDGE PROCESSSECTION H PROCESS CONTROL
The following applicable measures should be implementftd to correct thefoaming problem:
if nitrification is not required, gradually increase the wasting rateto increase the FIM ratio (see Section 2.04, "PROCESS CONTROL").If the scum is not returned to the aeration tanks, include the volatilesolids removed in the scum in thastesludge calculations.During normal operation, the amount of volatile solids removedwith the scum is too small to matter. However, during heavy foam-ing, as much as 10 percent of the waste activated sludge solidsmay be removed with the scum.When filaments appear in a nitrifying sludge, they may be killed bythe addition of chlorine to the RAS. Recent experiences sugglststhat the does of chlorine required wl be from 2 to 3 lb C1211000lbs of MLVSS1day.CAUTION: Excessive chlorination can harm the desirable micro-organisms.Implerno,-.1 a better'brogram for controlling the waste of activatedsludge. Read Section 2.04 "PROCESS CONTROL" fct moreguidance on waste activated sludge control techniques. '
Solids Washout (See Case 1 on Figure 1116f
This condition can sometimes be quickly detected when good settling isobserved in the 30-minute Settling test but billowing homogenous sludgesolids are rising in the secondary clarifier (Figure 11-15) even though thesludge blanket is in the lower half of the clarifier.
Some probable causes of solids washout are as follows:1. Equipment malfunction2. Hydraulic overload3. Solids overload4. Temperature currents
The following applicable measures should be implemented to correct thesolids wash.ltit problem:
Equipment Malfunction
The operator should inspect all equipment in the clarifier to ensure that itis operating properly. Specifically check the following:
Sludge Collection EquipmentLook for broken drives or support members.Look for uneven blanket depth at several locations in the
clarifier. An uneven blanket may indicate a pluggedsuction collector or broken plough.
11-77 137

Are the flowsbalancedbetweenmultiple units?
Cheek theclarifiersurto**evartlave tete.
ACTIVATED SLUDGE PROCESSSECTION II - PROCES CONTROL
Baffles and SkirtsLook for broken welds, bolts, or supports.Look for holes in the baffle.
Weir LevelsLook for unbalanced flow over the weirs. Are the weirs on one
side of the tank more deeply covered than those on theother side?The weirs should he adjusted to an equalelevation.
o'
Figure 0.15
Hydraulic Overload
The operator should check the hydraulic loading on each clarifier/byeither measuring the flow to each clarifier or by estimating the flowbalance between multiple units as indicated by the depth of flow over theweirs In each of the clarifiers. Overloading can result from excessive flowor unevenly distributed flow between multiple units. Approach and solvethe problem as follows:
Determine H the flows are being distributed equally to the aerationbasing: and clarifier units. The weirs at the effluent end of the aera-tion tanks must be adjusted to an equal elevation to provide anequal distribution of loading to each tank. The weirs or gates at theRAS distribution structures must be adjusted to an equal elevationto provide proper distribution of RAS flows. The weirs at thesecondary clarifier distribution structures must be adjusted to anequal eleyation to provide a uniform hydraulic loading. In addition,thin effluent weirs must be ajusted to an equal elevation to provideoptimum clarifier performance.After checking and correcting the weir elevations where needed,determine the clarifier surface overflow rate as follows:
11.78

30 MINUTE SETTLING
30 MINUTE sernsto
OBSERVATION
GOOD SETTLING IN TESTBILLOWING IN CLABFIER
ACTION REMEDY
CHECK FOR EQUIPMENT MALFUNCTIONS REPAIR EQUIPMENT
C.
CHECK HYDRAULIC LOADING IMPROVE INLET/OUTLET BAFFLING-REDUCE RAS
MEASURE TEMPERATURE PROFILES USE ADDITIONAL AERATION TANKSAND/OR INSTALL BAFFLES
OBSERVATION ACTION REMEDY
POOR SETTLING IN PERFORMTEST, SUPERNATANT- MICROSCOPICVERY CLEAR E XAMINATION
130
FILAMENTS
ir 0.0.IS LOW-INCREASE AIR TO ACHIEVE DO OF 1 TO 2 MG/LCHECK D.C.{ I
IFD.O.LEVELS UNEVEN-ADJUST AIR DISTRIBUTION AND/ORCLEAN DIFFUSERS
(DOWN> 100/5 -- TRY ADDING N
CHECK N.P. AND FE poop > mm/i TRY ADDING P
Boo/FE > loop. S TRY ADDING FE
CHECK plf - pH <0.04RY RAISING pH
CHLORINATE RAS AT 2-3 LBW 1000 LBS MLVSS /DAY
NO FILAMENTSDISPERSED FLOC{
CHECK
r/m RATIO - IF HIGHER THAN USUAL,DECREASE WASTING
CHECK D.O. - IF ABOVE 3.0 MGAREDUCE AERATION
CASE 1 AND CASE 2
FIGURE II-16
F
140

How towaists A. Data Required°WSW
1, surface area, each clarifier = 7,850 sq. ft.overflow rate,
4.) 2. Two clarifiers, total area = 111,4/9sq. ft.3. Plant flow (peak hour) = 7,5 or 7,500,000 gpd
ACTIVATED SLUDGE PROCESSSECTION II- PROCESS CONTROL
*.
Example Calculation
t
-.--
B. Determine the clarifier surface overflow rate.
Surface overflow rate, gpd/f(.2 = _Plant nflow, pd
WI
Clarifier surface area, sq. ft....
7,500,000 gpd
15,70Qsq. ft.
= 478 gpd/sq. ft.
Ct Compare the calculated surface overflow rate with the designrate. If the current rate exceeds the design rate (see Section 2.03,"SECONDARY CLARIFIERS"), the *triflers are hydraulicallyoverloaded, and additional clarifier units are required in operation.if all clarifiers are operating, plant expansion or flow equalizationis required. -
. flSolids Overload
N.
A special case of overloading of the clarifier is known as solids 01/81'loading. Solids overloading is related to the 0, RAS flow, and MLSSConcentration. Reducing the MLSS concentration or the RAS flow mayeliminate the poor settling in the clarifier. Determine the solids loadingrate as follows:
C heck theclerillor solidsloading.
How tocalculateclarifier solidsbiding rate.
v
Example Calculation
A. Data Required1. Surface area, each clarifier = 7,850 sq. ft.2. Two clarifiers, total = 15,700 sq. ft. .3. Plant flow, 0 (peak hour) = 7.5 mgd4. ()RAS, RAS flow rate (peak hour) = 3.8 mgd5. Aeration effluent MLSS, peak hour = 2,500 mgli
B. Calculate the solids loading rate.
ibift2/hr = 0 + ORA& mgd) (MLSS, mg/I) (8.34 lbsigal)(24 hrs/day) (Clarifier surface area, sq. ft.)
L........,(7.5 + 3.8) (2,500) (.8.34)
(24) (15,700)
.:
:.- 0.83 lb MISS/sq. ft.lhr
'Ph
s

4
Ate .11 aval tabletanks Inoperation?
Allow *Akio tobuild IncierUler duringpeek flowperiod.
Decrease thesolidi Inventory.
flow to conducta tempprofile.
Install baffles.
, .
ACTIVATED SLUDGE PROCESSSECTION II. PROCESS CONTROL
-C, A solids loading rate value of 1.25 IbIsq. ft./hr is a practical upperlimit for clarifier operation. If the calculated value for a particular*plant exceeds this value the following approaches should betried.
' Utilize any available aeration tank or clarifiers.Reduce the RAS flow.Reduce the MLSS concentration.
The use of all available aeration tanks makes it possible to reduce theMLSS concentration without changing the FIM. The extra volume ofadditio9a1 aeration tank makes it possible to have the same volatilesolids inventory with a lower MLSS concentration, which effectivelyreduces the solids loading rate.
If no additional aeration tanks are available, the second approach shouldbe used. The RAS flow should be reduced by 10 to 20 percent. The depthof the sludge blanket in the clarifiers should be measured periodicallyto ensure the sludge blanket does not build to an excessive depth. Observe
uthe clarifier to see if the poor settrg characteristics are improved. If the --tsettling does not improve after re cing the RAS flow, the MLSS shouldbe decreased by slightly increasing the wasting rate. Be aware that theFIM is increasing during this procedure because the solids Inventory willdeorease. A practical limit for MLSS reduction would be a 10 percent.gradual change in one Week. If no improvement occurs during thoseadjustments, thehigh effluent suspended solids concentrations are mostlikely not due to solids overloading.
Temperature Currants
A temperaturei profile of the clarifier will identify the presence of anytemperature currents. The temperature probe on a dissolved oxygen meteris an excellent tool for, this procedure. To makethe profile, the tempera-ture Is gileasured and recorded at the head, one quarter, one half, threequarters and tail end of a rectangular or square clarifier, or at the quarterpoints across a circular clarifier. At each point, the temperature is measuredat the surface and the quarter points down to fhe bottom of the tank. Becareful that the temperature probe and wires do ot get entangled in thesludge collection equipment.
If the deeper temperatures are consistently cooler by 1 to 2° C or more,temperature currents are present. The settling may be improved if bafflesare installed to break up the currents and stop the turbulence.
114112

Poor settling .andcompaction,with a clearsupernatant
ACTIVATED SLUDGE PROCESSSECTION II PROCESS CONTROL
Bulking Sludge (See Case 2 on Figure II16)
The presehce of a clear supernatant above a poor settling sludge indicatesthat the settling is being -hindered by either the presence of filamentousmicroorganisms or dispersed floc. The presence of filamentous microorganismsis corrected by improving the treatment environment with the addition ofnutrients, such as nitrogen and phosphorous, andlor by correcting the dis-solved oxygen concentration in the aeration tank. The presence of dispersedfloc indicates either organic overloading or overaenition. Classic sludge-bulking in the clarifier is illustrated in Figure 11-17.
Some probable causes of the bulky sludge problem are as follows:1. Filamentous microorganisms present
Low D.O. in aeration tankinsufficient nutrientsLow pHWarm wastewater temperatureindustrial wastes
2. No filamentous microorganisms presentOrganic overloading (high FIM)Overaeration
11.424 3
Flume 1147
1
4
.11.1110

..
' Monts. IfIllsmotous
ohms ars.moot.
i
.
4.
. ..
ACTIVATED SLUDGE PROCESS. SECTION II PROCESS CONTROL
Mr
. : 1
The first step in analyzing this condition is to perform a microscopic examina-tion of the MLSS. Microscopic analysis of the MLSS is described in Section -IV, "LABORATORY CONTROL.",Approach and solve the problem as follows:
.
Filamentous Microorganisms Present (Figure II -1$)...1.-
Whst tochock If filamentous microorganisms are present, the following steps should bewho followed:Illsmotoosorganisms ors Meacure the D.O. level at various locations throughout the aerationwawa. tank. .
If the average D.O. isless than 0.5 mg11 there is insufficient dis-solved oxygen in the aeration tank. Solution,- increase the airSCFM rate until the O.O. levels increase to 1 to 3 mg11 throughoutthe tank.If the D.C. levels are nearly iero.in some parts of the basin, but arehigher in other locations, the air distribution system is out ofbalanceor the diffusers in an area of the basin may need to becleaned. Solution - Balance air system and/or clean diffusers.
Calculate the ratios of BOD to nitrogeti (use TKN expressed as ikBOD to phosphorus (expressed as P), and BOD to iron (expressedas Fe). In general, anhydrous ammonia is used to add N, trisodlumphosphate is used to add P, and ferric chloride is used to add Fe.
How tocalculateamount ofnutrients to use.
Example Calculation
A. Data Required1. Influent BOD = 170 mg11
2. Influent TKN = 4.5 mg /13. Suggested ratio, BODIN = 10015 = 20 .
4. Suggested ratio, BOD1P = 10011 = 1005., Suggested ratio, BOD/Fe = 10010.5 = 2006. Plant Q, average daily = 7.5 mgd7. Ammonia/nitrogen atomic weight ratio, NH3IN = 17/14 = 1.28. Trisodium phosphate/phosphrus atomic weight ratio, Na3
1304/R = 164/31 = 5.39. Phosphroic acid/phosphorus atomic weight ratio, H3PO41P =
98131 =. 3.16
10. Ferric chloride /iron atomic weight ratio, FeCI3/fe = 162.5156r. 2.9
.. .
B. Calculate the amount of N,P, and Fe needed per day to achievethe suggested ratios.
po, mg11Nutrient needed espective suggested ratio from
3, 4 or 5 above
11.83
114
4

4
ACTIVATEDSLUDGE PROCESSSECTION !I. PROCESS CONTROL
G_
44-
GOOD SETTLING SLUDGE -
Z
FILAMENTOUS ORGANISMS IN BULKING SLUDGE
MICROSCOPIC OBSERVATIONS
FIGURE 11-18
11.84
. 445
A
--t

(
A,
ACTIVATED SLUDGE PROCESSSECTION II.PROCESS CONTROL
Exempt. calculation
N needed BOO, mgllSuggested ratio, BODIN
170
20 .
= 8.5 mg11
C. Calculate the difference between the nutrient available and thenutrient needed.
Nutrient shortage = N needed - Nutrient available
Example Calculation
.N shortage = N needed TKN available
= 8.5.4.5
= 4.0, mgfl*
*Nutrient addition is not needed When answerh zero.
D. Calculate the pounds of nutrients that need to be added per day.
Nutrient, lbsiday = (N shortage,Thg/i) (0, mgd)(8.34 lbsigal)
Example Calculetlon
Nitrogen, lbsIday = (N shortage, nIgil) (Q, mgd) (8.34 lbsigal)
11.85
= (4 mgii) (7.5 mgd) (8.34 lbsIgal)
= 250 lbs of Nlday
146

,t
Addition ofnutrients.
Nutrientsshould beapplied withcars
lithe emotiontank pH 6.5.
Preventproblem itsource.
i
ACTIVATED SLUDGE PROCESS. SETION II PROCESS CONTROL
,
E. Calculate the pounds of the respective commercial chemical to be, added per day.
Chemical, L (Nutrient lbsktay) (Respective atomic wt. ratio)
lbs/day Concentration of chemical, %7
N,Example Calculation
il (N, lbs/day) (1.2 NH31N)Anhydrous ammonia -'°'" NH3 concentration, %
., (250 lbsiday) (1.2 NH3/N)(assume using a.commercial grade 80%
with a 80% conc.)
= 300
0.8
' i
= 376 lbs of anhydrous ammonia needed/day
A
Nutrients should be added at the influent end of the aeration tank. Thesettleability of the sludge should be carefully observed to see if it Isimproving. if the settleability improves, the dose of nutrient can be reducedby five percent per week until the settleaWlity begins to decrease. Thenincre e the dose by five percent and observe the settleabiiity. !
Nutrients are expensive and they should be applied with care: Nutrientdosage may be increased with increased BOD concentrations whichlakes Into account the effects of the additional microorganism growththat will occur. if the settleability does not improve readily, the nutrientdosing should be continued until the actual problem Is identified' andsolved, because the p ?oblems that are causing the poor settleabillty maybe Interrelated. ..
,
If the pH in the aeration tank is less than about 8.5, the settledbility of thesludge may be affected dyp to Inhibition of the bacteria that settle readily.if the pH of the raw wastewater is less than 6.5, the low pH problem isprobably due to industrial wastes and d survey shodid be co.nducted toIdentify the industry that is In violation of its discharge permit, The bestprocedure; if possible, is to prevent the problem by control at the source.A good industrial waste.monitoring and enforcement program will avoidmany difficulties in this lrea.
, .
Nitrification destroys alkalinity and reduces the aeration pH level. If thisis the cause of the problem, raise the MLSS pH by adding caustic soda.or lime at the influent end of the aeration tank. If nitrification is required, itis suggested that the MLSS pH be maintained in the range of 7.2 to 7.8to encourage an acceptable rate of nitrification. Care must be exercisedto ensure that the treatment system is not shocked by high pH levels oroverdosed to pH levels above 9.
Effect ofnIbliclotIon.
11.86
147

II
Determiningamount ofcausticrequired.
How tocalculatecaustic needed.
o
.ACTIVATED SLUDGE PROCESS
SECTION ii-PROCESS CONTROL
The best method for deterrpining the amount of caustic required to raisethe pH involves a batch titration technique. A solution containing a knownconcentration of caustic is added dropwise to a sample of MLSS. Thesample volume must be known and the sample must be stirred during thisdetermination. The dropwise addition of caustic is continued until the pHis approximately 7.2. The amount of caustic added is proportional to theamount required to raise the pH in the treatment System. The pounds ofcaustic soda (NaOH) required is determined as follows:
Example Calculation
A. Data Required1. Plant 0 average daily = 7.5 mgd \2. Normality of NaOH used in titration = 0.02N3. Volume of NaOH used to titrate sample Tr. 6.5 ml4. Equivalent weight of 1.0 N NaOH (one liter) = 40,000 mgIl5. Concentration of commercial caustic Soda solution used =
25%6. Volume of sample titrateH = 1 liter
B. Determine the mg/1 of pure NaOH needed to raise the sample pl-Ito about 7.2.
NaOH needed, =mgll(pure NaOH)
(ml of NaOH used, liter sample volume) (Normality of NaOH) (Equivalent wt)1000 mill
= (6.5 ml) (0.02 N) (40,000 mg/1)1000 mill
= 5.2
C. Determine the lbsiday of pure NaOH needed to adjust the pH ofthe actetated sludge.
NaOH needed, lbs/day = (NaOH needed, mg/1)(0, mgd) (8.34 lbs/gal)(pure NaOH)
11.87
= (5.2 mg/I) (7.5 mgd) (8.34 Ibslgal)
= 325.26
x48F
.

Determining theamount of limerequired.
Now tocatculatellmeneeded.
ACTIVATED SLUDGE PROCESSSECTION II PROCESS CONTROL
D. Determine the ibs/day of commercial caustic soda solutionneeded. Caustic soda Is frequently used as a 25 percent byweight solution.
25% NaOH solution, Ibslday = (lbs of pure chemical needed/day) (100 %0
Solution concentration %
(325.2 lbs/day)(100%)
25%
= 1301
When determining the amount of lime needed for pH adjustment, obtainand weigh a small amount (about 1 or 2 grams) of the actual lime to beused in the treatment process. While a measured sample Is stirring, addsmall increments of the weighed lime (or suspension) until the pH is about7.2. Then, weigh (or measure) that portion of the lime (or suspension) notused to determine the amount of lime used in the titration. The poundsof lime required is determined as follows:
Example Calculation
A. Data Required1. Plant 0, average daily = 7.5 mgd2. Weight of lime before titration = 1.0100 grams3. Weight of lime after titration = 1.0056 grams4. Weight of lime used in titration = 0.0044 grams5. Volume of sample titrated = 1000 ml
B. Determine the mg/1 of lime needed to raise the sample pH toabout 7.2.
Lime needed, mg/ I = (Sample vol. ml) (lime used, g) (1000 mglg)
1000 mill
(1000 ml) (0.0044g) (1000 mglg)
1000 m1/1
= 4.4
C. Determine the Ibslday of lime needed to adjust the pH.
Lime needed, Ibslday = (Lime needed, mg/1)(0, mgd)18.34 lbsigal)
= (4.4 mg/1)(7.5 mgd) (8.34 lbs/gal)
= 275
11P8
149
is the chemicaladditionofisclist,
Addidon ofoxidizing'DOOM
?ruts imsymptoms--Apt thicaus.
Ortsmitting Ins1110UA1 Of Cl2(naked
How tocalculus C,2isd sots
ACTIVATED SLUDGE PROCESSSECTION II PROCESS CONTROL
The a. lition of lime or caustic to raise the pH Is an expensive operation.The settleability of the sludge should be closely monitored to observechanges to ensure that benefit is being rained from the addition of causticor lime. If no improvement in settleability occurs whirr a 2 to 4 weekperiod, then the addition of caustic or lime should be halted.
The cMorination of tf.a RAS is a dependable and effective control offilamentous microorganisms. The filamentous microorganisms are morereadily affected by the addition of oxidizing agents such as chlorinebecause they have a greater surface area to voluine ratio. The addition ofother oxidizing agents such as hydrogen peroxide In dosages of 100 to200 mall has also been reported to effectively control the presence offilamentous microorganisms.
The use of Oxidizing agents does not treat the cause of the problem butonly treats the symptoms. The most cost-effective solutions to the prob-lems relating to filamentous microorganisms will Involve treating thereuse of the problem, such as adding nutrients or increasing aeration,and riot the symptoms.
A dose of 2.3 lbs of C12 per 1000 lbs a MLVSS per day has been reportedto effective!' control filamentous microorganisms. The chlorine dosageis expressed in the form of a raft which is a logical and useful approachto chemical dosing in activated sludge systems. The proper chlorine feedrate is *Renamed as follows:
Example Calculation
A. Data Required1 Aeration MLVSS = 2000 mg/I..2 Aeration volume = 1.26 mil gal3 Desired C12 dosage lbs110001bs MLVSSida = 2.5 lbe
6 Calculate the volatile solids inventory under aeration.
MLVSS. lbs = (MLVSS, mg/1)(Aer. vol., mg) (b...ot lbs/gal)
= (2000 mg/1)(126 mg) (8.34 ibsigal)
= 21,0;7 lbsot MLVSS
C Calculate the chlorine feed rate.
C12. ibsiday _ (C12 dosage) (MLVSS, tbs)1000
(2.5 ihs C12(21,017 lbs of MLVSS)1000 lbs MLVSS
:-_ 82 5 lbs C121day
/1.89
13u

Outside helpmay be needed.
Is the NMnormal?
D.0concentration Isimportant.
Result oidentrification.
Causes ofclumping andrising.
ACTIVATED SLUDGE PROCESSSECTION LI PROCESS CONTROL
If filamentous bulking is occurring quite often, it is recommended thatthe operator have an experienced microbiologist identify the type offilamentous organism causing the problem. After identifying the type oforganism, the microbiologist can provide data on the type and/or sourceof the waste contribution to the growth of this organism. For instancy, ifthe filamentous organisms were identified as Toxothrix, a conditionpromoting the production of sulfides (1125) such as septicity in the collecilon system or treatment plant is the probable cause. With this type ofinsight into the problem, the operator can implement the appropriatemeasures to reduce the number of future problems. in addition, theoperator will be better informed on how to handle the problem the nexttime it occurs.
No Filamentous Microorganisms Present
Check the PM to determine if the system is operating at a higher FiMvalue than is normally used. The presence of small dispersed flocs ischaracteristic of an increased F/M. If the F/M is higher than normal by10 percent or more the wasting rate should be decreased. The decrease inthe F/M should be reflected by the disappearance of the dispersed flocsover a period of a week.
The amount of turbulence and D.O. in the aeration tank is also important.D.O. concentrations above 3.0 mg/i indicate that excess air is being used,and the aeration rate should be reduced to lower the D.O. concentrationsto the range of 1 to 3 mg/1. Excessive turbulence (overaeration) in theaeration tank will hinder MLSS floc formation and may result in the carry.over of pinpint floc with the clarifier effluent.
Clumping1Rising Sludge (See Case 3 on Figure 11-20)
When the sludge initially settles during the 30mlnute settling test and thenfloats to the surface after one to two hours, the problem Is generally thatdenitrification is occurring in the clarifier, as illustrated in Figure 11.19. Nitrateions are reduced to nitrogen gas and bubbles are formed in the MLSS floc asa result of this process. The bubbles attach to the biological flocs and floatthe flocs to the 'surface of the clarifier where they eventually flow over the weir.
Some probable causes of sludge clumping:1. The activated sludge process is being operated at a low F/M ratio and
consequently the process has "slipped" slightly or completely intothe nitrification zone.
2 The sludge is being held too long in the clarifier and consequently allthe available dissolved oxygen has been used by the microorganisms.The return sludge should have a D.O. content of not less than 0.2 mall.
11.901 51

Se MINUTE SETTLING ONE TO TWO NOVAS SETTLING
.s.
I
OBSERVATION Je:TION RETaDY
STIRRISING
SLUDGE GIVES cm BUBBLES DEN ITRIFicATICD4 INCREASE RAS PATE- AND LET --SLUDGE AND SETTLES IN CLARIFIERS -INCREASE WAS RATESETTLE AGAIN
ad MINUTE SETTLING ODS/O3VATTC44
POORSETTLING PERFORMCLOUDY --MICROSCOPIC NO PROTOZOASuPERNA- EXAMINATIONTAN:
ACTION REMEDY
TNAG I. vE PRO10.0.* ifl GNANGF. OF REGENT TOXIC LOAD Gut SAGA WAStiNG.T4ADT TAD< AIR.NEEP CLOSE WATC
CASE 4
F/M TOO HIGH .- REDUCE WASTING AND INCREASE RETURNORGANIC OVERLOAD
'-LOW TO NORMAL F/M
\..DISPERSED FLOC TOO MUCHHEALTHY PROTOZOA MIXING
LOW 0. 0,, -- INCREASE OXYGEN
\AOCOUATE D.O.TOXIC WASTE
- REDUCE AERATION
CASE 3 AND CASE 4
FIGURE 11-20
152
IF PoSSISLE GET SEED sixti:eSTOP WASTING UNTIL. S01-105 BUILD UP

Correctivemeasures fursludgeclumping.
ACTIVATED SLUDGE PROCESSSECTION 11- PROCESS CONTROL
3. Higher than normal wastewater temperature resulting in a higher/ateal microorganism activity which causes the process to nitrify at ahigher FIM ratio. A higher rate of microorganism activity will alsoresult in a faster dep:Alon of the dissolved oxygen in the clarifiersludge and consequently a greater potential for, septicity and deni-trification.
-%::.,' :, ...
a
Figure 1119Clumping In Clarifier
t
The following applicable measures should be implemented to correct thesludge, clumping problem:
increase tine return activated. sludge flow rate to reduce the detentiontime of the sludge in the clarifier, A periodic measurement of theclarifier sludge blanket depth will help to determine the proper returnrate.
Where possible, increasing the speed of the sludge collector maylessen the problem.When the suction type of sludgP collector is employed, check that allsuction tubes are flowing freely with a fairly consistent suspendedsolids concentration. Some of the suction tubes may be improperlyadjusted or plugged resulting in coning in some areas and a sludgeblank.A buildup in other areas.If nitrification Is not required, gradually increase the sludge wastingrate to stop nitrification. Initially, the solids Inventory should be decreased by 10 percent over one week, and then the process operationmust be observed over the following two weeks to see if treatment hasimproed
,
11,92
153

Won***SC-minutesettling taw
Protium appearInactive.
Roma% arsactin.
No protozoaprosanL
What to Check.
ACTIVATED SLUDGE PROCESSSECTION II PROCESS CONTROL.
Cloudy Secondary Effluent (See Case 4 on Fig re 11.20)
During the periods of high effluent suspended solids concentration, thesettleability (or settling) test should be run immediately and followed up withadditional tests several times a day until the problem is identified and cor-rected. When the mixed liquor iifthe settleability test settles poorly leavinga cloudy supernatant, the next step is to perform a microscopic examinationof the mixed liquor. One of the important purposes of this examination is todetermine if protozoa are present and the status of their health. The use of amicroscope for process control and troubleshooting is further aescribed inSection 11/1"LABORATORY CONTROL?'
Protozoa Are Present
If protozoa are present, their actions and appearance should be observed.When the protozoa appear to be inactive it frequently indicates that a slugof toxic material has recently entered the treatment system. The operatorshould reduce the sludge wasting rate and maintain normal operationuntil the material passes through the treatment system. Refer to Table11.12.
If the protozoa appear normal and active, but the cloudy cafidition per-sists, the activated sludge floc may be dispersed due to eXCeeSiVeence (overaerution, in the aeration tank. Generally, overaeration is ,characterized by D.O. concentrations above 3 mg/1 in tpe aeration tank.Proper control of the aeration system is further described in Section 2.04,"AERATION AND D.O. CONTROL"
Protozoa Are Not Present
If no protozoa are present, there are two possibilities. First, the F/M is toohigh and the system is coerating in an overloaded manner. Approach andsolve the problem as follow;:
Calculate the F /M. Refer to Section 2.64, Constant NM ControlCompare calculated F/M with FIM's for the periods of satisfactoryoperation.If the NM is greater than these values, the wasting rate should bereduced to raise the solids inventory.Increase the RAS flow to lower the sludge blanket level in theclarifier to the rrinimum. The increased RAS flow will increase thesolids inventory by transferring the MLSS stored in the clarifierinto the aeration tank.
Second, the FIM may be tower than or within the normal range. Thiscondition is frequently associated with one of the following:
Low D.O. concentration in the aeration tank. If the average D.O.measured at several locations in the aeration tank is less than 0.5mg/I, aeration should be increased until the D.O. is between 1 and3 mgli.
ir.93.1 54

AshIlke sondeRating onclarinetsurface.
ACTIVATED SLUDGE PROCESSSECTION PROCESS CONTROL
A toxic waste entered the treatment system. Toxic waste adverselyaffects the health of the activated sludge. A short term solution tothis problem involves the addition of large quantities of healthyseed sludge to build-up the volatile solids inventory. The long termsolution requires an Industrial waste survey to identify the sourceof the toxic material and the enforcement of strict industrial wastedischarge ordinances. Table 11.12 shows the levels of heavy metalsthat can usually be tolerated by activated sludge microorganismson both a long -term and short-term basis.
TABLE 1 1.12
ALLOWABLE CONCENTRATIONS OF HEAVY METALS
CONSTITUENT
CONCENTRATION AT WHICH DAMAGE TOACTIVATED SLUDGE MIGHT OCCUR
CONTINUOUS LOADING SLUG LOADING
CADMIUM 1 mg/1 10 mg/1
CHROMIUM 2 mg /1 2 mg/1
COPPER 1 mg/1 1.5 mg /1
IRON 35 mg/I 100 mg /1
LEAD 1 mg/1
MANGANESE 1 mg/1
MERCURY 0.002 mg /1 0.5 mg /1
NICKEL 1 mg/1 5 mg/1
SILVER 0.03 mg /1 0.25 mg/1
ZINC 1 to 5 mg/1 25 mg/1
COBALT >1 mg/1
CYAN OE 1 mg/1 1 to 10 mg/I
ARSENIC 0.7 mg/1

Causes ofsating.
ACTIVATED SLUDGE PROCESSSECTION II PROCESS CONTROL
Milling (See Case 5 on Figure 11.22)
The appearance of small astAtke sludge particles floating on the surface ofthe secondary carifler (Figure11.21) is commonly referred to as "ashing."'
4
Figure 11.21Ashing In Clarifier
Some probable causes of the ashing problem are as follows:1. The beginning of denitrification is occurring in the clarifier.2. The mined liquor has an unusually high grease content.
Corrective The ashing problem should be approached and solved as follovys:measures forsalting. First, stir the qludge which floats in the 30minute settling test.
If it Settles This indicates that denitrif 'cation has begunSee "SludgeClumping" for solution.If it doeS not settle, there may be excessive amounts of grease in thesludge. Perf9rm a grease analysis. If jhe grease content exceeds 15percent by weight of the MLSS, the problem may be one of the following:
)The primary tank scum baffles are Malfunctioning due to hydraulic!Overloading or mechanical failure. Specific attention should be givento scum baffles and the scum collection system in the plant.Too much grease is being dumped in the sewer by an industrial orpommercial discharger. If too much grease is in the raw wastewater,an industrial waste survey must be conducted to Identify the discharger,and have the problem corrected.
1115 15t$

DOES NOT RELEASE BUBBLESNOR SETTLE
..,,EXTEND AERATION ZONE- INCREASE WASTING
DENSE. COMPAQ FLOC
TO MUCH SHEAR - REDUCE AERATION IF POSSIBLE

Otd sludge,poor floe,
Causes ofpinpoint floc,
Correctly*measures forpinpoinf floc.
ACTIVATED SLUDGE PROCESSSECTION II PROCESS CONTROL
Pinpoint Floc (See Case 6 on Figure 11.22)
The appearance of small dense, pinpoint floc particles suspended in theaesondary clarifier is a common problem often seen in treatment plantsopelating near or In the extended aeration range. This problem is generallyrelated 10 an old sludge that settles rapidly but lacks good flocculationcharacterlttics.
SOTO Orb-be-W-6 oauses of the pinpoint libc problem are as Follows.The process is being operated at a FIM near or in the extended aeration range resulting In an old sludge with poor floc formation char*.acteristics.
2. Excessive turbulence (overaeration) in the aeration tank shearing the .floc formations.
The following applicable measures should be implemented to correct iliaproblem:
If the sludge settling characteristics observed during the 30minutesettling test indicate a "too rapidly settling" sludge with poor floc
. formation, the clarifier effluent quality can be improved by graduallyincreasing the wasting rate. if nitrification is required, caution must beexercised not to decrease nitrification by wasting too much sludge.
6 if good settling with a clear supernatant above the settled sludge isobserved in the settling test, check for proper aeration and mixing inthe aeration tank. if the average D.O. concentration in the aerationtank is more than 3 mg/I, the SCFM air rate should be reduced until theaeration D.O. is between 1 and 3 mg/i.
Siaggiera/Billowing Solids (See Case 6 on Fig ure11-22) .
The appearance of small, light, fluffy sludge particles rising (sometimesbillowing) to the clarifier surface and discharging over the effluent weirs is a
MLSS too low problem often seen when the MLSS concentration is too low. This problem ityoung sludge. generally related to a young sludge (high FAA) which :millet poorly. The
problem of light fiqc particais is generally worse in shallow clarifiers, partic-ularly at high RAS flow rates. At some plants, the flocs are particularly notice-able during the early morning hours.
Causes of:nigglers.
Some probable causes of this problem are as follows:1. The aeration tank is being operated at a MLSS concentration that is
too low. This would normally occur during process start-up until theproper MLSS concentration Is established. A sludge wasting rate thatis too high will result in low MLSS and a high F/M.
2. Sludge is being wasted on a batch basis during the early morninghours resulting, in a shortage of microorganisms to handle the day-time organic loading.
3. The return sludge flow rate is high.

Correctivemeasures forstragglers.
ACTIVATED SLUDGE PROCESSSECTION II PROCESS CONTROL
The following applicable measures should be implemented to correct the .
problem:Decrease the sludge wasting rate to raise the MISS concentration andincrease the sludge age.If possible, avoid high sludge return rates.If wasting sludge nn a batch (or intermittent) basis, avoid wastingduring. the early morning hours. All the organisms are needed at thistime to handle the daily increase in organic loading.
REFERENCES
Boe, Owen, K., "Activated Sludge Control With a Settleometer and Centrifuge," U.S.Environmental Protection Agency, Region VIII.
Eckertfelder,W.W., Biological Waste Treatment Pergamon Press, New York, 1961.
Environmental Protection Agency, Protess Design Manual for Upgrading ExistingWastewater Treatment Plants, 1974,
Hammer, Mark, J., Water and Waste-Water Technology, John Wiley & Sons, Inc.,New York, 1975.
Hawkes,1-1.A., The Ecology of Waste Water Treatment, Pergamon Press, 0' ford, 1963.,
Kern, Kenneth D., et al., "A Field Study Training Program", Operation of WastewaterTreatment Plants, (Chapter 7), Sacramento State College Department of CivilEngineering.
McKinney, Ross E. Microbio,ogy for Sanitary Engineers, McGrawHill Book CompanyInc., New York, 1962. ,
Metcalf & Eddy, inc., Wastewe9r Engineering, McGrawHill, New York, 1972.
Stevens, Thompson, Runyan, Inc., Operator's Pocket Guide to Activated Sludge,Part$ 1 and 11. Published by the Authors, 5505 S.E. Milwaukie Avenue, Portland,Oregon 97202, 1975.
Stewart, M.J., Activates Sludge Process Variations The Complete Spectrum, PartsI, II, ill. Water and Sewage Works, April, May, June, 1964.
Water Pollution Control Federation. "Sewage Treatment Plant Design," Manual ofPractice Na 8, Washington, D.C., 1967.
Water Pollution Control Federation, "Operation of Wastewater Treatment Plants,Manual ofloractice, No. 11, 1976.
West, Alfred W., Operational Control Procedures for the Activated Sludge Process,parts 1.11, IIIA, and IIIB, U.S. EPA, National Training and Operational TechnologyCenter, Cincinnati, Ohio. 1975.
11.98153
ti
J
4

3.01 INTRODUCTION
Where distil'activatedsludge comefrom?
The process*Mesonadvirortment tocontrolmIcroorgantsms.
WASTEWATER
Processprovidestreatment toreducepollution ofreceivingwaters.
Se familiarwith the !emitused inoperetIng theprocess.
ACTIVATED SLUDGE PROCESSSECTION III FUNDAMENTALS
The term "activated sludge" is derived from wastewater being mixed with airor oxygen for a length of time to develop a brown floc which consists ofbillions of microorganisms and other material. These microorganisms usemost of the suspended and dissolved material found in ill wastewater astheir foosi (SOD) source. The microorganisms are aerobic and thereforp re-quire an air or oxygen supply to function. Their need for food and air or Cifygenis similar to the needs of humans and other animals.
The activated sludge process provides the environment to keep these micro-organisms under controlled conditions so that they cap remove most of thesolids from the wastewater as it passes through the profess. The environmentIs provided by four basic systems which make up the activated sludge process.These systems include aeration, sedimentation, return activated sludge(RAS) and waste activated sludge (WAS) as illustrated In Figure 111.1,
AERATION TANK
SECONDARYCLARIFIER
(SEDIMENTATION)
ummommil\w/i.
EFFLUENT
.
LAIR OR OXYGEN ADDED
RETURN ACTNATED SLUDGE 4
WASTEACTIVATEDSLUDGE
TYPICAL ACTIVATED SLUDGE PROCESS
FIGURE III-1
The purpose of the activated sludge process is to remove as much of theorganic matter In the wastewater as possible by biological means. In doingthis, the process, produces an effluent quality high enough that beneficialuses of receiving waters will not be hindered, thus, a high level of treatmentmust be achieved.
Definitions
in order for the operator to understand the concepts involved in operatingthe activated sludge process, he must first understand the terms associatedwith it.

.
I
I
1
,
ACTIVATED SLUDGE PROCESSSECTION III . FUNDAMENTALS
t
. .
ACTIVATED SLUDGE is the floc of microorganisms that form whenwastewater is aerated. s.
MIXED LIQUOR is the mixture of activated sludge and wastewaterin the aeration tank.MIXED LIQUOR VOLATILE SUSPENDED MATT R (MLVSS) havebeen found to be proportional to the microorganisms concentration inthe aeration tank.KINETICS is the approach used to mathematically sifnulate biologicaltreatment Processes by relating the growth rate of the microorganismsto the food and microorganism concentration. .
NET GROWTH RATE is the microorganism rate of growth minus themicroorganism decay rate. Also referred to as the net sludge yield.MEAN CELL RESIDENCE TIME (MCRT) is the inverse of the netgrowth rate and is equal to the average time a microorganism spendsin the treatment process. The MCRT is an important kinetic parameterthat is very useful in prgicess control.FOOD TO MICROORGANISM RATIO (FM) is the ratio of the amountof food expressed as pounds of COD ( or BOD) applied per day, to theamount of microorganisms, expressed as the solids inventory inpounds of volatile suspended matter. The FM is mathematically re-lated to the MCRT, and is also an Important process control tool.
GOULD SLUDGE AGE (GSA) is the ratio of the pounds per day ofInfluent wastewater suspended matter to the solids inventory in theaeration tank. Thus, GSA or Sludge Age should r. Se jonfused withthe term MCRT.
, RETURNrTIVATED SLUDGE (RAS) is the settled nixed liquor thatis collect d in the clarifier underflow and returned to the aeration basin.WASTE ACTIVATED SLUDGE (WAS) is the excess growth of micro-organisms which must be removed to keep the biological system Inbalance. Various control techniques have been developed to estimatethe amount of WAS that must be removed from the process.COMPLETE MIX ACTIVATED SLUDGE describes tin ideal mixingsituation where the contents of the aeration tank are at a uniform con.centration. In other words, everything in the tank is dispersed by aback mixing action.PLUG FLOW ACTIVATED SLUDGE describes an Idea/ situationwhere the contents of the aeration tank flows along the length of thetank.BACK MIXING refers to mixing the contents of a tank in the longi-tudinal or flow oriented direction.TRANSVERSE MIXING, also known as cross roll, refers to mixing in adirection across the direction of flow.SLUDGE REAERATION refers to the practice of aeratit,the RASbefOre it is added to the mixed liquor.PROCESS LOADING refers to the organic loading range as measuredbrthe FIM.CONVENTIONAL LOADING refers to a process loadin" of 0.2 to 0.5lbs BOD appliedllb MLVSS/day.HIGH RATE LOADING refers to a process loading of two to threetimes the conventional loading rate.
//--III-2
161
z

InfluentWastewatercombined withMS to formMixed Liquor.
Waste ActivatedSludge.
ProcessBalancebased on foodlimited growth
Weil settlingmixed liquor Is**key toactivatedNudgetrestmenL
6ACTIVATED SLUDGE PROCESS
SECTION ill FUNDANIORALS
EXTENDED AERATION LOADING refers to low ate loading that isone half to one' enth of the conventional loading rSETTLEABILITY is the measure of the volume occu the mixedliquor after settling in a graduated cylinder for 30 min s. Settleabilityis generally expressed as a percentage based on the rat f the sludgevolume to the supernatant volume. el
SOLIDS INVENTORY is the amount of volatile suspended solids in thetreatment system. The Solids Inventory is also known as the VolatileSolids Inventory.
3.07 PROCESS DESCRIPTION
The activated sludge 'process involves growing microorganisms on theorganic material in wastewaters. Return Activated Sludge (RAS) from theclarifier underflow is combined with the influent wastewater in the aerationtank to form the mixed liquor. The mixed liquor is usually aerated for a periodof several hours in the aeration tank. During this time some of the organicmaterial in the wastewater is converted into new microorganisms and somein converted (oxidited) to various other products including carbon dioxide.The mixed liquor flows through the aeration tank and into the clarifier where itsettles to form the RAS. The clear liquid remaining above the settled mixedliquor is called the secondary effluent which is discharged from the process.
A portion of the activated sludge is purposely removed by wasting it from theprocess. The wasting of sludge is necessary to maintain the desired csaantityof microorganisms in the process. Wasting is necessary because the microsorganisms grow and multiply as they eat the food supply in the wastewater.The basic idea behind successful operation of an activated sludge system isto keep a balance of microorganisms to the amount of food in the wastewater.Proper operation will provide the microorganisms with a balanced diet offood, nutrients, and oxygen. If nutrients or oxygen limit the growth of themicroorganisms, they will not settle satisfactorily in the clarifier. Properoperation makes food the only part of microorganisms diet that limits theirgrowth. As long as ood is the only Omit to their growth,lhe process can becontrolled and maintained so that they settle in the clarifier.
if the organic material conversion pro-ess is limited by oxygen or nutrients,the microorganisms in the mixed Otis.? will not settle well in the secondaryclarifier. The activated sludge process depends on settling the mixed liquorso that it can be returned to the aeration tank to keep in balance with theorganic material In the incoming wastewater. This balance is generally relatedto process loading as Expressed by the F/M ratio. Inability to settle themixed liquor can result in a high concentration of suspended solids in theclarifier effluent. Proper control of the activated sludge process will producea mi. id liquor with good settleability. If the conditions in the aeration systemdeteriorate, the formation of undesirable microorganisms can result. Typicalundesirable microorganisms Include the filamentous organisms. Filamentousmicroorganisms grow as long, threadlike organisms having an increasedsurface area. This increased surface area makes it possible for the filamentousorganisms to grow in conditions of low dissolved oxygen or low nutrient
162

r.Filaments makepoor settlingMudge.
Carob/liking bymakingenvironmentless suitable fortheir growth.
Aerationprovides DOand mixing.
Most common.
Fine and coarsebubbles.
Tend to clog.
ACTIVATED SLUDGE PROCESSSECTION ill FUNDAMENTALS
concentrations. Unfortunately, filamentous organisms hinder settling bycausing excessive bridging and matting of the flocs, resulting in a mixedliquor which does not settle well. Poor settleability associated with the presence of too many filamentous organisms is known as bulking sludge.
The consequences of bulking sitodo are that poorly settling mixed liquorcannot be returned to the aeration tank and that the clarifier effluent suspended solids will be high. Operation in a bulking sludge condition willeventually result in the loss of the mixed liquor over the weirs into the effluent.Typical approaches to curing bulking include treating the return activatedsludge with oxidizing agents, such as chlorine or hydrogen perioxide, andimproving treatment conditions so that the environment is less favorable tothe growth of filamentous organisms.
Aeration System
Aeration serves the dual purpose of providing dissolved oxygen and mixingof the mixed liquor and wastewater in the aeration tank. Aeration is usuallyprovided by either diffused air or mechanical aeration systems. Diffused airsystems consists of a blower and a- pipe distribution system that is used tobubble air into the mixed liquor. Mechanical aeration systems consist of apumping mechanism that disperses water droplets through the atmosphere.
Diffused Air System
Diffused air systems are the most common types of aeration systemsused in activated sludge plants. The distribution system consists ofnumerous diffusers generally located near the bottom of the aerationtank. The diffusers are located in this position to maximize the contacttime of the air bubbles with the mixed liquor.
Diffusers are designed to either produce fine or coarse bubbles. Finebubble diffusers were used frequently in the treatment plants designed inthe period from 1950 to 1970, because it was felt that the increased oxygentransfer efficiency" of the fine bubble diffusers was important. linfbrtu-nately, the fine bubble diffusers are easily clogged by biological growthsand by dirty air, resulting in high maintenance costs.
Fine Bubble Diffusers
The most common type of fine bubble diffusers are nylon or dacronsocks and saran wrapped tubes. These dirfusers have oxygen transferefficiencies 6f around eight percent. Sketches of these types of finebubble diffusers are shown below in Figure III-2.
The major limitation of fine bubble diffusers is that they are easilyclogged. Diffusers are selfsealing if dirty air Is pumped into them.The diffusers are also subject to clogging because of biologicalgrowths. The air supply for all fine bubble diffusers should be filtered.Refer to Section I, "TROUBLESHOOTING", for observations-whichindicate diffuser clogging. .1
111.4
163
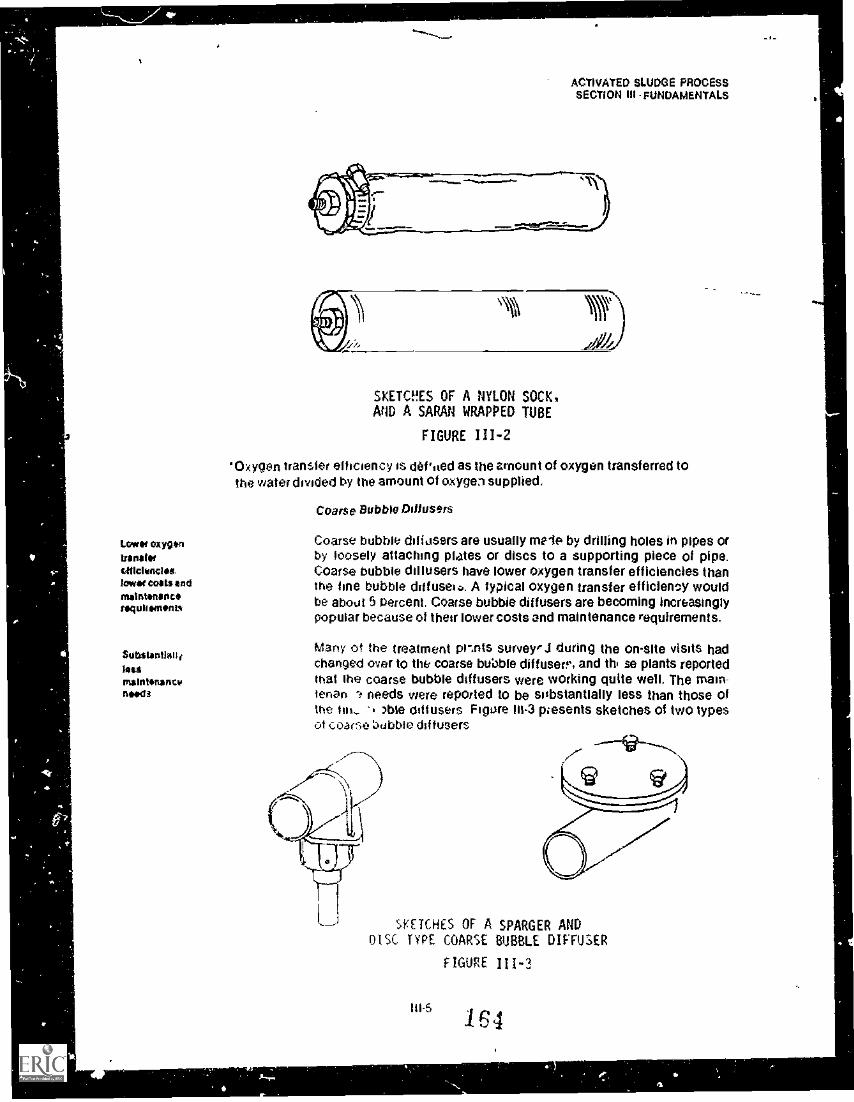
Loot oxygentransferUnclenched.Iowa' colds endtneintensecsNi 111 M111*
Subslantleitilestinsintenantvneeds
ACTIVATED SLUDGE PROCESSSECTION III -FUNDAMENTALs
SKETCHES OF A NYLON SOCK,AND A SARAN WRAPPED TUBE
FIGURE 111-2
'Oxygen transfer efficiency is dehied as the amount of oxygen transferred tothe water divided by the amount of oxygen supplied.
Coarse Bubble Diffusers
Coarse bubble diffusers are usually mete by drilling holes in pipes orby loosely attaching plates or discs to a supporting piece of pipe.Coarse bubble diffusers have lower oxygen transfer efficiencies thanthe fine bubble drffuseao. A typical oxygen transfer efficiency wouldbe about 5 percent. Coarse bubble diffusers are becoming Increasinglypopular because of their lower Costs and maintenance requirements.
Many of the treatment pr.nts survey'J during the on-site visits hadchanged over to the coarse bubble diffusers, and thi se plants reportedthat the coarse bubble diffusers were working quite well. The main-tenan needs were reported to be substantially less than those ofthe hit_ able diffusers Figure 111.3 presents sketches of two typesof coacie bubble diffusers
SKETCHES OF A SPARGER ANDOISC TYPE COARSE BOBBLE DIFFUSER
FIGURE 111-3
111-5
1 6 4

Surface endTurbine.
Floating orplatformmantel.
Omen transfer2 lb
lhp/hr.
ACTIVATED SLUDGE PROCESSSECTION Ill . FUNDAMENTALS
Mechanical Aeration Systeme
There are two types of aerators in common use today. These 13clude thesurface and turbine aerators. Surface aerators use a rotating propellerthat pumps the mixed liquor through the atmosphere above the aerationtank. Oxygen transfer is achieved by the aerator propeller spraying themixed liquor through the atmosphere. Turbine aerators increase oxygentransfer efficiency by creating turbulence In the area of the tising bubbled.
Surface Aerators
Surface aerators either float or are mounted on supports in the aerationtank. Materials, Such as epoxy coated steel are used in the construe-tion of surface aerators to reduce corrosion.
The oxygen transfer efficiency of a surface aerator increases as thesubmergence of the propeller is Increased. However,-power costs alsoincrease because more water is sprayed.
Oxygen transfer efficiencies for surface aerators are stated in termsof pounds of oxygen transferred per horsepower per hour (lb 02/hpthr).Typical oxygen transfer efficient ets are about 2 lb 02/hphr. Surfaceaerators are sometimes equipped with draft tubes to improve theirmixing characteristics.
Another type of surface aerator used in oxidation ditches is the brushaerator, which is a horizontally motmted brush located June .its1;,tv thewater surface. The brush is rotated rapidly in the wato: to supply ;nix-ing and aeration.
Figure 111.4 shows a floating and a platform surface .rator.
WATER SURFACE
TYPICAL FLOATING AND PLATFORM SURFACE AERATORS
FIGURE 111-4
1111 65
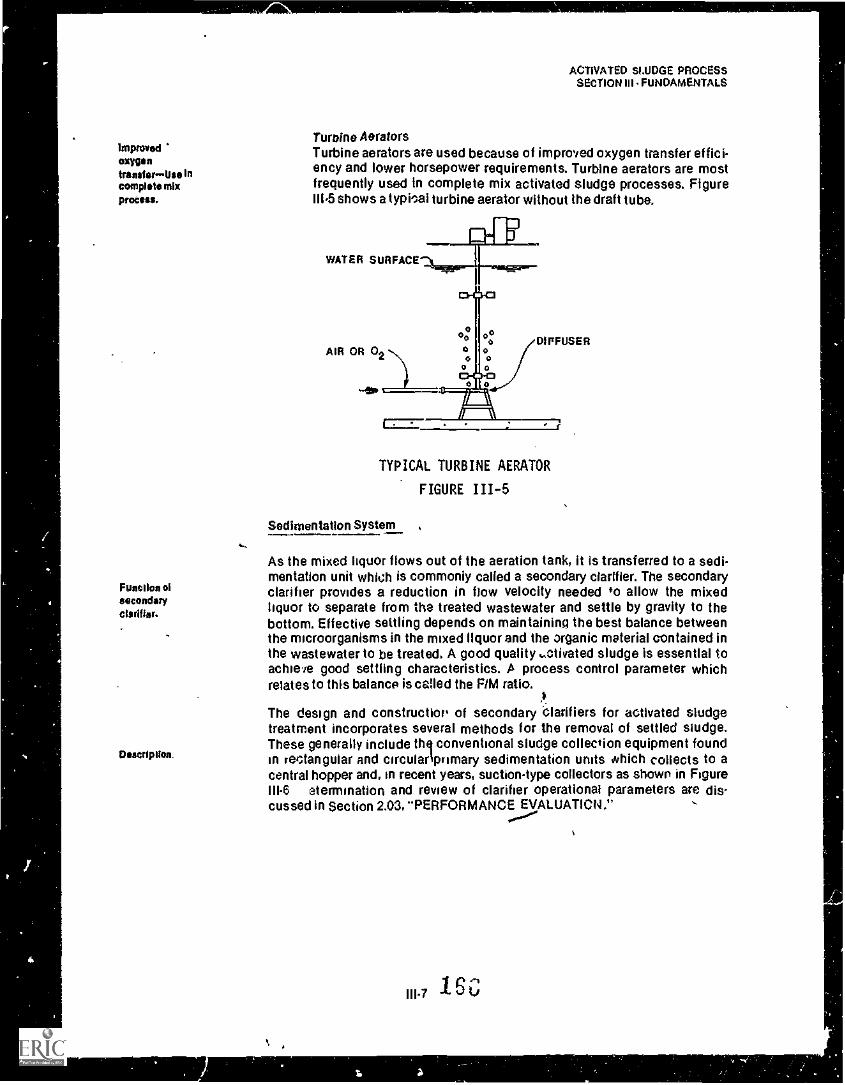
improvedoxygentransferIlse incomplete mixprocess.
Function ofsecondaryclarifier.
Description.
ACTIVATED SLUDGE PROCESSSECTION III FUNDAMENTALS
Turbine AeratorsTurbine aerators are used because of improved oxygen transfer effici-ency and tower horsepower requirements. Turbine aerators are mostfrequently used In complete mix activated sludge processes. Figure111-5 shows a typical turbine aerator without the draft tube.
WATER SURFACE
AIR OR 02 -.. 0
o 00
DIFFUSER
"el
TYPICAL TURBINE AERATOR
FIGURE 111-5
Sedimentation System ,
As the mixed liquor flows out of the aeration tank, it Is transferred to a sedi-mentation unit which is commonly called a secondary clarifier. The secondaryclarifier provides a reduction in flow velocity needed to allow the mixedliquor to separate from the treated wastewater and settle by gravity to thebottom. Effective settling depends on maintaining the best balance betweenthe microorganisms in the mixed liquor and the organic material contained inthe wastewater to be treated. A good quality activated sludge is essential toachiele good settling characteristics. A process control parameter whichrelates to this balance is celled the FIM ratio.
The design and construction of secondary Clarifiers for activated sludgetreatment incorporates several methods for the removal of settled sludge.These generally include thq conventional sludge collection equipment foundin rectangular and circular primary sedimentation units which collects to acentral hopper and, in recent years, suction-type collectors as shown in FigureIII-6 etermination and review of clarifier operational parameters are discussed in Section 2.03, "PERFORMANCE EVALUATION,"
Ill-7 1 C.;

as
Moat technicalarticles havebeen written forthe engineerand not theoperator.
One: two halloways ofeveivafionprocessvariations41 Loading
2) Physicalentngement.
ACTIVATED SLUDGE PROCESSSECTION HI. FUNDAMENTALS
SN
7 .3,'- 6" -
Figure 111-6Sludge Collector with Suction Draw Tubes
3.03 ACTIVATED SLUDGE PROCESS VARIATIONS
In the past many technical articles have been written, describing a number ofdifferent variat.onS of the activated sludge process. Generally the processesincluded are conventional, tapered aeration, complete mix, extended aeration,ciep aeration, contact stabilization, and the Kraus process, Unfortunately,these discussions have been rather simplified and they have not kept pacewith our increasing understanding of the principles behind all the activatedsludge processes. The articles nave been written with the design engineerrather than the operator in mind. A related problem is the fact that mostarticles discussing the application of process theory to operation do not de-scribe th operation of these individual process variations, but, rather, describeprinciples that are supposed to apply to the process in general, or to thecomplete mix or conventional process modes. Another problem is that someof the recess variations" are very difficult, such as the conventional andcontact Stabilization processes. and ethers are very minor variations or morebasic processes, such a3 tapered aeration.
If one studies the oroblem. it becomes obvious that there are only two basicways of looking at t iestion of activated sludge process variations: fromthe standpoint of the variot.s ranges of prom; loading, and from the standpoint of the various physical arrangements of the process. The various levelsof process loading are described by the F/M relic and MCAT. The term, "physicalarrangements" is used to refer to the structural arrangemont of the aerationtank as well as the various arrangements of the process streams that are usedto provide flexibility.
At

Three bestsloading ranges.
Ths loadingrungs is oftenfixed by design.
ACTIVATED SLUDGE PROCESSSECTION III FUNDAPIENTALS
Process Loading Ranges
Over the years a number of studies have been conducted describing the influence of process loading on the behavior of the activated sludge process,and most of these have identified three basic ranges of process loading wherethe aeration, solids can be successhilly settled making process operationfeasible. The three basic ranges of process loading are shown in Figure fora plant operating on a typical domestic wastewater at a temperatare of abbut 20degrees centigrade. For the purpose of this discussion, these loading rangeswill be referred to as the high rate, coventional rate, and extended aeration.
Generally the range of process loading in which a plant Is to be operated isnot a matter for the operator to decide. In fact operators who try to operate aplant in a loading range other than that for which it was designed are usuallydisappointed, and this practice is not recommended. Most plant of 1 mgd ormore are designed to operate in the conventional range, althoLgh many aredesigned to operate in the lower portions of that range to ensure that effectivenitrification occurs.
High Rate
The high late loading range takes advantage of the settleability of sludge
Not commonly when the treatment system Is loaded at a fairly high rate. Generally, theused, level of treatment which results is somewh_t comparable to a typical
highrate trickling filter plant. Although the process can be applied effectively in certain situations, large-scale use of this modification of theprocess at their 300 mgd Hyperion plant, choosing to treat only about onebetter than it is at slightly lower loadings, Is apparently not good enoughand this, combined with the higher level of soluble SOD, greatly reducesthe treatment efficiency. The City of Los Angeles has abandoned thisprocess at their 300 mdg Hyperion plant, choosing to treat only about onethird of their flow at conventional loading levels. Apparently the quality ofthe combined effluents consisting of 100 mgd treated by conventionalactivated sludge and 200 mgd treated with primary sedimentation only isas good or better than the quality when the entire flow was treated by thehigh rate process.
Typicaloperation formedium endlarge sizedplants.
Nitrificationat lower end ofloading range.
Conventional Rate
For a typical domestic wastewater at about 20 degrees centigrade the coneventional process operates between MCAT values of 5 to 15 days and F!Mratios of 0.2 to 0.5 lbs BOO applied/lb MLVSSiday. Most large municipaltreatment plants operate in the conventional activated sludge zone. Plantsoperating in the middle of this range produce an excellent effluent qualityand do not nitrify. At the lower end of this loading range, an even bettereffluent is sometimes produced, although problems sometimes occurwhen the plant slips slightly or gbes completely into nitrification, whichoften results in operational problems such as rising sludge in the clarifiers,the appearance of filaments in the sludge, and the formation of a brown,greasyappearing foam.
16g.

WASTEWATER TEMPERATURE IS APPROXIMATELY 20°C
EXTENDED CONVENTIONALAERATION ACTIVATED SLUDGE
0.20 0.40
F/M RATIO (LB BOO APPLIED/LB SOLIDS INVENTORY/DAY)
SLUDGE SETTLEABILITY VS. ORGANIC LOADING
FIGURE III-7

Poor elude.settNebIlity etupper end ofboding rens,.
/ ACTIVATED SLUDGE PROCESSSECTION III - FUNDAMENTALS
Filamenteous growths and poor sludge settleability have been associatedwith the conventional prows at the upper end of.this loading range. Dis-persed growth and a clou4 effluent are also quite common. Usually theoperator can see this sort of condition coming by plotting a trend of theorganic loading in his treatment process (either the F/M ratio or the actualMCRT). Other signs of a more physical nature may also be used by theoperator to evaluate an "overloaded" condition. For example, once highloading levels are reached, a stiff, white detergenttype foam is,, oftenobserved on the aeration tanks.
Extended Aeration Rate
The lowest range of process loading where successful operation may beaccomplished is the extended aeration range. Generady plants operating
From:minty vow in this range are small in size and do not receive 24 hour supervision. Suchwith smaller plants are very conservative in design and generally opetewith anplants.-Loss MCRT of 20-40 days and NM ratio of 0.05 to 0.15 lbs BOD
ratplied/lb
WAS than MLVSSIday,ilased on typical domestic wastewater at a temperature of 20° C.conventional The extenddb aeration process is sometimes referred to as the "totalplant.
oxidation process". This name is derived from the fast that these plantsare designed with such low loadings that the simple kinetics theory rindto describe processes of higher loading would predict that all of the in-
Occasion:I fluent BOD will be converted to CO2. This is why some man ulacturerswesting Is claim that no wasting is necessary for their extended aeration designs. Ineitseutlet. actual fact, there is no such thing as the "Total Oxidation Process" and
even after extremely long periods of aeration, suspended matter remain inthe effluent. Although sludge wasting need not be conducted on a dailybasis In plants operating in the extended aeration range, occasional wast;ing is an absolute necessity.
Pin floe isfrequentproblem.
Donna MittenIs alsoproblem
Often the effluent of the extended aeration processes contains small pin-point floc which may be observed passing over the weirs of the secondaryclarifier. When the loading in an extended aeration plant is in the h9herportion of the &ding range, a number of operating problems may occur.Because the entire extended aeration range is In the nitrification. zone,derdtrification and rising sludge problems may result. Also the samebrown, greasy foam, filaments, and poor settleability mentioned in dis-cussion of the conventional process at low loading may occur under thesecircumstances. if possible, these problems may be improved by usingadditional aeration capacity or decreasing the level of MLSS.
Other problems associated with the extended aeration process have to dowith the fact that some sludge must be wasted and that many operators
Westing Is have been told that wasting is not necessary, indeed, many small extendedaeration plants have no facilities installed to make wasting possible.Under these circumstances, it is not uncommon for sludge to creep overthe clarifier weirs whenever fluctuations in flow occur. Unfortunately, thisresults in a significant reduction in removal efficiency.
7(i

' 1'
Control sludgewesting.
Need to havewesting1,011111es.
Extendediteration plantssubject toproblem. due toflow variation.
ACTWATED SLUDGE PROCESSSECTION FUNDAMENTALS
If the operator of an extended aartion plant frequently experiences lossesof solids over the effluent weirs, there are two remedies which can beused; regular sludge wasting, and flow equalization. Of the two, sludgewasting is by far the most important. A conscientious operator shouldkeep track of the solids he intentionally wastes, and the solids that goover the effluent weirs. In this manner, the plant can be operated to achievea specific value of MCRT.
If plant design provisions have not been made for sludge wasting, theoperator should attempt to improvise some sort of temporary or perma.nent method. Depending on the specific design of the plant and thegeography and environmental conditions around it, the operator may beable to arrange for constructing sludge beds or lagoons for wastingfacilities. The sludge from plants of this sort is generally already "aero-bically" digested: and therefore, if it is placed directly on a sand bed fordrying, or in a lagoon, it will generally not have a foul odor.
Even when regular wasting is carried out, a high degree of flow variationin extended aeration plants will often cause solids losses. This is probablydue to the particular characteristics of the Hoc produced in the low loadingrange as well as to the flow variations themselves. in some cases, if theaeration tank is large enough, the operator can design a makeshift systemwhich will allow the use of the aeration tank as a flow equalization device.Minor modifications of this sort will go a long way to improve suspendedsolids removal in plants where losses are primarily due to _hydraulicfluctuations.
Physical Arrangements of the Process
As mentioned previously, the term "physical arrangements" is used in thisPhysical tayout discussion to describe the structural arrangement of the aeration tank as wellof process. as to the various arrangements of process streams that are used to provide
process flexibility. Using this sort of description there are only three physicalarrangements which are presently used to any great degree in modern acti-vated sludge plants in the United States. These are complete-mix activatedsludge, plugflow activated sludge, and activated sludge with reaeration.
Contents oflank unitormiymixed.
Measure DO orS lo checkuniformity of
Dye studies toot
tComplete Mix Activated Sludge
In an ideal complete-mix activated sludge plant, the contents of the tankare completely homogeneous. In order to ensure that this is achieved,special arrangements are often .employed to yniformly distribute theinfluent and withdraw the effluent from the aeration tank. Attention to thetank shape and to intensive mixing is important. There are a number ofmeans which the operator may use to evaluate the degrete to which hisparticl.ilar process operates in the complete mix mode. First and foreritostthe entire contents of the tank should be completely uniform. This canbe confirmed by measurements of dissolved oxygen and suspended solids.If the tank is thoroughly mixed, these measurements should be nearly --uniform. Dye studies may also be used and will provide even more accurateinformation; however, conducting these studies is usually beyond thecapability of a typical treatment plant.
111.12 17I

Typicallaboratorymodel
Restunderstood.
Very stablebones se shockloads Indiluted.
No uniqueoperatingproblems. A
ACTIVATED SLUDGE PROCESSSECTION ill - FUNDAMENTALS
The complete mix process is important because it operates well, but also,because most laboratory and pilot scale\studies use this proc* arrange-ment.
..1sl
For this reason, the completemix process is probably the best understoodof the three basic; process arrangements that will be discussed here. Infact most of the information developed by the research community canbe applied to the completemix process with much less reservation thanit can to other processes. .
As a general rule, the completemix process is a very stable processwhich is resistant to upsets from shock loads of all kinds. This is a directresult of the fact the shock is almost uniformly spread throughout theentire aeration chamber. Some of the stability of this process may also bedue to the fact that the same environment prevails throughout the entiretank. As a result, a relatively uniform population of microorganisms aredeveloped in an environment which is nearly the same throughout.
Evidence to date does not show any special operating problems whichare unique to the completemix process, however, there are a fewcomments that can be made about the proceis in general. Some peopleexpress concern about the fact that some of the wastewater may beimmediately transported from the influent to the effluent end of theaeration tank without receiving much treatment. A strict application ofthe principles of chemical engineering to such a physical arrangementwould indeed suggest that it may be less efficient than others. However,the data available at present on the relative performance of the complete-mix process show that it is just as efficient as other process arrange-ments. It would appear that the application of a rather simplified chemicalengineering view of the completemix theory overlooks other facts whichare of overriding importance.
.\-,The other major area of comment with regard to the completemix processhas to do with sludge settleability. There is considerable evidence accum-ulating to the effect that the completemix process may operate with ahigher typical level of SVI or lower settleability lan do competitiveprocess arrangements. insufficient evidence is aval tble at the presenttime to prove or discount this contention, however, it S oqld be recognizedthat the settleability of completemix sludges is generally well within therange of normal operation and the competitive process arrangementswhich develop floc having lower SVI's during operating conditions alsohave more inconsistent operation.'
1:"2111.13
//
//
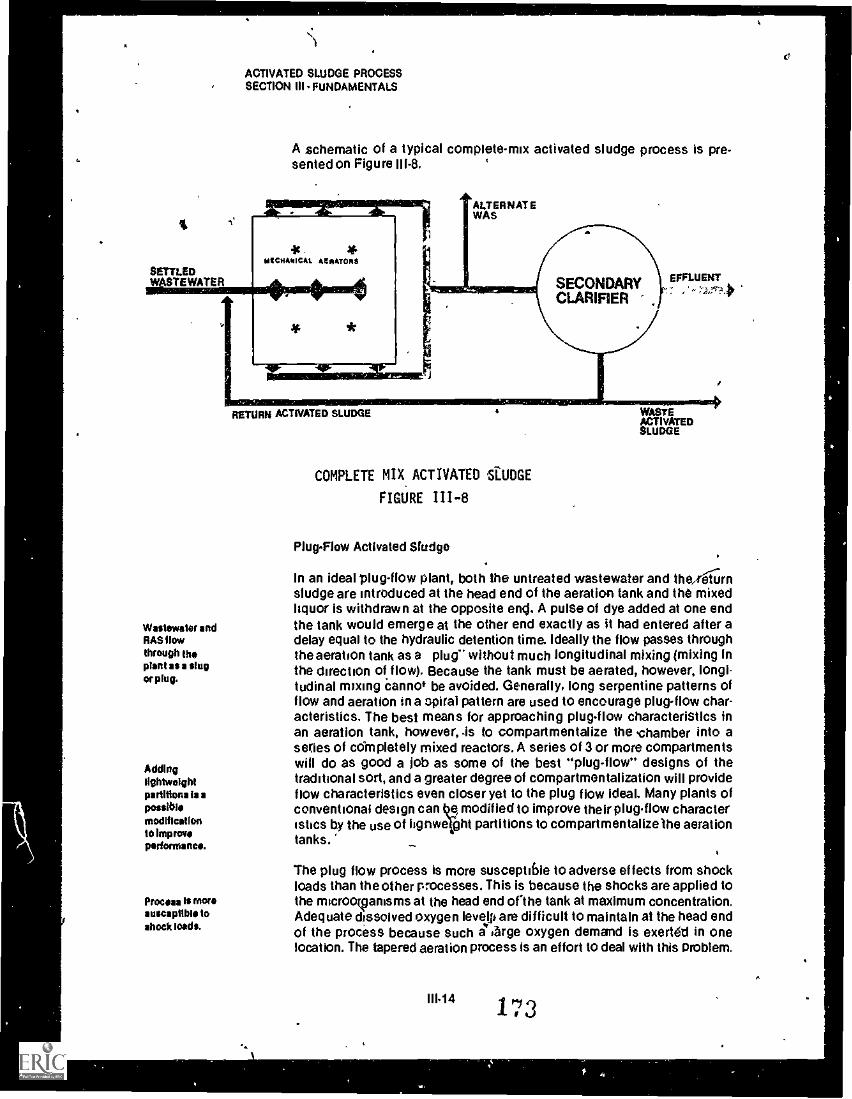
4
SETTLEDWASTEWATER
Wastewater andRAS flowthrough theplant as a slugor plug.
Addinglightweightpartitions is apossiblemodificationto Improveperformance.
Process Is moreauscaptibie toshock Iceds.
A'
ACTIVATED SLUDGE PROCESSSECTION III FUNDAMENTALS
A schematic of a typical complete-mix activated sludge process is pre-sented on Figure 111-8. ,
AMMr=ralMICHANICAL AMIATORS
ALTER NA; EWAS
RETURN ACTIVATED SLUDGE
COMPLETE MIX ACTIVATED SLUDGE
FIGURE 111-8
EFFLUENT
WASTEACTIVATEDSLUDGE
Plug-Flow Activated Sludge
In an ideal plug-flow plant, both the untreated wastewater and thernsludge are introduced at the head end of the aeration tank and the mixedliquor is withdrawn at the opposite enj. A pulSe of dye added at one endthe tank would emerge at the other end exactly as It had entered after adelay equal to the hydraulic detention time. Ideally the flow passes throughthe aeration tank as a plug" without much longitudinal mixing (mixing inthe direction of flow). Because the tank must be aerated, however, longi-tudinal mixing canno* be avoided. Generally, long serpentine patterns offlow and aeration in a spiral pattern are used to encourage plugflow char-acteristics. The best means for approaching plugflow characteriStics inan aeration tank, however, -is to compartmentalize the -chamber into aseries of completely mixed reactors. A series of 3 or more compartmentswill do as good a job as some of the best "plug-flow" designs of thetraditional sort, and a greater degree of compartmentalization will provideflow characteristics even closer yet to the plug flow ideal. Many plants ofconventional design can to improve their plug-flow characteristics by the use of lignwe ht partitions to compartmentalize the aerationtanks.
The plug flow process is more susceptible to adverse effects from shockloads than the other processes. This is because the shocks are applied tothe microorganisms at the head end ofthe tank at maximum concentration.Adequate dissolved oxygen level li are difficult to maintain at the head endof the process because such a iarge oxygen demand is exerted in onelocation. The tapered aeration process is an effort to deal with this Problem.
111.1417 3
f
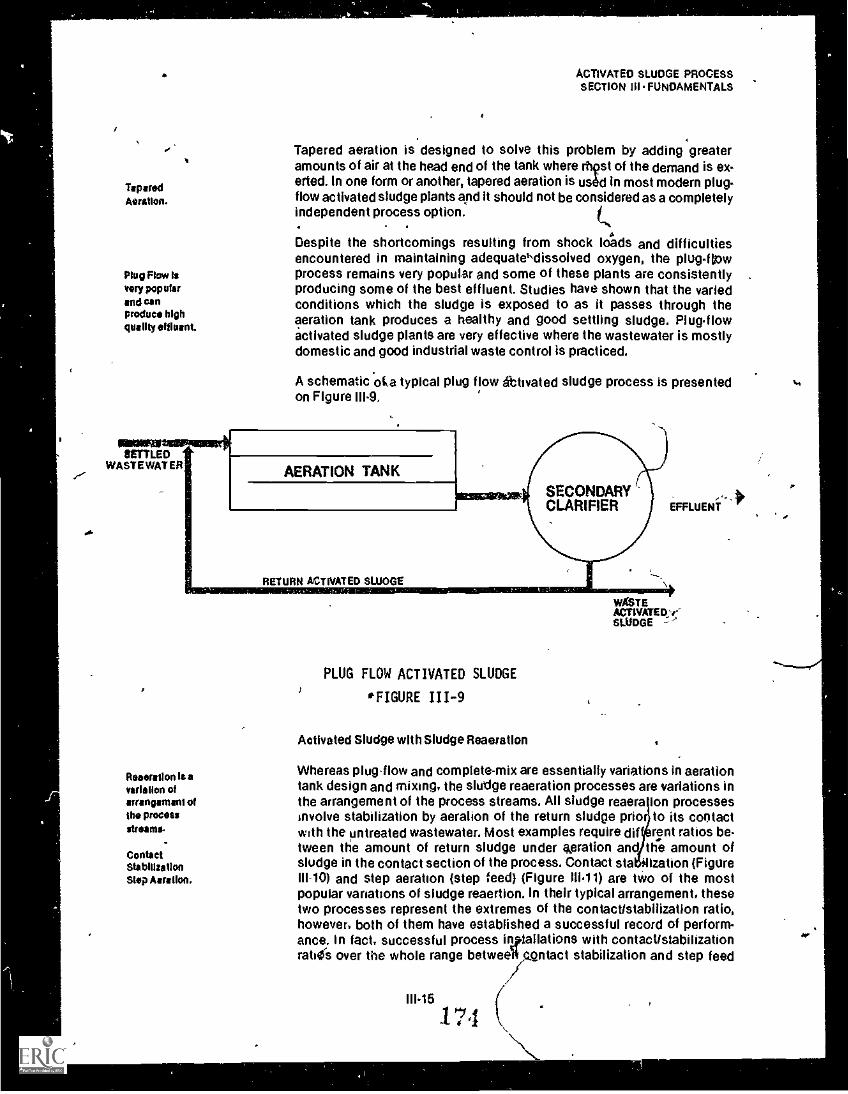
ACTIVATED SLUDGE PROCESSSECTIONIII.FUNDAMENTALS
TaperedAeration.
Plug Flow Isvery popularand canproduce highquality effluent.
MOMS ,SETTLED
WASTEWATER
Tapered aeration is designed to solve this problem by adding greateramounts of air at the head end of the tank where [test of the demand is ex-erted. In one form or another, tapered aeration is used in most modern plug-flow activated sludge plants and it should not be considered as a completelyindependent process option.
Despite the shortcomings resulting from shock lolds and difficultiesencountered in maintaining adequatehdissolved oxygen, the plug-firmprocess remains very popular and some of these plants are consistentlyproducing some of the best effluent. Studies have shown that the variedconditions which the sludge is exposed to as it passes through theaeration tank produces a healthy and good settling sludge. Plugflowactivated sludge plants are very effective where the wastewater is mostlydomestic and good industrial waste control is practiced.
A schematic oka typical plug flow ittivated sludge process is presentedon Figure III-9.
AERATION TANK
RETURN ACTIVATED SLUDGE
ReaeratIon Is avariation ofarrangement ofthe processstreams.
-ContactStabilisationStep Aeration.
WXSTEACTIVATEDSLUDGE
PLUG FLOW ACTIVATED SLUDGE
*FIGURE 111-9
Activated Sludge with Sludge Reaeration
Whereas plug-flow and complete-mix are essentially variations in aerationtank design and mixing, the sludge reaeration processes are variations inthe arrangement of the process streams. All sludge reaera Ion processesinvolve stabilization by aeration of the return sludge prio to its contactwith the untreated wastewater. Most examples require dif rent ratios be-tween the amount of return sludge under keration an the amount ofsludge in the contact section of the process. Contact sta ization (FigureIII-10) and step aeration (step feed) (Figure 111.11) are two of the mostpopular variations of sludge reaertion. In their typical arrangement, thesetwo processes represent the extremes of the contactistabilization ratio,however, both of them have established a successful record of perform-ance. In fact, successful process injtallations with contactistabilizationrates over the whole range hetweeli contact stabilization and step feed
1 74 (III.15
\\_

4
SETTLEDWASTEWATERomgellaDWiamliE.
ALTERNATEWAS
ACTIVATED SLUDGE PROCESSSECTION iii FUNDAMENTALS
can be found in great numbers., Most of these processes have definitelybeen shown to greatly increase the capacity of the activated sludgeprocess to handle high organic loadings in smaller aeration tank volumesand some have argued that they are also more resistant to shock loading.
RETURN ACTIVATED SLUDGE
EFFLUENT
WASTEXII YAWL,SLuDGE
SludgbRaaeration isless wellunderstoodthan othervariations.
Includes solidsin the ContrictandStsbilizationbasins In theFM calculations
COD removalnot significantlyaffected by thevolume ratio ofContact toStsbilizetionbssin.
CONTACT STABILIZATION ACTIVATED SLUDGE
FIGURE I I I-10
The various arrangements of sludge reaeration have been studied muchless on a laboratory and pilot scale basis than have the other basic processarrangements, complete-mix and plugflow. Of the three basic processarrangements discussed here, the sludge reaeration processes are theleast well understood. On the other hand, they are processes which havedemonstrated-great potential.
However, a certain amount of information is available on the behavior ofthe sludge reaeration processes based on field and pilot scale data. Thisdata will be used to describe the processes and their behavior to theextent possible.
First of all, although volumetric loadings for the sludge reaeration pro.cesses may be considerably higher for the two processes describedpreviously, the overall FIM ratios or CRT values which may be used foroperation *.re in about the same range, i.e., in the range which has beendescribed as conventional activated sludge (F/M values of 0.2 to 0.5 andMCRT values of 5 to 15 days). In doing these calculations all the solids inthe process should be inVuded in the solids inventory and F/M calculations.
Although it has been adequately demonstrated that the ratio of solids inthe contact section and in the reaeration section has a significant impacton the degree of removal of certain compounds suck as ammonia, theremoval of organic material (COD or BOD) from domestic effluents doesnot seem to be significantly affeoted over a very broad range of Contact/stabilization ratios. For this reason, the effluent quality seems to be `bout
III.16 1.75
RIM

f
.......:%
SETTLEDWASTEWATER
AERATION TANK
3Ab
RETURN ACTIVATED SLUDGE
,.,
ACTIVATED SLUDGE PROCESSSECTION Iii FUNDAMENTALS
SALTERNATEWA
STEP FEED ACTIVATED SLUDGE
FIGUItE III-11A
the same in processes ranging from step aeration, where the reaerationsection is usually quite small to the contact section. All organic wastesare not of exactly the same nature. If removals of organic materials arenot akiiigh as expected; the operator should consider taking measures toincrea4 the fiaction of the sludge inventory which resides In the contactsection.'The Most simple means of accomplishing this is to increase therecycle ratio. If this measure has been used to the limit of its value, otheroptions ate frequently available. Among the most important of these arethe distribution of raw wastewater feed in a step aeration design and theadditioP of another tank to the contact section in others.
Most of the benefits of sludge reaeration are achieved if the organic loadimpotent point present Is mainly in the colloidal state. Generally, the greater the fractionlobe of soluble BOO, the greater the required contact time. As a result, theconsidered. required total aeration volume of this process approaches that of the
conventioanl process as the relative amount of soluble BOD in the waste-water increases.
WASTEACTIVATEDSLUDGEwes.4
I
Control ofsiudtpi returnmore important-then in othervariations
Do not controlRAS with justthe blanket meiId the clarifier.
The control of sludge return assumes much greater importance in thesludge reaeration processes than it does in the other activated sludgevariations. For example, the rate of (shim (or the recycle ratio) affects notonly the solids balance between ne contact and stabilization sections,but it is also very important for controlling the overall solids inventoryand the concentration of solids in the contact section.
if the rate of return is controlled in reaeration processes in the samemanner as was suggested for completemix and plugflow some problemswould result. For example, if the return were operated according to thelevel of the sludge blanket in the secondary clarifier, the reaeration bays .would always be full of sludge which would be at the maximum concen-tration that could be achieved in the clarifier. Chances are this concen-tration does not correspond to the proper NM ratio for operation. II therecycle ratio is increased beyond this level, some water will be mixes in
III.17 176

RAS la used tocontrol solidi_ratio In theContact andStabilizationbasins.
WAS must becarefullycontrolled.
Inexpensiveconversion toContactStab! Ilution.
a
/
ACTIVATED SLUDGE PROCESSSECTION HI FUNDAMENTALS
with the solids and the concentration in the reaeration bays would bereduced. Thus, it Is possible to adjust the ratio of the solids in the contactand reaeration bays through the use of the rateofreturn.
This same phenomenon is also Important In controlling solids wasting Ina sludge reaeration plant. For example, if the return rate Is set up so thatthe r.,aximum concentration of return is always provided when wasting Isattempted, the rosult will always be to reduce the concentration of sludgein the contact section without substantially Influencing the concentrationin the reaeration section.
In general, the sludge reaeration processes are a very good means of Im-proving the capacity of a given set of aeration tanks to handle A higherBOD load. Operators having overloaded plug-flow or completemix plants,should consider alterations to accommodate some sludge reaeration ifpossible. Many times this conversion can be accomplished with only asmall investment in additional piping. One of the bigadvantages of thereaeration processes is they reduce the solids loading op (he final clarifiers.
REFERENCES1
..----Eckenfeider, W.W., Biological Waste 1:realment, Pergamon Press, New York, 1961.
Environmental Protection Agency, Process Design Manual for Upgradiq ExistingWastewater Treatment Plants, 1974.
Hammer, Mark J., Water and WasteWater Technology, John Wiley & Sons, Inc.,New York, 1975. .
Hawkes, H.A., The Ecology of Waste Water Treatment, Pergamon Press, Oxford, 1963.
1
Kerri, Kenneth, D., et al., A Field Study Training Program, Operation of WastewaterTreatment Plants, (Chapter 7), Sacramento State College Department bf CivilEngineering.
McKinney, Ross E., Microbiology for Sanitary Engineers, McGraw Hill Book Companyinc., New York, 1982.
Metcalf & Eddy, Inc., Wastewater Engineering, McGrawHill, New York, 1972.i
Stevens, Thompson, Runyan, inc., Operator's Pocket Guide to Activated Sludge,Parts I and II. Published by the Authors, 5505 S.E. Milwaukle Avenue, Portland,Oregon 97202, 1975.
Stewark, M.J., "Activated Sludge Process Variations The Complete Spectrum."Parts 1,11, III, Water and Sewage Works, April, May, June, 1984. __ ,
Water Pollution Control Federation. "Sewage Treatment Plant Design," Manual ofPractice No. 8; Washington, D.C., 1987.
111-18177
/

J
Liberator,control lean'casings! Ica
Good samplingrechnloas Ismerman
Two types ofmangles.
241. rcompoeltesampling Ispreferred
If only grabsimple. eraCOlteCteds thlkoperator moatsimple duringpeak flowco. c ; ',ma.
ACTIVATED SLUDGE PROCESSSECTION IV- LABORATORY CONTROL
4.01 INTRODUCTION
An essential tool for proper process control is frequent and accurate samplingan laboratory control tests. By relating the lab test results to operation, theoperator can select the most effective operational parameters, determine theefficiency of hos treatment processes, and identify developing problemsbefore they senousiv affect effluent quality. Therefore, laboratory facilitiesplay an important icle in the control of ar aerobic biological treatment facilit..
4.02 LABORATORY SAMPLING AND TESTING PROGRAM
Good sampling procedures are the key to meaningful laboratory analyses.A typical sample represents only a mail traction of the total flow. and greatcare must be. ext.,cisecl to ensure that the sample is representative. If this isnot a.compiished, the subsequent analytical data is worthless for process.:ontrol. Therefore, the importance of good and accurate sampling techniquescannot be overstressed
The exact location or sumpiing points within a given treatment plant cannotbe specified because of the sarying conditions and the plant design. However, it is possible to present certain general guidelines which are presentedon Figure IV I
Two types of samples may be collected, depending upon the purpose ofsampling. The first is a dip or "grab- sampling which consists of a singleportion collected at a given time. The second type of sample is a "composite"sample that consists of portions taken at known times and then combinedin volumes that are proportional to the flow at the time of sampling. Thesecombined portions produce a sample which is representative of the wastewater char- liens. over the entire sampling period.
The preferred sampling proi.edure, except : certain lab tests whlch must berun immediately (D sso, ed Oxygen. Temperature, pfti, is to collect hourlysamples fa 24 hours with the voourne of sample in proportion *o the wastesrater flow rate. When available and where possible, automatic sampling
devices should be employed. The sample contain - and sample lines shouldbe frequently cleaned to ciovent sample- cor Clliiination. The hourly grabsamples should be composited into a labeled plastic gallon bottle and keptrefrig -rated at 3 or 4° C. to preven bacterial decomposition. For some testsisuch as the nitrogen tests), other methods of preservation may be needed,refer to Standard Methods for recommended preservation procedures. A finalcornposited sample volume of 2 to 3 liters Is usually suff ink iit for conductingruilne tests. Where collection of an hourly sample is not feasibk, a :. or 3hourly sampling procedure is the next best alteigative. The sampling methodand time of sampling Should be noted upgro the lab record (log) sheet asreference for later data review and interpretation.
Grab Samples
Grab samples are representative of , ; instantanecot s characteristics of thewastewater. if it IS only possible to collect Grab samples, they should becollected when the treatment plant is operating Pt peak flow conditions.
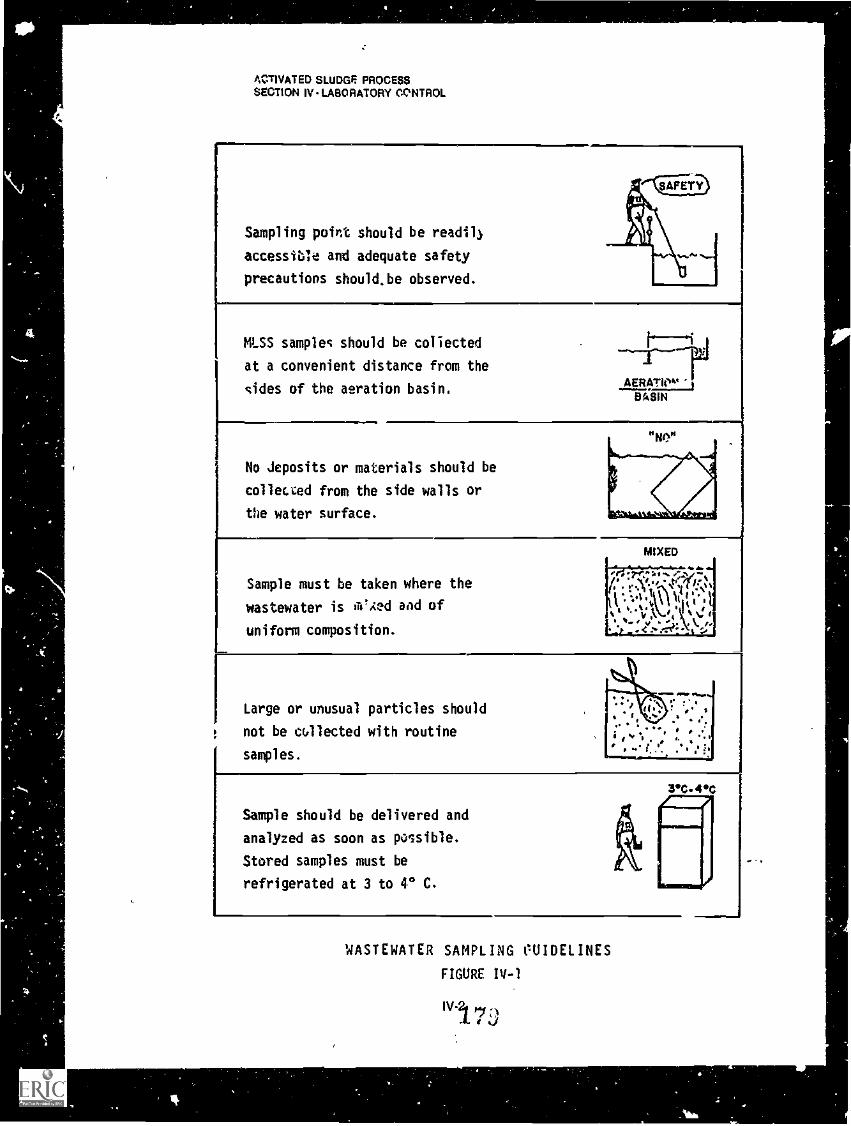
At tTIVATED SLUDGE PROCESSSECTION IV LABORATORY CONTROL
Sampling point should be read 1,
accessible and adequate safety
precautions should,be observed.
MLSS samples should be collected
at a convenient distance from the
sides of the aeration basin.
"No"
No Deposits or materials should be
collecced from the side walls or
the water surface.
Sample must be taken where the
wastewater is la'Aed and of
uniform composition.
Large or unusual particles should
not be cullected with routine
samples.
3°C.4°C
Sample should be delivered and
analyzed as soon as possible.
Stored samples must be
refrigerated at 3 to 4° C.
WASTEWATER SAMPLING PUIDELINES
FIGURE IV-1

24Hourcomposites arethe beat fordeterminingorganic loadingendperformance.
Take MESSsamples atsometime andlocation eachday.
How to make upa MESSsample whenmultiple tasksare in operstion.
ACTIVATED SLUDGE PROCESSSECTION IV - LABORATORY CONTROL
Sample collection should be conducted systematically at various samplinglocations during the flow sequence through the plant. Grab sampling timesmay be systematically staggered to account for the resoctive hydraulicdetention time of each unit process. In this manner, a slug of water may betheoretically followed through the treatment plant. For example, if the by
detention period through a particular unit process unit Is two hours,then the grab sample of the effluent from this unit sh uld be collected twohours after the influent sample. In this manner, the sarn es can be assumedto be representative of the wastewater bete; e and after treatment.
Composite Samples
Composite samples generally represent the wastewater characteristics overa specified period of time. The ideal procedure incorporates the use of 24-hou composite samples consisting of hourly grab samples proportioned tothe flow at the time of sampling. This procedure is only feasible in treatmentfacilities with 24-hour attendance or where automatic samples are warranted.Adequate results, however, can generally be obtained from analysis of com-pos.te samples collected over a shorter period. In those redlines whereautomatic samplers are aot available, collection of composite samples duringthe number of shifts worked would be sufficient as long as peak flow periodsare included. A total composited sample volume of approximately three litersis generally suificiecie to perform the routine process control tests
MLSS Sampling
MLSS samples taken to develop an estimate of the amount of solids inthe aeration tank should always be taken at the same time of the dayand should always be taken from several places along the tank section.Jrdinanly only one solids analysis need be conducted on a compositemade up of samples taken from every quadrant of every tank. Analysis ofindividual samples should also be conducted occasionally to develop addi-tional information about the condition of the process. Composites fi",maeration tanks of different size can be prepared by first combining equalvolume samples from each tank quadrant, and then combining the tankcomposites.
When samples of the mixed liquor are taker, a composite should beprepared from samples withdrawn from all the tanks under aeration. If anyof the aeration tanks ire of different size, the sample should be taken inproportion to tank size. Occasionally, the MLSS concentration in eachtank should be measured. For example, suppose an operator is to collecta MSS sample which is to be representative of a complete mix planthaving 3 aeration tanks with a volume of 0.4 mil. gal. and 3 new aerationtanks having a volume of 0.8 mil. gal. One liter of MLSS has already beencollected from each tank How much should be taken from each of the sixone liter samples to prepare a 'I liter composite that is representative ofall the aeration tanks?

How tocompositeMISS samplesto beproprotionatwith flow.
ACTIVATED SLUDGE PROCESSSECTION IV LABORATORY CON1 ROL
Sample volume per (Tank Vol , mg)(Composile Vol.. liters)=-
tank, liters Total Vol. of all tanks, mg
0 liter)4)(1.For the 0.4 mil ga: tanks, voli.me = (0. 0.13 liter (130 ml)(3 x 0.4) + (3 x 0.6)
For the 0.6 mil gal tanks, volume = (0.6) (1.0 liter) 0 2 liters (200 ml)(3 x 0.4) + (3 x 0.6)
Total Volume = (3 x 0A3) + (3 x 0.2) = 0.99 liters x990 ml)
Composite sampling for processes operating in the step feed and sludgereaeration modes should be conducted in the same manner describedabove and shown in Figure IV2.
Once the composite sample is made to represent all of the tanks it shouldbe proportioned to the aerati n influent flow rale (either raw wastewateror primary effluent flow rate). As stated above, composite samples repre-sent wastewater characteristics over a specified period of time. Generallya total composited sample of 3 liters is adequate to perform routineprocess control tests. Therefore, the total amount of sample required, thenumber of samples required, the rata of flow at the time of sampling, andthe estimated average ciaily flow rate, can be used to salculo:e the amountof representative aeration tank sample to be composited during eachsampling period to represent the daily flow. This mu-, be calculated usingthe following equation.
Amount of sample to collect. ml =
(I-tate or flow, mgd time of sampling) (Total sample required(Number of samples collected) (Average daily flow, mgd)
Example Calculation
A Data Requwed1. Rate of flow at time of sample colit,...tion = 15 mgd2. Total sample volume required, Note ml = (liters) (1000) = 3liters or 3000 ml3. Number of samples to be collected = 84. Average daily flow = 0.9 incd
IV-4
si

ACTIVATED SLUDGE PROCESSSECTION IV LABORATORY CONTROL.
B. Determine ;rie amount of sample to be collected for the presentflow rate in milliliters.
Csicuisilon forAk
composes Amount of sample 1.sampling.
to collect. mi (Rate of flow, mgd) (Total sample required, ml)
Lab controlrequiresadequatefacilities andtechnical skills.
Lebore toryanslyses ere the .-tools of processceatrol.
Sampling andanalyses mustbe increeeditwhen theprocess is upset-
Vice'worksheetsprovided.
(Number of samples) (Ave. daily flow, mgd)
(1.5 mgd) (3000 ml)
(8) (0.9 mgd)
625 ml
This equation may. also be used to composite other samples takenfrom the plant.
Laboratory Control Program
The specific laboratory tests and frequency which they are performed forprocess control and performance evaluation will vary from plant to plant de.pending on the variation of the activated sludge process, its size, laboratoryfacilities provided. process control method used. available manpoWer, andtechnical skills. A typical sampling and testing program for an activatedsludge process is presented on Figure IV-2.
4.03 LABORATORY CONTROL TESTS
This section of the manual is provided to increase understanding and todevelop an appreciation of laboratory control tests.
The tests discussed are those necessary for routine process control when thebiological system is operating properly. Additional analyses and increasedfrequency of analysis for the routine analysis may be required for abnormalconditions. Specific suggestions are made for abnormal operation in SectionI. "TROUBLESHOOTING. However, the operator must rely upon his ownjudgement to determine which analyses he needs to conduct to supply theinformation that he desires.
Typical worksheets have been provided in Appendix A to assist the operatorin developing systematic data collection, calculation, and recording. Pre-cautionary procedures are presented for each of the tests presented in thissection to make the operator awa,e of the common pitfalls. Except where aspecific note is made, an analyses are referenced to the fourteenth edition of"Standard Methods for the Examination of Vater and Wastewater".
IV5 I Q
I

0r 111111.11 "s!et -1.4.A
SETTLED 4WASTEWATER Nir@ ® ®
ACTIVATED SLUDGE PROCESSSECTION IV LABORATORY CONTROL
ALTERNATE
: FLOW
SODC 0 0SUSPENDED SOLIDS TOTAL *SUSPENDED SOLIDS VOLATILE ;
NITROGEN- KJEL DAHL
AMMONIA
AERATION TANK MIXEDLIQUOR Ct''CIWAS
rEFFLUENT
0HAS RETURN ACTIVATED SLUDGE
TYPICAL ACTIVATED SLUDGE PLANT
3
DESCRIP TION iS" ° S I
;al ;
CR k CR CR CR
VI ASTEACTIVATEDSLUDGE
OAtr. v
Orar
NITRITENITRATE
PHOSPHORUS30 MIN. SETTLINGD0
TEMPERATURE
AIR INPUTSC F PASLUDGE BLANKET
4.0
3 / W3 / W3 / W
C AMC AM P
C AM P
C AM P
2 C AM P
/ W C AM22/ G AM2/ C AM P I
2/W C AM P JJ
D Ca2G AM P
D G AM PD G AM SD G AM S4
MICROSCOPIC EXAMINATION 1 W Gj .1) 10LOCATION OF SAMPLE
CODE DESCRIPTION
gPHI10061 IMAM LOCATIONC
UST WHITS CA1.00:4760
COUPOSITIO DAILY
6 61,460$10Clii "0111401
HUHYSILLANCIW WWIAM ANAIMMAL SICAluP:16100CA 0010H10005tY Mccookoto AND TOTAMTIOMA WPC 166A6UPSIASPITPAI PHYSICAL SICASUACIPpri
SAMPLING LDCATIONS FOR STEP FEED AND SLUDGE REAEHATION
TYPICAL SAMPLING AND TESTING PROGRAM FOR ACTIVATED SLUDGE
FIGURE IV-2
IV6 1°3

The 5day BOB
Minimum of twodilutions, atleast 2 ingif B.O.usedmust beat least 2 milliten after Fdays.
Mix sampleswell.
Avoid aerationduring bogiefilling.
Note Baysmean 120 Hours.
ACTIVATED SLUDGE PROCESSSECTION IV LABORATORY CONTROL
Biochemical Oxygen Demand (BOO)
The biochemical oxygen demand is determined by incubating a sample ofknown volume in the presence of microorganisms, excess nutrients, anddissolved oxygen. A properly conducted BOO analysis will have organicmatter as the growth limiting substance. If oxygen is !uniting, the analysis isnot meaningful.
The BOO is an index of the amount ofloxygen that will be consumed by thedecomposition of the organic matter in a wastewater. The analysis consistsof measuring the initial dissolved oxygen concentration, Incubation for fivedays at 20° C, and measuring the final dissolved oxygen. The difference in dissolved oxygen concentration corrected for the initial dilution and sample volumeis called the SOD. The BOO test is related to both the organic loading upon thebiological process as well as the removal efficiency of the process. Thedifference between the BOO applied and the BOO leaving the process is equalto the BOO removed by the process. This difference is part of the data requiredto determine the loading upon the process. For example, the organic loadingupon the activated sludge process is expressed as the pounds BOO appliedper day pound of mixed liquor volatile suspended solids (lbs BODtdaytibMLVSS). The efficiency of the process is determined by the following formula:
BOO applied. Iblday BOO leaving, Ibiday x 100 the removal efficiency. %BOO applied, ibtday
.1n this determination, the aeration tam( and clarifier are considered, as onesystem.
Precautionary Procedures
When performing BOO analyses the following procedures should befollowed in conjunction with the procedures outlined in Standard Methods.
1) A minimum of two dilutions per sample should be used. Onlyanalyses with oxygen depeltions of greater than 2 Intl but withno less than a residual of 2.0 rr.g/I after five days of incubation at20 C should be used to calculate the BOO. Generally, the highestvalue calculated should be used to represent the BOO.
2 Samples should be wet: mixed before the dilutions are made. Awide tip pipette should be used for making the dilutions. The widetip does not clog with suspended solids.
3 samples and the dilution water must be carefully added to theBOO bottle to avoid aeration and the pm:bully of entrainingbubbles in the solution.
4) The BOO incubator must be maintained at 20° ± 1° C for theentire 5 day (Note; 120 hours) period. Record the temperature ofthe incubator from a NBS certified thermometer placed in a beakerof water in the incubator.
IV71 S-1
Toxic Ads.
Primarystandard madefrom giutose.
Use shythiourasto Inhibitimbibers.
COD is last endreproducible.
Th.CODisbetter forprocess control.
Th. analystmust establishhi. arlsbitity.
ACTIVATED SLUDGE PROCESSSECTION IV LABORATORY CONTROL
5) If the BOD value of the more dilute sample is always greater, thismay indicate that there is some toxic material in the wastewater,which is inhibiting the bacteria. A series of dilutions should be setup and run. If the BOO is increasing with higher dilution, this mayindicate a condition known as a toxic slide. Further analysesshould be conducted to determine the nature of the toxic material,and if it appears that the concentration of the toxicant is significant,efforts should be initiated to identify the source and reduce theconcentration of the toxicant In the wastewater.
6) Use of a primary standard is strongly recommended. The standardshould be made of g coseglutamic acid mixtureand it shouldbe made up at a BOO near those levels in the treatment plantinfluent. The primary standard should be made up and analyzedweekly. Any significant variation (more than ± 20%) should causethe operator to be suspicious. Efforts should be undertaken to review the laboratory procedure, and find out what is causing theproblem. Each operator should analyze the standard and the resultsshould be within ± 10%. Operators not falling within this rangeshould review their laboratory techniques, and make the appropriateadjustments.
7) Wastewaters that have been partially nitrified may produce highBOD results. The increased oxygen demand results from theoxidation of ammonia to nitrate. The use of allyithiourea in thedilution water 'rill inhibit the nitrifiers and alleviate this ptoblem.
Chemical Oxygen Demand (COD)
The COD is an estimate of the total oxygen demand that results from the de-gradable organic matter. The analysis consists of oxidizing the organicmatter with potassium dichromate in a heated strongly acidic solution.
While the BOD analysis is an index of the t 'degradable organic matter, it isnot very useful for process con'rol because of the five day lag in time. The CODtest is rapid (3-4 hours), it is not subject to interferences from toxic materials,and it is not affected by ammonia oxidation.
The COD removal of a biological process is directly relatable to the amount ofbiological growth that can result from this removal. The COD analysis suffersfrom the disadvantage that it does not measure the rate of or biodegrabilityof matter removal, end therefore it is difficult to predict the effectS of effluentson the oxygen resources of receiving waters and the treatability of a particularwastewater.
Precautionary Procedures
When performing the COD test, the following procedures should beollowed in conjunction with those outlined In Standard Methods.
1) initially, the analyst should run triplicate samples to establish thevariabilitj of his analyses. Once this variability is established.samples can be analyzed without replication.
Iti 1 5F;

Soluble CODend DOD.
Symptomshighlighted bysettleabliltytest
ACTIVATED SLUDGE PROCESSSECTION IV LABORATORY CONTROL
2) Use a wide tip pipette to ensure that a representative sample istaken.
3) Glassware used for the COD analyses must be washed with hy-drochloric acid, hot washed, and rinsed three times with distilledwater.
4) Extreme caution and safety precautions should be practiced whenhandling the chemical :lagents for the test. Goggles, a rubberizedapron and asbestos gloves are essential equipment.
5) If a sample mixture turns green during or immediately followingthe heating period, the analysis is not valid and should be re-examined in a more dilute sample. If the problem reoccurs, thenthe laboratory technique should be reevaluated and the sampleshould be checked for likely interferences, such as high chlorideconcentration or the presence of a strong base.
6) A primary standard consisting of potassium acid phtalate shouldbe analyzed on a weekly basis to ensure that the analyses are con-sistent. The COD concentration of the standard should be nearthe level of the COD of the wastewater. (See Standard Met!.ods.)
Soluble COD and SOD
IvThe discussions on 80D and COD have been limited to the measurement ofthe total COO and BOD. The soluble BOO and COD are more meaningful formeasviinq performance (conversion of food to cell growth). The soluble SODor COD ..) determined in exactly the manner described above, except that thesample is filtered through a membrane filter prior to the analysis. The use ofthis filtering apparatus is discussed under the suspended matter analysis.
Settleable Matter
The settleable matter test (also known as the Imhoff Cone Test) is a measureof the volume of solid matter that settles to the bottom of an Imhoff cone inone hour. The volume of settled solids is read as milliliters per liter (m1/1)directly from the Iraduations at the bottom of the Imhoff cone.
This test is of value in providing a quick and efficient check of a sedimentationunit. Addi.ionally. a rough estimate of the volume of solids removed by thesedimentation unit can be made. Only a trace of settleable solids ohould re-main in the secondary effluent. Po.4 settleable matter removal may Indicatethe following related problems which may occur in sedimentation basins.
Primary and Secondary1) Hydraulic overload.2) irregular flow distributions to multiple units.3) Excessively high velocity currents.4) Effluent weirs of uneven heightShort circuiting.5) improper sampling technique.6) Improper raw sludge removal rates

Measure of thefilterable sous.
Use of this test.
A measure ofthe organicmatter--proportional tothemicroorganismconcentrationin the mixedliquor.
ACTIVATED SLUDGE PROCESSSECTION IV - LABORATORY CONTROL
Secondary only1) Biological upset.2) improper RAS pumping rate
Precautionary Procedures
When performing the settleable matter test, the following proceduresshould be followed in conjunction with those outlined in Standard Methods.
1) Take a sample volume greater than one liter.2) Use grab sampleS for this analysis.3) Fill the Imhoff cone exactly to the one liter mark in one rapid pour-
ing without stopping.41 Arter the sample has settled for 45 minutes, either gently tap the
sides of the cone or gently spin the cone between the palms ofyour hands to settle those solids adhering to the sides of the coneabove the compacted settled layer at the bottom of the cone.
5) Read and record the volume of settled matter (m111) at the end ofone hour. Read the graduation at the average solids depth and notat a peak or void area on the surface of the settled solids.
Total Suspended Matter
The suspended matter test refers to the solids in suspension that can be re-moved by standard filtering laboratory procedures. The suspended matter isdetermined by filtering) a known volume of sample through a weighed glassfiber or membrane filter disc in an appropriate filtering apparatus. The filterwith the entrapped solids is oven-dried at 103° - 105° C and then cooled in adesiccator and subsequently weighed. The increase in filter weight representsthe suspended matter.
The significance of the suspended matter test is generally dependent on thetype of treatment process and the location of measurement within the processapplication. Results of the test have the following uses in process control.
1) Evaluating the organic strength of the wastewater.2) Evaluating clarifier solids loading.3) Determine the sludge recycle rate by calculation4) Calculating clarifier solids capture.5) Estimating the solids inventory.
Volatile Suspended Matter
The volatile suspended soilds test is performed by volatilizing the non filterableresidue from the total suspended solids test. This volatilization is done byburning in a furnace at about 550° C. The results of this test Indicate theamount of volatile and nonvolatile solids contained in the sample.
This test is an index of the quantity of microorganisms in the activated sludge.The test has the same significance as the total suspended matter test withtwo additional applications which are the determination of F/M ratios and theMLSS levels to be maintained in the aeration basin of an activated sludgeplant.
IV10
187

x7,
.6"
use wide tippedpipette.
Tempen.turebetween 103-1051 C.
NO2 partially
oxidized tonof nitrogen
High NO2concentrationsimply
. Incompletenitrilicetion
ACTIVATED SLUDGE PROCESSSECTION IV LABORATORY CONTROL
Precautionary Procedures
When performing the suspended matter test, the following proceduresshould be followed in conjunction with the procedures outlined in Stand-ard Methods.
1) The sample must be thoroughly mixed to taking a samplealiquot.
2) Do not use a smalltipped pipette to measVe the sample aiquot. Awide-tipped pipette should be utilized tor permit passage of thelarger solids and to facilitate rinsing. An alternate method ofobtaining a sample aliquot would be to pour It into a graduatedcylinder.
3) Rinse all adhering solids from graduate (or pipette) with distilledwater. Pour rinse water through the filter.
4) Test results that appear faulty or questionable shotild be dis-regarded.
5) It is important to always maintain a temperature of between 103 -105° C in the drying oven. The temperature must be monitoredand recorded in a record book.
6) Se sure that the filter is properly seated in the filtration apparatusbefore pouring the sample. This is easily accomplished by wettingthe filter with distilled water, then applying vacuum to the filtra-tion apparatus.
7) Samples containing high solids levels may require more than onehour to completely dry. This is especially true of return sludgesamples.
8) Be consistent in the length of time the filter apparatus and paperare allowed tc ool in the dessicator both before and after filtering.
9) Use Whatman GFIC filters and a millipore filter apparatus withsintered glass seat for this analysis.
Nitrite Nitrogen
Nitrite (NO2) is an intermediate oxidation state of nitrogen between ammonianitrogen and nitrate nitrogen. Nitrite is transatory and readily amendable toboth bacterial oxidation to nitrate or reduction to nitrogen gas depending
environmental factors such as dissolved oxygen and microbial conditions.
The nitrite concentration can be used to monitor how well nitrification isprogressing in a treatment process. High nitrite concentrations indicate incom .
plete nitrification, and could lead to problems, such as high chlorine andoxygen demands.
Precautionary Procedures
When performing the nitrite nitrogen test. the following procedures shouldbe followed in conjunction with the procedures outlined in StandardMethods.
1) Use extreme caution in handling the chemica; reagents to avoidinjury or damaged clothing.

ACTIVATED SLUDGE PROCESSi SECTION IV LABORATORY CONTROL
Analyze es soon #
es possible.
Semple must becool.
Use theSructneMethod.
TKN measuresorganic endammonianitrogen.
Most nitrogen inrareWeStageter, inthis form.
I
4
2) Due to the 'instability of nitrite (NO2), the composite samples usedfor the n WI nalysis should be preserved by one of the following"---methods: (a) f #4thig, or, (b) addition of 5 rni of chloroformil ofsample. in general.ij is advisable to analyze only fresh grab samplesfqr nitrite. ----% ,
3) The samples must be cool when the analysis is performed orerroneous results will be measured.
4) Deviation from standard procedure may yield erroneous results. Beconsistent in your laboratory technique.
Nitrate Nitrogen
Nitrate Is seldom found In raw wastewater or primary effluent, becausefacultative microorganisms can readily use nitrate as an oxygen source. Inthe biological treatment process, the ammonia nitrogen can be microbic)logically oxidized to nitrite and then to nitrate depending on the microorgansimspresent and the environmental factors such as pH, temperature, and dis-solved oxygen.
Secondary effluent may contain from 0 to 50 mgll nitrate nitrogen 4ependingon the total nitrogen content in the raw wastewater and conditions of treatment.Activated sludge systems that have a long MCRT (usually 10 days or more)and adequate oxygen can also produce a nitrified effluent.
Precautionary Procedures
When performing the nitrate nitrogen test, thelefollowing proceduresshould be followed in conjunction with the procedures outlined inStand-ard Methods.
1) Use the Brucine method for routine analysis.2) Analyze the sample as soon as possible to avoid bacterial re
duction of the nitrate.3) Preserve samples that cannot be analyzed immediately by either_
freezing or by the addition of 5 ml of chloroformll of sample.
Total Kjeidahl Nitrogen (TKN)
This test measures the ammonia and organic nitrogen but not the nitrite ornitrate nitrogen. The sample is digested with acid and catalysts that convertthe organic nitrogen to ammonia nitrogen. The ammonia is then distilled offinto a boric acid solution and measured by either a colorimetric analysis callednesslerization or by titration.
In raw wastewater, nitrogen is primarily found as organic and ammonia nitro.gen depending on the degree of decomposition. As decomposition increases,the organic nitrogen is biologically decomposed (ammonified) to ammonianitrogen.
19jIV-14
-1

Do not breathethe fumes.
Ira
A measuredthe form ofnitrogen thatcauses highchlorinedemands andfish toxicity.
ACTIVATED SLUDGE PROCESSSECTION IV LABORATORY CONTROL
The results of this test are valuable because it can be used to:1) Evaluate the performance of a treatment process designed to nitrify.2) Evaluate nutrient (nitromn) deficiency.3) Evaluate oxygen rz;uulrements for activated sludge.
Precautionery Procedures
When performing the Total Kjeldahl Nitrogen test, the following proced-ures should be followed in conjunction with the prowdures outlined inStandard Methods:
-1) Use extreme caution in handling the reagents to avoid injury.2) Perform the digestion step under a vJntilated hOOd. Do not breathe
in the fumes given off:during digestion.3) The TKN test may be performed on the same composite samples
as for the BOD and Suspended matter tests. The samples shouldbe preserved by refrigeration at 3 to 40 C for not more than 24 hours.
4) Deviation from standard procedures.may yield erroneous results.Be consistent in lab technique.
tiAminenie Nitrogen *
This, test measures the nitrogen present in the wastewater as ammonia.Ammonia nitrogen le domestic wastewater is generally between 10 and 40mg11. Primary treatment may increase the ammonia nitrogen content slightlydue to decomposition of some protein compounds during treatment. Insecondary treatment process, ammonia can be oxidized to nitrite then tonitrate in varying degrees depending on factors, such as the residence timeof the microorganisms, wastewater temperature, and oxygen reliability.
The siphificance of this test is associated with the oxygen demand requiredto oxidize ammonia in the biological treatment process or receiving stream.Theoretically, the oxidation of one bound of ammonia nitrogen requires 4.6pounds of oxygen. This test is also valuable in evaluating the performance ofa treatment process designed to nitrify. Other significant problems relatingtq, ammonia are high chlorine demands,ish toxicity, and high oxygen demandin receiving waters.
Precautionary Procedures
When performing the Ammonia Nitrogen test, the following proceduresshould be followed in conjunction with the probedures outlined in Stand.and Methods.
1) Use extreme caution in handling the chemical reagents to avoidinjury or damaged clothing.
2) Deviation frpgt standard procedures may yield erroneous results.Consistency in laboratory techniques is essential.
1V.13
1

ACTIVATED SLUDGE PROCESSSECTION IV LABORATORY CONTROL
30Minute Settling Test
The 30minute settling test of MLSS proVides an index of the activated sludgesettling and compaction characteristics in the secondary clarifier. The test, In
An imPortaniof itself, is simple to perform and requires only a graduated glabs cylinder and ameasure
mixed liquor clOck. It is performed by transferring a thoroughly mixed one -liter sample ofsettling. mixed liquor to a one 'der graduated cylinder and then recording the
liters of sledge settled in the oneliter graduated cylinder at five minuto intervals°bum at 5 for the first 30 minutes and then at ten minute intervals up to one hour. Thismin Intervals lest can also be conducted with stirring, and the operator should try bothfor NM 30 min.10 min methods to see which most closely models his sedimentation results In thethereafter. clarifier.
Stirring can This test indicates how well the activated sludgoiiiked liquor concentratesimprove musts. and compacts. The usual index of sludge settleability and compaction is the
Sludge Volume Index (SVI) or its reciprocal the Sludge Density Index (SDI)Related to the which are based on the siudgOevel at the end of the 30minu period. Some
results, however emphasize that an SVI of 100 (SDI of 1.0) I indicative of awell functioning aotivated sluidge plant. This may not nece sadly be true because these indices represent onI the 30-minute settlin and do not neces-sarily account for the clarity of e liquid above the Judge Observationsshould be made during the 30mlfiute test to d ine whether the sludgeparticles are agglomerating well, settling uniformly, and leaving a clear liquidor whether sludge particles are settling rapidly and leaving a cloudy liquidabove. The latter behavior is indicative of several operational problems whichare discussed in Section 2.05. During the 30minute test, a well settling sludgewill normally settle to approximately half of its original volume in the first 5 to10 minutes.
Precautionary Procedures
Important toobserve results-with timeDonot read only at'30 minutes.
4
When performing the 30minute settling test, the following proceduresshould be followed in conjunction with procedures outlined in StandardMethods.
1) A morning and afternoon grab sappleAvrAwo samples per shift)should be tested for settleab:liti:
2) Grab sampleS should be takAr. during peak as well as average flowperiods.
3) Each Sample should be collected consistently and at the sarnelocation.
3) Vigor:is mixing and pouring of sample should be avoided.5) Be certain to fill the settling cylinder exactly to the onelite: mark6) Record time test is set up and temperatures of sample7) Record settling level every five minutes for the first 30 minutes
and every 10 minutes for the second 30-minute period
Observations During Test
An important factor i r inning the 30-minute settling test is to observethe settling and compaction characteristics of the MLSS. Often operatorswalk off after setting up the test and come back to read and record thesettling level at the end of 30 minutes. In doing this, they may miss (moattant information by not observing how the sludge settles. Use 01 the 30
1V14

ACTIVATED SLUDGE PROCESS,.SECTION I' LABORATORY CONTROL
minute test only to calculate the SVI or SDI does not provide the rpaximqmbenefit for process control. The operator should attlpt tai record the
ryfollowing obseations during the test so, that correlatio s to Other laboratory control tests used for process control can be made:
A. First Five to Tan Minutes
'1) Do sludge particles agglomerate while forming blanket?'2) Does sludge compact sloWly and uniformly, leaving clear liquid?
or .
3) Do sludge particles fall through a cloudy liquid?4) How much and what type of straggler floc, if any, remains in the
liquid?13.' End of 30 Minutes
1) Has the sludge floc compacted to "the appearance of lobkingcrisp with sharp edges and somewhat like a sponge? or,
2) Does the floc look feather-edged fluffy and somehwat homog-enous?
C. End of 60 Minutes1) Has any settled sludge floated to the-Gur ace of the cylinder?
7) Did it take two to four hours for the slu ge to split or Doti to thesurface':
3) These observations provide aci;bic on the final clarifier sludgeblanket charcteristics and removal rates in relation to sludgedetention time in the clarifier.
'A well settling sludge will have the characteristics of Items Al and A-2,and C2.
Total Phosphorus
Phosphorus is one of the nutrients essential to biological growth in condarytreatment processes. Most wastewaters have more 'phosphorus availablethen is required for biological growth and assimilation of the carb naceousBOD. A deficiency of phosphorus may result from high waste loading fromIndustries, such as canneries which generally have wastes that are high ipcarbohydrates and low in nutrients. Such a phosphorus deficiency may limitbiological growth and lead to poor BOD removals,
Typical raw domestic wastewater contains approximately 10 mg/I of phosphorus of which 20 to,30 percent may be.removed by the growth of microorganisms which are wasted from the process. Greater removals may be obtainedby various processes involving addition of a metarion such as iron or aluminumto chemically precipitate iron or aluminum phosphate. Other removal pro.cesses involve pH adjustment by addition of lime or other means and chemi-cal precipitation of a calcium phoiRfate.
ti
W-15
92
I

An importantparameter
I
DOmeasurementscan be used
I to controlaeration.
ACTIVATED SLUDGE PROCESSSECTIDN IV LABORATORV CONTROL
1 .
Dissolved oxygen (DO). is that oxygen dissolved in liquid and is usuallyexpressed as milligrams per liter (mg/I). There are various types of testa todetermine the DO content of water. Generally, the iodometic methods and themembrane electrode (DO probe) are best suited for the domestic wastewaterapplication. The azide modification of the lodemetric method (also known.as
_Vvokler Method) is recommended for most wastewater and stream samples.When determining the DO in activated sludge mixtures (MLSS and RAS), andother biological flocs which have a high oxygen utilization rate, the coppersulfatesulfamic acid flocculation modification should Frrecede the azide
,Modification to retard biological activity and to flocculate suspended solids.The membrane electrode method is becoming increasingly more popularbecause of its speld, ease of operation, and adaptability to process controlinstrumentation. Often, the membrane electrodes are used for .continuousmonitoring and control of DG in activated sludge units. The memptane elec-trodes must be properly maintained and calibrated on a daily basis to ensurethat their measurements are accurate and usable for process control,.
Precautionary Procedures,
When performing the total phosphorus test, the following proceduresshould be followed in conjunction With the procedures outlined in Stand.and Methods. /t..
1) Use extreme caution in handling the ch emical reagents to avoidinjury or damaged clothing.
2) Record specific procedures used for pretreatment of sample andmeasurement of phosphorus concentratipn with test results. Also,clearly indicate the expression of the test results, P or PO4. (Note;1.00 mg/I P equals 3.06 mglI FN.)
3) Deviation Irom standard procedure may yield erroneous yesults.Be consistent in your laboratory technique.
0issolved Oxygen
The 'significance of .the DO test in process control is' in its measurement ofthe dissolved oxygen available for and essential to aerobic .decomposition ofthe organic matter, otherwise, anaerobic decomposition may occur with thepossible development of nuisance conditions. In the activated sludge process,the DO test is uses to monitor the aeration process as a basis for control ofthe air supply rates, in order to maintain a desired DO residual, while avoidingoveraeration and power wastage. The DO test is also used in the determinationof BOD as discussed previously. Fish and most aquatic life require dissolvedoxygen to sustain their existence and the DO test is an important measuresment in plant effluents and receiving water quality.
4.Precautionary Procedures
When performing the DO test. the following procedures should be followedin conjunction with the precedureS outlined in Standard Methods.
1) Use extreme caution in handling the chemical reagents to avoid, ipjury or damaged clothing:
IV16193
it
N.

*
Mr
,
*
1
I.
.
Use speelai estein sampling.
.
Performimmediatelyafter &mating.
... -An importantmem/etc:Mamicroorganism.
(
Uerriirabsamples 'analyzeimmediately.
____...
Calibrate thepH meter claily.
Exerciseextreme Cafewith electrodes.
,
4
'V
. .
ACTIVATED SLUDGE PROCESSSECTION IV LA ?ORATORY CONTROL
2) The use of special DO. sampling equipment is preferable for col-lecting aamplet. The samples should be taken with the samplecontainer completely immersed and without aeration of the sampleor entrapment of any r bubbles.
3) Perform DO test im ediately following collection of sample:4) The following substances will interfere in the azide modification
/- of the ladometric DO analysis: ironosalts, organic matter, excessive' suspended matter, sulfide, sulfur' dioxide, ;residual chlorine,
chromium,and cynalde.
, Hydrogen ion Concentration (pH) *
,-
1
The intensity of acidity oralkajinity of a solUtion is numerically expressdby Its pH. A pH value of7.04sneutralkwhilavalues7tal4are flkaline andvalues 0 to 7 are acid, pH can be measured calorimetrically at electrome-ticalli. The electrometric method (pH Dieter) is preferred In ail applicationsbecause it is not as subject to interference by color, tubldity, colloidalmatter, various oxidants and reductants as is the less expensive colonmetric method. 0
. .
The pH measurements are valuable in process cantral because pH is one ofthe environmental factors that affect the activity and health of microorganisms.Sudden changes or abnormal pH values may be indicative of an adverse in-dustrial discharge of a strongly acid ar alkaline waits. Such discharge aredetrimental to biological processes as well as to the collectiorksystemand treat-ment equipment, and should be either stopped or neutralized prior to discharge.Generally, thspH. of the second* effluent will be close to 7. A pH drop maybe noticeable in a biological process achieving nitrification because alkalinityis destroyed and carbon dioxide W produced during the nitrification process.
Precautionary Procedures
When performing the pH test, the fallowing procedures should be followedin conjunction with the procedures outlined in Standard Methods.
1) Grab samples should be used for the pH measurement. The pHtest should be performed on the samples immediately followingcollection before the temperature or dissolved gas content canihange significantly. Do not heat or stir the pHaample as a changein temperature or dissolved gas content will affect the pH value.
2) Do not contaminate the buffer by pouring the used buffer solutionback into the buffer container. ,
3) Calibrate the pH meter daily with a buffer solution of approximatelythe same temperature and pH as the sample to be tested. Adjustthe pH meter's temperature compensator for each pH measure merit.
4) Avoid fouling the electrodes with all ar grease.5) Erratic results or drifting 'should prompt an investigation of the
electrodes.
IV17
194Po
Y

/
.
1'i
.se
TemperatureMeets growth0microorganisms.
/.;.,
MeasureIromedlatetY
A useful tool.
1
The Importantprotlits.
ACTIVATED SLUDGE CONTROL.SECTION IV LABORATORY CONTROL
Temperature1p
In process control, accurate temperature measurements are helpftil in eval-uating process performance because temperature is one of the.most importantfactors affecting microbial growth. Generally stated, the rate of microbialgrowth doubles for every 10° C increase in temperature within the speCifIctemperature range of the microbe. Temperature measurements can be helfpurin detecting infiltration/inflow problems and illegal industrial discharges.Thermometers are calibrated for either total immersion or partial immersion.A thermometer calibrated for total immersion must be cvmpletely immersedin the wastewater sample to give a correct reading, while a pactial.iremersionthermometer must be immersed in the sample to the depth.of the etched circlearound the stem for a correct reading.
If a Fahrenheit thermometer is used, its reading may be converted to Centi.grade by following formula:
t-° ° C = (° F 32°)
9
Precautionary Procedures
When obtaining the temperature of a sample, the following proceduresshould be followed in conjunction with the procedures outlined in Stand.ard Methods.. \.
1). To attain truly representative temperature measurement, it is.necessary either to take the temperature reading at the point ofsampling dr immediately folloWibg sample collection.. A large
. sample volume should be used to avoid a temperature chingerk,daring the measurement. .
2) The accuracy of the thermometer used should bi occasionallyverified against's precisionlhermometer certified by the NationalBureauof Standards (NEISI. - ..
3) The' hermometer should be left in the sample while it is read.
Microsc4Ic Examination C )
Microsbopic examination of the MISS can be a significant aid in.the evaluationof the activated sludge process. The oresende of various microorganism,.within the sludge floc can rapidly_ indicate good or poor treatment. The mostimportant of these' microorganisms are the heterotropic and ,autotrophicbacteria which are responsible for purifying the wasteivater. Ir., addition,protozoa play an important role in clarifying the wastewater and act akindica-tors of the degree of treatment. The presence of rotifiers is alto an indicatorof effluent stability. . -I .
-
A Kedominance tf protozoa (ciliates) and rotifierein the MLSS is a sign ofgood sludge qbailty. The eatment under these conditions, with proper FAS,WASSrhi aeration rates, can be expected to produce effluent KM concentra-tions of less then 10 mg/I.
. ,, IV18
4
)

t
k
S
7
.
,
I
,
I..
,
ACTIVATED SLUDGE PROCESSSECTION IV- LABORATORY CONTROL
Oh
Inversely, a predorninance of filamentous organisms and a limited number,ofciliates is charactetistic of 4 poor quality activated sludge. This condition iscommonly associated with a sludge that settles poorly. The sludge floc isusually light and fluffy because it has a low density. There are many otherorganisms such as nematodes (worms) and waterborne insect larvae whichmay be found; however, these do not significantly affect the quality oftreatment.
- .
The microorganisms which are important to the operator are the protozoa androtifers. As discussed previously, the protozoa eat the bacteria and help toprovide a clear effluent. Basically, the operator should be concerned with threegroups of protozoa, each of which have signaicance in the treatment ofwastewater. These groups include the following:
1) Amoeboids2) Flagellates'3) Ciliates
. Amoeboids (Figure IV-3)
The cell membranes of Amoeboids are extremely flexible; and themobility of these organisms is crated by the movement of protoplasmwithiA the cell. Food matter is ingested by absorption through the cellmembrane. Amoeboids may predominate in the MLSS floc daringstartup periods of the activated sludge process or when the processis recovering from,an upset condition.
i
1'
., .
..
.
.
t
1
r
l 1-f
.,
AMOEBOIDS -
FIGURE IV -3
,
..%,-- N,
,x-
. , 1
IV-19
1.96
.IN
I..
r:*4
t
t

f
1
0
ACT' ATE!) SLUDGE PROCESS \SECT ON IV LABORATORY CONTROL
Flagellates (Figure 1V-4), , : )
C.-3These organisms are characterized by the tail (Flagella) which extends
-..tro their round or elliptical cell configuration. Their mobility iscrea ed by a whipping motion of the tail, whiCh allows them to movewith, oniewhat,of.h corkscrey, motion. Flagellate predominance maybe associated with a iightdispersed MLSS floc; low copulation ofbacteria, and a high organic load (SOD). As amore dense sludge fidcdevelop% thelagellate predominance will decrease with an increaseof bacteria, When the flagellates no longer are able to successfullycompete for the available food supply, their population decreases tothe pcInt of insignificance. '
FLAGELLATES
FIGURE 'IV -4
Ciliates
These organisms are characterized by the rotating hair-like membrane(cilia) wilich cover all or part of their cell membrane. Their mobility iscreated by the movement of the cilia, and the cilia around the gulletare utilized for the intake of food. Ciliates may predominate during
',the period of fair to good Settling of the activated sludge
They are considerably larger than flagellates and for the purposes ofmi&oscopic examination may be classified into two basic groups,which are the free swimming and thestalked Ciliates.
IV20 't
Q

.
ACTIVATED SLUDGE PROCESSSECTION IV LASORATORY CONTROL
K
A
Free Swimming Ciliates (Figure IV5)
Free swimming ciliates ire.usually apparent when> there_ is a lergenumber -of bacteria in the ktivated sludge. These .organisms teed orgraze on the bacteria and 'clarify the effluent. Therefore, their presenceis generally indicative of a treatment process that approabhing anoRtirritan degree of treatment. A relative predominance of flagellatesindidates decreased treatmentefficlency and the MCRT of the systemShould be %increased to maintain a relative predominance of free.swimmers,. stalk_ed ciliates and higher forms of organisms such asrotifers. 4
" 4
)FREE SWIMMING CILIATES.
FIGURE IV-5
Stalked &Wes (Figure IV6) .
these organisms are frequently present whenunable to compete for the available food. Aof these organist's aloro with rotifirs willefficiently operating process.
19';"
11/.21
the free swimmers arerelative predominanceindicate a stable and
ti
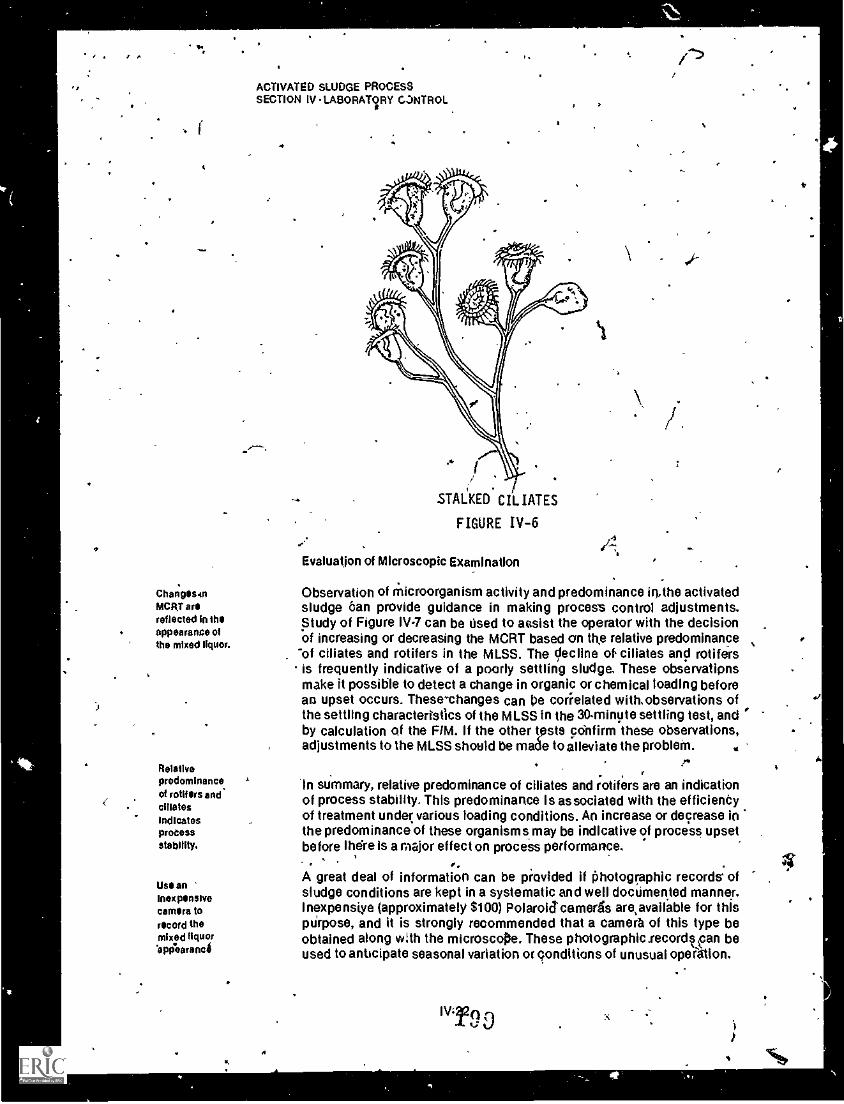
ACTIVATED SLUDGE PROCESSSECTION IV LABORATORY C3NTROL
STALKED CILIATES
FIGURE IV-6
0 di-;Evaluation of Microscopic Examination
Observation of microorganism activity and predominance in,the activatedsludge tan provide guidance in making process control adjustments.Study of Figure IV-7 can be Used to aesist the operator with the decisionof increasing or decreasing the MCRT based an the relative predominanceof ciliates and rotifers in the MLSS. The decline of ciliates and rotifersis frequently indicative of a poorly settling sludge, These observatipnsmake it possible to detect a change in organic or chemical loading beforean upset occurs. These.changes can be corielated with.observations ofthe settling characteristics of the MLSS in the 30.minute settling test, andby calculation of the NM. If the other tpsts cOnfirm these observations,adjustments to the MLSS should be made to alleviate the problem.
Changes.inMAY arereflected In theappearance ofthe mixed liquor.
Relativepredominanceof rotifers andciliatesindicatesprocessstability.
Use aninexpensivecamera torecord themixed liquorappearanc4
'In summary, relative predominance of ciliates and rotifers are an indicationof process stability. This predominance is associated with the efficient),of treatment under various loading conditions. An increase or decrease inthe predominance of these organisms may be indicative of process upsetbefore there is a major effect on proceis performance.
, , . 3(4'
A great deal of information can be piovided if photographic records' ofsludge conditions are kept in a systematic and well documented manner.Inexpensive (approximately $100) Polaroid tamer& are,available for thispurpose, and it is strongly recommended that a camera of this type beobtained along with the microscope. These photographic .recordwn beused to anticipate seasonal variation or conditions of unusual opeation.
iv1290
.1

I"
Relatively lowcostmicroscope Istaltsbie.
I
ACTIVATED SLUDGE PROCESSSECTION IV LABORATORY CONTROL
Selection of a Microscope
'eatures which should be considered whpn selecting a microscopeinclude the following: , . .
4;1) BuilPi illumination or an external system which allows variations"
2)
''Agf lig t intensity..condense? system. '
_,.3) A movable stage. Stage should be controlled by coaxial handle .
rather than a manual push-pull. I4) . 10X and 40XObjectived.. ---5) 10X eyepiece.
.Auxiliary equipment should include:
6) Light blue flitof (daylight type) --)7) tildes .
'8)!.. Coversilps9) Several small dropping pipettes
10) Storage.box11) Dust cover:
iiiThe cost of a microscope can v. try between $150 0 and $2,500.00, de-pending upon the individual's requirements in t e Way of illumination,lenses and auxiliary equipment. A relatively inex ensive instrument is allthat is required for the examination of activatedsiudge.
Adapted from "Activated Sludge Proce Analyses and lnerpretationWorkshop Manual," Ministry' of the nvironment, Toronto, Ontario.(Additional information is also inciud d.)
,
Use of the Microscope
Procedures for preparing slid s and using the microscope should includethe following:
1) Clean cover slip and dIlde.2) Use pipette to pick up sludge: Put 'finger on top of pipette until
the Jrnmersed end of a widetip pipette reaches the bottom ofsludge sample. Release your Unger to alloIAWudge into the Pipette.Replace your finger on top of pipette anb-remove the pipettefrom the sampler beaker. A long tipped eye droppei may also be-used. .
3) Allow one drop of sludge from the pipette to drop'in the middle,.of the clear area of the .glass slide by lifting your finger from topof pipette momentarily, and then replacing your finger. 1r
4i Pick up cover slip by two corners. Do not.louch the cleaned area.
5) Pull cover slip along glass slide towards drop of sludge. 4
6) As soon as cover slip .touches drop of sludge, allow cover slip tofall onto glass slide.
7) Pick up.glass slide. Place on microscope stage.
8) MoVestage up to within approximately 1/8 inch of objective.Look at glass 'slide through the eyepiece of the microscope.
Nr
lV23 21 j 0

ti
o
STRAGGLERS
Uz
8g FREE SWIM.124 CILIA Efil
E4
w
201
3r_
FLAGE LLA TES
GOOD irritLING
ROTIFERS .
TIFERSSTA LKED'C 'MATES
FREE *
SWIMMING
CILIATES -,
STA LEE D
CILIATES
FREESWIMMING
9LIA 7. is
4
NEMATODES
ROTIFERS,
S T A LKED
C MATES
FREESWLMMING
CILIA TESFLAGELLA TES FLAGELLATES FLAGELLA TES
AMOEBOIDS. t, I AMOEBOIDS AMOEBOIDS I AVM EBO AMOEBOIDS ,.
RELATIVE NUMBER OF MICROORGANISMS VS. SLUDGE QUALITY /
PIN FLOC
NEMATODES
ROTIFERS
STALKEDCILIATES
FREE SWIM.CILIATES
FLAGELLATES
FIGURE I11-7I 2°'
Acourate flowmeasurementsare essential.
Flowmeasurementsare veryImportant.
ACTIVATED SLUDGE PROCESSSECTION IV-LASOFIATORY CONTROL
9) Use the coarse adjustment on the microscope to bring tne sludgeinto the field of focus.
10) Use fine adjustment to refine focus to suit your eyes.11) Identify organisms In the sludge.
Procedures for Examination
When performing a microscopic examination of activated sludge, a sheetof paper shoulfte kept handy to sketch the types observed. In the eventthat unknown varieties of microorganisms are made, the operator mayidentify these later. The objective of the examination is to determine'relative predominance of microorganisms. This may be accomplished bythe procedures outlined below and utilizing a worksheet as illustrated inFigure W.8.
Ekamination Procedures:1) Record the date, time, temperature, and location of the sample on
the worksheet.2). A minimum of three slides per sample should be examined.3) Scan each slide and count the number of microorganisms in each
group.4) Provide a mark for each microorganism counted in the appropriate
group space on the worksheet.
5) After completing the examination of the three slides, total thenumber of organisms counted in each group.
6) The three I-toher totals are interpreted as the predominatingorganisms.
Microscopic examinations o' .he activated sludge should be made threetimes per week during peak flow periods. If a consistent trend of pre-dominating organisms is established during normal operating conditions,the frequency of examinations should be decreased to one time perweek.
Flow
4 physical measurement of the inplant flows is essential for true processcontrol. Without these flow measurements, h is impossible to compute hy-draulic and organic loadings, FIM ratios, air requirements, detention periods,recycle flows, clarifier underflows, or sludge wasting rates. Without the aboveparameters to regulate the treatment processes, the operator is left with onlya "seat of the pants" approach to process control. Without a measurement ofinplant flows, it is impossible to competently evaluate the operation of theindividual treatment units. The measurement of the plant flows also providesa Kazis for computing costs for billing, estimating chemical needs, predicting1:ie future need for plant expansion or modification, and evaluating theeffect of the plant effluent on 'he receiving steam. Reference to Figure IV24111 Indicate locations of typical Inplant flows that should be measured forprocess control.
IV-25
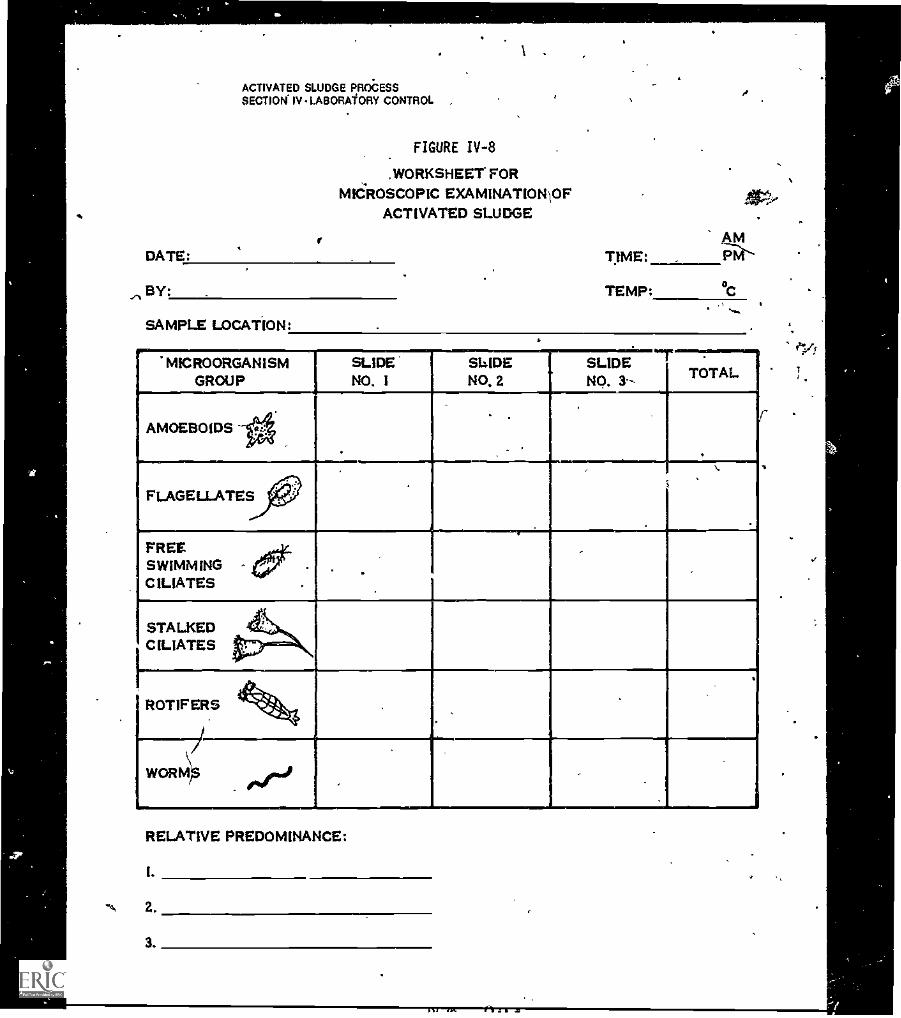
4P
ACTIVATED SLUDGE PROCESSSECTION. IV LABOROORY CONTROL
FIGURE IV-8
,WORKSHEET FORMICROSCOPIC EXAMINATIONIOF
ACTIVATED SLUDGE
DATE:
BY:
SAMPLE LOCATION:
TIME:AIM
PW.
TEMP: °C
MICROORGANISMGROUP
SLIDENO, I
SLIDENO, 2
SLIDENO, 3-
...rm..,TOTAL
AMOEBOIDS.
FLAGELLATES 0FREESWIMMING iii#7C ILIATES
.
,
STALKEDCILIATES
ROTIFERS Vs4.4-,[
/WORM
RELATIVE PREDOMINANCE:
Z.
3.
4.

How (o measureflow without aflew meter.
The level of thesludge blanketcan bemeasured withoptical orelectronicequipment.
Types ofblanket finders.
. ACTIVATED SLUDGE PROCESSSECTION IV LABORATORY CONTROL
in many of the smaller plants, only the plant influent flow and possibly theplant effluent flow are metered. In these cases, the opqrator will have tomeasure thp in-plant flows by other means. For Instance, a pumped flow maybe estimated by multiplying the pump capacity (gpm) times the minutes ofpumping time per day.
gpd = (gPm)(miniday)
Often, pump capacity may be estimated by measuring the volume of liquidpumped from or to a structure In a timed period. Noimmetereid flows into orout of the structure must be permitted during the test period. Metered flowsinto or out of a structure durilig the test must be taken Into account whencomputing the volume of liquid pumped.
(Area, sq. ft.) (Depth, ft.) (7.48 gal/cu. ft metered flow, gpmminutes
The metering instrumentation must be properly maintained and calibrated ona regular and routine basis to insure that their measurements are accurateand usable in process cbntrol and performance evaluation.
Sludge Blanket Measurement
Wittail the secondary clarifier, a separation of the liquid and solids takes place.The solids settle to the bottom of the clarifier while the settled liquid is dis-placed over the clarifier effluent weirs. If the settled solids are not removedfrom the tank at a rate equal to or greater than solids input by the aerationeffluent flow, a blanket of sludge will accumulate until eventually the solidsare washed out in the clarifier effluent flow.
The location of the sludge blanket in relation to the clarifier depth may bedetermined by various types of devices. Some are commercially availablewhile others must be improvised by the operator. Figure IV-9 shows severalvariations of sludge blanket finders. Th3 following are some of the differenttypes of blanket finders:
1) A series of air lift pumps mounted within the clarifier at various depths.2) Gravity flow tubes located at various depths.3) Electronic sludge level detectora light source and photo-electric
cell attached to a graduated handle or drop cord. The photo-electriccell actuates a meterrbuzzer, light, etc.
4) Sight glass findera graduated pipe with a sight glass and lightsource attached at the lower end.
5) Plexiglass core sampler.6) Some type of portable pumping unit with a graduated suction pipe or
hose.
2 0 r

ACTIVATED SLUDGE PROCESSSECTION IV -LABORATORY CONTROL
SIGHT GLASS
..
AIR LIFT PUMP
SLUDGE BLANKET INDICATORS
. FIGURE IV-9
IV -28
2 0 C
ELECTRONIC

1
Use the siudgeblot*thickness tocontort RASflow.
Run a profile todetermineaverage blanketthickness.
Ewe's;caution.
Dula methodto determineSS.
Test resultsvery often.
ACTIVATED SLUDGE PROCESSSECTION IV - LABORATORY C9NTROI.
6itermlning the sludge blanket depth in the secondary clarifier in conjunctionwith other measurements such as the Influent flow, MISS, SVI, and the RASflovkind suspended solids concentration provides valuable information thatcan be used to bontrol the RAS flow rates. Additionally, this test can be usedto evaluate the operation of multiple units, for instance the sludge blanket-depth In two clarifiers operating In parallel (both receiving flow from samoaeration basin) having equal RAS flow rates should be comparable. if thesludge blanket in one clarifier was rising while the blanket in the other clarifierwas falling, it could be concluded that the aeration tank effluent flow isunevenly, distributed to the clarifiers. A rising blanket may indicate an in,adequate sludge return rate, unbalanced distribution of aeration taniref fluentflow, inadequate sludge wasting rates, or a poorly settling sludge. The presenceof a poorly settling sludge could be verified with the SVI.valfie. Tdcorrect arising blanket, the operator first determines the reasons by a review of the labtest results, operational logs, and process dontrol parameters. After determining the possible reason for the increased blanket depth, the operatorshould then take the appropriate corrective measures.
Precautionary Procedures
The following precautionary procedures should )e followed in the per-iormance of the sludge blanket measurement: k
1) Select a measuring station located at a point where the blanketdepth represents an average of the entire blanket depth. Such alocation can be selected by running a profile of the clarifier's entireblanket depth. Thereafter, the selected location should al. ys beused.-
2)" The sludge blanket finding devloes must be used with care. Theelectronic devices mustbe lowered slow y until the blanket islocated.
3) Procedures and techniques must be uniform ...for all ope'rations andfor all measurements.
Centrifuge Test
Tile centrifuge test provides a quick and convenient method of roughly determining the suspended matter (SS) concentrations of the mixed liquor andreturn sludge. The centrifuge test results can by use4 to calculate a mass(solids) balance and to develop various graphs for cantrg1 and monitoring ofthe return sludge flow rates, adjustment of the sludge wasting rates, clarifierand aeration sludge detention times, and solidi dittribution ratios. How touse the centrifuge test results far controlling the activated Mudge process isdiscussed futher in Section 2.04, "SLUDGE QUALITY CONTROL."
Due to changing sludge settling affil compaction Oliaracteristicd, the resultsof the centrifuge test will often vary for similar suspended matter concentra-lions. The sludge characteristics as reflected by the 30minute settling testmust be considered when Interpreting or,using thetesults of the centrifuge test.
1\29 20.i
1'
1
o
Comparisons ofcentrifuge andSS tests mustbe made.
Plot SS andcentrifuge testresults on graphto obtainrelationship
Turbiditychecksoperational,performance.
ACTIVATED SLUDGE PROSSECTION IV %LABORATORY CONTROL
4
Precautionary Procaduyek,.
A generalized procedure is described below:1) Collect a representative sample.2) Thoroughly miircarnple and fill each centrifuge tube exactly to the
fuirmark. The sample must be thoroughly mixed before each pour-ing. It is recommended that no less than three tubes be run oneach sample.
3) Centrifuge samples for 15 minutes with the speed adjustment setat full speed. It is of utmost importance that the samples arecutrifuded for the same speed setting' each time to promote con-sistent compaction and meaningful test results.
4) Remove one tube at a time and read the amouni,of suspendedmatter concentrated in the bottom of-the tube. The result? Shouldbe recorded for future reference.
?5) Use the results of the centrifuge test\directly for control andmonitoring of the activated gludge process as described in Section2.04, "'SLUDGE QUALITY CONTROL" or convert to suspendedmatter concentration'as described below.
4
Suspended Matter Correlation,.
A correlation between the centrifugeste t yesults and the actual filteredsuspended matter concentration may bk made on a Oily basis by per-forming a centrifuge test and a suspended matter test on the same sampleof mixed liquor. A 5-day moving average of the spin ratio (SS doncentratiOnmg/I/centrifuge sludge concentration, %) should be used to minimize theeffect of any variation In this relationship. Another method sometimesused to correlate the results of the two tests is to plot the SS concentrationlcentrifuge sitifige concentration relationship on a graph. After thevarious points are plotted on the graph, a line of best fit is drawn as shownon Figure IV0-10. Since this relationship varies as sludge characteristicschange, the line of best fit must be periodically checked and corrected bycomparing the graph readout with the results of an actual filtered sus-
, pended matter test.
Turbidity.
Turbidity (eters to. the interferencg of light passage through water. Fineparticles of suspended matter hinder the passage of light by scattering andabsorbing the rays. Turbidity in the secondary effluent is chiefly.due to tio-logical floc that has carried over in the clarifier effluent.
The turbidity measurement of the secondary effluent is a quick and easymethOd of checking the operation and performance of the activated sludge,process, In recent years, some turbidity analyzers have been 'permanentlyinstalled at the secondary clarifier to continuously measure and indicate theclarity of the secondary effluent. A properly- operated activated sludge processgenerally produces an effluent with a thrbiditSr between 1.0 and 3.0 JTU(Jackson Turbidity Unit). An increasing effluent turbidity indicates an unfavor-able trend in process operation which sreld be' promptly investigated andcorrected.
IV300(:;

MEMEMMEMEMMEMMEMEMEM
NE UM
MOMEMMEMMEMMEMMEMEME
WM N
MMIN
MM
WMIIM
EM
WE E
W M
:
E M
WLIEEI
ieM
Mmumumli s
M M
W MOMIME =
E MEMINIMMOMMIMEMEMEM-
UM
WN M
I EMNELA O E =
EW
MMI U
MMEMMEMTIMMINNWOMMENN
N MEMMEMMOMMINIMIMMMIIM
MEMMETEMEMMEWMUMMI
=ME MIMMINIMMAMEMM
-
O MEN= MUM W
I IOfflEW
11M M -
11MEMMEMMEMEME MEW
-
MMEMEMMEMMEM
NM
kMI
MMIOME M
E EMM M
_
-

*
Recommendedwily ofexpensingannlay.
4.
ACTIVATED SLUDGE PROCESSSECTION P/ LABORATORY CONTROL
A photoelectric turbidirrleter with an automatic readout in either JacksonTurbidity Units (JTU) r Formazin Turbidity Units (FTU) Is the recommendedmethod of meaSurinarp.turbidity of the'secondary effluent..
Precautionary Procedures
When performing the turbidity test, the following procedures should befollowed in conjunction with the procedures outlined in Standard Methods.
1) Hold theturbidimeter test vial neat the top. The test vial must bekept clean, both on the inside and the outside.
2) Calibrate the turbibleneter using a standard in the range of theturbidity,expected.
3) Stir the spenple before pouring. Pour the sample slowly into thetest vial, being careful not to create or trap air bubbles.
4) Be sure the outside AA the test via: is dry before Inserting it Into'the turbidimeter.
5)0After allowing any air bubbles to escape, promptly read the results.
6) Replace any test vials that are scratched or damaged.
'Jackson Turbidity Units and Formazin Turbidity Units, although not identical, arealmost the same for practical purposeA.,
REFERENCES
APHAi AWWA, WPCF, Standard Methods for Examinatiorcof Water and Wastewater,14th Edition, 1976.
California Water Pollution control Association, Laboratory Procedures for Ope atorsof Water Pollution Control Plants, 1970. '
Kern, Kenneth D., et al., A field Study Training Program, Operation of Waste raterTreatment Plants,.(Chapters 6 and 14), Sacramento State College Departalintsii../Civil Engineering.
Ministry of the Enviornment Activated Sledge Process Anaylses and InterpretationWorkshop Manua Training, Certification, and Safety Section, Toronto, Ontario,
'M4V LP5.
New York State Department, of Health - Laboratory Procedures for WasteWaterTreatment Plant Operators, Health Education Service, Albany, N.Y.
U.S. Environmental Protection Agency, Technology .Transfer liarldbook foAnalytkalQuality Control in Water and Wastewater Laboratories, AnalOcal Quality ControlLaboratory, National Environmental Research Center, Cincinnati, Ohio, June, 1972.
The Texas Water Utilities Association, Manual of Wastewater Operations.
Water Pollution Control Federation, Striipliiied Laboratory Procedurts for WastewaterExamination, Publication No.18, 1971.
A
W.32 2
\

TRICKLING FILTER PROCESSTABLE OF CONTENTS
Topic
SECTIOi TROUBLES pOTING1.01 INTRODUCTION1.02 TROUBLESHOOTING GUIDES
No. 1 Filter FliesNo. 2 - Odors
- No. 3- PondingNo. 4 - Effluent Suspended SolidsNo. 5 Freezing
Page
1.1
1.2
1-3
1.5
1-6
1.13
SECTION II- PROCESS CONTROL2.01 INTRODUCTION 11.1
2.02 OPERATIONAL GUIDES 11.1
"No. 1. Trickling Filter 11.2
No. 2 Seconder, Clarifier 11.5
No. 3-Pumping Equipment and Piping 11.6
. 2.03 PERFORMANCE AND EVALUATION 11.7
Review of in,Plant Recycled Flows 11.7
2.04 PROCESS CONTROL 11.9
Staging 11.9
RecirculationSludge Remo41 11.12
2.05 LOADING PARAMETERS 11.14
Organic LoadingHydraulic Loading
11.15
0-16Surface Overflow Rate 0-17.
2.06 OPERATIONAL PROBLEMS 11.18
Filter Flies 11.19
OdorsPonding 11.21
High Effluent Suspended Solids il23Freezing 11.24
SECTION III - FUNDAMENTALS
3.01 INTRODUCTION 111.1
Definitions 111.2
3.02 PROCESS DESCRIPTION 111.3
Rotary Distributor 111.3
'Fixed-Nozzle Distributors 111.6
Dosing 111.6
Media 111.6
Underdrain 1119
1Ventilation 1040Natural Ventilation III 10Forced Ventilation 111.10
F,al Sedimentation".
111.10
A 212

IMP
S
TRICKLING FILTER PROCESSTABLE OF CONTENTS (continued)
.,
3.03- TRICKLING FILTER CLASSIFICATIONLc..Rate Trickling FiltersHigh-Rate Trickling filters
AeroFilterBioFilterAccel( Filter
RoughingRate Trickling Filters
SECTION IV LABORATORY CONTROL
4.01 INTRODUCTION IV-4
4.02 LABORATORY SAMPLING AND TESTING PROGRAMGrab Samples IV1Composite Samples IV-3Laboratory Control Program IV-4
LowRate Trickling Filter Process IV4-tlighRate Tickling Filter Process IV-4Roughing Filters/Biological Towers,.. ---* IV6
4.03, LABORATORY CONTROL GUIDESBiochemical Oxygen DemandChemical Oxygen Demand
_Soluble COD and SODSettleable MatterTotl Suspended MatterNitrite NitrogenNitrate NitrogenAmmonia NitrogenTotal PhosphorousDissolved OxygenHydrogen Ion Concentration
'1V6IV-7IV-8IV-9IV-9
IV-1011/-11
IV12IV-12IV-13IV-13IV-14
Temperature IV15Flow 1V-15
213
.0"

4
4
4
f
I TRICKLING FILTER 'PROCESSLIST OF FIGURES
Figure No: 4 Description Page11.1 Typical Trickling Filter Trend Plots 11.8
11.2 Staging of Fitters 11-10
1111 Typical Trickling Filter Process 111-1
111.2 Typical Trickling Filter in Cross Section 111.4
111.3 Rotary Distributor 111.3
111.4 . Fixed-Nozzle Distribution"System 111-7
10-5 Redwood Lath-Media 111.8
111.6 Plastic Media 111-9
111.7 Low-Rate Trickling Filter Layout. 111.12
$ 111.8 High-Rate Trickling Filter Layoilt 111.14
Ill) Trickling' Filter Variations 1106111-10 Typical Rgughing Filter Installation 11147 *,
411.1 1.
Oxidatiorr(Biological) Towers 111.18
1V -1 Wastewater Sampling Guidelines IV2IV2 Sampling and Testing Program for Trickling Filter 1V5
,
.
.
A
.
4
0.
. o
214/ I
44
.
4
I
J
r
z
4..
ri
4
,
4.
TRICKLING FILTER PROCESSLIST OF TABLES
F
Table NO. i .page`"'
11.1 tilde to Successful Process Control 11.1
111.1 Fl itpr Classification and Characteristics 111.11.,
,h
..
.:----1'
/4
.....--..
**.
I
.
I.
;
4
4.
;
c,
va
..t.
(17\.._ ,
4
a,4
1
"1
21.5
.
A
s,
ts.
.

Select themeasure withleast adverseeffect.
Know theprocess.
TRICKLING FILTER PROCESSSECTION I. TROUBLESHOOTING
1.01 INTRODUCTION
This section of the manual presents troubleshooting prdcedures for solvingthe common operating problems experienced in the trickling filter process.With each problem, or observation, is included a list of probable c)uses,procedures to determine the cause, and the suggested corrective measureslisted in the order to be considered. You, the operator, must deterenine andselect one or more of the corrective measures that will restore the processto an efficiency level which will produce the best final effluent quality. Inorder to evaluate the problem and select the best corrective measure, youmust be thoroughly familiar with the trickling filter process and how it fitsinto the Overall treatment plant operation. In addition, you must be familiarwith the Influent wastewater characteristics, plant flow rates and patterns,design and actual loading parameters, performance of the overall plant andindividual processes, and current maintenance procedures.
'1.02 TROUBLESHOOTING GUIDES
There are five problems that frequently occur in the operation of a tricklingfilter process. These problems are listed below and are referenced to thetroubleshooting guides which are presented on the following pages:
INDEX TO TROUBLESHOOTING GUIDES
TroubleshootingGuide No. Problem Indicator
t
1 Filter Flies2 Odors3 Ponding4 High Effluent Suspended Solids5 Freezing

217
Obe
TRICKLING FILTER PROCESS
TROUBLESHOOTING GLIDE I Filter Flies
OBSERVATION PROBABLE CAUSE NECESSARY CHECK REMEDIES REFERENCES
1. Filter Flies.a.Gnatsized moth-like
flies.
b. Dark brown, wormlikelarvae in filter slimegrowth.
irt.
S.
Poor distribution of waste.water, especially along thefilter wall.
Hydraulic loading insufWent to keep fly eggs andlarvae washed from filterbed.
.
'
I.
t.
Visually check.
. .
Calculate hydraulic loading.Hydraulic loadings greaterthan 200 godisq. ft. areusually required.
;
.
0
1) Unclog spray orifices ornozzles.
2) Provide orifice openings atend of distributoi arm tospray walls or open dumpgates slightly for a sprayeffect on filter wall.
1) Prevent completion of thefilter fly life cycle In theorder of the followingremedies:a) Increase recirculation
rate.b) Flood Filler for several
hours each week duringfly season or,
c) Chlorinate filter influentfor several hours eachwc.ek maintaining a 1 to2 mgfl residual at thedistributor outlet.
d)Spray filter walls andother areas where fliesrest with a reaklualiyPeinsecticideif not pro-hibiled by State or localregulatory agencies. DONOT spray surface ofmedia.
pg 119
pg II19
pg 11.19
..
t
.
,i i1

TRICKLING FILTER PROCESS
TROUBLESHOOTING GUIDE 2- ODORS
OBSERVATION PROBABLE CAUSE NECESSARY CHECK ------- REMEDIES REFERENCE3
1. Odors;(Anaerobic decompositionwithin the filter.)
A. Excessive organic loading.a. Industrial wastes.
_
1. Calculate organic loading.a. Check industries for
unusual waste discharge.
...-
1) Utilize a commercial mask-ing agent while making theappropriate corrections.
2) Encourage aerobic condilions in pre-treatmentunitstry pre-OhiOdnatiOn,aeration, or recirculationduring low nigheflows.
.3) Enforce industrial wasteordinance.
4) Improve operation of pa, Mary sedimentation tanks.
5) Increase recirculation rateto dilute organic strengthand improve oxygentransfer,
8) Chlorinate filter influent forfor several hours each dayduring low flow maintaininga 1 to 2 regil residual atdisttibutor Outlet.
7) If design loading is beingexceeded. Plaid sxPans ionmaybe required.
pg 1115 A 11.20
pg 1140
pg 119
pg II-20
pg 11.16 & ii.7
.
219 220

,
i
221
T.
4
. 1,.
...
.- .
TRICKLING FILTER PROCES$
TROUBLESHOOTING 0=E 2- ODORS(continued)
.
OBSERVATION 7 - -PROBABLE CAUSEI
a
I
NECESSARY CHECK .. REMEDIESI
REFERENCES
.
.
0
- .
i'
B.V oor Ventilation../..---'-4
C.4Poor housekeeping.
,
.
-'-.1/4.
.
1. if provided see that vent. Pipes are clear in filler. 1
:.
2. Check underdrain systemis not obstructed or flowingmorelhan half full.
3. Check filler media voidsare not filled with biologicalgrowths.
/ r
-
1. Visually check.
1) Unclog vent pipes.
2) Remove all debris fromfiller effluent channel andflush obstructive materialsfrom underdrain.
3.1 If underdrain system isW 'flowing more than half full,, reduce filter recirculation
if possible.
4) Improvise a mechanicalmeans of improving, venti-
"4 lation if natural ventilationis inadequate. .
.5) Increase circulation to
flush oul e excess No-logical gr (!s. .
1) Remove all debris fromfilter media surface.
2) Wash down distributorsplash plates and theside walls'above the media.
pg 111.10
pg 111-9
.
pg 111.10
pg 114
pg 11.2
...
pg 114
.
TT,
-
.
.
I
r. ANar.rIF P., s4
a
I

1
TRICKLING FILTEll PROCESS
TROUBLESHOOTING GUIDE 3- PONDING1
OBSERVATION PROBABLE CAUSE NECESSARY CHECK REMEDIES..
REFERENCES`
1. Pending of wa..iritNoverflier media.
1r
.
'W- t
A.
IiB.
C.
.
.
Excessive biologicalgrowth in media voids.
.
---
.
1
I
Media is, nonuniformlysized, disintegrating ortoo small.
\,_
Poor housekeeping.
t.
),
t.
t.
4
Check records for increassin organic loading and/ordecreases in hydraulic14ading or If dosing inter.vals has boon decreased.
.
----7--,,....._t 0
Visually inspect.
Visually inspect.
1) Loosen surface layer ofrock, media.
2) Flush the area with highpressure stream of water.
3) Increase recirculation.
_4) Dose the filter influent withChlorine for 24 hours toobtain 12 mgll residual atdistributor outlet.
r-5) If possible, flood the filterfor24 hours.
6) If possible, shutdown TF., dry media and wash out.
1) Dry out filter and checkmedia. Replace nonual-totally sized, or damagedmedia. "s
.`,1
1) Remove all leaves, paper,sticks, and otherdebris accumulating ' onfilter media surface.
.
pg Illt
pg I121
pg 114
pg 11-21
pg 1121 & III-9
pg 11.21
.
..
p 1121 a 1114.
pg112
223224

03.
SN. ...."
9.
$
\ TRICKLING FILTER PROCESS
. . -.TROUBLESHOOTING GUIDE 4- HIGH EFFLUENT SUSPENDED SOLIDS
,,,
0)
225
/
OBSERVATION PROBABLE CAUSE NECESSARY CHECK REMEDIES REFERENCES
.
1. Increase in Clarifier Effluent Suspended Solids.
.
. ..
A.
B.
C.
Excessive sloughing fromfilter.
.../
Denitrification in clarifier.
Final clarifier hydraulicallyoverloaded.
v
1. Check seasonal changesthat would affect micro-organisms.
2. Check organic loading.a. industrial wastes.
.
.
i. Checi. to see if f Ube effluent a nitrified and sludgefloats in clumps.
1. Calculate clarifier surfaceoverflow rate. (Should notexceed 1200 gpdfsq. ft. atpeak flow.)
1) Wait for season to change°Thy polymer addition.
1) If there is a high rate ofloading, decrease by usingmore filters, if available.
2) Enfoice industrial wasteordinance.
3) Increase clarifier under-flow rate.
4). Plant expansion may benecessary.
1) Increase clarifier under-flow rate.
1) If due to recircurattonreduce recirculation rateduring peak flow periods.
2) Additional clarifiers maybe required.
.pg 11.23
.
pg 1115
,... ,
pg 11-23
.
pg 11-12 .
pg 1142 & 11.23
.
pg II-17.11-7 & 11-9
pg 11-17
i
... J22C
i

,
I1,
Yr
s..
.
TRICKLING FILTER PROCESS'
TROUBLESHOOTING GUIDE 4 - HIGH EFFLUENT SUSPENDED SOLIDS (continued) .
0.
1
.
OBSERVATION PROBABLE CAUSE NECESSARY CHECK REMEDIES REFERENCES
...
D.
E.
Equipment malfunction infinal clarifier.
Temperature currents infinal clarifier.
1. Check for broken sludgecollection equipment.
2. Check for broken baffles.
3. Check for uneven flop.over effuent webs. ,
1. Make temperature survey. of the clarifier using a
temperature probe on a DOmeter.
...
/..
1)
2)
1)
Replace or repair brokenequipment.
Adjust effuent weirs to anequal elevation.
Install baffles to stopshortcirculting.
. .,
....."
..
,,
pg 1113
pg 1113 &
pg 1113
11.5
.....,.
22'7 228
.
0

r.
CO
229
0,4
TRICKLING FILTER PROCESS
TROUBLESHOOTING GUIDE 5- FREEZING
OBSERVATION PROBABLE CAUSE NECESSARY CHECK 1 REMEDIES
.
REFERENCES
1. Freezing.
.
A. Low temperatures. 1. Check atmospherictemperatures.
1) Decrease recirculation..
2) Operate twostage titers in
'pg 11-9
pg 11-9
. Parallel.
3) Adjust orifices and splashplates for coar-A-Way.
pg 11-24, Ma& 111-6
4) Construct windbreak.
5) if using intermittent dos-ing, open bleeder valve onthe distribution main.
6) Partially open dump gatesat outer end of distributorarms to provide streamalong retaining wall in-stead of a spray.
pg III.6
pg 111.6
7) Cover pump sumps anddosing tanks.
i
8) Manually remove iceformation.
4
. 41

TRICKLING FILTER PROCESSSECTIO: I .TROUBLESHOOTING
REFERENCES
Environmental Protection Agency, Technology Transfer, Process Desige Manual forUpgrading Existing Wastewater Treatment Plants, October, 1974.
Kc:ri, Kenneth D., et al., A Field Study Training Program, Operation of WastewaterTreatment Plants, (Chapter 6), Sacramento State College Cspartment of CivilEngineering.
Lohmeyet, George T., Trickling Filters and Their Operation, Water & Sewage Works,September, 1958.
New York State Departpent of Health, Manual of Instruction for Sewage TreatmentPlant Operations. ,
The South Carolina Water and Sewage Worts Assowation, Correspondence CourseManual for Sewage Plant Operators, Class C, 1962.
The Texas Water Utiliti 4.ssociation, Manual at Wastewater Operations, (Chapter12), 1971.
Water Pollution Control Federation, Operation of Wastewater Treatment Plarits,Manual of Practice No. 11, 1970.
..,
2j1I.9

4
Importance W sproperlycontrolledoperation.
Acceptableranges aregiven herein.
TRICKLING FILTER PROCESSSECTION II PROCESS CONTROL
2.01 INTRODUCTION
The trickling filter process is reliable and can treat shock organic loads. Itrequires much less monitoring and control then the activated sludge process.However, proper operation and control is still required to achieve peak performance and to avoid operational problems e4uch as ponding, odors, flies,and freezing. Table 11.1 presents guidelines to ach'tving successful processcontrol.
The operating parameters given in this .section are intended as acceptableranges to guide the operator ip achieving operational control at his plant.
Operation and control of a trickling filter process should be based on its response and performance. The success or failure in achieving the best possibleperformance from the treatment process is dependent on 6.1e operator.
TABLE II-1
GUIDE TO SUCCESSFUL PROCESS CONTROL
aWO
REQUIREMENT REFERENCE
1. Sound operational and preventivemaintenance measures.
Section 2.02,OPERATIONAL GUIDES
2. Laboratory monitoring Section 4.02,LABORATORY SAMPLING AND r\,..\ITESTING PROGRAM
3. Accurate, uptodate records. Appendix A,OPERATIONAL RECORDS
4. Evaluation of operational and laboratorydata.
Section 4.03,LABORATORY CONTROL TESTS
5- Application of data evaluation to adjustmentof the process.
Section 2.04,PROCESS CONTROL
6. Troubleshooting problems before theybecome serious.
Section 1.02,TROUBLESHOOTING GUIDES
4
2.02 OPERATIONAL GUIDES
Operational guides are provided on the following pages to aid the operator inestablishing routine operational procedures for his trickling filter process.
Performance of the routine oplAtional procedures is not complete without acompetent preventive maintenance program. Every item of operating equip.ment requires frequent attention with particular emphasis on lubrication andother preventive maintenance requirements to ensure troublefree operationand minimum maintenance costs. A good preventive maintenance programhelps to improve process control by ensuring that the equipment remainsoperational.
11.1
2 32

=A)
233
TRICKLING FILTER PROCESS
OPERATIONAL GUIDE 1- TRICKLING FILTER
r
EQUIPMENT SUGGESTED STEP PROCEDURES DETAILS FREQUENCY REFERENCE
A. ROTARY DISTRIBUTOR 1. Check that distributor rotates smoothly. la) Visually Observe. Daily pg 111.3
. 1b) Jumpy operation could denote bearing- damage and/or mallunction of pumps. :.
2. Clean clogged orifices. 2a) Shut off the flow to the filter. Daily pg 1113
2b) WAIT for arms to slop rotating before
. . Proceeding.
2c)lite CAREFUL when walking on medialsurface --it is extremely slippery.
2d) ReMove o "*ctive materials fromorifices.
2e) Open end dump gates and flush thedistributor arms.
21) Return unit to normal service.
3. Hose slime growths off splash plates. 3a) Excess growths can affect uniformspreading action of plates.
Daily pg 111-3
4. Check oil in bearing assembly for watercontamination.
4a) Water contamination denotes a badlyworn or defective seal.
'.4b) A leaky seal should be repaired immedl.
ately to avoid bearing damage.
5. Maintain bearing assembly and driveunit if so equipped.
5a) Follow manufacturer's instructions.
5b) A competent preventive maintenanceprogram is essential for good operation.
6. Adjust guy rods. 6a) Should be adjusted with seasonaltemperature changes to keep distitibtfor arms leveled.
sensup,oy pg 1113
7 Winter operation (Freezing conditions). 7a) See Troubleshooting Guide No. 5. 0911-24
...
234
s

/ TRICKLING FILTER PROCESS
OPERATIONAL GUIDE 1 TRICKLING FILTER (continued)
EQUIPMENT SUGGESTED STEP PROCEDURESr-i DETAILS
... .FREQUENCY REFERENCE
B. FIXEDNOZZLE DISTRIBUTION SYSTEM
. '
C. DOSING SIPHON
1. Clogged nozzles.
.
2. Flush all dad ends in the distributionpiping.
3. Winter operation (Freezing conditions).
1. Check operation.
2. Clean and lubricate float-actuatedcounters, etc.
3. 'Wash down tank walls. .,
---.,..... _... '. lean tai4nd Inspect piping apparatus.f(
5 Winter operation (Freezing conditions).
la) Shut off flow tolateral.
lb) Be CAREFUL when walki on mediasurfaceit is extremely ppery.
to) Disassemble and clean clocked nozzles.
td) Open valve, or remove nozzle, at end oflateral and flush obstructive materialswhich may be in the4lateral.
..
le) Return toservice.
2a) May net be possible with some systems./
3a) See Troubleshooting Guide No. 5.
ta) Observe a dosing cycle. If it is not work-ing properly, check for a clogged siphonvent or a leak in the piping.
2a) Follow manufacturer's instructions.
3a) To prevent odors and unsightly accum-ulation of grease and slime.
4a) Replace badly corroded piping.
5a) Cover tank to minimize loss of heat.
,
Daily
.
,Weekly
1
Daily
Daily
Biannually-..
.
pg III.6
,.
pg III-6
.
.

37
1
TRICKLING FILTER PROCESS
OPERATIONAL GUIDE 1- TRICKLING FILTER (continued)
EQUIPMENT SUGGESTED STEP PRO)CEDURES.) DETAILS ' FREQUENCY REFERENCE
D. 'MEDIA
E. UNDERDRA1N
':\/fr.
- ,
F. WALLS
G. HYDRAULIC LOADINGON FILTER
1.
2.
1.
1
--I.
1.
/
Vilually check...
Remove all debris from filter surface.
Inspect.
.
'4
Wash down side walls aboie media.
Control recirculation rates for optimumperformance.
la) Check for any indication of pending,filter flies, and windblown debris.
la) When needed, flush out obstructivegrowths and debris.
lb) Remove any obstructive materials ineffluent channel.
,
1c) Underdrain conduits and effluent chart.nel should not be flowing more thanhalf full.
la) Review records to determine the lowestrecirculation ratio yielding good processperformance (based on7EIOD or COD ofthe final effluent).
lb) The recirculation ratio should be groatenough to avoid the Problems of pond.114 odors, and filter flies.
1
Daily
Daily
Daily
...
i
pg 1148
1--
pg 1114 & 111.10
pg II 7, If 15 & II 16
,...-:---./ -
#

t
UI
OPERATIONAL GU DE72-SECONDARY CLARIFIER
TRICKLING FILTER PROCESS
E0141016T , SUGGESTED STEP PROCEDURESN.-
/DETAILS FREQUENCY REFERENCE
A.
,
TANk
.
1. Inspect for proper operation,.
?. Perform daily wash down.
3. Maintain sludge collection equipmentand drive units.
4. inspect battles and effluerifweirs.
.
5. Check sludge withdrawal rate andfrequency.
/
la) Mechanical equipment.
lb) Presence of floating sludgeseeliroubleshooting Guide No. 4. .
2a) Hose down the influent channels, tankwallsespecially at the water line, el.fluent weir and launders, effluent chewnet, and sight sludge box or.hopper.ifsq provided.
N
'3a) Follow manufacturers instructions.
., ,
4a) Maintain baffles In sound Condition.
4b) Maintain effluent weirs at an equalelevation.
5a) Sludge should be removed before it becomes septic and floats to the surface,preferably on a continuous basis.
4...
.
Twiceishift
Daily
.
,
Daily
Twice/shift
,i
pg11.12 &II.23
.
polio
pg 11-12 k
.
239I 240

11.
4'
TRICKLING FILTER PROCESS
OPERATIONAL GUIDE 3- PUMPING EQUIPMENT AND PIPING
"11
EQUIPMENT SUGGESTED STEP PROCEDURES 'DETAILS FREQUENCY REFERENCE
A. PUMPS 1. Check operation of the pumps andmotors.
.
.
iI 2. Alternate pumps in service.
3. Maintain pumping units.
4. Fully open and close all valves.
.
5. Check operation of air vacuumlreliefvalves, flow meters. eat.
la) Check for excessive vibration. unusualnoises, lubricant leakage, andoverheating.
16) Check oil reservoir levelif so equipped.
1c} Check oil feed rateif so equipped.
1d) Check packing or mechanical sealsmake adjustments per manufacturer'sinstructions.
le) Check for proper position of suctionand discharge valves.
3a) Follow manufacturers instructions.
4a) Make necessary adjustments or repairs.
4b) Maintain valves and operatoTs accordingto, manufacturer's instructions.
5a) Maintain according to manufacturersInstructions.
Twice/shift .
i
?
Daily.
Monthly
.
Weekly
..
.....,
11
*
4,y

Competentprocess controlIncludes
svaluellon ofprocessperformance.
TRICKLING FILTER PROCESSSECTION II PROCESS CONTROL
2.03 PERFORMANCE EVALUATION
Evaluation of process performance is an essential part of competent processcontrol and operation. The evaluation is helpful in determining process response to various modes of operation, developing performance trends, andidentifying the causes of operational problems. For trickling filters, perform-ance evaluation consists of reviewing the COD, BOD, suspended solids, andammonia nitrogen removal efficiencies in relationship to the mode of operastion loading parameters, and plant recirculation flows. The review andapplication df lab testing results is further discussed in Section IV "TRICKLINGFILTER LABORATORY CONTROL" and "APPENDIX A"
Trickling filter performance is affected by many factors, st4 as hydraulicand organic loadings, depth and physical characteristics of the raidia, methodof wastewater distcibution, ventilation, characteristics of applied wastewater-
'Many factors (temperature, pH, toxicants, etc.), and the hydraulic loading upon the subse-affect filter quent sedimentation unit. An effective means of reviewing your plant per-performance. formance is to maintain daily charts or graphs ref iedting such data against
time. The charts presented in Figure )1.1 serve as visual aids in identifying theoptimum control parameters and make any trends or changes immediatelyevident. The preparation and use of these trend charts are discussed furtherin "APPENDIX A"
A
Conclusions reachId during the process evaluation are then applied to theadjustment of the process (selection of recirculation rates and modes ofoperation) for efficient and economical operation. Whenever possible, onlyone process adjustment should be made at a time to allow sufficient timebetween each change for the process to respond and stabilize.
Importance ol Complete and accurate records of all phases of plant operation and maintop.complete and ance are essential for accurate performance evaluation and process control.accurate The preparation of operational records is discussed further in "APPENDIX A.records.
Reoya led flows "--.may causeoverloading.
A
,- Review of InPlant RecycleciViow
r.
In evaluating the performance tithe process or solving problems, a carefulconsideration F. OM be given to ail inplant recycled flows. Often, inplantrecycled flows are the cause of &genic or hydraulic overloading. The sludgeprocessing operations may return decants from digesters, thickeners, centrifuges, or vacuum filters. The waste backwash water from effluent sand f litre.tlon processes may also cause hydraulic overloading or other process controlproblems, The recycled flow from Improperly loaded and operated sludgeprocessing units may account for as much as' 25 percent of the total plant Norganic loading. Usually, the majority of recycled flows are returned to theprimary sedimentation units whete it is hoped organic solids will settle out.In mdst,cases this practice is themajor cause of overloading secondary pro- I
cesses due to poor removal of solid the recycled flows sent to the primary _Isedimentation units. ts
:D.
The additional ioading then results In a grea,er sludge production, and subse-quently an Increased loading upon the sludge processing operation. In thetri*'.1ing filter process, excessive CODOr BOO loadings will eventually reduceeffluent quality and cause anaerobic conditions,to occur in the filter.
II72 43
,
/%,

3.00
az200
0 lk
a a.00
0
0125
Lk0 C.Z 0 1000
0C
0 75
2
50100
1
aridaEMMEN ME
s
,
.
1
i
,
i
75
50
251 00
75
1.1
50
ase
0 15DAY
20 25
HIGH RATE TRICKLING FILTER[Five -day moving average trend plots)
FIGURE 110
TYPICAL TRICKLING FILTER TREND PLOTS

Minimise theeffectcfrecycled flows.
Sidedoperatingparameters forbestperformancewith Mast cost.
Staging Mars tooperating filtersin series.
Moditledconcept.
Why isrecirculationused?
TRICKLING FILTEP PROCESSSECTION II. PROCESS CONTROL
Some guidelines triat will reduce the effects of recycled flows on the tricklingfilter process incl 'le the following:
1) Add flow continuously or during low night flows to avoid shock loads.2) Improve efficiency of sludge handling process.3) Utilize a lagoon or drying bed for poor quality decants from sludge
processing operations.4) Avoid pumping excess water in underfloor fed to sludge handling
processes.5) Aerate or pretreat recycled flows to reduce oxygen demands.
2.04 PROCES3 CONTROL
Operational control of the trickling filter process primarily consists of reviewingoperating logs and lab test results to select the proper operational parameters(recirculation rates, hydraulic loading) and modes that yield the requiredperformance at the least cost. The plant Operator must be cost consciousand concerned with the conservation of power, and the production of effluentthat will meat discharge requirements. For example, to conserve power andminimize operat.cnal costs, the operator should select and utilize the lowestrecirculation rate that will provide the required performance, but not result inponding, odors, filter flies, or other problems.
Staging
The term Staging refers to the operation of tricking filters in series. Thepurpose of staging is to produce a higher quality effluent by using the firstfilter in the series as a roughing filter.
An approach that has been used successfully in England involves alternating:le filters, that is, the leading filter is alternated between the two filters
operating in series. This practice is referred to as Alternating Double Filtration(A.D.F.). The primary advantage of this approach is that the slime iickness iscontrolled in both filters by the alternate loading which tends to recce clog-ging problems. Unless the filter process is designed to operate with A.D.F.,this flexibility in the operational mode is usually non-existent. Oat ically themode of staging is dictated by design rather than operation, control Asshown in Figure 11-2, both filters (stages) are generally constructed the samesize with several options for recirculation incorporated into the design. Theselection of the recirculation scheme should be based upon process perform-ance. Use the scheme which produces the best effluent.
Recirculation
Recirculation -; practiced in all highrate trickling filter plants and to somedegree tn lowrate trickling filter plants. Recirculation is utilized in highratetrickling filter plants basically to maintain a constant hydraulic loading toprevent clogging the voids in the filter media. in the lowrate trickling filterplant, recirculation may be utilized to maintain a sufficient dosing rate duringlow flows. Various recirculation arrangements are shown on Figure ti2.

ALTERNATE RECIRCULATIONRECIRCULATIONrinsINSININ
IMMO MUM 61,11111111s MR MIR INIOMINIII MEM= ON 1
j1.1wl I
II
11INTERMEDIATE
!OPTIONAL!
iI
_I I
1PRIMARY
13P-CLARIFIER
A P
FIRST STAGETRICKLING FILTER
SWOGE
FIGURE 11-2
STAGING OF FILTERS
SECOND STAGETRICKUNG FILTER
SECONDARYCLARIFIEP
SLUDGE
0 5=4 XrZ z=:13
2141/
mcp
1.0
1 F4
8
EFFLUENT
2 4 r.1A
TRICKLING FILTER PROCESSSECTION 11 PROCESS CONTROL
Consider When selecting the recirculation flow scheme and rate, the hydraulic loadinghydraulic on the filter and affected clarifiers must be considered as well as the hydr4ulicloadings. limitations of the distribution and underdrain systems. As a rule of thOlb,
the underdrain conduits and effluent channels should not flow more thanonehalf full.
Base control onniter responseandperformance
Recirculationcan minimizeoperationalproblems andImprove filterperformance.
Usually, the recirculation ratio has a greater effect on filter performance thanthe recirculation flow scheme. Recirculation ratios may Iv defined as parts ofrecirculated flow per part of raw wastewater. flow. TherefOre. a ratio of 0.5 isequivalent to one half gallon of recirculated flow for each galion of wastewaterto be treated. Although some experimentally based equations have beendeveloped to calculate the emount of (recirculation needed, it is recommendedthat operational control be based on filter response and process performance.
In highrate trickling filters, recirculation ratios (R/Q} usually range from 0.5 to4.0 with higher ratios considered to be economically unjustifiaole. Commonengineering practice is to design the highate trickling filter process for ratiosof 0.5 to 2.0. Trickling filters utilizing synthetic media employ recirculation asa means of maintaining a minimum wetting rate, i.e., a hydraulic loadingigpm/sq ft) which will maintain biological growth throughout the media depth.The recirculation ratio is determined as shown below:
ExamPle Calculation
A. Data RequiredI. Recirculation flow = 0.2 mgd2. Raw wastewater flow w 0.4 mgd
B. Determine the recirculation ratio (R/O).
RIOrecirculation flow
raw wastewater flow
_0.2 mgd
0.4 mgd
= 0.5I
Recirculation is often utilized to improve filter performance and to minimizeoperational problems. Some of the advantages of recirculation include thefollowing:
1. Maintains biological growth throughout synthetic media depth.2. May improve operation of primary and final sedimentation units during
low flow periods by reducing septicity.3. Dilutes high strength or toxic wastes to make them treatable.4. Minimizes hydraulic and organic loading variations.5. .improves distribution of the wastewater over the filter surface.6. Minimizes odors, ponding, and filter fly breeding by increasing hydraulic
loading to encourage continuous sloughing and reduce slime thickness.7. Prevents biological growth from drying out during low flows.
;
Be aware ofpossibleadverse effects.
Know yoursystem.
Trick lira filtersludge requiresthickening.
Withdrawsludge beforeIt bec4messeptic.
Increasesludgewithdrawalduring periodsof heavysiough
Sludge removalfrequency isImportant.
Sludgecharacteristicsand production.
TRICKLING FILTER PROCESSSECTION II. PROCESS CoNTRoLN.
Although the advantages of recirculation erally outweigh the disadvantages, recirculation may. result in the follolving adverse effects:
1. Reduces the wastewater temperfure and therefore lowers the rate ofbiological activity. in extremely cold climates, recirculation mayincrease the potential for ice formation.
2. Recirculation through a sedimentation unit at rates exceeding hydrau-lic design limits may reduce efficiency.
3. Increases operational costs due to higher pumping rates.4. If excessive, it may decrease the organic removal efficiency of the
process.
The operator should be familiar with all the modes of recirculation availableto him at his plant. Some of the common modes of recirculation are shown onFigure 11-2. The mode most favorable to your particular operation should beselected. Operating costs should also be considered in the selection ofrecirculation modes and rates.
Sludge Removal
Underflow (secondary sludge) from the final sedimentation units is oatenreturned to the primary sedimentation units for resettling with the primarysludge. This method is commonly practiced to thicken the secondary sludgeand reduce the volume of water pumped to the processing or sludge disposalfacilities. The sludge withdrawal from the final sedimentation tank may beintermittent or continuous. Consideration to remove the sludge before itbecomes septic in the sedimentation tank should be made. Usually, visualinspection of the sludge characteristics is sufficient to determine if the with.drawal rate should be increased or decreased. Due to periodic sloughing ofbiological growth from the filter media, the amount of solids setfiing in thefinal sedimentation unit will vary. Sludge from a low-rate trickling filter isrelatively stable, and periodic removal at 3 to 24 hour intervals, dependingupon operational conditions, is usually sufficient. During warm summerweather and periods of heavy sloughing, removal at 3 to 6 hour intervals maybe required. Sludge from a highrate trickling fitter has a higher oxyben de-mand, and therefore, it must be removed from the sedimentation tank withina short time, preferably on aiontinuous basis.
Occasionally, sludge is transferred directly to digestion units, and the fre-quency and rate of pumping must be set to maintain reasonable sludgeconcentrations without permitting septic conditions to develop. Rising andfloating sludge would indicate that the frequency of pumping should be
-increased, or that the continuous pumping rate should be increased.
Trickling filter sludge is usually a dark brown, humus material with little or noodor when aerobic. Generally, trickling filters treating domestic wastewaterproduce 50C to 7:30 pounds or settleable solids per million gallons of waste-water treated. The sludge produced by a low -rate filter usually has a total drysolids content of one to seven percent after settling in the sedimentationtank. The sludge produced by a high-rate filter is lighter and fluffier with atotal dry solids content ranging from onhalf to three percent.

,
SImpltmethodto Wools%stodgepumpingfrequency.
I
4
v
TRICKLING FILTER PROCESSSECTION II PROCESS CONTROL
There are several methods of estimating the volume of sludge that must beremoved from a trickling filter process. The simplest method is based on asettleable solids test (Imhoff Cone Test) of a composite sample' of the filtereffluent. The volume of sludge to be removed may be estimated as follows:
Example Calculation
A. Date Required4. Filter effluent settleable solids = 4 mill
(Average of a series of grab samples)2. Flow to clarifier = 900,000 gpd
B. Determine the volume of sludge in gallons per day.
=(a) Sludge vol., (Settleable Sol., mIII)(flow, gpd)1,000 m1/Igpd
(4 m1/1)(900,000 gpd)1,000 m1/I ,
= 3600 gpdOR
(b) Sludge vol., = Sludge Volume, gpd
gpd 1,440 minlday
3600 gpd
1,440 minlday
= 2.5 gpm
C. Determine pump control.
(a) Percent time on =
OR
(b) Minutes perhour
(Sludge Volume, gpd) (100%)
(Pumping Rate, gpm) (1,440 minlday)
(3600 gpd)(100 %)
(50 gpm) (1,440 minlday)
= 5%
(Percent Time On)(60 minutesIhr)100%
(5%) (60 minutes/hr)
100%
= 3 minutes/hr
'Composite sample- Refer to Section 4.02 for discussion.
11.13
2 ,.).,_...,
K

Alternatemethod tocalculatesludgePumping rate.
Trickling filtersaro doalgrisdwithloading criteriafor operation,
TRICKLING FILTER PROCESSSECTION II PROCESS CONTROL
A second method bf estimating the volume of s ge4s based on measurementof the sedimentation unit influent and effluent suspended solids, the percenttotal dry solids in the sludge, and the flow to the clarifier. The volume ofsludge to be removed may be estimated as follows:
Zymmpla Calculation
A. Data Required1. Filter effluent suspended solids = {10 mgll
(composite sample)2. Sedimentation unit effluent = 30 m9/1
suspended solids3.. Flow to sedimentation unit = 0.9 mgd4. Desired sludge concentration :a 1.5%
(Some allowance should be made forthe Irregularity in the filter sloughings)
Determine the suspended solids removed by the sedimsritationunit in mg/I.
SS removed, mgll = m.9n
= 91.50
= 60 mgll
C. Determine the volume of sludge in gallons per day.4
Sludge Vol., gpd = (Flow, mgd) (SS removed, mgll)
Desired Sludge Conc., %
= (0.9 mgd) (60 mg/I) (100%)
1.5%
= 3600 gpd ,
2.05 LOADING PARAMETERS
A trickling flitir process is designed with loading parameters as criteria foroperation. Operation of the process within these rarameters is essential Ifdesign performance is to be achieved and dis harge requirements met on acontinuous basis. The process control pars eters for trickling filters aregenerally based on organic lqading and hydra (lc loading. In considering thetrickling filter process, the filter or filters abd the following sedimentationunit shoitld always be considered as one unit in both design and operation.The probess control parameter for sedimentation units is generally based onthe surf ape overflow rate. Exceeding the design parameters of any unit pro.cess will eventually result In a poor quality effluent.

BOO loading Inrecliculellonflow should beIgnored.
How to\s.s. calculate BOO
loading fortrickling lifters.
(TRICKLING FILTER PROCESS
SECTION 11. PROCESS CONTFIOL
Organic Loading
LThe organic loading is commonly expressed as pounds of BOO applied per,day per 1,000 cubic feet, cubic yard, or acrefoot of madia. Where recirculationis practiced, an additional organic load is contained in the recirculated flow.This added loVing is included in the calbulations by some operators andomitted by others since it is included in the influent load. The Water PollutionControl Federation Manual of Practice No. 6., Units of Expression forWater Treatment, expresses BOO loading as lb BOD/day/1,000 cu. ft. excludingthe additional BOO load contributed by the recirculated flow in the high-ratefilter plant. To eliminate confusion in making data comparisons with otherplants, it is suggested that the BOO of the recirculated flow be ignored. TheBOO loading is determined as follows:
Example Calculation
A. Data Required1. Primary effluent BOO = 132 mgll2. Raw wastewater flow = 0.4 mgd3. Diameter of filter = 50 ft.4. Depth of filter media = 3 ft.
B. Determine pounds of BOO applied per day.
BOO Applied lbs/day = (SOD, mg/I)(Flow, mgd) (8.34 lbs/gal)
= (132 mgll) (0.4;mgd) (8.34 lbslgal)
= 440
C. Determine the filter ,surface area in square feet.**
Surface Area, sq. feet = (0.785) (Oia., ft.) (Oia., ft.)*
= (0.785) (50 ft.) (50 ft.)
= 1963.5
*Surface Area = x Oia. x Oia. = (0.785) (dia.) (dia.) or 0.785 (Oia)2
D. Determine the volume of filter media in 1000 cubic feet.
Vol. of Media, 1000 cu. ft. = (Surface Area, sq. ft.) (Depth, ft.)
11.15
252
1000 units
(1962.5 sq. ft.) (3 ft.)
1000 units '
= 5.88 or 5.9 thousand cubic feet

1
TRICKLING FILTER PROCESSSECTION II PROCESS CONTROL
... -...-----
b
itydasulleone can belimited by Misrdistribution andunderdrsinsystems.
How tocalculate'hydrauliciostilos forbating Mors.
E. Determine the BOD loading.
v
\,---
lbBOD Loading, ibs BODIdayl =BOD applied, sidaY
1000 cu. ft. Volume of Media, 1000'cu. ft.
440, lbsiday
5.9 thousand cu. ft.
= 75
Hydraulic LoadingS
The WPCF Manual of Practice No. 6 expresses hydraulic loading as gallonswaste floydincluding recirculation) per day per square foot of surface area(gpdisq. ft)7Qtten, the hydraulic loading of a trickling filter is limited by thehydraulic capacity of either the distribution or underdrain systems. Thehydraulic loading on the sup errate trickling filters (synthetic mediafilledtowers) is commonly expressed as gallons per minute per 'square foot ofsurface area (gpmisq. ft.). The hydraulic loading may be determined as follows:
Eximple Cakulation
A. Data Required1. Raw wastewater flow = 0.4 mgd = 400,000 gpd2. Recirculation flow = 0.2 mgd = 200,000 gpd3. Diameter of filter = 50 ft.
I
B. Determine the total flow applied to the filter li gallons per day.
Total Flow, gpd -4 Raw Wastewater Flow, gpd + Recirc. Flow, gpd
= 400,000 + 200,000
2.-. floopoo
C. Determine the surface area of the filter in square feet.
Surface Area, sq. ft. = (0.785) (Dia., ft.) (Dia., ft.)*
= (0.785) (50) (50)
= 1963.5

Importance ofhydraulicloading qgsedimentationunits.
Now tocalculatesurfaceoverflow rate.
i
TRICKLING FILTER PROCESSSECTION it PROCESS CONTROL
D. Determine the hydraulic loading.
Hydraulic Loading, =gpdIsq. ft.
Hydraulic Loading, =
Total Flow, gpdSurfasa Area, sq. ft.
600,000
1963.5
= 306
Sqrface,Area-= P. ".1 (Dia.) (Dia.) = 0.785 ,Dia.) (Dia.) or 0.785 (Dia.)2.4
Surface' Overflow Rate
The surface overflow rate is the parameter`commonly_used to measure thehydraulic loading on the sedimentation units. The surface overflow rate isexpressed as gallons waste flow per day per square toot of surface area(god/sq. ft.). The surface overflow rate is directly related to the sedimentationunit's ability to effectively remove settleabl'e solids. Normally, if the surfaceoverflow rate is within the design range, it can be assumed that the detentiontime and weir overflow rates are also within the design range. However, con-sideration should be given to flow distribution which can cause short circuit-ing of flow through the unit. Sedimentation units which follow low and highrate trickling filters are commonly designed with maximum surfa6 1 overflewrates of 1000 gpd/sq. ft. and 800 gedisq. ft., respectively.
The surface overlow rate is determined as shown below:
Example Calculation
h.
B.
Data Rimiired1. Peak hour influent wastewater flow = 603,000 gpd2. Recirculated flow from sedimentation = 300,000 gpd
unit effluent3. Diameter of sedimentation unit = 40 ft.
Determine the total flow in gallons per day.
Total Flow, gpd = Influent Wastewater Flow, gpd + RecirculatedFlow, gpd
= 600,000 + 300,000
= 900,000
II-17 254
\r
a
if

Commonproblems withtrickling litters.
Goodoperailonaipracticesminimizeproblems.
TRICKLING FILTER PROCESSSECTION ilPROCESS CONTROL
C. Determine the surface area of the sedimentation unit in square feet.
Surface Area, sq. ft. = (0.785)(Dia., ft.) (Dia., ft.)*
= (0.785) (40) (40)
= 1256
D. Determine the surface overflow rate. ,
Surface Overflow Rate,Flow, gpd
gpd/sq. ft. Surface Area, sq. ft.
900,000
1256
= 717
*Surface Area =314 (Dia.) (Dia.) = (0.785) (Dia.) (Dia.) or 0.785 (Dia.)2
2.06 OPERATIONAL PROBLEMS
There are five problems which commonly occur in trickling filter operations:1) Filter flies2) Odors3) Ponding4) High effluent suspended solids5) Freezing
Each of these problems is disucssed In the following sea:Aims. Although thetrickling filter process does not require complicated or stringent procepcontrol measures, it does require daily attention and maintenance for bnefficient and troublefree operatibn. Some of these practices are listed below.
1) Keep the distributor orifices or spray nozzles free of obstructions.2) Keep excessive growths hosed off the distributor splash plates and
the side walls above the media.3) Keep the distributor arm system in good repair and leveled to ensure
the wastewater is applied uniformly over the filter bed.4) Keep all obstructive materials removed from the filter surfa e, the
underdrain conduits and effluent channel.5) Avoid expected problems by Implementing preventive measures on a
routine bisis.6) Do not allbw problems to become serious before correcting.
Beneficialwhen in smellnumbers.
Filter files Pillbecome sseriousnuisance duringsummer months.
losplement.preventivemeows..
Preventcompletion ofthe Bias lifecycle.
Correctivemeows. for flyproblems.
propermeinienance Isimportant.
Possiblesolution whentherecircutetionrats can not bereduced.
Can Brhydraulicloading beincreased byreciroulelion?
_
Poisibiscontrolmeows if filterdesign permitsflooding.
TRICKLING FILTER PROCESSSECTION it PROCESS CONTROL
Filter FliesI
The filter fly is a gnatsized, mothIlke fly that often breeds in the slimes of atrickling filter. its dark brown, worm-like larvae live in the trickling filter slime
ttiperforming a useful function by consuming the dead d decaying biologicalslime growths. At the completion of metamorphosis, t e larvae emerge fromthe filter as adult flies and they create a considerable When present.In addition to being unsanitary, the flies get into the ey s, nose, and ears, andcause meat deal of physical discomfort and irritation. During the cooler partof the year, filter flies usually exist in numbers which do ndt present problems.But in the warmer summer months, due to their shorter life cycle (7 days orpossibly less), the flies emerge from infested filter beds in vast numbers,presenting a serious nuisance. Although the flies are capable of flying only ashort distance, they may be carried by the wind over considera'Ae distancesto residential areas.
For these reasons, preventive measures should be implemented asst routineprogram to avoid the development of a nuisance problem and subsequentcomplaints. Unfortunately, the filter fly and its larvae are not easily destroyed.The most effective means of control is to prevent the completion of its lifecycle.
Some probable causes for filter fly problems include the following;1. Poor distribution of influent wastewater, espeicaliy along the filter
wall.2. Hydraulic loading rates are insufficient to keep ly eggs and larvae
washed from the filter media.3. Preventive measures program not being implemented on a routine basis.
One or more of the following corrective measures may be needed to controlfly problems in any given situation. The measures best suited to your particularopinitlen with the least adverse effect on the quality of the plant's finaleffluent should be selected. The measures are listed in the suggested orderof consideration.
The distribution system should be properly maintained so that westwater is uniformly applied over the media. Keep distributor orifices fspray nozzles free of all obstructions. Keep the biological growthsadhering to the splash plates hosed off. If distributor arms are notequipped with spray nozzles at the outer end to keep the media adjacentto the wall and the Inside surface of the wall wet, either tap the ends ofthe distributor arm or open dump gates slightly fora spray effect.Slow down the distributor arm rotation by reversing some of the spraynozzle directions. This will act to brake the rotating arm.increase the recirculation rate to help wash fly larvae from the filterbed. Hydraulic loadings in excess of 200 gpdisq. ft. will often minimizefilter fly problems.On a routine weekly basis, flood the filter for several hourg to preventcompletion of the filter fly life cycle. When thls measure Is used, consideration should be given to the resultam hydratlir :oading placed onthe filters remaining in service. Care should be exercised in releasingthe wastewater from the flooded filter such that the hydraulic designcapacity of the secondary sedimentation units is not exceeded, resultsing in the washout of settleable solids.
11.1t

A
TRICKLING FILTER PROCESS
r*** SECTION II PROCESS CONTROL
Unwise use ofchlorine maylower effluentquality.
4
First checkwith State andlocal regulatoryagencies.
Causes forodors.
Indication thatotheroperationalproblems mayexist.
Improve primarytreatment.
-A°
On a routine weekly basis, preferably during a period of low flow, dosethe filter influent for several hours (no more than 8 hours at a time) withsufficient chlorine to maintain a 1 to 2 mgll residual at the distributoroutlet. The application of chorine will cause sloughing of the upperlayer of media slime where fly larvae avl pupae reside. Caution shouldbe exercised during prolonged chlorine pkileationpt higher residuals.This could cause too mtkh of the slime laies42?15ugh off and reducefilter performance.If not prohibited by St to of local regulatory agencies, spray filter wallsand other areas whe the flies rest with a residual-type insecticide.Do not spray insecticide onto the filter media, as the insecticide mayharm the slime growth and contaminate the receiving waters. insecticidetreatment should be repeated at intervals of two or four weeks. Alternatethe type of Insecticide used to avoid developing a resistant strain ofthe fly.
Odors
Foul odors coming from a filter are generally due to anaerobic conditionsoccurring within the slime growth of the 'filter. When the available dissolvedoxygen is consumed by the mlcroorgahisms, conditions which cause anaerobic decomposition will occur. It is normal for the innermost slime layernext to the media to be anaerobic, because of inhibited diffusion of oxygenthrough the outer slime layer. However, the outer slime layer must be com-pletely aerobic; and therefore, a continuous and adequate supply of oxygen(dissolved) is necessary for an efficiently operating filter. Foul odors do notcommonly occur when aerobic conditions are maintained in the filter. Whenodors do occur, it is a good indication of inadequate operational and processcontrol procedures.
Some probable causes of odor problems include the following:1. Excessive organic loading due to the following: an unusually high
BOD in the efluent wastewater; an overloaded or poorly operated primarysediment-''on unit; overloaded or poorly operated sludge processingoperations resulting in an in-plant recycle flow with a high BOD loading;or inadequate dilution by recirculation.
2. Poor ventilation due to the following: a submerged underdrain system;clogged vent pipes (vertici., pipes from underdrain around innercircumference of periphery wells); obstructed underdrain channels;natural ventilation Is poor; or void spaces between media is filled withexcessive gray to black biological growths.
3. Filter is operating at or over its hydraulic and/or organic loadingcapacity.
4: Poor housekeeping practices. Accumulation of debris on meida surface.
The following measures should be implemented to resolve odor problems:Evaluate the operation of the primary sedimentation tanks for possilemeans of improving efficiency. An influent baffle may be needed toprevent short circuiting, or an improvement in the scum baffle may benecessary to prevent the loss of grease particles from the tank.
11.20

Maintain goodpublic relations. 4
Maintainaerobicconditions inupstreamtreatment unite.
Goodhousekeeping.
Recirculationrate may needIncreasing.
Chlorinationlessens theproblem.
Conditions inlitter which canand will lead toponding.
TRICKLING FILTER PROCESSSECTION II PROCESS CONTROL
Utilize one of the commercially available masking agents to makeodors less noticeable, thereby avoiding complaints. This should notbe considered as a solution to the operational problem, but only as ameans to avoid a public relations problem while the source of theproblem is localled and appropriate corrections are made.Maintain aerobic conditions in the wastewater collection system, andin primary and secondary sedimentation units (prevent septicity). Re.circulation of filter effluent, or final effluent, through the primarysedimentation units during low night flows would be helpful in reducingsepticity. The same principle can be utilized by recirculating effluentthrough the secondary sedimentation units.Remove all debris (leaves, sticks, paper, etc.) from the surface of thefilter media.Check to see that vent pipes are clear.Remove all debris from filter effluent channel and periodically flushobstructive materials from the underdrain system.increase recirculation to the filter to dilute the strength of the appliedwastewater, to flush out the excess biological growths, and to improveoxygen transfer. The hydraulic loOnfipplied to the filter should notbe so great that the underdrain system is flowing more than one-half full.On a daily basis, dose the filter influent for several hours, preferablyduring a period of low flow, with sufficient chlorine to maintain a 1 to2 mgll residual at the distributor outlet. Prolonged chlorine applicationat higher residuals may reduce filter performance. Chlorination onlylessens the problem until a permanent solution such as plant expan-sion, improved operation, or a larger recirculation pump can be provided.
Ponding
Ponding also known as pooling, is the formation of pools of wastewater onthe filter surface due to clogging of the void space between the media. Thevoids may be clogged by excessive biological growths, accumulated debris,non-uniformly sized media, or disintegrated media fragments. Clogging of themedia voids will Inhibit air and wastewater passage, thereby reducing filterperformance and resulting in anaerobic conditions which are responsible forfoul odors. The potential for ponding can be minimized by use of a sufficienthydraulic loading (relative to the organic loading) to keep excess biologicalgrowths flushed from the media voids on a routine basis, and by removing anydebris which may accumulate on the media surface.
Some probable causes of ponding problems include the following:1. Application of a highstrength waste with Inadequate dilutim by
recirculation.2. Inadequate hydraulic loading in relation to the organic loading to keep
media voids flushed.3. Nonuniformly sized media where smaller particles fill the void space
between larger particles. This inhibits air ventilation and passage ofwastewater.
4 Disintegrating media resulting in clogging of the void space.
11.21
25!-;

Correctivemeasures forMit pondIng.
F settee goalsaelieepIng.
improvecondition andpreventrecurrence.
CUI for minorponding.
Cure for seriouspondIng whenloading doesnot parr .11
removal of afilter fromservice.
When filterdesign permitsI" -ding endextra liters eresvelteble.
Mottling notPogGible
Defectivo media
TRICKLING FILTER PROCESSSECTION II PROCESS CONTROL
5 Uniformly-sized media which is too small to provide adequate voidspace for air and wastewater passage at current loadings.
6 An accumulation of moss, snails, leaves, sticks, or other such materialswhich clog filter voids.
One or more of the following corrective measures may be needed to controlponding depending on the cause and seriousness of the problem. The meas-ures are listed in the suggested order of consideration. The measures bestsuited to your particular operation with the least adverse effect on the qualityof the plant's final effluent should be selected.
Remove all leaves, paper, sticks, and other debris accumulating on themedia surface.Increase micirculatipn to reduce htfiuerit strength and improve thehydraulic flushing of media voids.
%nd flush the affected portion of the niter ce with a highpres:ure stream of water.Loosen the surface layer of rock in the affected area by raking or forking.
Dose the filter influent for 2 to 4 hours (preferably during ci,k .iow) withsufficient chlorine to maintain a 1 to 2 mgll residual at the distributoroutlet. Residuals of 20 to 50 mgll may be needed when ponding isserious and it is r e:essary to unload the majority of the biologicalgrowth. Significant unloading of the slime layer will reduce the treat-ment efficiency until a biological balance Is re-established. If the treat-ment facility lacks provisions for application of chlorine to the filterinfluent lbw, chlorinated time (34%) or HTH powder (70%) may beapplied to the affected area at a dos4 a of 8 to 10 pounds of chlorineper 1,000 square feet of filter surface.If the construction of "le filter permits, flood the filter, keeping themedia submerged for about 24 hours. When utilizing this method, con-sideration should be given to the resultant loading placed on the filterunits remaining') in service. To preveit surcharging 01 the secondarysedimentation units. release the wastewater from the flooded filterslowly, preferably during the low night flow period.Remove the filter from service allowing the slime growths to dry outWhen placed back into service, the loosened growths drop from thereed anu wash out with the filter efflu nt. The length of drying requireddepends on the weather and the thickness of the growths. A few hoursof drying may be adequate to slough the excess growths, while for moreser;ously clogged media, one or more days of drying time may beree;uged. Portions of a filter media may be dried out by closing offindividual distributor arm orifhesin the event each of the above measures fail to relieve the problem.remove some of the media for cleaning and inspection. It t , media isfound to be in satisfactory condition and uniformly-sized (3 to 5 inches)it can be carefully placed back into the filter. If the media is defectiveor too small, it must be replacedCAUTION All filter underdrain systems can be easily damaged by theweight of heavy equipmeht or careless placement of media

Removal ofsettleablestoup/angelsthe key to goodperformance.
Causes for higheffluentsuspendedsolids.
Things to lookfor vAenexperiencinghigh effluentsolids.
Checkhyo:rauilcloading.
Check surfaceoverflow rata.
Performtwnparatureprofile.
TRICKLING FILTER PROCESSSECTION li PROCESS CONTROL
High Effluent Suspended Solids
The efficiency of the trickling filter process is dependent on . removal offilter sloughings in the final sedimentation units. A high suspended solidsconcentration in the sedimentation unit effluent is usually indicative that aproblem exists in this portion of the trickling filter process.
Some probable causes for high effluent suspended solids include the following:1. The unit is hydraulically overloaded due to excessive flow rates in
conjunction with recirculated flow rates, or the flow is unevenly dis-tributed between multiple units.
2. Sludge collection equipment needs adjustment or repair.3. Baffles or skirts need repair.4. Effluent weirs not at an equal elevation.5. Temperature currents.6. Rate of sludge withdrawal or frequency Is inadequate.7. Heavy sloughing caused by temperature and,biologIcal activity. Shock
loadings due to toxic wastes or organic and/or hydraulic overloads.
The foiiowtng measures should be implemented to determine as well asresolve the problem.
Check for broken welds, bolts, su,poris, and/or holes in the bafflesand make any needed repairs.Check that effluent weirs are set at an equal elevation and make myneeded adjustments.Check that the sludge colle, ion equipment is operating pro..1) Thecondition of the sludge scrapers or flights should be chocked and 1:,eclearance between the floor and scraper adjusted if needed.The operator shoulo check the hydraulic loading on each clarifier (seeSurface Overflow Rate) by either measuring the flow to *soh clarifier orby estimating the flow balance between multiple units as indicated bythe depth of flow Over the weirs in each of the clarifiers. Overloadingcan result from excessive flow or unevenly distributed flow betweenmultiple units.
Compare the calculated surface overflow rate with the design rate. Ifthe current rate exceeds the design rate, the unit is overloaded andefficient .operation can be restored if additional sedimentation facilitiesare provided. The installation of baffles in the existing unit may im-prove settling.
A temperature profile of the sedimentation unit will identify the presenceof any temperature currents. The temperature probe on a dissolvedoxygen meter is an- excellent tool for this procedure. To make thesurvey, the temperature profile is measured and recorded at the head,one quarter, one half, three quarters and end of a rectangular or squareunit, or at the quarter points across a circular unit. At each point, thetemperature is measured at the surface and the quarter points down tothe bottom of the tank. Be careful that the temperature probe and wiresdo not get entangled in the sludge collection equipment. If the deeper-temperatures are consistently cooler by 1 to 2° or more, temperaturecurrents are present. The settling will be improved if baffles are in,. ailedto break up the currents and stop the turbulence.
11.23
2G U
A

Check thesludge removalrate.
Chamicataddition may berequiredjemporarity.
Check forindustrialdischargeswhich hinderprocessperformance.
Check for shockhydraulicloadings
Freezinggenerallylimited toclimaticconditions.
Condition,:which createfreezingproblems
Things Io helpreduce freezingproblems
ti
TRICKLING FILTER PROCESSSECTION II - PROCESS, CONTROL
If the sludge floats to the sedimentation unit surface in clumps withnumerous small bubbles attached, the problem is most likely relatedto septicity or denitrification. This problem is best resolved by increasingthe sludge removal rate to draw the solids out of the unit more rapidly.Polymer addition to the sedimentation unit influent flow may improvethe capture of suspended solids. The type of polymer and initial dosageshould be determined in the lab by jar tests. It has been reported that a1 to 2 rngil dosage of cationic polymer has been effective in somecircumstances. The polymer dosage should be peripdically adjusted onthe basis of the most effective solids capture with the least amount ofchemical addition. The rate of sludge removal should be increasedduring periods of chemical addition and heavy sloughing.
Conditions such as ainormal pH's, temperatures, or toxic chemicals%.:an be best controlled by enforcing strict industrial waste dischargeordinances. Increasing the recirculation rate will help to buffer dr;effect of shock loads. However, harmful industrial dumps should bestopped or neutralized at their source whenever possible. If possible,a toxic shock load (usi,ally characterized by an abnormally low or highpH) should be diverted to a holding basin and returned to the plantinfluent at a very low rate to minimize its effect on the biological pro-cesses h. the treatment plant (digesters as well as trickling filterprocesses).Frequent hydraulic shock loads may justify the addition of flow equal-ization basins. These basins should be aerated and mixed to preventsepticity and settling of the solids. In some cases, hydraur shockloads can be buffered by using the influent wet well and adjo.. ;rig in-, fluent pipe for equalization and controlling the influent wastewaterpumps to level out the peak flows. The practice of holding wastewaterin the influent sewer for more than a brief period must be avoided.
Freezing-------
This problem is limited to those areas of the coka.itry that experience freezingweather Conditions. Wastewater that is exposed as a thin film or is not inmotion is very susceptible to temperature loss and subsequent freezing. Tosome extent, ice formation can be minimized by appropriate operationalprocedures.
Causes of freezing problems irtclude the following:1. Loss of t.:-nperature the applied wastewater due to recirculation
ithe filter acts like a cooling tower).2. ,irong prevailing winds which increase heat loss.3. Wastewater standing in the distribylien system which may freeze
when intermittent dosing is practiced4 A thin film of spray which freezes more readily than a coarse stream
of spray
The potential for ice formation can be reduced ley the following measures:Decrease recirculation as much as possible to red - cooling effectsupon the wastewater.
11.242 1

TRICKLING FILTER PROCESSSECTION it PROCESS CONTROL
Operate twostage filters in parallel to reduce cooling effects bymaking fewer passes through the filters.Adjust orifices and splash plates for a coarser spray effect.Construct a windbreak to protect the filler from prevailing winds andreduce heat losses.Where intermittent dosii.g is practical, open the bleeder valve in thelower end of the distribution main slightly. This will drain the systembetween doses.Partially open the dump gates at the outer end of the distributor armsto provide a stream rather than a spray along the retaining wall.Cover open pump sumps and dosing tanks to reduce heat losses.Break up and remove ice formations which may obstruct operation.
REFERENCES
Eckenfeder,W.W., Biological Waste Treatment, Pergamon Press. New York, 1961._
Hawk W.A., Th\Ecology of Waste Water Treatment, Pergarnon Press. Oxfo.d. 1963.
Kern, Kenneth b., et al., A Field Study Training Program. Operation of WastewaterTreatment Plants. tCha0er 6), Sacramento state College Department of CivilEngineering.
Lohmtsyer, George T., Trickling Filters and Their Operation. Water & Sewage Works,September 1958.
McKirney, Ross E., Microbiology for Sanitary Engineers, McGraw-Hill Book CompanyInc., 1962.
National Research Council, Sewage Treatment at Military Installations, Sewage WorksJournal, 18, No. 5, 1946.
The South Carolina Waiar and Sewage Works Association, Correspondence CourseManual for Sewage Plant Operators, Class C (Chapter 16)1962.
The Texas Water Utilities As4ociation, Manual of Wastewater Operations. (Chapter'2).1971.
Water Pollution Control Federation, Operation c. Wastewater Treatment Plants.Manual of Practice No. 11.
Water Pollution Control Federvion Sewage Treatment Pieta Design, Manual ofPractice No. 8,1959.
Water Pollution Control Federation, Units of Evres&on filr Wastewater Treatment,Manual of Practice_No:S. 1976
11.25

Why popular.
Trickling filterprocess.
TRICKLING FILTER PROCESSSECTION III FUNDAMENTALS
3.01 INTRODUCTION
The trickling filter process was first used in the United States in 1908, and haSremained a popular form of wastewater treatment since that time. Inexpensiveaeration and process stability are the primary reasons that the trickling filterhas remained a popular treatment process. As energy costs increase, theusage of trickling filters as roughing filters is likely to increase.
The trickling filter process consists of a tricking filter and a sedimentationunit. The filter structure is filled with media which provides surface area forthe microorganisms to attach themselves. The wastewater is applied at thesurface of the-trickling filtfand it trickles or splashes over and through thevoids of the media where t e microorganisms are attached. After the waste-water passes through the filter, it is wheeled in an underdrain system belowthe media. Solids which reamin in the wastewater are then settled and -.movedfrom the sedimentation unit. A portion of the filter effluent may be recirculatedto the head of the filter as shown on Figure 111-1. ..."-
0
RECIRCULATION EFFLUENTreasuermaresamasmatewwwwwwwwwwwamitaiwarmamisiriammaiewileineel --
IIIpanMEI PM Ma IMO IMO ME OPP Illia Min
1 1I
1 1 1
SETTLED I I ISEWAGE TRICKLING
FILTER
DIRECT RECIRCULATION
Total amount ofmicroorganismsis called thebiomass.
Surfacemicroorganismsare aerobloSub-surfaceanaerobic.
Capable ofwithstandingshock loads.
ISECOND RY ICLARIFILR
____/ ii EFFLUENT I
BIOLOGir aLSLUDGE
TYPICAL TRICKLING FILTER PROCESSFIGURE 111 -1
The total amount of microorganisms attached to the trickling filter media iscalled the biomass. The biomass includes algae, bacteria, fungi, protozoa,and higher life forms of organisms such as worms, snails, and insect larvae.
Facultative bacteria are the microorganisms responsible for the majority ofthe treatment which occurs in the trickling filter. The surface microorganismsare aerobic while the microorganisms immediately attached to the media surface or where dissolved oxygen is absent areanaerobic.
Because they contain vast numbers and varieties of microorganisms, tricklingfilters are capable of adapting to changes in environmental conditions andloadings. For this reason shock organic loads have less effect on this processthan on some modes of the activated sludge process.
2P9t..: ur
1

TRICKLING FILTER PROCESSSECTION IIIFUNDAMENTALS
Definitions
Operation of the trickling filter process requires a basic understanding ofsome key words commonly used by operators. The following provides aframework for understanding what'a trickling filter consists of and what makesit function as a treatmoint unit. .
MEDIA is placed 4n a structure to provide a surface for the micro-organisms to attach thetmselves. The media frequently consists ofrocks, plastic, sheeting and redwood laths.DISTRIBUTOR ARM is the most common method of evenly applyingthe wastewater °vet the media irr the structure. The arm is generallypropelled by the momentum or force of waste.ater being sprayedfrom orifices located on the arm.BIOMASS refers to the ts(al mass of microorganisms attached to themedia. In concept, the liomass is similar to the Solids inventoryousedin activated sludge terminology to describe the total amount of micro-organisms in an activated sludge system.RECIRCULATION refers to the pumping of the filter effluent back tothe head end of the trickling filter. Recirculation evens out variationsin the hydraulic loading.SLOUGHING is tit process by which the excess growth of the microorganisms falls of of the filter media. When the thickness of thebiological growth i too great, the excess microorganisms are washedoff of the media and discharged with the filter effluent.FILTER UNDERDRAIN consists of a sloped floor under the filter mediawhich allows the wastewater and sloughings to coliedtlig a channel.From the channel the wastewater and sloughings (filter effluent) aretransferred to the sedimentation unit for settling and removal.HYDRAULIC LOADING refers to the amount of wastewater applied tothe surface of the trickling filter media. The hydraulic loading Is calculated by dividing the average daily influent flow by the surface area ofthe filter media. The loading parameter is commonly expressed asgallons per day per square foot of surface area (gpd/sq. ft.).ORGANIC LOADING refers to the amount of BOD or COD applied perunit volume of filter media per day. The organic loading is commonlyexpressed as pounds of BOD applied per day per 1000 cu. ft. (lb BOO/day/1000 cu. ft.).LOW RATE TRICKLING FILTERS are operated with an organic loading,of 5 to 25 lb BOD applied/day/1000 cu. ft. The low rate filter will frequently produce a nitrified effluent, and low rate filters are becomingslightly more popular because of this capability.HIGH RATE TRICKLING FILTERS are operated with organic loadings.of 25 to 100 lb BOO applied/day/1000 cu. ft.ROUGHING FILTERS are operated at loading rates above 100 lb BODapplied/day/1000 cu. ft. A roughing filter is used to reduce the amountof BOD and/or COD in the wastewater.BIOLOGICAL TOWERS refer to the type of trickling filters that aresynthetic medlafilled, tower.like structures. These towers are sometimes referred to as oxidation or roughing towers, Because of theirhigh hydraulic loading, they are often classified as SuperRate tricklingfilters.
2C' 4

Waste isabsorbed byslime growth.
Same growthsloughs ofti.road's.
Sloughing. erecaptured in theclarifier
Principlecomponents ofprocess.
Whet makes thedistribution armrotate?
!TRICKLING FILTER PROCESSSECTION III FuNDAMENTALS
STAGING refers to operating trickling filters in series.. Staging ispracticed to produce an effluent with a lower BOD and/or COD con-centration.
3.02 PROCESS DESCRIPTION
The trickling filter process consists of spraying the wastewater over a bed ofmedia, such as crushed rock, cynders, slate, redwood laths, or molded plasticmaterials to form a biological slime layer. This slime, or zoogleal film, is composed primarily of bacteria, protozoa, and fungi, and at times includes worms,fly larvae, rotifiers, and snails. Usually sunlight promotes an algal growth onthe bed's upper surface. As the wastewater trickles downward through thevoids of the media, organic matter and dissolved oxygen are absorbed intothe film and at the same time, the metabolic end products such as carbondioxide, water, nitrates and sulfates are released.
When the slime lay* loses its ability to continue clinging to the, media, usuallydue to either the excess thickness of the slime layer and/or the scouring effectof the wastewater flow, portions Of the slime layer slough off into the wasteflow. The waste flow containing the metabolic end products an&sloughinrlsflows into an underdrain system which supports the media and liermitrlircirculation. The underdrain system has a sloping bottom conveying the wasteflow into a main effluent channel.
In a single stage system, the collected trickling filter effluent' is conveyed toa sedimentation unit for the removal of the settleable sloughings. In a multi.stage system, final sedimentation would follow the tast trickling filter stage.In some cases the system may have intermediate sedimentation units betweenthe trickling filter stages.
The principal components of the trickling filter process consist of the following:1. The distribution system through which the wastewater is applied to
the filter media.2. The filter media which provides surface area for the microorganisms
to grow.3. The underdrain system which supports the media and provides drainage
of the waste flow to a collection channel while permitting air circulation.4. A final sedimentation tank for the removal of the filter sloughings.
A crosssection of a typical circular trickling filter is Shown on Figure 111.2with the principal components identified.
Rotary Distributor
The rotary distributor consists of two or more horizontal arms that are mountedon a turntable assembly anchored to a center column, as shown on Figure111.3. The wastewater is uniformly distributed over the media by orificeslocated in the side of the distributor arms. Usually, the reaction force of thewastewater spray fro n the orifices provides the force needed to rotate thedistributor assembly. In some cases. the distributor assembly is motor driven.
111 3
2°

TRICKLING FILTER PROCESSSECTION III.FUNDAMENTALS
000 DISTRIBUTORTRAVEL
ofiCfr 00*0. et
N1'
TYPICAL TRICKLING FILTER IN CROSS SECTIONFIGURE 111-2
111-4 2 e
PP

Maintenanceprovisions.
Distributor ermMellon speed.
TRICKLING FILTER PROCESSSECTION III FUNDAMENTALS
The turntable rests upon and revolves on a ball bearing assembly whichoperates in an oil bath with a mechanIcaltype, seal between the rottingturntable and the stationary base to eliminate oil leakage and contact Withthe wastewater.
The distributor arms are commonly braced by horizontal tie rods. To maintainthe distributor arms in the horizontal position and permit seasonal adjustment,the aims are supported vertically by adjustable guy rods from a center mast.A dump gate Is provided at the outer end of each arm for flushing theobstructive materials from inside the arm. Often, an Orifice is provided in thedump gate to spray the edge of the media to discourage fly breeding. Usually,a drain plug is provided in the center column to facilitate shutdown proceduresand prevent damage due to freezing.
The distributor arms are sized to prevent velocities in excess of 4 feet persecond (fps) at maximum flow. Generally, the rotation spead of the reactiondriven unit will vary with the flow rite In the range of 0.1 to 2. m. The four-arm distributors are often equipped with weir boxes at the cenlit column toconfine the flow to two arms at minimum flow rates. This feature is providedto maintain proper reaction force for the rotation of the distributor arms froma minimum flow to a maximum flow.
Figure 111.3
Rotary Distributor
26 7

Uncommon Innewer plants.Found mostlyIn oldetplants.
Uniform sprayapplication.
Deep bed niter
Dosing bysiphon. pumpsor gravity.
Media does notniterwastewater butmust bedurable.insoluble anduniformly -sited
TRICKLING ALTER PROCESSSECTION III FUNDAMENTALS
Fixed Nozzle Distributors
In the rockfilled filters, fixed-nozzle distribution systems are uncommon andare usually found at older facilities. The distribution system consists ofstationary pipes placed in the filter bed with inverted nozzles located atstrategic points fora relatively uniform coverage of,spraying wastewater overthe media. Special nozzles constructed with a deflector for a flat spray patternare usually used in these filters. Dosing tanks are utilized to provide an intermittent wastewater application. The dosing tanks are usually designed toprovide a minimum rest period of 30 sec. at maximum flow, Figure 111.4strates the fixed nozzles a dosing tanknd distribution system..
The dosing tanks also provide a varying head so that the spray falls first at amaximum distance from the nozzle and then at a decreasing distance as thehead drops. This technique provides a relatively uniform application.
Witt the introduction of synthetic media, construction of deepbed, fixed-noz. Hers provide greater contact time and higher wetting rates of waste-
ter applied. The nozzles are strategically located at points along pipesstraying downward over the bed.
Dosing
The hydraulic head required for operation of the distribution system may beprovided by dosing tanks, pumps, or by gravity discharge from the precedingtreatment unit.
Dosing tanks are usually equipped with an automatic siphon controlling-themaximum and minimum head conditions. They also provide an intermittentdosing frequency. A typical dosing siphon is shown in Figure 111.4.
Media
The media in a trickling filter does not provide a straining or filtering action asimplied by the name, but provides a surface area for the growth of a slimehim which as responsible for the removal of organic matter. The media may becrushed rock, slag, coal, bricks, redwood blocks or laths, molded plastic, orany durable, insoluble and uniformly-sized material, Uniformity in media sizeis required to provide adequate void spaces for air circulation and to avoidflow restriction resulting in a condition known as ponding. The size range ofrock media is usually 3 to 5 inches in diameter depending upon the hydraulicloading that the filter has been designed for. Highrate filters use a largermedia than the lowrate filters. The durability, cost, and availability are someof the fictors that determine the type of media used. The depth of media inrock - fitted filters range from 3 to 8 feet with the majority of the biologicalactivity ',courting in the upper 3 feet.
In recent years, several forms of manufactured media have been introduced.The manufachged media provides a greater surface area per a specific volumeupon which the zoolgeal film may grow while providing ample void space forthe free circulation of air. Additional advantages are; a uniform media forbetter liquid distribution, lightweight material allowing construction of
111.6f.)4e-. ,

.0°...t$,5:blq 9 oPc5741,7. .",°*04.6%-:1°-
FIGURE III-4

c.
0.
Advantages ofsynthetic media.
Redwood lathmedia.
Plastic media.
,/
TRICKLING FILTER PROCESSSECTION III FUNDAMENTALS
e:
deeper beds, a greater BOD removal in a given volume of media; chemicallyresistant, and an ability to handle high-strength wastes, such as those fromthe food processing industry.
One type of manufactured media is redwood laths constructed into 4 x 4 footracks with spacer rails between)ayers and space between the, laths allowingfor air circulation and water floi. The racks are stacked vertically with lathsand soacer rails. The rough-sawn itexture of the redwood enhances the reten-tion of slime growhs. Figure 111-5 ipustrates the redwood lath media.
. .,The molded plastic media consists of modules of interlocking or bondedcorrugated sheets of plastic arranged somewhat like a honeycomb. Themodules of media are stacked so that they interlock and fit the filter configur-ation. he corrugated sulace bf the Plastic media enhances the retention ofthe slime groWths. Filters utilizing plastic media are often constructed 15 to30 feet deep, thus the terms biological or oxidation tower has been introducedto identify these installations. Tile synthetic media have a hldher miminumwetting rate (i.e., rate of flow per unit area) which will maintain a slime growththroughout the media depth foi optimum performance. This rate of flow mayrange from 0.5 to as hign as 2.0 gpm/sq: ft. (30 to 125 mgdiacre) dependingupon the type and configuration of the media. Design parameters for a specificmedia are available from/he manufacturer. A typical example of plastic mediais shown in Figure 111-6. '
REDWOOD LATH
REDWOOD RAILS
$
.STACKED
if
REDWOOD LATH MEDIAFIGURE III-- 6
/Mk
N
is
i

,
TRICKLING FILTER PROCESS. SECTION tit FUNDAMENTALS
-." "...
...; PLASTIC MEDIAFIGURE 111-6
Finerunderdrainsystem mustprovideadequateremoval ofeffluent andprovide.adequate aircirculation forefficientoperation.
Underdrain
The underdrain system collects the filter effluent and transfers it to thesubsequent filtration stage or sedimentation tank. The system consists ofbraces which support the filter media. The floor is sloped to collect the filtereffluent in a chancel. The underdrain braces may be spaced redwood stringersor slotted blocks constructed of concrete or more commonly, vitrified clay.The underdrain also allows air to circulate tnrough the media to provide theoxygen transfer pecessary to maintain aercLiic conditions essential to efficientfilter operation. Ample underdrain capacity is necessary for rapidly discharg-ing the effluent, and for air circulation and aeration. With natural ventilation,the underdrain systeni and effluent channel are usually sized such that notmore than 50 percent of its cross-sectional area will be submerged at peakhydraulic loading. Some trickling filters have vertical vent pipes around theinner circumference of the structure wall to provide ample ventilation. Othertrickling filters have drainage ducts extended tnrough the filter structure wallto provide ventilation.
)

&
Proper f Starventilation isa must.
Naturalventilationoccurs bydifferences intemperature.
Forced airventilationshould be in thesame directionas natuol sircurrent.
Finalsedimentationtank is enimportant unitin the tricklingfilter !scoots*.
Design issimilar toprimary tanks.
TRICKLING FILTER PROCESSSECTION lit FUNDAMENTALS
Ventilation
Adequate ventilation is very important in achieving efficient filter operation.Usually, with an adequately sized underdrain system, the difference in air andwastewater temperature will provide adequate natural ventilation. However,force ventiiation may be necessary in some of the following instances:
A. Filter.: with extremely deep beds, such as the biological towers.B. Filters situated below grade.C. Heavily loaded filters.D. Filters covered by a dome for winter:protection, or odor control.
Natural Ventilation
Natural ventilation occurs by gravity due to the temperature differentialbetween the wastewater temperature and the outside air temperature.The heating or cooling of the air will cause, a density change resultingin an air movement (heated air rises-and cooled,air falls). Therefore, thedirection of air flow will depend on the temperatures of thi air and waste-water. if the air temperature is warmerfiraii the wastewater temperature,the cooled-air flow will he downwardfhrough the filter. If the air tempera-ture is lower than the t astewater temperature, the warmed!air flow will beupward through the filter.
Forced Ventilation
Usually, forced ventilation systems are designed to provide an air flow ofi cfm/sq. ft. of filter area with air flow in either direction. The fans shouldbe operated to circulate the air in the same direction as the natural aircurrent. The ventilation units must be equipped with airtight seals to avoidcorrosion problems. At some locations, the air is exhausted throughscrubbing towers for the removal of odolrous and corrosive gases that areformed in treating the wastes. This is true particularly from foodprocessingindustrial wastewater. During freezing or low air temperatures, it is a wisepractice to restrict the air flow to minimize freezing. The volume of airrequired to sustain an aerobic filter operation is in the vicinity of 0.1 cfm/sq. ft. of filter area. However, this rate will vary depending on the organicloading and microorganism activity in the filter.
Final Sedimentation
The final sedimentation ',nit is an essential component since trickling filtersconvert the organic matter to a se ttleable biomass which periodically orcontinuously slough (drops) from the filter media. Therefore, the efficiency ofthe trickling filter process is dependent upon the removal of this sloughedbiomass in the final sedimentation unit.
The design and construction of the sedimentation unit is similar to that ofprimary sedimentation tanks. Determination and review of the clarifier loadingparameters is discussed in Section 2.05. /
111.10
2'7')a p..1
1.

TRICKLING FILTER PROCESSTABLE
FILTER CLASSIFICATIONS AND CHARACTERISTICS
UNITS
`1,91;1 I
"Of 1,.
14, it 'WO.
0.18%W ho.
P 1,1
14
LOWRATE HIGHRATE ROUGHINGRATE
3,1 I el$ 4 $44,1
1$1.1 .1 SI.
b.11, . TT1*.1 4:14,1t) m3 r'
Ir.'
.)
11../ 01
I,,
tIJO H. 'inPert,Or 1,10 I 1 ' ,t . .
Ti 1
t
17. u4
O 1. ,111$t11 fir J.,1
am..
TI 1
V $
911',
tfushect rosy (1.rIrf114 :0 rodA001114?no
,onntAle-C10.41:31,
11$ ks
io 9 0., 040
/510 10,14 tr.
MOT
14 1 /0 40 /t
Any of lne oftwOtotf0.n flip f4.11,
lrltu IF3lotoy 1p
allInuou ,6,0i1 orb Col°,UnsT4111.
.1 In $411
19110390W'.1213 TQ TV 21
CJ .41)
unilr191)U 413100/1 40crIFO1 AKIN). ton',141:1,11:
TOO140 hIR, Ay nol V4 slip Iwo)
31)10 /9
I 10' pf lOr11_, 110 . .41 /Oh .kft: t hey& Ji.i ,e.Inteis Lower ithidurqs ore regunett .n regions na..1K1 in* v.upter
r,, 40,1110n ratio - Pi..wculatIon flo.v dtyldrAbv rap, 7/4' 'V ter 110A ppll. I illtrtetik ITteITA ti11.1(1 flfl.i11111(11) tiller's P.4 .c1 tu High Rate Jitifnn It,' oata per lasnInci to roughonq
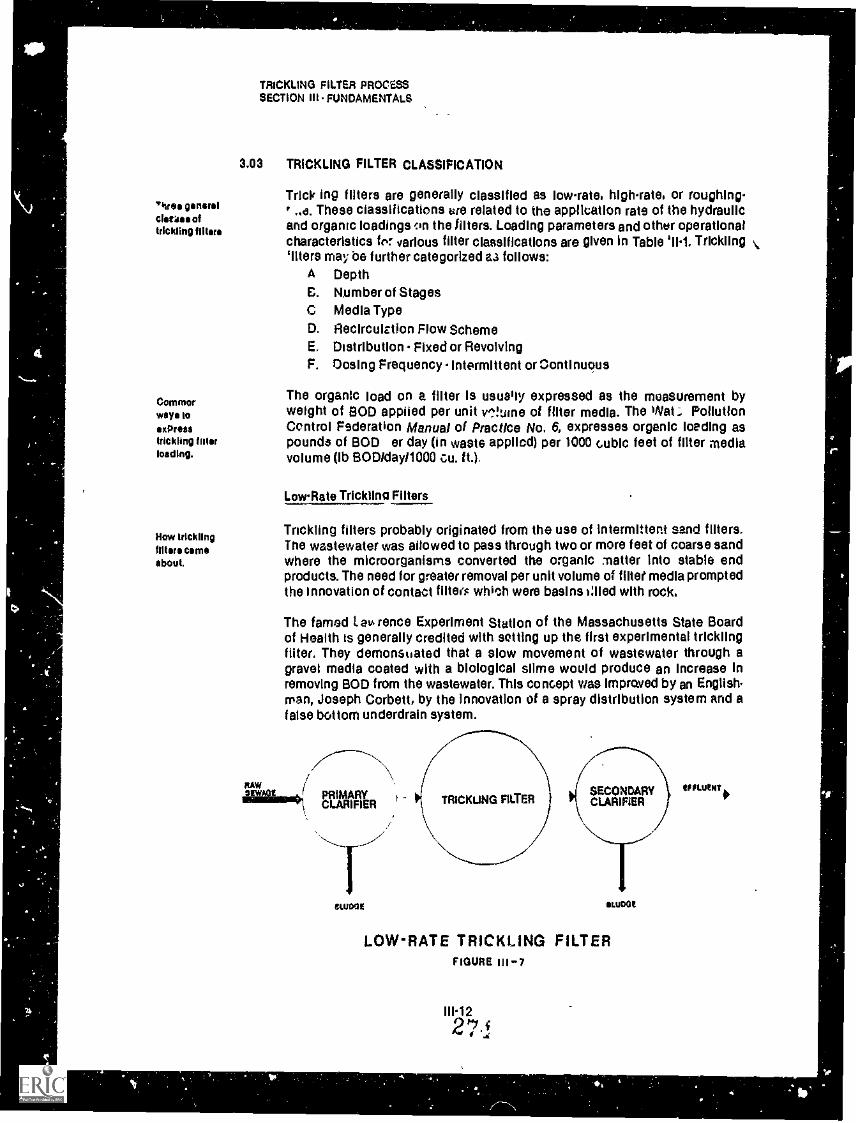
OF
'hum generalclams oftrickling filter.
Commorway. tosomatrickling Misrloading.
How tricklingfilters cameabout.
TRICKLING FILTER PROCESSSECTION lit FUNDAMENTALS
3.03 TRICKLING FILTER CLASSIFICATION
Trick ing filters are generally classified as lowrate, highrate, or roughing...s. These classifications we related to the application rate of the hydraulic
and organic loadings on the filters. Loading parameters and other operationalcharacteristics ler various filter classifications are given in Table '11-1. Trickling`liters may be further categorized as follows:
A DepthC. Number of StagesC Media TypeO. Recircuiction Flow SchemeE. Distribution Fixed or RevolvingF, Dosing Frequency Intermittent or Continuous
The organic load on a filter is usually expressed as the measurement byweight of BOO applied per unit v,!tarie of filter media. The Wet; PollutionControl Federation Manual of Practice No. 6, expresses organic !ceding aspounds of BOD er day (in waste applied) per 1000 cubic feet of filter mediavolume (lb BODiday11000 cu. ft.).
LowRate Trickling Filters
Trickling filters probably originated from the use of intermittent sand filters.The wastewater was allowed to pass through two or more feet of coarse sandwhere the microorganisms converted the organic matter into stable endproducts. The need for greater removal per unit volume of fillet media promptedthe Innovation of contact filter which were basins 1:11ed with rock.
The famed tavrence Experiment Station of the Massachusetts State Boardof Health is generally credited with setting up the first experimental tricklingfilter. They demonstrated that a slow movement of wastewater through agravel media coated with a biological slime would produce an increase inremoving BOO from the wastewater. This concept was improved by an English.man, Joseph Corbett, by the innovation of a spray distribution system and afalse bottom underdrain system.
TRICKUNG FILTERSECONDARYCLARIFIER
aurOOt
LOW-RATE TRICKLING FILTERFIGURE III 7
1112
271
IFFLUNT

How* low-rateilltor operates.
TRICKtiNG Fri TER PROCESSSECTION iu ruttoAtANTA.S
Lowrate filteri" are not usually equipped for recirculation except for thereturn of the sedimentation unit underflow (s'udge) to the plant headworksSome plants do practice recirculation. however, mostly during low flow periodsRecirculation prevents the biological some from drying out and thus improvesfilter performance. Generally, a thick. heavy biological growth is developedon the filter media with only a periodic sloughing. A seasonal change intemperature or wastewater application rate will cause large amounts of thebiological growth to drop from the filter media. Such an unloading 3 especiallynoticeable in the spring and fan The filter sioughings are usually Nell oxidizedand settle readily.
BiologicalMost of tie biological activity in a lowrate filter occurs in the upper three
activity and feet of the filter-bed allowing the autotrophic nitrifying bacteria to grow in theefficiency of a lower portion of the filter. A properly loaded and operated lowrate tricklinglow-rate filler. filter process will consistently produce a high-quality. well nitrified effluent
with a BOD and a suspended solids content in the range of 10 to 25 mg/I
Odors end Hiescommon topricey,.
Concepts of ahigh-rata filmprocess.
Howe high ratefitter ° ales.
A high-tate filtersloughs almostcontinuously
ti
The lowrate filter is a highly reliable biological process with the ability toconsistently Droduce a high quality effluent even with fluctuating loadingrates. Proper control measures m..st be taken to minimize nuisances. such asodors and filter fly breeding which are common to lowrate filters
High-Rate Trickling Filters
By using inplant recirculation to dilute the influent organic strength and tokeep the media voids flushed. high-rate trickling filters allow greater BOOloadings per volume of media. Recirculation also results in the return of activemicroorganisms to seed the filter and aids in the pre iention of odors endflies. Highrate filters may be either single-stage or twostage. The two-stagedesign is capable of achieving the, same removal rates as the lowrate IntelHowever, nitrification does not generally occur unless the BOO loading to thesecond stage is sufficiently reduced.
High-rate trickling filters are generally designed to receive a continuous flowof wastewater All high-rate filters are equipped for recirculation. aithougnsome utilize this feature only during periods of Inv/ flow (See Figure Ili-8 fortypical recirculation 'schemes for High-Rate Trickling Filters). The recirculatonsystem is commonly designei to provide a ratio of 0.5 to 2 Some systemshowever, utilize recirculation to maintain a constant hydraulic loading on thefilter. Tne depth of media in a high rate filter ranges from three to eight feet.with most filters in the three to five foot range. To avoid clogging and improveventilation, a larger size media is used. The media is usually'relattvely uniformand in the range of three to five inch
Due to the greater hydraulic loading, the excess biological growths areflushed from the media on a nearly continuous basis This sloughed materialis not fully oxidized. and has a high BOO content which can cause problemsin the sedimentation unit. Although not as dense as the low-rate filter thehigri-rate filter sloughings still settle readily. A singleStage, high-rate filterprocess usually has a BOD removal efficiency of 65 to 85 percent and seldoriexhibits any significant degree of nitrification A twostage. high-rale filterprocess may attain BOO removal efficiencies of 75 to 90 percent with varyingdegrees of nitrification which depends on the organic loading, filter depth.and wastewater temperature
(/'
I

b%.
Recirculationto front el niterduring low flows.
Rocucolationto front ofprrrstrycadutranratrontank
MICMAC FILTER PROCESSSECTION lit FUNDAMEN TAO
ALS EON ATE REC'NCULATIOtrerammirmriesisimatimmito&saltablimierlaril mum
/I
SEWAGE PRIMAgrCLARIFIER TRICKUNG FILTER )
I
ERMA
cLunee stuo0a
HIGH-RATE TRICKLING FILTERPURE 03
II
1
EFFLUENT'
There are a number of patented modifications of rec.iri..Jlation schemes to thehighrate trickling filter process. Some of these recirculation schemes areshown on Figure 111.9. A brief discussion of these modifications follows:
Aero-Filter
The distinguisping feature of this process is the method of spraying thewastewater over the media. Specially designed distributors are usuallyutilized to provide a "raindrop" application on a maximum surface area atone time. Recirculation (from the final sedimentation tank to the filterinikantyi., practiced only during periods of iow flow to maintain a mini-mum hydraulic loadig of '13 mgad. This procedure allows for an efficientdistributor operation. A deep media bed of 8 feet is recommended for theAeroF titer with a minimum depth of 6 feet. The second filter of a twostage system may have a minimum depth of 5 feet.
The BioFilter has a relatively shallow media bed of 3 to 5 feet. The CriS-to ng uishing feature of this process is the method of recirculation. Filtereffluent, or final sedimentation tank effluent, is returned to the head ofthe primary sedimentation tank. This method of recirculation requireslarger sedimentation units than normal; however, better sedimentationoperation can be attained during periods of low flow.
111-14%,

Recirculation tofront col tillercontinuously
Roughing idlersarc used tobutter highloadings onsubsequentbiologicalprocesses.
See Figurefor lowers.
Roughingtowers canbutter tlyactivatedsludgeprocess.
Roughingtower Is alsocapable ofproducinghIgh-qualltyertluent.
TRICKLING FILTER PROCESSSECTION iii - FUNDAMENTALS
Aceelo-Fliter
The AcceloFitter has a relatively deep bed depth, generally about 6 feet.The cilstinguishing feature of this process is the method of recirculation.The filter effluent is returned to the inlet of that filter or a precedingfilter where it mixes with the raw wastewater. A recirculation ratio of 2 to 1is recommended. jhis method of recirculation reduces fillerodVrs and flybreeding, and increases thp dissolved oxygen concentration. The recir-culation also continuously reseeds the influent filter flow with activemicroorganisms sloughed from;the filer without affecting the hydraulicloading on the primary or final sedimentation tanks.
RoughingRate Trickling Fillers
Roughing filter., are usually designed as an intermediate stage of treatment,and many times precede activated sludge treatment or Secondstage filters.Theire primary function is to reduce high organic loadings on a subsequenttreatment process. Often, roughing filters are utilized at plants receivinghighstrength industrial wastes. A roughing filter may be either a rockfilledfilter or a synthetic mediafilled tower receiving a very high organic loading.Roughing filters have a very high BOO removal efficiency. Generally, a BOOremoval of 40 to 70 percent can be expected from a roughing filter processthat include, sedimentation.
Figure III.10 shows a typical roughirig filter installation.
With the introduction of various types of synthetic media, a new concept intrickling filters has been developed. The synthetic media possesses a greatersurface area and void space than the conventional crushed rock media. Thisallows a greater growth of biological slime per unit volume and permitsgreater hydraulic loadings on the filter without obStructing air flow andoxygen transfer. The synthetic media is lig' .,eight, permitting the construc-tion of deeper filter beds, resulting in smaller diameter units, The increaseddepth is required to provide sufficient contact time at the higher hydraulicloadings. As the recommended bed depths for synthetic media are 15 to 30feet, the resulting tower-like structures are sometimes referred to as biologicaloxidation or roughing towers. The most important application of the biologicaltowers has been as roughing units to absorb toxic or unusually strong in-dustrial wastes and high soluble BOO wastes from food processing industries.
At San Pablct California. a roughing tower buffers the activated Cudge processby absorbing shock loads Toxic wastes occasionally kill the organisms in theupper portion of the roughing tower, however, the following activated sludgeprocess is protected and the roughing tower readily recovers
The synthetic media filters ars not limited to use as roughing filters, they arecapable of producing a high quality effluent with BOD loadings in the high-rate range. Biological towers utilizing plastic packing at 50 to 100 lbs BOW1000 cu. ft /day are capable of act eying approximately the same performanceas rockfilled filters with an organic loading of 30 to 60 lbs 60011000 cu.

TRICKLING ALTER PROCESSSECTION III-FUNDAMENTALS
Rm.PRIMARYgam"CLARIFIER
SETTLE*$1WA011
FitaCotikno
TR/CKUSP1 FILTER
AFRO- FILTER
SECONLIARY
SUNOS
"1
smuts,.
RAWSEVM011
PO CeRGCRATKill
"3.4"tPINNAFITr;LASNPIEA
Ira? ,,P
I41
\ 51 --------.121 / \
1 I / SECONDARY1RICKLING FILTER CLARIFIER )
RAWSCWA0...ma..4),
%VMS SW0011
PRIMARYCLARIFIER
SIMIDSEW Aeat
BIO-FILTER
I I= IMI=LTOVW ..
I /SECONDAR Y
IRK:KUNO FILTER Is
01. CLARIFIER
ACCELO-FILTER
TRICKLING FILTER VARIATIONS
FIGURE RI- 9
111-162"1*'
tritt.0110
4

Rw"e PRIMARYCLARIFIER
SLUDGE
RECIRCULATION IOPTIONAL Irimmunwaimaymommasnemmorimanteimoramenemmi
I ' II .1I I1 II II I
G TRICKLING FILTER INTERMEDIATE ACLARIFIER
loprioNALI
SLUDGE
AERATION BASIN SECONDARYCLARIFIER
RETURN ACTIVATED SLUDGE
a
TYPICAL ROUGHING FILTER INSTALLATIONFIGURE III-10
27j
WASTEswim

Recirculation Isused tomaintainbiologicalgrowththroughoutdepth of media
TRICKLING FILTER PROCESSSECTION in - FUNDAMENTALS
Figure III.11 is a photograph showing the oxidation (biological) towers used atFairfield. California to buffer and reduce the organic loading of highstrengthbrewery waste on the activated sludge process. The air scrubber towers(center) are used to avoid odor nuisances. These oxidation towers are coveredand utilize forced ventilation for exhausting the foul air through the scrubbingtowers.
Recirculation is utilized to provide the hydraulic wetting rate that will main-tain the growth of a biological slime throughout the depth of the media. Thisminimum wetting rate depends on the type and shape of the media. The RODremoval efficiency of a biological tc er is greatly dependent on the maintenance of a healthy biological slime throughout the media depth, as well C4Sthe wastewater characteristics, mode of recirculation, and type of syntheticmedia. A decrease in ROD removal may accompany wetting rates that aregreatly above or below the minimum wetting rate. Modes of recirculation mayinclude one or a combination of the following:
1. Return of the tower effluent to the tower influent to seed the mediaslime growth with suspended biological (sloughings) growths.
2. Return of the clarifier effluent to the tower int uent to dilute the strengthof the influent wastewater.
3. Return the sedimentation unit underflow to the tower influent for thebuild-up of microorganisms to absorb shock loads, and to improveefficiency. Sometimes. the underfloor may be reaerated prior to returning in the tower intuent. This will provide additional buffering forperiods of shock loading.
Figure 111.11Oridetion ditiological) Towers
2,III 18
ir,
ti
TRICKLING FILTER PROCESSSECTION IIIFUNDAMENTALS
REFERENCES
Eckenfelder,W.W., Biological Waste Treatment, Pergamon PreSs, New York, 1961.
Environmental Protection Agency, Process Design Manual for Upgrading ExistingWastewater Treatment Plants, 1974.
Hammer, Mark J., Water and Waste-Water Technology, John Wiley 8 Sons, Inc.,New York 1975.
Hawkes, H.A., The Ecology of Waste Water Treatment, Pergamon Press, Oxford, 1963.
Kerri Kenneth 0., et al.. A Field Study Training Program, Operation of WastewaterTreatment Plants, (Chapter-6), Sacramento State College Department of CivilEngineering.
Lohmeyer, George T., Trickling Filters and Their Operation, Water & Sewage Works,October 1958.
McKinney, Ross E., Microbiology for Sanitary Engineers. McGraw.H ill Book Companyinc., New York, 1962.
Metcalf & Eddy, Inc., Wastewater Engineering. McGrawH New York, 1972.
Minch, V.A., Egan, John T., and Sandlin, Mc0ewain, Design and 00eratiok of PlasticMedia Filters, Joi mat WPCF, Vol. 34, No. 5, May 1962.
Public Works Journal Corporation, Handbook of Trickling Filter Design, 1970.
Reynolds L.B., and Chipperfield, P.N.J., Principles Governing The Selection of PlasticMedia for High-Rate Biological Filtration, 1970.
Schulze, D Sc., Trickling Filter Theory, Water & Sewage Works, R256, October,1960.
The Texas Water Utilities As 'elation, Manual of Wastewater Operations, (Chapter12),1971.
Water Pollution Control Federation. Manual of Practice No. 6. Units of Expressionfor Wastewater Treatment, 1976.
_919111)449.:_k_

V
Laboratorycontrol Is anessential tool.
Good samplingprocedures areessential.
Two types ofsamples.
TRICKLING FILTER PROCESSSEC rtoti tv . LABORATORY CONTROL
4.01 INTRODUCTION
An essential toot for proper process control is frequent and accurate samplingand laboratory control tests. By relating the lab test results to operation, theoperator can select the most effective operational parameters, determine theefficiency of his treatment processes, and identify developing problemsbefore they seriously affect effluent quality. Therefore, laboratory facilitiesplay an important role in the control of an aerobic biological treatment facility.
4.02 LABORATORY SAMPLING AND TESTING PROGRAM
Good sampling procedures are the key to meaningful laboratory analyses. Atypical sample represents only a small fraction of the total flow, and greatcare must be exeicised to ensure that the sample is representative. If thisis not accomplished. the subsequent analytical data is worthless for processcontrol. Therefore, the importance of good and accurate sampling techniquescannot be overstressed.
The exact location of sampling points within a given treatment plant cannotbe specified because of the varying conditions and the plant design. However,it is possible to present certa:n general guidelines which are presented onFigure IV-1.
Two types of samples may be collected, depending upon the purpose ofsampling. The first is a dip or "grab' sample which consists of a single por-tion collected at a given time. The second type of sample is a "composite"sample that consists of portions taken at known times and then combined involumes that are proportional to the flow at the time of sampling. -Thesecombined portions produce a sample which is representative of the wastewatercharacteristics over the entire sampling period.
The preferred sampling procedure, except for certain lab or field tests whichmust be run immediately (Dissolved Oxygen, Temperature, pH), is to collect
24.hour hourly samples over a day, having sample volumes that are in proportion tocomposite the wastewater flow rate, When available and where possible, automaticsampling Is sampling devices Should be employed. The sample containers and samplepreferred. lines should be thoroughly cleaned each time to prevent sample contamina-
tion. The hourly grab samples should be composited into a labeled plasticgallon bottle and kep /refrigerated at 3 or 40 C. to prevent bacterial decom-position. For some ests (such as the nitrogen tests). other method's ofpreservation may b needed. refer to Standard Methods for recommendedpreservation proce uses. A final composited sample volume of 2 to 3 liters isusually sufficient to perform all routine tests. Where collection of an hourlysample is not feasible, a 2 or 3 hourly sampling procedure is the next bestalternative. The sampling method and time of sampling should be noted uponthe lab record (log) sheet as reference for later data review and interpretation.
if only grab Grab Samplessamples arecollected. theoperator must Grab samples are representative of the instantaneous characteristics of thesample during wastewater If it is only possible to collect grab samples, they should bepeak flow collected when the. treatment plant is operating at peak flow conditions.conditions.
IV1
.

TRICKLING FILTER PROCESSSECTION" LABORATOAY CONTROL
Sampling point should be readily1
accessible and adequate safety
precautions should be observed.
1
fJ
3iiii7i)
....
1
No deposits or materials should be
collected from the side walls or
the water surface.
.140..
"FP*.
Sample must be taken where the
wastewter is mixed and of
uniform composition.
MIXED
Ire,. 41,4;41,,
+t..).`11"1:.-"
....44,..,,,k, 1.1,,, 1
:vX\-:` IV '.<.-....10.-' t.:'
Large or unusual particles should
not be collected with routine
samples.
.4
." tl . .
.' ..
.,.%... ,
.
Sample should be delivered and
analyzed as soon as possible.
Stored samples must be
refrigerated at 3 to 4° C.
___,
Soc.4C
Ai ffWASTEWATER SAMPLING GUIDELINES
FIGURE IV-1
IV2 2"

24-Hourcomposites arethe best fordeterminingorganic loadingandperformance.
Calculation forcompositesampling.
TRICKLING FILTER PROCESSSECTION IV LABORATORY CONTROL
t Sample collection shouliipe conducted systematically at various samplinglocations during the flow seque9e through the plant. Grab sampling timesmay be systematically stagdeeed to account for the respective hydraulicdetention time of each unit proc9s fro this manner, a slug of water may betheoretically followed throglithe tre atment plant. For example, if the hy-draulic detention period through a particular unit process is two hours;then the grab sample of the effluent from this unit should be collected twohours after the influent sample. In this manner, the samples can be assumedto be representative of the wastewater before and after treatment.
Composite Samples
Composite samples generalli represent the wastewater characteristics overa specified period of time. The ideal procedure incorporates the use of 24hourcomposite samples consisting of hourly grab samples proportioned to theflow at the time of sampling. This procedure is only feasible in treatmentfacilities with 24-hour attendance or where automatic samplers are warranted.Adequate results, however, can generally be obtained from analysis of ,com-posite samples collected over a shorter period. In those facilities whereautomatic samplers are not available, collection of composite samplesduring the number of shifts worked would be sufficient as long as peak flowperiods are included. A total composited sample volume of approximatelythree liters is generally sufficient to perform the routine process control tests.
The total amount of sample required, the number of samples required, thegate of flow at the time of sampling, and the estimated average daily flow'rate,can be used to calculate the amount of sample to be collected during eaphsampling period to represent the daily flow from the following equation:
Amount of sample to collect, ml =
(Rate of flow, mgd (4) time of sampling) (Total sample required, ml)
(Number of samples collected) (Average daily flow, mgd)
Example Calculation
A. Data Required1. Rate of flow at time of sample collection = 1.5 mgd2. Total sample volume required = 3 liters or 3000 ml
Note: ml = (liters) (1000)3. Number of samples to be collected = 84. Average daily flow = 0.9 mgd
13. Determine le amount of sample to be collected for the presentflow rate in milliliters.
2s'.-e
11/-3

TRICKLING FILTER PROCESS. SECTION IV LABORATORY CONTROL
.
Y
Lab controlreqUIte .dequtefollie andtechnics' sides.
Minimum testsfor lowrsiefilters.
4
`---....
IAmount of sample = (Rate of flow, mgd) (Total sample required, ml)
to collect, ml (Number of samples) (Ave. daily flow, mgd)
(1.5 mgd) (3000 ml)
(8) (0.9 mgd)
= 625 ml
Laboratory Control Program
,.;
The specific laboratory tests and frequency which they are performed forprocess control and. performance evaluation Iviil vary from plant to plantdepending on the type of tricgilng !liter process, plant size:laboratory facilities,available manpower, and technical skills. Minimum sampling and testingprograms for typical trickling filter processes are presented on Figure IV-2.
t.-
Low-hate Trlating Filter Process
The low-rate 'trickling filter process does not require complicated orstringent process control measures. However,%the process does requiredaily attention to maintain efficient and trouble-free operation. At asmaller plant, the -following tests would be sufficient in evaluating theperformance of a low-rate'filter process:
' BODSettleable MatterSuspended MatterTemperaturepH
Dissolved CWgen
At « ,anger plant, the laboratory control prodram should also includeammonia and nitrate nitrogen daterminations. The presence of 2 to 15mg/I of nitrate nitrogen in the filter effluent usually indicates a highdegree of stabilization. A typical sampling and testing program may be-developed for a low-rate filter process by referring to Figure IV-2.
High-Rate Trickling Filter Process
) Like the low-rate trickling filter process, the high-rate process requiresMinimum tests limited daily maintenan:m for an efficient and trouble-f reikoperation. Thefor highrate recirculation flow scheme and rate should be regulated to attain the besttotem possible performance at the least expense. At singlestage trickling filter
plant.% the following tests would be sufficient in evaluating the filterq performance:
BOD
Settleable MatterSuspended MatterTemperaturepH
Dissolved Oxygen
2°11,1-4
c
)
..
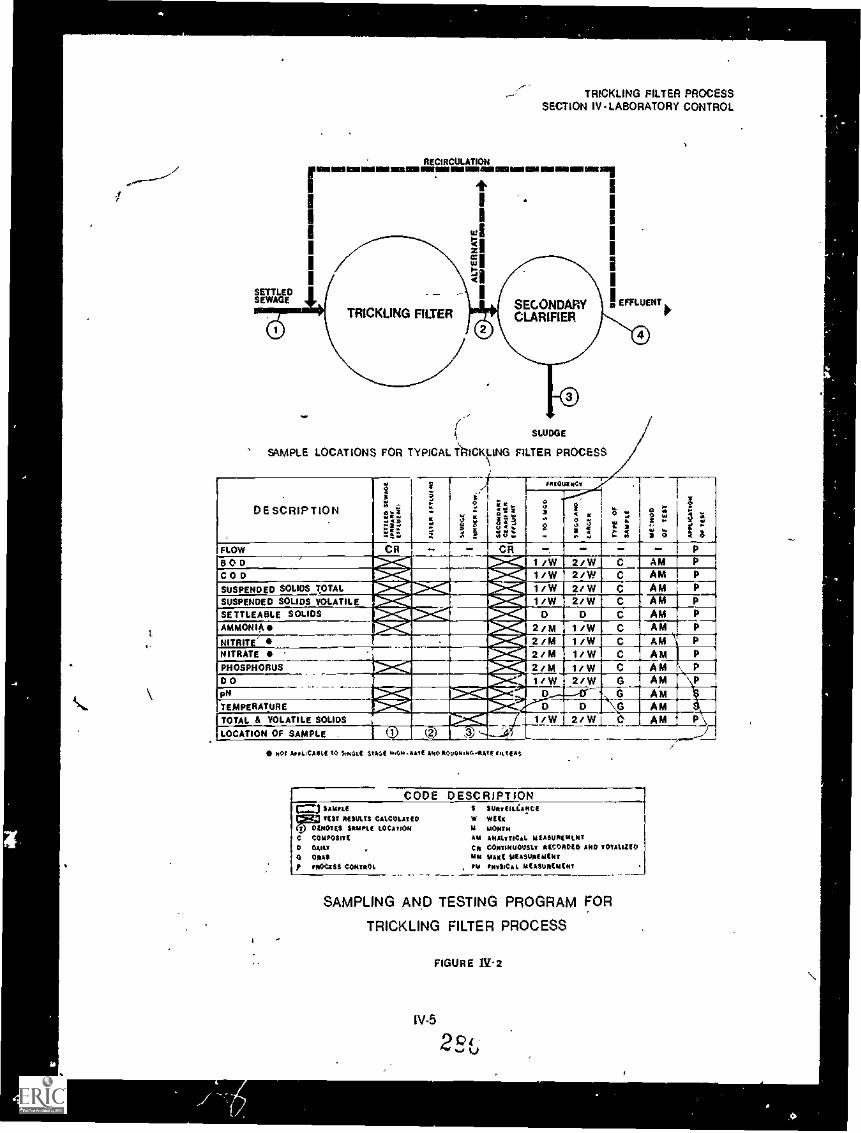
TRICKLING FILTER PROCESSSECTION IV -LABORATORY CONTROL
RECIRCULATION
rimmiI
I
onfinsmsassursayamosimansemmanmosimovemesi
SETTLEDSEWAGE
TRICKLING FILTERSECONDARYCLARIFIER
SLUDGE
Iaaaaaa
! EFFLUENT
SAMPLE LOCATIONS FOR TYPICAL TI:11CK4ING FILTER PROCESS
DESCRIPTION
.R.. r,:11!,l;'C4
s
-,
.I
7----xt,
1 1V
M: tt r.
sagouvecT
! t 6.r- !
9 2,.. W
f, "I t; ...0
r( a
01
;- .
FLOW CR CR P
Et 0 D 11014 110---11 1/W 2 / W C AM P
Coo 10"......w.1511
011-=-111111111-,,e1111
1115.----1
11P--"wrill...-$-_.p...1..._-414
so---_." ..1-4111EITZI
1 / W1/W
MAII2/W2/W
C AM P
SUSPENDED ROMS TsOTAL CC
AMAM
P
PSUSPENDED SOLIDS VOLATILE
SETTLEABLE SOLIDS 10-7....11011-..111111.1111
1 0 0 C AM P
AMMONIA
NITRITE
Wigs1 2 / M 1/W C AM100-7.7A111 2/M 1/W C AM
NITRATE ,
110-_.0...11.
111=
VELAII:10-NO'
2/M2/M
1/W1/W
CC
AM P
PHOSPHORUS AM '00 1 1 vi 2/W G AM T P
PR 105--- 111 0 G ANTEMPERATURE 10---.01.111 0 0 G AMTOTAL & VOLATILE SOLIDS 1111Mp......0111 1 W 2/ W A M
LOCATION OF SAMPLE . 0 ,
N41 ALICA$LE 10 30.411 $1,44114.414-401 ANORGyordord611tA EvoLTEAL
CODE DESCRJPT$ON=j SAMPLE $ MAMMA:AMC(
Fi$$$$ RESULTS CALCULATE° W WEEKNOTES mue tocoolott M MONTM
C COMPOSITE AM ANALYTICAL MEASURE/ELIOT
O DAILY CA CONTINUOUSLY RECORDED ANO TOTALIZE°
Q ORA* MM MAKE MEASUREMENT
? PROCESS CONTROL , PTA PITTSICAL MEASUREMENT
SAMPLING AND TESTING PROGRAM FOR
TRICKLING FILTER PROCESS
FIGURE 11/.2
11/.5
2 1.)
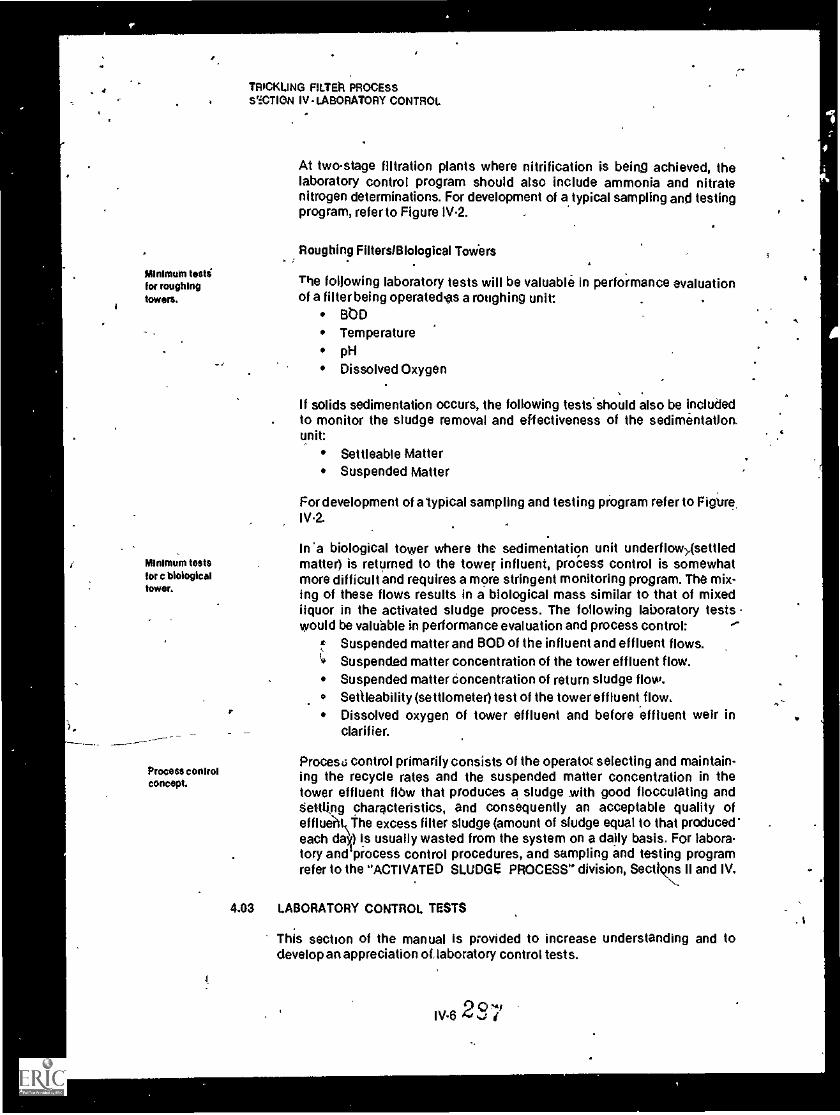
4
r
V
4
i
Minimum testsfor roughingtowers.
Minimum testsfor c biologicaltower.
Process controlconcept.
r
TRICKLING FILTER PROCESSSSCTION IV LABORATORY CONTROL
At twostage filtration plants where nitrification is being achieved, thelaboratory control program should also include ammonia and nitratenitrogen determinations. For development of a typical sampling and testingprogram, refer to Figure 1V2.
Roughing Filters/Biological Toviers. :
The following laboratory tests will be valuable in performance evaluationof a filter being operatedes a roughing unit: .
BOD
TemperaturepH
Dissolved Oxygen
If solids sedimentation occurs, the following tests should also be includedto monitor the sludge removal and effectiveness of the sedimentation.unit:
Settleable MatterSuspended Matter
For development of atypical sampling and testing program refer to Figure,IV2.
In 'a biological tower where the sedimentation unit underflowy(settledmatter) is returned to the tower influent, process control is somewhatmore difficult and requires a more stringent monitoring program. The mix-ing of these flows results in a biological mass similar to that of mixedliquor in the activated sludge process. The following laboratory testswould be valubble in performance evaluation and process control: ,-
Suspended matter and BOD of the influent and effluent flows.Suspended matter concentration of the tower effluent flow.Suspended matter Concentration of return sludge flow.Setileability (settlometer) test of the tower effluent flow.Dissolved oxygen of tower effluent and before effluent weir inclarifier.
Procesd control primarily consists of the operator selecting and maintain-ing the recycle rates and the suspended matter concentration in thetower effluent flow that produces a sludge with good flocculating andsettling characteristics, and consequently an acceptable quality ofefflueX The excess filter sludge (amount of sludge equal to that producedeach days) usually wasted from the system on a daily basis. For labora-tory and process control procedures, and sampling and testing programrefer to the "ACTIVATED SLUDGE PROCESS" division, Sections II and IV.
4.03 LABORATORY CONTROL TESTS
This section of the manual is provided to increase understanding and todevelop an appreciation of,laboratory control tests.
11/.6 .r..,9 ,j0 imf
4
0
.t

t
4,
.
.,
v
Sampling andanalyses mustbe increasedwhen hepa as Upset.
.
Typicalworksheetsprovided.
. . ,i The 5Day BOD.
i
.,
Calculatingremovalefficiency.
4
1 Minimum of twodilutions, atMast 2 moil D.O.usedmust beat least 2 mglileft after 6 -days.
,
t
ri
4.
TRICKLING FILTER PROCESSSECTION IV LABORATORY CONTROL
the tests discussed are those necessary for routine pi ocess control when thebiological system is operating properly. Additional analyses and increasedfrequency of analysis for the routine analysis may be required for abnormalconditions. Specific suggestions are mace for abnormal operation in SectionI, "TROUBLESHOOTING." However, the operator must rely upon his ownjudgrrient to determine which analyses he needs to conduct to supply theinformation that he desires.
Typical worksheets have been provided in Appendix A to assist the operatorin developing systematic data collection, calculation, and recording. Pre.cautionary procedures are presented for each of the tests presented in this'section to make the, operator aware of the common pitfalls. Except where a.,specific note is made, all analyses ate referenced to the fourteenth.editionof "Standard Methods for the Examination of Waters and Wastewaters."
Biochemical Olcygen Deri d (BOD)
The biochemical oxygen de nd is determined by incubating a sample ofknown volume in the presence of microorganisms, excess nutrients, anddissolved 0,,,ven. A" properly conducted BOD analysis will have organicmatter as the growth limiting substance. If oxygen is limiting, the analysisis not.meaningful.
The BOO is an indevol.the amount of oxygen that will be consumed by thedecomposition of the organic matter in a wastewater. The analysis consistsof measuring the initial dissolved oxygen concentration, incubation for fivedays at 20° C, and measuring the final dissolved oxygen. The difference indissolved oxygen concentration corrected for the initial dilution is called the"BOD. The BOO test is,related toboth the organic loading upon the biologicalprocess as well as trig removal efficiency of the process. The difference be-tween the BOO applied and the BOD leaving the process is equal to the BOOremoved by the process: The difference. is part of the data required to deter.mine the Wading upon the process. For example, the organic loading uponthe trickling filter process.is expressed as-the pounds BOD applied per dayper 1000 cubic feet of filter media. Historically the organic loading on atrickling filter has been expressed as BOO applied. The efficiency of theprocess is determined by thVollowing formula:
BOD applied, lblday - BOO leaving, Iblday x 100 the removal efficiency, %BOO applied, lbiday -
.
In this determinations the combined- efficiency of the trickling filter andclarifier are considered.
Precautionary Procedures
When performing BOO analyses trio following procedures should befollowed in conjunction with the procedures outined in Standard Methods.
I) A minimum of two dilutions per sample should be used: Onlyanalyses with oxygen depletiOns of greater than 2 mg/1 but with noless than a residual 01,2.0 mall after five days of incubation at 20° Cshould be used to calculate the BOD. Generally, the highest valuecalculated should be Used to rbprespnt the BOO.
IV7 2SS
I
.%

)
V
TRICKLING FILTER PROCESSSECTION IV LABORATORY CONTROL
P#Ix samples 2) Samples should be well mixed before the- diltitions are made. Awell. wide tip pipette should be used for making the dilutions. The wide
tip does not clog with suspended solids. 1
3) Samples and the dilution water must be carefullyLadded to theBOD bottle to avoid aeration?nd the possibility lof entrainingbubbles in the solution. 0 .
4) The BOO incubator must be maintained at 20° * 1° C for the entireNote SDays 5 day (Note: 120 hours) period. Record the temperature of themean 120Hopre. incubator from a NBS certified thermometer placed in a beaker of
water in the incubator.5) IF the BOD valuof the more dilute sample is always greater, this
may indicate that there is some toxic material iti the wastewater,which is inhibiting the bacteria. A series of dilutions should be setup and run. If the BOO is increasing with higher dilution, this mayindicate a condition known as a toxic -slide. Further analysesshould be conducted to determine the nature ofthe toxic material,and if it appears that the concentration of the toxicant is significant,efforts should be initiated to identify the source and reduce the
iconcentration of the toxicant in the wastewater.
6) Use of a primary standard is strongly recommended. The standardshould be made of glucoseglutomic acid mixtureand it shouldbe made op at a BOO near those levels in the treatment. 'Slantinfluent. The primary standard should be made up and analyzedweekly. Any significant variation (more than * 20%) should causethe operator to be suspicious. Efforts should be undertaken toreview the laboratory procedure, and find out what is causing theproblem. Each operator should analyze the standard and the resultsshould be within ± 10%. Operators not f allipg within this rangeshould review their laborator techniques and make the appropriateadjustments.
7) Wastewaters f hat have been partially nitrified may produce highBOO results. The Increased oxygen demand results from the oxi-dation of ammonia to nitrate. The use of allylthloprea In the dilutionwater will inhibit the nitrifiers and alleviate this problem.
*mkt aerationduring bottlefilling.
Toxic slide-.
Primarystandard madefrom glucose-glut:mit acid.
Use allythrloureato inhibitninfiera.
COD Is fast endreproducible.
The COD labetter forprocess control.
r Chemical Oxygen Demand (COD)
i
The COD Is an estimate of the total oxygen demand that results from the de.gradable organic matter. The analysis consists of oxidizing the organic matter,with potassium dichromate in a heated strongly acidic solution.
While the BOD analysis is an index of the biodegradable organic matter, it isrot very useful Ior process control because of the five day lag in time. TheCOO test is rapid (3.4 hours); it is not subject to interferences from toxicmaterials; and it is not affected by ammonia oxidation.
The COD removal of a biological process is directly relatable to the amount ofbiological growth that can result from this removal. The COO analysis"suffersfrom the disadvantage that it does not measure the rate of biodegradabilityof matter removed and therefore it is-difficult to predict the effects of effluentson the oxygen resources of retfeivIng waters and the treatability of a particularwastewater.
1V.8
280-L, .44
as
1
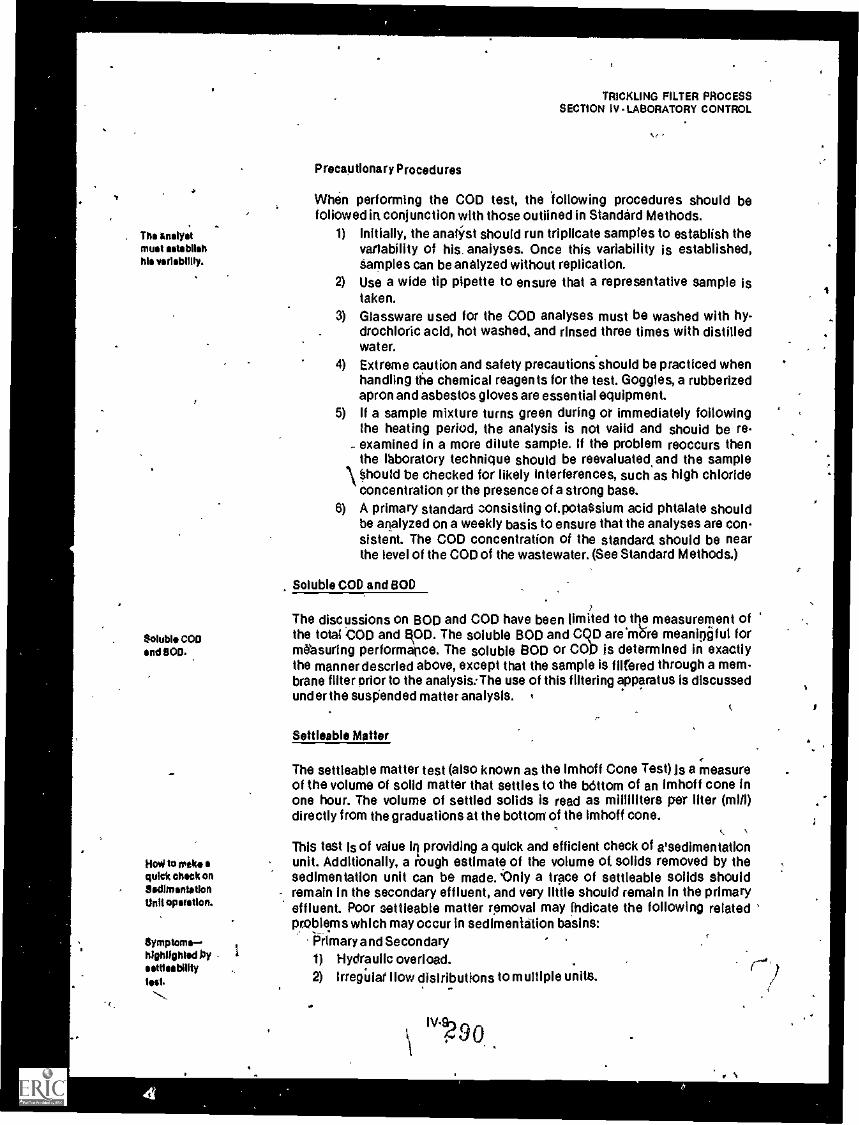
.Tits analystmust establishhis vsrlablilly.
Soluble COOsod SOO.
HOW to (Peke aquick check onSedimentationUnit operation.
SymptomsIslobliented PysettlesbIlltylest.
.......
.
TRICKLING FILTER PROCESSSECTION IV- LABORATORY CONTROL.
it
Precautionary Procedures
When performing the COD test, the following procedures should befollowed in conjunction with those outlined in Standard Methods.
1) initially, the analyst should run triplicate samples to establish thevariability of his. analyses. Once this variability is established,Samples can be analyzed without replication.
2) Use a wide tip pipette to ensure that a representative sample istaken.
3) Glassware used for the COD analyses must be washed with hy-drochloric acid, hot washed, and rinsed three times with distilledwater.
4) Extreme caution and safety precautions should be practiced whenhandling the chemical reagents for the test. Goggles, a rubberizedapron and asbestos gloves are essential equipment.
5) If a sample mixture turns green during or immediately followingthe heating period, the analysis is not valid and should be re-
- examined in a more dilute sample. If the problem reoccurs thenthe ihboratory technique should be reevaluated and the sample0ould be checked for likely interferences, such as high chlorideconcentration or the presence of a strong base.
6) A primary standard consisting of.potassium acid phtalate shouldbe analyzed on a weekly basis to ensure that the analyses are con-sistent. The COD concentration of the standard should be nearthe level of the COD of the wastewater. (See Standard Methods.)
Soluble COD and sOD
The discussions on BOO and COD have been limited to the measurement ofthe total COD and ROD. The soluble BOD and CQD are more meani9aful formeasuring performance. The soluble BOO or COD is determined in exactlythe manner descried above, except that the sample is filtered through a mem.brane filter Prior to the analysis: The use of this filtering apparatus Is discussedunder the suspended matter analysis. A
A
Settleable Matter
,The settleable matter test (also known as the Imhoff Cone Test) is a measureof the volume of solid matter that settles to the bOttom of an Imhoff cone Inone hour. The volume of settled solids is read as milliliters per liter (mill)directly from the graduations at the bottom' of the Imhoff cone.
' lThis test is of value Iri providing a quick and efficient check of atsedimentationunit. Additionally, a rough estimate of the volume of. solids removed by thesedimentation unit can be made. 'Only a trace of settleable solids shouldremain in the secondary effluent, and very little should remain in the primaryeffluent. Poor settleable matter removal may indicate the following relatedproblems which may occur in sedimentation basins:
Primary and Secondary1) Hydraulic overload. .
2) Irregillar flow distributions to multiple units.r' )
111.9-1 ^
1
a
i

. - .
:-.
.. I
TRICKLING FILTER PROCESSSECTION 1V -LABORATORY CONTROL
3). Excehsively high velocity currents..1). Effluent weirs of uneven height - short circuiting.5) Improper sampling technique.6) 'Improper raw sludge removal rates.
Secondary Only1), Biological upset.
Precautionary Procedures
When performing the settleable solids test, the following proceduresshould be followed in conjunction witti those outlined in Standard Methods.
1) Take a sample volume greater thah one liter.2) Use grab samples for this analysis.
f 3) Fill the Imhoff cone exactly to the one liter mark in one rapidpouring without stopping. ,
4) After the sample hat; settled for 45 minutes, either gently tap thesides of the cone or gently spin the cone between the palms ofyour hands to settle those solids adhering to the sides of the coneabove the compacted settled lay9r at the bottom of the cone/1
. 5) Read.and record the volume of settled matter (mill) at the end ofonehour. Read the graduation at the'average solids depth and not .at a peak or void area on the surface of the settled solids. *
Meaeureof theflIttiablesolids.
1
IMO this test.
i
Total Suspended Matter
The suspended matter test refers to the solids in suspension that can be .
removed by standar() jilteringlaboratohr. procedures. The suspended Matteris determined by filtering a knbwn volume of sample through a weighedglass-fiber or membrane filter disc in an appropriate filtering apparatus. Thefilter with the entrapped solids isvendr -d at 103° - 105° C and then cooledin a desiccator and subsequently weighed. The increase in filter weightrepresents the suspended matter. '.
The significan9e of the suspended matter test is genetally dependent on thetype of ,treatment process and thd location Of measurement within that process application. Resulti of the test have- the following uses' in process,control: . .
1) Evaluating the organic strength of the wastewater. ,
'2) Evaluating clarifier solids loading. ' 1
,3) Determine the sludge recycle rate by calculation.4) Calculating clarifier solidsecapture. .
5) Estimating the solids inventojy.
Precautionary Procedures
When performing the suspended matter test, the following proceduresshould be followed in conjunction with.tha procedures outlined in StandardMethods.
, 4 .
1) The sample must be thoroughly mixed prior to taking a samplealiquot.
ivlo291
t
I
1

Use wide tippedpipette.
/temperaturebetween 103.10P C.
NO2 a parflaliiioxidized form dinitrogen.
High NO2concentrationsImplyincomplete,nitrification.
'Analyzer'', soon .
as possible.
Semple must becool.
el%
A.
- TRICKLING FILTER PROCESS0 SECTION I1/ LABORATORY CONTROL
2) Do not use a smalltipped pipette to measure the sample aliquot.A widetipped pipette should be utilized to permit passage of thelarger solids and to facilitate rinsing. An alternate Method ofobtaining a sample aliquot would be to pour it into a gradu'atedcylinder.'
3) Rinsesill adhering solids from graduate (or pipette) with distilledwater. Pour rinse water through the filter.
4) Test results that appear faulty Or questibnable should be 'dis-regarded.
5) Iris important to always maintain a temperature of between 103105° C in the drying over'. The temperature must be monitored andrecorded in a record book.
6) Be sure that the paper litter properly seated in the filtration-apparatus before pouring the sample. This is easily accomplishedby wetting the filter paper with distilled water, then applyingvacuum to the filtration apparatus. .
7) Samples containing high solids levels may require more Than onehour to completely dry.
8) Be consistent in the length of time the filter apparatus and paperare allowed to cool in the dessicator both before and after filtering.
9) Use Whatmaq filters and a millipore filter- apparatus withsintered glass seat for this analysis.
Nitrite Nitrogen
Nitrite (NO2) is an intermediate oxidation state of nitrogen between ammonianitrogen and nitraternitrogen. Nitrite is transatory and, readily' amenable toboth bacterial oxidation to nitrate or reduction to nitrogen gas dependingupon environmental factorssuch as dissolved oxygen and microbial conditions.'
The nitrite concentration can be used to monitor howwell nitrification isprogressing in a treatment process. High nitrite concentrations indicate in-complete nitrification, and could lead to problems, such as high chlorine andoxygen demands.
Precautionary Procedures
When performing the nitrite nitrogen test, the following procedUres shpuldbe followed in conjunction with the procedures outlined in StandardMethods. .
1) Use extreme caution In handling the chemical reagents to avoidinjury or damaged clothing.
Z Due to the jnstability of nitrite (NO2), the composite samples usedfor the nitrite analysis should be preserved by one of the following,methods: (a) freezing, or (b) 5 vnlpf chloroform per liter of sample.
3) The samples must be cool 'when the analysis is perforined orerroneous results will be measured.
4) Deviation from standard procedure may yield erroneous results.Be consistent in your laboratory technique.
"t
92
ak
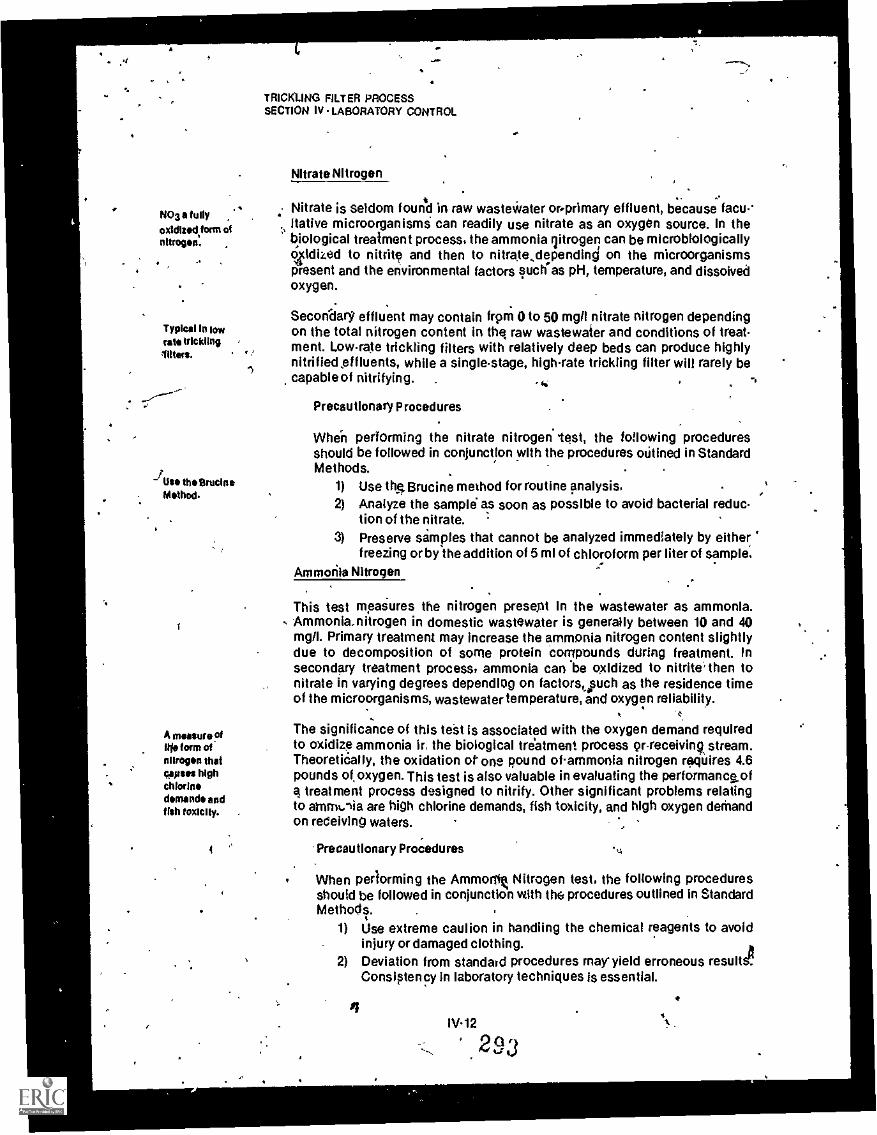
NO3 a fully
oxiclindform ofnitrogen.
Typical In lowrate tricklinglitters.
Use the aminoMethod.
A measure oflife form ofniirogen thataanses highchlorinedemand* andfish toxicity.
4
TRICKLING FILTER PROCESSSECTION IV LABORATORY CONTROL
Nitrate Nitrogen
.Nitrate is seldom found in raw wastewater or primary effluent, because facu--Relive microorganisms can readily use nitrate as an oxygen source. In thebiological treatment process, the ammonia r)itrogen can be microblologicallyoildized to nitrite and then to nitrate depending on the microorganismspresent and the environmental factors such'as pH, temperature, and dissolvedoxygen.
Secondary effluent may contain from 0 to 50 mgll nitrate nitrogen dependingon the total nitrogen content in the raw wastewater and conditions of treat-ment. Lowrate trickling filters with relatively deep beds can produce highlynitrified effluents, while a singlestage, high-rate trickling filter will rarely becapable of nitrifying. .
'411
Precautionary Procedures
Whin performing the nitrate nitrogen -test, the following proceduresshould be followed in conjunction with the procedures (Alined in StandardMethods.
1) Use t4.Brucine method for routine analysis.2) Analyze the sampid as soon as possible to avoid bacterial reduc-
tion of the nitrate.3) Preserve simples that cannot be analyzed immediately by either
freezing or by the addition of 5 ml of chloroform per liter of sample.Ammonia Nitrogen
This test measures the nitrogen present in the wastewater as ammonia.Ammonia.nitrogen in domestic wastewater is generally between 10 and 40mgll. Primary treatment may increase the ammonia nitrogen content slightlydue to decomposition of some protein compounds during treatment. Insecondary treatment process, ammonia can be oxidized to nitrite' then tonitrate in varying degrees depending on factors, such as the residence timeof the microorganisms, wastewater temperature, and oxygen reliability.
.
The significance of this test is associated with the oxygen demand requiredto oxidize ammonia ir, the biological treatment process nrreceivinq stream.Theoretically, the oxidation or one pound of-ammonia nitrogen requires 4.6pounds of oxygen. This test is also valuable in evaluating the performance.of
treatment process designed to nitrify. Other significant problems relatingto arnrmila are high chlorine demands, fish toxicity, and high oxygen demandon receiving waters.
Precautionary Procedures
When performing the Ammon% Nitrogen test, the following proceduresshould be followed in conjunction with the procedures outlined in StandardMethods.
1) Use extreme caution in handling the chemical reagents to avoidinjury or damaged clothing.
2) Deviation from standard procedures may yield erroneous results!Consistency In laboratory techniques is essential.
11/2
293
4
.

a,
it
S
.
Essential tobiologics!growth. .
e
TRICKLING FILTER PROCESSSECTION IV-LABORATORY CONTROL >
Total Phosphorus .
Phosphorus is one of the nutrients essential to biological growti in secondarytreatment processes. Most wastewaters have More phosphorus availablethan is required for biological growth and assimilation of the carbonaceousBOD. A deficiency of phcisphorus may result from high waste loading fromindustries, such as canneries which generally have wastes that are high in .carbohydrates and low hi nutrients. Such a phosphorus defficiency may limit .
biological growth and lead to poor BOD removals.
Typical raw domestic wastewater contains approximately 10 mgfi of phosphorusof which 20 to ) percent maybe removed by the .growth of microorganismswhich are wasted from the process. Greater removals may 1- Obtained byvarious processes involving addition of a metal on such as iron or aluminumto chemically precipitate iron or aluminum phosphate. Othei removal pro-cesses involve pH adjustment by addition of time or other means wit chemicalprecipitation of a calcium phosphate.
a
An Importantparameter.
s
Precautionary Procedures
When performing the total phosphorus, test, the following procedures 'should be followed in conjunction with the procedures outlined in StandardMethods. . .
1) Use extrrsme caution in handling the chemical reagents to avoidinjury or damaged ciothing.
2) Record specific procedures used fiir.pretreatment of sample andmeasurement of phosphorus concentration with test results. Also,dearly indicate the expression of the test results, P or PO4. (Note;1.00ingil P equals 3.06 mgfl PO4.)
' 3) Deviation from standard procedure may yield erroneous results.. .
Be consistent in your laboratory technique..
Dissolved Oxygen
Dissolved oxygen (DO) is that oxygen dissolved in liquid and is usually ex-pressed as milligrams per liter (mgf1). There are various tests to determinethe DO content of water. Generally, the' lodometic methods and the membraneelectrode (DO probe) are best suited for the dompstic wastewater application.The azide modification of the iodometric method (also known as WinklerMethod) is recommended for most wastewater and stream samples. Whendetermining the DO in trickling filter effluent end other biOlopicai flocs whichhave a high oxygen utilization rate, the copier sulfate-sulqmic acid flocc We-tion modification should precede the azide modification t&' -retard biologicalactivity and to flocculate suspended Solids. The membrine electrode methodis becoming increasingly more popular because of its speed, ease of opera-tion, and adaptability to process control instrumentation. The membraneelectrodes must be properly maintained and calibrated on a daily basis toensure that their measurements are acturate and usablfor process control.
IV13
294..
ji
N
.
.

t 00.Maaamemsnt
, can Mused tocontrol aeration.- A
flat spacial careInampling.
PerformImmediatelyalter sampling.
An importantmeasure for themIcroorgabiam.
goo grcbsamples- -analyzetrnmidlataly.
TRICKLING FILTER PROCESSSECTION IV LABORATORY CONTROL
The significance of the DO test in procest control is in its measurement ofthe dissolved oxygen available forond essential to aerobic decompositionof the organic matter; otherwise, anaerobic decomposition may occur withthe possible development of nuisance coliditions. The DO test is also usedin the determination of BOD as discussed preVlously. Fish and most aquaticlife require dissolved oxygen to sustain their exiltence and the DO test is animportant measurement in plant effluents and receiving water quality.
Precautionary Procedures
When performing The DO test, the following procedures should be allowedin'conjunction with the procedures outlined in Standard Methods.
1) Use extreme caution in handling the chbmical reagents to avoidinjury or damaged clothing.
2) The use of special DO sampling equipment is preferable for collecting samples. The:sampleis should be taken with the samplecontainer completely Immersed and without aeration of the sampleor entrapment of any air bubbles.
3) Perform DO test immediately following collection of sample.4) The following substances will interfere in-the azide modification
of the iodometric DO analysis: iron salts, organic matter, excessivesuspended matter, sulfide, sulfur dioxide, residual chlorine,chromium, and cyanide.
Hydrogen Ion Concentration (OH)
The intensity of acidity or.alkalinity of a solution is numerically expressed byits pH. AIM value of 7.0 is neutral, while values 7 to 14 are alkaline and values0 to 7 are acid. pH can be measured colorimetrical'v or electrometrically. Theelectrometric method (pH meter) is preferred in all .ipplications because It isnot as subject to interference by color, turbidity, colloidal matter, variousoxidants and reductants as is the less expensive colorimetric method.
The pH measurements are valuable in process control because pH as orfe ofthe environmental factors that affect the activity and health of microorganisjns.Sudden changes or abnormal pH values may be indicative of adverse industrialdischarge of a strongly acid or alkaline waste. 1Strch discharges are detriMentalto biological processes as well as to the collection system and treattnentequipment and should be either stopped or neutralized prior to discharge.Generally, the pH of the secondary effluent will be Close to 7. A pH drop maybe noticeable In a biological process achiing nitrification because alkalinityis destroyed and carbon dioxide is produced during the nitrification process.
Precautionary Procedures
When performing the pH test, the following procedures should be followedin conjunction with the procedures outlined in Standard Methods.
1) Grab samples should be used for the pH measurement. The pH.test should be performed on the samples immediately followingcollection before the temperature or dissolved gas content can
4 change significantly. Do no heat or stir the pH sample as a changein temperature or dissolved gas content will affect the pH value.
111.14
C117'
.a.

t*.
1'
4
Calibrate the pHmeter daily.
Exerciseextreme carewith electordes.
.
TRI9KLING FILTER PROCESS -
SECTION IV LABORATORY CONTROL
2) Do not contaminate the buffer by pouring the used.buffer solutionback into the buffer container.
3). Calibrate the pH meter daily with a buffer solutialot approximatelythe same temperature %rid pH as the sample to be tested.Adjustthe pli'meter's temperate, compensator for each pH measurement.
4) Avoid fouling the electrodes with oil or grease.5) Erratic results or drifting should prompt an investigation of the
electrodes.1
Temperature
In process control, accurate temperature measurements are helpful in evalu-ating process performance because temperature is one of the most important
Temperaturefactors affecting microbial growth. Generally stated, the rate of microbial
'''-affects growth growth doubles for every 10° C increase in temperature within the specifictemperature range oft-19,microbe. Temperature measurements can be helpful
mdLorganisms. in detecting. infiltrationiinliow problems and illegal dischargefs.Thermometers are calitrated for darter total immersion or partial immersion.A thermometer.calibrated for total immersion must be completely Immersed
. in the wastewater sample to give a borrect reading, while a partialimmersionthermometei must be immersed in the sample' to the flepth at. the etchedcircle around the stem for a correct readinb.
If a Fahrenheit thermometer ;s' used its readings may be converted to Centi-grade by the following formula:
° C = 5 (4 F 32°)9
I
Precautionary Procedures
When obtaining the >emperature of a sample, the follOwIng proceduresshould be followed in conjunction with the procedures outlined in StandardMethods.
1) To attain truly representative temperature measurement, fit IsMeasure necessary either to take the temperature reading at the point ofImmediately. sampling or immediately following sample collection. 'A large
sample volume should be used to avoid a temperature changeduring the measurement.
2) The accuracy of the thermometer used should be occasionallyverified against a precision (thermometer certified by the NationalBureau of Standards (N BS).
3) The thermometer should be left in the sample while it is read.
Accurate howmeasurementsere essential.
FiOW4
A physicirmeasurement of the in:plant flows Is essential for true process.control. Without these flow measurements, it is impossible to computehydraulic and organic loadings, detention periods, recyCle flows, anb clarifierunderflows Without the above parameters to regulate the treatment processes, .
IV15
29C

NI
,--''s-4
FlowmatoutoroonisOff veryImportant.
How tomum flowwithout o howmoth.
/
t
TRICKLING FILTER PROCESSSECTION IV LABORATORY CONTROL
a
the operator is left with only a "seat of the pants" approach to process control.Withou) a measurement of in-plant flows, it is impossible Kt competentlyevaluate the operation of the individual treatment units. The measurement ofthe plant flows also provides a basis for computing costs for billing, esti-mating chemical needs, prinlcting the future need for plant expansion ormodification, and evaluating the effect of the plant effluent on the receivingstream. Reference to Figure IV-2 will indicate locations of typical In-plantflows that should be measured for process control.
In many of the smaller plants, only the plant influent flow and possibly theplant efficient flow are metered. in these cases, the operator will have tomeasure the in-plant f!ows by other means. For instance, a pumped flow maybe estimated by multiplying the pump capacity (gpm) times the minutes ofpumping time per day.
gpd = (gpm) (min/day)
Often, pump capacity may be estimated by measuring the volume of liquidpumped from or to a structure in astimed period. Nounmetered flows into orout of the structure must be permitted during 4he test period. Metered flowsinto or out of a structure during the test must be taken into account whencomputing the volume of liquid pumped.
(Area, sq. ft.) (Depth, ft.) (7.48 gal/cu. ft.)._gpm metered flow, gpmminutes .
The metering instrumentation must be properly maintained and calibrated ona regular and routine basis to insure that their measurements are accurateand usable in process control and performance evaluation.
297,'IV18

I
ti
./4
TRICKLING FILTER PROCESSSECTION IVLASoRAToRY CONTROL
REFERENCES
APHA, AWWA, WPCF, Standard Methods for Examination of Water and Wastewater,14th Edition, 1976.
California Water Pollution Control Association, Laboratory Procedures for Operatorsof Water Pollution Control Plants, 1970.
Kerri, Kenneth, D., et al., A Field Study Training Program, Operation of WastewaterTreatment Plants, (Chapters 6 and 14), Sacramento State College Department ofCivil Engineering.
New York State Department of Health, Laboratory Procedures for Wastewater Treat-ment Plant Operators, Health Education Service, Albany, N.Y.
I
New York State Department of Health, Manual of Instruction for Sewage TreatmentPlant Operators, Health Education Service, Albany, N.Y.
1 The Texas Water Utilities Association, Manual of Wastewater Operations, Texas Statei Department of Health, 1971, Austin, Twxas.
U.S. Environmental Protection Agency, Estimating Laboratory Needs for Municipal.Wastewater Treatment Facilities, Office of Water Program Operations, Publica-tion No. 4301 9-74-002, Washington, D.C.
U.S. Enviromei tal Protection Agency, Technology Transfer, Handbook for AnalyticalQuality Control in Water and Wastewater l aboratories, Analytical Quality ControlLaboratory, National Environmental Research Center, Cincinnati, Ohio, June, 1972.
Water Pollution Control Federation, Simplified Laboratorts Procedures for WastewaterExamination, Publication No. 18, 1971.
IV-17
298
4

iig
APPENDIX AOPERATIONAL RECORDS
TABLE OF CONTENTS
TopicPage
1.01 INTRODUCTIONAl
1.02 OPERATIONAL PERFORMANCE RECORDS A1
Daily Recordst A1
Monthly RecordsA3
1.03 COMPUTER AIDED DATA MANAGEMENTA9
1-
1.04 INTERPRETATION OF RECORDSA-9
Trend PlotsAll
,).?.
20r,....- ,..,
. -.,
.
4AI Ileb`

,
ra
.
APPENDIX AOPERATIONAL RECORDS
LIST OF FIGURES
Figure No. Description i Page. '
A-1 B.O.D. Worksheet A-4
A-? C.O.D. WOrkshept 1 A.-5
A-3 Suspended Solids Worksheet A-6
A4 30M5ule Settling Test Al -
A-5 Monthly Process Control and Performance Logs A-8
A6 Trend Pldts A-13
......"'.
360
.
e
4.
Z.,
a
r
..
APPENDIX AOPERATIONAL RECORDS
LIST OF TABLES
Table No. Description Page
Al Weekly Computer Report of Process Parameters A10A2 Summary of Laboratory Test Applications for Process Control A12
and Performance Evaluation
3011
=aemew.

I
\s.
APPENDIX A - OPERATIONAL RECORDSI
-
Accuraterecords are thekey toconsistentprocess control..
Performancerecordsdocument theoperations andprovide theinformation forprocess control.
Be sure to entertime of 4; sndinitial yourentries.
1.01, INTROOKTION \1
The quantity of records to be kept Siilf depend upon the size and type of thewastewater treatment facility. A small plant may not require the number ofvariety, of records required fora large plant. The specific records required willbe determined by the size and number of unit processes within the treatmentfacility. Generally, these records are categorized as follows:
1) Operational Performance and Process Control2) Inventory3) Maintenance4) 0 & M Costs.5) Personnel
For the purpose of this manual, only the Operational Performance and ProcessControl records will be discussed. Several references are listed at the end ofthis appendix which will provide detailed information concerning otherrecords outlined above. Operational Performance and Process Control recordsat most wastewater treatment facilities are kept daily and on a monthlybasis. Averages for the month of operation are normally recorded on themonthly log.
1.02 OPERATIONAL PERFORMANCE RECORDS
Complete and accurate records of all phases of plant operation and mainten.ante are essential for the evaluation and control of a biological wastewatertreatment facility. Such recordg pre valuable for justifying expenditures, andfor making recommendations concerning operational changes, modifications,and expansions. These recgrde are liso, used to yerify compliance witheffluent quality requirements. Records should be systematically loggedbyunit process and Med, in a calendar sequence. Generally, the minimumamount of record keeping required Includes. the following:
1) Daily Log2) Daily Laboratory Work Sheets3) Influent and/or effluent,floW rates4) "Organic and hydraulic loading rates of each unit process5) Amount and dosage of chemicals used6) Power consumption7) Unusual happenings such as bypasses, floods, storms. complaints,
other significant events that could be possibly needed in the futurefor legal and administrative purposes.
Daily Records
A daily log or diary should be maintained to record" events and operations ;
during each shift of plant operation. In larger treatment plants, it may be !beneficial to maintain such a log for each' unit process. The log may be astandard (8'h x 11) spiral notebook or a standard daily diary made for that.purpose.
A-1
302

1
4\.
a
,. .4
A
a
Daily recordsare used toobserveperformanceend Catalog theday'shappenings.
The information entered in the plant log should be pertipent only to plantfunctions. Log entries must include trie time, the day of the week, the date,the year, and the weather condi ;ions. The names of the operators working at
, the plant, and their arrivaland departure times should also be included. Logentries should be.made during the day of variousActimilimed problems asthey develop. Do not wait until the end of the day to write up the log, as someitems may be overlooked. If the operator will take a few minutes to make logentries in the morning and afternoon, he will develop a good log. Logs arebeneficial to the operator and to people who replace the operator dimingVacations, illnesses, or leaves of absence. A well -kept log may prove veryhelpful to the operating agency as legal evidence in certain cases. An exampleof one day's log entries in a small trickling filter plant is outlined below:
f:.
Tuesday, January 6, 1976 Weather: Clear, Temp. 73° F, Wind -NW ,
J Doakes, Operator; A. Smith,'Assistant Operator. ,-
. G. Doe, Maintenance Helper.
i
-...........
,..
,
8:20 AM Made plant checkout, changed flow charts, No. 2 super.natant tubplugged on No. Z digester, cleared tube.
-...
9:00 AM Started drawing sludge from bottom of No. 2 digester toNo. 1 sand bed.
9:15 AM Smith and Doe completed daily lubrication and mainte -ance, put No 2 filter reciruclation pump on, took No. 1pump off.
10:00 AM Received three tons of .chlorine, containers Nos. 1583,1296, 495; returned two empty coptainers Nos. 1891 and1344. Replaced bad flex connector on No. 2 chlorinemanifold header valve, and,connected container No. 495on standby.
10:30 AM Collected and analyzed daily lab samples.
1:15 PM Pumped scum pit, 628 gallons to No. 1 digester.
1;30 PM Restored sludge pump No. 2 by removing plastic bottlecap from discharge ball check; Pump back in operation.
2:45 PM Smitt, and Doe hosed down filter distributor arms andcleaned orifices. Doe smashed finger when closing one ofthe end gates on filter arm. Sent Doe to Dr. Jones, filledout accident report, and notified Mr. Sharp of accident.
3:10 PM Stopped drawing stgdge to No. 1 bed. Drew 18,000 gallonsof sludge; sample in refrigerator to be analyzed Wednesday.
3:20 PM Electrician from Delta Voltage Company in with repairedmotor for No. 2 effluent pump, invoice No. A-1824, motorinstalled and pump OK.
3. .
A2
303
4

-
Monthlyrecords Indicatetrends:rodanima.
How toconstruct a log_
4:10 PM Doe back from doctor, stated he will lose fingernail, andrequired three stitches and tetanus shot. Must go backnext Thursday.
4:30 PM Plant checkout for tonight, put No. 2 chlorine containeron line, in case No. 1 should run empty during the night.
In addition to maintaining a daily log of plant operations daily laboratory datashould be kept and transferred to the monthly log form. The daily recordsshould be systematic so that later references can be. made. Example dailylaboratory worksheets are presented on the following pages.
Mont* Records
Monthly records should report the totals and the averages of the valuesrecorded daily. It is alscrkbenef iota! to show the maximum' and minimumdaily results, such as maximum and minimum deity flows.
Daily recorded data are usually transferred onto the monthly data sheets. Themonthly.data sheet is designed to meet the reporting needs of a particularplant. It should have all Important data recorded that maybe used later forthe preparation of monthly or annual reports.
The monthly data sheet may be a single 8V2 x 11 !teet for a small treatmentplant, or it may be a number of sheets pertinent to various treatment unitswithin the treatment plant.
Normally, every plant operator makes up a mon thly'data sheet for his plant torecord daily Oformation. These sheets are numbered down the left-hand sidefrom 1 to 31 to cover the days In the month. Then from left to right across thesheet are columns to record daily information. These columns shouldvontainthe day of the week, weather conditions, plant flows, wastewater temperatures,pH, settleable solids, SOD, quantity of sludged pumped, DO, and other per-tinent information applicable to various unit processes. A space for remakesis helpful to record and explain unusual events. Typical coltimn headings for-an activated sludge plant and trickling filter plant are presented In FigureA-5. Figure A-5 Is designed so that it may be composited to fit the needs of aparticular plant Therefore, the operator may develop a monthly log by usingFigure A-5 as an example.
p
Sometimes the operator may use two or three different sheets to collectpertinent data. Since each plant is different, the operator prepared his plantdata sheet to record the data he needs to maintain proper plant operation. Inaddition, he can develop the form to fulfill the requirements of his agency as--""-,well as the appropriate regulatory agencies. Generally, these sheets can beclassified as an operational performance lod and process control log as /illustrated in Figure A-5.
in addition to routine daily operation, maintenance, and wastewater char-acteristics, the monthly data sheet should contain any unusual happeningsthat may affect-interpretation of results and preparation of a monthly reportsuch as unusual weather, floods, bypasses, breakdowns, or changes Inoperations or maintenance procedures.
A-3304

B. O. D. WORKSHEET
Date of Sample:
Incubationpate In: Date Out:.
C
PrimaryStandard
-,
BlankSample
PrimaryEffluent
.
FinalEffluent-
1. Bottle No. -
2. ml of sarrIple used3. Initial D.O.
I 4, D. 0. after 5 daysI L I I
II
I
5. D. 0. depletion (diff. )
4. Factor (factor x diff. )
7. B. O. D. mg 11I
8. 'Avg. B. O. D. mg /1I
Dilution Water initial D. 0.
After 5 days incubation
Dilution Water D. O. depletion
CALCULATIONS:r
"(Initial D. O., mg/I-D.0. After incubation, mg/l) (Bottle capacity, mll . B. O. D. , mg /1(ml of sample used)
FIGURE A-1
305
/

(
pate of Sample:
'C. O. D. WORKSHEET
.I. t
Date 'of Analysis:,
,
PrimaryStandard 4
BlankSample
PrimaryEffluent
.
FinalEffluent
1. Reflux Sample Wo.
2. ml of sample Used
3. ml FAS for blank
4. Mt FAS for sampleI
I
1
,
5. Difference FAS
I6. FAS normality
7. C. O. D. mg /1. .
8. Avg. C.40. D. mg/1
CALCULATIONS:
(ml FAS blank - JnIXFAS sample) X FAS normality x 8,000 = COD mg/1rnl sample use
.

N
FIGURE A-3
SUSPENDED SOLIDS WORKSHEET
' Sample by' Analysis by:
Date: Date:
Time: Time:
Type of Sample: . Method used - 'Crucible /Filter'N..Location: (Circle One)
,..
Run Number
A Wt. of crucible/filter,and dry solids, gm
B .. Wt. of crucible/filter, ginC Wt. of dry solids, gin'''D ML of sample
A AE Suspended solids, r4. 1
A Wt. of crucible/ filter,and dry solids, gm ,
B Wt. of crucible/ filter,and ash, gm
x..
C Wt. of vol. solids, gmD ML of sample
A AE Vol. suspended solids, mg/I
Calculations?.
A - )3 = C
( C x I, 000,.000)>:c gi E
D. 4
4
,.
I
A6
i
.. ,
/I
o

ft
J
FIGURE A-4
DAILY LABORATORY ANALYSIS
o. 30MINUTE SETTLING TEST
Date Day
GRAB SAMPLE GRAB SAMPLE
Test Set Up: an Test Set Up:
Temp. C Temp.
Min. MLA. Mina
0 . 05 5
10 10.15 15
20 2025 2530 30
40 4050 5060 60
C
MLA-
00.
SDI orSVI= SDI or SVI =
OBSERVATIONS: OBSERVATIONS:
CALCULATIONS:
30 min ML/L Lao.svi x1,000M LSS rrig/I 4.5 SW
A7
306
L.

: .A
lift
000(00 1040016 06 00,00 60,00,C0 6.%04( 01100 0,0060 1011 MOWRY Ward* idgm,(600VIM
016000
a00 00 60 *W.
1111 O.
11010. .1 ailk/H2Nt'N'Ifliliii ..S. ........, MOM ocl LAI PLEI=1 r00416=CM 06..g. 1pm =In irjpg pi pqimamalmmi -6 160. =CI rEri MAN ....I .KIT,6.0 -4-I .6
&II. 004...MI 4da 0
..F. 1.t. ... 1.44.06. .s. 6
0.04 000 044414b'w mire K. 1.49zzliaInnMIS MIMI w.
mosma,,,PERFORMANCE LOG
FOR A 'YMCA. *Asmara vicutherr FAC*.ITYIACTWATE0 SLVINIE PROCESS OR TRICKLING FILTER PROCESS
0VLUINT 040 sea 00.06 11/001000 50000 I 600 0 210 OP .000 1.06 molB YOIllOrAl W... 4.10.10 .W4. VI.
I
el0
. .0...d on 47 41= a 60 12112 :11 .6: .:: Ms 11 0, 0 4.4 a ..... .. .00 $00 TV .al0K 160 eh oatn to oda...
1.4000,00 _
000000,.... TC00t .
DU rst00 e00.00000 006000
iOA ..
0(70204 40160i is0.0000 .000000000000066 a awe".sum. I aoua 4..146.0I OW/a.° ..-01 I .. 166.11.41 I
66. .I
FRONINLY PROCESS CONTROL LOG
FOR A TYPICAL TRICKLING FILTER PROCESSKNOC mom ftumitemom la I
lig00140 ClN0000 00100
I
MONTHLY PROCESS CONTROL AND PREFORMANCE LOGS
FIGURE A-5
300

An Importantnew tool.
Low cost dataprocessing.
A 909dreference.
Note the formatIn Tsb14-1.
The computercan 11111n
parforrasnce.
hoods toregulatoryponcho.
1.03 COMPUTER AIDED DATA MANAGEMENT I
The computer is an economical aid for data collection and analysis. Thecomputer can be used to tabulate and analyze all of the data needed toperform routine and nonroutine process control operations. Thp computercan also be used to inventory, equipment, to log maintenance requirements,and to provide completed report forms for regulatory agencies:
Typical operations costs for process control.data managemenwould be lessthan $250 per month. These cost$ include -terminal rental and computertime. A nominal initial cost would be involved to generate the programs usedfor a particular treatment plant.
A recent article' described 'the operation of a computer program used totabulate and analyze the operating data needed to monitor the operation ofan activated sludge plant. Table A1 (from the article) presents the minimumdata required to properly operate and monitor an activated sludge treatmentplant. Note that the data are tabulated on a daily basis, although processcontrol is based upon averaged data.
The data format used in Table A1 makes the data easily usable. it is stronglyrecommended that the'data *own on Table A-1 be tabulated in this format,because of the general usefulness of these data in treatment plant operations.These fifteen data entries can be used as a starting point for the properoperation and monitoring of any plant.
Additional use of the computer include the generation of monthly performance reports to regulatory agencies, and cataloging maintenance operationsand equipment inventory. The computer can be used to prompt or remindoperations personnel that scheduled maintenance operations are due. Thecomputei can continue to catalog outstanding maintenance operations untilthe operator responds with a signal that the duty is completed.
The computer is an easily used tool that can be programmed to perform.essny used tooi. routine data tabulation and analysis. With minimal effort, operations personnel
can readily learn to use and depend On the computer, freeing their timextoPerform other necessary functions.
Trussel, R., et al., "Computer Assisted Operation of an Actii. ed SludgePlant", October, 1974.
1.04 INTERPRETATION OF RECORDS
Interpretation. The rosin
purpose ofkeeping records.
Use yourrecordsfrequently.
Records are not useful unless they are evaluated and used as indicators ofplant operation and maintenance. Records are also useful as sources forreports to management or the public.
The recorded data can enable the operator to determine operation and main-tenance needs of his plant. The Information shown by the records shouldalso indicate to him and to his supervisor the treatment efficiency of eachunit irrthe plant. Records kept on the quality of the effluent and the receivingwaters should be analyzed for the discharge's effect on the receiving waters.The importance of looking at and analyzing records frequently cannot beoveremphasized.
A9310

/NI
e.
t.
.1 .(TABLE A-1
WEEKLY REPORT OF PROCESS PARAMETERSWEEK ENDING 10/2/74
************************************************************************* 1 * LOADING *
* A **************************************************************6**** 1 44 OCOM * C60 * COO , SS * SS ** E * MGO *' MG/L * LOS * MG/L * LOS ************************************************************************** 9/26** mar.9/28*
*-9/29** 9/30**10/ 1**10/ 2*********************4**************************************************.AVG * 2.78 * 394. * 9133. * 173. * 3967. *
* ***********************************************************************
2.732.682.702.852.802.962.74
**
**
*
**
349.434.434.434.357.374.376..
IP'
*****,*
7946.9700.9773.10334.8337.9242.8598.
*
****
**
158.148.455.102.4112.108.
*
*
***
**
3597.330$.10246.2429.2615.2669.29114.
*******
************************************************************************* 0 * CONTROL ** A ******************** ********************************************** T * F/M * SR * SOL/OS * SETT'LY * SVI* C a * DAYS . a. LOS * X * ML/GM **********************************-***************************************
... * 9/26* 0.40 * 20.2 * 19996. * 51.0 *4. !/2'1* 0.50 * 86.9 * 19433. * 36.0 *
225. *168. *
9/28* q.*7 * 37.3 * 10088. ** 9/29* 0.94 * 24.2 * 10970. * 30.0 *
32.0:::: *
* 2/30* 0.41 * 78.2- * 20184. *:::: :
173. **10/ 1* 0.41 51.4 * 17,47. * 270. *
*10/ 2* 0.78 * . 36.9 * 10,66. * 37.0 * 198. ** **********************************i************************************* AVG * 0.65 * 47.9 * 15655. .* 46.7 * 199. *
//************************************************************************
****************************************p******************************** 0 * PERFORMANCE* A ************* **************************************************** T * TURBIDITY , SS * SS * COD * coo *
* e * * MG/L * % REMOVED * MG/L * !t REMOVED *
************************************************************************- * 9/26* 2.7 * 14.0 /* 91.1 * 47. * 86.5 *
/ * 9/27* 3.3 * 11.0 * 92.6 54. * 87.6 *
* 9/28* 5.4 * 12.0 * 17.4 * 54. * 67.6 *
* 9/29# 5.6 * 23.0 * 77.5 * 54. * 417.6 *
* 9/3011 5.6 * 16.0 * 85.7 * 78. * 78.2 *
*10/ 1* 5.6 * 19.0 * 82.4 * 45. * 87.2 *
*10/ 2* 6.1 * 18:0 * 85.8 * 580 * 04.6 *
************************************************************************* AVG * 4.9 * 16.1 * 87.5 * 56. * 85.6 *
************************************************************************
A-10
311

le
Look for trends.
Look for suddenvariations.
Plotting yourdata inoreseeein take.
Use of VOODOO
dots.
Laboratory analyses performed on various samples provide essential tools toaid In the control and evaluation of a biological treatment process. Table A2presents a list of the analyses and their use In performance t.yafirtion andprocess control.
Records should not only be analyzed as a single piece of data, but any van -ation should be looked upon for its relation to another source of data. Forexample, a sudden rise in temperature of the influent might be accompaniedby greatly Increased flows. This could indicate a large industrial discharge.This discharge could also influence the BOD and suspended solids concen-trations in the plant influent. Or one might observe a sudden increase in 5dayBOD concentrations in the plant effluent. This may Indicate a seasonalincrease due to beginning of cannery operations, or it may Indicate a break-dowbpf Industrial treatment facilities discharging untreaied wastes Into thewastewater collection system.
Before any meaningful interpretation can be made of sudden variations Indata, an expected range of values has to be determined for the particulartreatment unit under consideration. This range must be based upon expectedor past performance. For example, if average daily flows during weekdayswere around two million gallons per day and suddenly a flow of 0.5 milliongallons per day wag recorded, this may Indicate malfunctioning of meteringequipment or a break in sewer lines or a bypass ahead of the plant. Conversely,unusually high flows may indicate storm water Infiltration, surface waterrunoff flowing into the system through manholes, or an unusual dump ofwastewater.
An excellent way to facilitate review of daily records and detect suddenchanges or trends are prepared charts showing values plotted against daysor-time. Unless results are plotted, slight changes and trends can go uncle-tected. The deviation from the expected values may have been caused byunusual circumstances or an error in observation or analysis.
Trend Plots
Plotting data on graphs is very helpful to Illustrate trends In the operation ofa wastewater treatment facility. Regular plotting of data may reveal unexpectedtrends which could provide insight to prevent an operational upset of a unitprocess. In addition, this approach could be utilized to justify budget require-ments, and to show the need for plant modifications or expansion. To lookfor or show a trend, plot the value or values against time as illustrated inFigure A6. The important concepts relevant to plotting trend charts arediscussed below:
1. Plotting daily data will not provide good process control interpret-Hons. A 5day moving average method is suggested for normal opera-tions. In cases where data is not taken daily, the collected data canstill be used to generate moving averages. Each day a new set of datais Included and one data set Is deleted from the group of five to beaveraged.
A11
312
e

Ta
TABLE A -2
SUMMARY OF LABORATORYCONTROL TEST APPLICATIONS FOR
PROCESS CONTROL AND PERFORMANCE EVALUATION
Mir wo1.8 *Cimino $1.4.4-1 MCCAW TRICKIDIO him PoOCIOs
601, tOl.AASMARY cril.t.P1itic00000r crst.csst
1GAKIC LOAD APPLitbopooteC u)so,040osOEvALDATC ATOMS 09ATORmASCC
tICRT MO.AT/OtOo I )4 RA TIO TAATIONA 0 W.CIACI.11.ALAPs AATS PSCUILSIOINTS
AtSPIVDTOSoLIDAIcrrot
MAAR' Cu LLLsilAtICD LIOLottnitro CULDL4SCGONDAPT IttLTSLTRAvwAs
VOLAIILTPADAAAV tLTP.1MIXT& LA:p okItICTID. Rif TIMMS?Tv-VITAS
oscoofc LOAD APPLIED°ADAM LOAD ACIADTC:,
I cv WATT PAOCLST PcAtolltAACDSOLIDS LOAD/SOON SCGOADAley 044,1710wilt DA4AKT DCTLPAUNAT IONS
o TAS,WAS ROWo KITTS LZYCLA lit ASAATIO4 DASD.o meta OUTRUN* T/04
0. SLUDGC REMOVAL OtAlLt TAON CLARY:MX
Ail ATC01 AtCW141.TWAIART Marv,SSCOADAW STRIA C1/4T
As4S40AAPRWAAY IttLl T1/41SKCONDAPV criLvvT
on Pt$CIm%tAillt LPL PetSAcontrAn 1)11,1%1
MTPATSPAJuARY ATOLL CartSSCODAV WILL Ira
PAIDAPDOALSPILITAART Ski LV.ISSCONDAW CTI.ret
THIADICATIONNUMMI A ALATICC
I AtiAblA SC/TUGAuTADIJOtoA
.
iLvOct ovALJT, *NOS WO CHAAACTgants 1Wo VAa ILttoC ATA4ONAL ASLATITT TO DCHITRITICATIDA
DO, DATTZDATAA111XLD ;TOL**sqTeSDAAy Mt. r T
fettle MCI LOAD°Mix DCMAND !OA CitANGTSoxyGCti TRANSTTN WTICIICPCV
CORGANIC WADING
r% peovocormi o Manor..flow RATS RZOVIRCUCATS
st .eklUAKI M. 11/47AN DUO Liog DANAc04DA1111( Tr/II TNT
issootomtvOsHomo,' Cb t%1WALD LIOL OftSr- ...Alit Tit i11
WM/M.404W W ILLSG *L ANDWZMALMini DOCIFARGLI ADTIPSS TODIOLOCICAL STATS11
DCTACTIOD Or forti.esAvoo.onizooo cv 4.rc /s CONDIT ION 01 1101XICAL AE Iva*Otrszc rsecomollOot of onOrsieolsOor
TTILTAPI T soUO,FILDAtii. CI f L. rT)ILIVIOkkOtIMtc04O41.1 ill! TNT
u ociONCTor ctrlarso----6 StiVAOT IteMOVAL II MS Wu ctoionto
...o xoworic LXAmrAl ICSMIAti. ijo. cA
e *SEAM T 4ICPT OTISIIMMTOStAt ,ATIvt t PADOSNAITEC Or IWTOOAT.AwlsAsSof AAA/ IONAL plbOOLOO ATIA/Dt TO
IlL 00 xtol , OReAAlto4SVAL . ATT SLCOOC QVAI T
oirsomom APPULDHyDAAOLIC DWARION
LOADSMit0 IA,.
syl..OIT CANal%Ter..DAD) , LARITII A
- *DUOS OISTROOTIONs t sr TO DWCRADNC AAA FLO* MISTc Tv* 0 A1C AVDIATILICS
I
A12
31"1.v
APPLIOMILT TO Doerr ItOLOGICAL PsOetiStO

%O.
i
2.00070
10
1,5002A
F.
0 1.000F.
5000.6
0. 5
0, 4
0. 3600
400
200
0
150
100
50
!kr"ii
'111111.11MBE
J.
0
lalb149.1.1091111M5 10 15
DAY20 25 30
ACTIVATED SLUDGE PROCESS(Fivs-day moving overall* trend plots). FIGURE AO

4
r
How to generatea S-day movingaverage.
Plot processcontrol data:FMS
MCRTMLVSSElfflient SSEffluent SODEtc.
Learn to plotaccurately andmeaningfully.
For example, 5-day moving averages for a 2-day period (January 5 and 6, 1976)are calculated as follows:
.I.. .....
Date
1.1-76
Initial DataGroupBOO mgll
120
SequentialDataGroupBOD mgll
Deleted1.2-76 118 1181.3-76 124 1241-4.76 122 1221-5.76 - 121 121
Total 605 ÷ 5 = 121avg. for 1-5-76
1.646 123 added
Total 608 i- 5 = 122avg. for 1.6-76
2) All data used for process control should be plotted on a daily, weekly,and monthly basis. Daily plots showing large variations indicate that.either shock loadings or errors in operatign .and/or calculation haveoccurred. Weekly and monthly plots will show long-term changes andindie^te whether the control exerted by the process control techniquesis suited to operating conditions.
3) The operator must familiarize himself with the techniques of graph-ically displaying data, in orderto get the maximum amount of informa-tion out of the data. Trend observation is probably the singlemostimportant tool that the operator has to prevent catastrophic upset ofthe biological processes.
40t14
)
3 r.
2
t..
/
t
., REFERENCES
New York State Department of Health, Laboratory Procedures for Wastewater Treat-ment Plant Operators, Health Education Service, Albany, N.Y.
New York State Department of Health, Manual of Instruction for Sewage TreatmentPlant Operators, Health Education'Service, Albany, N.Y.
Recommended Standards far Sewage Works, 1973 Revised Edition, Publinhed byHbalth Education Se(vice, Albany, N.Y. -
,
Sacramento State University. Operation of Wastewater Treatment Plants - A FieldSludy Program, Sacramento, California.
Texas Water Utilities Association, Manual of Wastewater Operations, Texas StateDepartment of Health, 1971, Austin, Texas.
Trussell, R.R., Bravo. A., Kermit, P., and Nichels, C., Computer.Assisted Operation ofan Activated Sludge Plant, Presented at the 47th Annual Convention of the WaterPollution Control Federation, October, 1974.
A15
31c
4
.4

.
1 ..-.
,
t
,
4
t
.
I
;
APPENDIX 13-PLANT VISTSt.,
The wastewater treatment plants included,in this appendix were visited to establishthe state-oftheirt for process control of aerobic biological wastewater treatmentfacilities throughout the United States.
A statistical breakdown of the types and methods Of oper#tion for each plant visitis include. ,.--/
.. .. ..
,
.
B-I
A4
R I1
.
M
/

L
CITY OF AWARiLLO, TEXAS
General Description
The River Road Wastewater Treatment Plant consists of screening, primary Sedimenlotion, primary effluent holding pond (balancing), secondary treatment by the activatedsludge process, and post chlorination. The activated sludge process has the flexibility -
of operating in the following modes: (1) conventional, (2) step-feed or variationstherein: reaction, contact stabilization and Kraus. Currently, the reaction mode isused thriiughout the year.
Performance and Process Control
They have the flexibility of wasting activated sludge by wasting from the return sludgeflow andior wasting mixed liquor from the channel conveying the aeration effluentto the secondary clarifiers. They utilize both wasting modes simultaneously. Thewaste RAS is returned to the plant influent for sedimentation with the primary sludge.The mixture of primary sludge and waste RAS is pumped to a gravity thickener. The*,RAS wasting rate remains at a fairly constant rate (the rate is based-upon achieving thedesired effect in tthe primary sludge thickener) while mixed liquor wealth° rate isvaried as needs dictate. The digester sludge is pumped to -clay- bottom drying bedswith the decant liquor returned to the plant influent.
in order. to balance the wastewater flows to the secondary treatment process, the plantpersonnel constructed an earthen primary effluent holding pond. it should be notedthat this. wastewater treatment facility is situated in the country with no nearbyneighbors to complain about the odors or appearance. This type of flow balancing hasbeen effective and quite satisfactory.
The plant utilized the conventional mode of the activated sluffge process prior to-theCity obtaining a new source of, water supply.from a lake. Theilake water possesses ahigh sulfate and chloride content with wide swings in the water temperature through-out the year. After the lake water was used as the City's water source, the plant
.. began to experience severe bulking problems (probably due to high sulfates andswings in wastewater [55 80° Fl temperature). The sludge reaeration mode of bperationwas Mei with three hours in the reaeration zone and three hours in the aerationzone. They concluded that the reaeration mods was effective in minimizing their bulk-ing problems. they now use the reaeration mode throughout the year.
,.
The WAS-ratM are based upon the maintenance of a constant MISS concentration.Response a the process and past experience are basically the guides used to in-creasing or declassing the MLSS level. This procedure seems to work quite sail
;_. factorily in conjunction with the balancing of the primary effluent flows.
the RAS rate was adjusted upon the basis of a daily sludge blanket depth meadure-liflent. An electronic siudgp blanket detector Is utilized to measure the sludge depthin the clarifier.
DO's of 2-3 mgli are 'maintained at the outlet of aeration basins. DO's greater than445 mgli are avoided because filamentous organism tend to predominate in the activatedsludge.
8-2
31

WASTEACTIVATEDSLUDGE
WASTEACTIVATSLUDGE
ED
PLANT FLOW DIAGRAM
ANAEROBICSUPERNATANT
SLUDGE
CRS,SEWAGE
city or AgACtitto. ITXA.. 1VER RNA/ PLANT
PLAqr ML...
DESIGN
WPWCCIPAAL ACtIVAA..) 51.000FONNEArt PLah144 ops*Arias - tsmsa
IXP1CAL AGEAlguM BASINS
A11004 AfAms40311 12.t 80.9 AWINGMAX DAY.000 eA.; 14.2 LENGTM.STPEAK POPUA.uW 22.0 22.3 KIOIH.FT% InOUGTRIAL ,.. 10. Of0f11.F1
AREA cACII.SF
KAM/ LOAP1.00 AERATION SYSTEM
PIM I DeSIEt.
CLARIFIERS
1 h0ABER 4
0. OfANCTER.FI 12.0. DEOTH.I.T . 10.s0. AREA-fA0H.SF 4418.0. VEER LEU1TO.MT 43J.
NEM TYPE 133LoYCHSLUDGE GEKuvAL 14.04
M-RATI034 **Egos 01.SIGN TYPICAL SYSifol TOFfUSEDTYPE' SOARGER
ISE 400).00/L 124. 120. MAX bCFN 14000.Ira $5.M1/L 00. AVO 3C141 11000.1./0.1. EuDs At11 /0 111.11SS/PAt
.00.IINIZ 0.24
ACRLDAYs J., 3.1SLUOGE A0E.DAYs J.0 9.1aLs)./w/I. 2000. 2000.MAX 4LS4.180/L ?40V.JAIN gLSS.W/L 1>01. PLA4t PERoRmaCE33 vuLATiLE fiu.
0.11. LEVELslO/L 2.0 2.0AIR APOLIf0.GCP/0AL I. Dfsfori txvICALAIR APPLIEO.SCS/L4 GEM AfA 1049.EtIOlum %MAX RETURN. x
40.im.
60.,
CM. 000).KG/Lx alp, atuovAL
35.0v4. _
1 S.0
am.oer. Mi.', AVO APA.4044S 4.0 6.4 EFF S.3.04/L 10.0 30.00Cf. TIKE.0 A.P.+O(fu4...402AS J.v 4.3 % SS REMOVAL 84. A).Eff. 11.1f.0 u.r.+0E100u.lowAS 1., 1.4 snot/GRAN
>11.00AS/100Keau.6.50
SECAL.DARy CLODAEAG TYPICALuKK am A4O MAX NAY AVG
SUWACk 1.0A01Mul0ALISk/O4V m44. sig. 804. Elf.uElft LoADIEMAL/ki/DAY 2.6. 0011. H7 6. 017.DETE01101 IIKE.HuOIS 2.3 2.0 2.3 3.1
matno.os/sr/aoo 0.111 0.1) o.ole 0.60
B-3
313

*
I
CITY OF AUSTIN, TEXAS
'General Description
'At the Govalle Wastewater Treatment Plant there are four activated sludge plants fedfrom a tcommon influent diversion structure. The accumulated data only pertain to "D"plant;the newest and most modern. The splitting of the influent flows to A, B, C, and Dplants is accomplished by motorized sluice gate valves at the influent diversion struc-ture. The contact stabilization mode of the activated sludge process preceded byscreening and grit removal is utilized at "D" plant. There are three feed points intothe aeration basin which function as a means to control the detention time in contactzone. They attempt to maintain a detention time of 20.30 minutes in the contact zone.The operator claims that a sludge with optimum settling characteristics is attained bya contact detention time of approximately 30 minutes.
,
Performance and Process Control
Excess activated sludge is wasted from the stabilization zone (sludge reaeration) ofthe aeration basin and discharged to an aerobic digester with a oneday detention time.The digester liquor is transferred to 191 acres of oxidation ponds. Except fpr theunderfloor from the chlorine contact tank, there are no recycled flows at "D" Opt.They vary the WAS rates to maintain a suspended solids concentration in the RAS of3,500-5,000 mg/I. They would also increase the WAS rate if they had an Increase insitidge blanket depth without an increase in SVI. The suspended solids concentrationof the return sludge governs the suspended solids concentration in the stabilizationzone. They use the following ratio to indicate if they need to increase or decreaseWAS rate:
BOO of return sludge, mg/I
Suspended Solids of return sludge, mg /!
The above ratio would seerrto indicate the degree of stabilization, which in turn isrelated to the sludge age and NM ratio.
. . i.....
The MS rates are adjusted to maintain the desired suspended solids concentration(stabilization zone) while maintaining less than two feet of sludge blanket in thesecondary clarifiers. Small air lifts installed in the clarifiers at fixed twofoot Intervalsindicate sludge blanket depth.
= 50.5 to 0.7
They maintain a DO of 1 to 2 mg/I at the outlet of the aeration basin. Aeration ratesalso are controlled to maintain a DO of 0.5 mg/I lathe secondary clarifiers just prior tothe effluent weir to avoid septicity in the return sludge.
Wastewater temperature is as high as 84° Fin the summer and as low as 69° F in thewinter. tn'the winter, they increase the suspended solids level to compensate for.slower biological activity. Also, they decrease the air rates to avoid excessive DO'sand subsequent filamentous organism growth.
..,
Storm flows are diverted around the activated sludge processes through a bar screento a storm overflow clarifier, chlorinated and discharged to the outlet!. The underflowfrom the clarifier is pumped to the influent diversion structure. The storm overflowclarifier also serves as the chlorine contact tank for "D" plant.
(.
84
a

RAWSEWAGE
STORMWATER OVERFLOW
CONTACT BASIN
STABLIZATION BASIN
WWASTEACTIVATEDVASLL
oaxE6 LIQUOROa *MOW* 4611#
(SECONDARY SECONDARYCLARIFIERS CLARIFIERS
111 11111.4111 miff
RETURN ACTIVATED SLUDGE
CLARIFIER UNDEAFLOW
SETTLEDSEWAGE
CHLORINECONTACTANDCLARIFIER
PLANT FLOW DIAGRAMEFFLUENT
ciii OF Auysto. !limb - bovAIE PLANtbliACT 11APILIZATiab
CORK: 17T pLhhi OFFE*Albla 101
MINT 11,44p pLAsr DEW..
ALRAil(r. BASIF.S 4.1.01111cot.
AiG Oft AAJMO.F11 10.o M.o./ 1.1v0E4 I booek .1
LAX DAI.K.0 15.V ir.0 tr...41,er 100. OlAver.R.1.4 II-,.
PAK P.Ar4.44( 17.0 11.0 wIDIR.F1 90. APIN.ht I/.oX IODWIRIAL W. OEPIRI.Fi I. AntA.EACH.F vDO.,.
mi. AREA-FACV4Sk 13300. 46114 Le61001 54.PtIR IYPE V...110FAtiOor 00,0vA1 riot
PLANT LoADIW AtizA1101 ..E..iEhl
WcAl11.1 MAL195 C,1, iiMICAL 4441L1 01141SWUPI_ SPAR411
1111- four(.11(.41. Icto. 160, MAX Set, W00,1OM ss.w,,,L dm), (60. AVG :MA, 11m0J.
P/MILP 84* MV1/Lh MLO:r/DAI 0.Fr 1W5,
*C414410 1)'0, 14,0Z..LUDGE ALI-.MAY, ,... 1.1MUL.MO/C 14L.1. 21")r.
MAX nss.ma/L tico.meN As4.114.4 1r0 o. PLANT PLRIMAMAXCtX vaLATILE by.0.11. LeVEL:J.J4G4 1., F.5AIM APPLIFO.ktr,GAL , 051611 TIP1PAi
,,'_.
AM APPLIEM.LF1 /L4 NOD, Ril 4540.(*DAN. 4 14. 44. (-4 r11t.,,16/1, 10.1) 11,uMAX 'WAWA, X 41. X Po qfm4VAL 0, 'ol,
!;'P. tiot.t AVG PI-m.1..105 3,4 1.,-) f th Sa..orn. 10.11 Of, k..
MI. Mktg 4.1.4N11.14e1,././4, 1,0 I.s 1 T.Z. otagyAt 4y, YVO,
Oki. IMO 4.i..4.44b44,141UP 4,Pd 0, Jetl/06-0 ISO,SVie4PAM/104A 0.11
SEC0VMARY CLAk Lt Ik R.
WAACE LOAL.lu.;014/..(/)sfbEilt LIJAOloo.(411./k1101VLIOTI(4.01.11,11 LOA0140.I4V.w/11 )40
I I: TYPICALqi< LAt -*AV 'AY AYJ
/44. J:G. fAY Ili.
NO,jet, F.10. PI ,14. 0,14.)',/ 4.1 1.1 3,50,4/ .44 I.,,..., 0.44,
8.5
321.

c
41.
CITY OF CARSON CITY, NEVADA WASTEWATER TREATMENT PLANT
GeneraILDescrifttion
The Carson City Wastewater Treatment Plant is a twosfage trickling filler plant with adesign capacity of 3.75 mgd ADWF. The plant was originally.put intp operation in 1961as a primary treatment facility with 1.5 mgd design flow capacity, expanded to thesecondary treatment (as the same design flow) in 1968, and expanded to the currentdesign flow capacity in 1974. The current ADWF at the plant is approximately-2.1 mgd.
The principal unit processes of the plant are as follows': comminution grit removal viaa grit cyclone, primary sedimentation, flow measurement with Parshail flumes a pri:mary stage trickling filters intermediate clarification (with recirculation of, the inter.mediate clarifier overflow to the primary trickling filter), a second stage trickling filter(with recirculation of unsettled effluent), final clarification, chlorihation, and effluent"disposal. Primary and secondary sludges are thickened, centrifuged, and incineratedat onsite facilities. Centrate is returned to ,the thickeher, and thickener overflow isreturned to the primary sedimentation basins. Effluent disposal is either to the CarsonRiver or to reclamation at a nearby golf course. In either case, the effluent is held in aneffluent storage pond prior to disposal. Excess flow to the plant during storms is by
from a manhole prior to the plant headworks and from the wet well of theprimary stage trickling filter feed pumps to an oxidation pond. This stored overflow
ifs recycled back to the plant headworks during dry weather for retreatment. Additionally,some excess stormwater can be bypassed around the primary stage trickling filter tothe secondary stage trickling filter.
Performance and Process Control
The treatment plant operator has no control over the mode or rte of recirculationaround either trickling filter stage. In bath cases, recirculated flow is returned to thewet wells of the filter feed pumps by gravity flow. The water level in these wet wellsare in turn controlled by levelactuated constant speed pumps. This method of recirculation results in a relatively constant hydraulic loading rate lc each filter. However,the organic loading rate to each filter is highly dependent on the hydraulic influentflow rate to the plant.
B6

44D
I
Vis
EFFLUENT
CLARIFIER UNDERFLOW
SECONDARY INTERMEDIATECLARIFIRRS CLARIFIER
RECIRCULATION
RECIRCULATION
/SECOND STAGTRICKLINGFILTER
PLANT FLOW DIAGRAM
.b s 'T.
,
;
1..
as
,
4
,J
.1 .
I 1. 1r
t ' s ' .1 t.
FIRST STAGETRICKLINGFILTER
WASTSLUDGEE
PRIMARYCLARIFIERS
THICKENER RETURN
'7.I. , Ili. 4-4A14,.F 61'1 I l4 r1LI. It
rI 1 P. I.4 I +4.4>4
44
I
'YU*
B7
4; '1 if 0-1
A Ji._r
r 1
;LAW ,S4 .4
.*iI . ie.'
t.1 ,l.11I ...A!
So
323
RASEWWAGE
L 441;
4.,04 4144 4.1.1%1.1Leitt.r
r'l'A4: 1C.1, ;1L1.4,1.01
Air )1,0,..;r. or. >441
*. sr.
J.4.,
4.,

.
CITY OF DALLAS, TEAS - CENTRAL PLANT
t General Description
The Dallas Central Wastewater Treatment Plant consists of two trickling filter plantsthe older Dallas Wastewater Treatment Plant with single stage standard rate T.F., andthe White Rock Wastewater Treatment Plant with roughing T.F. (oliowed by high-rateT.F. At both plants, the trickling filters are preceded by screening, grit removal, andprimary sedimentation.
Performance
The sludge from the final clarifiers is returned to the plant influent for sedimentationwith the primary sludge. The control of sludge withdrawal rates from the final clarifieris determined by visual observation. The mixture of primary and trickling filter s rIgeis pumped to anaerobic digesters for stabilirlion. The digester liquor is transfixedto another plant for disposal, thus there is no supernatant recycle flows at these plants.
At both plants, final clarifier effluent is returned to the trickling filters to providecontinuous dosing and reasonably constant hydraulic loading. The recirculation fatesare based on maintenance of a specific total flow to the trickling filters. This procedureseems to be simple and effective.
Process Control
-,.
They performed an extensive lab monitoring program; however, the lab results are notprimarily for trickling filter process control. Process control is based on maintaininga constant hydraulic loading via recirculation of the settled trickling filter effluent.
Operational problems have been experienced with filter flies4vhich have been effec-tively controlled by flooding each filter (except roughing T.F.) once perweek during thefly season (March to November). It appears that the weekly Hooding (espediaiiy forstandard rate T.F.) is the explanation for the absence of ponding or odor problems" -.with the 1 liter operation. I
The Dallas Wastewater Treatment Plant 'standard rate T.F.) is operating at designcapacity, while the White Rock Wastewater Treatment Plant (high rate T.F. precededby roughing U.) is operating considerably beyond its design capacity.'
(--
8-8
324
o

V
SETTLED SEWAGE
RECIRCULATION
PLANT FLOW DIAGRAM
Nett t4.03t
CLARIFIRUNDERFLEOW
EFFLUENT
SECONDARYCLARIRERS
CITY nal 1* VAS CForomx PLATbio.xIF igtexito; PPRIVP
cuko.t.i etAra Id opPERATI(34 U#40
PLANE CE bi(ht
DE41G4 it/ WM. Dt S-SLiFfit. C1.011-1E45
AV., DRY 1rFArlitte,494 32.4 )1...) ittly4P4 14 1.1)49ER AMAX DAVolat 5-3.V 5./. 0 viAexcx.rf 174. LE,4140.Eir to).PEAK FURROIDD 00.0 64. ) TrRt3f.f t 7.4 11D111.4.1 i,.X prOMIRIAL 10. ARFA-A0i.so. 2432A. Dhpnt.oi 11.1
4 it -EACo.C1 /(12464. AREA4E4Cd.brxXill Lewire.rtlitIR TYPE
/vtr4.I5,).
.frAlv}C{tSLUDGE REMOVAL 1-1.14,41
KA:a Lilit011. el_AP i Pt arlatalaNCE
TRICKLING FILTERS 1.4- .1,,st 1 frit At VtblVti t(PICAL
Ih 000?.RGA. )t0. OV. For toCo.xx/r. 25.v 2'.0it* $$.11..4.. v a. 94. t. ati7) Rtlig,At too. $4.ORO ox0.1.flent.6/10oXF/DAv sy. iv. teF So.hitit 42.0 42.0{n0 LUMh i/WACXE o. .. X Si REigovoit. . ,..c.trecuRcuLATioo.x co. co.
4.0404171Y Malik IERS OF.41(.14MA]( OM ALA MAY $,Ay AL.,
SePhACE LOADII.G.GALhr/DAY 2044. 1429. 7141. 1174.NEIR loADING.GALIFt/DAY 33T33t. tilit. I V3333.VETENTIUM .4
B-9
325

CITY OF FORT LAUDERDALE, FLORIDA PLANT A
General Description
The wastewater treatment plant is a conventional activated sludge plant. The plant isalso designed to operate in the step feed aeration mode Aeration is provided bymultiple low speed surface aerators. The depth of aerator submergence is vaned witha weir that increases or decreases the mixed liquor depth Varying the mixed liquordepth provides control of the aeration rate.
Waste solids are processed in a wet air oxidation system The centrate from the oxidized sludge is returned to the headworks When the wet air oxidation system isoperating. the primary effluent often has a hip ,er SOD concentration than the rawsewage
The plant treats wastewaters from light industrial and domestic areas Average dryweather flow :s 7 mgd of Which 60% is due io industry Peak flows occur in thesummer during tourist season. The plant effluent is discharged to an estuary
Performance
Effluent concentrations of BOO and SS are typically 25 and 15 mg/I, respectively Thesettled sewage has a BOO of 125 mgil when the wet air oxidation system is in use
Process Control
The FiM is held around 0.15 to 0.2 lbs BOD5 removed/lb MUSS/day actual wasting iscontrolled to maintain constant MLSS. The organic loading is nearly constant. and aconstant MLSS fixes the FiM D 0 is maintained around 2 mgil by adjusting the mixedliquor depth
Settleability of the mixed liquor was improved by continual dosing of the return aciivated sludge with 4 mgil of C12. Settleability also improved by over aerating thebiological solids in the aeration basin at night
6 ;0
n LV11 '4, 4.1

1
SEWAGE
RETURN ACTIVATED SLUDt.... WASTE'ACTIVATEDSLUDGE
PRIMARYCLARIFIER
PRIMARY AERATION BASINS
PLANT FLOW DIAGRAM0111 Or t 7. i Ad ,r,Atr. 1.1713104 - A
01447-A114. 51111.*k.11" 13 ALA1.3 173 opPrA319 1911
A.A1. /AI10.. CLA011-114:.
A. di 1 Art/ .. .... I., t.t. .10114.4 ? 1410.11 a.4. ,2: .. . $6.. .,/ L*9;11.13 IVA. DIA0E .0.91 0.3.. o.i. .., I ,.... IA.0 91 NH-3 wA. 011111.1 1/..). 1.07a....i .131 -,:. 0EP11193 11.0 AREA-EACII.N1- 9174.
AkE.1.9ACII.S* 9311. Kin U11.111491 170.1f1r/ 1V P1 J-10,(41
6 SLUDGE 0E3019AL *A4..1109Afaalipri yVSll AL L03016.
.1.0 110% -.I I rPICAL
V., TM iP,4,../1. 4A. 100,1... ...:,...../t.. I Of. /064*/ .L0 P..t, 47 .10 '4.0 ../(0.1 12..1., 0.1)9C,3,011.. I., 1./..L....4 At.L.I.,..4. ,..1 4.1KA....UA/i. 1,1.0. :).04( 141....4, /1. MOJ.1,14 01.10'4.16,./1. 1)00.% III/LAMA 7....
06,1 1UAL:J.0,a ,.0 1.0 PLOT PE133-01.k.C1.AMIN, A . 61, 46.
it...,.I 4.1 11E51..0. rolcmS.? 4.;1.1 .1.9 F 0 1o17r,.04(wL 14.44, 300
X DOG, 13E11001 90, fa,ESF SS014/t. 10.4 itro)% SS REK0VAL 90. 00,691,01./00311 Pa.$01.GRAM11 00141. 101)
StSito LitC.fAtilCAL1111. 43101,1C3110MBER 6111A-9ACIs 60.AAA Ll 02/DAY 720.Av0 LII uVrIt: 441.
MA 4f $URti. ll611 11111.0 A.: 1-100404.14,Du. 14.-... 710..1.e13341.,7104..Ltt 6 I174.1/ .9.414199.....044,
..1.200/10Y C410101964 LE4tus TYPICAL.4 044 AP. 9AV MY AVG
sa.ir ACE 1.100.01'..7.GA1.2..1. /Oat 127. 02'0714 L0A01.0.0ALI1. a/cAY 1AA7.3. 1.905. 12461.UEACII1P.. 10.1104$ 3.6 1..1 1.1
LuA01NG.0 P.0-/16101: 1.104 0.91 0.66 0,10

.,
CITY OF FREMONT, NEBRASKA
Gf.!'eral Description
Fremont's treatment facilities consist of two pi.. nary clarification, followed by fixednozzle trickling filters or roughing filters, followed by intermediate clarification, activated sludge, final clarification, chlorinatiod, and discharge. The Fremont, NebraskaWastewater Treatment Plant went Into operation irqtarch 1975, and, to date, theoperators have had very few problems with their aerobic IC treatment units. The plantdesign allows a great deal of flexibility in flow schemes. Each unit from the primaryclarifiers to the final clarifiers is duplicated; that is, there are two primary clarifiers,two trickling filters, two intermediate clarifiers, etc. The plant piping is such thateffluent from each unit joins at a splitter box where it :a combined, then resplit toflow to each of the two following units. The splitter boxes are designed so that flowcan be split evenly to each unit or any one unit can be taken off line, such as oneaeration tank or final clarifier or intermediate clarifier, and all of the How can berouted through the duplicate unit. There have been some mechanical equipment fail-ures whereby it was necessary to use this capability to reroute the flow around one ofthe-aeration basins.
Perform:rice and Process Control
Normally, 2.0 mgll minimum dissolved oxygen (D.O.) is controlled by adjusting the airflow rate to the diffusers beneath the turbine generators. Control of air How is accomplished manually.
To date, Fremont, Nebraska has not had foaming problems in the aeration basinsother than the normal foaming encountered during start-up. They have had no toxicloads and no bulking sludge to date. They have had some problems with rising sludge.Their solution to that problem is to increase their return rate and to lower the mixedliquor concentration by wasting sludge. Effectively, this cuts thesludge age down andtends to inhibit nitrification.
The plant is controlled on the basis of suspended solids balance. A mixed liquorsuspended solids between 3,000 and 4,000 mgll is the goal that they strive for. Thesludge is wasted based upon the sludge blanket depth in the clarifiers. Sludge iswasted to lower the depth of the sludge blanket. The sludge blanket's depth is meas-ured regularly by means of a flashlight on a long pole.
The return sludge system can be operated in an automatic or manual mode. In theautomatic mode. the return sludge rate may be set proportionally to influent flow.They have had problems with flow proportional RAS in the low plant influent flowranges. The flow rate is set by throttling RAS with a motor-operated butterfly valve.This valve and a magnetic flow meter are in the gravity line between the clarifier andthe RAS sump. The RAS flows by gravity to a sump where it is picked up by a pumpand returned to the aeration basin. The pumping rate is determined by sump level. Th.present method of operating is to set the return sludge rate manually at some fixed rate.
Sludge is wasted with a system similar to the RAS system. A butterfly valve on agravity line is manually set to waste at a fixed rate through a mag meter to a WAS sump.WAS is pumped from the sump to a gravity thickener where it is mixed with intermediate sludge and primary sludge. An alternative wasting point is the primaryclarifier. The solids handling facilities have the potential of affecting the activatedsludge process in that they may Limit the rate of sludge wasting and thus affect thesuspended solids level in the aeration basins under certain conditions.
BI2
3 c,..0, %.1

WASTEACTIVATEDWAGE
RETURN ACTIVATED EU.IDOEIWASTE ACTIVATED SLUDGE
limbo AERATION BASINS L---]
EFALUVIT
PLANT FLOW DIAGRAM
'4P, rAl,Iro'Ag PA,, 4,,A WA, 44M
fg :Co 111; 1-11.o:
RAW SEWAGE
THICKENERRETURN
C111 or #44d0,41.:.okpLrrE FIJI Aclfokrcr) stuOt4 41111 ruteps
Cokrirt riAl U 1 kPgItkkg1oh
A"( ^-,14...
ICtc ACROT10:4
r,:. s.. ?,.. l..t 1 ? 10.044, Z',.., 1..., LEI:..1.1.1. l 1,N. LIAM(' APP.1- f 90.
;,.. 41 Ikkiv.r IC). tEvimo. i 10,1.z.). t.FPAI.F1 A.J Aftt.AEAC4..sr 0101.
A4Porik.:4St- IC,,). xElet LI-t.cao4..o- I )2i.Kt to Ilr° 4bo11el.sk.k.itr4 REMOVAL rACvDoe
0, 1A; L., jp,
1r rqtr;).r'1/4/.i'r t.011.).1.'1'.,:.5/1 A./2, ,
4,01(,,, .4, 'a .7At C 14::01,./s Po, A
Al ...A.,
rC
ACOA110'. vss71./
1;.itilPt ruertgbtperaVe 1.
HP-titio -,0,VA) 4.4 02/1 As 4.0.A46 11 .3z/fm) 4440.
MIMING FILTEA
0VABFQ 2LtmOTD,FT SO,
HID18111 411).
cfprg.ii lo,oAltEA6AcH.st 3217.i4LFAC4,CF 17170.
I.$ YL4r1iMAv;, I
14r .1^,-,,,41../; ,.- a. 11.1,. FFt' W.uvlI' , 1,10.,A. I .'", 0, ',v. t NOS Pk00,ktr/.,;/' F.00.) 10-.4 'I "U ./' . , ..!, 0 I, 1-1+ 1,,,/k.,/l_
MCkAstPOJ Q, h.; % if growdott. IS. VI.
0t,r7 Tef. ICA L
40.0 10.($
9). Vt.;)LI 15.P
)1.004 A4,1,114 e, , ., 11,6
vi.S.F.,/i. 4.,111, 1N.,,,
VAX to06.4,/i. ,..',..0.
AI", It1S.41,1 0,}J.
A 410141iLfa.0. LfVELA.MIJAtrTU4h, % F,,
PJ,t,,,
1:.!...
Ciro HIE.* 0..., tL1tro,4,..ot.act. ThiE,* A.P....PEtuR.4,oiqu6:,
,a,1.1
r.j/...,
VET. Twos N.I....4ETIANqao, .1..1 1.4
Sno.110.01 COMO I F04
ukf'.. LOMA% .01 /Arik-DP11"410N 7114.10.
101.1%1A6.14,i,r/i
4.4d p4 III
.14,.11 NAI
1,4r I,
B13.329
SO1.M1A1RAY 10).: 11 .:11;Ao/1 OA, 1 .41
4. 1,

it
1C
INDIANAPOLIS, INDIANA-WASTEWATER TREATMENT PLANT NO. 2SOUTHPORT ROAD AND WHITE RIVER
\General Description
The activated sludge system can be operated as conventional, step aeration or bioabsorption process. Various processes are run throughout the year, and are depend-ent upon waste strength ',nd influent flow characteristics.
Hydraulic monitoring, control, and distribution is the primary operating features. Allforce main type process flows are controlled by means of magnetic flow meters withremote readout and remotely-actuated valves. Likewise, gravity (open channel) flow ismonitored and controlled by Parshall flumes with flow indicators and remotelyactuatedslide gates. One exception to the above is that gravity,Dows to the various points inthe.aeration basins are distributed by manually-operated slide gates.
Performance
Process balancing is facilitated by the ability to transfer RAS or WASflows betweenunit processes within the plant. Another unique design feature is that primary sludgecan be introduced into the secondary clarifiers. As a safety feature only, Influentwastewater flows can be bypassed to other inplant processes.
Process Control
Fundamentally the plant is operated simply by the sludge blanket in the secondaryclarifier. The RAS vs. WAS proportion is determined by the current BOD loading on theaeration basins. The sludge drawoff is adjusted once to twice a day based on diurnalClow, and/or upon the observation of shock loading.
B-14
3.3 0

k
RA1114WAO.
W
PLANT FLOW DIAGRAM
PAT FiX0
ATO DRY 4401E900j
WASTEACTIUMSWORE
Cav OI ISDIA04FaLtb. 1,101AAA SoNTAP0N1 PLANTCuAYEsfitigAL ACTIVATED SLUDGE
Cu4116.7 FLAW 16 oPE04f1do 1911$
2FLAW DESIO,
IyAgcm, $144101$ eAms CLARIFIERS
ORX 04,460 42.o2e.4
49.0260) lOWIER
7$;.KINDER 4
FEAR luvRom 42.)LENOIN,FFmt0711.FT 30.
DIAMETE$,FF 100
rc)...°
FUR TYP% vfts0TC4
DEP711.11 0.0% la0USTRIAL DEPT11,FT 15.0 AREAE4CH.SF DIS4.
, 4111,04ACM.SF 22600. NEIR LENOTH,14 3I A.
SLIME NS$0v$L /tomPLAN; WAOIls AEDATIou =gat
DIFFUSED444rluft 11A5It..
C:::
aStERME
4:07."kr RotO.Mtal. RAX SCFm SO000.
494 5041iT41 $50994 M. 1.1 /4,0 ROD, 116%/1.1 kLe.wttt
i12!...r
gC4f.D4YS -r.
SLUDGE 40E.DAYS !/ ..,
nt':
9t94.M.A.941 posoun
roa,.
%IV OLS$004 'LAM PeIliORMANCEt VOLATILE 9 70.
EFF nov4mon
DEstok TYPICAL
t /1000 $60014%EFF SS %OA% Sy RimuYAL
24.12.0$4.li.:200.0.c0It1144,11:010.
000. LETELS040/1.AIR ARRLIED.SeFelAtAIR OPLIEDotr/L$ N)C6 3E1MOAN, tkAg WNW, g06F. TUC, 410 rfohyoluciaW. TtmEdo A.t.44610N.qquaSDEL FINE.* m.F.itergempoloAs
siCoo0Acw,1LARIFte4.
WOACE WhOIN3,5ALIsp/OAIREIR LOADIc.4...ALIFf/ARY067E1710.4 s1116.PJ4N5414.,09 LeA0996.1.4VSp/HijA
4.0 3.3t.1
14.104.
14.i 2°414.9.4 4.1
4.4 4.Q
COW%041
13,t. 30.334SY. 2>2.3.
I., .41.10 012
B15
IYP1C4L1.44 34T RVO
1331. 1.14.101204 21616e.
I.v T.)107 0.90
331

ti
CITY OF KENOSHA, WISCONSIN
General Description
The water pollution control plant facilities at Kenosha, Wis nsin consist essentiallyof a conventional activated sludge process, with solids treat t incorporating flotklion thickening, anaerobic digestion, and dewatering by pressure liters.
This plant is designed to handle an average dry weather flow of 23 mgd. Currently, Vieindustrial contribution is averaging 87 percent of the average dry weather flow. SinVek,the combined sewer system contributes high hydraulic loads on the facilities duringrainfall, the utility also placed in operation the world's first biosorption treatmentsystem. This it a 20 mgd project to demonstrate the biological treatment of combinedsewer overflows during periods of rainfall.
Performance and Process Control
The activated sludge system consists of four singlepass basins, with return activatedsludge applied at the influent channel. Variations of MS application other than at theinfluent channel are insignificant in importance. The alternate applatation points areat the beginning and end of the first aeration basin. Dissolved oxygen in the variousbasins are maintained at a level of 1 to 2 mgli. Air feed rates are generally notvaried, due to difficulty in manually adjusting these rates.
The four final clarifiers are the peripheral feed, center suction Sludge discharge variety.A common header with connections to each clarRier is used for pumping. Each pumpis variable speed; however, only three pumps are provided for the four tanks, thusmaking controlled takeoff difficult. Although the pumps are variable speed, the RASflow rates are not varied. The rate of flow is controlled through the use of a magneticflow meter in the line returning to the aeration basin.
The amount of waste activated sludge (WAS) is controlled by the MLSS concentrationlevel in the aeration basin. WAS is taken from the RAS line and fed to an open aeratedpit, where eventually the siudge will be fed to the flotation thickeners. Rate is variedto maintain an MLSS level between 2,500 to 3,000 mgll.
The most serious control problem is that associated with the hydraulic distribution offlow to the four secondary clarifiers. The problem arises from the fact that the lastexpansion added a secondary clarifier which itself is approximately 50 percent largerthan the initial three secondary clarifiers. The distribution channels were designedsolely to feed the initial three clarifiers; therefore, flbw to the new and larger clarifieris much below design capacity. Consequently, during large increases in flow, theremaining three clarifiers tend lo be hydraulically overloaded.
B16
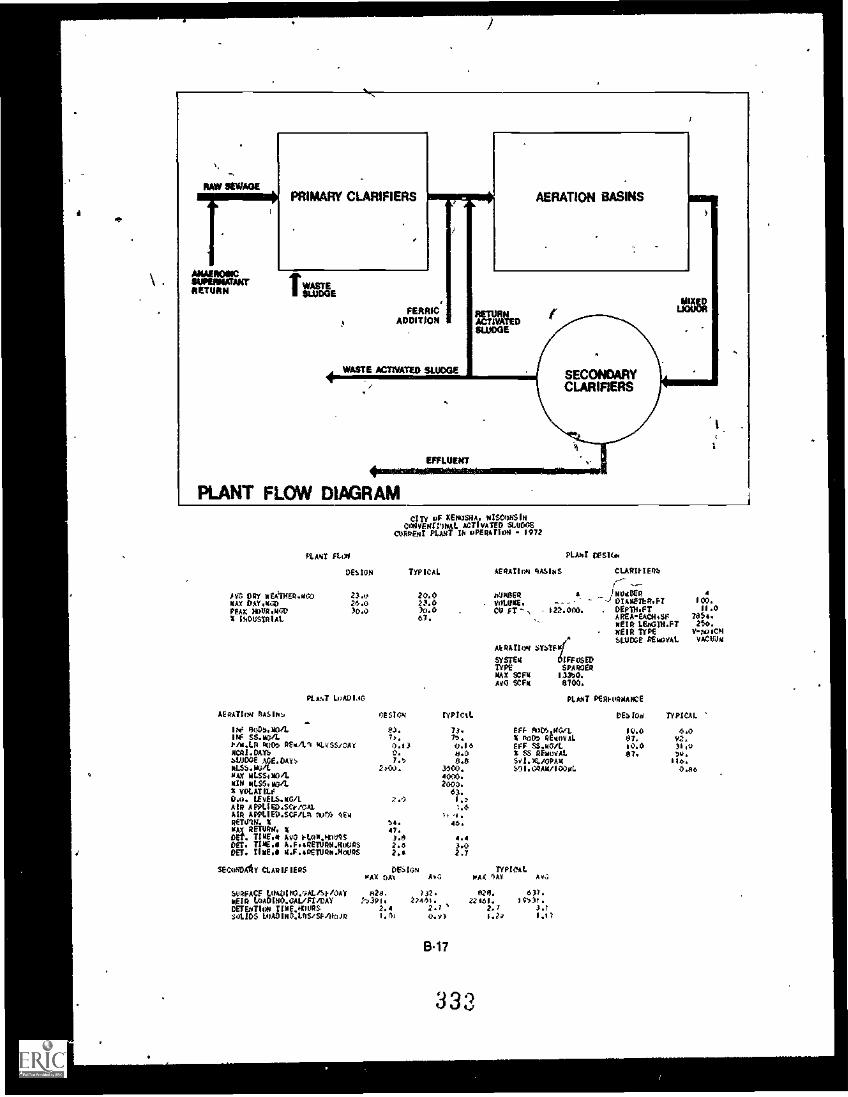
1
I SEWAGE
IANROINCSUP
AERMATAKT
RETURN
PRIMARY CLARIFIERS
WASTESLUDGE
3
FERRICADDITION
WASTE Amara SLUDGE
AERATION BASINS
RETURNACTIVATEDSLUDGE
EFFLUENT
SECONDARYCLARIFIERS
PLANT FLOW DIAGRAM
ElMIXED
UOUOR
CITY OF KEN0STIA, WISCONSINCoNVFNOINAL ACTIvATED SLUDGE
CURRENT PLANT IN oPERAtimi - 1072
PLANT FLt21 PLANT TOW..
DESIGN TYPICAL AERATION NASINS CLARIFIERS.---J--
390 DRY tiekrHER.m(k) 23.o 20.0 otINEER 4 I NO410 4
K AY DAY.NOX 26.0 23.0 YoLONE. - - --1 OIANETER.FT 100.
PEAK Nova.No0 30.0 30.0 CO FT-, 122.001. DEPIN.FT 11.0
% INDUSTRIAL 07. ... AREA-eAcii,sF 785..'lift LENGIMI.FT 25o.WEIR TYPE Y -M7ICHSWDGE REIN1TAL YACtium
PLANT WM3140
AERATIoN bTxtpkt
SYSTEM SEEMEDTYPE SPAROERNAY SCR 13390.MO SCFN 4100.
PLANT PERFoRNAICE
AERATION AASINu OESION IYPIcil. 0ExI0o TYPICAL '
INO IlooNv('+n. CO. 73. EFF 9009.00.,L. 10.0 6.0IMF SS.NOli 70, 75. T 39004 RENoVAL 07. 92.140.ER No04 REN/1.1 w.vSS/oke 001 0.16 EFF SS.NOIL 10.0 )1.0NCRI.DAYS 0. N.0 x SS REMUYAL $7. 9o.sLUDOE A0E.OAYx 7.9 8.8 SVI.X./OPAN ill..
IILSS.M0/L 2,00. 3100. $91.64AN/100mL 0.06MAX musoo/L 4000.AIN NLS1040/1. 2000.X T0LATILF 63.0.0. LEYEAS.AG/L 2.0 I.,AIR APPLSEO.SCp/OAL 1.4AIR APPLIED.SCFILN No% Atli )* sRETURN. %N AT RETURN. TOET. TINE.. AvO g-LoN.Fox4SGET. rime.. A.F.ARETURN.WoURSO ff. TINE N.F.NETURN.11004S
*moody CLARIFIERS
x.. 46.47.1.9 4.42.0 3.02.4 2.7
DESIGN TYPICALMAX Oki AVG MAR 10 A3.
SURFACE LOADIPIO.,;AL/StIOAY 824. 132. 929. 017.meta LookOlOO.OAVer/DAY 2)391. 22467. 22151. st,)t.
2.4 2.7 2.7 1.1DETENTION TIME.NOOSSOLIDS LoAOINO.ARS/sFrono 1.91 0.93 1.21 1.77
B17
333

,
/
4
LAS VEGAS, NEVADA - CLARK COUNTY SANITATION DISTRICT NO. 1TREATMENT PLANT
-1'General Description ',..----
In 1956 Clark County Sanitation District No. 1 put their 12 mgd trickling filter in service.in 1974 an addition to the original plant was put into operation, increasing the capacityto a total of 32 mgd. At this time, solids incineration was added.
Performance and Process Control
Pie treatment plant has had few operating problems, being a high-rate singlestagefilter plant. The main problems have been mechanical maintenance problems ratherthan serious operational problems. There is enough capacity in process units to pro-vide standby/backup capability when necessary. Here again, operation of the plant isnot significantly affected by the weather. One problem experienced at this plant hasbeen large amounts of freshwater snails accumulating in the chlorine contact tank.Anticipating a continuation of this problem, a traveling bridge collector was installedin the new chlorine contact tank, but the problem has been diminishing steadily sincethe new portion of the Plant has been put into operation. There have been operationsproblems with the Incinerator which have no effect on the operation of the tricklingfilter plant.
B8
334

4
LAt, 404. OtVADA CLARK OJ4TY Am?aft.DAN0 RATE TRICNLINO FILAR
CUORPA PLANT I.. OPVATIOJ 1074
POINT FLO.
VEW,0 wICAL
PLANT 0C4140
IITICAL160 PIL1E*4 CLARIOIENS
AvO URY 4EAIRE1,00.2 32.0 27,0 ,01060 a 140E0 a2014L.W.00D 53.0 34.0 4.1AF.EIER.1 100. PIANETER,FT 102.piAA NTSVNTA.4 530 34.0 00111.FT 9.0 OEPTN.PT v.4A 1400SIPIAL --, O. AIWA -EACH.SP 20353. AREA-R*444SP 70a4.
001.-EACH,CP 141764. HEIR Le02014FT 022.HEIR IVPE 0-00c4SLVDOE 4E40vAL Op.
PLAT PLANT reerpaNANCE
valcm.sho Patio': Pi->1O. kyPKAI
IA. DoDa.K./L 141. 74.
Ifir %AWL PM. e2J.004 1.0.0.111AWi3.3c*,0AY h7. 24.1.11) LOAD. WO/ACRE 2.. V.OrCINCOLAAJW.: 00 3A0.
4Ec0AqAPY cLANIFIt01.
ft",doil,lc 900, 0E40vALEfp: S.N44Ls s, 4Em0vAL
OF4y4 TYPICAL0A, JAV Ab.f. AVC
4V4FACE L0A01s.;,vALi,5-"At 'Jo. 415. 1 60. 401.L*AUINO,401/ef/DAI r?0. 10123. 161,61. /1710.
VIC.T104 1.2 l.V 2.4
1319
335
0040 TYPICAL
20.0 7.4ea. v0.
. 20.v 22.077. 00.

4*
LOWER POTOMAC POLLUTION CONTROL PLANT, LORTON, VA.
General Description
The wastewater treatment plant is a conventional activated sludge plant utilizing thecontact stabilization mode of operation. Diffused aeration is provided by positivedisplacement blowers. Each aeration basin has three passes with the first pass usedfir reaeration.
Waste solids are transferred to gravity thickeners f011owed by vacuum filters andincineration. Thickener effluent; filtrate, and spent cool'ng water are returned to theplant headworks.
The plant treats wastes/primarily from domestic sources. Average dry weather flow is15.0 mgd. Design average flow is 18.0 mgd. Effluent is discharg:1 to a creek.
Performance_
Effluent concentrations of SOD and suspended solids are typically, kt and 13 mgil,respectively. Settled wastewater has a typical SOD concentration 220 mg/I. Theside-stream flows, being transferred to the plant headworks, causes higher organicloadings.
Process Control
The primary control parameter fot this plant is the Sludge Compaction Ratio (SCR)method. The SCR is computed by obtaining mean values of 24 30.minute settling testsand 24 spin centrifuge) tests of hourly MLSS grab samples. The SCR is equal to thesettling' mean value divided by the spin mean value times 83.4. The number for oprational control is computed by multiplying the SCR by 100 and adding the settling meanvalue. For thiS plant, the control number of 500 appears provide optimum operation.The control number is maintained by solids wasting and is also used as an indicatorfor the addition of polymers. At this time no correlation of the control number hasbeen made to other process controls such as FIM, MCRT, etc.
.11
p
8.20
3 "
01.

ISLUDGE
WASTE
PRIMARYCLARIFIERS
WASTEACTIVATEDSLUDGE
NoiRsom,MIXEDUGUOR
fILTRATE RETURN
RAWSEWAGE
SETTLED SEWAGE
RETURN ACTIVATED SLUDGE
PLANT FLOW DIAGRAM
LAIr P1.4.
0faI WIC41 404411t' 3A.A15 CLOME44
CIii .or Locao4. qjtamik Lotcit PotOwAC PLAYItalP rECA ACINATEA St46A
41-,,r 1E44 PPM lo 0PfklAIUM iV73
WASTEACTIVATEDSLUDGE
EFFLUENT
SECONDARCLARIFIERS
Y
PLAUr 15A514:.
I.
64., Ofif 4,1.'0, o:., 14...) 170.AX JAA,.t, 7... ,O.0Prm, #./Ji, no J.,0 ,J.04 1.43Vo014t. 30.
401C*(1 ? rotNOFP 3
Lto.41.14 0. DIAMETCR.14 129.4101114i 0. oginx.Ft Ia.,
00111fi O. AREA-EACH.F 71310.AREAEACH.F O. ',gig, LEN1(4.1.1 IA/.
..EIR 1INT *-4114SLVO6f aemavAL weJ4
;IAA L.,Aut.; AMMON virai
4t101110T1 Mes1., l......1'. tYPICAL b1(.0 WPiIKAGWE 7M20
JA. 110D5.',11 it°. 2(U. 4Alf SCFM 0073Vir SS.0.11. 20). ;NJ. A96 411 13070t/0.1.ft N107 It ./L3 41-dS;/11A i V.jo 1614
4006.P47) '.0 1.5
AVOOE Pot, JAY, 1...6 0.O$1.5s404. t,7J 62t..
oAA AC.,:.. ..,la 400,
ol. 4C5S.VoI1. 500 PLAdi PER!! rAIAT.CE
90LAOIL1 11..
0.n. LEAtt>.mulL I.) 7.0
At 4001.10.SCr/qn '.2 ttaM MICALAIR APPLSED.Ch/L/A P,D, PrA 004.
swprol. 4 46. 46. 14 FOD9.04G/L 15.0 15,0.AA HEIVAII. 4 IV'. % tad:. AkamAL 43. , 93.(IL 714E, Ara tt04.11,AW. ...1 4.G 4_11. So.M0/1, 19.0 13.0Oti. aq0 A.P..44f100000VQJ JO 4,0 7 T4 4tM*101. 4). 93.VT. TM... ..r..nt41.0.,0,,I,o, 3,4 3.4 14111L/UPA6 10.
$31.00/00vAt 0.4
,EC40APY CA441r,..4
StinrACk L1)ADILO.vALPIP/0014F1q LOWICy.'C/FT/OV03103101 174f ./11UR0mun.; uonm.telr A: tiQ
!'e,1(7. f(PICAL04( JA, AL, MAX JAY AVO
adv. .3*. Ai,. AA:..
lot v,. t414v. 1$166 1307.3,J ;.1 J.1 4.$3
Odi .1.16 0.01 4,14
B-21
337
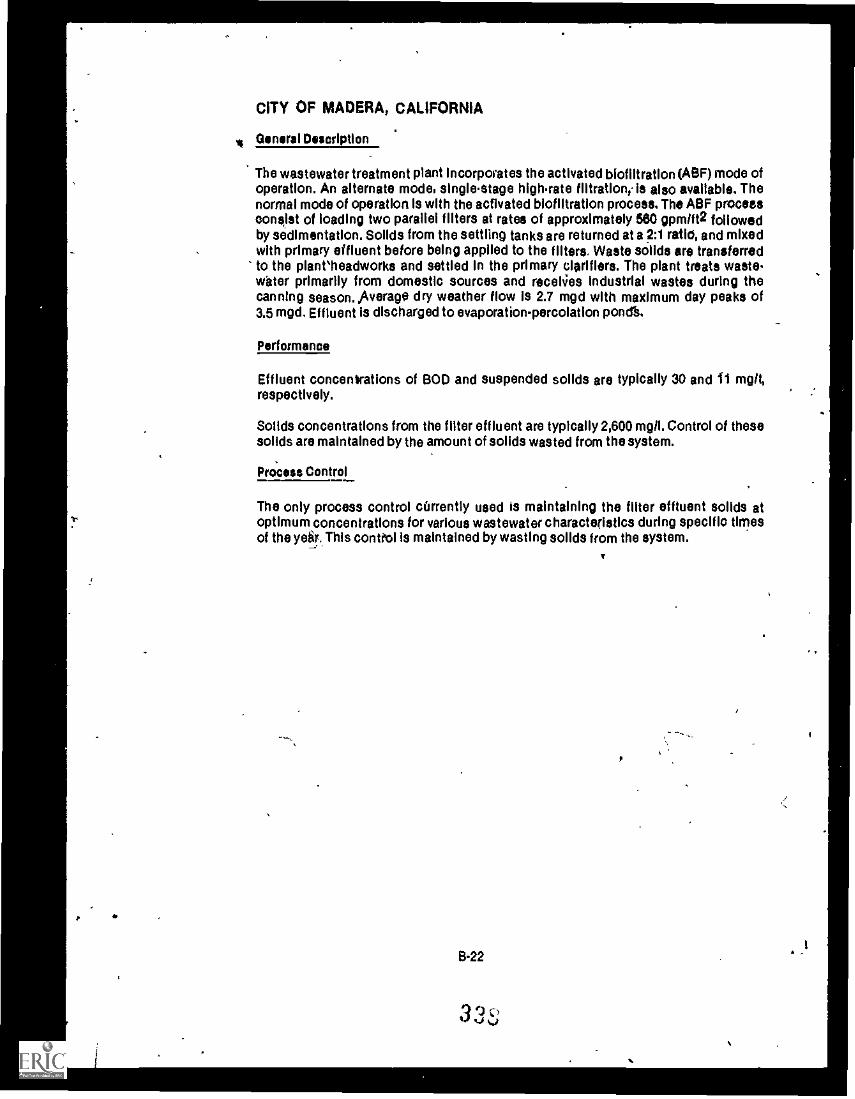
v.
..
CITY OF MADERA, CALIFORNIA
it General Description
The wastewater treatment plant Incorporates the activated biofiltratIon (ASP) mode ofoperation. An alternate mode, singlestage highate filtration; is also available. Thenormal mode of operation Is with the activated bloflitration process. The ABP processconsist of loading two parallel filters at rates of approximately 560 gpmlft2 followedby sedimentation. Solids from the settling tanks are returned at a 2:1 ratio, and mixedwith primary effluent before being applied to the filters. Waste solids are transferredto the plant'headworks and settled in the primary clarifiers. The plant treats waste-water primarily from domestic sources and receives Industrial wastes during thecanning season. Average dry weather flow is 2.7 mgd with maximum day peaks of3.5 mgd. Effluent is discharged to evaporationpercolation ponds.
Performance
Effluent concentrations of BOD and suspended solids are typically 30 and ii mgil,respectively.
Solids concentrations from the filter effluent are typically 2,600 mgil. Control of thesesolids are maintained by the amount of solids wasted from the system.
Process Control
The only process control currently used is maintaining the filter effluent solids atoptimum concentrations for various wastewater charactedstics during specific timesof the yetir..This control is maintained by wasting solids from the system.
V
i
,
.

RAW SEWAGE
PRIMARY CLARIFIERS
ENO -FILTER
-__1SETTLED SEWAGE
1MirkSLUDGE RETURN
WWI
WASTE SLUDGE
RECIRCULATION
EFFLUENT
PLANT FLOW DIAGRAM
SECONDARYCLARIFIER
810-FILTER
CITY of MADERA. 94.LIFoR4IA*MOTE° gpm.sour
WOW O1.A0T Ix uppp4E100 - 1072
PANT fLO1
ORION
AVG DAY *CA110E40.00 7.0MAX DAY.w00 II.0PEAS WoUR.o00 11.4S INDUSTRIAL
T.ricAL
2.73.27.0
70.
PAM" CEW
FRICKLINC 410.1M CLARItIM
KJ1DIE9 2 1.0.411ER
LEHOTO.F1 00. DIAAETER04mID1W.9T 40. DEFTH.fTDEPTH.FT 12.0 ARRA.EACH.SfAREA -EACH.Sf 3730. HEIR LE6Gfo.FT
'ID' -FACHAF 44071. HEIR TYFESLODOf 0E/40Y41.
277. '
2.04418.730.y.04401vAcuow
PLANT LqADIN1
TANKL184 FILTERS OEM,. fiPtest
FLAK PEPfoRwANCE
DE4ON 71PICAL
1Of 00060404. 010. 01. EfF 0005.w0/L 30.0 20.0HIP sp.mOrL . W. 10. S pop> AfixoyAL 73. 7v.0R0 L0AO.LROOD011000CF/VAt 77. 24. Eff SS.mOIL )0.0 22.0KYD LOAD. WOO/ACRE 100. 47. S SS REN0YAL 73. 10.DECIROULATI04.X 200. 700.
SECONDARY CLAIMPUS f>14N yPIC41.MAX DAY AvO wA4 04. 01e0
SVROACE LOA010.0ALISFIDAY P24h. 102. 300. 3(d.
WEIR LOADIK0.04LIDIMAY 233yy. 143x2. 7430. 57)2.DETENTKOI TIME$N0005 1.7 2.7 i.4 7.0
8.23
330

CITIES OF NEENAH-MENASHA, WISCONSIN - SEWAGE T\ATMENTPLANT
Genus' Description
The treatment facilities are designed to operate primarily as a conventional activatedsludge (CAS) or contact stabilization system. The contact stabilization mode has beentried periodically, and the results have been unsatisfactory. Tapered aeration wastried but resulted in clogged diffusers. Therefore, CAS is the only feasible mode ofoperation.
Perforthance
The primary facilities are designed to discharge only 13 mgd to the activated sludgesystem. Although the aeration facilities are designed to handle 18 mgd. the RAS heldconstant at 9.0 mgd make the ADWF to the system near 22 mgd. Flow in excess of 13mgd out of the primaries is hydraulically diverted to the interceptor sewer.
The RAS enters a wet well and is controlled by a telescopic valve arrangement. RASand WAS are pumped from the wet well. The WAS is flotation thickened and pumpedto a holding tank. RAS is returned to the head of each of the two aeration basins.
Process Control
Contrary to practice in most plants. the desire in operation is to achieve a relativelyhigh sludge level in the final tanks (correlates with the high SVI average of 210.220mug). Denser sludge blankets are particularly susceptible to lifting, with subsequentpoor effluent quality. Standard practice at this facility is to maintain a level of sludgenear the effluent weirs. The high SVI level is achieved by maintaining 3.4 mgil DO inthe effluent from the aeration basin.
High DO in the aeration basin is desirable, since at lower levels odor problems pe.-sist
B-243
a.
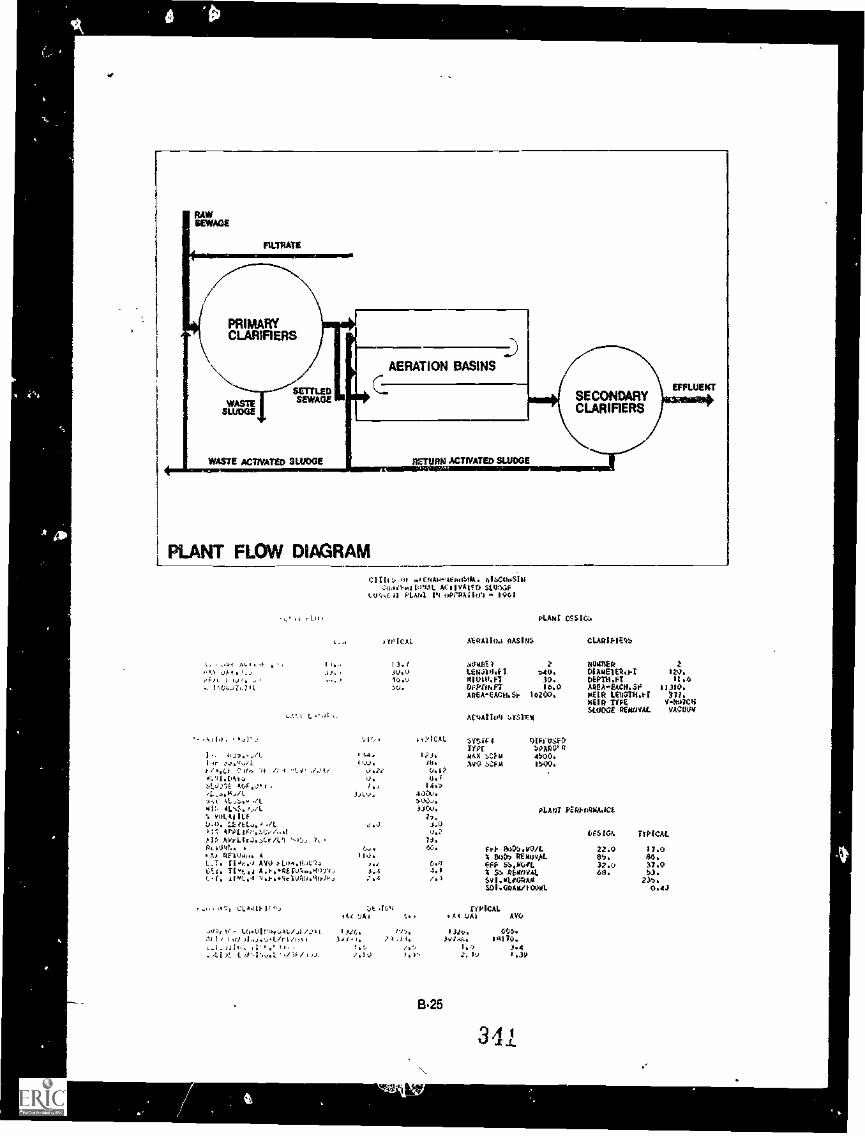
is
RAWBENNIE
FILTRATE
0(PRIMARYCLARIFIERS
AERATION BASINS
EFFLUENT
WASTESEWAGE
SLUDGE
WASTE ACTNATED SLUDGE
PLANT FLOW DIAGRAM
., rL.
ci orl:NAwEt.ohilA. 11140,4SIN,:.040-.110AL Acspotcp stuN:F
t..04,E PLAta 1.1 ourmatrt 1901
PLANT OS$101.
)1fi, 'CAL ARAI AASINS CLAIMIEgb
l. ,4t1 .1,.. , .1. . .. I I... 1 3.1 MPtrit / Z tognett 2''" OM .. il.. SUO., Leaaa.il 040. Diameittt.rt 120.riqt z ho,. ..,. 100 It11)111.FT 30. DEPTil.FT I/ .6.. 1..0.-40 rt 5U. OFPIII.r1 P.O0 A*g koEACII. SO WOG.
ARSAEACH.S1. 10200. PEIR L010111.1.1 711.HEIR "TYPE Vtl07C1iMAKE REMOVAL VACOIAt
L Aturiott 1.6n1!%(
.- 0,10. ..11... W, 4 t!,ICAL syfAc 4 NIFINSFOTYPC WO' rt
1 .. 41 J7 . ,11' st4, I71. /41tX heflA 000.I.r .:0,..dt i,..V. /U. AVG Sef.4 1300.r / ..LI ,.' .r.. 'IF /, 4 'Li' ./...4e J.2..2I 0.11 .0'...11.L0.14 t1. U.1
:.,J .!IE Af.,F...! I . 1... i4.., 1.4.144/1. 1.A.v. 440v.',it 41,..t.. WE >QC,.41: 41.1f.04/L 44tko. PLANT PL1114410.1
141..41 11.f 17.U.11. LL et L. , ./I. .:.J 4.0' r: APPL IP *.:4:i. /...t V.? 6 ESIV. TYPICALIP AWri.lt..).(..-/1,1 .--)_, .. 71.Pk i..141.. . G... 6c. frt &11:*Ifeit 22.0 17.0. 6* OF1040. 4 114. % B0Cra REMOVAL EP,. 86.L_T. 114,...1 AIN PLII./IJ1.14 ..1 G.F/ EFP Sh.11(./L 32.Q 37.0LAI. TIt1,1 A0-.01III.A0.4074.. 4.4 4.1 X $h REMOVAL 88. 13.r.- f . //t., .J.1-.9e1AII.9U1P., :.4 /.1 $V111,1/GRAM 23.
$01.GRAVI CRAM 0.43
b! .16.1 rYPICAL14( 'JAI 4A4 UA1 AV4
.,Or l(- 1.0.1 irk.41,4L/41/,t 1)26. 34o. 6051
.111. /".. 1 . s. scalp.nil.. .1' ! 3.44 L ./ "Is / +J. /O..) 1.1. 2. 1.) 1,39
B25
341

CITY OF PALO ALTO, CALIFORNIA
General Description
Due to the 'linty of the primary plan to meet the more strict discharge requirements,in 1066 it was decided to expand the plant and also treat the wastes from the cities ofMountain View and Los Altos by tne activated sludge process.
A reglanal plant wa; constructed with primary treatment, activated sludge secondarytreatment and solids incineration, the capacity being 35 MGD dry weather flow and53 MGD wet weather flow. The regional plant was placed in operation in 1972. Plansfor the future include expansion to 76 MGD dry weather flow and separate treatmentof toxic industrit... wastes.
Operation
The plant normally operates in the Complete Mix mode, but has the capability ofoperating in the Reaeration or Contact Stabilization mode. Reaeration has been triedat the plant, with little success. Sludge (RAS) is returned from the final clarifier with aportion being wasted. Waste sludge and primary sludge are thickened prior to de.watering and incineration.
B-26
1:4 4 6-1A ti

-St
NAW JEW I }
WASTE
PRIMARYCLARIFIERS
SETTLED SEWAGE
RETURNACTWATED
SLUDGE
PLANT FLOW DIAGRAM
Oil 11.7%1 tt 41-
(VIA.. I- P..0
N0'.04[PiA4-
! A..1 rS
WASTE
SLUDGE
MOM LIGUON
SECONDARYCLARIMERS
I!EFFLUENT
wartAmor)
Cl C. .1r kAL* AL.t. CALIt11gt.113.trt vt ACV r4;r)
1.>$1.".
.,1. AE)TSI1\ gg).St`. CL0P14-1
;%;*Po. $trovet.
forP, lc,to
ALSb,l1Q/I.nssokiel.
NIA au.ssovoir.r MAMA
1.411LS.7.:0,4.4ETLAN t
agfisgs.'11. 11,4.4 AY0
_CBI. 1114:40 A,t,,,REIgak.Q. ?Amor Mal 11LT,12...*(4111$
VEC04001 t.A/ IP :05
,1. r
Vif4`f PC.1. Cr
4 4L.00:1 4I _b. IAN3111.t. i ,I>.12). 10711,11 1..,.110 001.1,0 I 11 ,
1 6 2 ' _ : . ACIFRFPC'Vai 1 sPe .hEI0 LEhuis ., I 44u,. ii* Afri d-4.r.1':1..),ti..7 Oh* 1111, *AL :...I.
:41,11 .-.C4r1r-ltirp. ,...1rw4....no 16
10.11 LA ti,?tr . . zcy.,z,.; LI o2/.21' t,".....::..
ior
IIC . 71:-. IT MCC.4.1.. j,4 ik0 :1 .C.)0(.111. 10,1 . ' 40
A 0119? elgut4A. 0111, 44,*00 5. woe., d4.1) 14,4A 6. 4PoovAI 11, 7/.
.. I. 4LA,I1&1 flOJ .elf ORAi I i>JM1. 0.1J
VAA oPerIPICAL)t s!)
44PrAed 1.00n0,14/144ki .4;J. 0/4IMEM L4414.44Lf.gfe"n g%):J.. I4,VOJIL J. I./
../.; LOAVOCO,LOS/5./.. a /a .1
B27
')')1
313
3.9

k
CITY OF PHOENIX, ARIZONA - 91st AVENUE SEWAGE TREATMENTPLANT
General Description
Initially, a 5 mgd 'trickling filter plant was located at the 91st Avenue site. This planttreatec; wastewata from Glendale and the west Slaci of Phoenix until late In 1964 whenStage I of the 91st Avenue activated sludge Mao. was put into.operation..The capacityof tnis first stage was 45 mgd and was part of a hyecity (regional) waste r project.In 1969 a 15 ogd Stage H was put into operatioh, giving the plant a total ea city of60 mgd. At present, the 91st Avenue Sewage:Treatment Plaril is treating waste e44te7,---'from the cities of Glendale, Phoenix. Tempe, Scottsdale, Mesa, and Sun City. Young-town and Peon,- will be contributing their flows to the plant in tne near future. Con-etruction is urderway to expand the plant further, and future plans call for an eventualcapacity of 240 mgd. -
Perform Eng-gond Process control
The plant is eurreatly being operated in the conventional mode, but has the capabilityof oeing ripe ate In the step-feed mode. The 91st Aventie plant has experienced muchthe same got of problem with frothing in the aeration basins as the City of Tucson,and they solved it in the same manner by reducing the MLSS level to the 1,200 -1,600mgli range. As In tne case of the Tucson plant, this, along with a low sludge age of2 to 4 oays, seems to remedy the frothing problem.
B-28
1
v.
,

st-
ANAERCISICstwantormrRETURN
WASTE
RETURN ACTIVATED SLUDGE
WASTE
-\\
ACTIVATE D /SLUDGE
AERATION BASINSRAWSEWAGE
SETTLEDSEWAGE
PLANT FLOW DIAGRAM
cJ
A's 017 APdim OAT ..e_0
PEA,,
NO) .1.4 AA
PAP.? tiqg
1..
RhAf ,q,1/4
Apal toN AAWAb
[41'.3.4vet.
11 55.4=It'r 4f4/LA
iiCALOArbSLUDGE A4E.CA3,111.4S. M4/1
4AX 14.5S.L./1Mr4 MCS.m./A.I woLArt6E0.41.
Ail APPLIEr.P.W-P_ALAIR AFTLIED.7.:F/A1 t''DbRUM&MAX RistoftsD C1. TrKE. AVO FLuw.4 44$DE 1. 11*A A.,..+4tr4o%..1,11-4.
7imE.4 g.p.+Rfroo".4hAN
5fA1.3A41 CLA4:1- RP:
WaACI LoADMA4XL/la./OktMEIa 1.0160IU3.00.4.1f 1 /04 (
MENTION 1 IME.HOU43SOLIDS 7.11401NO.LOV>t tA
trly rf PriPEN1X. A WACO ofetii gObAL AclSYlifn 51.061
evR)r..7 PLAhl i4 WIDATIO4 100
serICAL
(A- 31 ,. lit ICAO
116.1474
Lo.2
1.T34, tr.7
7 -.Q. 14C.).
12ou.77.7.01.
if IA,
J.A 4:
.e
0..4t
047,otifid
1,4 2.4OAS
SECONDARY EFFLUENT
CLARIFIERS
KAU( DESK,.
AEcrAl it41 5151St. CLARIf SCRS
,14uoyia
LE%AttoTiAIDINFT*P0,0440r44PCH.:f
AfkA11I4. 5I EX
:,rSrifmfrPEMI ;:fh.PV0
4300.501.
17.0
OffFUS(1)'ZrikOak755'O,7200.
motettEATK.I7mix14.1TDEPIN.FT001,4140$.51N UR LqW1141-1N MI ME1100o1 REhovoit
PLANT Fcerio.tAsa
CO 0 *7.43/1.18I05 kE411l.AA55* Sa.140/1.% SS OfroAL$vi.01./GRAN30I.QQA*11000.
IWICAL106o j,/ 41.0
12v").I.6
8.29
0.71
3 LI
fr7:1.
/.4
?491.47.3.0
4704.100.
11.1041
?0.003.42.020.(JO.
1 .00

VILLAGE OF RIDGEWOOD, NEW JERSEY
General Description
The wastewater treatment plant is a conventional activated sludge plant. Design flexi.bliity of the plant allows the contact stabilization mode which is the current mode ofoperation. Diffused aeration is provided by low pressure centrifugal blowers.
Waste solids are processed by gravity thickening and anaerobic digestion. Additionalside stream flows such as digester supernatant and filtrate from the sludge vacuumfilters are transferred to the thickener. The thickener effluent undergoes separateaeration before being returned to the treatment process thus limiting additionalBOD loads.
The plant treats primarily domestic wastes. Average dry weather flow is 3.1 mgd witha design average of 5.0 mgd. Plant effluent is discharged to a river.
Performance
Effluent concentrations of BOO and suspended solids are typically 16 and 13 m911,respectively. The settled wastewater has a BOD of 130 mg/I.
Process Control
The FIM is held around 0.17 to 0.25 Ibs BOD/day/lb MINSS. The organic loading isnearly constant and by wasting to maintain a constant MISS fixes the F/M. 0.0. ismaintained around 2 mgll by adjusting the blower air rates.
f
B-30
A r*.4
S...

A 0 OGE
RETURNSETTLED ACTIVATEDSWAGE SUIDGE
STABILIZATION BASIN
PLANT FLOW DIAGRAM
VILLAGE OP ISDOt IMO NEA 1lRSE1COMmer
NkinsIT PLANT - 1966
01.X.4 FLos
0E54,4.
4Y4, URY .CA-WEI,K10 .044 0AY4G:, 7.a0E.WRFUR.WA) 7.I INGmaTRIAL
.19101.04.0o.0
so,
494A110.1
.4111E?V01.111g,
CO FT
PLANT DESIGN
O.1.71/.S CLANIFIE4a
I NURSER0. Di4NETF404
41.100, DEPTM.FT N.
AREA-EACN.aFNUR LEOSIN.FTIIEIR TYPESLUDGE PExavAL
1Ra.io.6
4416.424.
v-xoTceEPull
*F:oli(k4 1033Ex
SYSTEM PIFFMADTYPE SOCKMAX SCFm 6000.AVG scPx
PLANT PERFORAARCE
AE441101; 94414S rES13' PiPtC41. orAcx TYPICAL
PO Ao0,110/1. Is. 13a, EF1 800.110/L MO 14.01Nt $5,R4/1, Aa. .:. x Pnbt REMOVAL st0. 90.f/4.LS 100> Pcm/i.4 .L.,.,-/G, u,.1 o.%3 EFP Ss.mG,L .0.o 10.0mCPT.Ckla .... 6.3 I SS RE00YAL vo. es.SLUDGE AGE.DM$ 0.4 5.0 . 54,11L/GRAM 100.NLYS.00/L 20,0, 2100 SM,C4AR/1001AL 1.00NIX MLSS.Up/L 230U,MIN MLSS.XA. 14004I VoLAfiLE a>.
!....,
o.v0(4 4>6.
43.
0o. uni.s..mivl.AIR APPLiEb.SCF/GALAIP APPLIOscrAq f#0.)
RETURN, xMAX RETURN,GET. Timr.0 AiG rLo..movaDEE. TIME,, 4.f,ortivo000s,(TT. Tue.* ii.e..AElvas0400K:
).v
4),V.1,v1431.?
4.9
7.4
sTco4DO4Y CO.RIRIED. 0 5ivh 1)1400.0. .4) A(
SU*SXCE 1.0401..a.unt.4/011fg$stt Logolot.,0A1.11,14MOETCRTIo% fr.corwRst41.105 1...POINC,L6S/c/rtolP
419. )4,. A49. JA:.1,1+14, a1,16. 4117, X,)4 a
2.2 3.1 1.) 7.i0.44 0.,0 0.14 0.36
B31

a
.
ic. ST. PAUL, MINNESOTA METROPOLITAN WASTEWATER TREATMENTPLANT
General Description_.. --...
The current facilities were designed to operate as a high rate activated sludge processor step aeration activated sludge process, depending on influent conditions of theplant. Design average dry weather flow influent conditions are 218 mgd, 250 mg/I BOO,and 315 mg/1 suspended solids. , ,
This plant presently operates at or in excess of its design capacity. Existing sludgedisposal facilities are also operating at design capacity. These factors combinedresult in the plant failing to meet effluent standards.
Performance
Probably one of the most serious problems with the plant is its inability to operate inthe step aeration mode. The inability is due to (1) the loss of the incremental feed pipes,and (2) not enough air capacity.
Another problem which directly relates to the aerobic process is the fact that thegravity thickeners operate under an overloaded condition. This results in poor capture
-' efficiencies in the thickeners and consequently adds a solids burden on the aerationsystem. Related to the above isthe problem that more solids handling inventory.capacity lauired in the secondary system and flexibility for process control is verylimited.
1332
3 .4 :.%)
,I
I

PAW SEWAGE PRIMARY CLARIFIERS
AERATION BASINS
WASTE SLUDGE
SETTLEDSEWAGE
PLANT FLOW DIAGRAM
LIQUOR
SECONDARYCLARIFIERS
EFFLUENT
RETURN ACTIVATED SLUDGE WASTEACTIVATEDSLUDGE
01. ,- ... PAW.. ,14-itiA - lifiQoPotilAA PLAcit...at:mut acitviicq -Au) E
z.:.; A az /LA..? r. 1/PEq,31411 111,i
4ri.A..1
'%,i-, wicki.I
A. .4 .014.p...., 214., 2 $.1.0
,Ad JAI . ''D 111.J 343,4Pe In 1.1414 4:3.) 1.11..: 434.1:
PIM? *islorr
AtlArio. DASDS CLARIFIERS
i4314fleg 6 .40E4 t2
t".("44.11 !b. LE4Tu.f. 247.010311.13 110. %MOOT 7..
% i*AWIAL 43. niprn.f 10.4 DEPTH.!? 11,7A4EAE740.0 #2404. ANIA-EAC4,0 1v03.
&EP LEhOTN.Ft 62i.
FL4( 1.1ior.emEIR TM V.U4rCH
AERATION SYl7E? AIME REkovAL el.04
AEftAlioN. lAsi... :.15, iipicAt slirif, Diro.a.go
P o ;4969
10.. 14. r..-. 4 GO. iltt;Yrt
SC6.11 45364
1:100.Sr' r 3S. ' dr. 12.. tIO. 60.v Siff 60/).).1.,A0 .3.e7 4'./1A 1'4..33/641 Q.() 4.34'04443433 . 4.83LuJoe ACA....tr. 2. 2.4.L54.31J/3. 3 ,3.1. 37031.
4143 4353." ./1. 1401.
'4": 1t.43.".15. 11,11. 1PLA1.T 0646oPoriNC.E3 VOLAa ILE 03.P.O. LEVZ1. AWL d..1 I.,
AI AFLIE,4C /..64. 1.14 0E$I0.1 110 !CALArt ARatirX.SC./0 7,0. 4 v7 /,XETigh. X I,. r r. Eff r000.604 32.0 31.0MY 4tI904, t lo. 4. 134* REMOVAL 83. 77.IA i . lin.. Ow. 6:r.,.2... ,4 t$ .4 4.1 Err s).Non. 31.0 38.0De+. TINE 1 A .e.61..iT.,.r.. ,...,: ..1 1.6 X tts AX101,161. 76, 45.14.t. rift.' '1....611 6 r12. Pr.'.. ro .t./ Uit,uvORAil PIO.
S,1 , 0 RA14/100111. 8.91
S!CPh CUPP. I Pry Ji'.Ir. 10144.6. ,Ai ,
SW1a.ACE LOAUF02.016./..6., t. r 365, e26. 134.f..414 321r3. )1113. 341331.4. 13110.Ofnuni... .6.13...0 1.4 ).1 1.3 2.0
1.13 1.116
B.33
3 j
.41

.
I
.
SAN PABLO SANITARY DISTRICT, CALIFORNIA
General Description
The San Pablo Sanitary District, California operates a 12.5 mgd wastewater treatment'plant designed for yearound complete nitrification. The original plant consisted of aprimary treatment plant with effluent hlorination and anaerobic digestion for solidsprocessing. Additions completed in 19 eluded additional primary treatment lacties, a new plastic media roughing trickling filter, new aerationnitrification tanks, newsecondary clarifiers, an additional chlorine contact tank, new dissolved air flotationthickener, and two new anaerobic digesters. A primary design consideration in layingout the plant for nitrification was the presence of a significant volume fraction (11 to 13percent) of potentially toxic industrial wastes in the influent wastewater. Tank truckwashing residues and the waste from a manufacturer of organic peroxide and phenolformaldehyde are the major industrial waste sources. The roughing filter is used in thetreatment plant to proteot the nitrifying organisms from influent wastewater icxicity.Toxic dumps have caused severe sloughing and loss of growth on the media In theroughing filter, but nitrification remained unaffected.
Performance
Eff !ant BOD5 and suspended solids concentrations are typically 5 mgli. Completenitrification is obtained year round with a secondary effluent ammonia nitrogen conecentration of less than 0.2 mg/I. The roughing filter converts influent organic matterto biological organisms. This is indicated by data which shows that the total 9OD5 andtotal COD remain relatively unaffected by the roughing filter operation while thesoluble 8005 and soluble COD are reduced with a corresponding increase in totalsuspended solids.
Process Control
Control of the process is by maintaining an FIM of 0.15 lb 9OD51Ib MLVSS or an MCRTof around-13 days:The MLVSS concentration is checked each day and the waste rateis adjusted to give desired MLVSS concentration range based on desired FIM andprevious months SOD and flow data.
Air rates are adjusted twice a day to maintain DO of 3.0 mg/I in aerator effluent. Atimer is used to shutoff one blower at night.
RAS is controlled using a program cam in proportion to flow. The RAS flow is thenmodified by a MIL, station to give approximately 5,000 mgll solids in return.
i
8.34

0
7,0
PLANT FLOW DIAGRAM
--------
I agodEGFIHING FILTER EFFLUENT
rmACTUPA
ACTIVASLUTED/M)
WASTEActiVATIOSLUDGE
RATIONBASAEINS
SECONDARYCLARIFIERS"
*, EFFLUENT
CITY of SAN PM°. CALIFORNIAC64YEArINNAL MAMIE') $LVDC4 001 mo)GNINs FILEEN
C9s1A.4 PLANT IN oPERAII0N - 1972
PLAIT 01.4% PLANT DES144
OEStaA TOWN.
4 >
te.s
Ay0 DRY NeWEN.400 1 2.0
444 wit.m 0 16.)0141( 001:X.9,A0 16.9X 1040.50/104. 19.
kA,,A LNANIN0
T21C4Lio4 FIL10: DESSO CfPICAL
I* 004)9,4M. Ix). 420.IA 6$.0144 434. 120.(1w. LNAD.LON4Dp/1001cF/041( /20. IX.NTO 1.040. MG3 /AC04: .). 493.MEC11100LAI1010.% 244.. 200.
AERATINN fiAPIT4. DESii TYPICAL
PI 1005.w/L 110. 140.
!AO $$.v04. .10. 100.
0/4.1,R Pmpb AFIAA 4_441044 V.SJ 0.11401.DAX4 7.9 24.1
:.1.400E AUE.OAVs 3.,1 7.4
/4/.0$,X011. 0 . ,95.99.
AAA ALs$010/1 104.1119 4XUS.11C4, .....,.. 140).
1. 90L;111.E .1.
D.O. LEYEL.5.4G/1. 2.4: 3.0AIR APPLIED.0cF4,441 2.4A19 APPLIED.4C0/LN 4.176 FY 1G44.
RETURN, % 55. 31.
MAX RETURN. A 12.5.
0E1. TINE.. AY6 0144.4.104ups 4,4 10,4
DEA. AINE.6 A.r.oneilpielwA, 4.3 0.0VET. TINE.* N.F.4aEgup6.6(46:., 1.4 3.9
.IC0w0Aql CLANIFIFAS
AFoATINV DASIOS CLARIFIENs
/49911E9 2 WAREN 2
LAN314.4iT 2p2. LENOTN.FT 00.NIENO.F1 O. AIDAII.FT 64.CEPAN.FT 1V.0 OEPTH.FT 6.0AREA-EACA.* 1200. ANEA-EACN.SA IteCO.
NEIN LEM/MOT4fIR TIPS
240.y-ANACA
AFAk1104 SYSIEN 51.6137E EEN0yAL FLIGHT
NYSIk4 DIFEL*E0TYPE .),A90E4
141( ScFN 2400p.Av0 ;CFA 11040.
19IC4LIN0 FRAM
NUMBER IDIANETER.FT 52.0APTH.FT 18.0A9EA-EACH .SF 2124.A0L-fACK.Cy 36222,
0LAkT ,E10440ANCE
EFF 114105.m011.% 10$15 DEANYALI-FF &POO/I.
'S 4EN6YALpoI.ALioulS11.01/40/1.0Pc
0EL.14../ ffelcAL0Ay 440 0A4 ',414
WIMACE 1.040114.4ALF5F/044Y 764. 5)6. 166. JJ1.
z:Eto voul46.0AL/Fir0AY J/s/). 25)C0. 1J:142. 44 ;42,
DETE4TINN 214E,111V* 1.9 2.6 2.0 4.9".105 L4i40IG.05r..MOJ9 .49 0.49 0.01
B-35
351
TYPICAL
/1.0 4.091. 9/11.6 3..091. 92.
100.1.00
4

/
. CITY OF TUSCON, ARIZONA
General Description
The first primary treatment plant was constructed in 1928 and expanded in 1942. Pri-mary effluent was used for irrigation. In 1951 the first 12 mgd activated sludge plantwas put into operation, secondary effluent being sold for irrigation. In 1960 a highratetrickling filter plant was added in parallel to the existing activated sludge plant,increasing total capacity to 24 mgd. A second activated sludge plant was placed inoperation In 1968, in parallel with the other two plants. With the addition of this thirdplant, the total treatment capacity was increased to 37 mgd. At the present time, thethree plants are treating in excess of 33 mgd, but the plants are hydraulically over-loaded 12.18 hours per day.
i
)
Performance and Process Control
The two activated sludge plants are basically conventional plug flow processes. Thereis not enough flexibility in the plant to make other modes of operation feasible.
--i The plants are operated with a low MLSS, under 1,009 to prevent frothing from becominga problem. The sludge age is kept to 1.5 - 2 days to control frothing problems. Theactivated sludge processes are controlled to sludge age and misq Wasting and returnrates are adjusted as needed to cyiol to the appropriate sludge age and MLSS.
-14
160erations are not significantly affected by changes in weather or otheeenvironmentalchanges. The erratic flow characteristics, which hydraulically overload the plant for12 18 hours per day, cause the most serious chronic operational problems for theoperators. There is a solids washout problem in the secondaries when the hydraulicoverload condition exists.
1a
B-36 /I
3 52,
e

PERIM ACTIVATED =OW
PRIMARYCLARIFIERS
PLANT FLOW DIAGRAM
is
V.4.4 KUA
0:51(.4.
An, L,9 nEAiS(*.(1, 11.V4.14 DAV.4,00 14.0O. At It 701.2 ,,,, a.)
CITY Of rut.001. AAIUN& - PLANT rSCovvElitioNAL ACTIVATED UWE
Wt0E.1 PLANT iN 0PERAIION 1908
LIAM
02.4$4.022.
0041(181 .
1.0,41.46
AERAiia4 A4AP*
/..,. A0au.A04.
lur 5:...044.
0'11.0 9010% NO/LN 90:-.1./0Ai:474.0474HAM AyE.DAys4.44.202/1NA4 00.4. 4/Lno 4U4.00/.
V0LA4lLk0.0. LEVLL0040/1AIR APPLIP7.3C4ALAIR APPLIt14$0.4:7 21.19 IrtJ8170424 4Om Kluft. .4Lct. 1122LzA.k;1.1.0'1010,0E2. U. A.,..0:40012.,WAS..ET. fined 1.1.41t4V44.1100S
atc.4.047 CL4aI1l4,
SlArACk LoAu1.v.vAL,4t474744 LOAWIS.CAL/ttlAW
4C4L0110.1 11,r.00i0Ro:.01.10s LoAlri1v.J.War$0139
0LAut DE,10%
Musiom 13%ol0S CLARIFIERS
41.'0%4 4 NUMMI 1
LOUI40.1 0. 01ANETER.F1 102.
xiOcH.FT 0. 00111.1 r0.0
1Apahrt 0, ANEA.EACII.Si $04.
All% LENCIN01ANcAEACA,SP 0. o3q.14EIR TYPE /..,iTC3
ANNE KOVAL 1ACIANRATioN 4yagg
6C,104 iteicto.
1,0. $4V.IN. 01.
O.41) 0.770. 2.S4.4 2.7
20W. 1100.200.60(1.77.
$7300 11-6AITPE
;.PAR00ER 0
LAX SCkll 1040.440 $01 8100.
PLA02 fE4E0NNAOCE
2.o 3.00.V
Ot0.31. 30..,N.
4.# NO$.7 3.01.9 $.>
VE$104 71Plal
EEC 0007010,1 1%0 72.'J
7 90M REN01,4 O. a).
EFf %SAGA. lost, 21.0% So RE%0104. 00. f4.
0V1.10./ORAN 230.
501.48ANno010. 0.43
WAG'! MitaleA OA! A:y RAX 0Ai AV0
4+.18. 791. $00. 718.217f7, Iv)vY. 21212. 18180.
2.2 2.4 2.2 2.70./1 0.37 0.36
B37
353

NORTHWEST BERGEN CO. SEWER AUTHORITY, WALDWICK NEWJERSEY
General Description
The wastewater treatment plant a conventional activated sludge plant utilizing thestep feed aeration mode of operation Diffused spiral roll aeration as provided by Posi-tive displacement blowers. MISS as settled in rectangular clarifiers with sludge with-drawal from a trough at the midpoint of each tank. Waste solids are transferred togravity thickeners followed by centrlfucation and incineration.
The plant treats wastewater primarily from domestic sources with an average daily flowof 4 6 rgd Design average dry weather flow is 8.5 mgd Effluent as discharged to a river.
Performance
Effluent concentrations of BOD and suspended solids are typically less than 5 nightSettled wastewater has a typical BOO concentrat.on 01 100 mglt.
Process Control
ElM is,,held around 0.13 to 0 25 lbs BOOrdayilb MISS Actual wasting as controlled tomalt:nun a constant MCRT of about 6 days. The mode of process control is by main.Mining a constant MCRT Which varies the MISS and FIM. 0.0. is maintained around4.0 mom.
8.38

WASTEACTIVATEDSLIME
. PLANT FLOW DIAGRAM
PELT FLio.
CITY of NEW JERSEY NE PEKEN CO. PULAICusTAt r 5TA4101L414311/4
CORM PLOT IN 0141247106 - 925
7velc4i. A:FotTito 8psi4i W4101M
Au, OPy ACP1kft.,vav .3.7 4.t.
oAS 04.1,,,, 71.0 0.00PA 4.01.,1.V.:0 70.9 2.0% 1404'101m. ,,),
..03,04 3 MASER 3
i. 1or1.02 20). L6.16711.91 mo.61016.01 20. 10114,FT 32.06986.17 15.0 061/111.6f ,...049£4-86014.5P 4100. AREA-EAcsi.sF b2.7.
621111.61.3111.01 344.Eta iy22 i-ro to
AcArATipp. 5152(4 AVCOE RE60V4,- dAT,A,M
54f E 41PF r .01198 sr.'.114x WpA 19020.t420 ScFs 3500.
CI.ov2 IPADINC; Plat PEAF0264XCE
AEAAribi oul.fx els! c. 22rICA DESIGN TYPICAL
2* 6005.142,.. 220. 114. EFF N.-40min. 20,0 4.0I1.9 55.Wil. 226. tla. 3 MX 9660.41. 4.. 92.9,640 MO 0,204.1 4140,1 1.10 0.2A C. 2.11.10/1. 204 4.0OC97,114y$ 0, 4.2 X X 118601141. V. X.SLUE08 405.03V; I.? 6.8 Sei.kf./01166 253.11L55043/t. 2. 4A 1500. 501.036.11/100141. 0.32
4? 4L56.41/3/1. 2000.4th 1It.55.110/1. '500.X VOLATILE 75.O.U. LEVESS.00/L Z.7 4.1
AM 11991.111:45CF/001AIR APPLI1D.50149 6005 RP,A126116. 60411 IlaXIM XONT. TIME.. AVIS FLAT 140045
OET. TEMA A.F.ARETERE004E3DIT. TINA 0.11.*REIVRII,Ho12g
SECT) DANY C1011111911116144'
00.
40.1 44.71456613'.
011 00
1.21274.
IR.
7.20.13.5
linnet LoA0214.02141/.90AfL11ADIN0.0Aterr/DA1
08T61111416 1161,1111935SOLID, 1//ADIAO.t.nsISffiric
1212.
15220.I. s1.11
-01.1)24.
3.Z12.16
B.39
UMW.KAY DAY Aso
1112. 209.0944. 320,1.
3.4 4.00,21

t
?
P
- , -
APPENDIX C - LABORATORY EQUIPMENT
Outlined on the following pages are suggested laboratory equipment, supplies andchemical reagents required to perform the process control tests for typical aerobicbiological treatment facilities
In addition, optional equipment. anchor methods have been included for certain tests.All test methods are referenced to Standard Methods for the Examination of Waterand Wastewater. 14th Edition, 1978. APHA. AWWA. WPCF
Additional equipment required in conjunction with the following tests include
1 Standard type refrigeration tor sartipie storage2. Fume hood3 Bottles for collecting and storing of samples or use with automatic samplers.4. An appropriate carrying device for sample bottles If samples are collected
manually5. Sample bottle tongs with extended handle
BOD TEST
A Equipment and supplies
1 Incubator (BOD) Capacity, 13 cu ft . ambient air thermostatically controlledat 20± 1 °C
2 Bottles (BOO), meet APHA specifications. numbered in sequence. 300 mlcapacity, 2 cases (48 bottles suggested)
3 Buret, Straight Stopcock. with side tube stopcock for tilling, 50 ml capacity.0.1 ml subdivisions
4 Support, Buret Double. with holder5 B9ttle, reagent. 1000 ml capacity, with tubulature near bottom6 Bottles (4) Dropping Assembly. 25C ml capacity7 Bottle, carboy. 5 gal8 Tubing, polyethylene, 10 1t9 Pipets. volumetric, assorted sizes, 1 to 25 ml, color coded, 01 n-i! subdivisions
to Balance. Triple Beam, 600 grams. sensitivity 01 gram11 Hot PlateiMagnetic Stirrer12 Flasks eylenneyer. 500 ml capacity
B Chemic^ Reagents1 Distilled water
2 Sodium Thiosullate solution3 Concentrated Sulfuric Acid4. Manganous Sulfate solution5 Alkaline lodidesodrum azide solutions6 Starch solution7 Phosphate buffer solution8 Magnesium Sulfate solution9 Calcium Chloride solutions
10 Ferric Chloride solution
C-1
35C
i

C Optional Equipment/Method1. Polargraphic Dissolved Oxygen 11/leter, self contained, with BOD acitator
and probe assembly
COD TEST
A Equipment and Supplies1. Extraction Apparatus. 6 unit, complete with support rods. clamping brackets.
and rud clamps. 115 Volt ac2. Condensers, retlux with g joint both top and bottom, and drip tip at
bottom. length 350 rum3. Flasks, boiling, flat bottom, short neck, with mint, 250 ml capaCtity4. Cylinder, graduated. 50 ml capacity5 Pipet Filler, Polypropylene. Nalgene, safety, for use with volatile, corrosive
and poisonous liquids6 Pipets. Volumetric, color coded, 25 ml capacity, 0 1 ml subdivistons7. Tubing. polyethylene. 25118. Buret, Straight StoPCock, with side tube stopcock for filling, 50 ml capacity,
0.1 mi subdivistors9 Support, Buret Double. with holder
10 Bottle. Reagent, 1000 ml capacity, with tabufature near bottom11 POtable water source
12 Ruboer gloves and apron13 Clamp, Flask, Safety Tongs14 Safety glasses15. Beads. glass16 Balance, Triple Beam. 600 grams, sensitivity 0 1 gram
Chornicai Reagents1 Standard Potassium Dichromate Solution2 Sulfuric AcidSilver Sulfate Solution3 Standard Ferrous Ammonium Sulfate Solution4 Forlorn Indicator5. Silver Sulfate. i- ;wrier6 Mercuric Sulfate, analytical grade cr5Oals
SUSPENDED SOLIDS TEST
TOTAL SUSPENDED SOLIDS
A Equipment an1. Filter. holders, membrane assembly for vacuum filtration2 Flasks, filtenng, 1000 mi capat ity3 Tubing. Vacuum, 10 ft4 Forceps, specimen5 Pump, Air Pressure and vacuum type6 Paper. filter, glass fiber, 47 mm diameter
C. 2
Lo .., A

7. Vacuum, manifold with four col -tact ions and stopcocks6 Oven, drying. with forced draft. thermostatically controlled to maintain
103 ± C9. Cabinet. Desiccator, for vacuum drying and storage
10. Balance. Analytical, automatic. digital, single pan; readout to 0.1milligram
11. Cylinder. graduated, assorted sizes (25 to 100 ml capacity)
B. Chemicals1. Desiccant. silica gel air dryer
II. VOLATILE ``..`.SPENDER SOLIDS
A. Equipment and Supplies1. Furnace, muffle, 115 Volt ac, thermostatically controlled to maintain
600 ± 6 C
OPTIONAL EQUIPMENTiMETHOD
A. Gooch crucible method with 2.4 cm glass fiber filter
SETTLEABLE SOLIDS TEST
A. Equipment and Supplies1. Cones. Imhoff, 1000 ml capacity
2. Stand, Imhoff cone3 Rod. :tirrer, glass4. Timer, interval, range 15 minutes to 2 hours, 115 Volt ac
NITROGEN-KJELDHAL (TKN)
A Equipmeni and Supplies1, Bulbs. connecting, spherical. 65 mm diameter2. Tubes, delivery, with safety bulb3 Flasks, 800 ml capacity4 7.15pper, rubber. 800 ml Flask size
5. apectrophotomel 400 to 425 MA wito light patth of 1 cm or longer6. Qistillation Apparatus, 6 unit, kieldhal, 115 Volt ac..7 Br, ',fa, glass8 Ficisks, er,;nmeyer, 500 mt capacity9. Cylinders, graduated, 5C to 5Lr. " aPacitY
10. Balance, triple beam, 600 grams. sew; !Noy 0.1 gram11. Rubber gloves and apron12. Safety glassas
B Chemical Reagents1 OWN:A Water
C-3

c
(
c
s
...
2. Potassium Sulfate3. Concentrated Sulfuric Acid4. Red Mercuric Oxide5. Phenophalien indicator Solution6. Sodium Hydroxide7. Sodium Thiosulf ate, 5 parts water8. Methyl Red Indicator9. Ethyl Alcohol
10. Methylene Blue11. Indicating Boric Acid Solution
C Optional Equipment:Method1 Filter Photometer, with maximum transmittance at 400 to 425 mil and fight
path of 1 cm or longer2. Messier Tubes, matched, 50 ml capacity, tail form
AMMONIA - NITROGEN TEST(Nesslerization Method)
A_ Equipment and Supplies1 Spectrophotometer for use at 400 to 500 MA and light path of 1 cm or longer2. Beakers. assorted sizes. 25 to 200 ml3 Pipet, fillers, for use wit 1 corrosive liquid4 PipCs. assorted sizes, 1 to 25 ml, color coded, 0.1 ml subdiv, ions5. Cylinders, graduated, assorted sizes 25 to 200 ml6. Bottles, reagent. 1000 ml capacity7. Balance, triple beam, 600 grams. sensitivity 0.1 gram8. Rubber gloves and apron9 Safety glasses
B Chemical Reagents1 Ammonia free water2 Potassium Dihydrogen Phosphate3. Dipotassium Hydrogen Phosphate4 DechlorinatiOn agent Thioaulfate5 Sodium Hydroxide, 0.3N6 Sodium Arsenate7 Sodium Sulfite8. Sulfuric Acid9 Zinc Sulfate
10 Mercuric iodide11. Potassium iodide12. Ammonium Chloride, Anhydrous13 Hydrochloric Acid14 Potassium Chloroplatinate15 Cobattous Chloride
C-4
3 ,..... ......
w
-e
/

..,
tC. Optional Equipment/Method
1, Falter Photometer with maximum transmittance at 400 to 425 mp lightpathof 1 cm or longer
2. Messier Tubes, matched. 50 ml, tall form3 . pH meter, equipped with high pH electrode4. Phenate Method (Tentative)
NITRITE- NITROGEN TEST
A. Equipment and Supplies1. Spectrophotometer, for useat 400 to 500 mp and light path of 1 cm or longer2. Beakers, assorted sizes, 24. to 200 ml 1
3, Pipet, fillers, for use with corrosive liquids4. Pipets, assorted sizes, 1 to 25 ml, color coded. 0.1 mi subdivisions5. Cylinders, graduated, assorted sizes. 25 to 200 ml6. Bottles, reagent, 1,000 ml capacity7. Balance, Triple Beam, 600 grams, sensitivity 0.1 gram8. Rubber Gloves and Apron9. Safety Glasses
B. Chemical Reagents1. NitriteFree Water2. Potassibm Permanganate3. Calcium Hydroxide4. Orthotolidine5. Concentrated Sulfuric Acid6. Manganese Sulfate7. Ammonium Oxalate8 EDTA Reagent (
9. Sulfaralli3 Acid10. Hydrochloric Acid11. Naphthylamine Hydrochloride12. Sodium Acetate13. Sodium Nitrite
C Optional Equipment ethod1. Filter Phutomet , with maximum transmittance near 500 mil and light path
of 1 cm or longer2. Nessler Tubes, matched. 50 ml, toil form
NITRATE - NITROGEN TEST(Bruclne Method)
A Equipment and Supplies1. Spectrophotometer. for use at 400 to 500 mp and light path of 1 cm or longer
2 Beakers, assorted sizes, 25 to 200 ml
3. Pipet, fillers, for use with corrosive liquids4. Pipets, assorted sizes, 1 to 25 ml, color coded, 0.1 ml subdivisions
C5

r
OP
5. Cylinders, graduated, assorted sizes. 25 to 200 ml6. Bottles. reagent, 1,000 ml capacity7. Balance, Triple Beam, 600 grams, sensitivity 0.1 gram8. Rubber Gloves and Apron9. Safety Glasses
10. Test Tube Rack11. Test Tubes, 2.5 x 15 cm
B. Chemical Reagents -
1. Potassium Nitrate, anhydrous2. Sodium Arsenite3. Brucine Sulfate4. Sulfanilic Acid5. Concentrated Hydrochloric Acid6, Concentrated Sulfuric Acid7. Sodium Chloride
C. Optional EqulpmentlMethod1. Filter Photometer, with violet filter, having maximum transmittance between
400-425 my and light path of 1 inch NI
2. Zinc Reduction Method3. Cadmium Reduction Method4, Phenoldisulfenic Acid Method5. Chromotropic Acid Method
TOTAL PHOSPHORUS (AS P)(Ascorbic Acid Method)
A. Equipment and Supplies1. Spectrophotometer, for use at 400 to 500 mu and light path of 1 cm or longer2. Beakers, assailed sizes. 25 to 200 ml3. Pipet, fillers, for use with corrosive liquids4 Pipets. assorted sizes, 1 to 25 ml, color coded, 0.1 ml subdivisions6 Cylinders, graduated, assorted sizes. 25 to 200 ml6 Bottles, reagerit, 1,000ml capacity7. Balance. Triple Beam. 800 grams, sensitivity 0.1 gram8. Rubber Gloves and Apron9. Safety Glasses
10, Cylinder, mixing 100 ml capacity11. Hat PlatelMagnetic Stirrer, combination
B Chemical Reagents1. Ascorbic Acid2. Antimon Potassium Tartrate3. Hyrochiorfc Acid4. Sutturfc Acld5, Ammonium Malybdate
C6
3 Si

i
6. Ammonium Persulfate7. Potassium Phosphate, dibasic8. Potassium Phosphate, monobasic9. Sodium Hydroxide
10. Phenolphthalein
C. Optional EquipmentlMethod1. Filter Photometer, with red color filter and light path of 0.5 cm or longer2. Vanadamolybdaphasphoric Acid Colorimetric Method3. Stami.ous Chloride Method
30-MINUTE SETTLING TEST(One Liter Graduated Cylinder Method)
A. Equipment and Supplies1. Cylinders, graduated, one liter (1,000 ml) capacity; glass cylinders rec-
ommended.2. Rod, glass, stirrer3. Interval Timer, 1 minute to 2 hours, 115 volt ac4. Bottles, sample, wide mouth, 1 gallon capacity
B. Optional EquipmentlMethod1. Mallory Direct Reading Settlometer. 2,000 ml capacity
DISSOLVED OXYGEN TEST(Winkler Method)
A. Equipment and Supplies1. Bottles (BOD), meet APHA specifications, numbered in sequence, 300 ml
capacity, 2 cases (48 bottles suggested)2. Buret, stra,ght stopcock, with side tube stopcock for filling, 50 ml capacity,
0.1 ml subdivisions3. Support, Buret Double, with holder4. Bottle, reagent, 1,000 ml capacity, with tubulature near bottom5. Bottles (4), dropping assembly, 250 ml capacity6. Tubing, pOlyethylene, 10 ft.7. Pipets, volumetric assorted sizes, 1 to 25 ml, color coded, 0.1 ml subdivisions8. Balance, Triple Beam, 600 grams, sensitivity 0.1 gram9. Hot PlatelMagnetic Stirrer
10. Flasks, erlenmeyer, 500 nil capacity
B. Chemical Reagents1. Distilled Water2. Sodium Thiosulfate Solution3, Concentrated Sulfuric Acid4. Manganous Sulfate Solution5. Alkaline Iodide- Sodium Azide Solutions
6. Starch Solution
C7
362
v
P

a
.,
7. Sulfamic A4id, technical grade8. Copper Sulfate9. Concentrated Acetic Acid
C. Optional Equipment/Method1. Polarographic Dissolved Oxygen Meter, self contained, with probe assembly
" pH TEST(Electrometrlc Method)
A. Equipment and Supplies1. pH Meter2. Electrode, reference3. Electrode, glass4. Beakers, 100 ml capacity5. Bottle, wash, 250 mi capacity
6. Tissue Paper
B. Chemical Reagents1. Buffer Solution, pH 4A2. Buffer Solution, pH 7.03. Bdffer Solution, pH 10.04. Filling Solution, for reference electrode5. KCL Solution, saturated
C. Optional EquipmentIMethod1. Colorimetric Method (not recommended for wastewaters)2. pH Paper (provides quick estimate)
TEMPERATURE
A. Equipment and Supplies k
1. Combination Thermometers, 20° to 4. 150° C, .1. 20° to 220° F
2. Thermometer, 0° to + 120° C, with metal armored case and nylon cord
B. Optional Equipment/Method1. Telethermometer2. Thermistor Probe
C8
363

.4.
REFERENCES
APHA, AWWA, WPCF, Standard Methods for the Examination of Water and Waste-water, 14th Edition, 1976 - APHA NewYork, N.Y.
Ministry of the Environment, Activated Sludge Process Analyses and interpretationWorksuop Manual, Training, Certification, and Safety Section, Toronto, Ontario,M4V,I.125.
Nagano, J., Laboratory Procedures for Operators of Water Pollution Control Plants,California Water Pollution Control Association, October 2, 1970.
U.S. Environmental Protection Agency, Estimating Laboratory Needs for MunicipalWastewater Treatment Facilitiesm, Office of Water Program Operations, Publlcation No. 43019.74 -002, Washington, D.C.
e
U.S. Environmental Protection Agency, Estimating Laboratory Needs for MunicipalWastewater Treatment Facilities, Office of Water Program Operations, Publica-tion No. 4301 9.74.002, Washington, D.C.
Water Pollution Control Federation, Simplified Laboratory Practices for WastewaterExamination, Manual of Practice No. 18, 1971.
,
C-9
36$

APPENDIX D- GLOSSARY
.7----
,.,....
Absorption The taking up of one substance into the body of another.Activated Sludge Sludge floc produced in raw or settled wastewater by the growth of
organisms (Including zoogleal bacteria) In the presence of dissolved Oxygen. Theterm "activated" comes from the fact that the sludge is teaming with active, orliving, microorganisms. .
Activated Sludge Lading The pounds of biochemcial oxygen demand (BOO) in theapplied liquid per unit volume of aeration capacity or per pound of activatedsludge per day.
Activated Sludge Process A biological wastewater treatment process in which a mix.tura of wastewater and activated sludge is agitated and aerated. The activatedsludge Is subsequently separated from the treated wastewater (mixed liquor) by
- sedimentation and wasted or returned to the process as needed.Adsorption The adherence of a gas, liquid, or dissolved, material on the surfage or
interface zone of another substance. .
Aeration The bringing about of intimate contact between air and a liquid by one ormore of the following methods: (a) spraying the liquid in,the air, (b) bubbling air
, through the liquid, and (c) agitating the liquid to promote surface absorption of air.Aeration Period The theoretical time, usually expressed in hoUrs, during which mixed
liquor is subjected to aeration in an aeration tank while undergoing activatedsitidge treatment. It is equal to the volume of the tank divided by the volumetricrate of flow of the wastewater and return sludge.
Aerobic (1) A condition in which "free" or dissolved oxygen (02) is present. (2) Re.quiridg, or not destroyed by, the presence of free oxygen.
Alkalinity Buffering, or acid neutralizing, capacity of water due primarily to its car-banal°, bicarbonate, and hydroxide content.
Ambient Temperature Temperature of the surroundings.Anaerobic (1) A condition in which "free" or dissolved oxygen (02) is not present.
(2) Requiring, or not destroyed by, the absence of free oxygen.Assimilation The process by which food is converted to cell protoplasm.Autotrophic Having the ability to utilize CO2 as sole source of carbon.Available Oxygen The quantity of dissolved oxygen available for oxidation of organic
matter in a water body. 1
Bacteria Singe celled microorganisms of primary Importance In most biologicalwastewater treatment processes.
Batch Reactor Reactor In which how is neither entering nor leaving on a continuousbasis.
Biochemical Oxygen Demand (BOD) A standard test indicating the quantity of oxygenutilized by wastewater under controlled conditions of temperature and time.
Bioassay Estimating the toxicity of an effluent by testing its effects on livingorganisms.
Biodegradation The destruction or mineralization of organic materials by microorganisms.
Bioflocculation A condition whereby organic materials tend to be transferred fromthe dispersed form in wastewater to settleable material by mechanical entrap.vent and assimilation.
Biological Examinations A microscopic survey of the types of microorganismspresent In a sample.
D1
365
4
........_
ite
La
*

Biological Filter A bed of sand, gravel, broken stone, or other medium through whichwastewater flows or trickles that depends on biological action for its effectiveness.
Biological Filtration The process of passing a liquid through a biological filter, thuspermitting contact with.zoogleal films attached to the media that adsorb andabsorb fine suspended, collodial, and dissolved solids and release end productsof trioch, nical oxidation.
Biological Vagstewater Treatment Forms of wastewater treatment in which bacterialor biocheincial action is intensified to stablize the unstable organic matterpresent and remove non.settling solids. Intermittent sand filters, con act beds,trickling filters, and activated sludge processes are examples.
Biological Reactor The site(s) in a wastewater treatment plant where thebiochemical reaptions take place.
Biomass Active or dead microorganisms present in a particular area of aOiologicaltreatment plant.
BOD See Biochemical Oxygen Demand.BOD5 Five-day biochemcial oxygen demand, the oxygen demand exerted after five
days of a SOD test. (See Bio9hamcial Oxygen Demand)BOD Load The BOD content, usualli expressed in pounds per unit of time, of waste-
water passing into a waste treatment system. .Bulking Sludge An activated sludge hat settles poorly because of low-density floc.Gackonaceous Oxidation Biochemical rocess by which heterotrophic microorganisms
'derive energy from organic wastes, tendering more stable organics or inorganicsa's end-products.
Catalyst A substance that speeds up a chemical reaction without tiling altered Itself.Chemical Oxygen Demaild (COD) A mealkure of the oxygenconsuming. capacity of
inorganic and organic matter preseht in wastewater. It is expressed as theequivalent amount of oxygen required as determined using a chemical oxidant ina standard test. (toes not differentiate between stable and unstable organicmaterial and thOs does.. not -necessarily correlate with biochemical oxygendemand (BOD).
Chlorination The application of chlorine or chionne compounds to water or waste-water, usually for disinfection, but frequently to obtain other biological or chemi-cal results.
Chlorine Contact Chamber A detention basin provided primarily to secure the diffusionof chlorine through the liquid.
Chlorine Demand The difference between the amount of chlorine added to water orwastewater and the amount of residual chlorine remaining at the end of a specifiedcontact period.
Ciliate A type of protozoan characterized by shod. filamentous cilia used for motilityandfor capturing food
Coagulation The clustering of suspended solids into larger particles or flocs causedby the addition of a chemical (coagulant) or by biological processes.
COD See Chemical Oxygen Demand.Coliform-Group Bacteria A group of bacteria found in the intestines of man which are
used as indicators of fecal pollution and the presence of pathogenic bacteria inwater and wastewater.
Colloids Finely divided. non-settleable solids which may be remcad by coagulationor biochemcial action.
Complete Mix Idealized continuous flow reactor in which fluid particles are immedi-ately dispersed throughout the reactor.
D2
3
1"

\Complete Treatment In an imprecise and general sense, the processing of domestic
and some Industrial wastewaters by means of primary and secondary treatment.It may Include other specialized types of treatment and disinfection. A highpercentage removal of suspended, colloidal, and dissolved organic matter isImplied.
Composite Samples Samples collected at regular intervals, sometimes in proportionto the existing flow, and then combirld to form a sample representative of flowover a period of time.
Concentration (1) The amount of a given substance dissolved or suspended in a unitvolume of solution. (2) The process of increasing the solids per unit volume in aliquid. T
Contact Aerator A biological unit consisting of stone. cement-asbestos, or other sur-faces supported in an aeration tank, in which air is diffused up and around thesurfaces and settled wastewater flowsithrough the tank.
Contact)labilization Process A modification of the activated sludge process in whichwastewater is aerated with a high concentration of activated sludge for a shortperiod, usually less than 60 minutes. to obtain BOD removal. The solids aresubsequently separated by sedimentation and transferred to a stabilization tankwhereaeration is continued, starving the activated sluri_.e before returning it tothe aeration basin.
Conventional Activated Sludge Process Activated sludge process utilizing plug flowthrough the aeration oasin with primary effluent and activated Sludge fed at thehead end and uniform aeration throughout.
Cytoplasm Contents of a biological cell excluding the nucleus.Degradation The conversion of a substance to simpler compounds.Density Mass per unit volu.ne of any substance.Design Parameters Various criteria used to deterra size, shape, quantity, and/or
methods in the design of units and processes in a treatment plant_Detention Time The time required to a tank at a given flow or the theoretical time
required for a given flow of wastewater to pass through a tank (volume divided byflow rate). ....:.
Dewater To extract a portion of tha water present in a sludge or slurry.Diffused Air Aeration The process by which air is compressed and 4ischarged below
the mixed liquor surface through some type of air diffusion device.Diffuser A device (porous plate, tube, bag) used to break the air stream from a blower
system into fine bubbles in a liquid.Disinfection The process by which pathogenic (disease-causing) microorganisms
are killed. Chlorination is the most frequently used method in wastewatertreatment.
Dissolved Oxygen (DO) Molecular or -free" oxygen (02) dissolved in water or waste-water.
Dissolved Solids Very small, -nonsettling particles defined by the method of measure-ment (see Standard Methods).
Distributor A mechanical device used for spreading wiistswater over the surface of atrickling filter. A rotary distributor is usually usad.
D itch Oxidation A modification of the activated sludge process or the aerated pond,in which the mixture under treatment is circulated in an endless ditch and aerationand circulation are produced by a mechanical device.
D iurnal Flow Flow that Shows marked and regular variations through the course of aday.
0-3
367 , ,,..

Domestic Wastewater Wastewater derived principally from dwellings, businessbuildings, institutions and other non-industrial sources
DO See Dissolved OxygenDosing Ratio The maximum rate of wastewater application to a filter divided by the
average rate.Dry Suspended Solids The weight of the suspended matter in :iastewater or other
liquid after drying for 1 hr at 103' CEcology The branch of biology dealing with the relationships between organisms and
their environmentEffluent Wastewater or other ht, uid tics r.omg from a basin. treatment process, or treat-
ment plant.Enzymes Substances produced by living organisms that speed up chemical changesEndogenous Respiration Utilization internal cellular material as food under aerobic
conditions when an adequate external food supply is unavailableExcess Activated Sludge The quantity of activated sludge above that needed tor
process operation.Extended Aeration A modification of the activated -Judge process utilizing very long
aeration periods.FIM Ratio Food to microorganism ratio, the amount of tood (organic matter as BOO
or COD)available per unit mass of microorganisms.Facultative (1) A conditioo in which free or dissolved oxygen (02) is present only
in some places, (2) Able to functiOn both in the presence Or absence of freeoxygen.
Filamentous Bacteria Bacteria that grow in a thread or 'illmentous form.Filter Flooding The filling of a trickling litter to an elevation above the top Of the
medium by closing all outlets, in ordef to control nuisance Of filter flies.Floc Groups or clumps" of bacteria that have come together and formed a small
gelatinous mass. Found in aeration tanks and secondary clarifiersFlocculation An action resulting in the gathering of fine particles to form larger
particles.Grab Sample A single sample of wastewater taken all at one time trim one place.Head A term used in expressing the pressure or energy of fluids in terms of the height
of a verlcle column of water.Head Loss Energy lost, expressed in head. from flowing quids due to friction and
turbulenceHateroirophic A term describing organisms which use organics as the source of cell
carbonHigh-Rate Filter A trickling fitter operated at a high average daily dosing rate, usually
between 100 and 1000 godisq ft61ydrautic Detention Time The theoretical time required to displace the contents of a
tank or unit at a given discharge rate (volume of tank divided by discharge rate)Hydraulic Loading The volume of wastewater applied to a unit in a given time.Industrial Wastewater Wastewater in which wastes from industrial processes pre
dominate.Influent Wastewater or other liouid flowing into a reservoir, bas.l. treatment process.
Or treatment piano.,intermittent Filter A trickling litter dosed internistlently rath*e than COniiriu
OuSly

Keissener Brush A cylindrical metal brush used to maintain circulation and provideoxygen in the activated sludge process
Kinetic Data Recorded measurements used to determine rates of microorganismgrowth and substrate removal
Kraus Process A modification of the activated sludge process in which liquid fromanaerobic digesters is added to the aeration basins as a source of additionalnutrients.
Log Growth Phase The period of time when the mass of microorganisms is doublingat regular intervas
; sw-Rate Filter A trickling filter designed to be operated with a hydraulic load of 25to 100 gpclisq, ft. of fitter surface Alcto called standard-rate filter.
Mean Cell Residence Time Average period that a Cell is held in the activated sludgerocess; also known as solids retention time.
Mechanlca!Aeration A class of processes by which tne surface of an aeration tank ismechan.cally agitated to cause spray or wave resulting in aeration of the liquid.
Metabolism The lifeprocess in which food is utilized.Micronutrients Inorganic nutrients required in only trace amounts.Microorganism Very small organisms that can be seen ot.ly through a microscope.
Son,) microorganisms tis-6 thb wastes in wastewaterior food and thus remove oralter much of tne undesirable matter.
Mixed Liqour) The mixture of activated sludge ar 4 orastewater in an aeration tank.Mixed Liquor Suspended Solids (MLSS) Defined by testing method (see Standard
Methods). May be roughly defined as non-filterable solid particles in mixed liquor.Mixed Liquor Volatile Suspended Solids (MLVSS) Defined by testing method (see
Standards Methods) May _;:ie roughly defined as that part of the mixed liquorsuspende. solids that is combustible.
Motile Capable of movementNematode Unseiimented wormNew Growth Rate The rate of increaser the mass of live microorganisms calculated
by subtracting the death rate from The synthesis rateNitrifievion The biocherncial conversion of unoxidized nitrogen lamonia and organic
nitrogen) to oxidized nitreger.(.r. .ly nitrate)Nutrients Elements which are needee support living cells such as carbon, hydrogen,
oxygen, nitrogen, and phosphorusOreanio Matter High Energy carbon co pot ids, USUPIly from plant or animal sources,
but sometimes synthetic)dation A the, iical reaction. usually involving the addition of oxygen ano the
release of onergy0,cygen Uptake Rate The rate at ,,.itch oxygt is transferred to wastewater under
of itiOnOxygen Utilization The oxygen consumed to support aerobic biological treatment
processesParsnail Flume A device which measures the critical depth to determine flowPeak Load The rnaXif..tirr rate of flow to a wastewater treatment plant.pH An expression of the intensity of the alkaline or acidic strength of a water.Photosynthesis The use of ,enlight to obtain the energy necCisary to synthesize
new cell materialPin Flee Very fine Hoc particles with poor settling characteristicsPlain Sedimentation Sedimentation without the aid of chemicals
D-5
Plug Flow Reactor Idealized continuous flow reactor in which fluid particles aredischarged In the same order in wh, a they entered.
Pending The formation of pools or ponds of wastewater as a result of Surface Cloggingin trickling filters.
Preaeration A preparatory treatment of wastewater consisting of aeration to removegases, add oxygen. )romote flotation of grease, and aid coagulation.
Pretreatment The of racks, screens, communitors. and grit removal devices toremove metal. rocks, sand, eggshen, and similar materials Which may hinderthe operation of a treatment elsro.
Primary Treatment The first phase of wastewater treatment. Consisting of separatingthe readily settleable or floatable solids by sedimentation and skimming.
Protoplasm The matefia! of a living celiProtozoa Animalake microorganisms.Psychoda The generic name of filte flies.Raw Wastewater Wastewater before it receives any treatment.Reactor Any vessel in which a chemical. biochemical, or physiz;a1 reaction takes placeRecirculation The return of a portion of the wastewater which has already passed
through a trickling filter for a second passage.Respiration The process by which a cell takes up oxygen and gives off the Ca 'boil
dioxide formed el energy-prod sing reactions.Rising Sludge A problem in secondary settling tanks generally attributed to denotri-
the sludge bianket.Rotary Distributor A movable distributor made up of horizontal arms that extend to
the edge of the circular filter bed. reyu..ye about a central post, and distributeliquid over the bed through holes or jets in the arms.
Rotifer A smell, multicelled animal that gets its name from the rotating actors ofrows of cilia near its mouth.
Roughing Filter A trickling filter of relative'. coarse material operated al high rate toafford preliminary treatment.
Scum Collector A mechanical device for skimming and removing scum from thesurface of a settling tank.
Secondary Treatment Phase of vtAsievvater treatment in which dissolved or suspendedmaterial is converted into a form rr re readily separated Rom the wastewater
Sedimentat,on The process of settling suspended solids by gravity.Septic A condition produced by growth of anaerobic organism..Settleable Matter See Settleable Solids.Settleable Solids That matter to wastewater which will not stay in suspension during
a preselected settling period, either settling to the bottom or floating to the topSettled betewater Wastewater from which most of the settleable solids have been
re;aoved by SedimentationSewage Spent water of a community.Shock Load The arrival at a plant of a waste which is toxic to organisms in sufficient
quantity or strength to cause operating problems. Organic or hydraulic overloadscan also cause a shock load.
Side Water Depth (SWD) 'Re depth of mater measured along a vertical exterior wallSloughing The dropping or washing off of slime from trickling filtC.. media.Sludge 4 solids separated from liquids during processing.Sludge Age A measure of the length of time a particle of suspended solidS hak; been
undergoing aeration
D6
3;0

Sludge Blanket A layer of Sludge suspended within an enclosed body of wastewater,Such as a settling tank
Sludge Bulking Pool Settt ng due to low density Hoc in the activated sludge process.Sludge Digestion A proOesS by which organic matter to sludge is converted into a
more stable form by anaerobic or aerobic organismsSludge Density Index The reciprocal of the sludge volume index (SVI) multiplied by
100 (Le 1ISVI x 109)Sludge Volume Index The lab.) of the volume in milliliters of sludge Settled from a
1.000ml sample in 30 min to the concentration 'f mixed liquor in milligrams perliter multiplied by 1000
Solids Retention Time (SRT) The average residence time of suspended solids in abiological waste treatment system, equal to the total weight of suspended solidsin the system divided by the total weight of suspended solids leaving the systemper unit time.
Solids Loading The weigh( or mass of soi.ds applied to a treatment process per unittime.
Soluble Capable of dissolving readilyStabilization Conversion to a tOrm that reStsis change.Stage A process which is followed or preceded by a similar process.StandardRate Filter See LowRate Fitier.Step Aeration Same as step feedStep Feed Adding waJewater at points along the length of an aeration basin rather
than lust at the head endSupernatant Liquid removed from settled sludgeSubstrate The substance being used by microorganisms in suspension.Suspended Matter See Suspended Solids.Suspended Solids (SS) Defined oy testing method (see Standard Methods). but may
be roughly defined as ali non-dissolved solids that ta:,e a certain minimum timeto settle in still water
Synthesis The creation of new material from elementary building blocksTapered Aeration An aeration method whereby the quantity of air added varies along
the aeration basin ...JIM a maximum at the head end and a minimum at the outletend
Toxicity The ability of a waste to poison organismsTackling Filter A biological treatment prOcess in which the wastewater trickles
through a bed of Mime- covered media and is treated by the action of the micro.organisms in the slime layer
Trickling Filter Media ihe solid material in a trickling filter which provides a surfacefor a biological film of microorganisms Crushed stone is the most commonlyused media. but plastics are gaining popularity
Turbidity Cloudiness of wastewater due to suspended solidsVirus The smaliest form capable of proc. ,:nrig diseases in man or other higher
organismsVolatile Matter See Volatiie SolidsVolatile Solids Defined by testing method (see Standard Mel hoc!). but may be roughly
defined as combustible solidsWastewater The used ,.yater and solids that flow to a treatment plan(
07

Ale
IL
Zoogiaa A jelly-like coating developed by bacteria.Zeo teal Matrix The floc or slime formed by 200Qi031 bacteria.
(Definitions Vntipally from Glossary of Water and Wastewate, Engineering, APHA,ASCE, AWW, , and WPCF (1989); "Operation of Wastewater Treatment Plants," EPA(1970); Wastewater Engineering, Metcalf & Eddy (1972); Slotogy of Microorganisms,Brock (1974).)
D8

4
METRIC SYSTEM REFERENCEIw(4C POI NO(( WIC WIRIC notliS 040 TU.. AC! TOWS '40401 lfV,11.. CO$4: 401,... W., AI oitt
%0 11TSit N.c(m )j, 0:1.4iTo To..t WPC N7CM IS %(11 r.3 '112 r7..1t '071.e.Ult:PLE )1 ,04010% Of 'A( kftIC 001 .;OtrIsEN
9.411K&Iti.PL'.e
rIC, k
IC)
1 10
COVEPSI fA(TOR$
/
14,1, 0Ant. r
1111 1,
WAISH .0/ 501901
,e
5,... it
c7 ftev it.., ,t.).,f, ftiltrJ ,C,
is
.t.
ifl)0'11 II'h;r31,14 I.'J1h ... n,
.t 1,,.,
r1 -01
-0CO.40;.,8, itS1 'h
S.
'
-
t
(W.54.. TO1;(11(
.0.11.Trcll 6
4046 )
12,1 54 47$1:16 327 40
r. il0 ?Olt0 OSA1 7..
C. .02.85,', 030711
r. 46%C!C I-02,, V.0It )?It ".
il $112
57., ;)7c
1 C:3'If 71
.1 es:C .)7. ,
; :ti.i
Air i
k(tPIC TO(WISI,
woilt,.; L14Ef,P. ...,t
--
$004:
410.4404.4fetCm i.: ff.rC*Ic fiO. .
..bfc 1.0.1;41').Gvos.! 144110,1Cv*IC y.'4flitprior14110.14,10. to. 14. ifi f,,c,
1.410A oor If...t;*
)4 106 vOr otrvto/42 10 41P/wr/00...041 I I ,:,(.1 WI ft, v
40,02;04y R toc f4.t00.10/11110, Oil^.wi11$06 gi11:eAtIT1*, 9411445,13,,o s.0., gal,74f,0"
07f6s/f0t1( fo.i,f31,6444, ''''401:0,5.,4441r. "C',Avv feis0,aeo I'et
----0 090:4,11A :)0P*107
):. )1S0 .11,4100 ViC:.).,.If 47
t 1401 ) '
J '.,q
7:4 7
'il :610 l,
1 V)2 205A Of241C 3(24)0 )10C OCC.f1175 04;f4Z77 A)) A(2404 !OSA
)4 4;1(,
G :61A1
-- --itlear -O.,ty,:ic ....,s
CIA,. .otf,s1 s tf, f
, ##### ic.t,i. -., -c.,Ifit ..4.1,/.1 ri, ,
it401., ..trt.4.ttrs11,4,iCOI' ,(4,C.A., .Q1....8, ".'t.., .' ;Is111V, 90.. 14C', ,
TItOtS/$4 'rt., t, .,:.iloi,o's
rt.S,,hI. -0,.,k$10904.&,... ..t1,, .... I.,
4.1"1:cytle -4,...('4 ......1(,t, ..f,..,74.,fAI, ..1,778.,ff,11.11,1r.i.t,c.0 r ".'..rT10jf3.1.1.1.JA, ", ,
kyteg.1os,,c..1., *,,-,..,Saw, .ijertkor, ,.111, vv t vv
- ---,W-.10:I ,
1 .'..3/11V=
-3,
.' .1A-4._........1,,
1,, csq0. -3
..
WO-1
,:::.'4114,), ,
1...:
PFM1VIDED W:51ERITER oF EmESS104
000; 0.104 t6.0_!!. ;N: mtv,,e .%
it04 ith's 1?, . t,..etil$0, -2 :008 ,,of j,4,,j,,, ;,, ..,,,to lltrs 0f $40.,4
K0.4,11, koi0Irs )4I11.5 plo. 4s t.f 1,, .t,..0 , t ...Of. K.P.II t ..Jt. ..... % pos 1,, ....
0,7..: 1.,11t1 COA'',... 0, - 35 . .. St: . t*.1 C, I, C.' ,S tit" I &I lo)ftly$ Of 690 ,.. '
_.A1( O.., ,0 .01,. ...tw nt W.,.
or lnd, , , In. - ,.., $ .1., .., 1 . .... ... .I I a ' I I 4 .. I : . 1 1 , A O
I c,01; etOr, SOrr)I (At; it ltf
...II I.,, ,.4t !. 1.,:'1.0 ,,"li '. .s,Jr!.. I ., r'.'. r,f, me ei6,o,
trit,er i
--e. --..
,O..r. s ,1,. I' .,r 17.8 lt F.6,,,s. .1 t
0 I
,,r7,,.- or...1 .,,e. . 4 t T. r... . f,'I I ,. $
, .1
t..$, -,. , ;..,I, 'cp.
..., .:l: el 0.1, )2, (o, r.( C
, ,,,e e., .J., :...... 41 .1 :.
_et t. ..e re, : ,J 010i j ,,t4, c, ,,rd t
Cr"- fH 51 V. .4 0,91r ...... trA4r,1 ,r. ef t., ! ..'trOAt.
41. c Jblr r,
,,..,.c. ,rte
r,t4. Ker .1e,.. ;.$ tot ri
C,L. .
Its.t .S L` kV.) N 1 51