dividend policy of australian mcs and dcsuwa.edu.au/.../0016/31804/akhtarshumi_phdconf2007.pdf ·...
TRANSCRIPT

DIVIDEND POLICY DETERMINANTS OF AUSTRALIAN MCS AND DCS
Shumi Akhtar*
School of Finance and Applied Statistics
College of Business and Economics
Australian National University
Phone: (61) 2 61254723
Fax: (61) 2 6125 0087
* The author would like to express a very special gratitude to Prof. Tom Smith for his excellent supervision. I also wish to thank Dr Barry Oliver and Professor Michael Martin for their splendid advice. All errors and omissions are my own.
1
PREFACE
Title of Thesis: A STUDY OF CAPITAL STRUCTURE AND DIVIDEND POLICY DETERMINANTS IN MULTINATIONAL AND DOMESTIC CORPORATIONS – A CROSS-COUNTRY COMPARISON
Supervisor: Professor Tom Smith
This thesis uses a unique data set to assess whether the dynamics of financial structure can be captured
through the specification and estimation of capital structure and dividend payout models for domestic
corporations (DCs) and multinational corporations (MCs) across countries with different
characteristics. Therefore, this study attempts to provide a comparative and comprehensive
understanding of the capital structure and dividend policy determinants at both the micro (single
country) and macro (multiple country) levels for 6038 DCs and 5918 MCs across Australia, the United
States (U.S.), the United Kingdom (U.K.), Japan and Malaysia over the 1995 to 2004 period. These
countries are characterised by different financial, taxation and legal systems which may have an
impact on capital structure and dividend payment determinants. Both cross-sectional and time-
variation in capital structure and dividend policy are explored. This thesis includes four empirical
essays. Essay I is focused on capital structure determinants for DCs and MCs in Australia. Essay II
expands this to a multi-country comparison of capital structure determinants for DCs and MCs. Essay
III is centered on dividend policy determinants for DCs and MCs in Australia while Essay IV expands
this analysis to a comparison of dividend policy determinants for DCs and MCs in multiple countries.
Lintner’s (1956) speed of adjustment costs for capital structure and dividend payout ratios over time is
also tested for DCs and MCs across countries. Finally, results of sensitivity of different definitions of
dependent variables and interdependent (endogeneous) relationship between long-term debt and
dividend policy is presented.
The thesis is structured as follows::
Introduction Data The Dynamics of Australian MCs and DCs Capital Structure Determinants Capital Structure of MCs and DCs – An International Comparison Dividend Policy of Australian MCs and DCs Dividend Policy of MCs and DCs – An International Comparison Sensitivity Summary and Conclusion
This paper is based on Chapter 5
2
ABSTRACT This paper investigates the determinants of dividend policy for Australian DCs and MCs. In
considering dividend payout ratios we adopt two definitions – cash dividends and total dividends. The
cash dividend payout ratios consists of cash dividends to net earnings while total dividend payout
ratios consists of both cash dividends and share repurchases to net earnings. The determinants of
foreign exchange, tax clientele and financial slack are significant in explaining the difference of total
dividend payout ratios between Australian DCs and MCs. Diversification, profitability, firm-specific
risk, size, collateral value of assets and financial slack are the significant variables in explaining the
difference in cash dividend payout ratios between Australian DCs and MCs. These results remain
unaffected irrespective of controlling for industry and time effects.
3
1. INTRODUCTION Theoretically, it is often argued that international diversification of earnings should enable
multinational corporations (MCs) to maintain higher dividend payouts than domestic corporations
(Hines, 1996). Corporations use cash dividends and share repurchases as the two main methods to
distribute cash to shareholders. While each method has received considerable attention in the
academic literature, fewer studies have examined the determinants of cash dividends and share
repurchases within the multinational corporations framework. In particular, little is known about what
factors determine the choice between cash dividends and cash dividends and share repurchases across
MCs and DCs and what, if any, information investors infer from these decisions.
Factors that have been identified as determinants of dividend policy could differ substantially in both
domestic and multinational corporations. In a world where there is uniform taxation, fixed and stable
exchange rates, perfect capital markets, and no barriers to the transfer of capital, then the financial
decision for MCs should be the same as those for DCs. In such a situation, funds would be raised and
distributed by the cheapest sources and flow to wherever they are needed. Such a world does not exist
in practice. Given MCs operate in more than one country, financial manager of MCs’ should be aware
of the impact of different tax structure, legal structure, changing exchange rates, barriers to capital
inflows and segmented capital markets on dividend payments (Vinso, 1982). Thus the MCs’ manager
should be concerned about the availability of profit and factors that influence the distribution of profit
as a dividend to the shareholders.
Secondly, managers express a strong desire to avoid dividends cuts, except in extraordinary
circumstances. However, beyond maintaining the level of dividends per share, payout policy is a
second-order concern; that is, increases in dividends are considered only after investment and liquidity
needs are met (Brav et al., 2005). In contrast to Lintner (1956), they find that the target payout ratios
is no longer the preeminent decision variable affecting payout decisions because of the recent
development of share repurchase types of dividend payments across corporations and their growing
importance over the last two decades. Given the dividend payout ratios have become a growing
concern in the last decades, especially in the U.S., and given Australia closely follows U.S. in many
aspect of financial markets and no research has been conducted in Australia, it demands an
investigation to test the determining factors for both cash and cash and share repurchase in Australia.
Share repurchases were virtually nonexistent when Lintner (1956) and Modigliani and Miller’s (1961)
conducted their research, so it is not surprising that these authors ignore repurchases. Consistent with
Modigliani and Miller’s irrelevance theorem, and in contrast to decisions about preserving the level of
the dividend, Brav et al. (2005) find that managers make repurchases decisions after investment
decisions. Many executives view share repurchases as being more flexible than dividends, and they
use this flexibility in an attempt to time the market by accelerating repurchases when they believe their
4
stock price is low. Companies are likely to repurchase when good investments are hard to find, when
their stock’s float is adequate, and when they wish to offset option dilution.
While some evidence exists that share repurchases are used to reduce excess cash holdings (consistent
with Jensen’s (1986) free cash flow hypothesis), Brav et al. (2005) do not find evidence that managers
use payout policy to attract a particular investor clientele that could monitor their actions (Allen et al.
2000). Executives believe that dividends are attractive to individual investors but that cash dividends
and share repurchases are equally attractive to institutions. In general, most executives say that they
do not use payout policy as a tool in an attempt to alter the proportion of institutions among other
investors.
We could argue that if we just look at the sources and uses of funds identity, share repurchases and
cash dividends should be a substitute payout method, holding all other things constant. However,
firms can always adjust their sources of funds, and therefore it is possible that dividends and share
repurchases are determined independently. For example it is possible that dividends are determined
together with investment, as Miller and Rock (1985) suggest, and that repurchases are determined
independently. In summary, current theories do not provide a unique prediction on what the relation
should be between dividends and share repurchases and therefore the determinants. It is clear that the
question of the extent to which dividends and repurchases are substitute and their determinants and
multinationality in Australia are the central issues, which have important implications for many of the
existing theories.
The above discussion provides us an inspiration to investigate the determinants of cash dividends and
share repurchase within the frame work of DCs and MCs as this issue has never been considered
before. The above issues will be addressed by considering the factors that determine both cash
dividends (a narrow definition of dividend) and cash and share repurchase (a broader definition of
dividend) for MCs and DCs which includes firm-specific and international factors.
This paper investigates the above issues in a sample of Australian multinational and domestic
corporations by incorporating the suggested determinants in the prior dividend policy literature and
multinational theory. In considering dividend payout ratios we adopt two definitions – cash dividends
and total dividends. The cash dividend payout ratios consists of cash dividends to net earnings while
total dividend payout ratios consists of both cash dividends and share repurchases to net earnings. The
determining factors found to be important for DCs are diversification, stock return, tax clientele, cash
flow variation, profitability, company-specific risks, firm size and financial slack. The determining
factors to explain MCs’ dividend payout ratios are tax clientele, profitability, collateral value of assets
and leverage. Further, the common factors that explain the difference between DCs’ and MCs’
dividend payout ratios vary between cash dividend payments and cash and share repurchase payments.
5
In explaining cash dividend payout ratios, diversification, profitability, firm-specific risk, size,
collateral value of assets and financial risks are the explanatory factors, while for tax clientele, cash
flow variability and financial slack explain the difference of cash and share repurchase payout ratios
between DCs. Industry and time factors are considered and are found that the only industry that has
any significant relationship with dividend payout ratios is the transportation and communication
industry, while time effects show that on average dividend payout for Australia decreased over time.
The rest of the paper proceeds as follows: section 2 describes the sample and presents summary
statistics. Section 3 explains the theories of dividend payout. Section 4 discusses industry and time
issues affecting dividend payout ratio. Section 5 presents data and models descriptions. Section 6
discusses the findings of the regression results and the last section 7 concludes the chapter.
2. IMPORTANCE OF MULTINATIONALITY AND DIVIDEND PAYOUTS
To identify the determinants of capital structure for DCs and MCs it is necessary to categorise
corporations as either DCs or MCs. This can be achieved by considering what constitutes a
multinational corporation. The remainder can then be regarded as domestic corporations. Several
criteria have been suggested in the literature to define MCs, including foreign sales ratio (Geyikdagi,
1981; Errunza & Senbet, 1984; Fatemi, 1984, 1988; Kim & Lyn, 1986; Shaked, 1986), foreign tax
ratio (Lee & Kwok, 1988) and the number of countries in which the firm operates through subsidiaries
(Errunza & Senbet, 1984; Kim & Lyn, 1986; Michel & Shaked, 1986; Shaked, 1986). Burgman
(1996) and Chkir and Cosset (2001) use the foreign tax ratio to classify firms as MCs. The foreign
sales ratio has been popular but it does not differentiate between firms that earn income through export
or firms that generate foreign source income through subsidiary operations. Thus, in this thesis MCs
are corporations that have at least one subsidiary in another country (other than the domicile country)
in which a firm operates and earn income (Tallman & Li, 1996). Domestic corporations, being the
remainder.
2.1 Uniqueness of Operational Activities Holding all other things constant, MCs’ operational risks are deemed to be different from DCs’ as they
operate in an international environment. One can argue that foreign exchange risk and political risk of
the MCs’ subsidiaries may lead the total business risk to be higher (Burgman, 1996). For example,
MCs are exposed to additional risk including political risk and foreign exchange risk, which would not
exist in a domestic market (Bae and Noh, 2001). Monitoring, bonding and auditing costs are agency-
related and are higher for MCs because of the diversity of geographical locations, cultural differences,
higher auditing costs, differing legal systems, and language differences. Additionally, these national
6
differences increase the complexity of such standard tasks as generating multi-country financial
statements, hiring multi-country auditors and/or multiple auditors, and completing consolidated
balance and income statements (Burgman, 1996; Reeb, Sattar & Allee, 1998) and there are
complexities of their operations as compared to DCs. According to Wright, Madura and Wiant
(1997), these costs are due to the distance and the difference in the corporate and national culture
between the parent and the subsidiaries as well as the difference in the level of economic development
between the parent and the subsidiary host countries. Hence, these characteristics of MCs may limit
the amount of dividend that MCs can pay out to shareholders. On the other hand, Michel and Shaked
(1986) evaluate the differences in financial characteristics and performance between MCs and DCs.
Their results show that while DCs have superior risk-adjusted, market-based performance to MCs,
MCs are more capitalized and less riskier than DCs; the average standard deviation of stock returns
and the average systematic risk (beta) of DCs are significantly higher than those of MCs. Hines
(1996) argues that in the 1980s U.S. corporations paid dividends at very high rates out of their after-
tax profits, and that an unusually high fraction of those profits came from foreign profits (non-U.S.)
sources. Further, Hines (1996) argued that multinationals pay higher dividends than domestic
counterparts and their findings suggest MCs pays three times higher than DCs. So, the risk and the
benefit of diversification may have more of an impact on MCs’ dividend policy than their domestic
counterparts.
2.2 Different Tax Regime MCs operate in multiple countries which means its income is earned in different types of tax
environment. For example, imputation tax system encourages companies to pay more dividends to the
shareholders since it is less taxable than the capital gains. As for MCs, if they are paying higher tax
for their earnings in overseas countries then paying dividends out of profit might be costly. Therefore,
MCs will pay fewer dividends. However, alternatively, it can also be argued that if subsidiaries pay
less tax from the profit they make overseas which makes them better able to pay dividends, an MC
will have a higher dividend policy.
2.3 Easier Capital Market Access MCs are relatively in a better position to get access to international capital markets to raise debt than
the DCs due to their international operation. This means that in a bad economic year in the home
country, MCs can borrow money overseas at a favourable rate to maintain the dividend policy with the
shareholders, which indicates MCs should have higher dividends than DCs (Hines Jr., 1996).
7
3. THE DETERMINANTS OF DIVIDEND POLICY For nearly four decades, researchers have been grappling with the “dividend puzzle” to understand the
determinants of dividend policy. Most studies focus on U.S. firms. We expand the investigation by
studying dividend policy for Australia where the taxation system is so different from the U.S. and also
the advancement of the capital market and the economy advancement are comparatively different. We
measure the relationship between dividend payouts and 18 different international and firm-specific
variables. We also investigate industry and timing differences.
3.1 Multinationality Michael and Shaked (1986) evaluate the differences in financial characteristics and performance
between MCs and DCs. Hines (1996) argues that in the 1980s U.S. corporations paid dividends at
very high rates out of their after-tax profits, and that an unusually high fraction of those profits came
from foreign profits (non-U.S.) sources. Multinationality of a firm is comprised of multiple aspects of
risks and benefits in operating multiple countries. There is no universal measurement to capture all
these international risks and benefits for MCs and their impact on dividend payout ratios. Therefore
this chapter will use a dichotomous variable to confine the impact of multinationality on dividend
payout ratios.
3.2 Diversification The diverse operations in different countries often assist MCs to minimise operational cash flow risks
and all other financial risks due to imperfections that exist across countries around the world.
Therefore, intuitively, MCs should have relatively higher diversification benefits than DCs and
therefore it should enable MCs to pay higher dividend payouts relative to DCs Hines (1996).
Diversification in this context indicates the breadth of firms operation in international environment.
While diversification enables MCs to pay higher dividend payouts, in contrast, MCs are exposed to
additional risk including political risk and foreign exchange risk, which would not impact on a
domestic market to that extent (Bae and Noh, 2001). These characteristics of multinationals may limit
the amount of dividend that MCs can pay out to shareholders.
3.3 Foreign Exchange Risk MCs and DCs that are exposed to foreign exchange risk which will affect the demand and supply of
the firm’s products and prices and costs for the firm (Adler & Dumas, 1984). The more sensitive the
MCs are to foreign exchange rate fluctuations, the greater the chance of price fluctuations, which
ultimately shocks the profit level figures and cash flows from which dividends usually get distributed.
8

The greater the fluctuations of cash flows, the more the expected cost of bankruptcy risk increases and
consequently leads to generating less profit and therefore the lower the dividend payment to its
shareholders.
3.4 Political Risk Jodice (1985) suggest that political risk can be defined as changes in the operating conditions of a firm
that arise out of a political process, either through war, insurrection, or political violence, or through
changes in government policies that affect the behaviour of firms and their financial decisions.
Political risk can be conceptualised as events in the national and international environments that can
affect the profit level, physical assets, personnel, and operations of firms. Such adverse effects often
take place through constraints on the way in which the MCs operate in foreign countries.
Kim and Mei (1994) suggest that political risk has a significant impact on firms profitability. Market
volatility increases during political election and transition periods. Bailey and Chung (1995) also
document that political risk can have a significant effect on firms profit level and profit distribution to
its shareholders. This means that firms with significant foreign financing, foreign suppliers or
customers, or other international transactions or assets are relatively exposed to adverse changes in
currency controls, capital flow barriers and other laws and regulations that constitute political risk.
Depending on firms earnings exposure to political risks in the domicile country and foreign countries,
it wil affect firms dividend payments.
3.5 Agency Costs The principal agent problem is that managers may pursue their own goals at the cost of obtaining
lower profits for the owners (stockholders). Consequently, agency costs are incurred by shareholders
to insure that the manager acts in the best interests of shareholders who are not actively involved in the
management of the firm (Jensen & Meckling, 1976, 1986; Fama, 1980; Crutchley & Hansen, 1989).
There are many ways of reducing agency costs. Dividend payments serve as one means of monitoring
or bonding management performance. Greater dividend payments to shareholders may force the firm
both to raise capital by selling new shares and to go to the capital market more frequently. Agency
costs are reduced as a result of the increased scrutiny the capital market places on the firm
(Easterbrook, 1984; Jensen, 1986).
Rozeff (1982) attempt to finds an empirical relationship between agency costs and dividend policy and
the findings suggests that: i) if a firm has a high percentage of insider stock ownership, it will pay a
small dividend (a lower dividend payout ratio) to reduce agency costs; and ii) if a firm has a greater
9
number of shareholders, it will pay high dividends (a higher payout ratio) to reduce agency costs.
Further, it is also argued that an optimal dividend policy may exist even after tax considerations are
ignored. According to this argument, increased equitable dividend payments reduce the volume of
funds over which management has discretionary control; thus the costs of agency are reduced, but the
transaction costs of external financing increase. Therefore, there is an optimal dividend payout which
minimises the sum of these opposing costs. Lloyd, Jahera and Page (1986), Dempsey and Laber
(1992), Schooley and Barney (1994), Hansen et al. (1994), Rao and White (1994), Moh’d et al.
(1995), and Holder et al. (1998) support Rozeff’s (1982) original findings.
As Jensen and Meckling (1976) suggest, managers can allocate resources to activities that benefit
them privately, but that are not in shareholders’ best interest. Easterbrook (1984) views dividend
payments as a potential solution to agency conflicts. Dividend payments force managers to raise funds
in the external financial markets and thus subject managers to scrutiny by outside professionals such
as investment bankers, lawyers, and public accountants. Recognising the monitoring value of external
financial markets, shareholders will insist that managers pay dividends. Also, Jensen (1986) points
out that managers have incentive to grow their firms beyond optimal size as growth increases
managers’ power by increasing the resources under their control. Dividend payouts can be used to
reduce discretionary cash under managers’ control that could be wasted in negative NPV projects.
3.6 Free Cash Flows Prudent managers working in the shareholders’ best interests should invest in all profitable
opportunities. Management and owner separation affords corporate managers the temptation,
however, to consume or otherwise waste surplus funds. The inefficient use of funds in excess of
profitable investment opportunities by management was first recognised by Berle and Means (1932).
Jensen’s (1986) free cash flow hypothesis updated this assertion, combining market information
asymmetries with agency theory. The funds remaining after financing all positive net present value
projects cause conflicts of interest between managers and shareholders. Dividend and debt interest
payments decrease the free cash flow available to managers to invest in marginal net present value
projects and managers’ perquisite consumption (Myers, 1987, 1990).
3.7 Past and Future Growth In general, the growth of a firm depends on: (i) the amount of resources retained and reinvested in the
firm; and (ii) the rate of return that is earned on the retained resources. If a firm were experiencing
substantial success and rapid growth, the firm would require large additions of capital. Therefore,
10
growth firms may expect to pursue a low dividend payout policy since investments and dividends are
linked through the firm’s cash-flow identity.1
Many studies have suggested a negative relationship between the growth (investment) opportunities of
a firm and its dividends. For example, Rozeff (1982) and Schooley and Barney (1994) find that
dividend payout ratio is negatively related to both past growth revenues and predicted growth revenues
of the firm. It is found that higher growth rates in past and future revenues require more funds to
sustain growth; thus firms with more growth opportunities pay lower dividends in order to finance
further growth.
Using industry-level data, Smith and Watts (1992) also discover that various measures of growth
opportunities are negatively related to corporate dividend policy. Meanwhile, Gaver and Gaver
(1993), using firm-level data, find an inverse relationship between investment (growth) opportunity
and dividend policy. Using firm-level data in the U.K., Adedeji (1998) observes a negative interaction
between dividend payout and investment. La Porta et al. (2000), using firm-level data from 33
countries, also find that high-growth firms make lower dividend payouts than low-growth firms.
Using the over-investment argument, Jensen (1986) argues that if a firm has more growth options than
other firms, it will have lower free cash flow and will pay lower dividends.2 Consistent with the
overinvestment argument, Lang and Litzenberger (1989), Howe et al. (1992), and Denis et al. (1994),
using Tobin’s Q as an indicator of a firm’s growth (investment) opportunities, find a negative
relationship between Tobin’s Q and dividend payment. Thus, their result is consistent with the
findings of previous studies, which report a negative relationship between growth opportunities and
dividends.
Firms with many good investment opportunities have high cash needs, which may lead them to payout
a low fraction of earnings to shareholders as dividends. If this is the case, a negative relationship is
expected between investment opportunities and payouts. Alternatively, some others argue that the
relationship between investment opportunities and dividend is in fact positive (Brav et al., 2005).
Survey evidence suggests that firms are highly reluctant to cut dividends, and increase dividends only
when sustainable higher earnings are expected (Lintner, 1956; Brav et al., 2005). This argument
suggests that only firms with a variety of good investment projects pay high dividends today because
the cash flows earned from future projects support high dividends in the future. Given these two
conflicting hypotheses on the relation between investment opportunities and dividend payments, it is
left to empirical tests to determine which is indeed the more accurate. 1 In general, the greater the amount of investment during the period, the smaller the dividend or the greater the new equity issued. 2 According to Jensen’s (1986) argument (or over-investment hypothesis), a dividend increase by a firm with free cash flow problems will reduce the extent of over-investment, and will increase the market value of the firm. Similarly, a dividend decrease by such a firm will have the opposite result.
11

3.8 Stock Return In the prior literature it has been documented that higher stock returns are associated with higher
dividends, independently of whether income is taxed more or less heavily than capital gains
(Litzenberger & Ramaswamy, 1979, 1982; Bajaj & Vijhs, 1990; Morgan & Thomas, 1998). Recently,
this evidence is further documented by McManus, Gwilym & Thomas (2004). Lamont (1998) finds
that stock return has a significant positive relationship with dividend payout ratios. We follow the
Black and Scholes (1974) approach where they stated the effect in terms of the price of the company’s
shares, or in terms of the expected return on the company’s shares, where return is defined as both
capital gains and dividends. For example, if we believe that increasing a company’s dividend will
increase the price of its shares, then we can say this in either of two ways either increasing the
dividend will increase the price of a company’s shares or increasing the dividend will reduce the
expected return on a company’s shares. From MCs’ point of view it remains an empirical question as
to how stock return explains the dividend payout ratios for MCs.
3.9 Average Tax Rate Australia operates under an imputation tax system, where dividends may have franking credits
attached to them that allow shareholders to claim the tax paid at the company level as a credit against
their personal income tax liability. The system effectively removes the double taxation of dividend
income that occurs under the classical tax system. Companies engaging in off-market (sometimes
referred to as equal access) repurchase programs in Australia have generally sought a ruling from the
Tax Commissioner, the result of which has been that a proportion of the buyback price can be
designated as a fully-franked dividend, and the remainder is defined as a capital amount. This
structure may have tax advantages for shareholders such that they are willing to sell shares back to the
company at a price that is below the market price; shareholders gain from the imputation credits
attaching to the dividend component of the buyback and may also gain from capital gains tax credits.
It is an empirical question to see the impact of imputation tax on the dividend policy for Australian
MCs and DCs.
3.10 Tax Clientele
The tax clientele argument postulates that investors in low tax brackets prefer high dividend- paying
stocks when compared to investors in high tax brackets. (Brennan, 1970; ; Elton & Gruber, 1970;
Long, 1978; Litzenberger & Ramaswamy, 1979; DeAngelo & Masulis, 1980; among others). Early
investigations of the tax clientele effect were indirect tests of the tax clientele argument and have been
criticised by Miller and Scholes (1982) because of their extreme sensitivity to the definition of
dividends.
12

Most recent studies have documented that clienteles may not depend on taxes alone. While
Chaplinsky and Seyhun (1990) find that tax-deferred and tax-exempt dividend recipients accounted for
half of all dividends in 1979, significant dividends were still subject to taxes. Sterk and Vandenberg
(1990) find a preference for cash dividends despite the elimination of different tax rates between
capital gains and dividend income in 1986. DeAngelo (1991) argues that an equilibrium consistent
with dividend payout may exist even in the presence of tax systems that favour capital gains. Brennan
and Thakor (1990) also present an equilibrium model where dividends exist for small distributions
despite the preferential tax treatment of capital gains. In this paper, the clientele effect is tested
differently by incorporating the tax status of the firm’s major stockholders. Institutional investors are
either tax-exempt, can defer taxes on dividend received, or pay taxes on the dividends received from
another corporation. Consequently, if the tax clientele argument is valid, a positive relationship is
expected between institution holdings, and dividend payout ratio.
There is no theory that has been developed in regards to how MCs should respond to the tax clientele
effect but it may be argued that since MCs operate in more than one tax regime, depending on the
exploitation of tax advantage a positive sign will indicate that MCs’ investors are better off than DCs’
investors in maximising the tax advantage, and therefore would prefer high dividends.
3.11 Volatility of Cash Flows
Firms facing high levels of cash-flow uncertainty are likely to pay low dividends, fearing cash
shortfalls in the future. In order to fund profitable future investment projects, firms with high cash-
flow uncertainty will choose to hoard cash today by keeping dividends payments low. Moreover,
firms with unstable cash flows may have to resort to external financing more often. In general,
external funds are more expensive than internal funds, but this is yet truer for firms with high cash-
flow uncertainty; these firms generally have low credit ratings, a result of a volatile cash-flow streams,
and thus must pay premium interest to raise money. Firms with high cash-flow uncertainty will thus
pay lower dividends because of their greater need to rely on internal funds (Pettit, 1972; Asquith &
Mullins, 1983; Miller & Rock, 1985). Based on this discussion, it is expected that dividend payouts
will be negatively related to cash-flow volatility. This argument echoes survey evidence by Brav et al.
(2005). They report that more than two-thirds of chief financial officers of dividend-paying firms say
that the stability of future cash flows is an important factor affecting dividend decisions.
3.12 Profitability
Fama and French (2001) document that the probability that a firm pays dividends is positively related
to profitability and size and negatively related to growth. The intuition is that higher profitability and
greater size imply a greater capacity to distribute cash, whereas greater growth indicates superior
13

investment opportunities, thus a stronger incentive to retain cash. More profitable firms are expected
to hold less debt, since it is easier and more cost effective to finance internally and consequently pay
higher dividends. MCs have better opportunities than DCs to earn more profit mainly due to having
access to more than one source of earnings and better chances to have favorable business conditions in
particular countries (Kogut, 1985; Barlett & Ghoshal, 1989). Consequently, MCs being more
profitable than DCs are expected to have higher dividend payout than DCs after controlling for the
other variables.
3.13 Firm-specific Risk
It is often argued that a firm with more systematic risk (beta)3 tends to adopt a policy of setting a
relatively low payout ratio. Consistent with this argument, Rozeff (1982), Lloyd (1985), Bajaj and
Vijh (1990), Schooley and Barney (1994), Dyl and Weigand (1998) and others discover an inverse
relationship between dividend and security beta.
For example, Rozeff (1982) argues that, since higher beta is a reflection of the presence of higher
operating and financial leverage, a firm will tend to pay lower dividend when it has a higher beta
coefficient. Bajaj and Vijh (1990) argue that dividend increases are associated with increases in stock
return because the percentage change in a stock price is typically much smaller than the percentage
change in its dividend. Thus, the authors expect and find a decrease (increase) in security beta after a
dividend increase (decrease). Dyl and Weigand (1998) also find that both the total risk and the
systematic risk of a sample of dividend-initiating firms are significantly lower the year following the
announcement of dividend payments. The decrease in total risk is more pronounced especially for the
large firms, and the decrease in beta is more pronounced for the smaller firms.
Similar to the systematic risk, Beaver et al. (1970), Michael and Shaked (1986), Bar-Yosef and
Huffman (1988), Glen et al. (1995), and others argue that the uncertainty of a firm’s earnings may lead
it to pay lower dividends because the existence of large fluctuations in earnings materially increase the
risk of default. Further, if firm’s follow a policy of dividend stabilization, firms with greater volatility
in earnings will set a low payout ratio, which can be maintained even in the face of a relatively serious
or prolonged decline in earnings.
3 A firm’s security beta represents its level of systematic risk.
14
3.14 Size
Research by Lloyd, Jahera and Page (1985) and Vogt (1994) indicates that firm size plays a role in
explaining the dividend payout ratio of firms. They find that larger firms tend to be more mature and
thus have easier access to the capital markets, which reduces their dependence on internally-generated
funding and allows for higher dividend payout ratios. It is argued that firms that are large have greater
access to capital markets and they can easily able to switch between debt and equity and take
advantage of lower transaction costs, which allows for more stable and possibly higher dividend
payments of the firm. Hence a positive relationship is expected between the size and dividend payout
ratio (Ali, Khan & Ramirez, 1993).
3.15 Collateral Value of Assets
Shareholders may expropriate wealth from bondholders by paying themselves dividends. Bondholders
try to contain this problem through restrictions on dividend payments in the bond agreement.
However, fewer restrictions are placed on the firm if debt can be collateralised as the borrower is
restricted to use the funds on specific projects. Hence, a positive relationship is expected between
dividend and dividend payout ratios.
3.16 Firm Maturity
Dividends tend to be paid by mature, established firms, plausibly reflecting a financial lifecycle in
which young firms face relatively abundant investment opportunities with limited resources so that
retention dominates distribution, whereas mature firms are better candidates to pay dividends because
they have higher profitability and fewer attractive investment opportunities. Fama and French (2001),
Grullon et. al (2002), and DeAngelo and DeAngelo (2006) all advance lifecycle explanations for
dividends that rely, implicitly, on the trade-off between the advantages (e.g. flotation cost savings) and
the costs of retention (e.g. agency costs of free cash flow). The trade-off between retention and
distribution evolves over time as profits accumulate and investment opportunities decline, so that
paying dividends becomes increasingly desirable as firms mature. The literature offers only a rough
empirical idea of the characteristics that differentiate firms that pay dividends from those that do not.
Most notably, Fama and French (2001) find that firms with current high profitability and low growth
rates tend to pay dividends, while low profit/high growth firms tend to retain any profits.
3.17 Long-term Debt
There are two alternative hypotheses that predict no abnormal dividend payments after debt issue.
First, the debt covenant hypothesis predicts that firms will decrease or not increase dividends after
15
debt issues. Kalay (1982) shows that debt contracts restrict dividend payments directly and indirectly.
It is found that the stockholders of leveraged firms choose to pay dividends under debt contracts.
Consistent with the debt covenant hypothesis, DeAngelo and DeAngelo (1990), Jensen et al. (1992),
and Long et al. (1994) find an inverse relationship between dividends and debts. However, Denis
(1990), Gupta and Rosenthal (1991), Smith and Watts (1992), Mougoue and Mukherjee (1994), and
Adedeji (1998) find positive relationship between the leverages of a firm and its dividends.
The second hypothesis, the reputation hypothesis, also predicts no abnormal dividend payments after
debt issues. On the basis of asymmetric information between the insiders of the firm and the outsider
debt-holders, John and Nachman (1985) develop a model which shows the importance of reputation in
controlling costs. They suggest that firms are willing to maintain their reputation for the following
reasons: (i) although a firm may attempt to transfer wealth from shareholders to bondholders, this can
occur only in one period, not in a multi-period world; (ii) the higher-rated debt (bonds of reputable
firms) carry less restrictive constraints in the bond covenants on maximum payouts or minimum
investment than those of lower-rated debt. Handjinicolaou and Kalay (1984) examine the reputation
hypothesis, and find no evidence of wealth redistribution from bondholders to stockholders, but do
find evidence in favour of the reputation argument.
Long et al. (1994) test both the debt covenant and reputation hypotheses. Using a sample of the firms’
dividend payout ratios, straight debt, and convertible debt from 1964 to 1977, their findings do not
support the debt covenant argument, but do support the reputation argument. They conclude that
reputation is the most plausible explanation why firms do not transfer wealth from bondholders to
stockholders though dividend policy.
Firms trade-off dividend payments with fixed financial charges. A highly leveraged firm would tend
to lower its dividend payout ratio because of high fixed financial commitments. On the other hand,
increased indebtedness leads to increased contacts with external financing sources, which results in
closer monitoring and an increased dividend payout.
3.18 Financial Slack This chapter also considers examining the relationship between financial slack and dividend payout.
In order to undertake profitable investments, firms may prefer to increase their financial slack rather
than pay higher dividends. A high financial slack causes payout ratio to become lower, exacerbating
the cash flow problems. The pecking order theory seeks to explain why management prefers to build
financial. Asymmetry of information between investors and management makes external financing
more difficult to obtain. Thus management prepares for future financial risks and business
16

opportunities by accumulating internal funds whose use is not restricted. Therefore, financial slack is
expected to be inversely related to dividend payout ratio.
4. THE DIVIDEND POLICY AND OTHER ISSUES
4.1 Industry
Industry-specific factors affect a firm’s dividend policy (Baker & Powell, 2000). Although variation
in dividend payouts among firms appear to be affected by firm-specific variables such as investment
requirements and earnings variability, Lintner (1953) hypothesises that dividend policy also is
influenced by an industry effect. This effect could be interpreted as common correlations with
determinants of dividend payout by firms in the same industry, but Lintner suggests an effect of
dividend leadership analogous to price leadership or wage leadership. Such an industry effect, if it
exists, presumably stands apart from other firm-specific variables that affect payout decisions of the
member firms within an industry and causes them to have varying dividend policies (Dempsey, Laber
and Rozeff, 1993). Some evidence suggests that there is significant variation in dividend payout ratios
among industries (Michael, 1979; Baker, 1988).
Richardson, Tuna and Wysocki (2002) confirm that industry affiliation is a strong determinant of
corporate cash holdings, acquisitions, R&D and capital expenditures, leverage policy and dividend and
share repurchase policy. Several studies specifically examine the potential effect of industry
affiliation on dividend policies. Research by Michel (1979) and Baker (1988) among others suggests a
positive relationship exists between industry classification and dividend policy.4 Rozeff (1982)
concludes, however, that a company’s industry does not help to explain its dividend payout ratio.
Although firms within the same industry tend to have similar dividend payouts, Rozeff attributes the
apparently significant industry effect found in other studies to the fact that other variables are often
similar within a given industry. His conclusion does not apply to utilities since he intentionally
excluded regulated companies because their regulators’ status may affect their dividend policies.
Survey research by Baker, Farrelly and Edelman (1985) examine differences in determinants of
dividend policy among three industry groups – manufacturing, wholesale/retail, and utilities. Their
results show that the responses of the three groups differ significantly among eight of the fifteen
determinants of dividend policy examined in their study. Soter, Brigham and Evanson (1996) note the
economic environment for utilities has been changing over time. Due to regulators’ actions, the utility
industry has become a riskier place in which to operate and invest. In the current world, utilities find
themselves increasingly subject to competition. For the purpose of our analysis, I exclude financial
4 Rozeff (1982) concluded that a company’s industry does not help to explain its dividend payment ratio. This conclusion may not apply to utilities because he intentionally excluded regulated companies from his sample.
17
companies as these firms may have different considerations in establishing their investment and
dividend policies.
A zero one dummy variable will be used in the proposed models to capture the effect of industry in
both domestic and multinational corporations’ dividend payout policy. Further, industry dummies are
included in the regression to account for differences in asset structure, accounting practices,
government regulation, and competitiveness each may affect corporate governance of dividend
payments and firm valuations (Durnev and Kim, 2005). Given the prior studies have been conducted
in most U.S. and other European countries, it would be worthwhile to see the impact of industry in the
Australian corporations context.
4.2 Timing
It is important to examine the effects of time-varying information and determinants on the cash
dividend payout and cash dividend and share repurchases. Firstly, time series evidence of dividend
policies is relatively more plausible than cross-sectional evidence as time series analysis captures the
dynamic changes of dividend payout policy across time. Secondly, it would provide evidence on the
robustness of the disappearing puzzle. Thirdly, it allows conducting a further test of the time
dependence variable changes. For example, when investment and dividend payment is primarily
financed with internal funds, worsening conditions should not have as larger an impact as when
external funds account for the bulk of financing. Since this only happens in financial markets which
are imperfect (i.e. if internal and external funds are not perfect substitutes), the differential impact
should be stronger when financing frictions are more prevalent (Braun and Larrain, 2005). In order to
capture year effect (e.g. business cycle shocks or economic downturn), a dichotomous one and zero
variable will be used for each year.
5. DATA AND METHODOLOGY We gather data from the Osiris database and Compustat-Global for the period of 1995 to 2004. The
sample consists of 1254 Australian MCs and 994 Australian DCs.
The following three main regression models are proposed to test the determinants and multinationality
effect on different measure of dividend payout ratios. For example, Model I attempts to explain the
determinants of DCs and MCs independently so that a direct comparison can be made in terms of the
explanatory power of each determining factors between those two types of firms. Model II attempts to
isolate the multinationality effect which is believe to capture any unique factors that exist but we could
not capture within the capacity of this research even after considering the factors that is believe to
explain to the best (e.g. diversification, foreign exchange risk, political risks). Thirdly, Model III
18
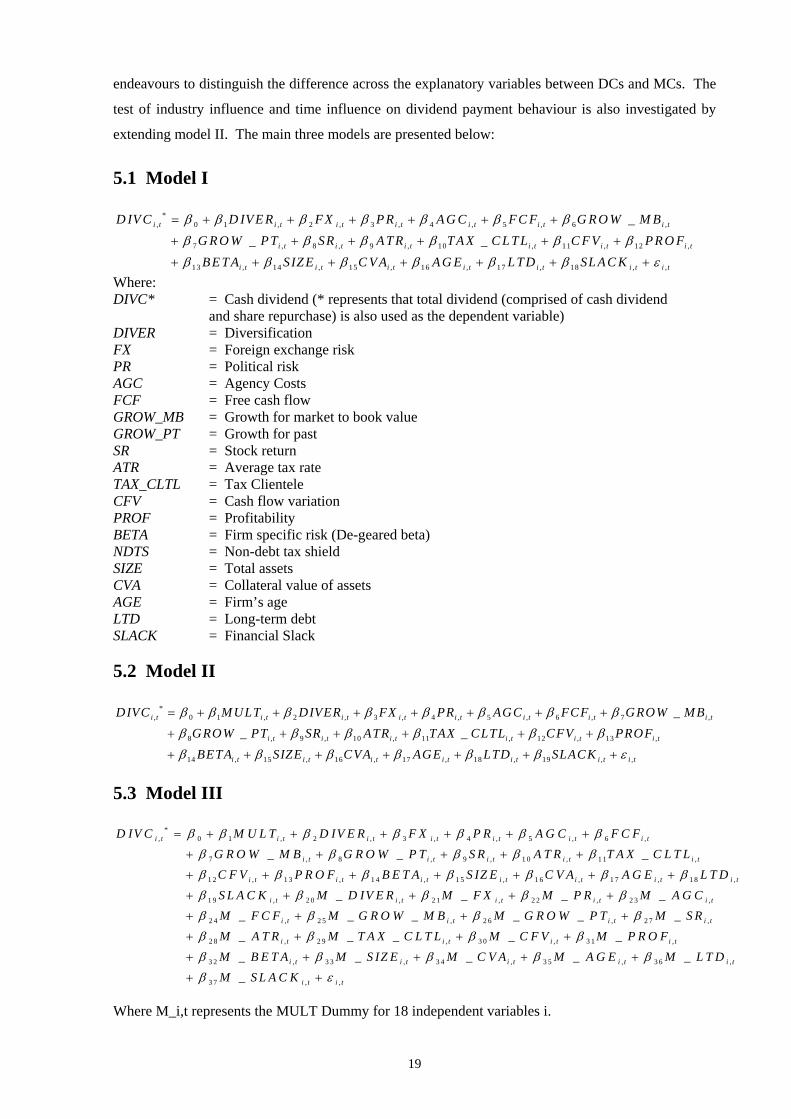
endeavours to distinguish the difference across the explanatory variables between DCs and MCs. The
test of industry influence and time influence on dividend payment behaviour is also investigated by
extending model II. The main three models are presented below:
5.1 Model I
*, 0 1 , 2 , 3 , 4 , 5 , 6 ,
7 , 8 , 9 , 10 , 11 , 12 ,
13 , 14 , 15 , 16
_ _ _
i t i t i t i t i t i t i t
i t i t i t i t i t i t
i t i t i t
D IV C D IV E R F X P R A G C F C F G R O W M BG R O W P T SR A T R T A X C L T L C F V P R O FB E T A SIZ E C V A A G E
β β β β β β β
β β β β β β
β β β β
= + + + + + +
+ + + + + +
+ + + + , 17 , 18 , ,i t i t i t i tL T D SL A C Kβ β ε+ + +
Where: DIVC* = Cash dividend (* represents that total dividend (comprised of cash dividend
and share repurchase) is also used as the dependent variable) DIVER = Diversification FX = Foreign exchange risk PR = Political risk AGC = Agency Costs FCF = Free cash flow GROW_MB = Growth for market to book value GROW_PT = Growth for past SR = Stock return ATR = Average tax rate TAX_CLTL = Tax Clientele CFV = Cash flow variation PROF = Profitability BETA = Firm specific risk (De-geared beta) NDTS = Non-debt tax shield SIZE = Total assets CVA = Collateral value of assets AGE = Firm’s age LTD = Long-term debt SLACK = Financial Slack
5.2 Model II
*, 0 1 , 2 , 3 , 4 , 5 , 6 , 7
8 , 9 , 10 , 11 , 12 , 13 ,
14 , 15 , 16
_ _ _
i t i t i t i t i t i t i t i t
i t i t i t i t i t i t
i t i t
DIVC M ULT DIVER FX PR AGC FCF GROW M BGROW PT SR ATR TAX CLTL CFV PROFBETA SIZE CV
β β β β β β β ββ β β β β β
β β β
= + + + + + + +
+ + + + + +
+ + + , 17 , 18 , 19 , ,i t i t i t i t i tA AGE LTD SLACKβ β β ε+ + + +
,
5.3 Model III
*, 0 1 , 2 , 3 , 4 , 5 , 6 ,
7 , 8 , 9 , 1 0 , 1 1 ,
1 2 , 1 3 , 1 4 , 1 5 ,
_ _ _
i t i t i t i t i t i t i t
i t i t i t i t i t
i t i t i t i t
D IV C M U L T D IV E R F X P R A G C F C FG R O W M B G R O W P T S R A T R T A X C L T LC F V P R O F B E T A S IZ E
β β β β β β β
β β β β β
β β β β
= + + + + + +
+ + + + +
+ + + + 1 6 , 1 7 , 1 8 ,
1 9 , 2 0 , 2 1 , 2 2 , 2 3 ,
2 4 , 2 5 , 2 6 , 2 7 ,
2 8
_ _ _ _ _ _ _ _ _ _ _
i t i t i t
i t i t i t i t i t
i t i t i t i t
C V A A G E L T DS L A C K M D IV E R M F X M P R M A G CM F C F M G R O W M B M G R O W P T M S RM A
β β β
β β β β β
β β β β
β
+ + +
+ + + + +
+ + + +
+ , 2 9 , 3 0 , 3 1 ,
3 2 , 3 3 , 3 4 , 3 5 , 3 6 ,
3 7 , ,
_ _ _ _ _ _ _ _ _ _
i t i t i t i t
i t i t i t i t i t
i t i t
T R M T A X C L T L M C F V M P R O FM B E T A M S IZ E M C V A M A G E M L T DM S L A C K
β β β
β β β β β
β ε
+ + +
+ + + + +
+ + Where M_i,t represents the MULT Dummy for 18 independent variables i.
19

6. REGRESSION RESULTS
6.1 Australian DCs and MCs Dividend Payout Determinants The analysis is based on levels which allows for a more direct interpretation of the results and avoids
some measurement issues that exist in the change analysis (Nissim and Ziv, 2001).
The regression analysis presented in Table 1 indicates four sets of regression results across DCs and
MCs for both cash dividend payout ratios (DIVCi,t) and total dividend payout ratios (DIVRi,t). Results
show that the first determining factor of diversification (DIVERi,t) of firms has a negative and highly
significant impact on DCs’ cash dividend payout decisions (t=-4.40). Similarly, the DIVERi,t factor for
DCs also show a significant and negative (t=-2.76) relationship in explaining cash and share
repurchase payout ratios (broader definition of dividend). This suggests that when Australian DCs
expand in terms of number of active subsidiaries in different geographical locations within the local
country, it decreases both cash and total dividend payments to shareholders. However, no significant
relationship is found with diversification of MCs and type of dividend payment modes (e.g. cash
dividend or total dividend). This suggests that MCs’ expansion both nationally and internationally has
no significant impact on dividend payout decision.
A weak and significant positive relationship is found for foreign exchange risk (FXi,t) for DCs in
explaining total dividend payout ratios (t=1.69). These results suggest that when the exchange rate
fluctuates, the Australian DCs are in a better position relative to MCs, as it appears that the variation in
foreign exchange rate favours the DCs’ increase in the dividend payment method through share
repurchase rather than just cash dividends. And this may be due to DCs maintaining the value of their
share within the firm and not letting their share value unnecessarily inflate in the market. No apparent
significant relationship is observed in MCs’ FXi,t variation and its impact on cash dividend payments
or share repurchases activities.
Prior literature suggests that dividends can be used in reducing agency problems between managers
and stockholders. For example, the payment of dividends reduces the discretionary funds available to
managers for perquisite consumption and helps address the manager-stockholder conflict (Jensen &
Meckling, 1976; Easterbrook, 1984; Crutchley & Hansen, 1989). While the direct measure of agency
costs is used here (ratio of number of shareholders to total outstanding shares) to capture the agency
problem between stockholders and managers, no perceptible evidence is found in either of Australian
DCs or MCs. Similarly, the free cash flow (FCFi,t) of agency costs shows that there is an inefficient
use of funds in Australian firms which decreases significantly their cash dividend payments capacity
across DCs and MCs; however, this relationship is not significant. This result suggest that the funds
remaining after financing all positive net present value projects cause conflicts of interest between
managers and shareholders almost identically between DCs and MCs. This implies that the managers
20

of Australian DCs and MCs use the excess cash flow to maximize their own wealth by spending on
unnecessary managerial expenses at the cost of shareholders by not paying cash dividends to their
shareholders on time. This result is inconsistent with Jensen (1986) who finds that free cash flow
positively and significantly affects dividend payout ratios higher levels of free cash flow will have
higher agency costs and need higher dividends payout ratios to reduce those agency costs.
Table 1 The determinants of cash dividends and total dividends for Australian DCs and MCs
This table reports the results of OLS regression (Model I) to obtain the parameters and t-statistics accordingly for the sample of 2248 (994 DCs and 1254 MCs separately) listed companies in the Australian Stock Exchange over 10 years to 2004. The adjusted R squared indicates the model’s goodness of fit.
*, 0 1 , 2 , 3 , 4 , 5 , 6 ,
7 , 8 , 9 , 1 0 , 1 1 , 1 2
1 3 , 1 4 , 1 5 , 1 6
_ _ _
i t i t i t i t i t i t i t
i t i t i t i t i t i t
i t i t i t
D IV C D IV E R F X P R A G C F C F G R O W M BG R O W P T S R A T R T A X C L T L C F V P R O FB E T A S IZ E C V A A G E
β β β β β β β
β β β β β β
β β β β
= + + + + + +
+ + + + + +
+ + + + , 1 7 , 1 8 , ,i t i t i t i tL T D S L A C Kβ β ε+ + +,
* indicates that this model uses two different measurement of dividend payout ratios which is explained below. Two dependent variables have been employed and they are: DIVC i,t (cash payout ratios) is calculated using cash dividend paid to net earnings and DIVR i,t (cash and share repurchase dividend payout ratios) is calculated as cash plus change in treasury stock scaled by net earnings. DIVER i,t (diversification) is the total number of subsidiaries that any firm has within their domicile country and overseas. FX i,t (foreign exchange risk) is calculated by the ratio of overseas sales to total sales revenue. PR i,t (political risk) is the sum of all the MCs subsidiaries countries’ political risk ratings exposed to the proportion of each sale that a subsidiary makes overseas. AGC i,t (agency cost) is the natural logarithm of total shareholders. FCF i,t (free cash flow) measured after Lehn and Poulsen (1989) is the sum of earnings before interest and tax plus depreciation plus amortization plus tax paid minus dividend paid and minus interest expense and then it was scaled by 10000 so that the magnitude of this variable is compatible with other measurements. Two growth measures have been used in this study namely GROW_MBB i,t (market value of equity to book value of asset) which is measured as market value of asset to book value of asset. And secondly, GROW_PT i,t (past growth) which is measured as the change in total assets over total assets. SRi,t (stock return) is measured as expected return of individual corporations by using CAPM. ATR i,t (average tax ratios) is calculated as total tax paid per annum scaled by net profit. TAX_CLTL i,t (tax clientele) is the ratio of number of common shares outstanding to number of total shares outstanding. CFV i,t (cash flow variation) is the standard deviation of the first difference in earnings before interest and taxes, scaled by mean value of interest expense. SIZE i,t is the natural logarithm of total asset. CVA i,t (collateral value of assets) is the ratio of fixed assets to total assets. AGEi,t is the natural logarithm of the age of the firm in years from date of incorporation. LEVERAGEi,t is the ratio of long-term debt to long-term debt plus market value of equity. SLACK i,t (financial slack) is measured as the sum of cash balances and marketable securities scaled by the market value of equity.
DCs MCs DIVCi,t DIVRi,t DIVCi,t DIVRi,t
Coeff t-Stat Coeff t-Stat Coeff t-Stat Coeff t-Stat C -0.15 -0.46 -0.28 -0.81 -0.69 -1.36 -0.89 -1.47 DIVERi,t -0.08 -4.40 a -0.06 -2.76 a -0.02 -1.13 -0.03 -1.60 FXi,t 0.05 0.75 0.14 1.69 c -0.11 -1.35 -0.10 -1.01 PRi,t 0.00 0.82 0.00 1.07 0.01 1.62 0.01 1.27 AGCi,t 0.02 1.00 0.02 0.92 0.06 1.41 0.06 1.43 FCFi,t -0.01 -0.79 0.00 -0.35 -0.03 -0.69 -0.01 -0.21 GROW_MBi,t 0.00 0.45 0.00 0.52 0.00 0.61 0.00 0.49 GROW_PTi,t -0.01 -1.39 -0.01 -1.15 -0.05 -0.59 -0.06 -0.59 SRi,t 0.03 3.03 a 0.03 3.04 a 0.01 0.69 0.01 0.85 ATRi,t 0.00 -0.39 0.00 -0.51 0.05 0.58 0.07 0.70 TAX_CLTLi,t 0.57 2.15 a 0.52 1.94 b 1.15 3.05 a 1.50 3.59 a
CFVi,t -4.39 -4.33 a -4.24 -4.20 a -1.32 -0.53 0.23 0.09 PROFi,t 0.04 3.35 a 0.03 3.24 a 0.24 1.89 b 0.22 1.71 c
BETAi,t 0.47 2.67 a 0.46 2.48 a -0.01 -0.05 0.45 1.85 SIZEi,t 0.07 4.37 a 0.07 4.49 a 0.04 1.67 c 0.07 2.22 b
CVAi,t 0.00 0.02 0.00 0.03 -0.26 -2.24 b -0.21 -1.63 AGEi,t -0.03 -1.54 -0.03 -1.30 0.02 0.48 0.03 0.52 LTDi,t -0.14 -1.62 -0.12 -1.37 -0.34 -2.51 b -0.35 -2.44 b
SLACKi,t -3.21 -3.65 a -6.19 -2.78 a -0.40 -0.64 4.64 2.05 b
Adj R-sqr 0.45 0.45 0.42 0.45 No. of Obs 994 994 1254 1254
a, b and c are the statistical significance level for 1%, 5% and 10% respectively.
21
Two proxies for growth factors are used to explain the variation in cash and cash and share repurchase
for Australian DCs and MCs. While GROW_MBi,t captures the future growth opportunities,
GROW_PTi,t attempts to confine historical growth rate and its determining power to explain dividend
increase or decrease across Australian DCs and MCs. An insignificant impact of future growth
opportunities is experimented within explaining both DCs’ and MCs’ cash dividend payments and this
finding is a contradiction with prior literature and pecking order theory (Rozeff, 1982; Lang &
Litzenberger, 1989; Gaver & Gaver, 1993; Brav et al., 2005).
GROW_PTi,t attempts to capture DCs’ and MCs’ past growth rate when deciding how much of its
earnings it needs to retain (for growth), and how much to give away as dividends. As the evidence
shows past growth has weak negative insignificant impact on MCs’ cash dividend payments, similarly,
no significant relationship is detected for DCs’ cash dividend payments.
The significant and positive influence of stock return (SRi,t) in explaining cash dividend payment for
Australian DCs (t=3.03 and t=3.04) suggest that as the stock return increases the dividend payment
increases as a result, especially when investors require a premium to hold high return stocks when
dividends are taxed at a higher rate than capital gains tax. Further, this evidence is consistent with
Bajaj and Vijh’s (1990) argument that dividend increases are associated with increases in stock return
because the percentage change in stock price is typically much smaller than the percentage change in
its dividend. However, stock return has no significant relationship to determine Australian MCs’ cash
dividend and cash and repurchase type of dividend payout ratio. This is consistent with Black and
Scholes (1974).
The tax clientele (TAX_CLTLi,t) coefficient appears to be positive and significant in explaining cash
dividend payout ratios for both DCs (t=2.15) and MCs (t=3.05) and also cash and share repurchase
mode of dividend payout ratios across DCs (t=1.94) and MCs (t=3.59). This result is consistent with
DeAngelo and Masulis (1980) and Litzenberger and Ramaswamy (1979) among others. This result
finds support for the tax clientele arguments where it states that as the institutional holdings increase,
the cash dividend payment increases proportionately, as the institutional shareholders of Australian
DCs and MCs are enable to take higher tax advantage as they fall in the low tax bracket.
The signalling theory of DCs and MCs is captured by using a proxy for cash flow variability (CFVi,t).
The negative and significant findings of CFVi,t explains cash dividend payout for DCs (t=-4.33). The
results demonstrate that firms with high volatile future cash flows pay significantly lower cash
dividends. The existence of signalling theory result in Australian DCs is consistent with Pettit (1972),
Asquith and Mullins (1983) and Miller and Rock (1985). No apparent significant relationship is found
to explain MCs dividend payout ratios.
22
The profitability (PROFi,t) factor is found with expected positive sign and significant for both DCs
(t=3.35 and t=3.24) and MCs (t=1.89 or t=1.71) which is consistent with Fama and French’s (2001)
argument that higher profitability implies greater capacity to distribute cash - thus a stronger incentive
to retain cash. The result also indicates that it is easier and more cost effective to finance internally
and consequently pay higher dividends.
Although it is often argued that firms with higher systematic firm beta tend to adopt a policy of setting
a relatively low payout ratio (Rozeff, 1982; Schooley & Barney, 1994), the evidence found in this
analysis is contradictory as the beta coefficient is positive and highly significant for explaining DCs
(t=2.67 and t=2.48) across cash and cash and share repurchase. A possible explanation for this result
can be argued from the financing costs point of view. For example, Rozeff (1982) uses beta as proxy
for external financing costs to maintain dividend payout, and possibly the positive significant result
attempts to suggest that as the systematic risks of Australian DCs increases the cash dividend payout
also increases since the costs of external financing outweigh the benefit of maintaining stable dividend
payout to shareholders. Nevertheless, to explain Australian MCs’ cash or non cash dividend payout is
not influenced by firm risk for the sample selected in this study.
The coefficient of firm size is significant and in the hypothesized direction to explain Australian DCs’
and MCs’ cash dividend payout and cash and share repurchase (t=4.37 and t=4.49; t=1.67 and t=2.22).
This indicates that as the Australian DCs become larger, it significantly increases the capacity to have
higher payout ratio. This evidence also suggest that as the DCs become larger it gets easier for them
to get access to capital markets to raise funds and are therefore less dependent on internal funds
enabling them to pay higher dividends, which is consistent with Holder, Langrerhr and Hexter (1998).
The debt covenant hypothesis predicts that firms will decrease dividends after debt issue and the
findings of our result support this theory which is consistent with DeAngelo and DeAngelo (1990) and
Jensen et al. (1992). The inverse and significant relationship between debt and dividend payout ratios
of cash and cash and share repurchase for MCs is negative and significant (t=-2.51 or t=-2.44),
suggesting that as the debt ratio increases, the cash dividend payment decreases due to high fixed
financial commitments. However, long-term debt does not show any statistical significant relationship
to determine Australian DCs dividend payout ratios.
Finally, managerial considerations of financial slack (SLACKi,t) predicts a negative and significant
results for Australian DCs (t=-3.65 and t=-2.78) only to explain cash dividend payments. The result
indicate that in order to be able to retain the ability to undertake profitable investments, DCs may
prefer to increase their financial slack rather than pay higher cash dividends. Interestingly, this result
only holds for MCs’ cash and share repurchase payout ratios but not cash payout ratios.
23
6.2 Effect of Multinationality on Dividend Payout To assess the impact of multinationality, the dichotomous variable for multinationality (MULTi,t) is
introduced into Model 1. A Likelihood Ratio (LR) test is performed to assess the significance of this
variable. The results indicate that multinationality is a significant variable in both cash and non-cash
dividend payment determination (LR F-stat=5.02 with prob=0.004 and F-stat=36.08 with prob=0.000
respectively).5 The positive sign on the coefficient indicates that MCs have significantly higher
dividend payout activities than DCs. To help explain the difference in dividend payout between DCs
and MCs and to assess the impact of individual economic determinants on MCs, Model 2 was
estimated.
Table 2 presents the effect of multinationality (MULTi,t) of Australian firms on cash dividend payments
and share repurchase activities. The positive direction of the MULTi,t coefficients (0.02 for cash
dividend payout ratios and 0.04 for cash and share repurchase type dividend payout ratios) is
consistent with the international theory that Hines (1996) developed. He documents that U.S.
multinational firms paid higher dividends from after tax profit relative to DCs because the unusual
high fraction of those profits came from foreign profits (non-U.S. sources). However, this result does
not have any significant impact in explaining Australian MCs’ decision payment decisions relative to
DCs counterparts. A possible explanation of this might be the fact that Australian MCs’
diversification benefit and tax benefit in operating in multiple countries do not outweigh the risks (e.g.
foreign risk, expropriation and economic risks) that they encounter. However, the adjusted R2 suggest
that construction of the model is explaining about 39% of the cash dividend payment and 41% of share
repurchase activities between DCs and MCs. The rest of the determining factors maintain the
expected signs and significance level as in the earlier table.
Table 21 The effect of multinationality on cash dividend and total dividend in Australian firms
This table reports the results of OLS regression (Model II) to obtain the parameters and t-statistics accordingly for the sample of 2248 (994 DCs and 1254 MCs separately) listed companies in the Australian Stock Exchange over 10 years to 2004. The adjusted R squared indicates the model’s goodness of fit.
*, 0 1 , 2 , 3 , 4 , 5 , 6 , 7
8 , 9 , 1 0 , 1 1 , 1 2 , 1 3 ,
1 4 , 1 5 , 1 6
_ _ _
i t i t i t i t i t i t i t i t
i t i t i t i t i t i t
i t i t
D IV C M U L T D IV E R F X P R A G C F C F G R O W M BG R O W P T S R A T R T A X C L T L C F V P R O FB E T A S IZ E C V
β β β β β β β β
β β β β β β
β β β
= + + + + + + +
+ + + + + +
+ + + , 1 7 , 1 8 , 1 9 , ,i t i t i t i t i tA A G E L T D S L A C Kβ β β ε+ + + +
,
* indicates that this model uses two different measurement of dividend payout ratios which is explained below. Two dependent variables have been employed and they are: DIVC i,t (cash payout ratios) is calculated using cash dividend paid to net earnings and DIVR i,t (cash and share repurchase dividend payout ratios) is calculated as cash plus change in treasury stock scaled by net earnings. Multinationality (MULTi,t) effect is measured where it takes a value of 1 when a corporation is a multinational otherwise it is 0. DIVER i,t (diversification) is the total number of subsidiaries that any firm has within their domicile country and overseas. FX i,t (foreign
5 Table not included.
24
exchange risk) is calculated by the ratio of overseas sales to total sales revenue. PR i,t (political risk) is the sum of all the MCs subsidiaries countries’ political risk ratings exposed to the proportion of each sale that a subsidiary makes overseas. AGC i,t (agency cost) is the natural logarithm of total shareholders. FCF i,t (free cash flow) measured after Lehn and Poulsen (1989) is the sum of earnings before interest and tax plus depreciation plus amortization plus tax paid minus dividend paid and minus interest expense and then it was scaled by 10000 so that the magnitude of this variable is compatible with other measurements. Two growth measures have been used in this study namely GROW_MB i,t (market value of equity to book value of asset) which is measured as market value of asset to book value of asset. And secondly, GROW_PT i,t (past growth) which is measured as the change in total assets over total assets. SR i,t (stock return) is measured as expected return of individual corporations by using CAPM. ATR i,t (average tax ratios) is calculated as total tax paid per annum scaled by net profit. TAX_CLTL i,t (tax clientele) is the ratio of number of common shares outstanding to number of total shares outstanding. CFV i,t (cash flow variation) is the standard deviation of the first difference in earnings before interest and taxes, scaled by mean value of interest expense. SIZE i,t is the natural logarithm of total asset. CVA i,t (collateral value of assets) is the ratio of fixed assets to total assets. AGEi,t is the natural logarithm of the age of the firm in years from date of incorporation. LEVERAGEi,t is the ratio of long-term debt to long-term debt plus market value of equity. SLACK i,t (financial slack) is measured as the sum of cash balances and marketable securities scaled by the market value of equity. Model II incorporates a dummy variable in addition to common eighteen variables to capture multinationality. For example, other attributes: inflation, interest rates, restrictions on the quantity of amount DCs and MCs can borrow overseas, debt market efficiency and borrowing costs to finance dividend payments which FX, PR and DIVER do not capture.
DIVCi,t DIVRi,t
Coeff t-Stat Coeff t-Stat
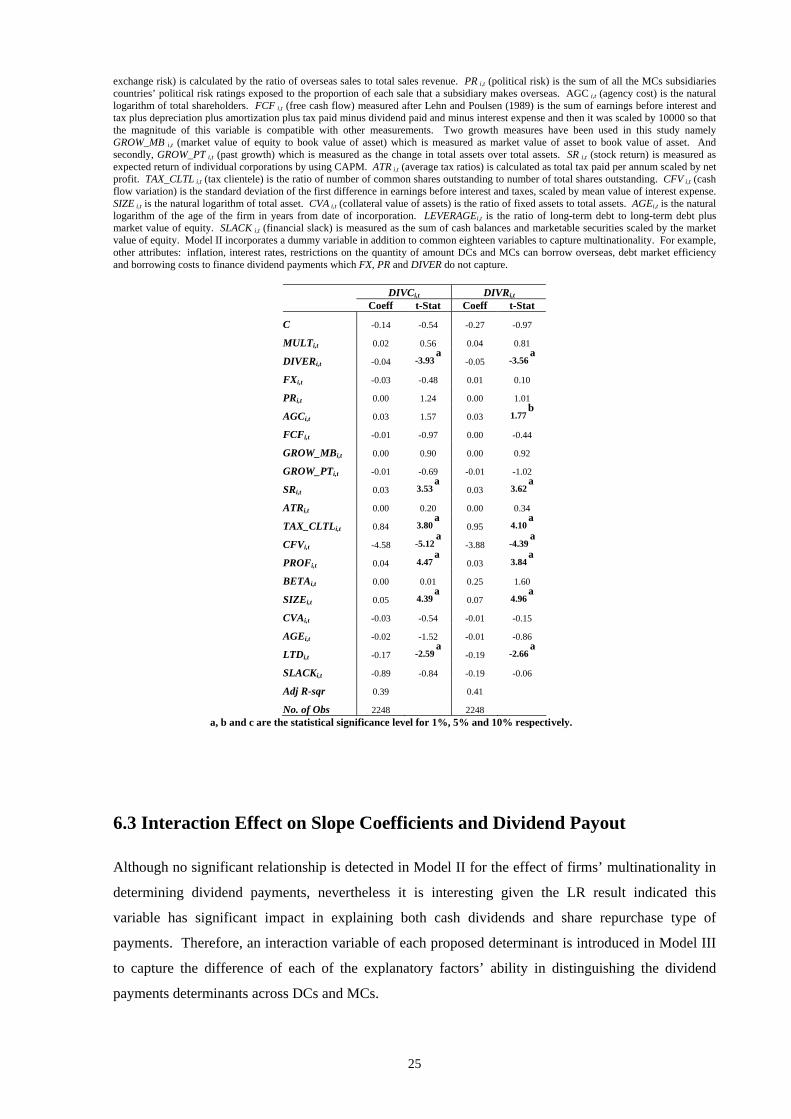
C -0.14 -0.54 -0.27 -0.97
MULTi,t 0.02 0.56 0.04 0.81
DIVERi,t -0.04 -3.93 a -0.05 -3.56 a
FXi,t -0.03 -0.48 0.01 0.10
PRi,t 0.00 1.24 0.00 1.01
AGCi,t 0.03 1.57 0.03 1.77 b
FCFi,t -0.01 -0.97 0.00 -0.44
GROW_MBi,t 0.00 0.90 0.00 0.92
GROW_PTi,t -0.01 -0.69 -0.01 -1.02
SRi,t 0.03 3.53 a 0.03 3.62 a
ATRi,t 0.00 0.20 0.00 0.34
TAX_CLTLi,t 0.84 3.80 a 0.95 4.10 a
CFVi,t -4.58 -5.12 a -3.88 -4.39 a
PROFi,t 0.04 4.47 a 0.03 3.84 a
BETAi,t 0.00 0.01 0.25 1.60
SIZEi,t 0.05 4.39 a 0.07 4.96 a
CVAi,t -0.03 -0.54 -0.01 -0.15
AGEi,t -0.02 -1.52 -0.01 -0.86
LTDi,t -0.17 -2.59 a -0.19 -2.66 a
SLACKi,t -0.89 -0.84 -0.19 -0.06
Adj R-sqr 0.39 0.41
No. of Obs 2248 2248 a, b and c are the statistical significance level for 1%, 5% and 10% respectively.
6.3 Interaction Effect on Slope Coefficients and Dividend Payout Although no significant relationship is detected in Model II for the effect of firms’ multinationality in
determining dividend payments, nevertheless it is interesting given the LR result indicated this
variable has significant impact in explaining both cash dividends and share repurchase type of
payments. Therefore, an interaction variable of each proposed determinant is introduced in Model III
to capture the difference of each of the explanatory factors’ ability in distinguishing the dividend
payments determinants across DCs and MCs.
25

The evidence of this interaction effect on individual slope coefficients for MCs is empirical and
therefore no reference is made in explaining Table 3. The interaction of MCs’ diversification slope
coefficient for cash dividend payments and repurchase payments suggests two different explanations
of dividend payments. For example, the interaction of MCs’ geographical expansion or diversification
(M_DIVER) locally and internationally has a positive and significant impact on increasing cash
dividend payments (t=2.25) while it does not have a significant impact on overall dividend payout
ratios. This result is intuitive and justified in a sense that diversification cannot have same directional
impact on both cash and a non-cash dividend payment as one is believed to be a substitute of another.
The slope coefficient of foreign exchange risk (M_FX) states that the fluctuations of foreign exchange
risks impacts significantly (t=-1.87) more on the reduction of combined payout ratios (cash and share
repurchase) but not cash dividend payout ratios only for Australian MCs relative to DCs.
Consistent with Hines (1996), the interaction factor of profitability (M_PROF) is positive and
significant (t=1.65) which suggest an increase in profitability would significantly increase the
Australian MCs’ cash dividend payments capacity than its DCs counterparts.
The interaction of negative and significant (t=-1.80) firm-specific risk (BETA) coefficient or proxy for
external financing costs suggests that it is rather costlier for Australian MCs to raise finance externally
in order to maintain stable cash dividend payout and therefore firm risk significantly decreases cash
dividend payments relative to DCs. Similarly, the increase in firm-specific risks discourages
significantly Australian MCs to be involved in share repurchase activity type of dividend payment
mode, since the result seems to be insignificant for our sample (t=-0.05). This may be argued in the
sense that if the managers could sense that firm-specific risk is increasing, then it would be unwise to
payout cash dividends instead of buying the shares back from the shareholders, which will make more
sense as it saves them losing out on the market value of the firm due to higher firm-specific risks.
Interestingly, the significant of interaction variable (M_SIZE) for MCs show that it is negative and
insignificant in explaining the slope difference of cash dividend payouts (t=-0.72). Similarly, the
slope coefficient of collateral value of assets for MCs also shows a negative and significant
relationship (t=-1.97), which suggests that as MCs increase their collateralised assets, it reduces the
cash dividend payments for MCs more than DCs. Intuitively, this result suggests that Australian MCs
are not exploiting the benefit of transaction costs of raising long term debt, especially when it needs to
finance dividend externally.
Finally, the interaction slope coefficients of MCs financial M_SLACK variable suggest that Australian
MCs cash dividend payment is positive and significant (t=2.62) and dividends comprised of cash and
share repurchase is also positive and significant (t=3.44) and a possible explanation for this is that
26

Australian MCs do not participate in financial slacking and therefore MCs are able to pay relatively
higher dividends than DCs.
Table 32 Interaction effects for cash dividend and total dividend determinants of Australian DCs and MCs
This table reports the results of OLS regression (Model III) to obtain the parameters and t-statistics accordingly for the sample of 2248 (994 DCs and 1254 MCs separately) listed companies in the Australian Stock Exchange over 10 years to 2004. The adjusted R squared indicates the model’s goodness of fit.
*, 0 1 , 2 , 3 , 4 , 5 , 6 ,
7 , 8 , 9 , 1 0 , 1 1 ,
1 2 , 1 3 , 1 4 , 1 5 ,
_ _ _
i t i t i t i t i t i t i t
i t i t i t i t i t
i t i t i t i t
D I V C M U L T D I V E R F X P R A G C F C FG R O W M B G R O W P T S R A T R T A X C L T LC F V P R O F B E T A S I Z E
β β β β β β β
β β β β β
β β β β
= + + + + + +
+ + + + +
+ + + + 1 6 , 1 7 ,
1 8 , 1 9 , 2 0 , 2 1 , 2 2 ,
2 3 , 2 4 , 2 5 , 2 6 ,
2 7 , 2 8
_ _ _ _ _ _ _ _ _ _ _
i t i t
i t i t i t i t i t
i t i t i t i t
i t
C V A A G EL T D S L A C K M D I V E R M F X M P RM A G C M F C F M G R O W M B M G R O W P TM S R M A
β β
β β β β β
β β β β
β β
+ +
+ + + + +
+ + + +
+ + , 2 9 , 3 0 ,
3 1 , 3 2 , 3 3 , 3 4 , 3 5 ,
3 6 , 3 7 , ,
_ _ _ _ _ _ _ _ _ _
i t i t i t
i t i t i t i t i t
i t i t i t
T R M T A X C L T L M C F VM P R O F M B E T A M S I Z E M C V A M A G EM L T D M S L A C K
β ββ β β β β
β β ε
+ +
+ + + + +
+ + + * indicates that this model uses two different measurement of dividend payout ratios which is explained below. Two dependent variables have been employed and they are: DIVC i,t (cash payout ratios) is calculated using cash dividend paid to net earnings and DIVR i,t (cash and share repurchase dividend payout ratios) is calculated as cash plus change in treasury stock scaled by net earnings. In order to capture the multinationality effect a dummy variable is introduced where it takes a 1 when a corporation is a multinational otherwise it is 0. DIVER i,t (diversification) is the total number of subsidiaries that any firm has within their domicile country and overseas. FX i,t (foreign exchange risk) is calculated by the ratio of overseas sales to total sales revenue. PR i,t (political risk) is the sum of all the MCs subsidiaries countries’ political risk ratings exposed to the proportion of each sale that a subsidiary makes overseas. AGC i,t (agency cost) is the natural logarithm of total shareholders. FCF i,t (free cash flow) measured after Lehn and Poulsen (1989) is the sum of earnings before interest and tax plus depreciation plus amortization plus tax paid minus dividend paid and minus interest expense and then it was scaled by 10000 so that the magnitude of this variable is compatible with other measurements. Two growth measures have been used in this study namely GROW_MB i,t (market value of equity to book value of asset) which is measured as market value of asset to book value of asset. And secondly, GROW_PT i,t (past growth) which is measured as the change in total assets over total assets. SRi,t (stock return) is measured as expected return of individual corporations by using CAPM. ATR i,t (average tax ratios) is calculated as total tax paid per annum scaled by net profit. TAX_CLTL i,t (tax clientele) is the ratio of number of common shares outstanding to number of total shares outstanding. CFV i,t (cash flow variation) is the standard deviation of the first difference in earnings before interest and taxes, scaled by mean value of interest expense. SIZE i,t is the natural logarithm of total asset. CVA i,t (collateral value of assets) is the ratio of fixed assets to total assets. AGEi,t is the natural logarithm of the age of the firm in years from date of incorporation. LEVERAGEi,t is the ratio of long-term debt to long-term debt plus market value of equity. SLACK i,t (financial slack) is measured as the sum of cash balances and marketable securities scaled by the market value of equity. Model III incorporates slope dummy variables in addition to common eighteen variables to capture multinationality impact on each of the explanatory variables. For example, Model III aims to discover any unexplained issues that Model II failed to capture which are either hard to measure or just not available to explain the MCs’ operational behaviour and its impact on dividend payments. Besides, some of these other attributes are hard to measure since some are qualitative information. The interaction dummy variable is used to find the significant difference of the common eight variables. For example, M_DIVER takes the actual value of MCs while it is 0 for the DCs.
DIVCi,t DIVRi,t
Coeff t-Stat Coeff t-Stat
C -0.15 -0.46 -0.28 -0.80
MULTi,t -0.54 -0.91 -0.61 -0.90
DIVERi,t -0.08 -4.34 a -0.06 -2.72 a
FXi,t 0.05 0.74 0.14 1.67 c
PRi,t 0.00 0.81 0.00 1.05
AGCi,t 0.02 0.98 0.02 0.91
FCFi,t -0.01 -0.77 0.00 -0.34
GROW_MBi,t 0.00 0.45 0.00 0.52
GROW_PTi,t -0.01 -1.37 -0.01 -1.13
SRi,t 0.03 2.99 a 0.03 3.00 a
ATRi,t 0.00 -0.38 0.00 -0.50
TAX_CLTLi,t 0.57 2.12 a 0.52 1.91 b
CFVi,t -4.39 -4.26 a -4.24 -4.14 a
27
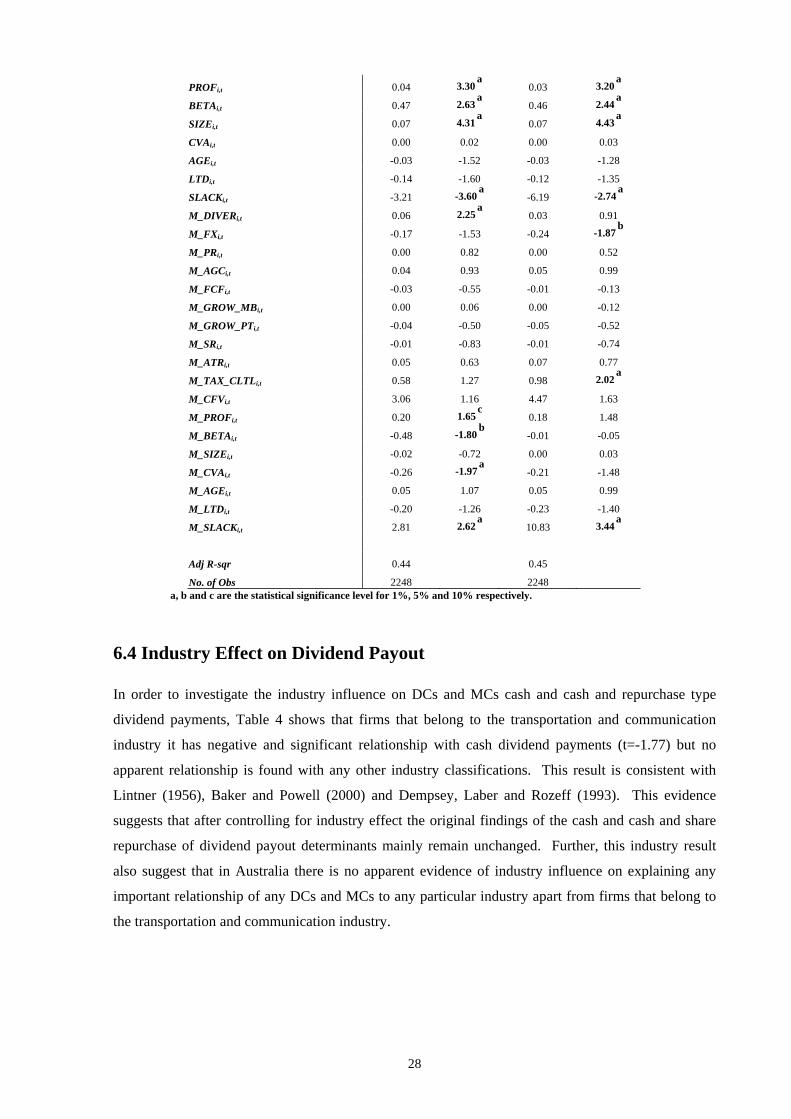
PROFi,t 0.04 3.30 a 0.03 3.20 a
BETAi,t 0.47 2.63 a 0.46 2.44 a
SIZEi,t 0.07 4.31 a 0.07 4.43 a
CVAi,t 0.00 0.02 0.00 0.03
AGEi,t -0.03 -1.52 -0.03 -1.28
LTDi,t -0.14 -1.60 -0.12 -1.35
SLACKi,t -3.21 -3.60 a -6.19 -2.74 a
M_DIVERi,t 0.06 2.25 a 0.03 0.91
M_FXi,t -0.17 -1.53 -0.24 -1.87 b
M_PRi,t 0.00 0.82 0.00 0.52
M_AGCi,t 0.04 0.93 0.05 0.99
M_FCFi,t -0.03 -0.55 -0.01 -0.13
M_GROW_MBi,t 0.00 0.06 0.00 -0.12
M_GROW_PTi,t -0.04 -0.50 -0.05 -0.52
M_SRi,t -0.01 -0.83 -0.01 -0.74
M_ATRi,t 0.05 0.63 0.07 0.77
M_TAX_CLTLi,t 0.58 1.27 0.98 2.02 a
M_CFVi,t 3.06 1.16 4.47 1.63
M_PROFi,t 0.20 1.65 c 0.18 1.48
M_BETAi,t -0.48 -1.80 b -0.01 -0.05
M_SIZEi,t -0.02 -0.72 0.00 0.03
M_CVAi,t -0.26 -1.97 a -0.21 -1.48
M_AGEi,t 0.05 1.07 0.05 0.99
M_LTDi,t -0.20 -1.26 -0.23 -1.40
M_SLACKi,t 2.81 2.62 a 10.83 3.44 a
Adj R-sqr 0.44 0.45
No. of Obs 2248 2248 a, b and c are the statistical significance level for 1%, 5% and 10% respectively.
6.4 Industry Effect on Dividend Payout In order to investigate the industry influence on DCs and MCs cash and cash and repurchase type
dividend payments, Table 4 shows that firms that belong to the transportation and communication
industry it has negative and significant relationship with cash dividend payments (t=-1.77) but no
apparent relationship is found with any other industry classifications. This result is consistent with
Lintner (1956), Baker and Powell (2000) and Dempsey, Laber and Rozeff (1993). This evidence
suggests that after controlling for industry effect the original findings of the cash and cash and share
repurchase of dividend payout determinants mainly remain unchanged. Further, this industry result
also suggest that in Australia there is no apparent evidence of industry influence on explaining any
important relationship of any DCs and MCs to any particular industry apart from firms that belong to
the transportation and communication industry.
28
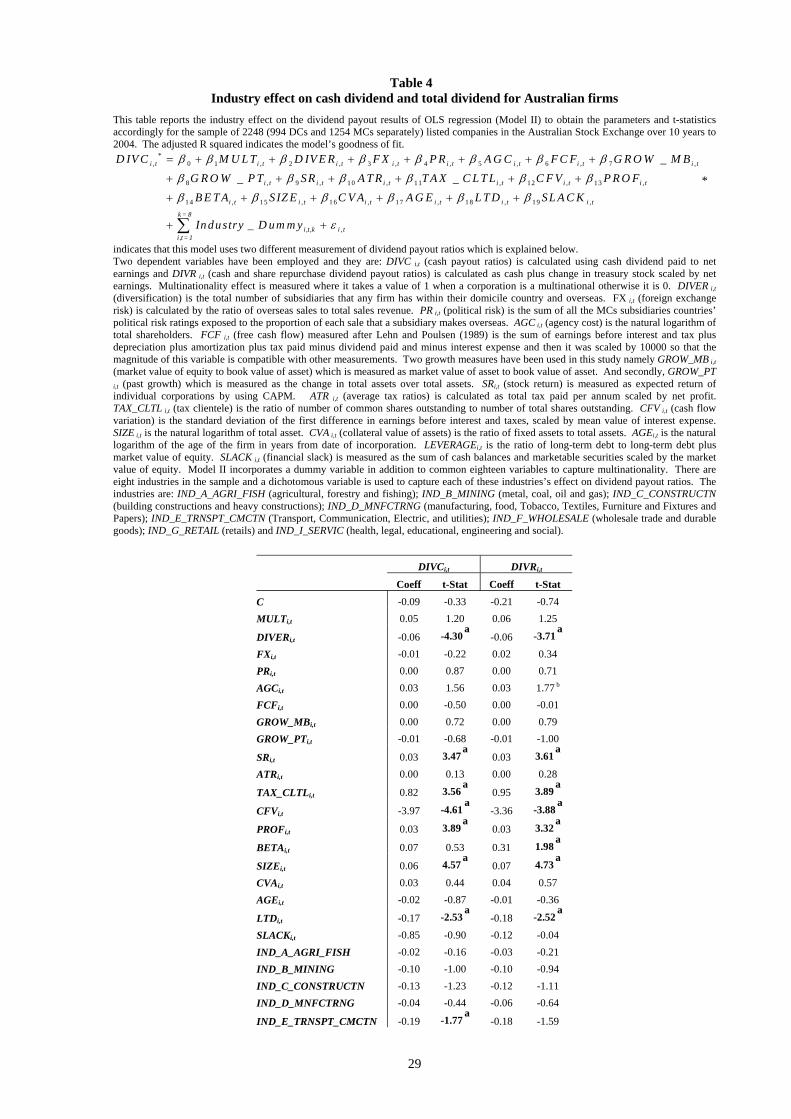
Table 43 Industry effect on cash dividend and total dividend for Australian firms
This table reports the industry effect on the dividend payout results of OLS regression (Model II) to obtain the parameters and t-statistics accordingly for the sample of 2248 (994 DCs and 1254 MCs separately) listed companies in the Australian Stock Exchange over 10 years to 2004. The adjusted R squared indicates the model’s goodness of fit.
*, 0 1 , 2 , 3 , 4 , 5 , 6 , 7
8 , 9 , 10 , 11 , 12 , 13 ,
1 4 , 1 5 , 1 6
_ _ _
i t i t i t i t i t i t i t i t
i t i t i t i t i t i t
i t i t
D IV C M U L T D IV E R F X P R A G C F C F G R O W M BG R O W P T SR A T R T A X C L T L C F V P R O FB E T A SIZ E C V
β β β β β β β β
β β β β β β
β β β
= + + + + + + +
+ + + + + +
+ + + , 17 , 1 8 , 19 ,
, _
i t i t i t i t
k = 8
i,t,k i ti,t= 1
A A G E L T D SL A C K
In dustry D um m y
β β β
ε
+ + +
+ +∑
,
*
indicates that this model uses two different measurement of dividend payout ratios which is explained below. Two dependent variables have been employed and they are: DIVC i,t (cash payout ratios) is calculated using cash dividend paid to net earnings and DIVR i,t (cash and share repurchase dividend payout ratios) is calculated as cash plus change in treasury stock scaled by net earnings. Multinationality effect is measured where it takes a value of 1 when a corporation is a multinational otherwise it is 0. DIVER i,t (diversification) is the total number of subsidiaries that any firm has within their domicile country and overseas. FX i,t (foreign exchange risk) is calculated by the ratio of overseas sales to total sales revenue. PR i,t (political risk) is the sum of all the MCs subsidiaries countries’ political risk ratings exposed to the proportion of each sale that a subsidiary makes overseas. AGC i,t (agency cost) is the natural logarithm of total shareholders. FCF i,t (free cash flow) measured after Lehn and Poulsen (1989) is the sum of earnings before interest and tax plus depreciation plus amortization plus tax paid minus dividend paid and minus interest expense and then it was scaled by 10000 so that the magnitude of this variable is compatible with other measurements. Two growth measures have been used in this study namely GROW_MBB i,t (market value of equity to book value of asset) which is measured as market value of asset to book value of asset. And secondly, GROW_PT
i,t (past growth) which is measured as the change in total assets over total assets. SRi,t (stock return) is measured as expected return of individual corporations by using CAPM. ATR i,t (average tax ratios) is calculated as total tax paid per annum scaled by net profit. TAX_CLTL i,t (tax clientele) is the ratio of number of common shares outstanding to number of total shares outstanding. CFV i,t (cash flow variation) is the standard deviation of the first difference in earnings before interest and taxes, scaled by mean value of interest expense. SIZE i,t is the natural logarithm of total asset. CVA i,t (collateral value of assets) is the ratio of fixed assets to total assets. AGEi,t is the natural logarithm of the age of the firm in years from date of incorporation. LEVERAGEi,t is the ratio of long-term debt to long-term debt plus market value of equity. SLACK i,t (financial slack) is measured as the sum of cash balances and marketable securities scaled by the market value of equity. Model II incorporates a dummy variable in addition to common eighteen variables to capture multinationality. There are eight industries in the sample and a dichotomous variable is used to capture each of these industries’s effect on dividend payout ratios. The industries are: IND_A_AGRI_FISH (agricultural, forestry and fishing); IND_B_MINING (metal, coal, oil and gas); IND_C_CONSTRUCTN (building constructions and heavy constructions); IND_D_MNFCTRNG (manufacturing, food, Tobacco, Textiles, Furniture and Fixtures and Papers); IND_E_TRNSPT_CMCTN (Transport, Communication, Electric, and utilities); IND_F_WHOLESALE (wholesale trade and durable goods); IND_G_RETAIL (retails) and IND_I_SERVIC (health, legal, educational, engineering and social).
DIVCi,t DIVRi,t
Coeff t-Stat Coeff t-Stat
C -0.09 -0.33 -0.21 -0.74 MULTi,t 0.05 1.20 0.06 1.25
DIVERi,t -0.06 -4.30 a -0.06 -3.71 a
FXi,t -0.01 -0.22 0.02 0.34 PRi,t 0.00 0.87 0.00 0.71 AGCi,t 0.03 1.56 0.03 1.77 b
FCFi,t 0.00 -0.50 0.00 -0.01 GROW_MBi,t 0.00 0.72 0.00 0.79 GROW_PTi,t -0.01 -0.68 -0.01 -1.00
SRi,t 0.03 3.47 a 0.03 3.61 a
ATRi,t 0.00 0.13 0.00 0.28
TAX_CLTLi,t 0.82 3.56 a 0.95 3.89 a
CFVi,t -3.97 -4.61 a -3.36 -3.88 a
PROFi,t 0.03 3.89 a 0.03 3.32 a
BETAi,t 0.07 0.53 0.31 1.98 a
SIZEi,t 0.06 4.57 a 0.07 4.73 a
CVAi,t 0.03 0.44 0.04 0.57 AGEi,t -0.02 -0.87 -0.01 -0.36
LTDi,t -0.17 -2.53 a -0.18 -2.52 a
SLACKi,t -0.85 -0.90 -0.12 -0.04 IND_A_AGRI_FISH -0.02 -0.16 -0.03 -0.21 IND_B_MINING -0.10 -1.00 -0.10 -0.94 IND_C_CONSTRUCTN -0.13 -1.23 -0.12 -1.11 IND_D_MNFCTRNG -0.04 -0.44 -0.06 -0.64
IND_E_TRNSPT_CMCTN -0.19 -1.77 a -0.18 -1.59
29

IND_F_WHOLESALE 0.02 0.20 0.01 0.05 IND_G_RETAIL 0.08 0.70 0.07 0.57 IND_I_SERVIC -0.02 -0.22 -0.03 -0.29 Adj R-sqr 0.41 0.42 No. of Obs 2248 2248
a, b and c are the statistical significance level for 1%, 5% and 10% respectively.
6.5 Time Varying Effect on Dividend Payout In order to investigate the time varying effect on cash dividend payout and cash with share repurchases
mode of dividend payouts, a yearly dummy (YR_0i) variable is introduced to investigate the yearly
effect of dividend payments across Australian DCs and MCs such that any noteworthy economic
events can be captured. The result in Table 5 suggests that every year since 1999 the cash payment is
disappearing in a higher magnitude than the cash and repurchase type of dividend payments, while the
reduction in cash dividend across 2002-2004 is highly significant (t=-2.35, t=-4.13 and t=-3.68
respectively). A similar pattern is also observed in the cash and share repurchase type of dividends
payout ratios across 2002, 2003 and 2004 (t=-2.56; t=-3.68 and t=-3.46).
Table 54 Time variation effect on cash dividend and total dividend for Australian firms
This table reports the industry effect on the dividend payout results of OLS regression (Model II) to obtain the parameters and t-statistics accordingly for the sample of 2248 (994 DCs and 1254 MCs separately) listed companies in the Australian Stock Exchange over 10 years to 2004. The adjusted R squared indicates the model’s goodness of fit.
*, 0 1 , 2 , 3 , 4 , 5 , 6 , 7
8 , 9 , 10 , 11 , 12 , 13 ,
1 4 , 1 5 , 1 6
_ _ _
i t i t i t i t i t i t i t i t
i t i t i t i t i t i t
i t i t
D IV C M U L T D IV E R F X P R A G C F C F G R O W M BG R O W P T SR A T R T A X C L T L C F V P R O FB E T A SIZ E C V
β β β β β β β ββ β β β β β
β β β
= + + + + + + +
+ + + + + +
+ + + , 17 , 1 8 , 19 ,
,
i t i t i t i t
t= 10
i,t i ti= 1
A A G E L T D SL A C K
Yearly_D um m y
β β β
ε
+ + +
+ +∑
,
*
indicates that this model uses two different measurement of dividend payout ratios which is explained below. Two dependent variables have been employed and they are: DIVC i,t (cash payout ratios) is calculated using cash dividend paid to net earnings and DIVR i,t (cash and share repurchase dividend payout ratios) is calculated as cash plus change in treasury stock scaled by net earnings. Multinationality effect is measured where it takes a value of 1 when a corporation is a multinational otherwise it is 0. DIVER i,t (diversification) is the total number of subsidiaries that any firm has within their domicile country and overseas. FX i,t (foreign exchange risk) is calculated by the ratio of overseas sales to total sales revenue. PR i,t (political risk) is the sum of all the MCs subsidiaries countries’ political risk ratings exposed to the proportion of each sale that a subsidiary makes overseas. AGC i,t (agency cost) is the natural logarithm of total shareholders. FCF i,t (free cash flow) measured after Lehn and Poulsen (1989) is the sum of earnings before interest and tax plus depreciation plus amortization plus tax paid minus dividend paid and minus interest expense and then it was scaled by 10000 so that the magnitude of this variable is compatible with other measurements. Two growth measures have been used in this study namely GROW_MBB i,t (market value of equity to book value of asset) which is measured as market value of asset to book value of asset. And secondly, GROW_PT
i,t (past growth) which is measured as the change in total assets over total assets. SRi,t (stock return) is measured as expected return of individual corporations by using CAPM. ATR i,t (average tax ratios) is calculated as total tax paid per annum scaled by net profit. TAX_CLTL i,t (tax clientele) is the ratio of number of common shares outstanding to number of total shares outstanding. CFV i,t (cash flow variation) is the standard deviation of the first difference in earnings before interest and taxes, scaled by mean value of interest expense. SIZE i,t is the natural logarithm of total asset. CVA i,t (collateral value of assets) is the ratio of fixed assets to total assets. AGEi,t is the natural logarithm of the age of the firm in years from date of incorporation. LEVERAGEi,t is the ratio of long-term debt to long-term debt plus market value of equity. SLACK i,t (financial slack) is measured as the sum of cash balances and marketable securities scaled by the market value of equity. Model II incorporates a dummy variable in addition to common eighteen variables to capture multinationality. There are 10 years in the sample and a dichotomous variable is used to capture each of these years on dividend payout ratios.
DIVCi,t DIVRi,t
Coeff t-Stat Coeff t-Stat
C -0.08 -0.31 -0.20 -0.65 MULTi,t 0.00 0.09 0.02 0.51
DIVERi,t -0.05 -4.40 a -0.06 -3.93 a
FXi,t 0.00 0.10 0.04 0.66
30

PRi,t 0.00 1.25 0.00 0.95
AGCi,t 0.04 2.43 a 0.04 2.81 a
FCFi,t 0.00 -0.24 0.00 0.02 GROW_MBi,t 0.01 1.14 0.01 0.99 GROW_PTi,t -0.01 -0.83 -0.01 -0.92
SRi,t 0.03 3.52 a 0.03 5.96 a
ATRi,t 0.00 0.42 0.01 0.79
TAX_CLTLi,t 0.81 3.59 a 0.91 3.79 a
CFVi,t -4.78 -5.08 a -4.11 -4.33 a
PROFi,t 0.04 4.89 a 0.04 2.45 a
BETAi,t -0.13 -1.07 0.10 0.65
SIZEi,t 0.05 4.33 a 0.07 5.14 a
CVAi,t -0.08 -1.42 -0.06 -0.98 AGEi,t -0.01 -0.57 0.00 0.06
LTDi,t -0.15 -2.22 a -0.15 -1.95 a
SLACKi,t -0.42 -0.44 0.34 0.15 YR_99 -0.07 -1.04 -0.07 -1.00
YR_00 -0.11 -1.91 b -0.10 -1.59 YR_01 -0.01 -0.15 -0.02 -0.36
YR_02 -0.12 -2.35 a -0.14 -2.56 a
YR_03 -0.21 -4.13 a -0.21 -3.68 a
YR_04 -0.20 -3.68 a -0.20 -3.46 a
Adj R-sqr 0.43 0.44 No. of Obs 2248 2248
a, b and c are the statistical significance level for 1%, 5% and 10% respectively.
Further, the incremental yearly impact is captured by employing an incremental yearly codification
from year 1995 to 2004 in order to investigate the average impact of incremental time effect on the
cash and cash and share repurchase dividend payments across DCs and MCs. The result in Table 6
dictates that on average cash dividend payments has been decreasing significantly (t=-5.58 and t=-
5.63) for Australian DCs and MCs (t=-4.05 and t=-3.92) across cash dividend payments and cash and
share repurchase payout ratios. Overall, the result of time effect on dividend payments suggests that
over the last ten years, both cash and cash and share repurchase declined, almost as equally across
DCs and MCs.
Table 65 Incremental year effect for Australian DCs and MCs on cash dividend and total dividend
Table 6 presents regression results of Australian DCs and MCs year effect on dividend payout policy. The following table uses the following model to capture the time effect:
, 0 1 ,i t i t i tD I V C Y r ,β β ε= + + DCs MCs DIVCi,t DIVRi,t DIVCi,t DIVRi,t
Coeff t-Stat Coeff t-Stat Coeff t-Stat Coeff t-Stat
C 38.41 5.63 a 38.75 5.68 a 37.60 4.10 a 38.27 3.97 a
Yr -0.02 -5.58 a -0.02 -5.63 a -0.02 -4.05 a -0.02 -3.92 a
Adj R-sqr 0.02 0.02 0.02 0.02 No. of Obs 994 994 1254 1254
a, b and c are the statistical significance level for 1%, 5% and 10% respectively.
31

32
Lastly, a yearly regression analysis is conducted to test whether the determinants that explain cash
dividend and cash dividend and share repurchase type of dividend payout vary across countries. The
result is reported in Table 7 and it suggests that, generally, the significance level of the independent
determinants across years varied and this variation remained similar across cash and cash and share
repurchase payout ratios. Interestingly, the determining factor remained similar across years for both
cash and cash and share repurchase. However, there seems to exist a difference of determining factors
for dividends payout ratios between DCs and MCs and this is shown with a significant coefficient of
(MULTi,t) in year 2002 (t=1.81); otherwise the determining factors stayed relatively similar across
years for DCs and MCs except for one particular year 2002. A possible explanation is that there might
be an effect of the 2001 terrorist attack on the selling and distribution of multinational corporations
internationally.
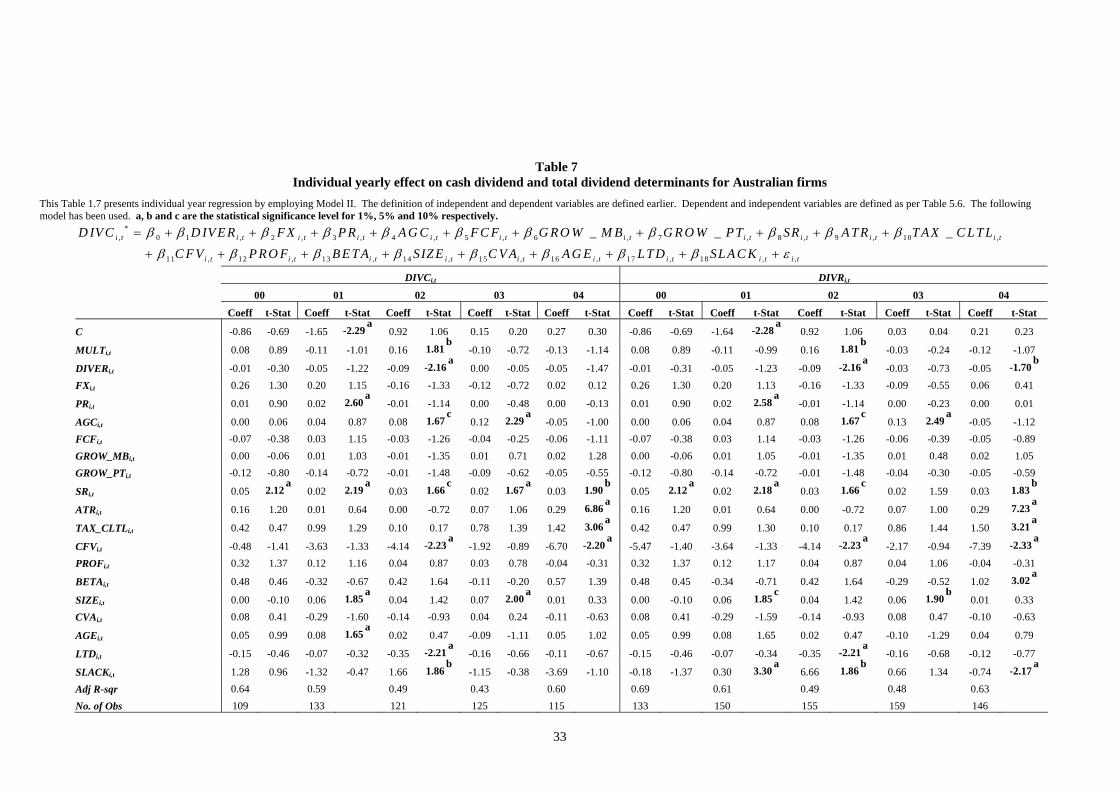
33
D IV
DIVCi,t DIVRi,t
00 01 02 03 04 00 01 02 03 04
Coeff t-Stat Coeff t-Stat Coeff t-Stat Coeff t-Stat Coeff t-Stat Coeff t-Stat Coeff t-Stat Coeff t-Stat Coeff t-Stat Coeff t-Stat
C -0.86 -0.69 -1.65 -2.29 a 0.92 1.06 0.15 0.20 0.27 0.30 -0.86 -0.69 -1.64 -2.28 a 0.92 1.06 0.03 0.04 0.21 0.23
MULTi,t 0.08 0.89 -0.11 -1.01 0.16 1.81 b -0.10 -0.72 -0.13 -1.14 0.08 0.89 -0.11 -0.99 0.16 1.81 b -0.03 -0.24 -0.12 -1.07
DIVERi,t -0.01 -0.30 -0.05 -1.22 -0.09 -2.16 a 0.00 -0.05 -0.05 -1.47 -0.01 -0.31 -0.05 -1.23 -0.09 -2.16 a -0.03 -0.73 -0.05 -1.70 b
FXi,t 0.26 1.30 0.20 1.15 -0.16 -1.33 -0.12 -0.72 0.02 0.12 0.26 1.30 0.20 1.13 -0.16 -1.33 -0.09 -0.55 0.06 0.41
PRi,t 0.01 0.90 0.02 2.60 a -0.01 -1.14 0.00 -0.48 0.00 -0.13 0.01 0.90 0.02 2.58 a -0.01 -1.14 0.00 -0.23 0.00 0.01
AGCi,t 0.00 0.06 0.04 0.87 0.08 1.67 c 0.12 2.29 a -0.05 -1.00 0.00 0.06 0.04 0.87 0.08 1.67 c 0.13 2.49 a -0.05 -1.12 FCFi,t -0.07 -0.38 0.03 1.15 -0.03 -1.26 -0.04 -0.25 -0.06 -1.11 -0.07 -0.38 0.03 1.14 -0.03 -1.26 -0.06 -0.39 -0.05 -0.89 GROW_MBi,t 0.00 -0.06 0.01 1.03 -0.01 -1.35 0.01 0.71 0.02 1.28 0.00 -0.06 0.01 1.05 -0.01 -1.35 0.01 0.48 0.02 1.05 GROW_PTi,t -0.12 -0.80 -0.14 -0.72 -0.01 -1.48 -0.09 -0.62 -0.05 -0.55 -0.12 -0.80 -0.14 -0.72 -0.01 -1.48 -0.04 -0.30 -0.05 -0.59
SRi,t 0.05 2.12 a 0.02 2.19 a 0.03 1.66 c 0.02 1.67 a 0.03 1.90 b 0.05 2.12 a 0.02 2.18 a 0.03 1.66 c 0.02 1.59 0.03 1.83 b
ATRi,t 0.16 1.20 0.01 0.64 0.00 -0.72 0.07 1.06 0.29 6.86 a 0.16 1.20 0.01 0.64 0.00 -0.72 0.07 1.00 0.29 7.23 a
TAX_CLTLi,t 0.42 0.47 0.99 1.29 0.10 0.17 0.78 1.39 1.42 3.06 a 0.42 0.47 0.99 1.30 0.10 0.17 0.86 1.44 1.50 3.21 a
CFVi,t -0.48 -1.41 -3.63 -1.33 -4.14 -2.23 a -1.92 -0.89 -6.70 -2.20 a -5.47 -1.40 -3.64 -1.33 -4.14 -2.23 a -2.17 -0.94 -7.39 -2.33 a
PROFi,t 0.32 1.37 0.12 1.16 0.04 0.87 0.03 0.78 -0.04 -0.31 0.32 1.37 0.12 1.17 0.04 0.87 0.04 1.06 -0.04 -0.31
BETAi,t 0.48 0.46 -0.32 -0.67 0.42 1.64 -0.11 -0.20 0.57 1.39 0.48 0.45 -0.34 -0.71 0.42 1.64 -0.29 -0.52 1.02 3.02 a
SIZEi,t 0.00 -0.10 0.06 1.85 a 0.04 1.42 0.07 2.00 a 0.01 0.33 0.00 -0.10 0.06 1.85 c 0.04 1.42 0.06 1.90 b 0.01 0.33 CVAi,t 0.08 0.41 -0.29 -1.60 -0.14 -0.93 0.04 0.24 -0.11 -0.63 0.08 0.41 -0.29 -1.59 -0.14 -0.93 0.08 0.47 -0.10 -0.63
AGEi,t 0.05 0.99 0.08 1.65 a 0.02 0.47 -0.09 -1.11 0.05 1.02 0.05 0.99 0.08 1.65 0.02 0.47 -0.10 -1.29 0.04 0.79
LTDi,t -0.15 -0.46 -0.07 -0.32 -0.35 -2.21 a -0.16 -0.66 -0.11 -0.67 -0.15 -0.46 -0.07 -0.34 -0.35 -2.21 a -0.16 -0.68 -0.12 -0.77
SLACKi,t 1.28 0.96 -1.32 -0.47 1.66 1.86 b -1.15 -0.38 -3.69 -1.10 -0.18 -1.37 0.30 3.30 a 6.66 1.86 b 0.66 1.34 -0.74 -2.17 a
Adj R-sqr 0.64 0.59 0.49 0.43 0.60 0.69 0.61 0.49 0.48 0.63 No. of Obs 109 133 121 125 115 133 150 155 159 146
This Table 1.7 presents individual year regression by employing Model II. The definition of independent and dependent variables are defined earlier. Dependent and independent variables are defined as per Table 5.6. The following model has been used. a, b and c are the statistical significance level for 1%, 5% and 10% respectively.
*, 0 1 , 2 , 3 , 4 , 5 , 6 , 7 , 8 , 9 , 10 ,
11 , 12 , 13 , 14 , 15 , 16 , 17
_ _ _
i t i t i t i t i t i t i t i t i t i t i t
i t i t i t i t i t i t
C D IV E R F X P R A G C F C F G R O W M B G R O W P T SR A T R T A X C L T LC F V P R O F B E T A SIZ E C V A A G E L T D
β β β β β β β β β β β
β β β β β β β
= + + + + + + + + + +
+ + + + + + + , 18 , ,i t i t i tSL A C Kβ ε+ +
Table 76 Individual yearly effect on cash dividend and total dividend determinants for Australian firms
7 CONCLUSION This chapter documents the determinants of dividend payout for a sample of 1254 Australian
multinational and 994 domestic corporations over a 10-year period to 2004. It is reported that
Australian multinationals have higher cash dividend and total dividend (cash and share
repurchase) payout than Australian DCs. The determining factors for cash dividend and total
dividend are not similar across DCs and MCs. The results indicate that the determinants of
cash dividend payout ratios for Australian DCs include diversification, stock return, tax
clientele, cash flow variation, profitability, firm-specific risks, firm size and financial slack .
These variables also significantly explain total dividend payout ratios for DCs. For
multinational corporations the determinants of cash dividend payout are tax clientele,
profitability, collateral value of assets and leverage (when dependent variable is measured as of
dividend payment to earnings). We also report that the determining factors vary between DCs
and MCs although multinationality of a firm indicated that MCs have relatively higher
dividend payout ratios; however, the result is not significant. The results also show that
diversification, profitability, firm-specific risk, size, collateral value of assets and financial
slack are the significant variables that explain the difference in cash dividend payout ratios
while tax clientele, cash flow variability and financial slack explain the difference between
Australian DCs’ and MCs’ share repurchase mode of dividend payments. After controlling for
industry and time effect, the majority of the initial explanatory factors in explaining dividend
payouts remain unchanged for both DCs and MCs regardless of different measurements of
dividend payout dependent variable. The only industry that has a significant negative impact
in the reduction of cash and cash and share repurchase type of dividend payout ratios is the
transportation and communication industry. Further, the time variation effect shows that both
DCs’ and MCs’ cash and total dividend has, on average, decreased over the last 10 years.
However, the magnitudes of decrease between cash payment and share repurchase are not
similar across DCs and MCs. Further, these results are robust to various tests of sensitivity for
statistical bias or measurement issues. Finally, the results are also insensitive to endogeneity
between leverage and dividend decisions.
34