dividend growth- creating lifetime income & inflation protection chris henderson aams® vice...
TRANSCRIPT

DIVIDEND GROWTH-DIVIDEND GROWTH-
CREATING LIFETIME INCOME & CREATING LIFETIME INCOME & INFLATION PROTECTIONINFLATION PROTECTION
Chris Henderson AAMS®
Vice President, Investments
Wedbush Securities
14851 N. Scottsdale Rd. #201
Scottsdale, AZ 85254
Member NYSE/FINRA/SIPC

Presentation GoalsPresentation Goals
Learn a strategy to create a low cost, Learn a strategy to create a low cost, personal, income stream.personal, income stream. Discuss common long-term income investments.Discuss common long-term income investments. Show the impact of annual dividend growth.Show the impact of annual dividend growth. Compare dividends and coupon payments over time.Compare dividends and coupon payments over time. Discuss the impact of compounding interest and Discuss the impact of compounding interest and
dividend reinvestment.dividend reinvestment. Identify qualifying stocks using a systematic, rules Identify qualifying stocks using a systematic, rules
based approach.based approach.

The 20 Year Bond BullThe 20 Year Bond Bull

How Far we’ve FallenHow Far we’ve Fallen10 Year Treasury Rates10 Year Treasury Rates

Look to JapanLook to Japan10 Year Japanese Yields10 Year Japanese Yields

JapanJapan
Financial led crisisFinancial led crisis Slowing GDPSlowing GDP Increasing elderly populationIncreasing elderly population Entitlement issuesEntitlement issues
Sound Familiar?Sound Familiar?

Bond Price vs. YieldBond Price vs. Yield

Bond Risk MeasureBond Risk Measure
Duration – How sensitive a fixed income Duration – How sensitive a fixed income investment is to changes in interest rates.investment is to changes in interest rates.
For every 1% change in rates you can expect For every 1% change in rates you can expect your income investment to change by the your income investment to change by the duration.duration.• Duration = 8, Every 1% move in rates should affect Duration = 8, Every 1% move in rates should affect
your investment value by 8%.your investment value by 8%.

Current Interest Rate EnvironmentCurrent Interest Rate Environment
Long-term TreasuryLong-term Treasury Duration = 16.92 / Yield 2.84%Duration = 16.92 / Yield 2.84%
Intermediate-term TreasuryIntermediate-term Treasury Duration 7.55 / Yield 2.71%Duration 7.55 / Yield 2.71%
Total Bond IndexTotal Bond Index Duration 5.3 / Yield 1.71%Duration 5.3 / Yield 1.71%
Municipal IndexMunicipal Index Duration 6.6 / Yield 2.14%Duration 6.6 / Yield 2.14%
Represented by Vanguard Funds 3/20/2013

A Low Cost, Self-Directed Alternative A Low Cost, Self-Directed Alternative to Lifetime Income & Inflation to Lifetime Income & Inflation
ProtectionProtection

Is There an Income Building Strategy That Makes Is There an Income Building Strategy That Makes Sense & Works?Sense & Works? An investment program that is rules based, easy to An investment program that is rules based, easy to
implement and manage, and has a high probability of implement and manage, and has a high probability of succeeding.succeeding.
An approach that can serve as your primary income An approach that can serve as your primary income producing portfolio.producing portfolio.
• An approach for savers and builders.An approach for savers and builders.• A methodical accumulation of capital through a sensible and A methodical accumulation of capital through a sensible and
disciplined approach.disciplined approach.• An approach that allows you to become an actual investor of An approach that allows you to become an actual investor of
real companies with real earnings.real companies with real earnings.
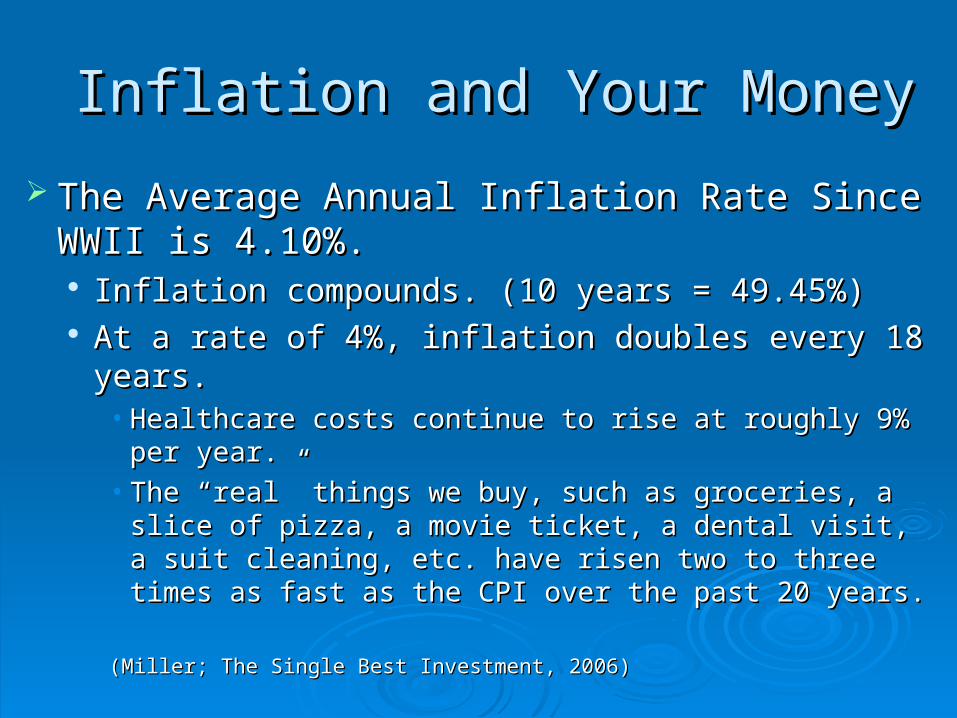
Inflation and Your MoneyInflation and Your Money
The Average Annual Inflation Rate Since WWII The Average Annual Inflation Rate Since WWII is 4.10%.is 4.10%. Inflation compounds. (10 years = 49.45%)Inflation compounds. (10 years = 49.45%) At a rate of 4%, inflation doubles every 18 years.At a rate of 4%, inflation doubles every 18 years.
• Healthcare costs continue to rise at roughly 9% per year.Healthcare costs continue to rise at roughly 9% per year.• The “real” things we buy, such as groceries, a slice of The “real” things we buy, such as groceries, a slice of
pizza, a movie ticket, a dental visit, a suit cleaning, etc. pizza, a movie ticket, a dental visit, a suit cleaning, etc. have risen two to three times as fast as the CPI over the have risen two to three times as fast as the CPI over the past 20 years.past 20 years.
(Miller; The Single Best Investment, 2006)(Miller; The Single Best Investment, 2006)

The Myth About Bonds…The Myth About Bonds… The Fed tightly controlled interest rates until 1978, in The Fed tightly controlled interest rates until 1978, in
1978 they decided to let interest rates float.1978 they decided to let interest rates float. Average annual volatility has almost doubled since that time.Average annual volatility has almost doubled since that time.
Bonds as an Bonds as an investmentinvestment lack 2 major benefits of stocks. lack 2 major benefits of stocks. Dividend growth & Capital growthDividend growth & Capital growth
Bonds as a Bonds as a savingssavings vehicle offer 2 major benefits stocks vehicle offer 2 major benefits stocks don’t.don’t. Generally, payment of principal if held to maturity & regular Generally, payment of principal if held to maturity & regular
periodic income payments.periodic income payments.
Question.......How Do Bonds Fit Into Your Portfolio?Question.......How Do Bonds Fit Into Your Portfolio?
*Investing involves risk, including possible loss of principal. This information should *Investing involves risk, including possible loss of principal. This information should not be relied upon as investment advice or recommendations. Additional disclosures not be relied upon as investment advice or recommendations. Additional disclosures are provided on pageare provided on page

Stocks and RiskStocks and Risk
Risk does not necessarily equal loss.Risk does not necessarily equal loss.
The notion of risk is actually a notion of volatility. The notion of risk is actually a notion of volatility. (How much an investments fluctuates over a given (How much an investments fluctuates over a given period)period)
The issue of losing The issue of losing allall of your money of your money foreverforever may may not be the right understanding of risk.not be the right understanding of risk.

The Hidden Key To a Proper Income The Hidden Key To a Proper Income InvestmentInvestment
Dividend GrowthDividend Growth Stable, profitable companies pay dividends from Stable, profitable companies pay dividends from
earnings, sharing part of the profits with investors.earnings, sharing part of the profits with investors. Dividends and dividend growth are good indicators Dividends and dividend growth are good indicators
of a company’s earnings.of a company’s earnings.• Companies can tell you how well they are doing or they Companies can tell you how well they are doing or they
can show you.can show you. Many companies raise their dividend every year.Many companies raise their dividend every year.
• Dividend growth will serve you for many years.Dividend growth will serve you for many years.

Dividend GrowthDividend Growth
Dividend Growth is an authoritative force that Dividend Growth is an authoritative force that may compel higher returns regardless of other may compel higher returns regardless of other factors of the market.factors of the market. An instrument that produces income is often An instrument that produces income is often
valued based on the amount of income it produces. valued based on the amount of income it produces. (Price vs. Yield)(Price vs. Yield)
You may receive increasing income You may receive increasing income andand the the probability of a higher stock price over time.probability of a higher stock price over time.
• You get the income that may increase and the effect that You get the income that may increase and the effect that rising income might have on the price, which in normal rising income might have on the price, which in normal market conditions, may be to drive the price higher over market conditions, may be to drive the price higher over time.time.

The Eighth Wonder…..The Eighth Wonder…..
Compounding ReturnsCompounding Returns
Compounding is the money that money makes, Compounding is the money that money makes, added to the money that money has already made.added to the money that money has already made.
Each time money makes money, it becomes capable Each time money makes money, it becomes capable of making more money.of making more money.
ExamplesExamples
Dividend Growth v. Coupon Payments – 5% Dividend Growth v. Coupon Payments – 5% annual dividend growth with no change in annual dividend growth with no change in principal valueprincipal value
Dividend Growth v. Coupon Payments – 5% Dividend Growth v. Coupon Payments – 5% annual dividend growth with equal 5% annual annual dividend growth with equal 5% annual increase in principal valueincrease in principal value

Dividend Growth v. Coupon PaymentsDividend Growth v. Coupon Payments(Dividends as cash)(Dividends as cash)
Stock A - 4% dividend with 5% growth rateStock A - 4% dividend with 5% growth rate Bond A - 4% CouponBond A - 4% Coupon
ValueValue DividendDividend Total IncomeTotal Income ValueValue CouponCoupon Total IncomeTotal Income
$100,000 $100,000 $4,000$4,000 $4,000$4,000 $100,000 $100,000 $4,000$4,000 $4,000$4,000
$100,000$100,000 $4,200$4,200 $8,2,0$8,2,0 $100,000$100,000 $4,000$4,000 $8,000$8,000
$100,000$100,000 $4,410$4,410 $12,610$12,610 $100,000$100,000 $4,000$4,000 $12,00$12,00
$100,000$100,000 $4,630$4,630 $17,240$17,240 $100,000$100,000 $4,000$4,000 $16,000$16,000
$100,000$100,000 $4,860$4,860 $22,100$22,100 $100,000$100,000 $4,000$4,000 $20,000$20,000
$100,000$100,000 $5,110$5,110 $27,210$27,210 $100,000$100,000 $4,000$4,000 $24,000$24,000
$100,000$100,000 $5,360$5,360 $32,570$32,570 $100,000$100,000 $4,000$4,000 $28,000$28,000
$100,000$100,000 $5,630$5,630 $38,200$38,200 $100,000$100,000 $4,000$4,000 $32,000$32,000
$100,000$100,000 $5,910$5,910 $44,110$44,110 $100,000$100,000 $4,000$4,000 $36,000$36,000
$100,000$100,000 $6,210$6,210 $50,320$50,320 $100,000$100,000 $4,000$4,000 $40,000$40,000
IncomeIncome $50,032$50,032 IncomeIncome $40,000$40,000
CumulativeCumulative 50.32%50.32% CumulativeCumulative 40%40%
Avg. AnnualAvg. Annual 5.03%5.03% Avg. AnnualAvg. Annual 4%4%
(Hypothetical example before taxes and fees, assuming no growth in share price. For illustrative purposes only)

Dividend Growth v. Coupon PaymentsDividend Growth v. Coupon Payments(Stock growth at 5%, Dividends as cash)(Stock growth at 5%, Dividends as cash)
Stock A - 4% dividend with 5% growth rateStock A - 4% dividend with 5% growth rate Bond A - 4% CouponBond A - 4% Coupon
ValueValue DividendDividend Total IncomeTotal Income ValueValue CouponCoupon Total IncomeTotal Income
$100,000$100,000 $4,000$4,000 $4,000$4,000 $100,000 $100,000 $4,000$4,000 $4,000$4,000
$105,000$105,000 $4,200$4,200 $8,2,0$8,2,0 $100,000$100,000 $4,000$4,000 $8,000$8,000
$110,250$110,250 $4,410$4,410 $12,610$12,610 $100,000$100,000 $4,000$4,000 $12,00$12,00
$115,760$115,760 $4,630$4,630 $17,240$17,240 $100,000$100,000 $4,000$4,000 $16,000$16,000
$121,550$121,550 $4,860$4,860 $22,100$22,100 $100,000$100,000 $4,000$4,000 $20,000$20,000
$127,620$127,620 $5,110$5,110 $27,210$27,210 $100,000$100,000 $4,000$4,000 $24,000$24,000
$134,000$134,000 $5,360$5,360 $32,570$32,570 $100,000$100,000 $4,000$4,000 $28,000$28,000
$140,700$140,700 $5,630$5,630 $38,200$38,200 $100,000$100,000 $4,000$4,000 $32,000$32,000
$147,730$147,730 $5,910$5,910 $44,110$44,110 $100,000$100,000 $4,000$4,000 $36,000$36,000
$155,120$155,120 $6,210$6,210 $50,320$50,320 $100,000$100,000 $4,000$4,000 $40,000$40,000
IncomeIncome $50,320$50,320 IncomeIncome $40,000$40,000
Cap. GainCap. Gain $55,120$55,120 Cap. GainCap. Gain $0$0
TotalTotal $105,440$105,440 TotalTotal $40,000$40,000
CumulativeCumulative 105.44%105.44% CumulativeCumulative 40%40%
Avg. AnnualAvg. Annual 7.47%7.47% Avg. AnnualAvg. Annual 4%4%
(Hypothetical example before taxes and fess, assuming annual 5% growth of shares. For illustrative purposes only)

Recap….Recap…. In our examples we saw dividend income grow from In our examples we saw dividend income grow from
$4,000 to $6,210 over a 10 year period.$4,000 to $6,210 over a 10 year period. A 55.25% increase in incomeA 55.25% increase in income
Bond interest remained level at $4,000 per year.Bond interest remained level at $4,000 per year. At 4.10%, inflation would have risen 49.45%.At 4.10%, inflation would have risen 49.45%.
• What happened to your purchasing power?What happened to your purchasing power?
Principal value grew 55% over the 10 year period.Principal value grew 55% over the 10 year period. Assuming “normal” P/E multiples, interest rates, and market Assuming “normal” P/E multiples, interest rates, and market
cycles, the value of the investment producing income may rise, cycles, the value of the investment producing income may rise, over time, at a rate similar to that of the income it produces.over time, at a rate similar to that of the income it produces.
(Examples for illustrative purposes only, actual results may vary)(Examples for illustrative purposes only, actual results may vary)

Investing For Future IncomeInvesting For Future Income
Use Dividend Growth to build a structure using Use Dividend Growth to build a structure using bricks that make new bricks…..and those bricks that make new bricks…..and those bricks in turn make new bricks.bricks in turn make new bricks. Dividends get reinvested in more shares, which Dividends get reinvested in more shares, which
themselves yield dividends to be invested in yet themselves yield dividends to be invested in yet more shares.more shares.
Each share pays a dividend that may continue to Each share pays a dividend that may continue to increase.increase.
Eventually you have 2 shares for every 1 you Eventually you have 2 shares for every 1 you started with, then three, then four, and on and on.started with, then three, then four, and on and on.

Reinvested v. Non-Reinvested DividendsReinvested v. Non-Reinvested Dividends(Stock growth at 5%)(Stock growth at 5%)
4% cash dividend with 5% growth rate4% cash dividend with 5% growth rate 4% reinvested dividend with 5% growth rate4% reinvested dividend with 5% growth rate
ValueValue DividendDividend Total IncomeTotal Income ValueValue DividendDividend Cap. GainsCap. Gains Total ValueTotal Value
$100,000$100,000 $4,000$4,000 $4,000$4,000 $100,000$100,000 $4,060$4,060 $5,203$5,203 $109,263$109,263
$105,000$105,000 $4,200$4,200 $8,200$8,200 $109,263$109,263 $4,437$4,437 $5,685$5,685 $119,385$119,385
$110,250$110,250 $4,410$4,410 $12,610$12,610 $119,385$119,385 $4,848$4,848 $6,254$6,254 $130,486$130,486
$115,760$115,760 $4,630$4,630 $17,240$17,240 $130,486$130,486 $5,296$5,296 $6,801$6,801 $142,583$142,583
$121,550$121,550 $4,860$4,860 $22,100$22,100 $142,583$142,583 $5,784$5,784 $7,443$7,443 $155,810$155,810
$127,620$127,620 $5,110$5,110 $27,210$27,210 $155,810$155,810 $6,329$6,329 $8,126$8,126 $170,265$170,265
$134,000$134,000 $5,360$5,360 $32,570$32,570 $170,265$170,265 $6,908$6,908 $8,852$8,852 $186,025$186,025
$140,700$140,700 $5,630$5,630 $38,200$38,200 $186,025$186,025 $7,551$7,551 $9,623$9,623 $203,200$203,200
$147,730$147,730 $5,910$5,910 $44,110$44,110 $203,200$203,200 $8,248$8,248 $10,587$10,587 $222,035$222,035
$155,120$155,120 $6,210$6,210 $50,320$50,320 $222,035$222,035 $9,018$9,018 $11,612$11,612 $242,665$242,665
IncomeIncome $50,320$50,320 DividendsDividends $62,479$62,479
Cap. GainCap. Gain $55,120$55,120 Cap. GainsCap. Gains $80,186$80,186
TotalTotal $105,440$105,440 Total ReturnTotal Return $142,665$142,665
CumulativeCumulative 105.44%105.44% CumulativeCumulative 142.66%142.66%
Avg. AnnualAvg. Annual 7.47%7.47% Avg. AnnualAvg. Annual 9.27%9.27%
(Hypothetical example before taxes and fees, assuming an annual 5% growth of shares. For illustrative purposes only)

Reinvested DividendsReinvested Dividends Dividend growth may offer a great benefit when Dividend growth may offer a great benefit when
given time.given time. A 55.25% increase in income compared to bond interest over a 10 A 55.25% increase in income compared to bond interest over a 10
year period.*year period.*
Compounding with reinvested dividends may Compounding with reinvested dividends may offer an even greater benefit over time.offer an even greater benefit over time. A 125% increase in income compared to bond interest over a 10 A 125% increase in income compared to bond interest over a 10
year period.*year period.* A 45% increase in income compared to cash dividends over a 10 A 45% increase in income compared to cash dividends over a 10
year period.*year period.*
(Using our hypothetical examples, results may vary)(Using our hypothetical examples, results may vary)
Creating Your Personal Income MachineCreating Your Personal Income Machine
The Rules – How to pick your stocks.The Rules – How to pick your stocks. Low Debt – A company needs to make money Low Debt – A company needs to make money
without heavy financing needs.without heavy financing needs.• Interest payments have priority over dividends. It’s Interest payments have priority over dividends. It’s
nearly impossible to raise your dividend if there are nearly impossible to raise your dividend if there are other substantial obligations that have priority.other substantial obligations that have priority.
• Debt/capitalization ratio should be low.Debt/capitalization ratio should be low. Earnings growth – At least as great as the dividend Earnings growth – At least as great as the dividend
growth you expect.growth you expect.

High Dividend Yield – At least 1.5X the S&P 500.High Dividend Yield – At least 1.5X the S&P 500. Growth of Dividend – A minimum of 5% annual Growth of Dividend – A minimum of 5% annual
average.average. Price/Sales Ratio – How many dollars of sales do Price/Sales Ratio – How many dollars of sales do
you get for each dollar of price.you get for each dollar of price.• Should be as low as possible.Should be as low as possible.• Numerous studies have shown this ratio to be among the Numerous studies have shown this ratio to be among the
most useful of fundamental valuation tools.most useful of fundamental valuation tools. Going back to 1952, an investment in the 50 stocks with the Going back to 1952, an investment in the 50 stocks with the
lowest P/S ratios nearly quadrupled the return form the market lowest P/S ratios nearly quadrupled the return form the market as a whole. as a whole. (What Works on Wall Street, 1996)(What Works on Wall Street, 1996)

P/E Ratio – Less than or equal to the P/E of the P/E Ratio – Less than or equal to the P/E of the S&P 500 or another value deemed appropriate.S&P 500 or another value deemed appropriate.
Cash Flow – Should be positive.Cash Flow – Should be positive. Price – Should be in a bullish trend above its Price – Should be in a bullish trend above its
support level.support level. Relative Strength – Should be positive when Relative Strength – Should be positive when
compared to the market.compared to the market.

Risks and Important DisclosuresRisks and Important DisclosuresThis presentation is for general information purposes only and should not be This presentation is for general information purposes only and should not be construed as specific tax or investment advice. It does not constitute an construed as specific tax or investment advice. It does not constitute an offer, solicitation, or recommendation regarding securities and is not offer, solicitation, or recommendation regarding securities and is not intended to predict or depict performance of any investment. There is no intended to predict or depict performance of any investment. There is no guarantee that any investment strategy will meet a stated objective or goal. guarantee that any investment strategy will meet a stated objective or goal. Hypothetical illustrations are based on underlying assumptions; your actual Hypothetical illustrations are based on underlying assumptions; your actual results may vary. Past performance does not guarantee future results. results may vary. Past performance does not guarantee future results. Indices are unmanaged and cannot be invested into directly. Indices are unmanaged and cannot be invested into directly.
The material has been prepared by the individual author and is intended The material has been prepared by the individual author and is intended only to provide observations and views of the individual author and may not only to provide observations and views of the individual author and may not necessarily reflect those of Wedbush Securities. Observations and views necessarily reflect those of Wedbush Securities. Observations and views expressed herein were based on data available at the time of publication expressed herein were based on data available at the time of publication and such observations and views may be changed by the individual author and such observations and views may be changed by the individual author at any time without notice. at any time without notice.

Risks and Important DisclosuresRisks and Important DisclosuresInvesting involves risk; principal loss is possible. Certain investments are not Investing involves risk; principal loss is possible. Certain investments are not suitable for all investors, may involve a high degree of risk that may include suitable for all investors, may involve a high degree of risk that may include substantial risk of loss, and are intended for investors capable of substantial risk of loss, and are intended for investors capable of understanding and assuming the risks involved. All strategies are not understanding and assuming the risks involved. All strategies are not appropriate at all times.appropriate at all times.
Bonds or fixed income securities are subject to credit risk, market risk and Bonds or fixed income securities are subject to credit risk, market risk and interest rate risk. The value of and income generated by debt securities will interest rate risk. The value of and income generated by debt securities will decrease or increase based on changes in market interest rates, the credit decrease or increase based on changes in market interest rates, the credit quality of issuers and general economic and market conditions. As interest quality of issuers and general economic and market conditions. As interest rates rise, bond prices fall. Credit risk refers to an issuer’s ability to make rates rise, bond prices fall. Credit risk refers to an issuer’s ability to make interest and principal payments when due. High yield or lower rated bonds interest and principal payments when due. High yield or lower rated bonds carry heightened credit risk and potential for default. Investors investing in carry heightened credit risk and potential for default. Investors investing in municipal securities should contact their tax advisor regarding the suitability municipal securities should contact their tax advisor regarding the suitability of tax-exempt investments in their portfolio. If sold prior to maturity, of tax-exempt investments in their portfolio. If sold prior to maturity, municipal securities are subject to gain/losses based on the level of interest municipal securities are subject to gain/losses based on the level of interest rates, market conditions and the credit quality of the issuer. Income may be rates, market conditions and the credit quality of the issuer. Income may be subject to the alternative minimum tax (AMT) and/or state and local taxes, subject to the alternative minimum tax (AMT) and/or state and local taxes, based on state of residence. based on state of residence.

Risks and Important DisclosuresRisks and Important Disclosures
The statements contained in this presentation contains information from The statements contained in this presentation contains information from third party sources believed to be reliable but are not guaranteed as to third party sources believed to be reliable but are not guaranteed as to accuracy and not intended to be all inclusive. accuracy and not intended to be all inclusive.
Wedbush Securities Inc. is Member NYSE/FINRA/SIPC.Wedbush Securities Inc. is Member NYSE/FINRA/SIPC.

Chris Henderson AAMSVice President, Investments
Wedbush Securities602-332-5252/480-778-8572