diversity on cultural boards: implications for organizational value … · · 2014-01-01diversity...
TRANSCRIPT
Diversity on Cultural Boards: Implications for Organizational Value and Impact*
Working Paper
Francie Ostrower, Ph.D. University of Texas at Austin
*The author gratefully acknowledges support for this study from the National Endowment for the Arts and additional support from the University of Texas at Austin. The data used in this study were originally collected as part of the 2005 Urban Institute National Survey of Nonprofit Governance. Permission to use the data by the Urban Institute is gratefully acknowledged.
This project was supported in part or in whole by an award from the Research: Art Works program at the National Endowment for the Arts: Grant# 12-3800-7001. The opinions expressed in this paper are those of the author(s) and do not represent the views of the Office of Research & Analysis or the National Endowment for the Arts. The NEA does not guarantee the accuracy or completeness of the information included in this report and is not responsible for any consequence of its use.

1
Diversity on Cultural Boards: Implications for Organizational Value and Impact
Francie Ostrower, Ph.D. University of Texas at Austin
Abstract
What is the racial and ethnic composition of arts boards? What factors are associated with variations in board diversity? The study addresses these questions through an analysis of over 400 arts organizations, using data from the 2005 Urban Institute National Survey of Nonprofit Governance. While our primary focus is on the racial and ethnic composition of arts boards, attention is also given to gender, occupation, and age, as well as to comparisons between the arts and other fields of activity. The study extends current lines of research on arts participation to encompass membership on boards, offers conclusions about the current state of diversity (or lack of it) on boards, identifies implications for enhancing diversity, and offers suggestions for future research.
2
Diversity on Cultural Boards: Implications for Organizational Value and Impact
Since the 1960s, cultural organizations, funders, and policymakers, have increasingly emphasized the importance of racial and ethnic diversity (DiMaggio and Ostrower 1992; DiMaggio 2000; Ostrower 2007a). Given the growing diversity of the United States population, it is an issue that has significant ramifications for organizational sustainability, legitimacy, and the relationship of the arts to civic engagement in the broader society.
To the extent that cultural organizations engage a wider variety of groups their opportunity for value and impact is enhanced. So too is the opportunity for the value and impact of the arts themselves, which are increasingly seen as having significant civic and social, as well as aesthetic values. While arts and cultural organizations are by no means the sole venues for engagement with the arts, they are an important one. To the extent that they do not engage a diverse constituency, the likelihood that the art they present will help promote bridges across social boundaries, and build social capital and civic engagement, is reduced.
This study examines racial and ethnic diversity with respect to one specific component of arts and cultural organizations, namely their boards of directors. In doing so, it extends and enlarges the current line of research and policy interest in arts participation. As Tepper and Gao (2008) note, much of the discussion about cultural participation has focused on attendance. More recently, Novak-Leonard and Brown (2011) highlight the multi-modal nature of participation, to include arts creation and participation through media. Our study focuses on participation through membership on boards of arts and cultural organizations – where organizational policy is made. While our focus is on racial and ethnic diversity, we turn at the end to also consider board composition with respect to gender, occupation, and age. In the course of the analysis, comparisons are also made between the arts and other types of nonprofit organizations.
This study was supported through the inaugural National Endowment for the Arts research grants initiative, which funded research using pre-existing data. Data for this study were drawn from the 2005 Urban Institute National Survey of Nonprofit Governance (Ostrower 2007b), of which the author served as principal investigator. The dataset, described in greater detail in the next section, includes over 5,000 nonprofit organizations in different fields. Of these, we focus on data on the boards of the 438 arts, culture, and humanities organizations, the subject of this study. The survey is a rich source of data on a large number of boards. However, it was not designed to specifically analyze the present subject – arts organizations and board diversity – and this should be kept in mind. Accordingly, much of the following discussion – particularly with respect to correlates of diversity – is offered in an exploratory spirit, identifying suggestive leads and connections that warrant further research.
3
Our analysis of these 438 arts organizations was guided by two overarching questions:
• What is the racial and ethnic composition of these arts boards?
• What factors appear to be associated with variations in board diversity?
We found high and widespread levels of racial and ethnic homogeneity among these arts boards. In examining correlates of diversity (or lack thereof) we address the following group of factors:
• Community and audience demographics
• Organizational attributes
• Importance placed by the organization on board diversity
• Cultural content
While some of the correlates of board diversity identified (e.g., community demographics) are beyond an organization’s control, we did find others over which organizations have discretion. The conclusion of this paper discusses the implications of these findings for strategies arts organizations may pursue to help enhance their own board’s diversity.
The Study: Sample and Data
As noted above, this analysis was funded by the inaugural National Endowment for the Arts’ initiative to award grants for arts research employing pre-existing data. For this study, we analyze data originally collected as part of the 2005 Urban Institute National Survey of Nonprofit Governance, of which the author was principal investigator (Ostrower 2007b). This survey was the first national representative study of nonprofit governance in the United States. It was administered to a stratified random sample of nonprofit organizations drawn from the Urban Institute’s NCCS-Guidestar National Nonprofit Research Database of public charities that filed Internal Revenue Service Form 990. Therefore, all potential sample members had at least $25,000 in annual receipts, the threshold for the filing requirement at that time. We stratified the sample by size, measured as annual expenditures, to ensure adequate numbers of large organizations for analysis. Therefore, descriptive analyses using these data are based on analyses weighted to adjust for differential probabilities of selection by size as well as non-response patterns, except when otherwise noted, or when analyses are already broken down by size. We received responses from 5,115 nonprofits, a response rate of 41 percent. The survey was administered by mail, or could also be taken online (For a full discussion of sampling and weighting procedures see Triplett and Ostrower 2007; for the survey instrument, see Ostrower 2007c).

In this report, we focus on the 438 respondents that identified their primary program area as “arts, culture, and humanities” and that provided responses to all four questions about the board’s racial and ethnic composition (see Appendix A). Thus, we defined arts, culture, and humanities organizations in a broad fashion (versus, for instance, “fine arts”). At times during the discussion, we also draw on the full dataset of over 5,000 organizations in order to compare the board composition of these arts organizations with those of nonprofits in other fields of activity. Among the benefits of this survey is that it includes a varied and large number of arts organizations. The 438 arts organizations range in size from under $100,000 to institutions with budgets of over $10 million (see Figure 1).
Under $100k$100‐500k$500k‐2 million $2‐10 millionOver $10 million
Figure 1 Distribution of Arts and Cultural Organizations in Report by Annual Expenditures (Unweighted)
The organizations work in a range of artistic fields, including performing arts, visual arts, historical societies and museums, media and film, arts commissions, art centers, fundraising support organizations, arts councils and others. Some are community organizations while others are professional arts organizations. Figure 2 shows the distribution of the organizations by
4

artistic subfield, breaking out subfields with 20 or more organizations.1 Organizational subfields reflect categorization under the National Taxonomy of Exempt Entities codes. 2
The survey is a rich source of data on boards among a large and varied set of arts organizations. However, it bears repeating that the study was not designed to specifically analyze the present subject – arts organizations and board diversity – and this should be kept in mind. Toward that end, much of the present analyses are offered in an exploratory spirit, with the aim of identifying leads for future research that is designed to explore this specific topic.
Art Museums
Other Museums
Hist. Mus/Societies
Dance
Media
Music
Theaters
Fundraising
Other
Figure 2 Distribution of Organizations in the Report by Subfield (Unweighted)
For the purposes of the current report, we further supplemented these survey data. We merged in county-level Census data3 to permit analysis of board demographics in relationship to
1 The numbers of organizations by subfield are: Art Museums (n=20); Historical museums and societies (n=66); Other museums (n=23); Dance companies (N=23); Media (n=36); Music (n=71); Theaters (n=59): Fundraising and support (n=32); and “Other” (107). The “other” category includes a variety of organizations such as performing arts centers, visual arts organizations other than museums, professional societies, arts education, and arts and humanities councils. The level of specificity was determined by the number of organizations in the sample. For instance, we were able to distinguish “art museums” from museums because there were 20 available, but this was not the case for any particular types of dance or musical organizations.
2 The National Taxonomy of Exempt Entities (NTEE) system is used by the IRS and National Center for Charitable Statistics (NCCS) to classify nonprofit organizations (http://www.nccs.urban.org/classification/NTEE.cfm). Codes had already been merged into the original dataset. For this study, the codes that were assigned to the 438 arts organizations were carefully reviewed. In some cases there was a question about the potential accuracy of that code. In addition to consulting the organization’s open-ended response to a question about its activities, we consulted the organization’s website, and verified the current NTEE code. Based on the results, a determination was made as to whether the code needed to be corrected.
5
6
community demographics. We also created a new dichotomous variable to indicate whether the organization’s purpose includes an explicit focus on art or artists of a particular ethnic heritage, and/or an explicit focus on multi-ethnic traditions or multi-culturalism. For instance, an organization that described itself as dedicated to presenting dance by African-American artists, or to celebrating Irish heritage, would be coded as a ‘1’ or ‘yes’. However, an organization dedicated to blues music (but that made no reference to African-American culture), or an organization dedicated to the work of James Joyce (but that made no reference to Irish culture), would be coded as a ‘0’ or ‘no’.
Data used to create this variable came from: internet websites (every organization was looked up); responses to an open-ended question on the survey about organization type; and organization names. Thirty-one of the 438 organizations were categorized as dedicated to presenting or preserving art or artists associated with a particular ethnic group and/or multi-culturalism.4 This was done to explore whether such organizations might have a higher percentage of members of minority groups on their boards.
Our current analysis, of board composition, is based on questions in the survey: Respondents were asked to indicate how many of their board members are: Hispanic/Latino; White (non-Hispanic); African-American or Black (non-Hispanic); and Other. Those writing in a number for “Other” were further asked to “Please specify” and provided with a line to write in an open-ended response. (For a fuller discussion of these questions and responses to them, see Appendix A of this report). As we shall see, boards were overwhelmingly composed of white members. The numbers in the African-American, Hispanic/Latino, and Other categories were too small to permit separate statistical analyses and are therefore aggregated into a single category for statistical analyses. An important area for future research is to conduct studies with samples that permit analyses on board representation of these and other individual groups. Although we cannot conduct statistical analyses of that type, we do break out the small number of organizations that had higher percentages of African-American and Hispanic members respectively, and conduct a more exploratory and qualitative analysis on these organizations. We conduct a similar exploratory analysis for organizations with higher percentages of members of Asian descent (identified by combing through responses to the open-ended write-in for the
3 2000 U.S. Census Bureau data were retrieved from Table “SE:T17. Hispanic Or Latino By Race (SF3).” Social Explorer. http://old.socialexplorer.com/pub/reportdata/htmlresults.aspx?ReportId=R10443775. Retrieved 3/09/13.
4 This seven percent figure is comparable to the 9 percent of cultural heritage organizations that Rosenstein finds in her analysis of arts, culture, and humanities organizations filing the Form 990 (Rosenstein 2006). Of the 31 organizations, eight had a self-described focus on one or more European or Eurasian cultural traditions; six on African-American or African diasporic cultural traditions; Seven were self-described as multi-cultural and/or multi-ethnic; Five focused on Asian cultural traditions; Two focused on Native American culture; Two focused on Jewish heritage (their focus was on cultural and ethnic heritage versus on religious themes); One was focused on Latino culture

7
“other” category). Our purpose here is to identify potential leads for examination in future research.
Race, Ethnicity, and Board Composition
The mean size of the arts boards in the study was 14 members (with a standard deviation of 10). On average, 91 percent of board members were white, 4 percent were African-American or black, 2 percent were Hispanic, and 3 percent were in the “Other” category. The predominance of white board members is emphasized by the fact that the median percent of white board members was 100, while the medians for all three other categories were zero. In light of the small numbers, as noted earlier, statistical analyses in the report aggregate the African-American, Hispanic, and “Other” categories into a single category.
Fully 58.7 % of the boards had only white, non-Hispanic members. Virtually every board (98 percent) had at least one white member, 26 percent had one or more African-American or Black members, 19 percent had one or more Hispanic members, and 14 percent had one or more “other” members. 5 Racial and ethnic diversity was not a widespread priority when recruiting board members: Seventy percent say that racial or ethnic diversity is “not at all” or “not too important” in the selection of new board members, while only 30 percent say it is “somewhat” or “very important.”
To this point, we have discussed “diversity” as the percent of members of ethnic or racial minorities on the board. Diversity may also be thought of in terms of the number of different racial and/or ethnic groups represented. The picture that emerges from this perspective is also one of considerable homogeneity. Most boards (just over 59 percent) are comprised of members of just one of the racial/ethnic groups, and virtually all of these are white. Twenty-seven percent of boards reported members from two of the racial/ethnic groups queried.6 In fourteen percent of cases, boards included members of three or more groups.
These figures look at arts and cultural boards as a whole. These aggregate figures, however, conceal substantial differences among arts organizations of different size, to which we now turn.
5 Among the subset of arts boards that did have at least one non-white board member, the average board was 79 percent white (with a median of 88), 5 percent Latino (median of 0), 9 percent Black/African-American (median of 6), and 7 percent other (median of 0). Thus, even when we exclude all-white boards, board composition among other organizations is still overwhelmingly white.
6 Of these, half reported having white and African-American members, and 27 percent had white and Hispanic members. Only three percent reporting a combination that did not include white members.

8
Variations by Organizational Size
Substantial differences exist among arts organizations of different size, with all-white boards being far more prevalent among smaller organizations. Fully 69 percent of the smallest organizations (those with under $100,000 in annual expenses) had boards that are all white. Among organizations with $100 to 500,000, the figure drops to 52 percent, then to 39 percent among organizations with $500,000-2 million, to 29 percent among organizations with $2-10 million, down to a low of 5 percent among the small group of organizations with annual expenses of over $10 million. Fully 70 percent of the smallest organizations have members of only one racial or ethnic group on their board. As we move up through the other size groups, that figure drops to 52 percent, 40 percent, 29 percent, and then 5 percent among the largest organizations. Conversely the percentage reporting 3 or more groups increases from a low of 8 percent among the smallest organizations up to a high of 77 percent among the largest organizations.
Keep in mind that our focus to this point has been on the minimal bar of having any non-white board members. Variation in the average percent of white board members, however, is far less marked. Thus, among organizations in the two smallest size groups, boards are on average 91 and 92 percent white respectively. The figure is 87 percent in the next two larger size groups, and drops just slightly, to 85 percent, among the largest organizations. While large organizations less often have exclusively white boards, they are still overwhelmingly white.
The question that arises, however, is why organizational size is positively related to having one or more people of color on the board? A key issue is whether the relationship reflects something about organizational size per se, or whether there are other attributes, associated with larger organizational size, that result in differences regarding board homogeneity. The answer has practical consequences for organizations seeking to increase their board’s diversity: While becoming a larger organization is not a feasible strategy, it may be that larger organizations engage in practices that could also be adopted by smaller organizations that wish to diversify their boards. Our findings suggest this is the case.
Larger organizations were more likely to consider racial or ethnic diversity as an important criterion when recruiting new board members. The smallest organizations – those that most often have all-white boards — least often said race and ethnicity is important when selecting board members. Only 21 percent considered it somewhat or very important, as compared with fully 77 percent of the largest organizations.7 Those that do view diversity as an important criterion in recruitment far more often have one or more non-white board members: Fully 75 percent of organizations that say racial and ethnic diversity is important when recruiting
7 For other groups, figures are: 36 percent among those with $100-500,000, 53 percent among those with $500,000-2 million, and 47 percent in the $2-10 million group.

9
new members had one or more minority board members, compared with 26 percent of those who say it is not important. In short, one of the reasons that larger organizations are more diverse than boards of smaller organizations is that they place more importance on diversity when choosing board members.8
Another relevant finding is that organizational size is correlated with board size. Board size rises from a low average of 10 members among the smallest organizations, to a high of 47 among the largest ones.9 Larger board size enables organizations to incorporate individuals that are more diverse along numerous attributes, and larger boards were indeed more likely include one or more non-white members. Organizational size and board size are both significant when entered into a logistic regression, and the addition of board size reduces the size of the parameter estimate for organizational size. Taken together in a logistic regression (with whether or not the board includes any people of color as the dependent variable) with controls for organizational size, both board size and placing importance on race and ethnicity in recruiting new board members are statistically significant.10
The significance of organizational size needs to be better understood with respect to differences in board composition. Our findings do indicate, however, that at least part of the greater diversity among larger organizations is due to their adoption of practices – such as emphasizing racial and ethnic diversity in recruitment, and having larger boards – that could also be adopted by smaller organizations. Keep in mind, however, that we are discussing the minimal threshold of having any minority board members. Arts and cultural boards of all sizes were extremely homogenous with respect to race and ethnicity. Furthermore, as we shall see, it is important not to assume that factors associated with having any minority board members also account for variations in the percentage of minority board members.
Population Demographics, Audience Composition, and Board Composition
To this point we have identified low levels of minority board members relative to an overwhelming predominance of white board members. We need, however to place analyses of board composition in context, relative to the demographic composition of the larger population. It is one thing for a board to be 90 percent or more white in a community that is 90 percent
8 In a logistic regression, with controls for organizational size, the importance of racial or ethnic diversity as a recruitment criterion was significant, and reduced (though did not eradicate), the relationship with organizational size. Size was entered as a series of five dummy variables with the smallest size group as the omitted category.
9 Average board size was 19, 18, and 28, in the three size categories between the smallest and largest.
10 Significant organizational size differences disappear between the two smallest groups, and the difference between the third largest group and the smallest is just over the .05 significance level (.055). Differences remain statistically significant for the two size groups over $2 million and the smallest size group.
10
white, but quite another in a community that is 50 percent white. Even more relevant is the demographic composition of the organization’s audience members, since these are individuals that are interested in the organization’s activities. Comparisons to local and audience demographics shed light on whether or not board diversity (or lack thereof) reflects the available pool of potential board members.
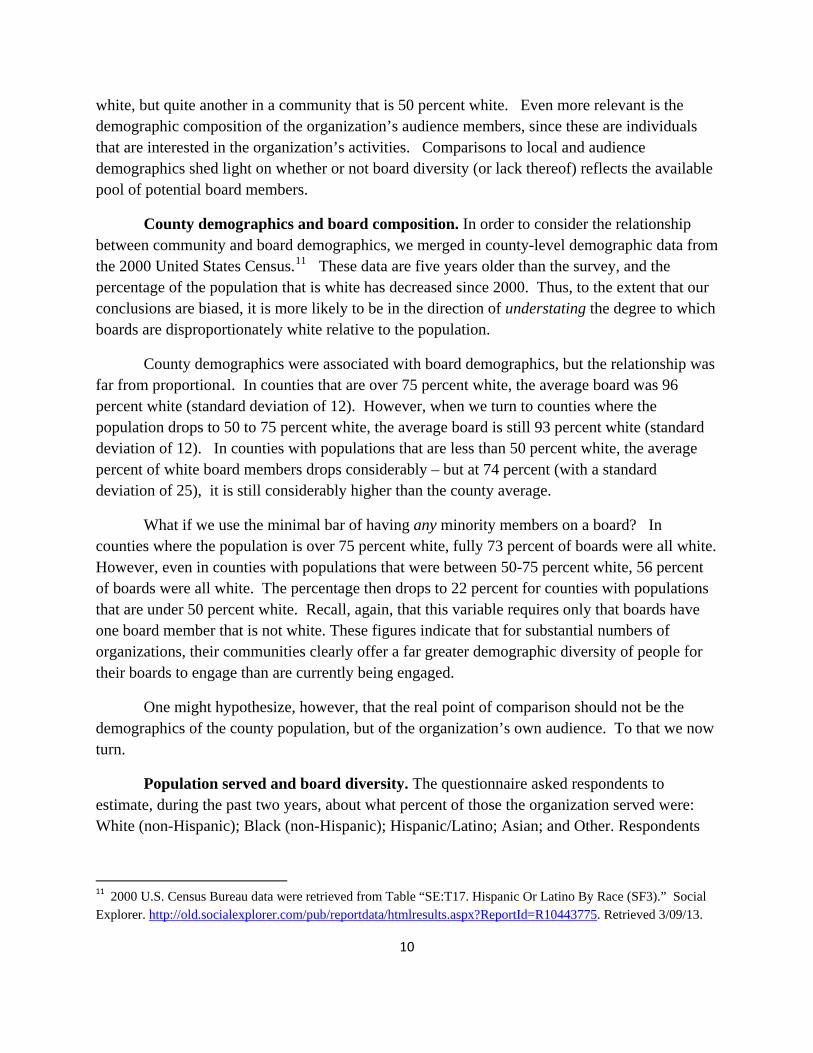
County demographics and board composition. In order to consider the relationship between community and board demographics, we merged in county-level demographic data from the 2000 United States Census.11 These data are five years older than the survey, and the percentage of the population that is white has decreased since 2000. Thus, to the extent that our conclusions are biased, it is more likely to be in the direction of understating the degree to which boards are disproportionately white relative to the population.
County demographics were associated with board demographics, but the relationship was far from proportional. In counties that are over 75 percent white, the average board was 96 percent white (standard deviation of 12). However, when we turn to counties where the population drops to 50 to 75 percent white, the average board is still 93 percent white (standard deviation of 12). In counties with populations that are less than 50 percent white, the average percent of white board members drops considerably – but at 74 percent (with a standard deviation of 25), it is still considerably higher than the county average.
What if we use the minimal bar of having any minority members on a board? In counties where the population is over 75 percent white, fully 73 percent of boards were all white. However, even in counties with populations that were between 50-75 percent white, 56 percent of boards were all white. The percentage then drops to 22 percent for counties with populations that are under 50 percent white. Recall, again, that this variable requires only that boards have one board member that is not white. These figures indicate that for substantial numbers of organizations, their communities clearly offer a far greater demographic diversity of people for their boards to engage than are currently being engaged.
One might hypothesize, however, that the real point of comparison should not be the demographics of the county population, but of the organization’s own audience. To that we now turn.
Population served and board diversity. The questionnaire asked respondents to estimate, during the past two years, about what percent of those the organization served were: White (non-Hispanic); Black (non-Hispanic); Hispanic/Latino; Asian; and Other. Respondents
11 2000 U.S. Census Bureau data were retrieved from Table “SE:T17. Hispanic Or Latino By Race (SF3).” Social Explorer. http://old.socialexplorer.com/pub/reportdata/htmlresults.aspx?ReportId=R10443775. Retrieved 3/09/13.
11
were asked to check one of a set of ranges for each of these groups.12 We have seen that most of these arts organizations have all-white boards – but is that reflective of their audiences?
Audience demographics proved to be an important correlate of board diversity, more so than county demographics.13 Yet here too, boards were disproportionately white relative to their own audiences. Although over half of these organizations have exclusively white boards, only 9 percent serve an exclusively white audience. Recall that the smallest organizations most often had exclusively white boards (over 60 percent). Yet even among this group, only 14 percent have an all-white audience. Among organizations in all the other size categories, the percentage serving an exclusively white clientele is 5 percent or less.14
Arts and cultural organizations in this study do serve largely white audiences. One clear message of the above findings is that engaging a more diverse audience is tied to diversifying board composition. However, even at current levels, we find far greater diversity in audiences than on boards. This strongly suggests that these organizations are not taking full advantage of the pool of potential board members from underrepresented groups that is already available.
Variations Among Subfields
Given the wide range of artistic activities present (see Figure 2 above), the sample size makes it difficult to analyze artistic subfields in detail. However, to explore whether any suggestive patterns might be identified, we examine board composition by subfields that have at
12 Response categories were: 0, 1-9 percent, 10-24 percent, 25-49, 50-74, and 75-100 percent. Ranges were provided since we did not expect respondents could provide accurate specific percentages, and would be more likely to skip the question if asked to do so, given the greater level of effort required. Of the 438 arts organizations that provided full data on board composition, 393 answered all of the questions on the demographic composition of those served. The board composition of these 393 was comparable to the full group of 438, with 56 percent having exclusively white boards (close to the almost 59 percent figure for the full 438).
13 In an OLS regression (with the percent of minority board members as the dependent variable), independent dummy variables for the percent of those served that are white and organizational size accounted for 40 percent of the variation. By contrast, an OLS regression with organizational size and the percent of the county that is white as independent variables accounted for 20 percent of the variation explained. Entering both audience and county population (with controls for size) accounted for 44 percent of the variation. Both variables remain significant, but the presence of audience composition as a variable reduces the parameter estimate for county population, suggesting that county demographics impact board composition in part by impacting audience composition.
14 In a logistic regression (with whether or not the organization has any non-white board members as the dependent variable), we also examined the potential impact of the percent of those served that are low income/below the poverty level (measured as a dichotomous variable for whether 25 percent or more of those served are low income) along with the impact of the percent of the audience that is white (measured as three dummy variables: under 50 percent, 50-74 percent, and 75 percent or more, with under 50 percent as the omitted category). Examined together, racial/ethnic audience composition, but not income composition, is significant.
12
least 20 or more organizations. Our results do identify some variations that bear further investigation on larger samples.
Through bivariate tables, we compared the percentage of organizations in each field that have one or more minority board members with organizations in other fields. A significantly higher percentage of media organizations (67 versus 40 percent) and dance organizations (61 percent versus 40 percent) had one or more people of color on their boards, and a significantly lower percent of historical organizations did so (23 percent versus 45 percent). Art museums also had a higher percentage (70 versus 41), but the difference was not statistically significant, possibly due to the small numbers.
The question is what accounts for this variation among subfields: For instance, to what extent is the subfield itself – i.e., the cultural form – the operative factor? Might organizations in dance and media be more likely to present content reflective of a greater diversity of cultural groups, and thus attract a more diverse group of board members? Or, to what extent are the findings less a function of artistic content than of other associated organizational attributes or community context?
We cannot provide definitive answers to these questions with the available data. However, our exploratory analyses do indicate that a complex mix of artistic content, community demographics, and organizational characteristics are at work – and that the factors are not necessarily the same in every case. Consider the case of media organizations, which, as noted, were more likely to have at least one minority board member. Media organizations were not located in counties that were significantly more or less white. Only two characterized representing diverse ethnic perspectives and traditions as part of their mission, while the vast majority (34) did not. Media organizations did, however, tend to be larger in size than other arts organizations. Indeed, with controls for organizational size, a dichotomous variable for being a media organization in a logistic regression was no longer significant.
Boards of historical organizations (primarily historical museums and societies) were less likely than other arts and cultural organizations to have any non-white members. As it turns out, they tend to be smaller in size.15 Yet, even after taking size into account, historical organizations remain significantly more likely to have all-white boards. They are also more likely to be located in counties with a higher white population. The names of the historical organizations suggest that most focus on the history and culture of a particular geographical area. One of the noteworthy differences between historical organizations with, and those without, any minority board members is the latter are located in communities with a considerably higher percent white population (average 83 percent white, standard deviation of 18) than those that have at least one
15 Eighty-three percent are in the two size categories under $500,000 compared with 59 percent of other organizations.
13
person of color on the board (where the county population averages 65 percent white, with a standard deviation of 18).
Dance organizations were also more likely than other organizations to have one or more minorities on the board. They are not significantly larger (or smaller) than other organizations. They are more likely to be located in counties with higher minority populations. Furthermore, fully 4 of the 23 dance organizations had a self-described focus on presenting and promoting dance and dancers of a specific ethnic heritage, and/or multi-ethnic traditions. The percent of dance organizations that explicitly link their purpose to presenting and advancing art and artists from a particular ethnic cultural tradition, and/or multi-cultural awareness, is over twice as high as that of other organizations. If we limit this category to non-European derived cultural traditions, it is over three times as high.
Thus, we find that the source of the patterns observed among the three subfields seem to have overlaps, but also differences. In this regard, it is particularly interesting to compare the organizations according to whether or not they say that racial and ethnic diversity is important in recruiting new board members. Media organizations were more likely than other organizations to say this (49 percent versus 29 percent). However, neither historical nor dance organizations were significantly different than other organizations along those lines. The subfield in which the highest percent by far (65) say it is important, however, was art museums, reinforcing the interest of pursuing the study of museum board composition on a larger sample.
Board Diversity: A Consideration of Multiple Factors
We turn in this section to multivariate analysis of the presence/absence of any non-white board members (see Table 1). Certain variables emerge as having consistent and robust relationships, in that they remain significant notwithstanding the addition or removal of other variables:
• The percent of the county population that is white (negative)
• An audience that is over 75 percent white (negative)
• Placing importance on race and ethnicity when selecting new board members (positive)
• Board size (positive)
• Having limits on the number of consecutive terms board members can serve (positive)

Table 1: Presence of Any Minorities on Board and Percent of Minorities on Board: Logistic and OLS Regression Results
Logistic OLS
PARAMETER ESTIMATE
SE PARAMETER ESTIMATE
SE
SIZE $100‐500K 0.1021 0.4065 ‐0.00048893 0.01853SIZE $500K‐2M ‐0.079 0.4765 ‐0.01324 0.02129SIZE $2‐10 M 0.276 0.6477 0.00273 0.02719SIZE OVER $10M 0.5982 1.2494 0.00129 0.04028N BD MEMBERS 0.0526* 0.021 ‐0.00092807 0.00056031DIVERSITY IMPORT. 2.0379*** 0.3499 0.03983** 0.01516% COUNTY WHITE ‐4.1*** 0.8939 ‐0.19371*** 0.03662AUD 50‐74% WHITE ‐0.0569 0.5683 ‐0.15422*** 0.0225AUD 75%+ WHITE ‐1.4655** 0.5666 ‐0.19644*** 0.02318TERM LIMITS 0.9166** 0.3256 0.01734 0.014DONATE IMPORT. ‐0.5108 0.3791 ‐0.02593 0.01655AUD. 25%+ LO INC 0.496 0.4361 0.03163 0.01819MEDIA 0.0507 0.6155 0.05175 0.02687DANCE 0.332 0.6963 0.03745 0.02932HISTORY ‐0.9736* 0.4414 ‐0.02049 0.01999GVT FUNDING 0.7258* 0.3612 0.02496 0.01625ETHNIC/MULTICULT 0.3137 0.6366 0.23058*** 0.02637
ADJ. R‐SQUARE NA NA 55
*<.05 **<.01 ***<.001
Notes: a) Dependent variable for the logistic regression is a dichotomous 0/1 variable for whether the organization has one or more minority board members (1=yes). The dependent variable for the OLS regression is the proportion of minorities on the board (ranging from 0‐1, where 0 is none and 1 is 100 percent) b) Independent variables are all 0/1 dummy variables (where 1=yes), except for the number of board members (coded as the number) and the percent of the county that is white, non‐Hispanic (a proportion ranging from 0‐1). Source: 2005 Urban Institute National Survey of Nonprofit Governance
14

15
We examined term limits with the idea that this would open up circulation within the board, offering more opportunity for bringing in new people, and this was supported. Conversely, we considered whether recruiting people based on their ability to financially contribute was an obstacle to recruiting people of color, but found no support for this conclusion.16
Multivariate analyses also help us to understand the relationship between organizational size and the greater likelihood of including one or more minority group members on boards. The findings support the idea that this relationship reflects the fact that larger organizations adopt practices that are associated with greater diversity, specifically: Placing importance on diversity when recruiting new members; term limits; 17 and having larger boards. Larger organizations are also more likely to be in counties that are demographically more diverse. Indeed, with controls for other variables related to greater board diversity, organizational size was no longer statistically significant. With respect to field of activity, we find that with controls, differences between media and dance and other organizations were no longer significant, but those with historical organizations remained so. We still, however, think investigating these and other potential subfield differences on samples with larger numbers is warranted.
These findings indicate a multiplicity of influences. Organizations have little control over some of these, while others are at their discretion. Organizations cannot change their county demographics. They can, however, increase their board size to include a wider variety of people, consider limits on the number of consecutive board terms members can serve, and decide to make racial and ethnic diversity an important consideration when recruiting new board members. Recall that 75 percent of organizations that make racial or ethnic diversity an important criterion in recruiting board members have at least one person of color on the board, compared with 26 percent among those for whom it was not important. Forty-eight percent of those with terms limits have at least one non-white board member compared with 36 percent who do not.
One factor that we have not discussed, but that was considered to be of potential significance, was whether or not the organization receives funding from government funders,
16 Organizations that place importance on the ability to donate or fundraise as a recruitment criterion were actually more likely to have one or more minority members. However, once controls for organizational size and other variables were included, emphasizing the ability to donate or fundraise was no longer significant.
17 The primary difference in use of term limits is between organizations with under and over $100,000 in annual expenditures. Of the former, only 32 percent have term limits. However, over half of the organizations in the each of the larger groups do, until we hit the very largest organizations (over $10 million), where the figure drops to 38 percent.

16
who are concerned about diversity. Receipt of any government funding was significant and positive.18
Our discussion here has been about correlates of “diversity,” understood as a minimal threshold of having any people of color on the board. This reflects the widespread homogeneity among these boards, in which a majority are exclusively white. It is interesting to ask whether the variables examined in relation to the dichotomous variable (any minorities on the board), also are related to the percent of minorities on the board. Thus, we performed an OLS regression with comparable independent variables (see Table 1). We found both commonalities and differences: County demographics and audience demographics were significant, as was placing importance on racial and ethnic diversity in recruiting new board members. However, board size was not significant. In other words, increasing board size does promote inclusion of at least one non-white member, but the percentage of people of color does not continue to grow with increased board size. Furthermore, term limits were not significant. Conversely, having an organizational mission that includes preserving or presenting multi-ethnic forms, and/or art of a particular ethnic cultural heritage was significant. Taken together, the variables in the regression explained 55 percent of the variation in the percentage of minorities on the board.
A Consideration of Atypical Cases: Organizations with Higher Percentages of African-American, Hispanic, and Asian Board Members
As noted at the outset, low numbers preclude separate statistical analyses of levels of African-American and Hispanic board representation and their correlates. Here, however, we do examine separately the small number of organizations with atypically high percentages of African-American and Hispanic board members in an exploratory fashion. We seek to identify potential leads about what distinguishes these organizations from others that bear further investigation in studies designed for that purpose. No statistical generalizability is proposed here, and, since we are dealing with atypical cases pulled out from the sample, analyses in this section are unweighted.
This section considers two sets of organizations: those with over 10 percent of board members that are African-American, and those that have a comparable percentage of Latino board members. Ten percent is a modest, and somewhat arbitrary cutoff, but it is over two times the sample average for African-American board membership, and five times the average for Hispanic board membership. By scrutinizing open-ended responses to the “Other” category, we
18 We examined the impact of foundation funding, which was not significant. We find some suggestion of potential differences between those that receive over 50 percent of funding from foundations and others, but there were few such organizations, the relationship was not statistically significant, and it was difficult to disentangle funding from foundations and government. The issue bears further investigation on a larger sample.

17
subsequently identify and pull out organizations with an atypically high percentage of board members of Asian descent for similar consideration.
Of the 438 organizations in the study, 60 report that their board is comprised of over 10 percent African-American or black members.19 Of these 60, 38 report an African-American board membership between 10 and 20 percent, and 22 organizations have boards that are 20 percent or more African-American or black. Fewer organizations report comparably high percentages of Hispanic/Latino members: Thirty-two say that their boards have over 10 percent Hispanic/Latino membership. Of these 32, 24 have a Hispanic membership between 10-20 percent, and 8 report that 20 percent or more of board members are Hispanic. Eight organizations have boards that are 50 percent or more African-American in composition. That was true of two organizations in the case of Hispanic board members.
One question of interest was whether these organizations more often were dedicated to arts and/or artists associated with African-American or Hispanic traditions respectively, and/or to presenting multiple cultural traditions. This did prove to be true. Eleven out of the 60 (or about 18 percent) organizations with over 10 percent African-American or black board membership present or promote art related to African-American cultural traditions and/or multi-ethnic culture and expression. By contrast, among organizations with 10 percent or fewer African-Americans, less than 6 percent describe their mission in that way. Among those with boards that are 20 percent or more African-American, the figure is eight out of 22, or more than one-third of the organizations.
Among the 38 organizations with more than 10, but less than 20 percent African-American or black board members, three fall within this category, but all expressed a focus on “ethnic” or “multicultural” art or expression, rather than any particular focus on African-American themes or artists. By contrast, 6 of the 22 organizations with 20 percent or more African-Americans on the board did state a focus on African-American cultural heritage and/or artists, with two others dedicated to multi-ethnic expression. Most (6 of the 8) organizations with boards that are 50 percent or more African-American are concerned with presenting and preserving art related to African-American artists and/or cultural traditions, with a seventh focused on multi-ethnic cultural awareness.
Turning to a comparable analysis of organizations with 10 percent or more Latino board membership, we find that five of the 32 (16 percent) are directed at advancing or raising awareness of the culture of a particular ethnic group or multi-ethnic cultural awareness, compared with 7 percent of other organizations. Only one of the five specifically focuses on Latino cultural traditions. Four of the five were organizations with 20 percent or more Hispanic
19 One additional organization reported this as well, but could not be included in the analysis because of missing data on other relevant attributes needed for the analysis.

18
board members. These four constitute half of the 8 organizations with 20 percent or more Hispanic board members. Only two organizations had boards that are 50 percent or more Latino, including the sole organization focused on Latino art/artists. While the other organization with a board that is over 50 percent Latino makes no reference to national or ethnic heritage or multi-ethnic expression in its mission, it is noteworthy that it does have a bilingual web site.
In sum, these organizations are more likely than others to explicitly focus on either multi-ethnic forms, and/or arts or artists associated with a particular ethnic cultural heritage. In the case of African-Americans, this was more likely to be African or African-American cultural traditions, than it was Latino cultural traditions for boards with higher percentages of Hispanic or Latino members. At the same time, the majority of organizations with higher percentages of either African-American or Hispanic board members do not particularly focus on arts and cultural heritage of these respective groups (except, in the case of African-Americans, when we get to organizations with boards that are majority African-American).
With respect to artistic subfield, we find overlaps and differences. Media and dance organizations are prominent in the case of organizations with higher percentages of African-American board members. Eleven of the 60 organizations with boards that were over 10 percent African-American, were media organizations. That is just over 2.75 times the percent among other organizations. Seven were in the field of dance, over twice the percent among other organizations. Over 25 percent (6/22) of those with boards that are over 20 percent African-American, were dance organizations.
Media is also a conspicuous presence among organizations with higher percentages of Hispanic board members. Eight, or 25 percent of the 32 organizations with boards that include over 10 percent Latino members are in media (by contrast the figure is 7 percent for other organizations). Nine organizations have boards that are over 10 percent African-American and over 10 percent Hispanic, and four of these are media organizations. While the percent of dance organizations with over 10 percent Latino membership also exceeded the percent among other organizations, the numbers were too small to reveal any conspicuous difference.
Organizations with higher percentages of African-Americans are in counties with higher African-American populations. Those with over 10 percent African-American board members are in counties with an average 26 percent African-American population (standard deviation of 20) compared with 10 percent for other organizations (standard deviation of 12). The figure is 27 percent (standard deviation of 18) among organizations with boards that are over 20 percent African-American in membership.
Likewise, organizations with over 10 percent Hispanics are in counties that have a higher Hispanic population. Thus, on average they are 23 percent Hispanic in population (standard deviation of 20) compared with 10 percent (standard deviation of 11) for other organizations.

19
The 8 organizations that have 20 percent or more Hispanics are in counties that have an average Hispanic population of fully 38 percent (standard deviation of 22) versus 10 percent elsewhere.
Thus, boards with over 10 percent African-American and Hispanic composition are in counties with over twice the average population of those groups respectively. In the case of Hispanics, however, there is a markedly higher average population in counties where the organizations have over 20 percent Hispanic membership. It would bear investigation on larger samples to see whether there may be a higher “bar” to translating county demographics into board membership among Hispanics.
Organizations with higher percentages of African-American or black board members are more likely than others to serve a higher percentage of African-Americans. Thus, two-thirds of organizations with boards that are over 10 percent or more African-American have audiences that are 10 percent or more black, compared with less than one-third (31 percent) for other organizations. The figure rises to over 90 percent among organizations whose boards include 20 percent or more African-American members.
Likewise, organizations with over 10 percent Hispanic board members serve a higher percent of Hispanics: 78 percent serve an audience that is 10 percent or more Hispanic, compared with 25 percent of other organizations. The figure is 100 percent for boards with 20 percent or more Hispanic members.
As we have seen, organizational size was an important correlate of having any people of color on the board. Organizations with over 10 percent African-American board membership are somewhat larger in size. Thus, 13/60 or one-fourth of the organizations have over $2 million in annual expenditures (compared with 15 percent of other organizations). The comparable figures for boards with over 10 percent Hispanic membership are 22 percent in the over $2 million category versus 16 percent among other organizations.
A strikingly higher percent (68) of organizations with boards that are over 10 percent African-American or black say that ethnic and racial diversity is important in selecting new board members. This is over twice the 33 percent found among other organizations. The difference is far less marked between the 45 percent of organizations with over 10 percent Hispanic board members that say this, as compared with 37 percent of other organizations.
A Note on Boards with Higher Percentages of Asian and Asian-American Membership
The survey did not ask respondents to identify the number of Asian-Americans on the board, but did ask organizations to specify if they indicated they had one or more board members in the “Other” category. The largest group, forty-nine organizations, indicated that they had one
20
or more board members who are Asian or Asian-American.20 Of this group, we were able to identify 20 organizations with over 10 percent of board members of Asian descent, and nine organizations where the percentage was 20 or higher.21 While only the most tentative analysis was possible here, a few suggestive findings bear mentioning.
Community and audience demographics proved important, as was true in the case of boards with higher percentages of African-American and Latino board members. On average, these organizations are in counties that have a population that is 12 percent Asian (standard deviation of 6), three times the average among other organizations (the average population is the same for the organizations with boards that are 20 percent or more Asian). Fully 74 percent have audiences that are 10 percent or more Asian as compared with 14 percent of other organizations. This was true of all nine organizations with boards that have 20 percent or more Asian or Asian-American members.
Four of the 20 are committed to promoting and presenting forms associated with a particular Asian culture (e.g., Japanese, Indian) and a fifth is multi-ethnic, but was originally founded with a specific focus on the Asian community. All five of these organizations have boards with 20 percent or more members of Asian descent. Thus, none of the 11 with 10-20 percent, but over half of the nine with 20 percent or more, focus on art associated with Asian and/or multi-ethnic forms.
A striking number of the boards with higher percentages of Asian or Asian-American board members are larger organizations. Fully 30 percent have over $2 million in assets, but that is true only of 16 percent of other organizations. Indeed, 15 percent have over $10 million in expenditures as compared with 5 percent of the organizations that do not have over 10 percent of the board comprised of Asians.
Fifty-five percent say racial and ethnic diversity is important when recruiting new board members compared with 37 percent of other organizations.
With respect to field, one noteworthy finding was the comparatively high presence of art museums (15 percent of the 20, as compared with less than 4 percent for other organizations). Similar to the findings for African-Americans we found a higher percent associated with dance – fully 4 of the 20 organizations (or 20 percent), compared with five percent for other organizations. Media was not a comparably striking presence here.
20 The second most commonly cited group, Native American, was cited by only 10 organizations.
21 It is possible that the number is somewhat higher, because a few respondents wrote Asian and another category, so it was not possible to determine the percent of the “Other” category attributable to board members of Asian descent.

Three organizations had boards that were over 10 percent African-American, over 10 percent Hispanic, and over 10 percent Asian. Two are media organizations, and the third is a theater. Each of these boards also had one or more white members. These organizations would be particularly interesting to follow up with qualitatively to understand how they achieve diverse representation to a degree that is clearly unusual.
Comparisons with Other Nonprofit Organizations: A Note
To what extent is the lack of racial and ethnic board diversity unique to arts and cultural nonprofit organizations? We address this question by comparing the 438 arts, culture, and humanities organizations to nonprofits in other fields of activity in the Urban Institute National Survey of Nonprofit Governance. As Table 2 shows, high percentages of organizations in all fields of activity have exclusively white boards. However, the percentage of arts organizations with any minority board members is lower than the percent found in every other field, except for environmental and animal organizations. Differences between the arts and other fields of activity (except for the “other” category) were statistically significant when entered as a series of dummy variables in a logistic regression with the arts as the omitted category. A question that arises, however, is why these differences exist – do they reflect something about the arts per se or are they a function of other, associated attributes. For instance, when we added controls for organizational size into a logistic regression, differences with education and human services were no longer statistically significant. This suggests that at least some of the differences are reflective less of field per se, than of associated organizational attributes (in this case that arts and cultural organizations are comparatively smaller in size). An in-depth consideration of comparative issues of board diversity is beyond the scope of this study but is one that bears further investigation.
Table 2: Percent of Nonprofit Organizations with One or More Minority Board Members by Field of Activity
Arts Educ Envir Health Cmty Imp HumServ Other All%: 41.29 49.58 27.25 50.48 57.66 53.98 43.67 48.9N 438 976 177 825 265 1501 501 4683
Note: Includes only cases that provided full data on the board’s racial and ethnic composition.
Source: 2005 Urban Institute National Survey of Nonprofit Governance
21

22
Other Dimensions of Board Composition: Gender, Occupation, and Age
Gender
Boards of arts organizations present a far more balanced picture with respect to gender composition, than they do with respect to race and ethnicity. Very few boards were either exclusively male (2.4 percent) or female (4.5 percent). On average, among the 466 cases that provided data on the gender composition of their boards, women constitute 53 percent of board members (standard deviation of 23). The aggregate figures do conceal differences by organizational size. The percent of women on the board is negatively related to organizational size. Thus, among organizations with under $100,000 in annual expenditures, women comprise an average of 57 percent of board members. Women also comprise an average just over half of board members (52 percent) in the next size category ($100-500,000). The figure drops to 43 percent among organizations with $500,000 to 2 million, and is 41 percent in each of the size categories above that.
We do also find variations in representation of women by field of activity. Women were a particularly strong presence in the boards of dance organizations, where boards averaged 72 percent female (standard deviation of 24), and fundraising organizations where they averaged 62 percent of board members (standard deviation of 23). The lowest percentage was in media and communications organizations with an average of 41 percent (and standard deviation of 19) followed by historical organizations (average of 44 percent, with a standard deviation of 22).
There is a higher percentage of women on boards of organizations where women comprise a higher percentage of those served by the organization. Thus, for organizations with a less than 50 percent female clientele, the average board is 44 percent female (standard deviation of 23) compared with 57 percent for boards of organizations with over 50 percent women (standard deviation of 22). Interestingly, though, the largest organizations, which have a lower average percentage of women on their boards, are also more likely to have audiences that are over 50 percent female. While the percent of organizations that serve an over 50 percent female clientele is between 61-71 percent among the three smallest size groups, it is 83 percent and 90 percent respectively among the largest two size groups.
Taken together, organization size, the percent of women in the audience, and field of activity accounted for 20 percent of the variation in the percent of women on the board when entered as the independent variables in an OLS regression.
As we have seen, arts and cultural organization boards are comparatively more homogeneous with respect to race and ethnicity than boards in other fields of activity. However,

they have comparatively higher percentages of women on their boards relative to other fields (see Table 3).
Table 3: Average Percent of Female Board Members by Field of Activity
Arts Educ Envir Health Cmty Imp HumServ Other AllAvg. % 52.8 49.67 44.02 539.28 43.12 47.9 39.59 46.26 N 466 1040 187 862 292 1601 383 4978
Source: 2005 Urban Institute National Survey of Nonprofit Governance
Occupation
The majority of arts boards’ members – on average, 72 percent (standard deviation 26) – were employed. Business is by far the most common employer of those who are employed. On average 59 percent of employed board members were employed by a business. The second largest group (20 percent) was self-employed. On average, few board members work for another nonprofit (10 percent) or government (8 percent). On average, only 3 percent of arts organizations’ board members were employees of the organization. As this last, low percentage, indicates, unlike in the business world it is unusual for arts nonprofits to have inside directors.
Overall, board members’ type of employer did not differ dramatically or systematically with organizational size. The average percent of employed board members that are employed by a business is fairly comparable among all organizational size groups (57-59 percent), with the exception of the largest group, where it is higher (70 percent). The most systematic association with size was related to the average percentage of employed members that work for government, which declines from a high of 10 percent among the smallest organizations, to a low of 3 percent among the largest organizations
The prevalence of business backgrounds among board members is further indicated by the fact that fully 39 percent of arts organizations have board members that also sit on corporate boards. The presence of corporate members is more widespread among larger organizations. Thus, only 26 percent of organizations in the smallest size group have board members that also serve on corporate boards. That percentage climbs to 47 among the $100.000-500,000 group, to 57 percent among the $500,000-2 million group, to 82 percent among the $2-10 million group and then to fully 96 percent among arts organizations with over $10 million in expenditures.
Occupational profiles do differ across subfields. The numbers are quite small (N=20) but dance organization boards were more likely to include employees of their own organization (with an average of 14 percent of employed board members), and contain fewer business employees (on average 37 percent of employed dance board members). Media boards also had a lower percentage (45) of business employees, and were more likely to employ employees of
23

other nonprofits (average 25 percent). Art museums had a very high percentage of employed board members (73 percent) that work for business.
Since the survey did not ask respondents about the occupational composition of their attendees we cannot analyze potential associations between audience and board attributes with respect to this variable.
Age
On average, arts boards have few (6 percent) board members under the age of 35. Only 35 percent of arts organizations have any members that young. Our findings indicate one barrier here may be the practice of requiring that board members contribute. Among those with such a requirement, 28 percent have one or more members under 35, as compared with 44 percent of organizations that do not require board members to contribute. The highest percentage of under 35 year old board members is the average of 7 percent found among organizations with less than $100,000 in annual expenses. The average drops to under 3 percent in the two highest size groups. On average, most board members are age 51-65 (43 percent) or 36-50 (32 percent), with the balance age 66 or older. Largest organizations are less likely to have the youngest board members and more likely to have board members between 51 and 65 years of age. (Respondents were asked to provide the number of board members in the above age ranges).
Subfields more likely to have more young board members are media (48 percent) and fundraising and support organizations (50 percent). The figure is lowest in history (16 percent), art museums (24 percent), and dance (33 percent).
As Table 4 shows, arts organization boards are not atypical in their frequent lack of young board members. They are significantly more likely to have board members under the age of 35 than are health organizations, but significantly less likely to include younger board members than human service organizations.
Table 4: Organizations With Any Board Members Age 35 or Younger By Area of Activity
Arts Educ Envir Health Cmty ImpHumServ Other AllPercent 34.83 38 29.39 29.5 35.11 40.36 30.32 35.69N=4773 cases 449 996 178 835 278 1528 509 4773
Source: 2005 Urban Institute National Survey of Nonprofit Governance
Conclusion
Nonprofit organizations are one of the key venues in which arts participation takes place. This participation does not occur solely through attendance or arts creation. An important, but understudied, vehicle for participation is engagement with arts organizations themselves,
24

25
including board membership, where organizational policy is made. This report examined the extent to which boards engage a diversity of individuals, particularly with respect to racial and ethnic diversity. We found that boards of arts, culture, and humanities organizations are quite homogeneous with respect to race and ethnicity. While levels of homogeneity are fairly pervasive, they are not uniform, and do vary, in particular by organizational size. Arts organizations are not unique in this respect – we also found substantial percentages of all-white boards among organizations in other fields of activity. However, the percentage in the arts was exceeded only by organizations in the field of environment and animals.
This study yields conclusions (in italics below) and implications, as well as areas for future research. This includes steps that arts and cultural organizations can take to help make their boards become more diverse.
While many organizations say they find it difficult to find people of color to serve on boards, our findings indicate that many organizations are not identifying and engaging those currently available in existing pools of potential candidates. The percentage of organizations with all-white boards far outstrips the percentage of organizations with all-white audiences. Almost 59 percent of organizations have all-white boards, but only 9 percent serve an all-white audience. This suggests that there is a pool of candidates interested in the organization and its activities from whom potential board members might be drawn. Of course, we recognize that simply being an audience member does not necessarily make one a potential candidate for board membership. However, for the majority of our sample, including just one minority member would have moved them out of the all-white board category. Our statistical findings are consistent with qualitative data that indicates that arts boards do have potential board members of color that go unrecognized (Ostrower 2002). Furthermore, 70 percent of the organizations said that racial and ethnic diversity is “not at all” or “not too important” in the selection of new board members.
There are a multiplicity of influences associated with boards’ racial and ethnic composition. Some of these are beyond organizations’ control, while others are at their discretion. Organizations cannot control the demographics of their county population. Audience composition is a key factor – and diversifying audiences clearly should be a key part of board diversification efforts – but is also one that many organizations have found challenging. At the same time, our findings do point to some measures for organizations to consider in order to try and enhance board diversity:
• Increase board size
• Introduce term limits
• Make racial and ethnic diversity an important criterion when recruiting new board members

26
Our findings suggest that factors related to artistic content play a role, but so too do organizational factors that are not arts-specific. Therefore, diversity efforts at the board level need to consider organizational structures and processes that facilitate or inhibit diversity. This is consistent with the fact that board homogeneity is a broader issue in the nonprofit world.
Our findings further indicate that outside sources, notably government funders, play a role. While our cross-sectional data cannot establish causality, the pattern is consistent with the hypothesis that government funders’ concern about diversity prompts potential and current grantees to give it greater attention. Additional research would be useful here to examine how government funders (at the local, state, and federal levels) incorporate diversity into funding and evaluation guidelines and decisions, and with what consequence.
Further research is needed to understand the factors, and differences in factors, associated with having any board members of color, and those associated with having a truly “diverse” board that goes beyond inclusion of only one or two members who are not white. In this respect it was interesting to note the importance of whether or not the organization explicitly characterizes its purpose as preserving, presenting, or promoting art or artists from a particular ethnic heritage, or as multi-ethnic. Clearly, there were some other organizations that included cultural content that was of non-European origin, or multi-cultural, but that did not highlight the link between that content and a particular heritage in their mission and self-description. It would be of interest to further explore the extent to which it is not only the cultural content, but the way that organizations portray their relationship to that content that makes a difference.
With respect to another issue that has been difficult for arts organizations – the presence of younger board members – the study suggests that one prohibitive factor may be the tendency to require board members to donate. Organizations may want to consider waiving this requirement in some cases to bring in younger generations.
Caution should be exercised in generalizing about “diversity” as an undifferentiated whole. Clearly different dynamics are at work in the case of gender, and racial and ethnic diversity. Arts boards, which are so homogenous in terms of race, are quite diverse with respect to gender. Indeed, arts and culture was the one field of activity in which the average percent of female board members exceeded the percentage of men. And, while organizational size is positively correlated with having one or more minority board members, it is negatively associated with the percentage of female board members.
Perhaps less intuitively but also important, is that there appear to be both overlaps and differences in the patterns at work with respect to diversity in terms of engaging members of various racial and ethnic groups, as well as in different artistic subfields. As we have seen, in some instances, subfields that exhibit higher percentages of minorities appeared to do so for different reasons. We need to further understand, through future research, the extent to which

27
variations in board composition are actually associated with differences in cultural content versus other associated organizational attributes (such as size). For instance, historical organization boards appear to be far more homogeneous not only with respect to race and ethnicity but also gender – and also have older board members. What would be of great interest, however, would be to understand why some of these organizations do manage to be more diverse than others. A comparison of the names of those that do, and those that do not, have all-white boards, revealed little in the way of suggestive leads or differences – most seemed to be focused on history and culture of their local area. Why then, are some able to engage minorities and others not?
The factors associated with higher engagement of individuals of African-American, Hispanic, and Asian descent also seemed to exhibit commonalities and differences. An important area for future research is to follow up on these suggestive findings in order to substantiate, revise, and refine these preliminary suggestions.
Although we examined over 400 organizations that were drawn from a sample of nonprofits with over $25,000 in annual expenditures, levels of minority presence were so low that we were unable to conduct more refined statistical analyses by sub-group. We believe that a key next step – having identified those atypical organizations that have achieved either higher levels of engagement of members a particular ethnic group, or even more atypically, greater diversity of multiple groups – would be to conduct qualitative analyses to understand how this was achieved.
Ultimately, diversity is a value that organizations may or may not embrace. But it is one that the arts world has said that it does want to pursue – and it is clear that much more needs to be known about how this can be done.

28
APPENDIX A
This survey asked respondents how many board members are: Hispanic/Latino, White (non-Hispanic); African-American or Black (non-Hispanic); Other. These options were based on the 2000 Census categories. If respondents indicated they had board members in the “Other” category they were as asked to “please specify” and provided a space to write an open-ended response.
Of the 476 arts, culture, and humanities organizations, 438 gave responses to all four of the above board composition categories (see Table A1). Thus, data were missing for just under 8 percent of cases (comparable to the 9 percent of organizations in other areas of activity in the full survey that also failed to provide full data for these items). The “other” category, with 440 respondents, had the highest amount of missing data. Responses on the other four categories ranged from 447 to 451.
Table A1: Number of Responses to Items on Board’s Racial and Ethnic Composition
How Many Board Members Are: Hispanic/Latino
White (non-Hispanic)
African American or Black (non-Hispanic)
Other (Please Specify)
Number with Data on all of the Above
N
447
449
451
440 438
Since this report focuses on boards’ racial and ethnic composition, it seemed more appropriate and consistent to confine analyses to those 438 organizations that provided full data on their boards’ racial and ethnic composition. For purposes of comparison, and to examine the potential consequences of including cases with partial data, we ran means on each of the four board composition variables using only the 438 cases, and then using all responses for that item. For the analysis using only the 438 cases that replied to all four questions, the percent of each of the four groups on a board is the number of group members over the total number of board members (calculated as the sum of the four categories). For those that had only partial data (i.e., provided data on some, but not all of the racial/ethnic categories queried) the answer to an earlier question about the organization’s total number of board members was used as the divisor. The

29
results are presented below (see Table A2), and indicate that there was little or no difference in results.
Table A2: Board Composition: Comparison of Averages Using Cases with Partial and Full Data
Cases with Partial Data 438 Cases with Full Data Mean Percent (N) Mean Percent
Hispanic/Latino 2.27 (447) 2.22 White, NH 90.54 (449) 90.88 African-American/Black non-Hispanic 3.97 (451) 3.81 Other 3.15 (440) 3.09
As noted, earlier in the survey, we had asked respondents to identify the total number of board members. In principle, that number should have been identical to the sum of the responses to the four racial/ethnic categories. This was usually, but not always, the case. For 37 of the 438 arts organizations, the figures provided for the number of board members in the various racial and ethnic categories (including “other”) did not sum to the total number of board members reported earlier. Indeed, in 16 of these 37 cases respondents filled in a number for one racial/ethnic category that exceeded the total number of board members they reported earlier (including 11 instances in which the organization reported having board members of only one racial/ethnic group). Such discrepancies indicate the need for future studies that focus on board composition to provide questions in a more interactive fashion (e.g. phone surveys using software that can immediately detect, and prompt interviewers to probe discrepancies in responses).
We conducted an analysis of the open-ended responses to the “other” category. These revealed no group that would have had adequate numbers of cases for independent statistical analysis, though we do conduct more qualitative and exploratory analysis on the subset of organizations with over 10 percent of Asian or Asian-American board members. Eighty of the 438 arts organizations with full data reported having board members in the “Other” category. In 73 of the 80 cases, as requested, respondents provided a write-in answer specifying the groups (two additional respondents also provided write-ins, but these were not legible). The largest group (49 of the 73 organizations) wrote in Asian, or in some cases a specific Asian nationality (e.g., “Chinese”, “Japanese” “Indian (from India).” 22 The second largest group was far smaller
22 Counted here as “Asian” are those responses that would fall under the Asian category as defined by the U.S. Bureau of the Census, including the Far East, Southeast Asia, and the Indian subcontinent (see Hoffell et al 2012). In all but one case, when a respondent wrote “Indian” the respondent specified whether the reference was to the country of India or to a Native American (e.g., “Indian (India)” and “Hopi Indian”) . The one case where no such specification was provided was treated as missing data.

30
and consisted of the 10 respondents that wrote in Native American. Five wrote in Pacific Islander or Native Hawaiian. Four respondents said they had a multi-racial board member (writing in, “multi-racial” “mixed,” and “half white, half Hispanic”). Three wrote in “Jewish” alone or in combination, two wrote in Arab-American or Middle Eastern, one wrote in Armenian. Two respondents included data that were not racial or ethnic categories at all: One wrote in “Asian and LGBT” and another wrote in “women.”
Recall that the original survey was not designed to specifically examine boards’ racial and ethnic composition. In light of the very small numbers of African-American or Hispanic or Other board members reported, we are unable to conduct separate statistical analyses, and focus on an aggregated category. Furthermore, while responses clearly indicate low levels of members of any non-white individual groups on their boards, we believe further research is needed to establish in a more exact fashion the precise percentages. We have greatest confidence in the accuracy of the aggregate and dichotomous variable (which simply codes whether or not the board includes any members of a minority group) which is also our primary focus.
We believe that it is important to undertake further research specifically designed to examine boards’ racial and ethnic composition. Such a specialized focus would be necessary to obtain more precise and refined estimates of arts boards’ racial and ethnic composition. A clear implication of our findings is that such a specialized survey should ask an expanded set of questions, in an interactive fashion, to obtain more precise data and to ensure that the responses conform to the intended categories.
31
REFERENCES
DiMaggio, Paul. 2000. “Social Structure, Institutions, and Cultural Goods: The Case of the United States.” In G. Bradford, M. Gary and G. Wallach (Eds.), The Politics of Culture: Policy Perspectives for Individuals, Institutions and Communities. The Center for Arts and Culture. New York: The New Press.
DiMaggio, P. and Ostrower, F. 1992. Race, Ethnicity, and Participation in the Arts: Patterns of Participation by Hispanics, Whites, and African-Americans in Selected Activities from the 1982 and 1985 Surveys of Public Participation in the Arts. National Endowment for the Arts Research Division Report # 25. Washington, DC: Seven Locks Press.
Hoffel, E., Rastogi, S., Kim, M. and Shahid, H. 2012. The Asian Population: 2010. Washington, DC: U.S. Census. 2010 Census Briefs. http://www.census.gov/prod/cen2010/briefs/c2010br-11.pdf.
Novak-Leonard, J. and Brown, A. 2011. Beyond attendance: A multi-modal understanding of arts participation. National Endowment for the Arts Research Report #54. Washington, DC: National Endowment for the Arts.
Ostrower, F. 2007a. “Multiple Motives, Multiple Experiences: The Diversity of Cultural Participation.” In B. Ivey and S. Tepper (Eds.), Engaging Art: The Next Great Transformation of America’s Cultural Life. New York: Routledge.
Ostrower, F. 2007b. Nonprofit Governance in the United States: Findings on Performance and Accountability from the First National Representative Study. Washington, DC: Urban Institute. http://www.urban.org/UploadedPDF/411479_Nonprofit_Governance.pdf
Ostrower, F. 2007c. APPENDICES (Expanded Version, July 2007) to Nonprofit Governance in the United States: Findings on Performance and Accountability from the first National Representative Study. Washington, DC: Urban Institute. http://www.urban.org/UploadedPDF/411479_appendices.pdf.
Ostrower, F. 2002. Trustees of Culture: Power, Wealth, and Status on Elite Arts Boards. Chicago: U. of Chicago.
Rosenstein, Carole. 2006. How Cultural Heritage Organizations Serve Communities Priorities, Strengths, and Challenges. Washington, DC: Urban Institute. http://www.urban.org/UploadedPDF/311376_cultural_heritage_orgs.pdf.
Tepper, S. and Gao, Y. 2008. “Engaging Art: What Counts?” In S. Tepper and B. Ivey (eds.) Engaging Art: The Next Great Transformation of America’s Cultural Life. New York: Routledge.

32
Triplett, T. and Ostrower, F. 2007. “Sampling, Weighting, and Variance Estimation for the 2005 Urban Institute National Survey of Nonprofit Governance.” Appendix D in Ostrower, F. APPENDICES (Expanded Version, July 2007) to Nonprofit Governance in the United States: Findings on Performance and Accountability from the first National Representative Study. Washington, DC: Urban Institute. http://www.urban.org/UploadedPDF/411479_appendices.pdf.