diversity in the city: ethnic & socio-economic segregation in schools in amsterdam: erasmus...
TRANSCRIPT

Diversity in the City: Ethnic & Socio-economic Segregation in Schools in Amsterdam:
Erasmus Intensive Program – Sofia – 2012 - Femke Roosma

Outline
• Amsterdam: a divers but segregated city
• Dutch historical and institutional context
• Definitions: ethnic & socio-economic segregation
• Segregation in Amsterdam schools: facts & figures
• The role of free school choice in segregation
• Why is segregation a problem?
• Social policies for desegregation
• Discussion Questions

Amsterdam: a Diverse City
Capital of the Netherlands, 770.000 inhabitants, 177 nationalities
50 % natives, 15 % western-non-natives, 35 % non-western-non-natives.
Migrants from:
• (Former) Colonies as Suriname, Netherlands Antilles, Indonesia,
• Labour migrants from Morocco, Turkey
• Refugees from Africa, former Yugoslavia, Middle East
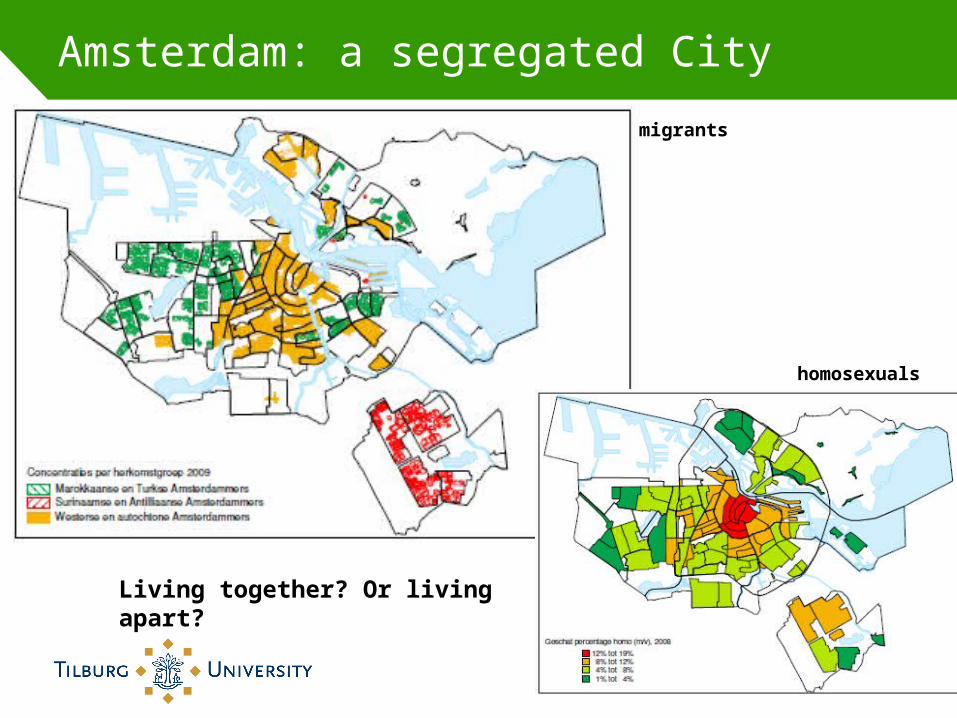
Amsterdam: a segregated City
Living together? Or living apart?
migrants
homosexuals

Amsterdam: segregated schools

Dutch Historical / Institutional Context
• 1848: Free School Choice
People were allowed to found their own schools
• 1848 – 1917: “Schoolstrijd”
But schools were not equally funded:
- public schools were funded
- private schools with a (Christian) denomination were not funded
• 1917: Pacification
Christian parties and liberal (and socialist) parties made a package deal:
- equal funding of public private schools
- universal suffrage (equal voting rights)• 1917 – now: Free school choice is a seen as fundamental right

Dutch Historical / Institutional Context
Educational System• Full-time education compulsory: 5-16 years
• Primary School: 4-12 years
• Secondary School: 12-16/18 years
• School system: relatively stratified, early selection
• Schools of different denomination
Diversity in Schools
• Now: about 15% of students in primary & secondary education has a non-Western background.
• But, due to residential segregation and free school choice ethnic minorities are not distributed equally between Dutch schools...
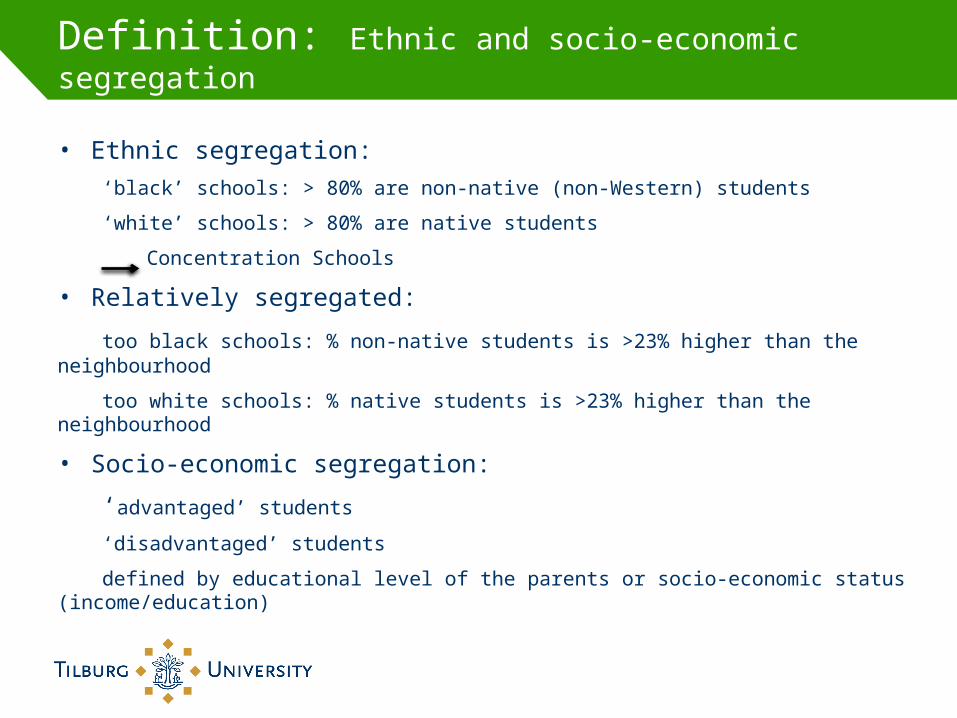
Definition: Ethnic and socio-economic segregation
• Ethnic segregation:
‘black’ schools: > 80% are non-native (non-Western) students
‘white’ schools: > 80% are native students
Concentration Schools
• Relatively segregated:
too black schools: % non-native students is >23% higher than the neighbourhood
too white schools: % native students is >23% higher than the neighbourhood
• Socio-economic segregation:
‘advantaged’ students
‘disadvantaged’ students
defined by educational level of the parents or socio-economic status (income/education)

Segregation in Amsterdam: facts & figures
The Netherlands:• About 10% of all schools in the Netherlands are defined as ‘black schools’.
• In the four largest cities the number of ‘black schools’ (80% non-native) is about 40%
Amsterdam:Primary schools 2009/2010: % and [abs]
Total 203 schools
Ethnic Segregation Black Mixed White
33% 67 51% 104 16% 32
Relative Segregation
Too black Mixed Too white
12% 24 82% 167 6% 12
Too advantaged Mixed Too disadvantaged
10% 21 87% 175 3% 7
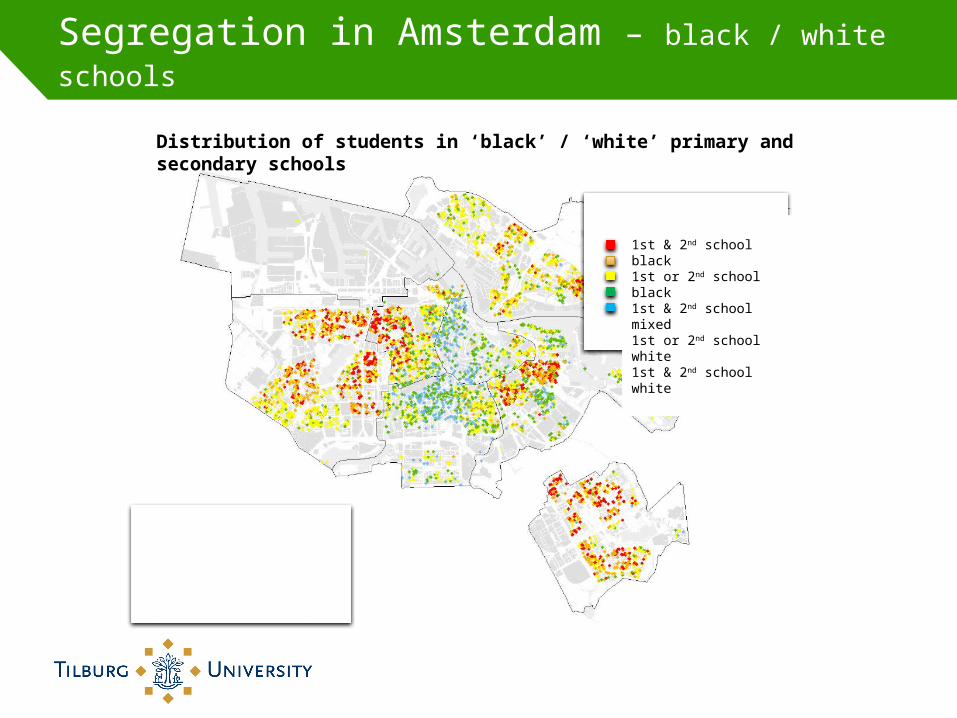
Segregation in Amsterdam – black / white schools
1st & 2nd school black1st or 2nd school black1st & 2nd school mixed1st or 2nd school white1st & 2nd school white
Distribution of students in ‘black’ / ‘white’ primary and secondary schools

Segregation in Amsterdam: too black / too white
< 25%25-50%50-75%> 75%
Number of non-natives in neighbourhood
Too blackToo whiteMixed
Primary schools
Too ‘black’ and too ‘white’ primary schools
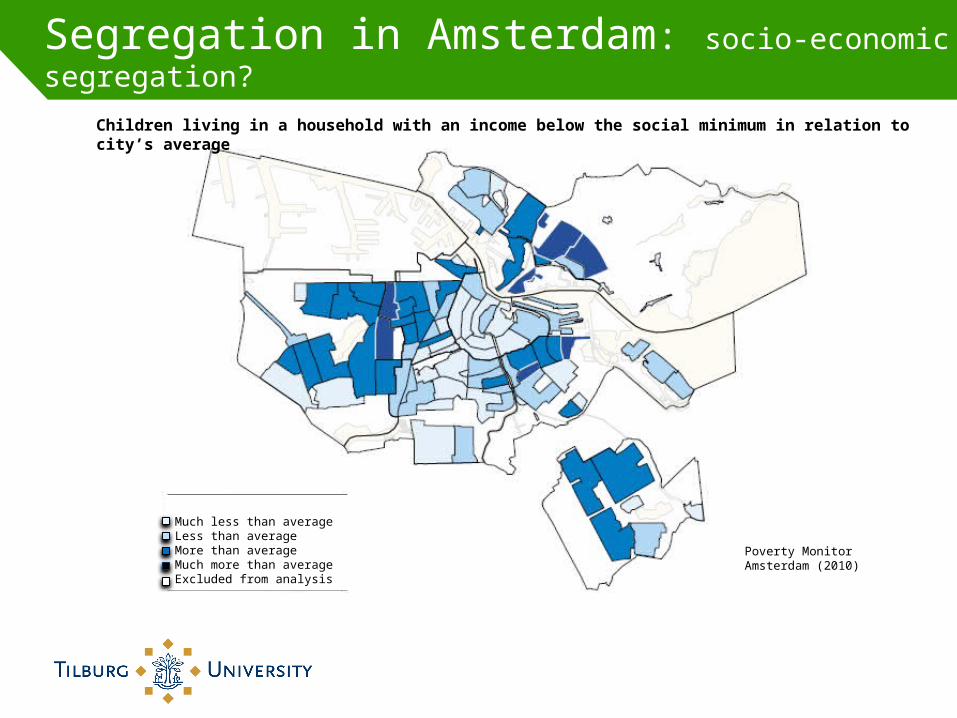
Segregation in Amsterdam: socio-economic segregation?
Much less than averageLess than averageMore than averageMuch more than averageExcluded from analysis
Children living in a household with an income below the social minimum in relation to city’s average
Poverty Monitor Amsterdam (2010)

The Role of Free School Choice
Percentage of students that go to a primary school that is further away and more ‘white’ than the three nearest primary schools
NativesNon-natives
Mostly white neighbourhood
Mostly black neighbourhood
Black neighbourhood
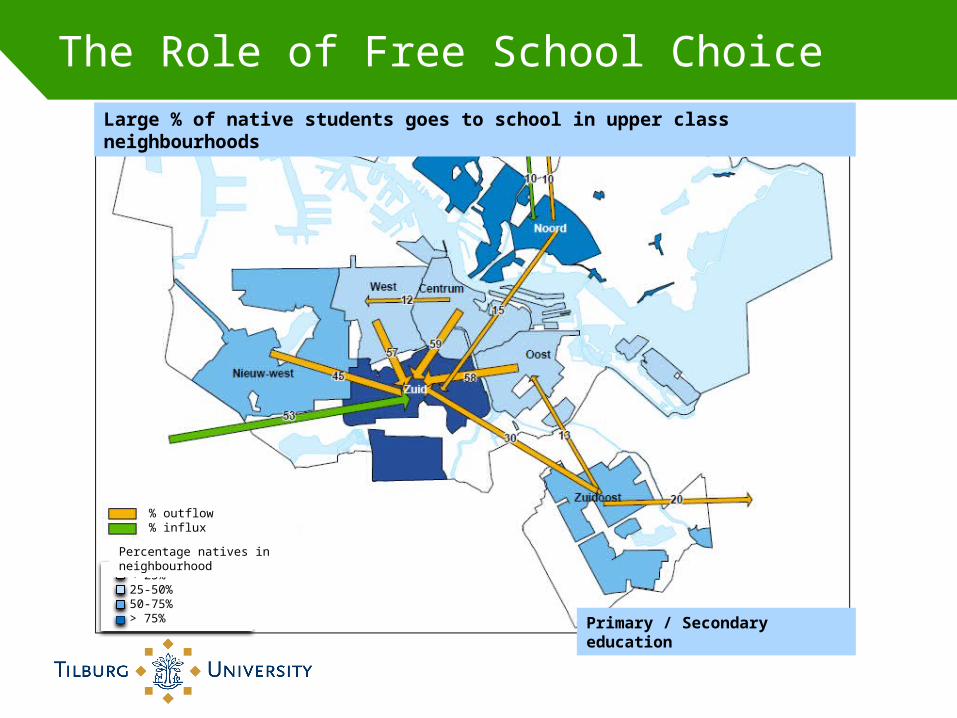
The Role of Free School ChoiceLarge % of native students goes to school in upper class neighbourhoods
% outflow% influx
< 25%25-50%50-75%> 75%
Percentage natives in neighbourhood
Primary / Secondary education

The Role of Free School Choice
Non-native students show a more mixed pattern
% outflow% influx
< 25%25-50%50-75%> 75%
Percentage non-natives in neighbourhood
Primary / Secondary education

The Role of Free School Choice
Parents of native pupils:
- Special educational
denomination
- High status school
- Quality of education
- Not too high % non-native
pupils
- Culturally similar
Parents of non-native pupils:
- Quality of education
- Special training programs
- Neighbourhood
Why parents chose different schools...

Why is school segregation a problem? (1)
Sociologists (Dronkers, Tesser, Gijsberts, Driessen, Paulle, Karstens) point to different reasons:
Socio-economic segregation:
Educational performance
• Theory: Students in schools with more disadvantaged students perform worse
- level is adjusted to disadvantaged students
- less time to serve all students
- less social capital
• Empirical Effects:
- Reasonable empirical effects when percentage disadvantaged is > 30%
- Balance should be 70% advantaged and 30% disadvantaged (Paulle, 2007)
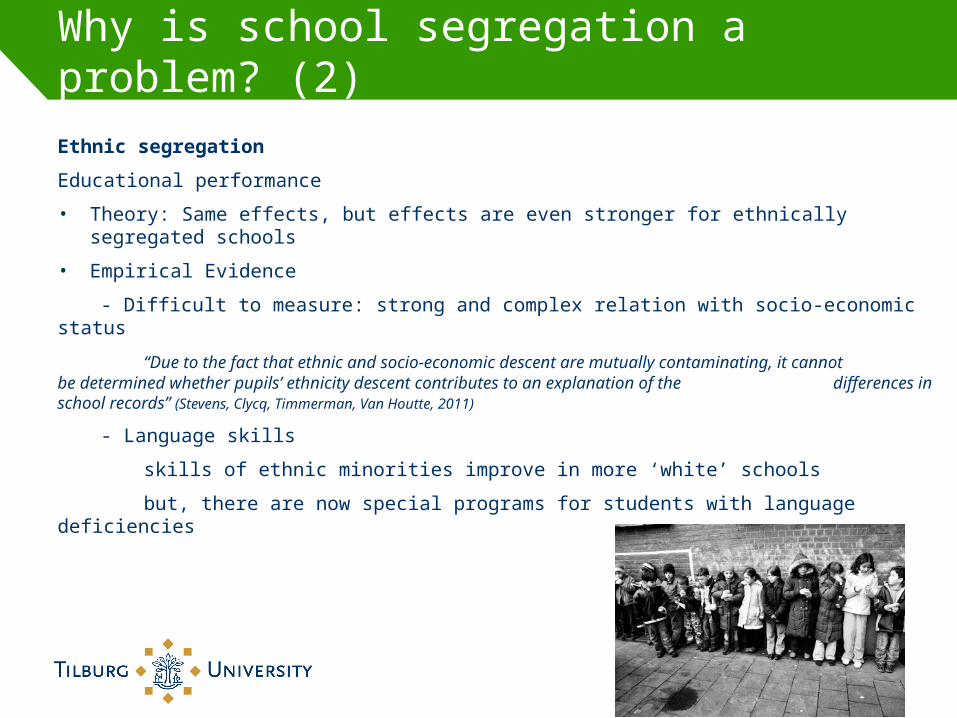
Why is school segregation a problem? (2)
Ethnic segregation
Educational performance
• Theory: Same effects, but effects are even stronger for ethnically segregated schools
• Empirical Evidence
- Difficult to measure: strong and complex relation with socio-economic status
“Due to the fact that ethnic and socio-economic descent are mutually contaminating, it cannot be determined whether pupils’ ethnicity descent contributes to an explanation of the differences in school records” (Stevens, Clycq, Timmerman, Van Houtte, 2011)
- Language skills
skills of ethnic minorities improve in more ‘white’ schools
but, there are now special programs for students with language deficiencies

Why is school segregation a problem? (3)Ethnic segregation
Interethnic contact / Social integration
• Theory
- Contact theory: the more contact, the better effects on integration / acceptation
- Ethnic competition theory: the more contact, the more competition
- Well being of minorities
- ‘Citizenship’
• Empirical Evidence
- Not much research on this topic
- Mixed schools: more chances on interethnic friendships, but not better perceptions or better integration for those who do not have these friendships.
- Better effects on well being for the minority group of students in more mixed groups
- No research on the effect on citizenship
Why is school segregation a problem?
Equal ChancesDiversity/
Living together
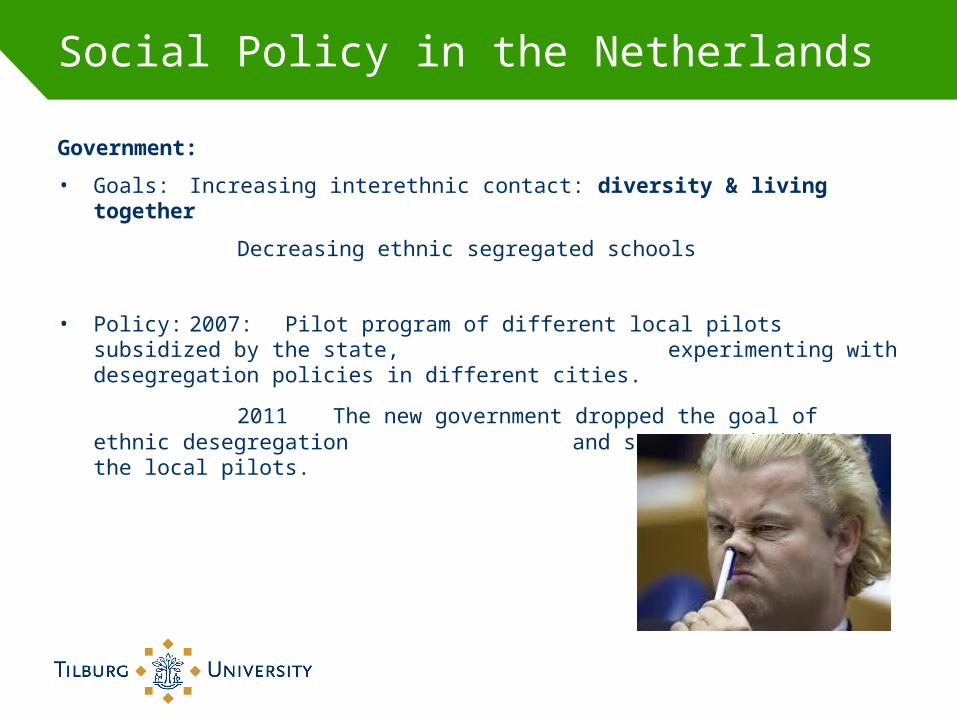
Social Policy in the Netherlands
Government:
• Goals: Increasing interethnic contact: diversity & living together
Decreasing ethnic segregated schools
• Policy: 2007: Pilot program of different local pilots subsidized by the state, experimenting with desegregation policies in different cities.
2011 The new government dropped the goal of ethnic desegregation and stopped subsidizing the local pilots.

Social Policy in Amsterdam
Amsterdam:
• Agreement on Colourful Primary Schools
• Goals: Children go to schools in their neighbourhood: diversity & living together
Focus on local schools: limiting ‘too black’ and ‘too white’ schools
• Policy: Neighbourhoods develop ‘placement-policies’
Different pilot projects: local school policy
- central application system: assign students to a school in neighbourhood
- priority for siblings, students from priority areas and parents’ initiatives
Support Parents Initiatives
- group applications
Housing Policies: desegregate neighbourhoods
• Outcomes No clear results yet: process needs more time
Pilots are probably extended (time and place)

Social Policy in other cities
Nijmegen:
• Goals: Socio-economic desegregation of primary schools: equal chances
Ideal balance of 70% / 30% advantaged/disadvantaged students
• Policy: Pilot project
- central application system: city wide (smaller city)
- priority for siblings, children from the neighbourhood and children who contribute to the 70% / 30% advantaged/disadvantaged
Support for parents by making school choices
Support for schools with a mixed population
- mixed schools do not lead directly to better integration
• Outcomes: First choice: 1293 Second choice: 46 Third choice:14
- 32 objected, 22 went to court, 14 students were rejected
- better 70/30 match, more children go to school in neighbourhood
Social Policy in other countries
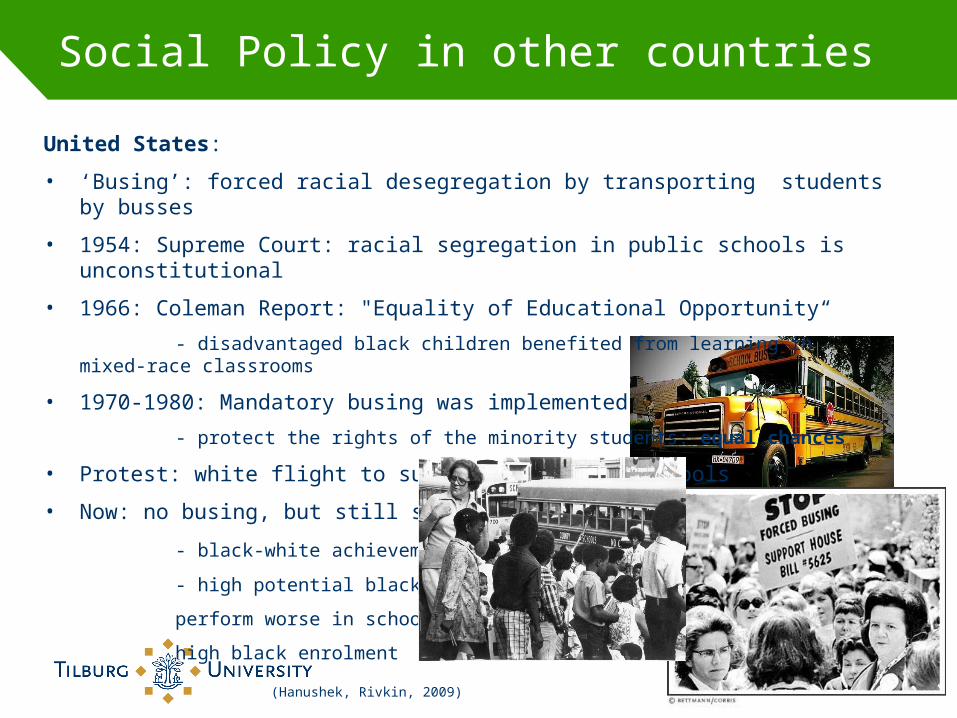
United States:
• ‘Busing’: forced racial desegregation by transporting students by busses
• 1954: Supreme Court: racial segregation in public schools is unconstitutional
• 1966: Coleman Report: "Equality of Educational Opportunity“
- disadvantaged black children benefited from learning in mixed-race classrooms
• 1970-1980: Mandatory busing was implemented
- protect the rights of the minority students: equal chances
• Protest: white flight to suburbs or private schools
• Now: no busing, but still segregation.
- black-white achievement gap
- high potential black students
perform worse in schools with
high black enrolment
(Hanushek, Rivkin, 2009)

Voluntairy Segregation?
LGBT’s & School for bullied children

Discussion Questions
• Is segregation a problem? Is it a problem of cities?
• Is segregation a problem big enough to enforce desegregation by the state?
- in order to create equal chances?
- in order to make people live together? (diversity)
- also when it limits free choice?
• Can you think of other forms of segregation in your country / city?
• What kind of desegregation policies would work?

Thank you for your attention!
Questions?

Definition: Ethnic or socio-economic segregation? (2)
• Ethnic segregation = Socio-economic segregation?
• Thus: Non-native pupils with a higher socio-economic background go to ‘white’ primary schools.
Non-native pupils with a lower socio-economic background go to ‘black’ primary schools
% Non-native pupils in primary school
Socio-economic status
Non-native / non- western pupils
Native pupils
Low High Low High<10% 38 62 3 9710-24% 59 41 10 9025-49% 71 29 16 8450-79% 87 13 31 69>80% 94 6 36 64Total 86 14 13 87
Source: SCP (2008) Betrekkelijke Betrokkenheid