diva 2.0: integrating daylight and thermal simulations...
TRANSCRIPT
DIVA 2.0: INTEGRATING DAYLIGHT AND THERMAL SIMULATIONS USING RHINOCEROS 3D, DAYSIM AND ENERGYPLUS
J. Alstan Jakubiec1 and Christoph F. Reinhart1
1 Harvard University, Graduate School of Design, Department of Architecture
ABSTRACT This paper describes a highly optimized design workflow for integrating detailed daylighting analysis using Radiance / DAYSIM with thermal load simulations using EnergyPlus within DIVA, a sustainable analysis plugin for the Rhinoceros 3D Nurbs modeling program. First, the importance of using detailed daylighting models is discussed such that occupant comfort and behavior when operating blinds can be accurately considered. DIVA�’s method of this implementation is then described for a single-zone perimeter office model. Finally, schedules and energy results generated using EnergyPlus defaults are compared to those from detailed analysis in DIVA/DAYSIM. The merits of an integrated workflow are discussed, and it is shown that such an analysis has a significant impact on lighting, heating and cooling loads for a building.
INTRODUCTION It is typical in architectural design to create detailed geometric building models for visualizations and client presentations. These existing models can be used directly for high quality daylight analysis from programs such as 3D Studio Max (Reinhart, 2009), Rhinoceros 3D (Lagios et al., 2010) and Sketchup. Such analysis have become more common and sophisticated in recent years with the inclusion of occupant behavior models which predict visual comfort, the status of shading devices and electric lighting for each hour in the year. To complete such advanced daylight analysis, an integreated thermal analysis is required. However, when it comes time to analyze energy, the standard practice is to rebuild these models in another software tool, often generating daylighting information in energy tools which are poorly equipped for such an analysis because, for example, walls are considered to be infinitely thin and lighting prediction algorithms are not very accurate. This begs the question, what are the associated biases of sophisticated daylighting tools such as Radiance and DAYSIM versus modern energy simulation tools such as EnergyPlus? Radiance and DAYSIM employ a reverse raytracing algorithm based on the physical behavior of light in a volumetric, three-dimensional
model which should most accurately represent reality (Ward, 1994). EnergyPlus on the other hand, utilizes the split flux method based upon a representation of complex geometries as planes when predicting interior daylight levels (US Department of Energy, 2010). Ecotect is also a simulation tool which follows the planar, split-flux model of daylighting as it is essentially a thermal modeling tool with an advanced interface (Autodesk, 2011). This has been shown to have significant shortcomings in predicting the daylight available in a space, especially as the distance from the façade increases and external obstructions are accounted for (Ramos and Ghisi, 2010). Thusly, the building simulation community is one divided by two approaches to the problem of daylight in energy simulations. The �‘single model�’ camp, utilizes only energy models to account for daylight, thermal and energy analysis. This is probably warranted in situations where electric lighting is not a large component of the total building loads such as in residential programs. The �‘hybrid model�’ camp predicts daylighting and thermal consequences in two separate models which share lighting and shading schedules (An and Mason, 2010). This method accounts for a more accurate representation of reality; however, it also takes more time to run such a two-model simulation along with a concerted effort to organize and transfer data from one simulation environment to another. The method presented in this paper takes a more integrated approach to this problem. DIVA, which stands for Design Iterate Validate Adapt, is an environmental analysis plugin for the Rhinoceros 3D Nurbs modeling program (McNeal, 2010). DIVA performs a daylight analysis on an existing architectural model via integration with Radiance and DAYSIM (Reinhart et al., 2011). Users of the plugin can then construct a simple perimeter one-zone volume for energy analysis based on the existing detailed architectural geometry. Schedules generated by the daylighting analysis are then automatically shared with the energy simulation. This method allows the rapid visualization of daylight and energy consequences from an architectural design model where users can easily test multiple design variants for daylight and energy performance without manually exporting to multiple softwares. The
Proceedings of Building Simulation 2011: 12th Conference of International Building Performance Simulation Association, Sydney, 14-16 November.
- 2202 -
schedules are automatically saved into comma separated value (CSV) files which can be used as inputs into more complex energy models. This paper explains a general process of coupling daylight and energy simulations using the �‘hybrid model�’ approach which has been automated in the DIVA plugin as of version 2.0. First, the necessity for such integration is discussed by comparing illuminance predictions, visual comfort analysis and schedule generation between DAYSIM and EnergyPlus. Next, the DIVA implementation of simulation integration is discussed. Finally, results are presented for a simple South-facing office space which illustratres the necessity to use more accurate lighting predictions in energy models.
SIMULATION MODELS
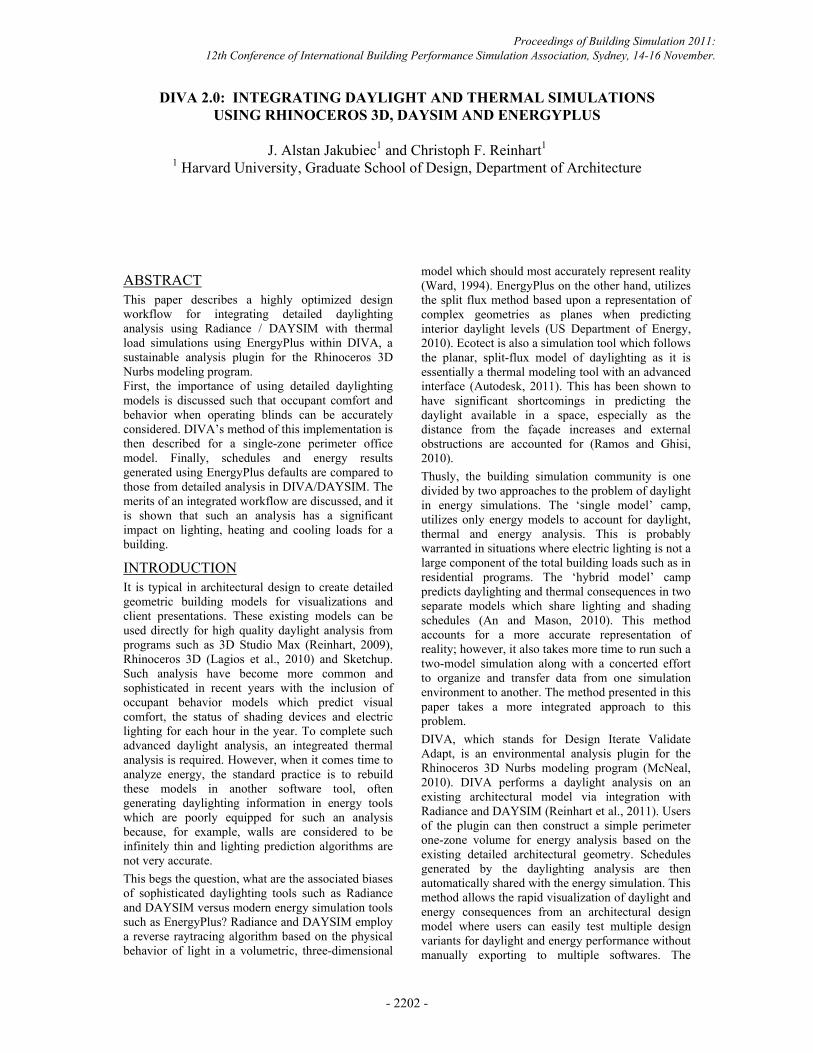
Figure 1 Standard South-facing office space modeled
for daylight and energy analysis
Standard Office Model For the purposes of this paper, a �‘standard�’ office model was constructed as detailed in Figure 1 above. For the energy model, only the exterior (colored) surfaces are considered in the thermal calculation with all others being adiabatic so as to represent a portion of a perimeter zone in a larger building. Six users share the space, each contributing a load of 70W. The lighting power density at full power is 10.74W/m2. Exterior walls are modeled as having a U-Value of 0.26 W/m2K. Windows have a visual transmittance of 0.76, a solar heat gain coefficient of
0.60 and a U-Value of 2.61 W/m2K. All simulations are performed in the Boston, MA climate with no exterior obstructions. The office is conditioned by electric cooling with a COP of 4.94 and gas heating with a burner efficiency of 0.80. Radiance simulation parameters and materials are detailed in Table 1.
Table 1 Radiance simulation parameters and materials
Simulation Parameter Value ab (ambient bounces) 5 ad (ambient divisions) 1024 as (ambient supersamples) 16 ar (ambient resolution) 256 aa (ambient accuracy) 0.10
Radiance Material Floor 0.20 Reflectance Ceiling 0.80 Reflectance Walls 0.50 Reflectance Exterior Ground 0.20 Reflectance Glazing 0.76 Transmittance
Daylight Simulations in DAYSIM and EnergyPlus Both DAYSIM and EnergyPlus calculate annual hourly illuminance values and glare metrics which are used to determine the status of shading devices such as venetian blinds and electric lighting requirements for a space; however, the methods employed by both programs are radically different. These differences will be discussed in the following subsections. Annual Interior Illuminance Calculations EnergyPlus predicts the average diffuse and direct luminance incident on each window surface for each sun-up hour in the annual typical meterological year (TMY) climate file utilizing one of four possible CIE sky distributions. In the case of a window shaded with a venetian blind, the shade is modeled as a perfect uniformly diffusing surface. To determine the annual illuminance of a point in the space, daylight factors which relate the contribution of each window to the point of interest are calculated. These are then multiplied by the direct and diffuse luminance at the window for each sunlit hour in the year (US Department of Energy, 2010). Interior reflections of light are modeled using the split flux method (Hopkinson et al., 1954) where the upward and downward luminous flux from the window is split into two components. Each split component is reflected by an average weighted reflectance of the surfaces above and below the window. This kind of calculation works best in rooms where the ratio of width to depth to height is 1:1:1 which almost never occurs in reality, and thusly such calculations often result in substantial inaccuracies. DAYSIM employs a daylight coefficient method based on raytrace calculations to generate an annual illuminance profile at each point of interest (Reinhart and Walkenhorst, 2001). For its diffuse calculation, rays are cast to a sky consisting of 145 Tregenza
Proceedings of Building Simulation 2011: 12th Conference of International Building Performance Simulation Association, Sydney, 14-16 November.
- 2203 -

bins. For the direct component, 65 direct solar positions are considered. In DAYSIM, each time a ray reflects from a surface, a realistic reflectance value is applied rather than a room-area average. Further, DAYSIM considers direct sunlight entering a space whereas EnergyPlus does not. The contribution for each daylight coefficient is then determined using the Perez all weather sky distribution based on values from the TMY data.
Annual Glare Calculations Annual glare in EnergyPlus is calculated using a slightly modified version of the Cornell Daylight Glare Index (DGI). DGI was derived from human subject studies in daylit interiors for which the visible sky brightness and size was measured; however, it is not considered to be reliable when direct light or specular reflections are present in a field of view (Hopkinson, 1972). This is because it relies only upon mean window luminance and not interior specular reflections or other direct sources of light. Also, only discomfort due to luminous contrast between the window and the ambient conditions determined by the split flux method are considered in EnergyPlus. DAYSIM employs the Daylight Glare Probability (DGP) metric for annual glare predictions (Wienold, 2009). DGP is also a metric derived from subjective user evaluations in sidelit office spaces; however, DGP can evaluate direct sunlight, specular reflections and areas of bright luminance calculated at each hour as glare sources. DGP also uses vertical illuminance calculated at the eye as a parameter which can influence the glariness of a space (Wienold and Christofferson, 2006). This means that in exceedingly bright scenes, discomfort can be predicted even without significant visual contrast where DGI would predict very low glare due to lack of contrast when using identical luminance data.
Schedule Generation Each program, utilizing its own illuminance data can predict the dimming of electric lighting in a space; however, these values will vary substantially. Figure 2 illustrates Daylight Autonomy (DA) predicted by DAYSIM and EnergyPlus as a function of distance from the façade when the blinds are always open and without any external obsturctions. Daylight Autonomy is the percentage of occupied hours in a year where daylighting is met by natural light alone (Reinhart, 2004). These values are measured along the centerline shown in Figure 1 at 0.8m above floor height. For a minimum lighting requirement of 500lx, Figure 2 shows how drastic the predictive differences can be for the typical office space shown earlier. Without any exterior shading or obstructions present, the agreement between DAYSIM and EnergyPlus is not terrible �– the maximum disagreement being about 20% DA for the blinds always open case; however, when exterior shading, urban environment or blinds are considered, the agreement is shockingly poor.
Figure 3 shows the same Daylight Autonomy calculated under conditions where the blinds are always closed. In this case using the same the simple office space, for the identical blind geometry in each program, DAYSIM predicts far greater levels of daylight than does the EnergyPlus split flux method. The falloff as distance from the façade increases is also radically different with a maximum disagreement of about 40% DA.
Figure 2 Daylight Autonomy, 500lx simulated at
increasing façade distance in DAYSIM and EnergyPlus with blinds open
Figure 3 Daylight Autonomy, 500lx simulated at
increasing façade distance in DAYSIM and EnergyPlus with blinds closed
We may also underline the weakness of one of EnergyPlus�’ methods of controlling shading which is based on the measurement of insolation at the window surface. Using a control method where the blinds are down whenever mean window insolation is above 100W/m2, for example, the blinds will almost always be closed. This value could be set higher, but it is unclear what constitutes an appropriate number as much of the insolation could be from diffuse sky radiation, and this will vary with climate. In contrast, DAYSIM�’s version of this is to avoid direct light on a user-defined workplane (see Figure 1) and as a result, blinds will only be closed when direct light likely to cause discomfort is present. Glare calculated in each program can also be used to determine the status of blinds. As noted before, the DGI metric employed by EnergyPlus is probably not an ideal determinant of comfort in modern daylit spaces except under very controlled circumstances where direct light will not enter a space. In such a case, there would likely be no necessity for blinds. It is worth noting that EnergyPlus-generated schedules for window shading rely upon the user having perfect knowledge of the exterior conditions.
Proceedings of Building Simulation 2011: 12th Conference of International Building Performance Simulation Association, Sydney, 14-16 November.
- 2204 -
Blinds are immediately raised when mean window insolation is below 100W/m2 or glare is not experienced (US Department of Energy, 2010); however, this probably does not constitute an accurate occupant behavior. In DAYSIM, blinds are opened by a conscientious (active) user seated near the window each day in the morning and at a noon lunch break. Using the avoid direct sunlight behavior model, if any user experiences direct sunlight on their desk, the blinds are lowered until the end of the lunch break or until the next morning (Reinhart, 2004). The same method applies for users avoiding discomfort glare. The above discussion constitutes a significant reason to use DAYSIM for the generation of electric lighting and window shading schedules which more accurately represent occupant comfort, behavior and the distribution of natural light in a space when compared to EnergyPlus and other split-flux methods.
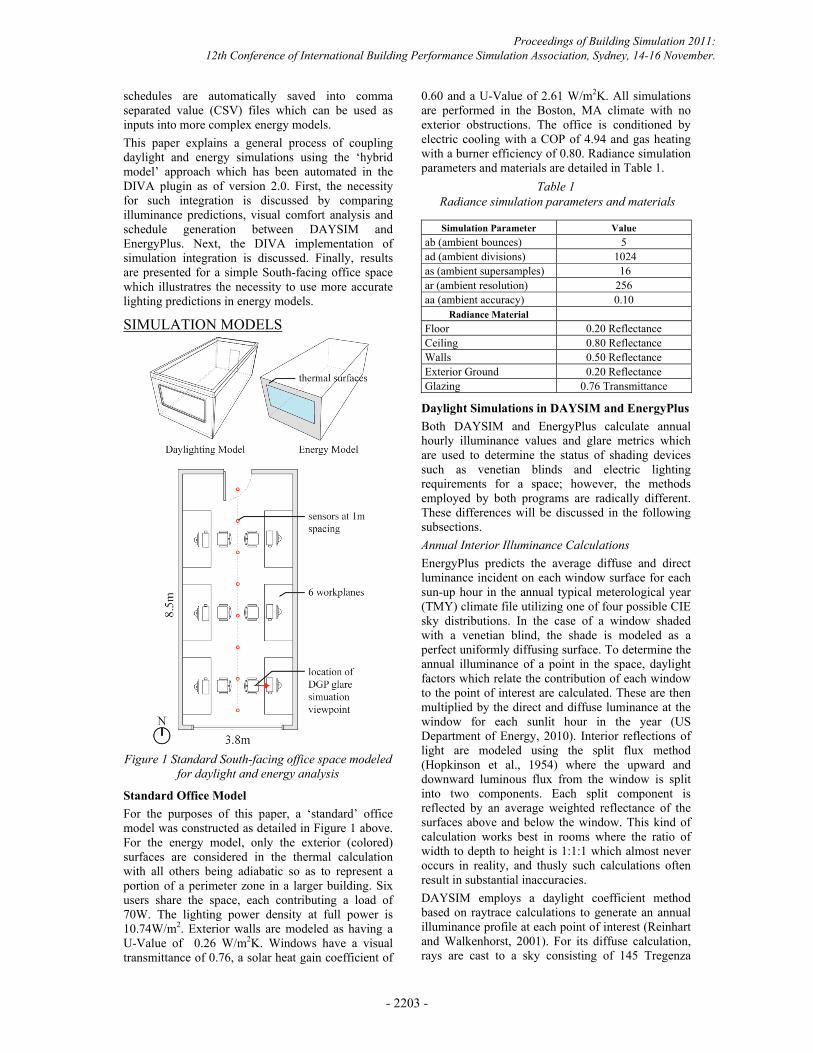
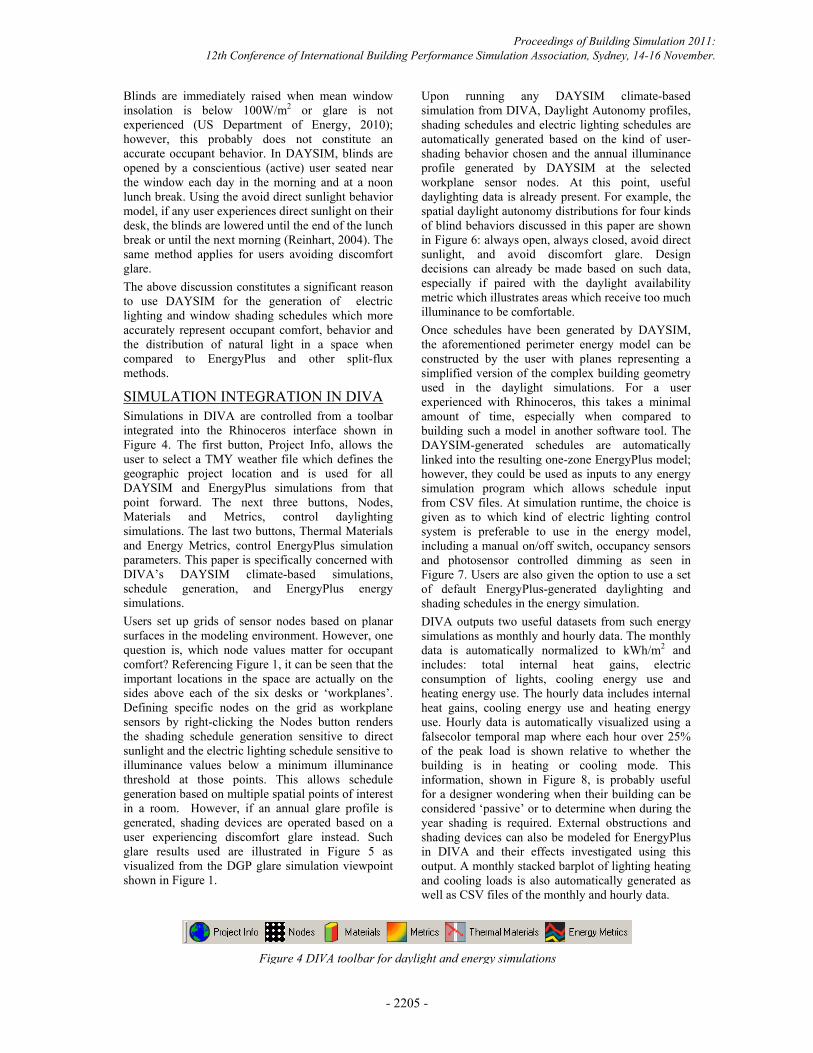
SIMULATION INTEGRATION IN DIVA Simulations in DIVA are controlled from a toolbar integrated into the Rhinoceros interface shown in Figure 4. The first button, Project Info, allows the user to select a TMY weather file which defines the geographic project location and is used for all DAYSIM and EnergyPlus simulations from that point forward. The next three buttons, Nodes, Materials and Metrics, control daylighting simulations. The last two buttons, Thermal Materials and Energy Metrics, control EnergyPlus simulation parameters. This paper is specifically concerned with DIVA�’s DAYSIM climate-based simulations, schedule generation, and EnergyPlus energy simulations. Users set up grids of sensor nodes based on planar surfaces in the modeling environment. However, one question is, which node values matter for occupant comfort? Referencing Figure 1, it can be seen that the important locations in the space are actually on the sides above each of the six desks or �‘workplanes�’. Defining specific nodes on the grid as workplane sensors by right-clicking the Nodes button renders the shading schedule generation sensitive to direct sunlight and the electric lighting schedule sensitive to illuminance values below a minimum illuminance threshold at those points. This allows schedule generation based on multiple spatial points of interest in a room. However, if an annual glare profile is generated, shading devices are operated based on a user experiencing discomfort glare instead. Such glare results used are illustrated in Figure 5 as visualized from the DGP glare simulation viewpoint shown in Figure 1.
Upon running any DAYSIM climate-based simulation from DIVA, Daylight Autonomy profiles, shading schedules and electric lighting schedules are automatically generated based on the kind of user-shading behavior chosen and the annual illuminance profile generated by DAYSIM at the selected workplane sensor nodes. At this point, useful daylighting data is already present. For example, the spatial daylight autonomy distributions for four kinds of blind behaviors discussed in this paper are shown in Figure 6: always open, always closed, avoid direct sunlight, and avoid discomfort glare. Design decisions can already be made based on such data, especially if paired with the daylight availability metric which illustrates areas which receive too much illuminance to be comfortable. Once schedules have been generated by DAYSIM, the aforementioned perimeter energy model can be constructed by the user with planes representing a simplified version of the complex building geometry used in the daylight simulations. For a user experienced with Rhinoceros, this takes a minimal amount of time, especially when compared to building such a model in another software tool. The DAYSIM-generated schedules are automatically linked into the resulting one-zone EnergyPlus model; however, they could be used as inputs to any energy simulation program which allows schedule input from CSV files. At simulation runtime, the choice is given as to which kind of electric lighting control system is preferable to use in the energy model, including a manual on/off switch, occupancy sensors and photosensor controlled dimming as seen in Figure 7. Users are also given the option to use a set of default EnergyPlus-generated daylighting and shading schedules in the energy simulation. DIVA outputs two useful datasets from such energy simulations as monthly and hourly data. The monthly data is automatically normalized to kWh/m2 and includes: total internal heat gains, electric consumption of lights, cooling energy use and heating energy use. The hourly data includes internal heat gains, cooling energy use and heating energy use. Hourly data is automatically visualized using a falsecolor temporal map where each hour over 25% of the peak load is shown relative to whether the building is in heating or cooling mode. This information, shown in Figure 8, is probably useful for a designer wondering when their building can be considered �‘passive�’ or to determine when during the year shading is required. External obstructions and shading devices can also be modeled for EnergyPlus in DIVA and their effects investigated using this output. A monthly stacked barplot of lighting heating and cooling loads is also automatically generated as well as CSV files of the monthly and hourly data.
Figure 4 DIVA toolbar for daylight and energy simulations
Proceedings of Building Simulation 2011: 12th Conference of International Building Performance Simulation Association, Sydney, 14-16 November.
- 2205 -
Figure 5 DIVA annual glare output from standard office space glare viewpoint (user seated near the window)
Figure 6 Daylight Autonomy distributions for various shading control schedules with venetian blinds
Figure 7 DIVA / EnergyPlus metrics menu showing the various lighting control schedules available
Figure 8 DIVA hourly load intensity visualization based on �‘DAYSIM avoid glare�’ schedule
Proceedings of Building Simulation 2011: 12th Conference of International Building Performance Simulation Association, Sydney, 14-16 November.
- 2206 -
COMPARISON OF RESULTS Five different energy simulations of the standard office space were run, changing only the schedules so as to represent the relative impacts of using advanced shading and electric lighting schedules in this kind of perimeter-zone energy model. The five simulations are as follows,
1. baseline model with lights always on when occupied
2. EnergyPlus schedules generated by lowering shades at 100W/m2 window insolation
3. EnergyPlus schedules generated by lowering shades when DGI is greater than 26 at a point 3 meters from the facade
4. DAYSIM schedules generated for users avoiding direct sunlight on workplanes
5. DAYSIM schedules generated for users avoiding discomfort glare
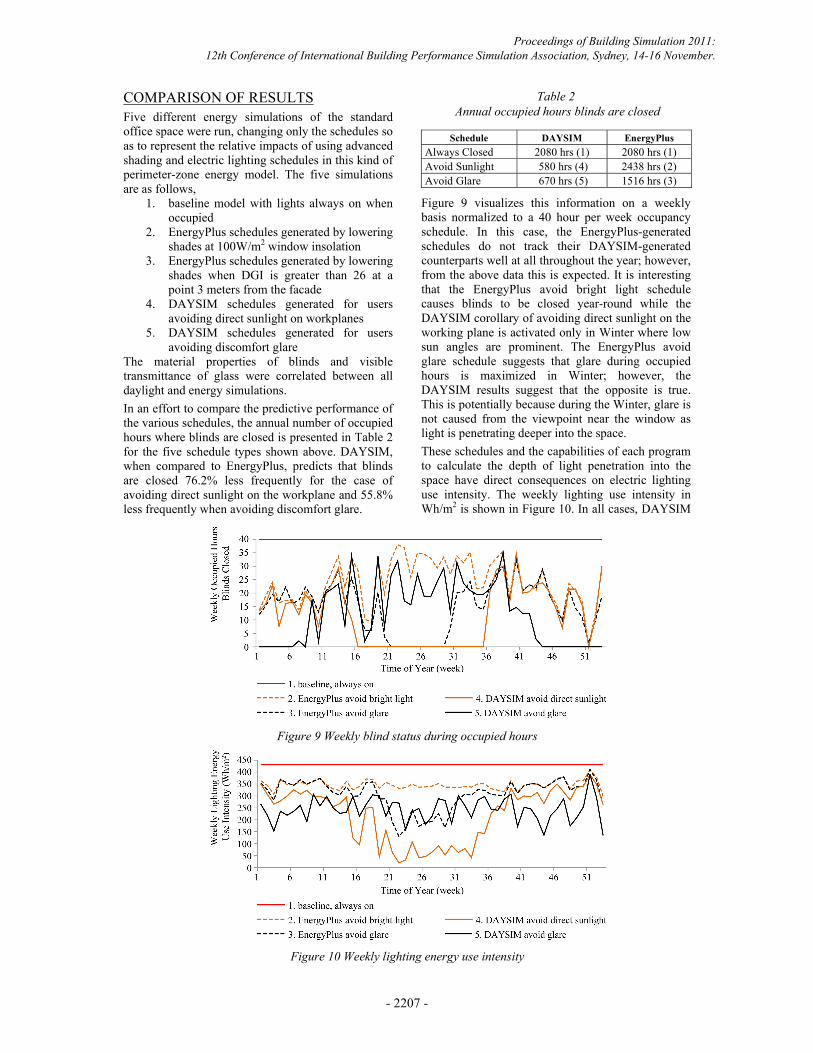
The material properties of blinds and visible transmittance of glass were correlated between all daylight and energy simulations. In an effort to compare the predictive performance of the various schedules, the annual number of occupied hours where blinds are closed is presented in Table 2 for the five schedule types shown above. DAYSIM, when compared to EnergyPlus, predicts that blinds are closed 76.2% less frequently for the case of avoiding direct sunlight on the workplane and 55.8% less frequently when avoiding discomfort glare.
Table 2 Annual occupied hours blinds are closed
Schedule DAYSIM EnergyPlus Always Closed 2080 hrs (1) 2080 hrs (1) Avoid Sunlight 580 hrs (4) 2438 hrs (2) Avoid Glare 670 hrs (5) 1516 hrs (3)
Figure 9 visualizes this information on a weekly basis normalized to a 40 hour per week occupancy schedule. In this case, the EnergyPlus-generated schedules do not track their DAYSIM-generated counterparts well at all throughout the year; however, from the above data this is expected. It is interesting that the EnergyPlus avoid bright light schedule causes blinds to be closed year-round while the DAYSIM corollary of avoiding direct sunlight on the working plane is activated only in Winter where low sun angles are prominent. The EnergyPlus avoid glare schedule suggests that glare during occupied hours is maximized in Winter; however, the DAYSIM results suggest that the opposite is true. This is potentially because during the Winter, glare is not caused from the viewpoint near the window as light is penetrating deeper into the space. These schedules and the capabilities of each program to calculate the depth of light penetration into the space have direct consequences on electric lighting use intensity. The weekly lighting use intensity in Wh/m2 is shown in Figure 10. In all cases, DAYSIM
Figure 9 Weekly blind status during occupied hours
Figure 10 Weekly lighting energy use intensity
Proceedings of Building Simulation 2011: 12th Conference of International Building Performance Simulation Association, Sydney, 14-16 November.
- 2207 -
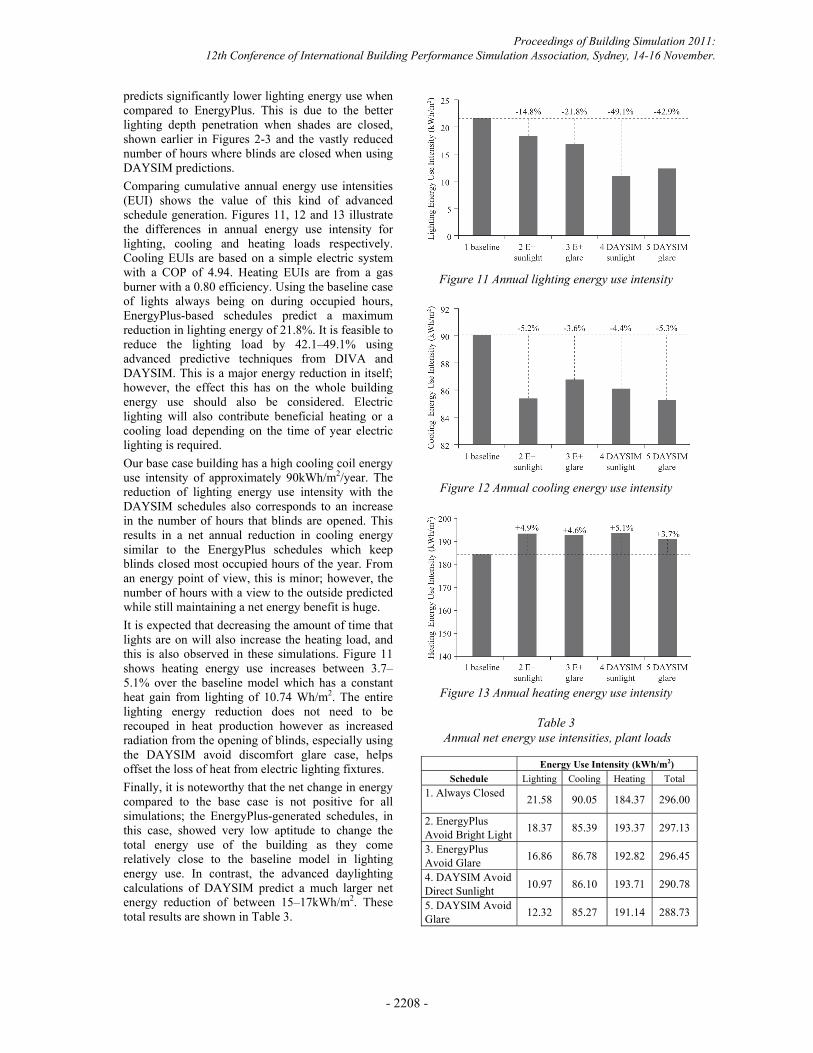
predicts significantly lower lighting energy use when compared to EnergyPlus. This is due to the better lighting depth penetration when shades are closed, shown earlier in Figures 2-3 and the vastly reduced number of hours where blinds are closed when using DAYSIM predictions. Comparing cumulative annual energy use intensities (EUI) shows the value of this kind of advanced schedule generation. Figures 11, 12 and 13 illustrate the differences in annual energy use intensity for lighting, cooling and heating loads respectively. Cooling EUIs are based on a simple electric system with a COP of 4.94. Heating EUIs are from a gas burner with a 0.80 efficiency. Using the baseline case of lights always being on during occupied hours, EnergyPlus-based schedules predict a maximum reduction in lighting energy of 21.8%. It is feasible to reduce the lighting load by 42.1�–49.1% using advanced predictive techniques from DIVA and DAYSIM. This is a major energy reduction in itself; however, the effect this has on the whole building energy use should also be considered. Electric lighting will also contribute beneficial heating or a cooling load depending on the time of year electric lighting is required. Our base case building has a high cooling coil energy use intensity of approximately 90kWh/m2/year. The reduction of lighting energy use intensity with the DAYSIM schedules also corresponds to an increase in the number of hours that blinds are opened. This results in a net annual reduction in cooling energy similar to the EnergyPlus schedules which keep blinds closed most occupied hours of the year. From an energy point of view, this is minor; however, the number of hours with a view to the outside predicted while still maintaining a net energy benefit is huge. It is expected that decreasing the amount of time that lights are on will also increase the heating load, and this is also observed in these simulations. Figure 11 shows heating energy use increases between 3.7�–5.1% over the baseline model which has a constant heat gain from lighting of 10.74 Wh/m2. The entire lighting energy reduction does not need to be recouped in heat production however as increased radiation from the opening of blinds, especially using the DAYSIM avoid discomfort glare case, helps offset the loss of heat from electric lighting fixtures. Finally, it is noteworthy that the net change in energy compared to the base case is not positive for all simulations; the EnergyPlus-generated schedules, in this case, showed very low aptitude to change the total energy use of the building as they come relatively close to the baseline model in lighting energy use. In contrast, the advanced daylighting calculations of DAYSIM predict a much larger net energy reduction of between 15�–17kWh/m2. These total results are shown in Table 3.
Figure 11 Annual lighting energy use intensity
Figure 12 Annual cooling energy use intensity
Figure 13 Annual heating energy use intensity
Table 3
Annual net energy use intensities, plant loads
Energy Use Intensity (kWh/m2) Schedule Lighting Cooling Heating Total
1. Always Closed 21.58 90.05 184.37 296.00
2. EnergyPlus Avoid Bright Light 18.37 85.39 193.37 297.13
3. EnergyPlus Avoid Glare 16.86 86.78 192.82 296.45
4. DAYSIM Avoid Direct Sunlight 10.97 86.10 193.71 290.78
5. DAYSIM Avoid Glare 12.32 85.27 191.14 288.73
Proceedings of Building Simulation 2011: 12th Conference of International Building Performance Simulation Association, Sydney, 14-16 November.
- 2208 -
DISCUSSION What significance does the hybrid model process hold for the design and engineering of buildings? One answer is that it depends on what kind of building is being considered. In buildings with lighting-intensive programs such as offices and schools, there exists an imperative to get lighting levels �‘correct�’ when simulating a space. The prediction of electric lighting use and window shading has far reaching consequences on the total heating and cooling loads for the building. This of course also affects the choice and amount of luminaires and the decision of what control systems to implement as well as peak loads and HVAC sizing. On the other hand, when simulating buildings without a large lighting requirement, belonging to the single model camp is probably reasonable. Further, the automatic generation of schedules based on detailed daylighting analysis produces schedules which can also be shared with a more complex simulation of an entire building. We contend that simulating the daylight throughout an atrium, behind a complex fenestration system or in a dense urban environment will necessarily be very inaccurate using the methods present in many modern energy simulation tools such as EnergyPlus. If accuracy is the goal of an energy simulation, accounting for daylight and occupant behaviour is certainly a crucial part of that. DIVA allows the automatic coupling and visualization of daylight and energy consequences from within the popular architectural modelling tool, Rhinoceros 3D. This is a powerful tool because peak loads and the amount of heating, cooling and lighting necessary annually in a space will change with formal decisions, the design of shading systems, the amount of glazed area and the choice of materials. All of there can be analyzed visually, photometrically and energetically from within DIVA. Putting such tools in the hands of educated designers has the capacity to allow deeper consideration of design decisions in terms of energy use and occupant comfort.
CONCLUSION The evidence presented in this paper suggests that using DIVA/DAYSIM to generate advanced blind and electric lighting schedules for use in thermal analysis tools has a significant effect on simulation results. This is a direct result of using more accurate daylight predictions as well as advanced occupant comfort and behavioural models to determine the status of blinds. By automating the process of coupling daylight and thermal simulations for simple, perimeter single-zone models, an integrated analysis tool is provided for designers which can be used to provide rapid feedback from within existing design models. Currently, the software is limited to single-zone analysis; however, schedules can be exported
for multiple zones by changing the location of occupants in comprehensive daylight models.
REFERENCES An, J., and Mason, S. 2010. Integrating Advanced Daylight Analysis into Building Energy Analysis. Proceedings of Simbuild 2010. Autodesk. 2011. Autodesk Ecotect Analysis 2011. Hopkinson, R. 1972. Glare from Daylighting in Buildings. Applied Ergonomics 3(4): 206-15. Hopkinson, R., Longmore, J. and Petherbridge, P. 1954. An Empirical Formula for the Computation of the Indirect Component of Daylight Factors. Trans. Illum. Eng. Soc. (London) 19, 201. Lagios, K., Niemasz, J., and Reinhart, C.F. 2010. Animated Building Performance Simulation (ABPS), Linking Rhinoceros/Grasshopper with Radiance/DAYSIM. Proceedings of SimBuild 2010, New York City. McNeel, Robert and Associates. 2010. Rhinoceros Version 4.0, Service Release 8. Ramos, G., and Ghisi, E. 2010. Analysis of Daylight Calculated Using the EnergyPlus Program. Renewable and Sustainable Energy Reviews 14 (7): 1948-58. Reinhart, C. F. 2004. Lightswitch-2002: A Model for Manual and Automated Control of Electric Lighting and Blinds. Solar Energy 77 (1): 15-28. Reinhart, C.F., Lagios, K., Niemasz, J., Jakubiec, A. 2011. DIVA for Rhino Version 2.0. http://www.diva-for-rhino.com/. Reinhart, C.F., and Breton, P.F. 2009. Experimental Validation of Autodesk® 3ds Max® Design 2009 and DAYSIM 3.0. Leukos 6 : 1. Reinhart, C.F., and Walkenhorst, O. 2001. Validation of Dynamic RADIANCE-based Daylight Simulations for a Test Office with External Blinds. Energy and Buildings 33 (7): 683-97. US Department of Energy. 2010. EnergyPlus Engineering Reference.
http://apps1.eere.energy.gov/buildings/energyplus/pdfs/engineeringreference.pdf.
Walkenhorst, O., Luther, J., Reinhart C.F., Timmer, J. 2002. Dynamic Annual Daylight Simulations Based on One-Hour and One-Minute Means of Irradiance Data. Solar Energy 72 (5): 385-95. Ward, G.J. 1994. The RADIANCE Lighting Simulation and Rendering System. Proceedings of the 21st Annual Conference on Computer graphics and interactive techniques, Orlando. Wienold, J. 2009. Dynamic daylight glare evaluation. Proceedings of Building Simulation 2009. Wienold, J., and Christoffersen, J. 2006. Evaluation methods and development of a new glare prediction model for daylight environments with the use of CCD cameras. Energy and Buildings 38 (7): 743-57.
Proceedings of Building Simulation 2011: 12th Conference of International Building Performance Simulation Association, Sydney, 14-16 November.
- 2209 -