disussin pap sis - docs.iza.org
TRANSCRIPT

DISCUSSION PAPER SERIES
IZA DP No. 11790
Sónia CabralPedro S. MartinsJoão Pereira dos SantosMariana Tavares
Collateral Damage? Labour Market Effects of Competing with China – at Home and Abroad
AUGUST 2018

Any opinions expressed in this paper are those of the author(s) and not those of IZA. Research published in this series may include views on policy, but IZA takes no institutional policy positions. The IZA research network is committed to the IZA Guiding Principles of Research Integrity.The IZA Institute of Labor Economics is an independent economic research institute that conducts research in labor economics and offers evidence-based policy advice on labor market issues. Supported by the Deutsche Post Foundation, IZA runs the world’s largest network of economists, whose research aims to provide answers to the global labor market challenges of our time. Our key objective is to build bridges between academic research, policymakers and society.IZA Discussion Papers often represent preliminary work and are circulated to encourage discussion. Citation of such a paper should account for its provisional character. A revised version may be available directly from the author.
Schaumburg-Lippe-Straße 5–953113 Bonn, Germany
Phone: +49-228-3894-0Email: [email protected] www.iza.org
IZA – Institute of Labor Economics
DISCUSSION PAPER SERIES
IZA DP No. 11790
Collateral Damage? Labour Market Effects of Competing with China – at Home and Abroad
AUGUST 2018
Sónia CabralBanco de Portugal
Pedro S. MartinsQueen Mary University of London, Nova SBE and IZA
João Pereira dos SantosNova SBE
Mariana TavaresMaastricht University
ABSTRACT
IZA DP No. 11790 AUGUST 2018
Collateral Damage? Labour Market Effects of Competing with China – at Home and Abroad*
The increased range and quality of China’s exports is a major ongoing development in the
international economy with potentially far-reaching effects. In this paper, on top of the
direct effects of increased imports from China studied in previous research, we also measure
the indirect labour market effects stemming from increased export competition in third
markets. Our findings, based on matched employer-employee data of Portugal covering
the 1991-2008 period, indicate that workers’ earnings and employment are significantly
negatively affected by China’s competition, but only through the indirect ’market-stealing’
channel. In contrast to evidence for other countries, the direct effects of Chinese import
competition are mostly non-significant. The results are robust to a number of checks and
also highlight particular groups more affected by indirect competition, including women,
older and less educated workers, and workers in domestic firms.
JEL Classification: F14, F16, F66, J31
Keywords: international trade, labour market, matched employer-employee data, China, import competition
Corresponding author:Pedro S. MartinsQueen Mary University of LondonMile End RoadLondon, E1 4NSUnited Kingdom
E-mail: [email protected]
* The authors thank João Amador, Andrea Ciani, Robert Gold, Karsten Mau, Pedro Portugal, Jens Suedekum, José
Tavares, and seminar participants at the 9th Economic Geography and International Trade (EGIT) Research Meeting
(Düsseldorf), the University of Essex, Queen Mary University of London, and the ZEW Summer School on Topics and
Methods in Labor Market Research for their helpful comments and suggestions. Pedro S. Martins and João Pereira dos
Santos thank financial support from the European Union (VS/2016/0340) and Fundação para a Ciência e Tecnologia
(PD/BD/128121/2016), respectively. This paper was written while João Pereira dos Santos was visiting Banco de
Portugal, whose hospitality is gratefully recognised. The opinions expressed in the paper are those of the authors and
do not necessarily coincide with those of Banco de Portugal or the Eurosystem. Any errors and omissions are the sole
responsibility of the authors.
1 Introduction
The impact of international trade on labour markets is a classical question (Stolper andSamuelson, 1941) which is currently subject to greater interest. Over recent decades, notonly has international trade grown strongly but its pattern has also evolved significantly:global value chains emerged as a new paradigm for the international organisation of pro-duction while new, labour-intensive countries have become key players in the world market(Krugman, 2008; Hanson, 2012).
In this context, a number of recent studies have examined the micro-level effects of risingimports on different groups of workers (e.g. Autor et al., 2014 and Dauth et al., 2018),generally focusing on the cases of large developed economies or countries with specialisa-tion patterns different from those of emerging economies. This research has documentedsubstantial adjustment costs in the domestic industries most exposed to imports from de-veloping countries, in particular China. These distributional consequences have also led toqualifications regarding the, until recently, very positive views regarding the welfare gainsfrom international trade.
In this paper, we focus on the indirect effects stemming from the increased competition thatone country can generate in the export markets of other economies, focusing explicitly onthe case of China. In other words, China can affect the labour market of country A not onlybecause of its exports to that country but also by reducing the exports of country A to countryB as China increases its exports to country B. Specifically, we propose different measures ofthis indirect effect and analyse their labour market effects.
This indirect, ’market-stealing’ effect can become increasingly important for high-incomecountries, including the US or Germany, as China’s exports are increasingly more diversifiedand sophisticated, while also less reliant on low-wage labour. For less developed countries,the additional competitive pressures in international markets posed by developing economiesin East Asia, in particular China, have already been in play for several years. In fact, the largeexport market share gains of China in low-tech, low-skill products, like textiles, clothing,footwear, electric appliances, and toys, were accompanied by losses in the export shares ofthose industries of several other countries.
Our empirical evidence on both the direct and indirect labour market effects of China’s emer-gence in international trade is based on the case of Portugal. As a (small) open economy witha comparative advantage profile more comparable to that of China than most other developedeconomies (Cabral and Esteves, 2006), Portugal is an interesting country not only to revisitthe direct relationships examined in the literature but also to illustrate the largely undocu-mented indirect effects that we propose here. Indeed, China’s share in goods imports fromPortugal more than tripled, reaching a level in 2008 more than eleven times higher than the
2

one of 1993 (Figure 1). At the same time, the share of total employment in manufacturingin the country nearly halved over the period we consider (1993-2008) and economic growthduring this period was always low (except for 1996-2000).
Figure 1: Portuguese international trade with China and manufacturing employment in Portugal
0
5
10
15
20
25
30
35
40
0
200
400
600
800
1000
1200
1400
1600
1800
1993 1995 1997 1999 2001 2003 2005 2007
As
per
cen
tag
e o
f to
tal e
mp
loym
ent
Mill
ion
s cu
rre
nt U
SD
Portuguese imports from China
Portuguese exports to China
Share of manufacturing industry in total Portuguese employment (rhs)
Sources: CEPII - CHELEM database and Quadros de Pessoal (QP)Notes: Portuguese goods imports from (exports to) China in millions of current US dollars on the left scale and share of full-timeemployees working in the Portuguese manufacturing industry, as a percentage of total full-time private employment on the right scale.
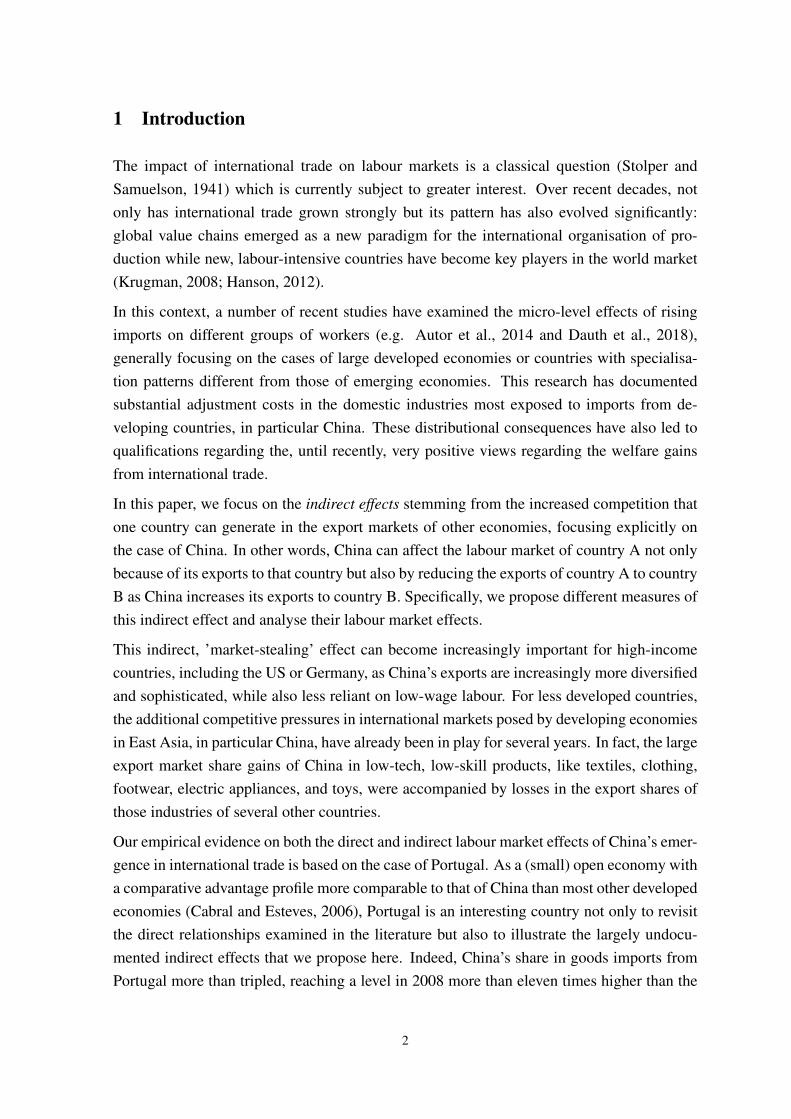
On top of the direct effects, stemming from much larger increases in exports from Chinato Portugal than the other way around, Figure 2 highlights the potentially intensified com-petition from China faced by firms in Portugal in terms of exports to the European Union(EU) markets.1 Between the early 1990s and 2008, the large increase of Chinese exports tothese markets was contemporaneous to a relatively subdued growth of Portuguese exports.Zooming in, Figure 3 depicts a form of the indirect effects that we also consider in this paper,the changes in industry market shares of China and Portugal in the EU market between 1993and 2008, finding suggestive evidence of a negative relationship between the two variables.Greater increases in the market shares of China’s exports tend to be associated with largerlosses in the market shares of Portuguese exports. This is particularly the case in industriesthat accounted for a substantial proportion of Portuguese exports in 1993. This pattern isalso consistent with the evidence in Dauth et al. (2014) that rising Chinese exports lead to astrong diversion of German imports from other (mostly European) countries.
Our empirical analysis of the labour market impacts accrued from the direct and indirecteffects of China’s emergence is based on a matched panel database covering all firms with atleast one employee in Portugal over the period 1991 to 2008. More precisely, our main sam-ple comprises individuals that were full-time employed both in 1991 and in 1993, who are
1A different direct impact, which we also examine, is the enhanced export opportunities for Portuguese firms to China, which alsoincreased significantly but ’only’ by a factor of six.
3
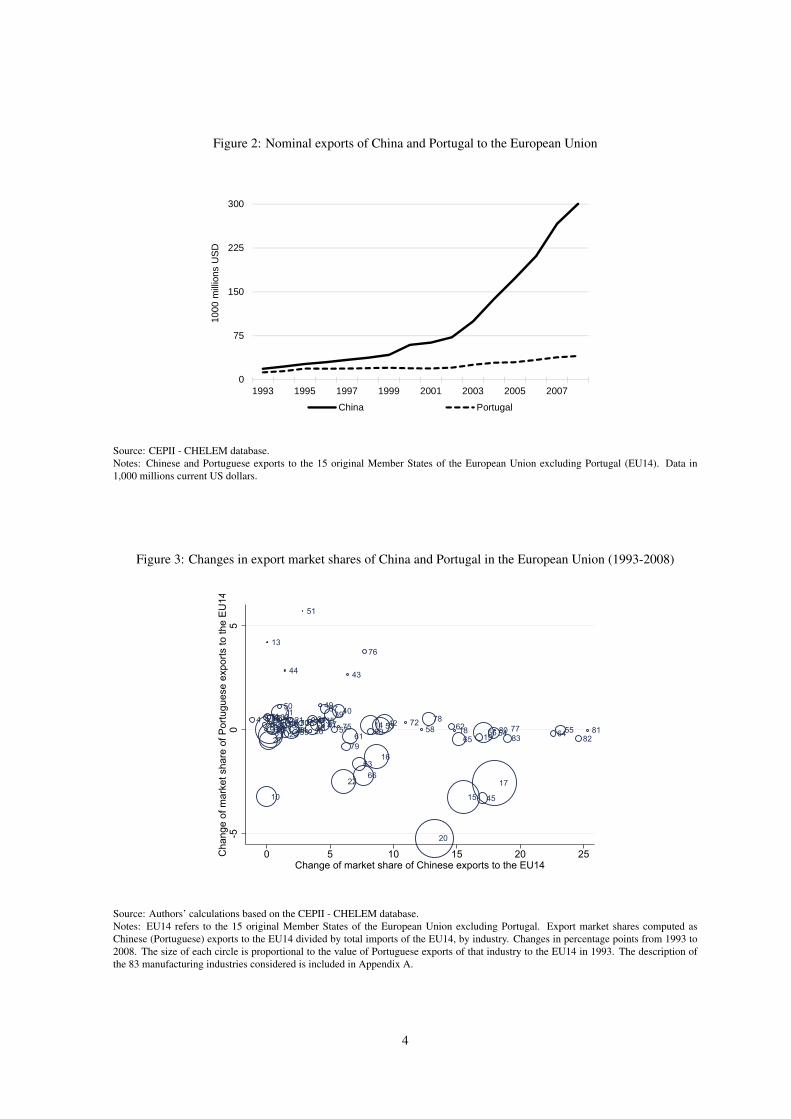
Figure 2: Nominal exports of China and Portugal to the European Union
0
75
150
225
300
1993 1995 1997 1999 2001 2003 2005 2007
1000
mill
ions
US
D
China Portugal
Source: CEPII - CHELEM database.Notes: Chinese and Portuguese exports to the 15 original Member States of the European Union excluding Portugal (EU14). Data in1,000 millions current US dollars.
Figure 3: Changes in export market shares of China and Portugal in the European Union (1993-2008)
1 234 56789
10
1112
13
14
15
16
17
1819
20
21
22
23
24
25 2627
2829
303132
33 3435
36
37
383940
41 42
4344
45
464748
4950
51
5253
54 555657 5859 606162
63
6465
66
67686970
7172
7374 75
76
7778
79
80 818283
-50
5C
hang
e of
mar
ket s
hare
of P
ortu
gues
e ex
ports
to th
e EU
14
0 5 10 15 20 25Change of market share of Chinese exports to the EU14
Source: Authors’ calculations based on the CEPII - CHELEM database.Notes: EU14 refers to the 15 original Member States of the European Union excluding Portugal. Export market shares computed asChinese (Portuguese) exports to the EU14 divided by total imports of the EU14, by industry. Changes in percentage points from 1993 to2008. The size of each circle is proportional to the value of Portuguese exports of that industry to the EU14 in 1993. The description ofthe 83 manufacturing industries considered is included in Appendix A.
4

then followed until 2008 so that we can examine their cumulative wage earnings and years ofemployment over the 1994-2008 period. We exploit the comprehensiveness and richness ofthe data to examine how these workers were affected by China’s exports not only to Portugalbut also to other markets that Portuguese firms traded with. Our identification strategy isinspired by a number of influential articles by David Autor, David Dorn, Gordon Hanson,and several co-authors which combine nationwide changes in sector-specific import expo-sures with the national industry affiliation of workers (Autor et al., 2014; Autor et al., 2015;Acemoglu et al., 2016).2 As before, we exploit the fact that the significant rise of China froma closed to a market-oriented economy and the world’s largest exporter was sudden, largelyunexpected, and motivated by exogenous factors such as changes in domestic policies and intrade agreements.3 To account for possible endogeneity issues due to unobserved domestic(demand-side) conditions, rather than by rising Chinese productivity and market accessibil-ity (supply-side) factors, these papers propose an instrumental variable (IV) approach, whichwe also follow.
Consistent with previous research, we find evidence of negative effects from China’s emer-gence in international trade in the labour market of a developed economy, in this case Portu-gal. However, in striking contrast to evidence for other countries, the direct effects of Chinaimport competition on the domestic labour market of Portugal are mostly non-significant.Here, the negative labour market effects associated with China’s emergence result mainlyfrom the resulting losses in Portugal’s export market shares, not from the growth in Portu-gal’s imports from China. Moreover, the impacts of competition from China exhibit someheterogeneity across individuals, with older, less educated, female and domestic-firm work-ers suffering higher employment and earning losses. Overall, our methodology and findingscontribute to a better understanding of the full range of existing and potential labour marketeffects around the world of emergence and ongoing growth of China - as of other countries.
The remaining of the paper is organised as follows. Section 2 discusses some of the relatedresearch that frames this study. Section 3 details our data sources and identifying assumptionwhereas Section 4 outlines our econometric framework. Section 5 presents our estimationresults. Finally, Section 6 concludes.
2 Related Literature
A number of recent papers have analysed how domestic labour markets adjust to the changesin international trade associated with the integration of low- and middle-income countriesinto the global economy. In this section, we present a non-exhaustive review of studies that
2The same empirical strategy has been used to study whether import competition increased voters’ support for extreme populist partiesin the US (Autor, Dorn, Hanson and Majlesi, 2016) and in Germany (Dippel et al., 2017).
3See Hsieh and Klenow (2009); Hsieh and Ossa (2016); and Brandt et al. (2017).
5

are closely related to our study and provide a framework for our analysis (see Autor, Dornand Hanson (2016) and Muendler (2017) for comprehensive surveys of this research). Thisliterature has focused on three main levels of analysis: the local labour market, the firm, andthe worker.4
In the first level of analysis, an important contribution by Autor et al. (2013) examines theeffect of rising Chinese competition on US local labour markets, exploiting cross-marketvariation in exposure stemming from differences in industry specialisation. InstrumentingUS imports with changes in Chinese imports by other high-income countries, Autor et al.(2013) conclude that rising imports from China caused higher unemployment and reducedwages in US local labour markets that host import competing manufacturing industries. Thesame methodology is followed by Dauth et al. (2014) for Germany, Balsvik et al. (2015) forNorway, Donoso et al. (2015) for Spain, Mendez (2015) for Mexico, Costa et al. (2016) forBrazil, Pereira (2016) for Portugal, and Malgouyres (2017) for France. Recently, Feenstraet al. (2017) also find a negative effect of Chinese import competition on US employment,but argue that this effect was largely offset by the global expansion of US exports.
Other papers study additional dimensions of firms’ reactions in response to the same type ofinternational trade shocks. In a seminal paper, Bernard et al. (2006) show that plant survivaland growth are lower in US manufacturing industries facing higher exposure to imports fromlow-wage countries. Evidence that greater Chinese import competition tends to increaseplant exit and reduce firms’ sales and/or employment growth is available for Chile (Álvarezand Claro, 2009), Mexico (Iacovone et al., 2013), Belgium (Mion and Zhu, 2013), Denmark(Utar, 2014), and for a panel of firms from twelve European countries (Bloom et al., 2016).
Empirical evidence at the worker-level, the level of analysis that we also follow in this paper,is scarcer. Autor et al. (2014) study labour adjustment costs analysing the effects of Chi-nese trade exposure on earnings and employment of US workers from 1992 through 2007.Their findings suggest that workers who experienced higher subsequent import growth intheir original industries of employment gained lower cumulative earnings. These workersalso faced an elevated risk of receiving public disability benefits vis-à-vis other individualsworking in less exposed manufacturing industries. Moreover, affected workers spent lesstime working for their initial employers and in their initial 2-digit manufacturing industries.
Following the same econometric strategy, Ashournia et al. (2014) exploit data from Danishworkers and find that Chinese import penetration decreases wages for low-skilled employeeswhile Hakkala and Huttunen (2016), using Finnish worker-firm data merged with product-level trade data, distinguish between import competition in final products and offshoring.Their results indicate that both types of competition increase the job loss risk for all workers,
4In a different vein, Amiti et al. (2017) provide evidence on the consumer benefits from international competition. They show that thelowering of Chinese import tariffs enhanced China’s competitiveness and translated into a decline of the US price index for manufacturedgoods.
6
in particular for those in production occupations. Majlesi and Narciso (2018) find that indi-viduals living in a municipality more exposed to Chinese import competition are more likelyto migrate to other municipalities within Mexico. In contrast, this trade shock reduces thelikelihood of migrating to the US. Finally, Pessoa (2018) concludes that import competitionfrom China significantly decreases UK workers’ years of employment and earnings, withhigh skilled workers suffering lower losses.
Dauth et al. (2018) examine the impact of rising international trade exposure on individualearning profiles of German manufacturing workers. They complement Autor et al. (2014)by focusing on both imports and export shocks, not only from China but also from EasternEuropean countries, and by studying the effects among heterogeneous employer-employeematches as well as the reallocation process in response to trade shocks. Their results contrastsignificantly with those found in the US context. For Germany, this particular globalisationepisode was mainly positive, but there were winners and losers. High-skilled workers bene-fited the most from the increased export opportunities, while the incidence of import shocksfell mostly on low-skilled workers. In a related paper, Dauth et al. (2017) estimate the aggre-gate effects of rising trade with China and Eastern Europe on the German labour market and,in particular, on the composition of service versus manufacturing jobs. They find that, incontrast to the US, these trade shocks did not accelerate the secular decline of manufacturing(rise of service) employment in Germany.
Most studies on the impact of China’s emergence in international trade on the labour mar-kets of developed countries are focused on what we refer to as the direct effects of China’simports. As explained above, we argue that the impact of indirect effects stemming fromgreater export competition from China may be as important. In this regard, Flückiger andLudwig (2015) use product-country level data and show that increased Chinese competitionin the export markets induces a contraction in the European countries’ manufacturing sec-tors, with significant negative effects on output and employment. In a different vein, Mattooet al. (2017) estimate the effect of movements in China’s exchange rate on the exports ofother developing countries in third country markets. They find that exports to third marketsof countries facing greater import competition from China tend to rise (fall) more as therenminbi appreciates (depreciates). At the firm-level, Utar and Ruiz (2013), using data forMexican exporters, show that intensified Chinese competition in the US had a negative effecton employment, especially on the most unskilled labour sectors. However, they also presentevidence of industrial upgrading in response to the shock. Additionally, Martin and Mejean(2014) reveal how foreign competition from low-wage countries impacted the quality con-tent of French exporters. They show that the improvement is more pronounced in marketsthat faced higher competition.
Our paper contributes to this research by focusing on worker-level effects and offering atemplate for analysis that can be followed by other researchers also interested in quantifying
7

the magnitude of indirect effects of international trade competition in export markets.
3 Data and Identification
3.1 Industry Trade Shocks
One of the main structural changes of the world economy in recent decades has been theintegration of China in international trade. Since the early 1990s and, in particular, after itsaccession to the World Trade Organisation (WTO) in 2001, Chinese trade flows have exhib-ited strong growth, gaining market shares and creating significant competitive challenges tomost developed countries. The period we consider for the shock is between 1993 to 2008,comprising much of China’s export boom. The decision to end the analysis in 2008 wasdictated by the great recession of that year which was followed by a significant decline ininternational trade worldwide.
In this section, we describe the measures of workers’ exposure to trade with China thatwe use. First, we consider a standard measure of direct import competition from China inthe Portuguese domestic market. Second, we assess the indirect effect of competition fromChina in foreign markets to which Portuguese producers export. Third, we describe theinstrumental variable approach used.
Following Autor et al. (2014), the direct import exposure to China of a specific Portugueseindustry j over the τ period 1993-2008 can be measured as the change of its import penetra-tion ratio:
4IPdir j,τ =4Mchn→prt
j,τ
WB j,93, (1)
where Mchn→prtj represents Portuguese imports from China for a specific industry j and
4Mchn→prtj,τ is the change of the latter over the period τ, 1993-2008. WB j,93 is the total
wage bill of industry j in 1993, which is used as a proxy of the initial industry size. Dueto data restrictions, it is not possible to use the initial domestic absorption to normalise eachindustry’s imports, as in Autor et al. (2014), thus we follow Dauth et al. (2018) and use thetotal wage bill to normalise the change in trade flows at the industry-level.
As we discussed before, the level of bilateral trade between two countries does not necessar-ily reflect the degree to which the two countries compete in international markets. In fact,the strong growth of Chinese exports can impact the Portuguese manufacturing sector notonly through intensifying competition in the domestic market, but also in foreign marketswhere Portuguese firms compete with China. In the case of Portugal, as in many other coun-tries, we expect this effect to be particularly relevant given that the product specialisation
8

of the Portuguese exports is relatively similar to the one of China in this period (Cabral andEsteves, 2006). The other 14 original member-states of the European Union (EU14) as awhole constitute the most important destination of Portuguese exports, representing around80 percent of total exports of goods in 1993-2008. Hence, we select these EU14 countries asthe third markets where the competition from Chinese products will be assessed.
The main measure of indirect import competition from China in each industry j from 1993to 2008 that we propose in this paper is:
4IPind j,τ =∑
14C=1
ωprtCj,934Mchn→C
j,τ
WB j,93, with ω
prtCj,93 =
Mprt→Cj,93
M→Cj,93
(2)
where ωprtCj,93 is the share of Portugal on total imports of each EU14 country C in each industry
j in 1993, Mprt→Cj,93 are imports from Portugal by country C and industry j (i.e., industry j
Portuguese exports to country C) and M→Cj,93 are the total imports of country C of industry j.
This weight is then multiplied by the change in the absolute value of imports of country Cfrom China from 1993 to 2008 by industry j, 4Mchn→C
j,τ . The measure is normalised by thewage bill of industry j in Portugal in 1993, similarly to Equation (1).
Equation (2) is a measure of competition of Chinese products in the EU14 market, computedas a weighted average of the change in Chinese exports to each EU14 country by industry,where the weights are the initial shares of Portuguese exports in the imports of each indi-vidual destination market. The notion of individual market used herein refers to each j,Cmarket, measured as imports of industry j by EU14 destination country C correspondingto a total of 1,162 individual markets (83 industries ∗ 14 countries). Intuitively, this meansthat, in each industry and destination country, Portuguese exports will be affected by the in-creased competition from China in a way that is proportional to its initial export share in thatindividual industry-country market. For instance, a Portuguese industry with a large marketshare in Spain in 1993 can be expected to be more exposed to competition from China ifSpain subsequently increases its imports from China of these products compared to a Por-tuguese industry that only has a minor export market share in Spain. We also consider acomplementary measure in our robustness checks.
The direct and indirect measures above, when taken together, reflect the competition fromChina faced by Portuguese firms both in the domestic market, Equation (1), and in its maindestination markets, Equation (2). As discussed in the literature, a problem with Equation (1)as a metric of trade exposure is that the observed changes in Portuguese bilateral trade flowswith China can reflect also Portuguese supply and demand shocks rather than just China’sgrowing productivity and falling trade costs. To capture the China-driven effect on Por-tuguese trade with China, we follow the cited literature and instrument this direct importcompetition variable using Chinese exports to other countries with comparable income lev-
9

els. The countries were selected based on their income similarity to Portugal using data onGDP per capita on purchasing power parities (PPP) in constant 2011 international dollarsover the 1993-2008 period from the World Development Indicators of the World Bank, ex-cluding all members of the EU. Our final instrument group consists of 7 non-EU high andupper middle-income countries: Argentina, Chile , Uruguay , Mexico, Turkey, Israel andNew Zealand. We expect correlations in industry-level demand and supply shocks betweenPortugal and these countries, and potential exogenous effects of shocks in these countrieson the Portuguese labour market, to be minor. Nonetheless, we execute a robustness checkwhere we modify the countries in the instrument group. The instrument is defined as follows:
4IPO j,τ =4Mchn→O
j,τ
WB j,91, (3)
where Mchn→Oj are imports of the 7 selected countries from China in industry j. The mea-
sures are normalised by the wage bill of the respective industry j in Portugal in 1991.
Given the small relative size of the Portuguese economy, the measure of exposure to com-petition from China in export markets defined in Equation (2) is arguably determined in-dependently of Portuguese trade and labour market shocks (see Balsvik et al. (2015) for asimilar argument for Norway). Moreover, since the seminal paper of Bayoumi and Eichen-green (1992), the picture that emerged from the large body of literature on business cyclesynchronisation in the euro area is that the Portuguese cycle is among those with the lowestcorrelation with the euro area cycle and, in particular, the correlation of demand shocks inPortugal is very low (see for Haan et al. (2008) for a review of this literature and Belke et al.(2017) for a recent application). Hence, we argue that the growth in imports from China of agiven industry by each EU14 country is exogenous to the domestic conditions in that industryin Portugal and do not instrument the measure of indirect competition of Equation (2).5
The international trade data we use is from the CEPII - CHELEM database, which reportsbilateral trade flows of goods, expressed in millions of current dollars, since 1967. Thedatabase comprises 84 countries, a World aggregate, and 121 different manufacturing prod-ucts, with a breakdown at the 4-digit level of the International Standard Industrial Classi-fication of All Economic Activities (ISIC), rev.3.6 After several reconciliation procedures,these 121 products were grouped into 83 manufacturing industries based on the most dis-aggregated level of ISIC rev.4. The description of the main steps that we took to reconcileinternational trade and labour market data, as well as of the 83 trade-exposed industries, isincluded in Appendix A.
All nominal trade flows were converted to 2008 euros using the Consumer Price Index (main-5Donoso et al. (2015) follow a similar strategy in their assessment of the effects of exposure to China in Spanish local labour markets.6See De Saint-Vaulry (2008) for a detailed description of this database.
10
land Portugal, excluding housing) and the following official exchange rates: escudo/ECU andECU/dollar until 1998 and euro/dollar from then onwards.
3.2 Worker-level Outcomes
Our labour market database is Quadros de Pessoal (QP), an administrative dataset coveringvirtually all employees and firms based in Portugal, including their unique and time-invariantidentifiers and the firm-worker match. All firms, excluding public administration organi-sations, with at least one employee are obliged by law to provide this information to theMinistry of Labour and also to exhibit it in the firm to facilitate monitoring and compliancewith labour law. The reference month regarding the employee data is October of each year(March until 1993).
The data also provides, for each year, a large number of firm variables (e.g. location, industry,sales, total employment) and worker characteristics (e.g. schooling, gender, different typesof earnings, occupation). The earnings measure we adopted includes the base wage (monthlygross pay for normal hours of work) and the regular subsidies and premiums paid on amonthly basis. Our analysis focused on full-time workers (in any case a large majority ofworkers) and workers paid at least 80 per cent of the minimum wage.7
We analyse the years between 1991 and 2008 (except 2001 for which worker-level data isnot available). Our sample includes workers aged 15 to 65 throughout the whole period of1991-2008 (i.e., 15-48 in 1991 and 32-65 in 2008). We consider only individuals employedboth in 1991 and in 1993 (but not necessarily in 1992), to guarantee a minimum degree oflabour force attachment in the years prior to the outcome period (and to establish a morerepresentative measurement of the workers’ reference wages, as explained below). Our mainsample consists of 602,073 different workers employed in 1991 and 1993 in either manufac-turing or non-manufacturing sectors, who we then follow annually every year until 2008, ofwhich 283,272 individuals are employed in the manufacturing industry in 1991 and 1993.
We use two main worker-level outcomes: (real) wage earnings and years of full-time em-ployment, both computed over the 1994-2008 period.8 We follow Autor et al. (2014) anddefine the wage outcome variable as the cumulative (real) earnings of a worker from 1994to 2008, divided by the average earnings of 1991 and 1993 (base wage). Periods of non-employment in the sample are considered as zero earnings. As to the second main outcomevariable, on employment over the period, we use the number of times (in the October censusmonth) that an individual is present in the data set (implying that the individual has a privatesector labour contract in each year).9
7By law, workers formally classified as apprentices can receive a minimum wage that is, at least, 80 per cent of the full rate. We alsodropped a small number of individuals with missing information in key variables such as gender, age, and industry.
8Nominal wages were inflated to 2008 euros using the Consumer Price Index (Portugal mainland, excluding housing).9Given the nature of the data set, non-employment could represent unemployment, inactivity, emigration or death but also self-
11

3.3 Descriptive Statistics
Table 1 provides descriptive statistics for our main variables. The key dependent variable,relative cumulative earnings, was multiplied by 100 and presents an average value of 1,040.This means that, on average, cumulative (real) earnings from 1994 to 2008 (a 14-year period,as data for 2001 is not available) were more than 10 times higher than the average (real)earnings experienced in 1991 and 1993. Manufacturing workers cumulatively earned, onaverage, 9.5 times their initial average monthly earnings, while non-manufacturing workers,who were not directly exposed to the shocks (defined in terms of imports and exports ofgoods), cumulatively earned 11.1 times their initial average monthly earnings.
Our second depend variable is defined as cumulative years of full-time employment in theprivate sector over the same 14-year period. We find that, on average, a worker has almost8 years with positive earnings, which represents approximately 57 percent (8/14) of the out-come period. Considering the 25th and 75th percentiles, this variable ranges between 5 and12 years of employment (main sample) and 5 and 11 years (manufacturing only).
Among workers initially employed in a manufacturing industry, the average increase in thedirect import penetration ratio faced by workers was 1.9 percentage points. However, theaverage increase in China’s import competition is almost four times bigger (7.0 percentagepoints) in the case of the indirect import penetration ratio, again for workers (originally) inmanufacturing industries.
There is a considerable heterogeneity of the individual trade exposure measures among work-ers. The 25th/75th percentile dispersions are much higher in the case of the indirect importcompetition indicator (over 15 percentage points) than in the case of the direct import pen-etration (1 percentage point). In other words, from 1994 to 2008, the worker at the 75thpercentile experienced a 35 times stronger increase in indirect import competition than theworker at the 25th percentile (almost 4 times stronger for the direct import penetration mea-sure). The instrument displays values that are similar to the ones of the indicator of directimport penetration. All these figures are significantly smaller when all (manufacturing andnon-manufacturing) workers are considered: 53 percent of the full-sample workers were em-ployed in non-manufacturing industries in 1993 and their import penetration ratios are zeroby definition.
employment, part-time activity, measurement error, or employment as a civil servant. Given the nature of the labour market and thedefinition of the sample as of 1993, the first two outcomes (unemployment and inactivity) are by far the most important cases.
12
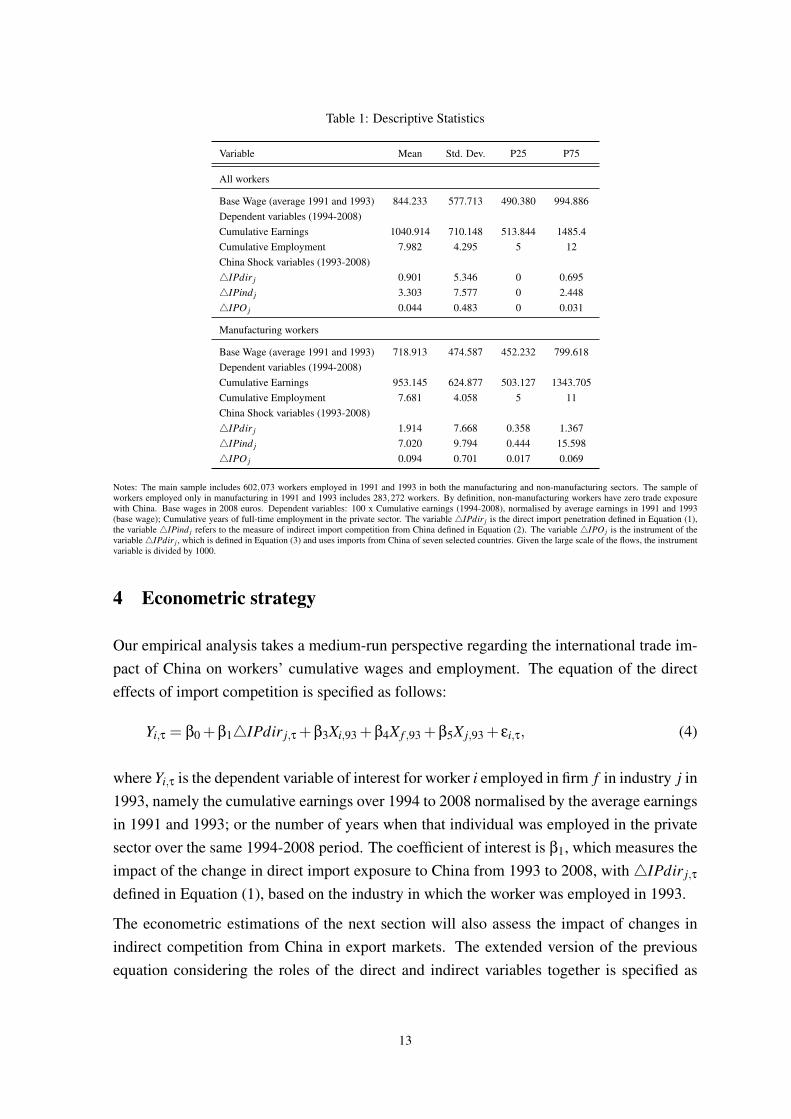
Table 1: Descriptive Statistics
Variable Mean Std. Dev. P25 P75
All workers
Base Wage (average 1991 and 1993) 844.233 577.713 490.380 994.886Dependent variables (1994-2008)Cumulative Earnings 1040.914 710.148 513.844 1485.4Cumulative Employment 7.982 4.295 5 12China Shock variables (1993-2008)4IPdir j 0.901 5.346 0 0.6954IPind j 3.303 7.577 0 2.4484IPO j 0.044 0.483 0 0.031
Manufacturing workers
Base Wage (average 1991 and 1993) 718.913 474.587 452.232 799.618Dependent variables (1994-2008)Cumulative Earnings 953.145 624.877 503.127 1343.705Cumulative Employment 7.681 4.058 5 11China Shock variables (1993-2008)4IPdir j 1.914 7.668 0.358 1.3674IPind j 7.020 9.794 0.444 15.5984IPO j 0.094 0.701 0.017 0.069
Notes: The main sample includes 602,073 workers employed in 1991 and 1993 in both the manufacturing and non-manufacturing sectors. The sample ofworkers employed only in manufacturing in 1991 and 1993 includes 283,272 workers. By definition, non-manufacturing workers have zero trade exposurewith China. Base wages in 2008 euros. Dependent variables: 100 x Cumulative earnings (1994-2008), normalised by average earnings in 1991 and 1993(base wage); Cumulative years of full-time employment in the private sector. The variable 4IPdir j is the direct import penetration defined in Equation (1),the variable 4IPind j refers to the measure of indirect import competition from China defined in Equation (2). The variable 4IPO j is the instrument of thevariable4IPdir j , which is defined in Equation (3) and uses imports from China of seven selected countries. Given the large scale of the flows, the instrumentvariable is divided by 1000.
4 Econometric strategy
Our empirical analysis takes a medium-run perspective regarding the international trade im-pact of China on workers’ cumulative wages and employment. The equation of the directeffects of import competition is specified as follows:
Yi,τ = β0 +β14IPdir j,τ +β3Xi,93 +β4X f ,93 +β5X j,93 + εi,τ, (4)
where Yi,τ is the dependent variable of interest for worker i employed in firm f in industry j in1993, namely the cumulative earnings over 1994 to 2008 normalised by the average earningsin 1991 and 1993; or the number of years when that individual was employed in the privatesector over the same 1994-2008 period. The coefficient of interest is β1, which measures theimpact of the change in direct import exposure to China from 1993 to 2008, with4IPdir j,τ
defined in Equation (1), based on the industry in which the worker was employed in 1993.
The econometric estimations of the next section will also assess the impact of changes inindirect competition from China in export markets. The extended version of the previousequation considering the roles of the direct and indirect variables together is specified as
13

follows:
Yi,τ = β0 +β14IPdir j,τ +β24IPind j,τ +β3Xi,93 +β4X f ,93 +β5X j,93 + εi,τ. (5)
where the indirect dimension4IPind j is defined in Equation (2). As in Autor et al. (2014),all regressions include individuals working in the 83 manufacturing industries that weretrade-exposed to China, as well as workers employed in non-manufacturing sectors, which,by definition, have zero (goods) trade exposure. In the robustness section, we also estimatethe regressions using only the smaller sample of workers employed in the manufacturingindustry in 1991 and 1993.
A number of workers’ characteristics that potentially affect wages (and may be correlatedwith different import exposures) are included in the vector Xi,93, depending on the specifica-tion, namely a female dummy variable, eight formal schooling categories, and eight formalcategories of worker’s qualifications.10 We also included quadratic polynomials in age andin tenure to account for the fact that wages tend to increase at a decreasing rate with years inthe labour market and with years of experience in the same firm.
X f ,93 is a vector of firm-level controls in 1993 that includes two variables capturing the size ofthe firm - the number of employees and the logarithm of turnover (annual sales) -, the shareof equity owned by the government, and twenty eight regional dummies (NUTS 3 level).In addition, the share of foreign equity (a measure of foreign ownership) is also included,following recent evidence of differentiated wage and hiring policies of foreign-owned firms(Hijzen et al., 2013).
Despite the large set of controls already included, we may still miss some potentially relevantcontrols at the sector level, such as technology-related variables. To minimise this potentialissue and absorb additional heterogeneity across individuals, we also include dummy vari-ables for 9 broad aggregate sectors computed based on the 83 trade-exposed manufacturingindustry (the omitted category is the non-manufacturing sector).11 This means that the re-gressions estimate the impact of the trade shock from differences across sub-industries ofeach given broad sector. Moreover, we add a measure of overall import penetration of theindustry in 1993, to control for other shocks associated with a greater level of imports of anindustry that can be confounded with trade with China.
Furthermore, robust standard errors are clustered at the start-of-the-period industry level.More precisely, within the manufacturing industry standard errors are clustered at the levelof the 83 industries of the trade shock. For non-manufacturing sectors, the standard errorsare clustered at the 2-digit level of ISIC rev.4. Overall, standard errors are adjusted for 235
10Blanchard and Willmann (2016) find that individual gains from trade may be non-monotonic in workers’ ability.11The 9 aggregates are food, drinks and tobacco; textiles, clothing and footwear; wood and paper; chemicals; plastics, glass and rubber;
metals; machinery, equipment and electronics; transport equipment; others. Appendix A includes the description of the manufacturingindustries included in each aggregate.
14

clusters.
As discussed in the previous section, the regressions estimated by two-stage least squares(IV) use the variable described in Equation (3) as instrument of the direct effects of importcompetition. Appendix B presents the main descriptive statistics of the control variablesused in the analysis.
5 Empirical results
In all regression tables, OLS results are contrasted with IV regressions. Panel A presentsthe results in which the dependent variable is cumulative earnings, computed by adding upindividual labour wages from 1994 to 2008 and then normalising that sum by the averageearnings of the same individual in 1991 and 1993. Panel B reports results for one furtherlabour market outcome as the dependent variable: the number of years that an individualspent working in the private sector, as a full-time employee. To rule out other possibleconfounding mechanisms, vectors of controls are added at the individual, firm, and sectorallevels. In Columns (2) we use the same set of controls as in Columns (6) – individual, firmand sector controls.
5.1 Baseline Results
In this subsection we present the baseline results for the full sample. The results consider-ing only the direct impact are presented in Table 2, in which the key regressor of interest is4IPdir j as in Equation (1), instrumented with imports from China of seven other countriesas in Equation (3). As can be seen, the instruments appear to be strongly partially correlated.Regardless of the specification and estimation method, we always find a non-statisticallysignificant association between the Chinese direct import penetration measure and both cu-mulative earnings (Panel A) and cumulative years of employment (Panel B).12 These resultsindicate that, in contrast to the countries considered so far in the literature, imports fromChina did not have a significant negative effect upon the Portuguese labour market outcomesup to 2008.
These findings may be driven by the magnitude of the shock itself, with potentially greaterpenetration of Chinese imports in the US than in Portugal. Another possible reason forthe lack of evidence of negative direct effects in Portugal may reside on product qualityupgrading by firms in sectors that experience a rise in their domestic trade competition fromChinese imports. These results and interpretation would be consistent with evidence for othercountries: Bloom et al. (2016) find that Chinese import penetration correlates positively with
12In all specifications, standard errors are clustered at the start-of-period sector-level. All controls have the expected signs. Resultsreporting the complete set of estimates are available from the authors upon request.
15

Table 2: Baseline Results: Direct Effects
OLS IV(1) (2) (3) (4) (5) (6)
Panel A. Cumulative Earnings4IPdir j -1.469 -0.116 -0.386 -0.363 -0.205 0.251
(1.440) (0.608) (0.959) (0.537) (0.388) (0.662)
Panel B. Cumulative Employment4IPdir j -0.676 -0.250 -0.299 -0.196 -0.251 -0.019
(0.637) (0.543) (0.426) (0.274) (0.286) (0.544)
First stage4IPO j 9.093*** 9.086*** 9.026*** 8.366***(0.635) (0.630) (0.585) (0.693)
First stage F test 204.884 208.108 237.734 145.841
Individual controls No Yes No Yes Yes YesFirm controls No Yes No No Yes YesSector controls No Yes No No No Yes
Notes: N = 602,073. Dependent variables: 100 x Cumulative earnings (1994-2008), normalised by average earnings in 1991 and 1993; 100 x Cumulativeyears of full-time employment in the private sector. The variable4IPdir j is the direct import penetration defined in Equation (1). The variable4IPO j is theinstrument of the variable 4IPdir j , which is defined in Equation (3) and uses imports of seven selected countries from China. Given the large scale of theflows, the instrument variable is divided by 1000. All regressions include a constant. All controls are considered at the start-of-period level (1993). Workers’controls include a female dummy variable, eight formal education categories, eight formal categories of worker’s qualifications, age and age squared, andtenure and tenure squared. The vector of firm-level controls includes the number of employees, the natural logarithm of turnover, the share of public equity,the share of foreign equity, and twenty eight regional location dummies at the NUTS3 level. The vector of sector-level controls include a set of dummyvariables for 9 broad aggregate categories computed based on the 83 trade-exposed manufacturing industry and a measure of overall import penetration of theindustry. Standard errors in parenthesis are clustered at the industry level and are robust to heteroscedasticity. Stars indicate significance levels of 10% (*),5% (**), and 1%(***).
within-plant innovation in the UK, using data on the number of computers, patents, and R&Dexpenditure; while Mion and Zhu (2013) find that import competition from China inducesskill upgrading in low-tech manufacturing industries in Belgium.
Other potential explanations concern differences in labour market institutions between Por-tugal and other countries (in particular the US), including widespread sectoral collectivebargaining agreements, which set minimum wages for virtually all workers, especially inmanufacturing. More restrictive employment protection law in Portugal may potentiallyreduce the impact of China in terms of job loss and consequent earnings losses. Higher infla-tion rates in other countries may have also facilitated the adjustment of real wages followingthe import shock.
As we discussed above, the emergence of China in the global arena can affect firms in de-veloped countries not only through the direct impact of increased Chinese imports in thedomestic market but also through increased export competition in third markets. Table 3presents the estimation results of Equation (5) that adds the indirect effect of Chinese com-petition in EU14 markets, defined in Equation (2).
Looking first at the direct impact, in a context in which we also control for the indirect effect,we find that the coefficient remains non significant both in Panel A and Panel B in the OLSspecifications. However, when moving to the IV analysis, the coefficients are positive inthe first three specifications, even if again not significant in the most detailed specificationthat includes the sector-level controls. This suggests that the positive coefficients obtained in
16

the first IV specifications reflect other sectoral upward trends that are confounded with thetrade shock and have a positive impact in workers’ wage and employment outcomes. Whenwe control for confounding sectoral shocks through the inclusion of nine broad industrydummies and, hence, examine the impact of trade exposure within the same broad industryrather than comparing workers across very different fields of economic activity, the estimatedparameters for the direct effect in Column (6), for both cumulative earnings and years ofemployment, become statistically non-significant.
When turning to our measure of indirect import penetration defined in Equation (2), we findevidence of strongly negative effects in all six specifications. In Panel A, the coefficientsrange from -8.3 in Column (1) to -1.5 in (2) for the OLS regressions and from -8.8 in Col-umn (3) and -1.65 in (6) for the IV regressions and are always statistically significant, at leastat the 5% level. These results indicate that the indirect effects from increased competitionfrom China in third-country export markets have a sizeable negative effect on the wages andemployment of workers in affected industries. We also find that, in some specifications, thedirect effects become positive when considering the indirect effects as well and even sig-nificantly so in some cases, perhaps because of countervailing positive effects from productquality upgrading in Portuguese firms.
Table 3: Baseline Results: Direct and Indirect Effects
OLS IV(1) (2) (3) (4) (5) (6)
Panel A. Cumulative Earnings4IPdir j 2.733 0.413 4.656** 2.730* 2.696** 1.012
(1.777) (0.624) (2.157) (1.449) (1.343) (0.903)4IPind j –8.268*** -1.534** -8.754*** -5.462*** -5.419*** -1.652**
(2.767) (0.686) (2.772) (1.683) (1.646) (0.729)
Panel B. Cumulative Employment4IPdir j 1.060 0.120 1.772** 1.091* 1.231** 0.511
(0.731) (0.496) (0.903) (0.609) (0.609) (0.595)4IPind j -3.417*** -1.073*** -3.597*** -2.273*** -2.769*** -1.150**
(1.179) (0.411) (1.197) (0.763) (0.865) (0.447)
First stage4IPO j 8.743*** 8.702*** 8.681*** 8.094***(0.355) (0.321) (0.302) (0.614)
First stage F test 608.161 736.980 828.587 173.853
Individual controls No Yes No Yes Yes YesFirm controls No Yes No No Yes YesSector controls No Yes No No No Yes
Notes: N = 602,073. Dependent variables: 100 x Cumulative earnings (1994-2008), normalised by average earnings in 1991 and 1993; 100 x Cumulativeyears of full-time employment in the private sector. The variable 4IPdir j is the direct import penetration defined in Equation (1) and the variable 4IPind jrefers to the measure of indirect import competition from China defined in Equation (2). The variable4IPO j is the instrument of the variable4IPdir j , whichis defined in Equation (3) and uses imports of seven selected countries from China. Given the large scale of the flows, the instrument variable is divided by1000. All regressions include a constant. All controls are considered at the start-of-period level (1993). Workers’ controls include a female dummy variable,eight formal education categories, eight formal categories of worker’s qualifications, age and age squared, and tenure and tenure squared. The vector offirm-level controls includes the number of employees, the natural logarithm of turnover, the share of public equity, the share of foreign equity, and twentyeight regional location dummies at the NUTS3 level. The vector of sector-level controls include a set of dummy variables for 9 broad aggregate categoriescomputed based on the 83 trade-exposed manufacturing industry and a measure of overall import penetration of the industry. Standard errors in parenthesisare clustered at the industry level and are robust to heteroscedasticity. Stars indicate significance levels of 10% (*), 5% (**), and 1%(***).
Finally, we add up the direct and indirect effects to measure the overall economic impactof China’s import penetration. More specifically, we compare a 1993 manufacturing worker
17

at the 3rd quartile of each import penetration distribution (1.367 percentage points for thedirect impact and 15.598 for the indirect impact) and a similar manufacturing worker at the1st quartile of import exposure (0.358 for the direct impact and 0.444 for the indirect) asdepicted in Table 1. The resulting relative reduction in earnings in the outcome period us-ing the estimates of the more comprehensive specification of Column (6) of Table 3 is 24.0%(1.012∗(1.367−0.358)−1.652∗(15.598−0.444)). Given the non-statistically significanceof the direct effect, considering only the indirect effect and comparing again all-similar man-ufacturing workers located in the 25th and 75th percentiles of the distribution of the indirectimport exposure, the implied differential reduction in cumulative wages is 25.0% of the basewage. In other words, the overall negative effect is virtually exclusively driven by the indirecteffect.
For cumulative employment years, considered in Panel B, the results are similar, with in-creased competition from China in export markets decreasing the number of years spent onemployment between 1994 and 2008. The reduction in years of employment for a manu-facturing worker initially employed in an industry at the 75th percentile of Chinese indirectimport exposure relative to a worker at the 25th percentile is 17.4% (−1.150 ∗ (15.598−0.444)).13
We interpret these results as evidence that, when considering the two channels above, China’sexpanding role in global trade represented a major negative shock for the labour market ofPortugal, in line with evidence for other countries. However, a major difference relative toearlier research on other countries is that, in the case of Portugal, we find that the overallimpact is exclusively driven by the indirect effects.14
Overall, we conclude that, unlike previous research, China can affect negatively the labourmarkets of developed economies not only or not at all through its increase in exports to thecountry. In fact, for Portugal, this direct effect is very small and even positive in some cases,perhaps because of product quality upgrading effects. More importantly, China’s emergencein international trade can drive an intensified competition in third-country markets, leadingto trade diversion, which can then generate significant negative labour market effects, as inthe case of Portugal studied here.
5.2 Heterogeneity in the Impact of the Increased Trade Exposure
There is now a large consensus in the economic literature on the positive effect of interna-tional trade on aggregate welfare but also on its distributional consequences and impacts on
13We also estimated the impact of Chinese indirect competition without controlling for direct import penetration and our results arerobust to this change. In a specification with only the indirect effect, the differential impacts on cumulative wages and years of employmentfor a worker in the 75th percentile relative to a worker in the 25th percentile of the distribution of the indirect measure of trade exposureare -22.0% and -15.9%, respectively.
14Autor et al. (2014) also compute a measure of the indirect effects which they then add to their direct effects measure to show that theirmain result is robust to this alternative measure. They therefore do not allow these two variables to have separate and distinct effects.
18

income inequality within a country (see Autor (2018) and Crozet and Orefice (2017) for tworecent policy-oriented discussions of the impact of international trade in the labour market).The adverse impacts of trade tend to be very concentrated among specific groups of workers,industries and locations more vulnerable to trade competition. The implementation of ap-propriate public policies aimed at protecting trade-exposed workers and mitigating or evenreversing the costs of trade adjustment (including, for instance, hiring incentives, in-worksubsidies, and training) requires the identification of the individuals that tend to be morenegatively exposed to globalisation.
In this subsection, we investigate which specific groups of workers were more affected bythe increased international trade exposure to China, taking into account both the direct andindirect channels. More specifically, we extend the main analysis above to explore poten-tial heterogeneity in the impact of the increased direct and indirect competition from Chinaaccording to important workers’ dimensions available in our data set such as age, genderand schooling. We also examine whether the effects are distinct for individuals working indomestic- and foreign-owed firms in the pre-shock period.
Table 4 divides the sample of workers considering those with above and below the medianage in 1993 (35 years old). We find that the indirect effects on earnings fall exclusivelyon older workers. These workers tend to be paid higher wages, above market-level values,because they are better positioned to benefit from rent sharing (Martins, 2009) and bettermatching with their employers (Snell et al., 2018). Therefore they tend to lose the mostif they become unemployed or have to move to a new firm with a lower level of seniorityor where they are not as well matched. These results are in line with the findings from thedisplacement literature (see Raposo et al. (2015) for a study of job displacement in Portugal).The negative indirect effects on employment can now be observed for the two groups but arestill stronger for older workers who, when leaving the firm, may take longer to find suitablematches. Unemployment benefits are also more generous in their duration (up to three years)for older workers, potentially prompting them to remain unemployed for a longer period andexacerbating the public cost of their non-employment, while reducing the income effects ofthe drop in ernings above. In all cases, we do not find significant direct effects.
We also investigate if women tend to suffer more or less than men from exogenous tradeshocks. Despite the convergence of male and females observable attributes, Cardoso et al.(2016) show that the wage gender gap in Portugal, conditional on those workers’ charac-teristics, amounts to 23 log points on average in the 1986-2008 period. In Table 5, whichdivides the workers’ sample between males and females, we find that the indirect effects onwomen are more negative than those on men, both for earnings and employment. This gen-der heterogeneity in the effects may result from the higher proportion of women employedin sectors that are more exposed to the competition from China, in particular competition inexport markets. For instance, in the more labour-intensive manufacturing sectors of textiles,
19

Table 4: Heterogeneity: Sample Median Age
Less 35 years old More 35 years oldOLS IV OLS IV
Panel A. Cumulative Earnings4IPdir j 0.113 0.247 0.700 2.451
(0.648) (0.892) (1.022) (1.760)4IPind j -0.869 -0.892 -1.668** -2.005**
(0.644) (0.640) (0.670) (0.808)
Panel B. Cumulative Employment4IPdir j 0.125 0.098 0.015 1.463
(0.487) (0.668) (0.921) (1.367)4IPind j -0.870** -0.865** -1.521** -1.799**
(0.416) (0.418) (0.630) (0.748)
First stage4IPO j 8.109*** 7.856***(0.637) (1.362)
First stage F test 161.943 33.277
Controls Yes Yes Yes YesNumber of Observations 301 328 301 328 300 745 300 745
Notes: Dependent variables: 100 x Cumulative earnings (1994-2008), normalised by average earnings in 1991 and 1993; 100 x Cumulative years of full-timeemployment in the private sector. The variable4IPdir j is the direct import penetration defined in Equation (1) and the variable4IPind j refers to the measureof indirect import competition from China defined in Equation (2). The variable 4IPO j is the instrument of the variable 4IPdir j , which is defined inEquation (3) and uses imports of selected countries from China. Given the large scale of the flows, the instrument variable is divided by 1000. All regressionsinclude a constant and the vector of individual, firm, and sector controls from column (6) of Table 2. All controls are considered at the start-of-period level(1993). Standard errors in parenthesis are clustered at the industry level and are robust to heteroscedasticity. Stars indicate significance levels of 10% (*), 5%(**), and 1%(***).
clothing and footwear, the proportion of female employees was around 68% in 1993.
Table 5: Heterogeneity: Gender
Male FemaleOLS IV OLS IV
Panel A. Cumulative Earnings4IPdir j -0.126 0.627 0.805 1.561
(0.792) (0.848) (0.854) (1.821)4IPind j -0.543 -0.748 -1.406** -1.479***
(0.651) (0.691) (0.556) (0.552)
Panel B. Cumulative Employment4IPdir j -0.159 0.427 0.380 0.774
(0.626) (0.625) (0.690) (1.136)4IPind j -0.537 -0.697 -1.015** -1.054**
(0.523) (0.568) (0.423) (0.421)
First stage4IPO j 8.306*** 7.428***(0.456) (0.955)
First stage F test 332.270 60.460
Controls Yes Yes Yes YesNumber of Observations 371 664 371 664 230 409 230 409
Notes: Dependent variables: 100 x Cumulative earnings (1994-2008), normalised by average earnings in 1991 and 1993; 100 x Cumulative years of full-timeemployment in the private sector. The variable4IPdir j is the direct import penetration defined in Equation (1) and the variable4IPind j refers to the measureof indirect import competition from China defined in Equation (2). The variable 4IPO j is the instrument of the variable 4IPdir j , which is defined inEquation (3) and uses imports of selected countries from China. Given the large scale of the flows, the instrument variable is divided by 1000. All regressionsinclude a constant and the vector of individual, firm, and sector controls from column (6) of Table 2. All controls are considered at the start-of-period level(1993). Standard errors in parenthesis are clustered at the industry level and are robust to heteroscedasticity. Stars indicate significance levels of 10% (*), 5%(**), and 1%(***).
The direct and indirect effects of increased competition from China are not statistically sig-
20

nificant for university graduates, as can be inferred from Table 6, which splits the workers’sample between those with and without tertiary education in 1993. Workers with higherschooling levels are likely to be able to move to different occupations, and therefore, tobe less affected by negative international trade shocks. Moreover, they may also be betterplaced to take advantage from employment opportunities that follow from product upgrad-ing, as schooling facilitates access to better paying firms and jobs (see Cardoso et al. (2018)for a detailed study of the sources of the returns to education in Portugal).
Table 6: Heterogeneity: University Education
Non Tertiary TertiaryOLS IV OLS IV
Panel A. Cumulative Earnings4IPdir j 0.425 1.091 -0.345 0.260
(0.607) (0.943) (1.651) (1.465)4IPind j -1.469** -1.595** -0.224 -0.577
(0.690) (0.739) (2.541) (2.407)Panel B. Cumulative Employment
4IPdir j 0.124 0.549 -0.203 0.018(0.503) (0.629) (0.844) (0.656)
4IPind j -1.032** -1.112** -0.954 -1.083(0.420) (0.458) (1.415) (1.368)
First stage4IPO j 8.016*** 8.236***(0.681) (0.196)
First stage F test 138.736 1 769.592
Controls Yes Yes Yes YesNumber of Observations 574 286 574 286 27 787 27 787
Notes: Dependent variables: 100 x Cumulative earnings (1994-2008), normalised by average earnings in 1991 and 1993; 100 x Cumulative years of full-timeemployment in the private sector. The variable4IPdir j is the direct import penetration defined in Equation (1) and the variable4IPind j refers to the measureof indirect import competition from China defined in Equation (2). The variable 4IPO j is the instrument of the variable 4IPdir j , which is defined inEquation (3) and uses imports of selected countries from China. Given the large scale of the flows, the instrument variable is divided by 1000. All regressionsinclude a constant and the vector of individual, firm, and sector controls from column (6) of Table 2. All controls are considered at the start-of-period level(1993). Standard errors in parenthesis are clustered at the industry level and are robust to heteroscedasticity. Stars indicate significance levels of 10% (*), 5%(**), and 1%(***).
Finally, Table 7 divides the sample between workers employed in domestic and foreign firms,defined as firms with at least 10% of foreign capital equity ownership in 1993. We find thatindividuals employed in foreign-owned firms do not appear to be affected by China’s di-rect and indirect competition. Foreign-owned firms, which are typically affiliates of foreignmultinationals, may be more resilient to international trade shocks as they are likely to bepart of global value chains. For instance, Martins and Yang (2015) present evidence that thewages of workers in affiliates of multinational firms around the world are influenced not onlyby the profitability of the affiliate itself but also by the profitability of the parent company.
21

Table 7: Heterogeneity: Origin of Firms Equity
Domestic ForeignOLS IV OLS IV
Panel A. Cumulative Earnings4IPdir j -0.314 0.665 2.022 1.410
(0.822) (1.043) (2.327) (3.571)4IPind j -1.609** -1.739** -1.963 -1.782
(0.693) (0.744) (1.989) (2.222)
Panel B. Cumulative Employment4IPdir j 0.043 0.823 0.843 0.317
(0.598) (0.693) (1.751) (2.529)4IPind j -0.899** -1.003** -1.890 -1.734
(0.410) (0.446) (1.532) (1.693)
First stage4IPO j 7.910*** 7.387***(0.701) (0.745)
First stage F test 127.303 98.265
Controls Yes Yes Yes YesNumber of Observations 531 890 531 890 70 183 70 183
Notes: Dependent variables: 100 x Cumulative earnings (1994-2008), normalised by average earnings in 1991 and 1993; 100 x Cumulative years of full-timeemployment in the private sector. The variable4IPdir j is the direct import penetration defined in Equation (1) and the variable4IPind j refers to the measureof indirect import competition from China defined in Equation (2). The variable 4IPO j is the instrument of the variable 4IPdir j , which is defined inEquation (3) and uses imports of selected countries from China. Given the large scale of the flows, the instrument variable is divided by 1000. All regressionsinclude a constant and the vector of individual, firm, and sector controls from column (6) of Table 2. All controls are considered at the start-of-period level(1993). Standard errors in parenthesis are clustered at the industry level and are robust to heteroscedasticity. Stars indicate significance levels of 10% (*), 5%(**), and 1%(***).
5.3 Robustness Results
In this subsection, we present several robustness checks of our baseline results. We start bymeasuring the change in direct and indirect trade exposure to China using a gravity-basedapproach, which captures the differential changes in China’s sectoral productivity and tradecosts relative to Portugal. We proceed by including a measure of the increase in export op-portunities for Portuguese exporters arising from the integration of China in world markets;then we revise our measure of trade diversion and express it in percentage changes. Wealso instrument our direct import penetration measure with a different set of countries, workthrough our analysis using a smaller sample of manufacturing workers, and use a distinctvariable as a proxy of the initial size of an industry. Finally, we split the sample period intwo.
First, we adopt an alternative identification strategy that imposes weaker assumptions inmeasuring the direct and indirect import competition from China, based on a gravity modelof trade. Appendix C describes in detail the procedures used to construct these measures oftrade exposure. Intuitively, instead of using actual changes in Chinese exports as in Equa-tions (1) and (2), we use gravity residuals to capture the rising productivity and increasingmarket accessibility of China relative to Portugal and the implied differential change of Por-tugal’s attractiveness relative to China from the perspective of third countries. The gravityapproach neutralises import demand shocks in the destination markets, thereby isolatingsupply and trade-cost driven changes in Chinese export performance, which are precisely
22

the components of China’s export growth that we want to capture.
Table 8 shows the results of this alternative specification, which is estimated by OLS, asthe gravity approach sterilises the confounding effects of possible unobservable shocks. Asin our baseline regression, the impact of increased Chinese import penetration on the Por-tuguese domestic market is statistically non-significant, while the effect of higher competi-tion of Chinese products in the main destination markets of Portuguese exports is negativeand significant. To compare the economic magnitudes of these estimates with those of ourbaseline regression, we consider a manufacturing worker at the 75th percentile of the dis-tribution of the gravity-based measure of indirect import competition (39.724) and a similarworker at the 25th percentile of the same distribution (0.530). Using the estimates of Col-umn (2), the worker who experiences a stronger rise in indirect trade exposure has a relativereduction in cumulative wages of 17.6% (−0.448∗ (39.724−0.530)) of the base wage overthe outcome period (9.4% differential decline in years of employment). These magnitudesare consistent but more conservative than those obtained with our baseline results, becausethe rise in gravity residuals captures only the exogenous differential increase in competitive-ness and accessibility of China, and should be interpreted as a conservative estimate of theimpact of Chinese competition on the Portuguese labour market. Nevertheless, the fact thatour gravity and baseline estimates lead to consistently negative economic effects of China’sindirect competition in third markets suggests that correlated import demand shocks acrosscountries are not driving our main results and, hence, adds further confidence to their causalinterpretation.
Table 8: Robustness: Gravity-based Measures
OLS OLS(1) (2)
Panel A. Cumulative Earnings4IPGdir j -0.040 0.249
(0.099) (0.196)4IPGind j -0.448**
(0.204)
Panel B. Cumulative Employment4IPGdir j -0.070 0.084
(0.079) (0.124)4IPGind j -0.239**
(0.107)
Controls Yes Yes
Notes: N= 602,073. Dependent variables: 100 x Cumulative earnings (1994-2008), normalised by average earnings in 1991 and 1993; 100 x Cumulativeyears of full-time employment in the private sector. The variable IPGdir j is the gravity-based measure of direct import competition defined in Equation (C.6),computed using the average change of the residuals for each industry j across 82 destination countries between 1993 and 2008, based on the estimation of agravity model of trade for China and Portugal. The variable IPGind j is the gravity-based measure of indirect import competition defined in Equation (C.7),computed using the change of the residuals for each industry j and country C of the EU14 between 1993 and 2008, based on the estimation of a gravitymodel of trade for China and Portugal. See Appendix C for a detailed description of these variables. All regressions include a constant and the vector ofindividual, firm, and sector controls from column (6) of Table 2. All controls are considered at the start-of-period level (1993). Standard errors in parenthesisare clustered at the industry level and are robust to heteroscedasticity. Stars indicate significance levels of 10% (*), 5% (**), and 1%(***).
23
Second, we test a different impact channel of the integration of China in international trade:the increased export opportunities for Portuguese firms that may follow from the higherdemand for imports from China. The measure of the direct export opportunities in eachPortuguese industry j that we propose is defined as:
4EO j,τ =4X prt→chn
j,τ
WB j,93, (6)
where4X prt→chnj,τ is the change in Portuguese exports of industry j to China over the period
1993-2008.
In the following regression table, we use a measure of net direct import penetration, includingboth Portuguese imports from China and Chinese imports from Portugal. This measure al-lows us to take into account some of the potentially positive labour market effects of China’semergence in terms of increased Portuguese exports to China, possibly offsetting some ofthe effect of China’s higher import penetration. This new measure is:
4NIPdir j,τ =4IPdir j,τ−4EO j,τ, (7)
We instrument it as follows:
4EOO j,τ =4XO→chn
j,τ
WB j,91, (8)
4NIPO j,τ =4IPO j,τ−4EOO j,τ, (9)
where 4IPO j,τ is defined in Equation (3) and XO→chnj are the exports of the same seven
selected countries to China in industry j.
We consider also the indirect effect of competition in third markets in the regression andinclude the measure of net import penetration of Equation (7), which adjusts the direct effectof import competition with the impact of exports to China. Table 9 shows that our results arerobust to this new specification. We find that, while the direct effects, even in this broaderdefinition, are still statistically non-significant, the indirect effects remain significantly neg-ative with a coefficient very similar to that of our baseline results.
24

Table 9: Robustness: Net Direct Effects and Indirect Effects
OLS IV(1) (2)
Panel A. Cumulative Earnings4NIPj 0.319 0.841
(0.580) (0.864)4IPind j -1.510** -1.602**
(0.687) (0.725)
Panel B. Cumulative Employment4NIPj 0.105 0.464
(0.451) (0.572)4IPind j -1.068** -1.132**
(0.412) (0.443)
First Stage4NIPO j 8.026***(0.675)
F test 141.598
Controls Yes Yes
Notes: N= 602,073. Dependent variables: 100 x Cumulative earnings (1994-2008), normalised by average earnings in 1991 and 1993; 100 x Cumulativeyears of full-time employment in the private sector. The variable4NIPj is the direct net import penetration of Equation (7) which considers both direct importpenetration from China and export opportunities to China. The variable 4IPind j refers to the measure of indirect import competition from China defined inEquation (2). The variable4NIPO j is the instrument of the variable4NIPj , which is defined in Equation (9) and uses both imports from China and exportsto China of selected countries. Given the large scale of the flows, the instrument variable is divided by 1000. All regressions include a constant and thevector of individual, firm, and sector controls from column (6) of Table 2. All controls are considered at the start-of-period level (1993). Standard errors inparenthesis are clustered at the industry level and are robust to heteroscedasticity. Stars indicate significance levels of 10% (*), 5% (**), and 1%(***).
Third, we examine a distinct measure of workers’ indirect exposure to trade with China.Basically, instead of using absolute changes in the levels of imports from China as in Equa-tion (2), we examine percentual changes of the market shares of Chinese exports in eachindustry and destination country from 1993 to 2008. This alternative measure of indirectcompetition from China is computed as the changes in export market shares of China in eachof the EU14 countries by industry j, as a percentage of total imports of each individual mar-ket in 1993, weighted by the share of each EU14 country in total Portuguese exports of eachindustry in 1993:
4IPind2 j,τ =14
∑C=1
υprtCj,934τ(
Mchn→Cj
M→Cj,93∗100), with υ
prtCj,93 =
X prt→Cj,93
X prt→j,93
(10)
where υprtCj,93 is the share of each EU14 country C in total Portuguese exports of each industry
j in 1993. X prt→Cj,93 = Mprt→C
j,93 of Equation (2) are Portuguese exports of each industry j toeach country C of the EU14 and X prt→
j,93 are the total Portuguese exports of industry j in1993. This weight is then multiplied by the percentage change of market share of Chineseexports in each individual industry-country market from 1993 to 2008, where Mchn→C
j areimports from China of industry j by country C of the EU14 and M→C
j,93 are total imports ofthat country at the industry-level in 1993. Intuitively, a gain of export market share of Chinain a given industry of a given EU14 country will represent a greater increase in competitionfrom China, the higher the relevance of that individual market in total Portuguese exports
25

in the baseline year. In other words, compared to the original specification of the indirecteffect, here we consider the changes of China’s market share in each industry of each EU14country, as a percentage of the respective industry-country total imports in 1993 (not changesin the absolute levels of Chinese imports normalised by the size of the Portuguese industry)and we weight each individual market in terms of its importance in Portuguese exports ofthat industry in 1993 (not using weights from the EU14 country).
Table 10 reports the estimated effects, which are consistent with the main results of Table 3.In particular, the effects on earnings and employment of the increased competition fromChina in the main Portuguese export markets are significantly negative, while the impacts ofdirect import competition are not statically significant. To compare these estimates with ourbaseline results, consider a worker who faces a rise in indirect import exposure at the 75thpercentile (44.980 in this alternative metric) and compare to a worker with indirect importcompetition at the 25th percentile (6.452). The estimates of Column (2) imply that the for-mer earns 38.5% (−0.999 ∗ (44.980− 6.452)) less than the latter over the period (drop of23.9% in terms of years of employment), because of the stronger increase in indirect tradeexposure. In this sense, given the greater magnitude of these effects, our baseline resultscan be seen as a conservative estimate of the impact of stronger Chinese competition in Por-tuguese export markets.
Table 10: Robustness: Percentual Changes in Indirect Effects
OLS IV(1) (2)
Panel A. Cumulative Earnings4IPdir j 0.255 1.001
(0.605) (0.766)4IPind2 j -0.959*** -0.999***
(0.292) (0.293)
Panel B. Cumulative Employment4IPdir j -0.020 0.447
(0.499) (0.506)4IPind2 j -0.595*** -0.621***
(0.178) (0.180)
First stage4IPO j 0.008***(0.001)
First stage F test 195.466
Controls Yes Yes
Notes: N= 602,073. Dependent variables: 100 x Cumulative earnings (1994-2008), normalised by average earnings in 1991 and 1993; 100 x Cumulativeyears of full-time employment in the private sector. The variable4IPdir j is the direct import penetration defined in Equation (1) and the variable4IPind2 jrefers to the measure of indirect import competition from China defined in Equation (10). The variable 4IPO j is the instrument of the variable 4IPdir j ,which is defined in Equation (3), and uses imports of selected countries from China. All regressions include a constant and the vector of individual, firm, andsector controls from column (6) of Table 2. All controls are considered at the start-of-period level (1993). Standard errors in parenthesis are clustered at theindustry level and are robust to heteroscedasticity. Stars indicate significance levels of 10% (*), 5% (**), and 1%(***).
26
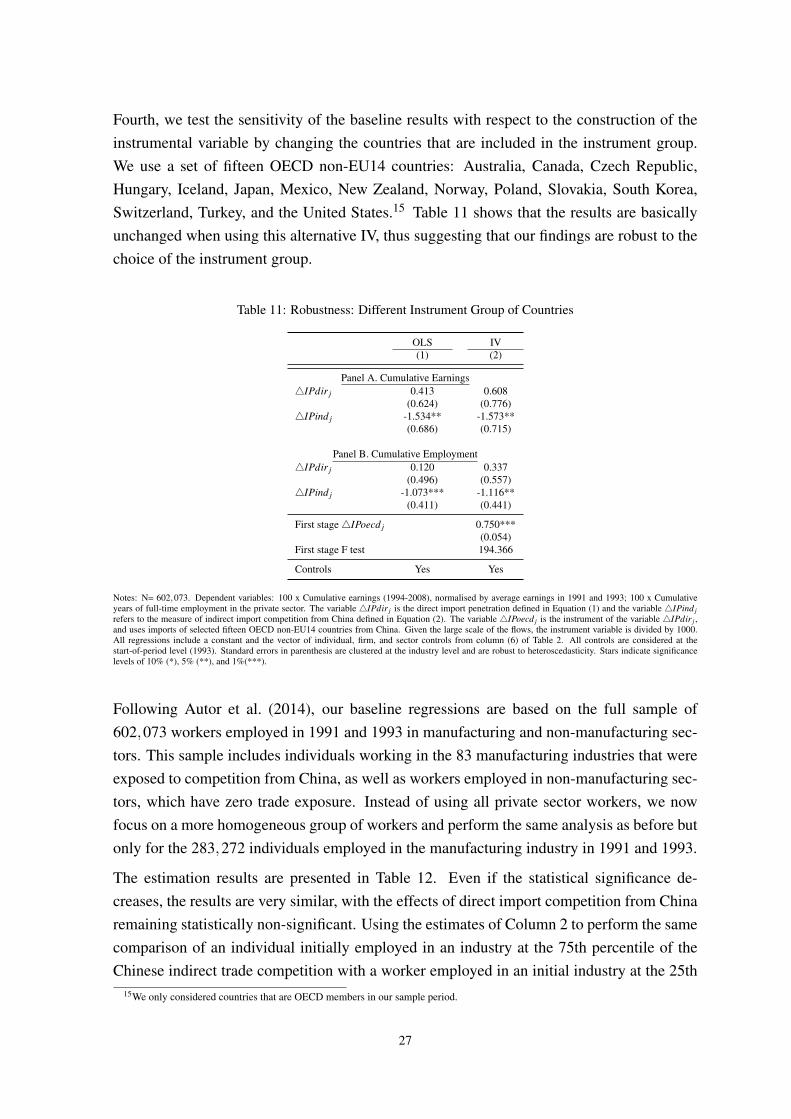
Fourth, we test the sensitivity of the baseline results with respect to the construction of theinstrumental variable by changing the countries that are included in the instrument group.We use a set of fifteen OECD non-EU14 countries: Australia, Canada, Czech Republic,Hungary, Iceland, Japan, Mexico, New Zealand, Norway, Poland, Slovakia, South Korea,Switzerland, Turkey, and the United States.15 Table 11 shows that the results are basicallyunchanged when using this alternative IV, thus suggesting that our findings are robust to thechoice of the instrument group.
Table 11: Robustness: Different Instrument Group of Countries
OLS IV(1) (2)
Panel A. Cumulative Earnings4IPdir j 0.413 0.608
(0.624) (0.776)4IPind j -1.534** -1.573**
(0.686) (0.715)
Panel B. Cumulative Employment4IPdir j 0.120 0.337
(0.496) (0.557)4IPind j -1.073*** -1.116**
(0.411) (0.441)
First stage4IPoecd j 0.750***(0.054)
First stage F test 194.366
Controls Yes Yes
Notes: N= 602,073. Dependent variables: 100 x Cumulative earnings (1994-2008), normalised by average earnings in 1991 and 1993; 100 x Cumulativeyears of full-time employment in the private sector. The variable 4IPdir j is the direct import penetration defined in Equation (1) and the variable 4IPind jrefers to the measure of indirect import competition from China defined in Equation (2). The variable 4IPoecd j is the instrument of the variable 4IPdir j ,and uses imports of selected fifteen OECD non-EU14 countries from China. Given the large scale of the flows, the instrument variable is divided by 1000.All regressions include a constant and the vector of individual, firm, and sector controls from column (6) of Table 2. All controls are considered at thestart-of-period level (1993). Standard errors in parenthesis are clustered at the industry level and are robust to heteroscedasticity. Stars indicate significancelevels of 10% (*), 5% (**), and 1%(***).
Following Autor et al. (2014), our baseline regressions are based on the full sample of602,073 workers employed in 1991 and 1993 in manufacturing and non-manufacturing sec-tors. This sample includes individuals working in the 83 manufacturing industries that wereexposed to competition from China, as well as workers employed in non-manufacturing sec-tors, which have zero trade exposure. Instead of using all private sector workers, we nowfocus on a more homogeneous group of workers and perform the same analysis as before butonly for the 283,272 individuals employed in the manufacturing industry in 1991 and 1993.
The estimation results are presented in Table 12. Even if the statistical significance de-creases, the results are very similar, with the effects of direct import competition from Chinaremaining statistically non-significant. Using the estimates of Column 2 to perform the samecomparison of an individual initially employed in an industry at the 75th percentile of theChinese indirect trade competition with a worker employed in an initial industry at the 25th
15We only considered countries that are OECD members in our sample period.
27

percentile of the same distribution, the implied relative reduction in cumulative wage earn-ing is 15.6% (12.5% drop of years of employment). These values are smaller than the onesobtained in our baseline regressions that use a bigger and more heterogeneous sample ofworkers and, hence, can be seen as a low benchmark of our results.
Table 12: Robustness: Only within Manufacturing
OLS IV(1) (2)
Panel A. Cumulative Earnings4IPdir j 0.096 0.594
(0.542) (0.805)4IPind j -0.933* -1.031*
(0.530) (0.554)
Panel B. Cumulative Employment4IPdir j -0.043 0.242
(0.440) (0.559)4IPind j -0.767** -0.823**
(0.351) (0.378)
First stage4IPO j 8.080***(0.615)
First stage F test 172.494
Controls Yes Yes
Notes: N= 283,272. Dependent variables: 100 x Cumulative earnings (1994-2008), normalised by average earnings in 1991 and 1993; 100 x Cumulativeyears of full-time employment in the private sector. The variable 4IPdir j is the direct import penetration defined in Equation (1) and the variable 4IPind jrefers to the measure of indirect import competition from China defined in Equation (2). The variable 4IPO j is the instrument of the variable 4IPdir j ,and uses imports of selected countries from China. Given the large scale of the flows, the instrument variable is divided by 1000. All regressions include aconstant and the vector of individual, firm, and sector controls from column (6) of Table 2. All controls are considered at the start-of-period level (1993).Standard errors in parenthesis are clustered at the industry level and are robust to heteroscedasticity. Stars indicate significance levels of 10% (*), 5% (**),and 1%(***).
As described in Section 3.1, to normalise the changes in sectoral trade flows with China, ourbaseline results use the total wage bill of a given domestic industry as a proxy of the initialindustry size. Even if due to data unavailability it is not possible to compute the domesticabsorption of each industry in 1993, we test a distinct normalisation of trade exposure toChina: the total turnover of each industry in 1993 (1991 in the case of the instrumentalvariable).16
Table 13 shows that using turnover to capture the initial relative dimension of domestic in-dustries does not have a significant impact in our results. We still find no evidence of anegative direct effect of increased imports from China and the impact of Chinese compe-tition in export markets continues to be significant and negative. In economic terms, themagnitude of the results is very similar to the one obtained with the baseline estimates ofTable 3. Using turnover as the normalisation factor, the values of the 25th and 75th per-centiles of the distribution of indirect import exposure to China in third markets are 0.487and 18.039, respectively. Comparing individuals initially employed in industries at the 75th
16More precisely, we used total turnover of industry j in 1993 and 1991 divided by 100 so that the values of the estimated parametersare more similar to the baseline regressions.
28

and 25th percentiles of the distribution of the measure of Chinese competition in export mar-kets, the estimates of Column 2 show that the individual in the more affected industry earns26.9% (−1.535 ∗ (18.039− 0.487)) less when compared to a worker at the 25th percentile(reduction of 16.4% in terms of years of employment).
Table 13: Robustness: Different Normalisation - Turnover
OLS IV(1) (2)
Panel A. Cumulative Earnings4IPT dir j 0.473 -0.216
(0.770) (0.740)4IPTind j -1.637*** -1.535**
(0.560) (0.610)
Panel B. Cumulative Employment4IPT dir j 0.087 -0.414
(0.581) (0.496)4IPTind j -1.007*** -0.933***
(0.316) (0.345)
First stage4IPTO j 2.743***(0.442)
First stage F test 38.583
Controls Yes Yes
Notes: N= 602,073. Dependent variables: 100 x Cumulative earnings (1994-2008), normalised by average earnings in 1991 and 1993; 100 x Cumulativeyears of full-time employment in the private sector. The variable 4IPT dir j is the measure of direct import penetration, the variable 4IPTind j refers to themeasure of indirect import competition from China, and 4IPTO j is the instrument of the variable 4IPT dir j , and uses imports of selected countries fromChina. The numerators of these three variables are same as the variables defined in Equation (1), Equation (2) and Equation (3), respectively, but 4IPT dir jand 4IPTind j use total turnover of industry j in 1993 as a normalisation factor and 4IPTO j uses total turnover of industry j in 1991 in the denominator.Given the large scale of the flows, the instrument variable is divided by 1000. All regressions include a constant and the vector of individual, firm, and sectorcontrols from column (6) of Table 2. All controls are considered at the start-of-period level (1993). Standard errors in parenthesis are clustered at the industrylevel and are robust to heteroscedasticity. Stars indicate significance levels of 10% (*), 5% (**), and 1%(***).
Finally, we consider two different sub-periods for the trade shock variables, 1993-2000 and2000-2008, still focusing on the same worker-level outcomes of the main sample of workersemployed in 1991 and 1993. The estimates in Table 14 show that the negative impacts ofincreased competition from China in exports markets are concentrated in most recent sub-period, while the direct effect of imports from China continues to be non-significant in bothsub-periods. These results are consistent with the distribution of the trade shock over time.For each trade shock variable considered, around 75% of the average increase occurred from2000 to 2008, when China’s international trade accelerated strongly following its accessionto the WTO.
29
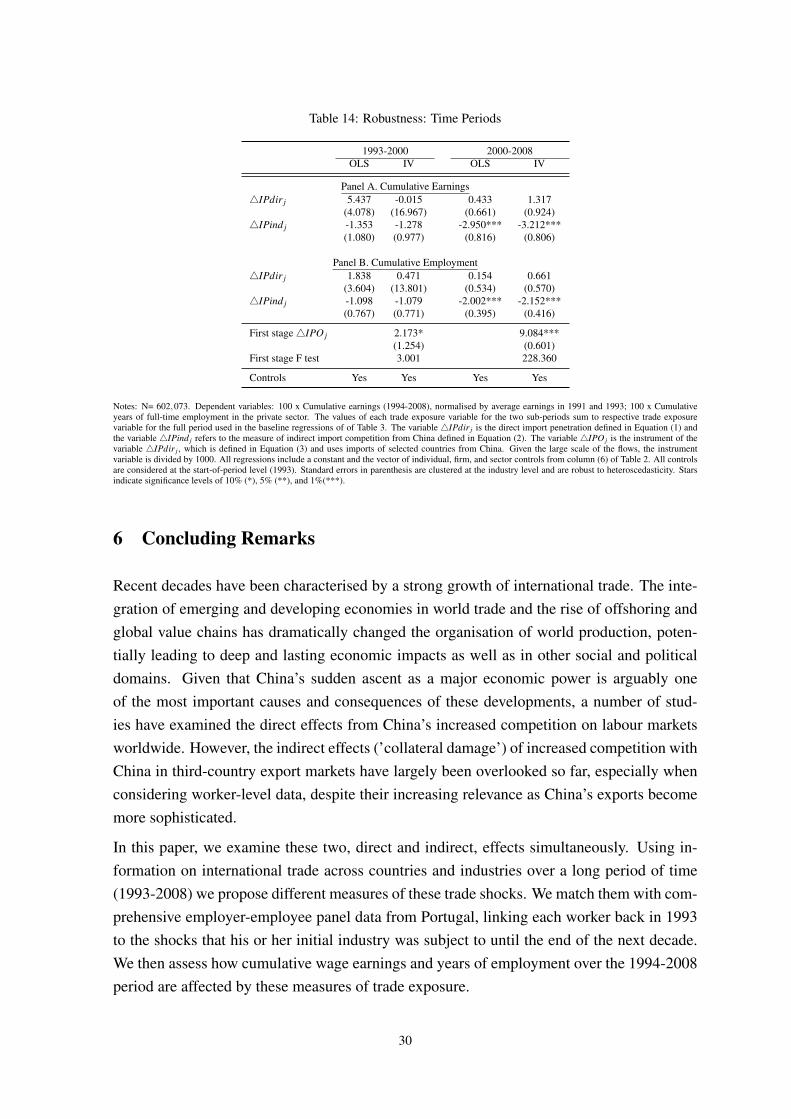
Table 14: Robustness: Time Periods
1993-2000 2000-2008OLS IV OLS IV
Panel A. Cumulative Earnings4IPdir j 5.437 -0.015 0.433 1.317
(4.078) (16.967) (0.661) (0.924)4IPind j -1.353 -1.278 -2.950*** -3.212***
(1.080) (0.977) (0.816) (0.806)
Panel B. Cumulative Employment4IPdir j 1.838 0.471 0.154 0.661
(3.604) (13.801) (0.534) (0.570)4IPind j -1.098 -1.079 -2.002*** -2.152***
(0.767) (0.771) (0.395) (0.416)
First stage4IPO j 2.173* 9.084***(1.254) (0.601)
First stage F test 3.001 228.360
Controls Yes Yes Yes Yes
Notes: N= 602,073. Dependent variables: 100 x Cumulative earnings (1994-2008), normalised by average earnings in 1991 and 1993; 100 x Cumulativeyears of full-time employment in the private sector. The values of each trade exposure variable for the two sub-periods sum to respective trade exposurevariable for the full period used in the baseline regressions of of Table 3. The variable 4IPdir j is the direct import penetration defined in Equation (1) andthe variable 4IPind j refers to the measure of indirect import competition from China defined in Equation (2). The variable 4IPO j is the instrument of thevariable 4IPdir j , which is defined in Equation (3) and uses imports of selected countries from China. Given the large scale of the flows, the instrumentvariable is divided by 1000. All regressions include a constant and the vector of individual, firm, and sector controls from column (6) of Table 2. All controlsare considered at the start-of-period level (1993). Standard errors in parenthesis are clustered at the industry level and are robust to heteroscedasticity. Starsindicate significance levels of 10% (*), 5% (**), and 1%(***).
6 Concluding Remarks
Recent decades have been characterised by a strong growth of international trade. The inte-gration of emerging and developing economies in world trade and the rise of offshoring andglobal value chains has dramatically changed the organisation of world production, poten-tially leading to deep and lasting economic impacts as well as in other social and politicaldomains. Given that China’s sudden ascent as a major economic power is arguably oneof the most important causes and consequences of these developments, a number of stud-ies have examined the direct effects from China’s increased competition on labour marketsworldwide. However, the indirect effects (’collateral damage’) of increased competition withChina in third-country export markets have largely been overlooked so far, especially whenconsidering worker-level data, despite their increasing relevance as China’s exports becomemore sophisticated.
In this paper, we examine these two, direct and indirect, effects simultaneously. Using in-formation on international trade across countries and industries over a long period of time(1993-2008) we propose different measures of these trade shocks. We match them with com-prehensive employer-employee panel data from Portugal, linking each worker back in 1993to the shocks that his or her initial industry was subject to until the end of the next decade.We then assess how cumulative wage earnings and years of employment over the 1994-2008period are affected by these measures of trade exposure.
30

Our findings show that countries can be affected in various ways by the emergence of Chinaas a dominant player in the global market for manufactured goods. In contrast to evidencefor other countries, we find that an increase in direct import penetration from China doesnot necessarily significantly decrease individuals’ wage earnings and years of employment.However, our results indicate that the indirect dimension associated with increased compe-tition in third-country markets driven by China’s exports can generate significant negativelabour market effects. More specifically, for Portugal, we find that an increase, from thebottom to the top quartile, of an industry’s exposure to China’s indirect import penetrationin a group of 14 EU countries is associated to a relative drop of 25% in worker’s cumulativewages and a 17.4% reduction in employment years.
The negative labour-market effects of increased trade exposure to China are robust to a num-ber of tests but are also heterogeneous across individuals. The impact falls disproportionatelyon older workers, females and workers without tertiary education. Moreover, the negativeeffects are also stronger for individuals working in domestic-owned firms. Hence, this papernot only supports the view that trade integration generates losers in the labour market but alsocontributes to the identification of those most affected, which is essential for public policiesaiming at supporting workers more hurt by globalisation.
Overall, our findings contribute to a better understanding of the effects of the ’China shock’,not only in Portugal but also in other countries with significant shares of their workforceemployed in relatively labour-intensive manufacturing exporting firms. This indirect effectis also increasingly relevant as more and more industries around the world become exposedto the increasing range and quality of China’s exports. Of course, as China’s emergence ledto the important indirect import penetration effects that we examine here, it may also havecontributed to relevant indirect export opportunities, namely by selling intermediate goodsto firms in third countries that then export final goods to China. This is a topic that we leavefor future research.
References
Acemoglu, D., Autor, D. H., Dorn, D., Hanson, G. H. and Price, B. (2016), ‘Import Com-petition and the Great US Employment Sag of the 2000s’, Journal of Labor Economics34(S1), S141–S198.
Álvarez, R. and Claro, S. (2009), ‘David Versus Goliath: The Impact of Chinese Competitionon Developing Countries’, World Development 37(3), 560–571.
Amiti, M., Dai, M., Feenstra, R. C. and Romalis, J. (2017), How did China’s WTO entry ben-efit US consumers?, NBER Working Paper 23487, National Bureau of Economic Research(NBER).
31

Anderson, J. E. and van Wincoop, E. (2003), ‘Gravity with Gravitas: A Solution to theBorder Puzzle’, American Economic Review 93(1), 170–192.
Ashournia, D., Munch, J. R. and Nguyen, D. (2014), The Impact of Chinese Import Penetra-tion on Danish Firms and Workers, IZA Discussion Papers 8166, Institute for the Study ofLabor (IZA).
Autor, D. H. (2018), ‘Trade and labor markets: Lessons from China’s rise’, IZA World ofLabor (431), 1–12.
Autor, D. H., Dorn, D. and Hanson, G. H. (2013), ‘The China Syndrome: Local LaborMarket Effects of Import Competition in the United States’, American Economic Review103(6), 2121–2168.
Autor, D. H., Dorn, D. and Hanson, G. H. (2015), ‘Untangling trade and technology: Evi-dence from local labour markets’, Economic Journal 125(584), 621–46.
Autor, D. H., Dorn, D. and Hanson, G. H. (2016), ‘The China shock: Learning from labor-market adjustment to large changes in trade’, Annual Review of Economics 8, 205–240.
Autor, D. H., Dorn, D., Hanson, G. H. and Majlesi, K. (2016), Importing Political Polar-ization? The Electoral Consequences of Rising Trade Exposure, NBER Working Paper22637, National Bureau of Economic Research (NBER).
Autor, D. H., Dorn, D., Hanson, G. H. and Song, J. (2014), ‘Trade Adjustment: WorkerLevel Evidence’, The Quarterly Journal of Economics 129(4), 1799–1860.
Balsvik, R., Jensen, S. and Salvanes, K. G. (2015), ‘Made in China, sold in Norway: Locallabor market effects of an import shock’, Journal of Public Economics 127, 137–144.
Bayoumi, T. and Eichengreen, B. (1992), Shocking Aspects of European Monetary Unifica-tion, NBER Working Paper 3949, National Bureau of Economic Research (NBER).
Belke, A., Domnick, C. and Gros, D. (2017), ‘Business Cycle Synchronization in the EMU:Core vs. Periphery’, Open Economies Review 28(5), 863–892.
Bernard, A. B., Jensen, J. B. and Schott, P. K. (2006), ‘Survival of the best fit: Exposureto low-wage countries and the (uneven) growth of U.S. manufacturing plants’, Journal ofInternational Economics 68(1), 219–237.
Blanchard, E. and Willmann, G. (2016), ‘Trade, education, and the shrinking middle class’,Journal of International Economics 99, 263–278.
Bloom, N., Draca, M. and Van Reenen, J. (2016), ‘Trade induced technical change? Theimpact of Chinese imports on innovation, IT and productivity’, The Review of EconomicStudies 83(1), 87–117.
32

Brandt, L., Van Biesebroeck, J., Wang, L. and Zhang, Y. (2017), ‘WTO accession and perfor-mance of Chinese manufacturing firms’, American Economic Review 107(9), 2784–2820.
Cabral, S. and Esteves, P. S. (2006), ‘Portuguese export market shares: An analysis by se-lected geographical and product markets’, Economic Bulletin, Banco de Portugal Sum-mer, 1–18.
Cardoso, A. R., Guimarães, P. and Portugal, P. (2016), ‘What drives the gender wage gap? Alook at the role of firm and job-title heterogeneity’, Oxford Economic Papers 68(2), 506–524.
Cardoso, A. R., Guimarães, P., Portugal, P. and Reis, H. (2018), The Returns to SchoolingUnveiled, IZA Discussion Papers 11419, Institute for the Study of Labor (IZA).
Costa, F., Garred, J. and Pessoa, J. P. (2016), ‘Winners and losers from a commodities-for-manufactures trade boom’, Journal of International Economics 102(C), 50–69.
Crozet, M. and Orefice, G. (2017), Trade and Labor Market: What Do We Know?, CEPIIPolicy Brief 2017-15, CEPII research center.
Dauth, W., Findeisen, S. and Suedekum, J. (2014), ‘The rise of the East and the Far East:German labor markets and trade integration’, Journal of the European Economic Associa-tion 12(6), 1643–1675.
Dauth, W., Findeisen, S. and Suedekum, J. (2017), ‘Trade and manufacturing jobs in Ger-many’, American Economic Review: Papers & Proceedings 107(5), 337–42.
Dauth, W., Findeisen, S. and Suedekum, J. (2018), Adjusting to globalization - Evidencefrom worker-establishment matches in Germany, IZA Discussion Papers 11299, Institutefor the Study of Labor (IZA).
De Saint-Vaulry, A. (2008), Base de données CHELEM-commerce international du CEPII,Working Papers 2008-09, CEPII Research Center.
Dippel, C., Gold, R., Heblich, S. and Pinto, R. (2017), Instrumental variables and causalmechanisms: Unpacking the effect of trade on workers and voters, NBER Working Paper23209, National Bureau of Economic Research (NBER).
Donoso, V., Martín, V. and Minondo, A. (2015), ‘Do differences in the exposure to Chineseimports lead to differences in local labour market outcomes? An analysis for Spanishprovinces’, Regional Studies 49(10), 1746–1764.
Feenstra, R. C., Ma, H. and Xu, Y. (2017), US Exports and Employment, NBER WorkingPaper 24056, National Bureau of Economic Research (NBER).
33
Flückiger, M. and Ludwig, M. (2015), ‘Chinese export competition, declining exports andadjustments at the industry and regional level in Europe’, Canadian Journal of Economics48(3), 1120–1151.
Haan, J. D., Inklaar, R. and Jong-A-Pin, R. (2008), ‘Will business cycles in the Euro area con-verge? A critical survey of empirical research’, Journal of Economic Surveys 22(2), 234–273.
Hakkala, K. N. and Huttunen, K. (2016), Worker-Level Consequences of Import Shocks,IZA Discussion Papers 10033, Institute for the Study of Labor (IZA).
Hanson, G. H. (2012), ‘The Rise of Middle Kingdoms: Emerging Economies in GlobalTrade’, Journal of Economic Perspectives 26(2), 41–64.
Hijzen, A., Martins, P. S., Schank, T. and Upward, R. (2013), ‘Foreign-owned firms aroundthe world: A comparative analysis of wages and employment at the micro-level’, EuropeanEconomic Review 60(C), 170–188.
Hsieh, C.-T. and Klenow, P. J. (2009), ‘Misallocation and manufacturing TFP in China andIndia’, The Quarterly journal of economics 124(4), 1403–1448.
Hsieh, C.-T. and Ossa, R. (2016), ‘A global view of productivity growth in China’, Journalof International Economics 102(C), 209–224.
Iacovone, L., Rauch, F. and Winters, L. A. (2013), ‘Trade as an engine of creative destruc-tion: Mexican experience with Chinese competition’, Journal of International Economics89(2), 379–392.
Krugman, P. R. (2008), ‘Trade and wages, reconsidered’, Brookings Papers on EconomicActivity 2008(1), 103–154.
Majlesi, K. and Narciso, G. (2018), ‘International import competition and the decision tomigrate: Evidence from Mexico’, Journal of Development Economics 132, 75–87.
Malgouyres, C. (2017), ‘The impact of Chinese import competition on the local structure ofemployment and wages: Evidence from France’, Journal of Regional Science 57(3), 411–441.
Martin, J. and Mejean, I. (2014), ‘Low-wage country competition and the quality content ofhigh-wage country exports’, Journal of International Economics 93(1), 140–152.
Martins, P. S. (2009), ‘Rent sharing before and after the wage bill’, Applied Economics41(17), 2133–2151.
Martins, P. S. and Yang, Y. (2015), ‘Globalized Labour Markets? International Rent SharingAcross 47 Countries’, British Journal of Industrial Relations 53(4), 664–691.
34

Mattoo, A., Mishra, P. and Subramanian, A. (2017), ‘Beggar-thy-neighbor effects of ex-change rates: A study of the renminbi’, American Economic Journal: Economic Policy9(4), 344–366.
Mendez, O. (2015), ‘The effect of Chinese import competition on Mexican local labor mar-kets’, The North American Journal of Economics and Finance 34, 364–380.
Mion, G. and Zhu, L. (2013), ‘Import competition from and offshoring to China: A curse orblessing for firms?’, Journal of International Economics 89(1), 202–215.
Muendler, M.-A. (2017), Trade, technology, and prosperity: An account of evidence from alabor-market perspective, WTO Staff Working Papers ERSD-2017-15, World Trade Orga-nization (WTO).
Pereira, T. (2016), The effect of developing countries’ competition on regional labour mar-kets in Portugal, GEE Papers 0058, Gabinete de Estratégia e Estudos (GEE).
Pessoa, J. P. (2018), Labor Market Responses to Trade Shocks: the UK-China Case, mimeo,Sao Paulo School of Economics.
Raposo, P., Portugal, P. and Carneiro, A. (2015), Decomposing the Wage Losses of Dis-placed Workers: The Role of the Reallocation of Workers into Firms and Job Titles, IZADiscussion Papers 9220, Institute for the Study of Labor (IZA).
Snell, A., Martins, P., Stüber, H. and Thomas, J. P. (2018), ‘Bias in Returns to Tenure WhenFirm Wages and Employment Comove: A Quantitative Assessment and Solution’, Journalof Labor Economics 36(1), 47–74.
Stolper, W. F. and Samuelson, P. A. (1941), ‘Protection and real wages’, The Review ofEconomic Studies 9(1), 58–73.
Utar, H. (2014), ‘When the Floodgates Open: "Northern" Firms’ Response to Removalof Trade Quotas on Chinese Goods’, American Economic Journal: Applied Economics6(4), 226–250.
Utar, H. and Ruiz, L. B. T. (2013), ‘International competition and industrial evolution: Ev-idence from the impact of Chinese competition on Mexican maquiladoras’, Journal ofDevelopment Economics 105, 267–287.
35

Appendices
A Reconciling trade and labour market data
Trade flows of the CEPII - CHELEM database have a product breakdown according to the4-digit level of the International Standard Industrial Classification of All Economic Activi-ties, rev.3 (ISIC3), while the Quadros de Pessoal (QP) dataset makes use of the Portugueseindustrial classification – Classificação Portuguesa das Actividades Económicas (CAE) – inthe version that was in place at the time when the data was collected.
Due to the long time span of the sample, four different revisions of CAE took place from1991 to 2008. Consistent information on Portuguese firms’ main sector activity over timeaccording to CAE rev.3 (CAE3) was provided by Banco de Portugal. CAE3 matches, atthe 4-digit level, the second revision of the Statistical Classification of Economic Activitiesin the European Community (NACE2), and the latter links to the ISIC rev.4 (ISIC4). TheUnited Nations Statistics Division offers a correspondence table between NACE2 and ISIC4.Each NACE2 code corresponds to only one ISIC4 code, but one ISIC4 code can incorporateseveral NACE2 codes. Hence, correspondences between NACE2 and ISIC4 are either 1:1 orm:1.
Trade exposed manufacturing industries were converted from ISIC3 to ISIC4 at the 4-digitlevel. This conversion process was based on correspondence tables between ISIC3, ISIC3.1and ISIC4, obtained from the United Nations Statistics Division. Assumptions were maderegarding ambiguous correspondences (m:m cases) in order to avoid extremely large and hy-brid (4-digit) industry groups. When making these decisions, the specificities of each 4-digitindustry parcel were taken into account within the Portuguese context. Non-manufacturingsectors were not part of the conversion process and are, thus, represented by their originalISIC4 code. All detailed correspondence tables used are available from the authors uponrequest.
36
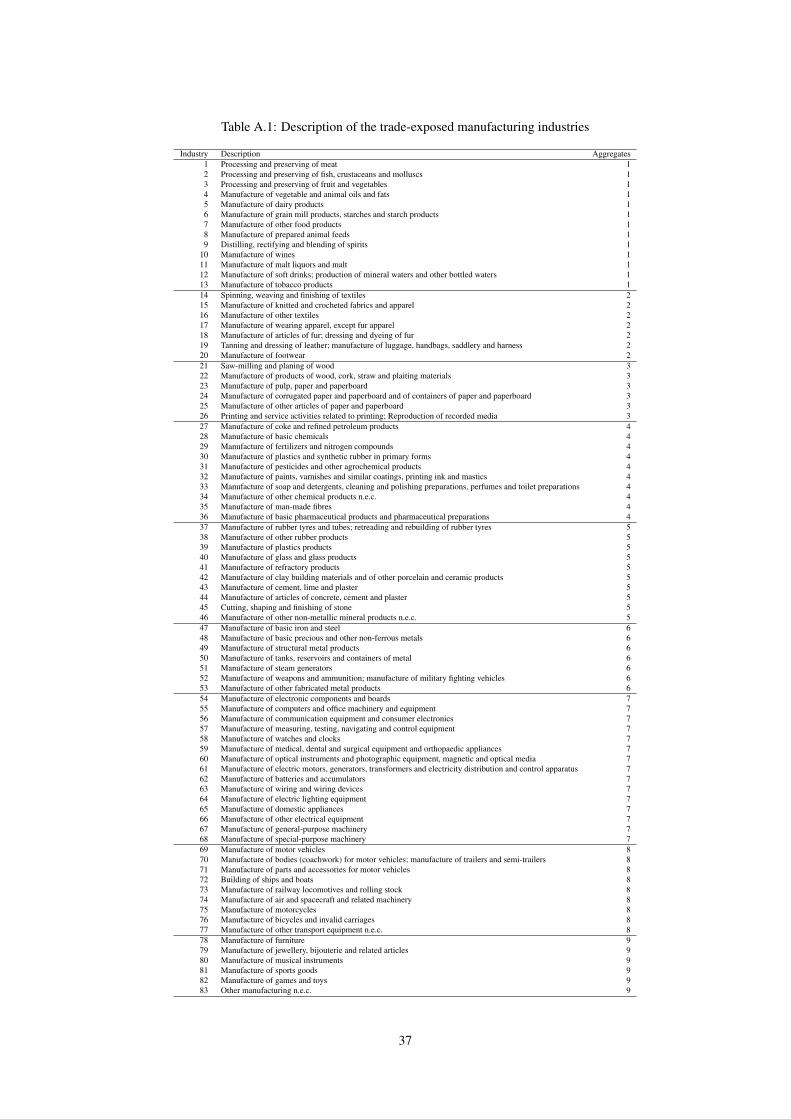
Table A.1: Description of the trade-exposed manufacturing industries
Industry Description Aggregates1 Processing and preserving of meat 12 Processing and preserving of fish, crustaceans and molluscs 13 Processing and preserving of fruit and vegetables 14 Manufacture of vegetable and animal oils and fats 15 Manufacture of dairy products 16 Manufacture of grain mill products, starches and starch products 17 Manufacture of other food products 18 Manufacture of prepared animal feeds 19 Distilling, rectifying and blending of spirits 1
10 Manufacture of wines 111 Manufacture of malt liquors and malt 112 Manufacture of soft drinks; production of mineral waters and other bottled waters 113 Manufacture of tobacco products 114 Spinning, weaving and finishing of textiles 215 Manufacture of knitted and crocheted fabrics and apparel 216 Manufacture of other textiles 217 Manufacture of wearing apparel, except fur apparel 218 Manufacture of articles of fur; dressing and dyeing of fur 219 Tanning and dressing of leather; manufacture of luggage, handbags, saddlery and harness 220 Manufacture of footwear 221 Saw-milling and planing of wood 322 Manufacture of products of wood, cork, straw and plaiting materials 323 Manufacture of pulp, paper and paperboard 324 Manufacture of corrugated paper and paperboard and of containers of paper and paperboard 325 Manufacture of other articles of paper and paperboard 326 Printing and service activities related to printing; Reproduction of recorded media 327 Manufacture of coke and refined petroleum products 428 Manufacture of basic chemicals 429 Manufacture of fertilizers and nitrogen compounds 430 Manufacture of plastics and synthetic rubber in primary forms 431 Manufacture of pesticides and other agrochemical products 432 Manufacture of paints, varnishes and similar coatings, printing ink and mastics 433 Manufacture of soap and detergents, cleaning and polishing preparations, perfumes and toilet preparations 434 Manufacture of other chemical products n.e.c. 435 Manufacture of man-made fibres 436 Manufacture of basic pharmaceutical products and pharmaceutical preparations 437 Manufacture of rubber tyres and tubes; retreading and rebuilding of rubber tyres 538 Manufacture of other rubber products 539 Manufacture of plastics products 540 Manufacture of glass and glass products 541 Manufacture of refractory products 542 Manufacture of clay building materials and of other porcelain and ceramic products 543 Manufacture of cement, lime and plaster 544 Manufacture of articles of concrete, cement and plaster 545 Cutting, shaping and finishing of stone 546 Manufacture of other non-metallic mineral products n.e.c. 547 Manufacture of basic iron and steel 648 Manufacture of basic precious and other non-ferrous metals 649 Manufacture of structural metal products 650 Manufacture of tanks, reservoirs and containers of metal 651 Manufacture of steam generators 652 Manufacture of weapons and ammunition; manufacture of military fighting vehicles 653 Manufacture of other fabricated metal products 654 Manufacture of electronic components and boards 755 Manufacture of computers and office machinery and equipment 756 Manufacture of communication equipment and consumer electronics 757 Manufacture of measuring, testing, navigating and control equipment 758 Manufacture of watches and clocks 759 Manufacture of medical, dental and surgical equipment and orthopaedic appliances 760 Manufacture of optical instruments and photographic equipment, magnetic and optical media 761 Manufacture of electric motors, generators, transformers and electricity distribution and control apparatus 762 Manufacture of batteries and accumulators 763 Manufacture of wiring and wiring devices 764 Manufacture of electric lighting equipment 765 Manufacture of domestic appliances 766 Manufacture of other electrical equipment 767 Manufacture of general-purpose machinery 768 Manufacture of special-purpose machinery 769 Manufacture of motor vehicles 870 Manufacture of bodies (coachwork) for motor vehicles; manufacture of trailers and semi-trailers 871 Manufacture of parts and accessories for motor vehicles 872 Building of ships and boats 873 Manufacture of railway locomotives and rolling stock 874 Manufacture of air and spacecraft and related machinery 875 Manufacture of motorcycles 876 Manufacture of bicycles and invalid carriages 877 Manufacture of other transport equipment n.e.c. 878 Manufacture of furniture 979 Manufacture of jewellery, bijouterie and related articles 980 Manufacture of musical instruments 981 Manufacture of sports goods 982 Manufacture of games and toys 983 Other manufacturing n.e.c. 9
37

B Definition of variables and descriptive statistics
In this appendix we detail the construction of some of the control variables included in theregressions and report their main descriptive statistics.
The eight formal education categories of the worker are based on the International Stan-dard Classification of Education 2011 (ISCED), as described in the following table. In theregressions, illiterate is the omitted category.
Code Description1 Illiterate, no formal education or below ISCED 1.2 Can read and write, but no formal education or below ISCED 1.3 4 years completed (Lower primary education - 1st cycle). Included in ISCED 1.4 6 years completed (Upper primary education - 2nd cycle). Included in ISCED 1.5 9 years completed (Lower secondary education). Refers to ISCED 2.6 12 years completed (Upper secondary education). Refers to ISCED 3.7 Lower tertiary. Refers to ISCED 4-5.8 Upper tertiary. Refers to ISCED 6-8.
The Portuguese Decree-Law 380/80 establishes that firms should indicate the qualificationlevel of the each worker as in the Collective Agreement. The eight formal categories ofworker’s qualifications considered are described in the following table. In the regressions,’Apprentices, interns and trainees’ is the omitted category.
Code Description1 Apprentices, interns and trainees2 Non-skilled professionals3 Semi-skilled professionals4 Skilled professionals5 Highly-skilled professionals6 Supervisors, foremen and team leaders7 Intermediate executives8 Top executives
The nine manufacturing industry aggregates used are food, drinks and tobacco; textiles,clothing and footwear; wood and paper; chemicals; plastics, glass and rubber; metals; ma-chinery, equipment and electronics; transport equipment; others. The composition of eachof the nine aggregates is detailed in Table A.1. The omitted category in the regressions is thenon-manufacturing sector.
38

The 28 regional location categories of the firm are defined for mainland Portugal accordingto the 3rd level of nomenclature of territorial units for statistics (NUTS3), version 1989, asfollows:
Code Description10101 Minho-Lima10102 Cávado10103 Ave10104 Grande Porto10105 Tâmega10106 Entre Douro e Vouga10107 Douro10108 Alto Trás-os-Montes10201 Baixo Vouga10202 Baixo Mondego10203 Pinhal Litoral10204 Pinhal Interior Norte10205 Dão-Lafões10206 Pinhal Interior Sul10207 Serra da Estrela10208 Beira Interior Norte10209 Beira Interior Sul10210 Cova da Beira10301 Oeste10302 Grande Lisboa10303 Península de Setúbal10304 Médio Tejo10305 Lezíria do Tejo10401 Alentejo Litoral10402 Alto Alentejo10403 Alentejo Central10404 Baixo Alentejo10501 Algarve
The measure of overall import penetration of the industry in 1993 is computed as:
ipLevelGlobal j,93 =M→P
j,93
WB j,93,
where M→Pj represents total Portuguese imports from the World for a specific industry j in
1993 and WB j,93 is the total wage bill of the industry j in 1993, used as a proxy of the totalsize of the industry.
39

Table B.1: Descriptive statistics - main sample
Variable Mean Std. Dev. Min Max
Individual controls (1993)
age 35.506 8.258 17 50
age squared 1328.886 587.239 289 2500
tenure 10.871 7.789 1 35
tenure squared 178.850 224.852 1 1225
female 0.383 0.486 0 1
Education dummies
2 0.015 0.122 0 1
3 0.430 0.495 0 1
4 0.211 0.408 0 1
5 0.164 0.370 0 1
6 0.130 0.336 0 1
7 0.015 0.121 0 1
8 0.031 0.174 0 1
Qualification dummies
2 0.074 0.261 0 1
3 0.203 0.402 0 1
4 0.493 0.500 0 1
5 0.062 0.241 0 1
6 0.057 0.232 0 1
7 0.032 0.176 0 1
8 0.033 0.178 0 1
Firm controls (1993)
ln(turnover+1) 15.174 4.487 0 22.656
number of workers 1188.285 3039.030 1 15875
foreign equity 8.882 26.565 0 100
public equity 10.297 29.672 0 100
Sector controls (1993)
sector dummies
1 0.046 0.210 0 1
2 0.190 0.393 0 1
3 0.038 0.190 0 1
4 0.023 0.151 0 1
5 0.046 0.210 0 1
6 0.042 0.201 0 1
7 0.043 0.202 0 1
8 0.024 0.153 0 1
9 0.018 0.132 0 1
ipLevelGlobal 0.254 0.782 0 83.553
Notes: The main sample includes 602,073 workers employed in 1991 and 1993 in both manufacturing and non-manufacturing sectors. Workers’ controlsinclude a female dummy variable, eight formal education categories, eight formal categories of worker’s qualifications, age and age squared, and tenure andtenure squared. The vector of firm-level controls includes the number of employees and the natural logarithm of turnover, the share of public equity, the shareof foreign equity. The vector of firm-level controls also includes twenty eight regional location dummies at the NUTS 3 level as described above. The vectorof sector-level controls include a set of dummy variables for 9 broad aggregate categories computed based on the 83 trade-exposed manufacturing industryand a measure of the total import penetration of the industry.
40

C Gravity-based measures of trade exposure
In this appendix, we describe the procedures used to construct the alternative measures ofdirect and indirect import competition from China based in the gravity model of trade, whichfollow the strategy of Autor et al. (2013) and Dauth et al. (2014).
Consider a standard gravity equation as in Anderson and van Wincoop (2003):
Xh→kj =
(yh
jykj
yWj
).
(τhk
j
Phj Pk
j
)(1−σ j)
, (C.1)
where Xh→kj are exports from country h to country k in industry j, yh
j is country h aggregateexpenditure in industry j, yW
j is world expenditure on the goods from that industry, Phj is the
standard CES price index of industry j in country h, σ j is the elasticity of substitution forindustry j and τhk
j are the iceberg trade costs between country h and country k in industry j.
In logarithm form:
ln(Xh→kj ) = ln
(1
yWj.
ykj
(Pkj )
(1−σ j)
)+ ln
(yh
j
(Phj )
(1−σ j)
)− (σ j−1)ln(τhk
j ) (C.2)
Let Chinese exports to country k in industry j be Xchn→kj and let Portuguese exports country
k in industry j be X prt→kj . Using the standard gravity specification of Equation (C.2), we
obtain the following equation for exports by China to country k in industry j relative toPortuguese exports in logarithm form:
ln(Xchn→kj )− ln(X prt→k
j ) = ln(zchnj )− ln(zprt
j )− (σ j−1)[ln(τchnkj )− ln(τprtk
j )] (C.3)
The term ln(zchnj )− ln(zprt
j ) captures China’s comparative advantage relative to Portugal inindustry j, determined by differences between the two countries in wages, labour productiv-ity, number of product varieties produced, domestic expenditure and competition. The termln(τchn
jk )− ln(τprtjk ) is the China-Portugal difference in trade costs to country k, i.e., the rela-
tive accessibility of market k from China and Portugal, which includes differential levels oftransport costs and trade barriers in destination countries. Demand-side factors in destinationcountry k are removed from Equation (C.3), isolating the effects of bilateral differences inproductivity and trade costs on exports.
To implement the gravity approach, we estimate the following regression, where we add adimension for year t:
ln(Xchn→kjt )− ln(X prt→k
jt ) = α j +αk + ε jkt (C.4)
41

That is, we regress Chinese relative to Portuguese industry exports to various destinationcountries k, pooled over the period 1993-2008, on industry and destination market fixed-effects.
The residual from the regression in Equation (C.4) in each year t is:
ε jkt =
[ln
(zchn
jt
zprtjt
)−α j
]+
[−(σ j−1)ln
(τchnk
jt
τprtkjt
)−αk
](C.5)
The first term on the right of Equation (C.5) is China’s differential comparative advantagerelative to the Portugal for industry j in year t, while the industry fixed-effect absorbs themean difference in China and Portugal export capacities. The second term on the right ofEquation (C.5) is China’s differential trade costs relative to Portugal in industry j and yeart for country k. The destination country fixed-effect absorbs the mean difference in China-Portugal trade costs, which are presumably driven by geography. Hence, the change overtime of the residuals in Equation (C.5) captures the increase in China’s competitiveness rel-ative to the Portugal and China’s differential improvement in access to foreign markets, in-cluding differential changes in trade barriers in the destination countries. These are preciselythe components of China’s export growth whose impact on the Portuguese labour market wewant to measure.
To obtain an alternative to the specification in Equation (1) of the direct effect of importcompetition from China, we use all 82 individual countries available in the CEPII - CHELEMdatabase, excluding China and Portugal, as destination countries k in the estimation of theEquation (C.4). We recover the residuals from this estimation, take their time-differencebetween 1993 and 2008 for each industry j and country k, compute a mean change of theresidual for each industry j as the average across the 82 different countries, and exponentiatethe values. Using these residuals, we compute the following gravity-based measure of directexposure to imports from China in each industry j from 1993 to 2008:
4IPGdir j,τ =4ε̃ j,τMchn→prt
j,93
WB j,93, (C.6)
where 4ε̃ j,τ is the exponentiated mean change in the gravity residuals of Equation (C.5)for industry j across 82 destination markets between 1993 and 2008. When this change inthe residuals is multiplied by the initial level of Portuguese imports from China in industryj in 1993, Mchn→prt
j,93 , we obtain the change in Portuguese imports from China predicted byChina’s increasing competitiveness and falling trade costs over that period.
One of the main contributions of our paper is to consider explicitly the indirect impact ofChinese exports to third countries on the Portuguese labour market. Our argument is that, dueto the rise of China, Portuguese producers can be not only displaced in their home but also in
42
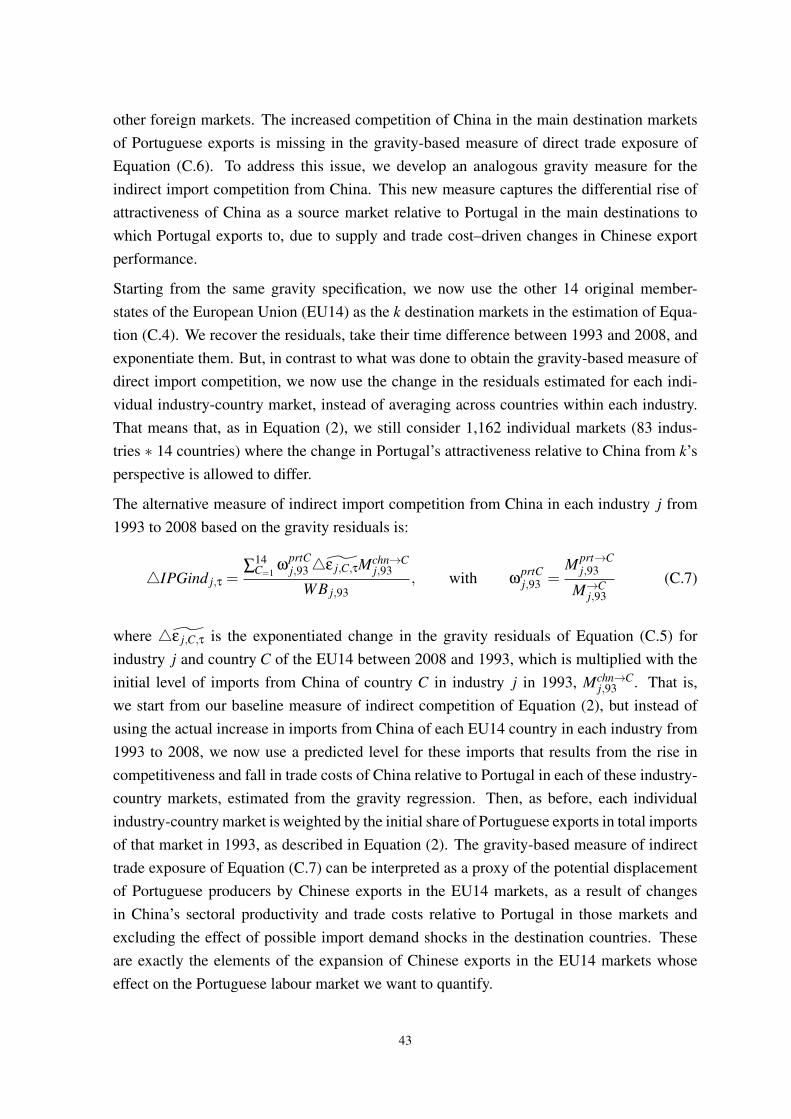
other foreign markets. The increased competition of China in the main destination marketsof Portuguese exports is missing in the gravity-based measure of direct trade exposure ofEquation (C.6). To address this issue, we develop an analogous gravity measure for theindirect import competition from China. This new measure captures the differential rise ofattractiveness of China as a source market relative to Portugal in the main destinations towhich Portugal exports to, due to supply and trade cost–driven changes in Chinese exportperformance.
Starting from the same gravity specification, we now use the other 14 original member-states of the European Union (EU14) as the k destination markets in the estimation of Equa-tion (C.4). We recover the residuals, take their time difference between 1993 and 2008, andexponentiate them. But, in contrast to what was done to obtain the gravity-based measure ofdirect import competition, we now use the change in the residuals estimated for each indi-vidual industry-country market, instead of averaging across countries within each industry.That means that, as in Equation (2), we still consider 1,162 individual markets (83 indus-tries ∗ 14 countries) where the change in Portugal’s attractiveness relative to China from k’sperspective is allowed to differ.
The alternative measure of indirect import competition from China in each industry j from1993 to 2008 based on the gravity residuals is:
4IPGind j,τ =∑
14C=1
ωprtCj,934ε̃ j,C,τMchn→C
j,93
WB j,93, with ω
prtCj,93 =
Mprt→Cj,93
M→Cj,93
(C.7)
where 4ε̃ j,C,τ is the exponentiated change in the gravity residuals of Equation (C.5) forindustry j and country C of the EU14 between 2008 and 1993, which is multiplied with theinitial level of imports from China of country C in industry j in 1993, Mchn→C
j,93 . That is,we start from our baseline measure of indirect competition of Equation (2), but instead ofusing the actual increase in imports from China of each EU14 country in each industry from1993 to 2008, we now use a predicted level for these imports that results from the rise incompetitiveness and fall in trade costs of China relative to Portugal in each of these industry-country markets, estimated from the gravity regression. Then, as before, each individualindustry-country market is weighted by the initial share of Portuguese exports in total importsof that market in 1993, as described in Equation (2). The gravity-based measure of indirecttrade exposure of Equation (C.7) can be interpreted as a proxy of the potential displacementof Portuguese producers by Chinese exports in the EU14 markets, as a result of changesin China’s sectoral productivity and trade costs relative to Portugal in those markets andexcluding the effect of possible import demand shocks in the destination countries. Theseare exactly the elements of the expansion of Chinese exports in the EU14 markets whoseeffect on the Portuguese labour market we want to quantify.
43