disturbance measurements from off-road vehicles … · disturbance measurements from off-road...
TRANSCRIPT
ERD
C/CR
REL
TR
-05
-12
Disturbance Measurements from Off-Road Vehicles on Seasonal Terrain
Rosa T. Affleck July 2005
Col
d R
egio
ns
Res
earc
h
and
En
gin
eeri
ng
Lab
orat
ory
Approved for public release; distribution is unlimited.

COVER: Stryker wheeled vehicle.

ERDC/CRREL TR-05-12 June 2005
Disturbance Measurements from Off-Road Vehicles on Seasonal Terrain
Rosa T. Affleck
Cold Regions Research and Engineering Laboratory U.S. Army Engineer Research and Development Center 72 Lyme Road Hanover, New Hampshire 03755-1290
Final report
Approved for public release; distribution is unlimited.
Prepared for U.S. Army Corps of Engineers Washington, DC 20314-1000

ii ERDC/CRREL TR-05-12
Abstract: Vehicle operations on cross-country terrain for military, com-mercial or industrial, and recreational purposes can disturb the terrain, especially during spring thaw season. Terrain disturbance from off-road vehicle operations can be measured in terms of rut depth and vegetation damage. Ruts occur when vehicle load is greater than the terrain’s bearing capacity, especially in soft soils. Rutting is the physical disturbance of the soil, including compaction and deformation. Estimates of rut depth for wheeled and tracked vehicles in soft, unfrozen soils can be calculated using an empirical equation based on the vehicle and soil properties. The vehicle parameters include vehicle load, tire or tracked footprint area, and wheel slip. The terrain soil properties are very important elements for estimating rut depth, including soil type and strength. Rut depth measurements were collected from military vehicles during Stryker (wheeled) vehicle impact tests at three locations at Donnelly Training Area, Alaska, and from M60A3 (tracked) and HEMTT (wheeled) vehicles at Fort McCoy, Wiscon-sin, during spring thaw seasons. These rut depth data are coupled with in-formation about vehicle maneuvers (multiple passes and turning) and soil properties, such as soil type, moisture content, and soil strength. The scope of this report is to compare the actual rut depth measurements with the empirical equations to relate the physical disturbance of the soil and vegetation to a severity index, quantify the volumetric soil displacement, and assess disturbance on winter operations.

Disturbance Measurements from Off-Road Vehicles iii
CONTENTS
Nomenclature.......................................................................................................vii Preface ................................................................................................................. ix 1 Introduction ..................................................................................................... 1
1.1 Definition of Problem—The Problem of Spring Thaw............................. 1 1.2 Background ............................................................................................... 2 1.3 Objectives.................................................................................................. 5 1.4 Definition of Terms ................................................................................... 5
2 Literature Review............................................................................................ 6 2.1 Vehicle Impact on Arctic and Subarctic Terrain ....................................... 6 2.2 Impact of Military Vehicles on Training Lands ........................................ 7 2.3 Impact of Mechanized Forest Operations on Woodlands ......................... 8
3 Methods......................................................................................................... 10 3.1 Rut Depth ................................................................................................ 10 3.2 Volumetric Soil Displacement ................................................................ 15 3.3 Impact Severity ....................................................................................... 15
4 Test Sites ....................................................................................................... 18 4.1 Locations ................................................................................................. 18 4.2 Climatic Conditions................................................................................. 18 4.3 Terrain Description—Soils...................................................................... 22
5 Data Collection.............................................................................................. 32 5.1 Spring Field Measurements..................................................................... 32 5.2 Winter Test .............................................................................................. 34
6 Analysis and Results ..................................................................................... 36 6.1 Rut Depth Measurements ........................................................................ 37 6.2 Rut Depth Model Comparison ................................................................ 41 6.3 Volumetric Soil Displacement ................................................................ 44 6.4 Cumulative Impact Width ....................................................................... 46 6.5 Disturbance on Winter Terrain................................................................ 51
7 Discussion ..................................................................................................... 53 8 Conclusion..................................................................................................... 55

iv ERDC/CRREL TR-05-12
9 Recommendations ......................................................................................... 57 10 References ..................................................................................................... 58 Appendix A: Summary Tables of Test Data and Example Pictures of Rut
Profile at DTA ........................................................................................ 62 Appendix B: Calculation of Frost Depth ............................................................. 75 Appendix C: Off-Road Vehicle Guidelines and Ratings from Studies in
Alaska ..................................................................................................... 77 Appendix D: Methods to Calculate Vehicle Speed and Turning Radius from
GPS Data................................................................................................. 81
ILLUSTRATIONS
Figure 1. Locations of Stryker maneuver tests at Donnelly Training Area ...........3 Figure 2. Location of wooded trail at Fort McCoy, Wisconsin .............................4 Figure 3. Rut depth measurement and determination using a profilometer .........12 Figure 4. Measurement of tire dimensions...........................................................13 Figure 5. Soil displacement calculation using image processing software to
determine the area of a rut ......................................................................15 Figure 6. Disturbance categories used to determine impact severity...................17 Figure 7. Air freezing degree days and daily average temperatures for Delta
Junction, Alaska, for four winter seasons ...............................................19 Figure 8. Graph of air freezing degree days and daily average temperature for
Sparta, Wisconsin, for the 1994–1995 winter season .............................21 Figure 9. Grain size distribution of the soil at the spiral and multi-pass test
sections at Arkansas Range.....................................................................22 Figure 10. Photo and map of terrain at Arkansas Range showing vegetation
features and pattern of maneuver impact test..........................................24 Figure 11. Gradation curve of the soil at Eddy Drop Zone..................................25 Figure 12. Photo and map of terrain at Eddy Drop Zone showing vegetation
features and pattern of maneuver impact test..........................................26 Figure 13. Highly organic material located at the Texas Range maneuver site...27 Figure 14. Photo and map of terrain at Texas Range showing vegetation
features and pattern of maneuver impact test..........................................28

Disturbance Measurements from Off-Road Vehicles v
Figure 15. Gradation curves for soils on control sections of wooded trail at Fort McCoy.............................................................................................29
Figure 16. Control section of the wooded trail at Fort McCoy trafficked by an M60A3 in April 1995.........................................................................31
Figure 17. Stryker disturbance test in March 2003 at the Texas Range ..............35 Figure 18. Stryker vehicle average speed from a GPS unit at locations where
rut depth data were measured at Arkansas Range, Eddy Drop Zone, and Texas Range.....................................................................................38
Figure 19. Gravimeter water content versus rut depth at Arkansas Range and Eddy Drop Zone .....................................................................................39
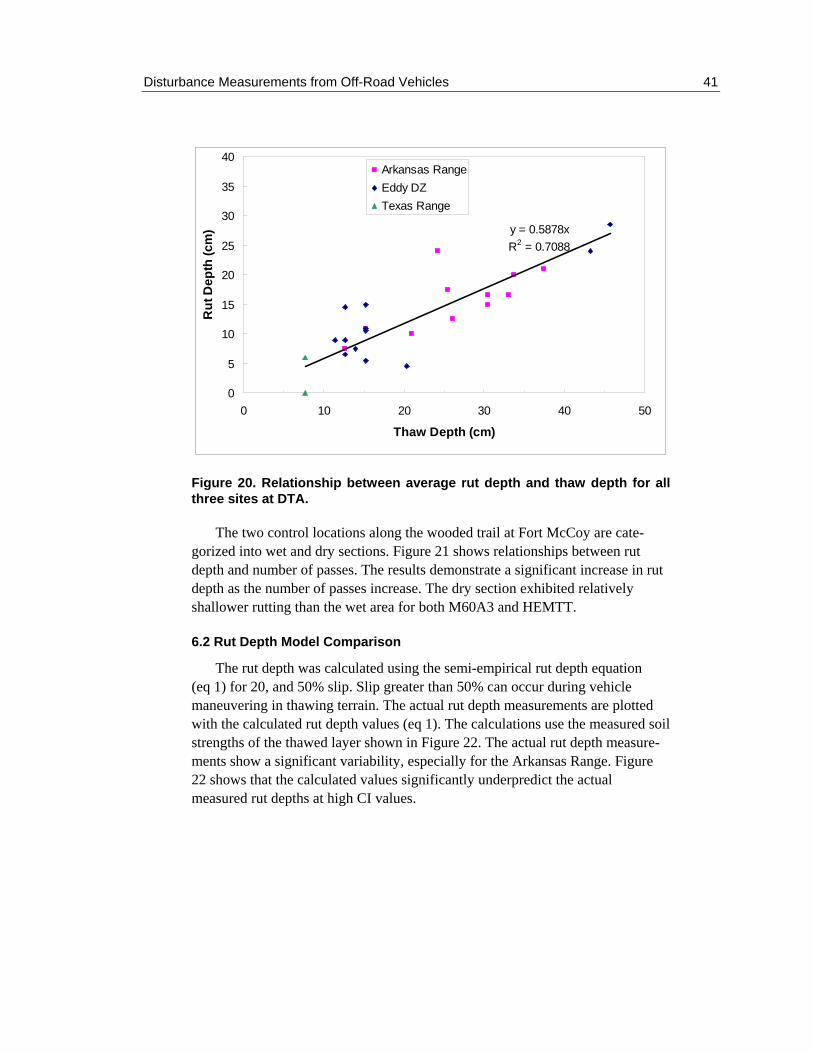
Figure 20. Relationship between average rut depth and thaw depth for all three sites at DTA ...................................................................................41
Figure 21. Number of passes and rut depth relationships on the dry and wet sections of the wooded trail ....................................................................42
Figure 22. Comparison of measured rut depth to predicted rut depth using eq 1 for two values of wheel slip at Arkansas Range and Eddy Drop Zone ........................................................................................................43
Figure 23. Comparison of measured rut depth to predicted rut depth using eq 1 and 2 on both control sections of the wooded trail .........................44
Figure 24. Stryker vehicle turning radius versus average volumetric soil displacement for the wet section at Arkansas Range and Eddy Drop Zone ........................................................................................................45
Figure 25. Rut depth versus average volumetric soil displacement at Arkansas Range, Eddy Drop Zone, and Texas Range............................................47
Figure 26. Stryker vehicle turning radius and cumulative impact width relationships for the outside tracks for Alaska sites................................47
Figure 27. Turning radius and cumulative impact width of single and multi- pass tests at Arkansas Range...................................................................49
Figure 28. Right and left wheel plots of turning radius versus cumulative impact width for single and multi-pass runs at Eddy Drop Zone ...........50
Figure 29. Comparison of cumulative impact width versus turning radius for various military vehicles for single pass.................................................51
Figure 30. Minor vegetation disturbance and no measurable rut depth resulted from the winter disturbance test..............................................................52

vi ERDC/CRREL TR-05-12
TABLES
Table 1. Guidelines for impact severity based on work by Haugen and Haugen et al. .............................................................................................9
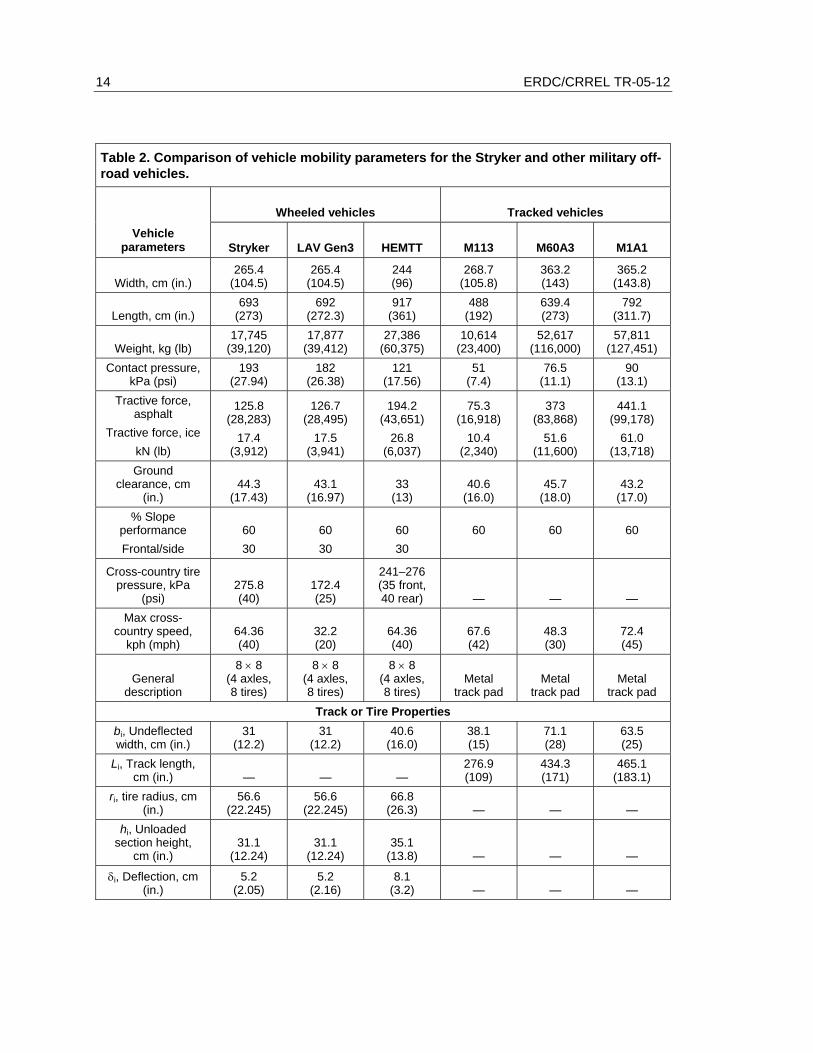
Table 2. Comparison of vehicle mobility parameters for the Stryker and other military off-road vehicles. .............................................................14
Table 3. Test site locations, terrain description, and conditions during trafficking................................................................................................36
Table 4. Relationships derived between volume of soil displaced along the track and turning radius. .........................................................................46
Disturbance Measurements from Off-Road Vehicles vii
NOMENCLATURE bi Undeflected tire or track width (m, in.)
CI Cone index
DTA Donnelly Training Area
GIS Geographic Information System
GPS Global Positioning System
hi Unloaded section height (m, in.)
HEMTT Heavy Expanded Mobility Tactical Truck
HMMWV High-Mobility Multipurpose Wheeled Vehicle
Iaf Air freezing index or air freezing degree days (°C-days)
Iat Thawing index or thawing degree days (°C-days)
kf Frozen thermal conductivity (J/s-m-°C)
ku Unfrozen thermal conductivity (J/s-m-°C)
Li Track length (m, in.)
LAV Light Armored Vehicle
M1 Abrams Tank (M1A1 or M1A2)
nf Freezing surface n-factor (dimensionless)
NCDC National Climatic Data Center
ri Tire radius (m, in.)
RCI Rating cone index (kPa, psi)
s Wheel slip
t Length of freezing period (days)
USCS Unified Soil Classification System
vo Mean annual air temperature (°C)
Vv Velocity of the vehicle (mph)
Vw Velocity of the wheel (mph)
Wi Wheel or track load (N, lb)
X Frost depth (m, ft)
zsoil Sinkage or rut depth (m, in.)

viii ERDC/CRREL TR-05-12
α Thermal ratio (dimensionless)
δi Deflection for the running gear element i (m, in.)
λ Correction coefficient (dimensionless)
μ Fusion parameter (dimensionless)
ρd Soil dry density (kg/m3)
ω Soil moisture content (%)

Disturbance Measurements from Off-Road Vehicles ix
PREFACE
This report was prepared by Rosa T. Affleck, Research Civil Engineer, Civil Engineering Research Division, Engineer Research and Development Center, Cold Regions Research and Engineering Laboratory (ERDC-CRREL), Hanover, New Hampshire.
The author gratefully acknowledges ERDC-CRREL for providing financial support to complete this report, and U.S. Army Alaska’s Department of Public Works for providing funding for the Stryker maneuver study. The author thanks Jerry Reagan of the Cold Region Testing Center and his crew for conducting the Stryker maneuver tests at Donnelly Training Area. She also thanks U.S. Army Alaska Department of Public Works personnel, including Gary Larsen for funding and technical support, and Ellen Clark for assisting during site selection and field work. The author thanks Paul Ayers of the University of Tennessee for his support and for lending his equipment, including the GPS and the profilometer, and thanks Katie Simmons of the University of Tennessee for conducting the severity impact measurements.
The contributions of the following CRREL employees are greatly appreci-ated: Christopher Berini and Garrett Quillia, who assisted with data collection; Charles Collins, CRREL-Fairbanks, for technical and project support; and Major Douglas Anderson, Judy Strange, and Thomas Douglas, CRREL-Fairbanks, for their assistance. The author also gratefully acknowledges the support, contribu-tion, and technical guidance of Sally Shoop on this subject.
This report was prepared under the general supervision of Stephen N. Flanders, Chief, Civil Engineering Research Division, CRREL; Dr. Lance D. Hansen, Deputy Director, CRREL; and James L. Wuebben, Acting Director, CRREL.
The Commander and Executive Director of the Engineer Research and Development Center is Colonel James R. Rowan. The Director is Dr. James R. Houston.


Disturbance Measurements from Off-Road Vehicles on Seasonal Terrain
ROSA T. AFFLECK
1 INTRODUCTION
1.1 Definition of Problem—The Problem of Spring Thaw
Spring thaw is a critical time of year for disturbance to soil and vegetation from vehicle passage. Traffic on off-road terrain includes a variety of purposes, e.g., military vehicles conducting training exercises and operations, oil drilling and exploration, mechanized forest logging operations, and recreational pur-poses. Vehicle disturbance on terrain during spring thaw is more complicated, owing to the saturated and weakened thawed soil layer. Soil moisture is at its maximum levels for the year due to snowmelt, and the moisture is trapped in the thawed layer over an impermeable frozen layer (Shoop 1993, Richmond et al. 1995). The impact of vehicle traffic on shallow, thawed terrain may be severe as a result of slippage and loss of vehicle traction, causing vegetation to be sheared off at the thaw/frost interface. Likewise, the impact can be significant when thaw is deeper and vehicle travel is restricted and impractical.
Soil deformation from military vehicle operations can cause environmental damage by decreasing plant development and increasing erosion (Ayers 1994). Several studies have been conducted to determine the effects of vehicle traffic on soil and the resulting environmental damage (Braunack 1986a, b; Ayers 1994). The potential consequences of vehicle traffic on soil and vegetation in-clude displacement of surface horizons, rut formation, soil compaction, reduction of soil strength, restriction of water movement, and physical damage to root systems. The physical soil disturbances affect not only plant vigor and mortality, but also plant recovery. The severity of disturbance to the terrain has been cor-related with loss of vegetation, exposed soil, increased erosion, soil compaction, and root damage.
Military vehicle operations on training lands during spring thaw can cause significant disturbance to soil and vegetation. The training lands in Alaska have

2 ERDC/CRREL TR-05-12
experienced thermokarst erosion caused by loss of insulating vegetation in per-mafrost zones. Evaluations and guidelines are being developed and monitored for land sustainability (Jorgenson et al. 2004; Shoop et al. 2004a, b). The need to maximize training capacities is important for the Army, but disturbance must be kept to a minimum because of environmental consequences, and to minimize the terrain reclamation or restoration needs.
In winter, however, frozen ground allows vehicles to traverse on areas of otherwise untrafficable or inaccessible lands. The impact to the terrain can be minimal as a result of the frozen soil’s higher strength, and snow cover can also limit the disturbance to the vegetation.
Disturbance to the soil and vegetation generated by the vehicles can be measured in terms of rut depth and severity of the disturbance. This report, however, deals only with the disturbance generated by military vehicles.
1.2 Background
In order to provide a quantitative analysis of the impacts of the Stryker Brigade maneuver training on Alaska training lands, a study was conducted during spring breakup using the 20-ton Stryker wheeled vehicle. The tests were performed in May 2003 at three locations in the Donnelly Training Area (DTA, formerly Fort Greely), Alaska (Affleck et al. 2004a, b). The three locations are at Arkansas Range, Eddy Drop Zone, and Texas Range (Fig. 1). The study encom-passed examination and measurements of the rut depth, soil moisture, thaw depth, soil strength, and disturbance to soil and vegetation along the vehicle tracks in the maneuver test area. The maneuver impact tests consisted of spiral and multi-pass runs to quantify the effects of the vehicle performing various maneuvers (straight versus turning). For the spiral test, the vehicle performed turning maneuvers by traversing from a small radius to larger radii to examine the disturbance generated when the vehicle is turning. The multi-pass tests were composed of lanes with one, three, eight, and thirteen passes. A preliminary data analysis on the maneuver impact tests at DTA is reported in Affleck et al. (2004a, b).
In contrast to the Alaska training sites, the other site where spring rut depth data were collected is located at Fort McCoy, Wisconsin, with moderate seasonal frost conditions (Fig. 2). The rut data used in this report are from two control sections of a wooded trail generated after trafficking using the M60A3 (tracked) and HEMTT (wheeled) vehicles in April 1995, in conjunction with a soil sta-bilization project (Kestler et al. 1999). The control sections of the trail were relatively straight and fairly flat, and rut depth measurements from one, ten, twenty-five, and fifty passes were taken.

Disturbance Measurements from Off-Road Vehicles 3
Figure 1. Locations of Stryker maneuver tests at Donnelly Training Area.

4 ERDC/CRREL TR-05-12
Figure 2. Location of wooded trail at Fort McCoy, Wisconsin.
Rut depth is the distance measured between the bottom of the tire track that has been caused by vehicle traffic and the adjacent undisturbed soil surface. A semi-empirical equation to predict rut depth has been developed for off-road vehicles in soft and unfrozen soils (Willoughby and Turnage 1990, Sullivan and Anderson 2000). This equation is a function of soil strength and vehicle parameters. Actual rut depth measurements from each site are compared to the estimated rut depth predicted by the semi-empirical equation.
A method to calculate the volume of soil being displaced and/or the volume change due to ground compression along the tracks is also developed based on the rut depth data. Correlations are established on the amount of rutting between a single pass and multiple passes. Likewise, disturbance relationships are devel-oped on straight path and turning sections.
A guideline was used to quantify the amount of disturbance to the soil and vegetation in terms of percent, which included vegetation damage, removal of vegetation, exposure of soil, and soil compaction. The cumulative impact width is based on the disturbed width and the impact severity. Cumulative impact width and turning radius relationships have been developed for various military vehi-cles from various training lands for summertime conditions. Cumulative impact width and turning radius relationships for the Stryker vehicle were developed and compared with other military vehicles.
Disturbance Measurements from Off-Road Vehicles 5
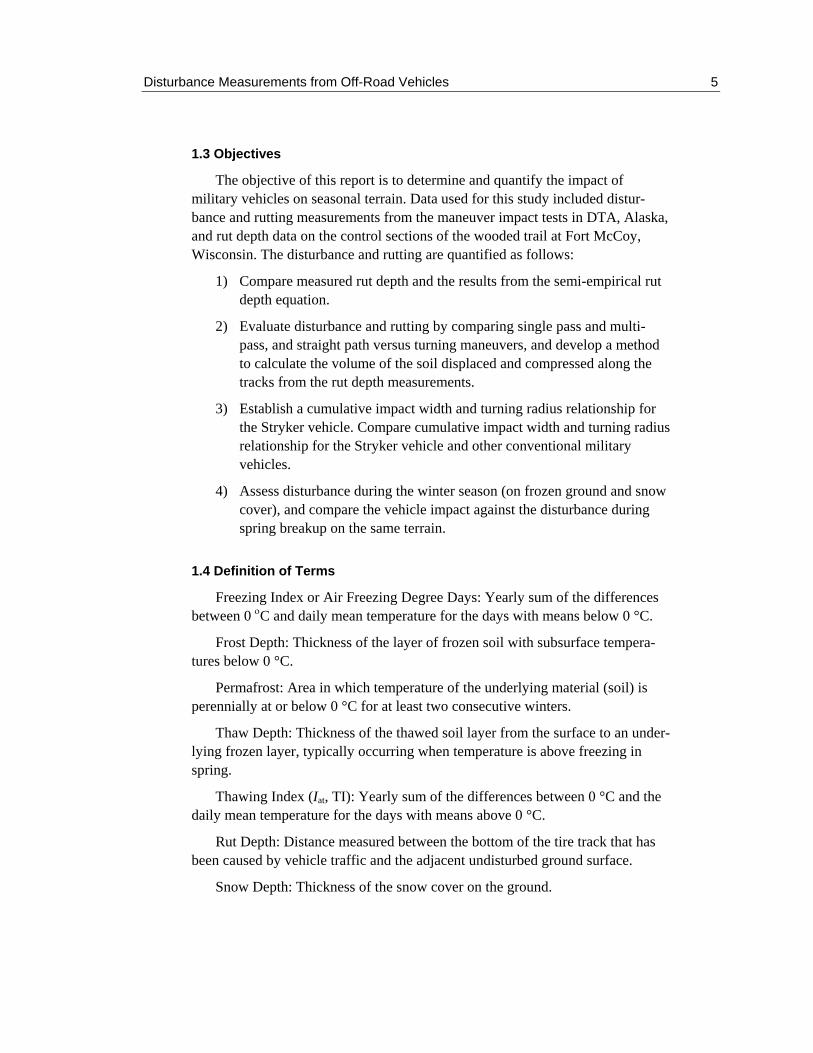
1.3 Objectives
The objective of this report is to determine and quantify the impact of military vehicles on seasonal terrain. Data used for this study included distur-bance and rutting measurements from the maneuver impact tests in DTA, Alaska, and rut depth data on the control sections of the wooded trail at Fort McCoy, Wisconsin. The disturbance and rutting are quantified as follows:
1) Compare measured rut depth and the results from the semi-empirical rut depth equation.
2) Evaluate disturbance and rutting by comparing single pass and multi-pass, and straight path versus turning maneuvers, and develop a method to calculate the volume of the soil displaced and compressed along the tracks from the rut depth measurements.
3) Establish a cumulative impact width and turning radius relationship for the Stryker vehicle. Compare cumulative impact width and turning radius relationship for the Stryker vehicle and other conventional military vehicles.
4) Assess disturbance during the winter season (on frozen ground and snow cover), and compare the vehicle impact against the disturbance during spring breakup on the same terrain.
1.4 Definition of Terms
Freezing Index or Air Freezing Degree Days: Yearly sum of the differences between 0 οC and daily mean temperature for the days with means below 0 °C.
Frost Depth: Thickness of the layer of frozen soil with subsurface tempera-tures below 0 °C.
Permafrost: Area in which temperature of the underlying material (soil) is perennially at or below 0 °C for at least two consecutive winters.
Thaw Depth: Thickness of the thawed soil layer from the surface to an under-lying frozen layer, typically occurring when temperature is above freezing in spring.
Thawing Index (Iat, TI): Yearly sum of the differences between 0 °C and the daily mean temperature for the days with means above 0 °C.
Rut Depth: Distance measured between the bottom of the tire track that has been caused by vehicle traffic and the adjacent undisturbed ground surface.
Snow Depth: Thickness of the snow cover on the ground.

6 ERDC/CRREL TR-05-12
2 LITERATURE REVIEW
Off-road vehicle traffic induces various impacts on terrain, especially during the thawing season. The impact is a function of vehicle type, the soil (strength, type, drainage, etc.), terrain, and climatic conditions. Several research studies have been undertaken, including vegetation disturbance (compression, breakage, removal, etc.), soil compaction, bulk densities, saturated hydraulic conductivity, and rutting of various vehicles for different purposes and operation. These reports are grouped according to vehicle impact on arctic and subarctic terrain, vehicle impact from military vehicles on training lands, and impact of mech-anized vehicles on forest operations.
2.1 Vehicle Impact on Arctic and Subarctic Terrain
A compilation of studies conducted on the disturbance and recovery of Alaskan tundra terrain caused by natural (fire, erosion, thaw lakes, frost action, etc.), and human-induced (off-road transportation, construction) activities is documented in Walker et al. (1987). The impacts from off-road transportation corridors, such as bulldozed trails and summer off-road vehicle trails, were addressed. Disturbance from construction of winter snow and ice roads with the main emphasis on the effects on vegetation was also addressed. Cross-tundra vehicle traffic may produce all levels of initial disturbance, ranging from com-pression of vegetation to displacement and removal of vegetation (Walker et al. 1977, Abele et al. 1978, Lawson 1982, Everett et al. 1985, Walker et al. 1987, Emers et al. 1995). Their studies concluded that the disturbance is based on many factors, including vehicle type, acceleration, turning radius, speed, time of summer, number of passes, slope, and vegetation.
A few studies have been conducted on the long- and short-term effects of off-road vehicle traffic on arctic tundra and subarctic alpine tundra soils (Sparrow et al. 1978, Abele et al. 1984, Slaughter et al. 1990). Soils with high and low ice content can be found in arctic and subarctic alpine terrain. Areas with high-ice-content soils were found to be more vulnerable to vehicle damage than those with low ice content (Hok 1969, Gersper and Challinor 1975). Sparrow et al. (1978) investigated the relationships between the severity of soil disturbance and the parameters of soil drainage class, soil morphology (soil profile), topography, and soil compaction (bulk density) of existing off-road vehicle trails. Their study concluded that poorly drained soils underlain by permafrost are often most heavily damaged, and soil bulk densities were relatively higher on traffic areas than the undisturbed areas.

Disturbance Measurements from Off-Road Vehicles 7
Several disturbance rating procedures have been established to rate the impacts of vehicles on permafrost-underlain terrain; some are summarized in Appendix C. A more quantified rating scheme that includes compression, dis-placement, breakage, and deposition of vegetation was developed by Abele et al. (1978) and is shown in Table C1. Later, Slaughter et al. (1990) developed summary ratings from the results of several off-road vehicle impact studies (Table C2) for typical vehicles listed in Table C3. These off-road vehicles ranged from small all-terrain (900–600 kg) to heavy wheeled and tracked (1,500–10,000 kg) vehicles, and are widely used in subsistence harvesting, sport hunting, recrea-tion, and general transportation in Alaska.
2.2 Impact of Military Vehicles on Training Lands
Similarly, vegetation disturbance and soil deformation from military vehicle operations can cause environmental damage by decreasing plant development and increasing erosion on training lands, and are of great concern for training land managers. Training lands in Alaska have experienced thermokarst erosion caused by loss of insulating vegetation in permafrost zones. Evaluations and guidelines are being developed and monitored for land sustainability (Jorgenson et al. 2004; Shoop et al. 2004a, b). Analyses were conducted by Shoop et al. (2004a, b) for U.S. Army Alaska training lands, and criteria were developed in which rut depths less than 6 cm (2.5 in.) are considered to be minor damage and rut depth greater than 15 cm (6 in.) is significant. The need to maximize training capacity is important for the Army, but disturbance must be kept to a minimum because of environmental consequences and to minimize the terrain restoration needs.
Several recent research studies have been conducted to determine the effects of military vehicle traffic, both wheeled and tracked, on soil, and the ensuing environmental damage. The results are documented by Braunack (1986a, b); Ayers (1994); Ayers et al. (2000); Halvorson et al. (2001); Haugen (2002); Gatto (2002); and Haugen et al. (2002). These studies, however, were conducted on military training lands in temperate regions with no seasonal or frost effects, except for Halvorson et al. (2001) and Gatto (2002). Braunack (1986a) conducted a test using the M113 (tracked, armored personnel carrier vehicle) on sandy soils in straight and turning paths to determine the effects of soil bulk density, saturated hydraulic conductivity, cone penetrometer resistance, and surface micro-relief (rut depth). In contrast to other studies, results from Braunack (1986a) showed a lower soil cone resistance within the tracks for the single pass and no change for two and six passes both on straight and turn tracks. It was also observed that a larger area was disturbed when the vehicle turned with increased rut width and depth.

8 ERDC/CRREL TR-05-12
Changes in rut geometry caused by freeze–thaw effects have been investigated by both Gatto (2002) and Halvorson et al. (2001). Gatto (2002) investigated rut depth and soil physical properties changes over several winter seasons caused by soil freezing from ruts generated from an M1, HMMWV, and HEMTT at Ethan Allen Firing Range (EAFR) in northwest Vermont, and showed that slumping of soil occurred in sidewalls of deep ruts in the spring as the soil thawed and loosened the compacted soil in the ruts. Halvorson et al. (2001) measured rut depths ranging from 2 to 15 cm and 64 cm wide, generated from an M1A2 tank during summer at Yakima Training Area (YTA) in central Washing-ton, and found that ruts were smoothed over time as a result of several events of shallow freeze–thaw cycles (cold wet winters).
The type of military maneuvers can also influence the impact on the terrain, whether the vehicles are performing column formation (single and multi-pass paths) or turning maneuvers. Guidelines to measure the disturbance to the soil and vegetation were established using impact severity and its corresponding disturbed width based on work by Ayers et al. (2000), Haugen (2002), and Haugen et al. (2002), as listed in Table 1. They have established cumulative impact width and turning radius relationships for several military vehicles from test data collected at YTA and Australia during summer conditions. These relationships are used for comparison to the test data measured for the Stryker vehicle at the Donnelly Training Area.
An empirical equation to predict rut depth has been developed by Willough-by and Turnage (1990) for off-road vehicles in soft and unfrozen soils. This equation has been incorporated into a vehicle performance prediction model (Richmond et al. 1995) and applied in a model to evaluate vehicle severity factors for estimation of U.S. Army lands’ training capacity (Sullivan and Anderson 2000).
2.3 Impact of Mechanized Forest Operations on Woodlands
Disturbance caused by machines used in forest operations for wood harvest-ing and timber extraction has been found to create site impacts, especially on sensitive forests with soft soil. Many researchers have concluded that harvesting in both poorly drained and well-drained soil with a high seasonal water table can result in soil compaction or rutting, and may limit or restrain root growth (Aust et al. 1995, Stone 2002, Nugent et al. 2003). These machines induced ground pressure ranging from 20 kPa to 125 kPa (Table C4). Aust et al. (1995) con-ducted compaction and rutting studies on coarser surface material (sandy soils) overlying finer subsoil materials (sandy clays and clays). Bulk densities were found to be 20% higher on the rutted and compacted area than the non-trafficked

Disturbance Measurements from Off-Road Vehicles 9
sites. Also, the average saturated hydraulic conductivity rate at which free water is able to drain through the soil structure decreased at least 10% after rutting and compaction. Similarly, Nugent et al. (2003) conducted a study on peat sites (95% water content and 5% solid content) and found that harvesting and extraction machines compacted the top 40 cm of the soil (peat) profile after trafficking based on the cone penetrometer resistance data. The average rut depth after one pass of 73.9-kPa ground pressure harvester was 15.3 cm with cone penetrometer resistance of 494 kPa.
Table 1. Guidelines for impact severity based on work by Haugen (2002) and Haugen et al. (2002).
% Impact severity Guidelines
0 No visible disturbance as compared to surrounding vegetation/area.
10 Laying down of vegetation; will recover quickly; few, if any, broken stems; no evidence of vegetative shearing; very difficult to see impact after a few days.
20
Some broken stalks/plants; no possibility of these stalks/plants straightening or returning to initial conditions within a few days; visible for a couple of months after impact; visible soil disturbance, possibly exposing bare soil as a result of vehicle weight.
40
Obvious depressed soil and vegetation with slight vegetation removal and significant vegetative damage; crushing, shearing, and slight removal of vegetation likely; piling on track edge evident due to turning and weight of vehicle; movement of plants/soil toward the edge of vehicle track without completely shearing plant at roots; some bare soil exposed.
60
About one-third of vegetation still present and intact on the track; significant amount of bare soil exposed; larger piling of vegetation on the edge of the track due to shearing motion of the vehicle, fully removing species from track; some of the pile has overturned, exposing some roots to air, suggesting vegetation may not recover.
80
Few vegetative species still intact on vehicle path; some vegetation has been sheared down to just above roots, so very little of plant remains above ground, while other vegetation has been fully sheared, removing roots; piling of vegetation and soil on the edge of the path; pile is completely overturned, exposing roots, suggesting the majority of species will not recover.
100 Complete removal of vegetation and soil; shearing action of vehicle has left vehicle track bare; sheared vegetation and soil is piled on edge of track.

10 ERDC/CRREL TR-05-12
3 METHODS
The methods used to quantify the disturbance from military vehicles on the terrain include comparison of actual rut depth and results to the semi-empirical rut depth equation; soil displacement correlations between single pass and multi-pass runs, straight path versus turning maneuvers; cumulative impact width and turning radius relationships; and comparison between the Stryker and other con-ventional military vehicles.
3.1 Rut Depth
3.1.1 Measurements
Rut depth is the distance measured between the bottom of the tire track that has been caused by vehicle traffic and the adjacent undisturbed soil surface. Rut depth is typically measured with a profilometer, which is placed in the center of the tracks, and depths. This was the technique used at Fort McCoy and DTA. However, more detailed rut depth data were collected from the maneuver impact tests at DTA using a profilometer made of a metal bar with sliding rods as shown in Figure 3. The rods are spaced every 2 cm horizontally and each rod is marked at 1-cm intervals vertically. The profilometer was placed in the center of the rut and a photo of the rut depth taken, and its location noted using a GPS unit. The photos were printed and lines were drawn of the natural (undisturbed) ground surface profile (the outside of the ruts) and maximum level of the rut. Rut depth is determined by counting the 1-cm intervals on the rod between the surface and rut lines (Fig. 3).
3.1.2 Rut depth model
Soil sinkage or rut depth (z) can be calculated for wheeled and tracked vehicles using semi-empirical equations developed by Willoughby (Willoughby and Turnage unpublished memo 1990), Richmond et al. (1995), and Sullivan and Anderson (2000). Although rut depth and sinkage are not equivalent, the measured difference is small and they were considered equivalent for these calculations. The equations for wheeled and tracked vehicles, respectively, are

Disturbance Measurements from Off-Road Vehicles 11
( ) ( )
1i 2soil 5 / 3
i i3/ 2 1 5
i i i
10* *2* * *
* 1 δ / *
rz NRCI r b
W h s
=⎡ ⎤⎢ ⎥⎢ ⎥−⎣ ⎦
(Wheeled) (1)
1i i i 2
soil i(5.887 * / * * )0.00443* * *W RCI b Lz L e N⎡ ⎤= ⎢ ⎥⎣ ⎦
(Tracked) (2)
Vw VvsVw−
= (3)
where zsoil = sinkage or rut depth, m (in.) RCI = rating cone index (kPa, psi) bi = undeflected tire or track width, m (in.) Li = track length, m (in.) ri = tire radius, m (in.) Wi = wheel or track load, N (lb) hi = unloaded section height, m (in.) δi = deflection, m (in.) for the running gear element i s = wheel slip Vw = velocity of the wheel (mph) Vv = velocity of the vehicle (mph) N = number of passes.
The variables for tire dimensions listed above are illustrated in Figure 4. Equations 1 and 2 were developed for predicting single-pass and multi-pass rut depths of ground vehicles. Sullivan and Anderson (2000) suggested a value for wheel slip of 20%. A 5% wheel slip value would not be uncommon for a vehicle traveling on a competent surface, while 50% slip or more would result from a low-traction surface. In this analysis, equation 1 was used to calculate the expected rut depth using 20% and 50% wheel slip for one pass and for 10 and thirteen passes. The predicted rut depth values are compared to the measured rut depth data.
Soil strength was expressed as a Cone Index (CI) or Rating Cone Index (RCI) for the layer of soil from 0 to 15 cm (0 to 6 in.), and also for the layer from 15 to 30 cm (6 to 12 in.) in depth. The soil strength was measured using a 30º circular stainless steel cone penetrometer, which correlates the soil strength to the shear resistance of the soil. The cone is pushed into the soil at a uniform rate and readings were recorded at 2.54-cm (1-in.) intervals. The CI is calculated from the

12 ERDC/CRREL TR-05-12
cone penetrometer reading and the cone basal area (ASAE 1999). CI is for sandy soils since these materials do not remold. The RCI accounts for the remolding of more resilient soils and for the effect of multiple passes of vehicles (RCI = CI × Remolding Index). Remolding index, however, applies only to fine-grained soils such as silts and clays. Because the soils in this analysis are mainly silty sands (SM and SP-SM), CI values were used in the equations and are expressed in psi or kPa.
Figure 3. Rut depth measurement and determination using a profilometer.
The maximum estimated rut depth for the vehicle using equations 1 and 2 cannot exceed the vehicle ground clearance height because the vehicle will bottom out at that depth, possibly resulting in immobilization. Therefore, any calculated rut depths greater than the vehicle ground clearance are set equal to the vehicle clearance height. The clearance heights for each vehicle are listed in Table 2.

Disturbance Measurements from Off-Road Vehicles 13
Figure 4. Measurement of tire dimensions.
14 ERDC/CRREL TR-05-12
Table 2. Comparison of vehicle mobility parameters for the Stryker and other military off-road vehicles.
Wheeled vehicles Tracked vehicles
Vehicle parameters Stryker LAV Gen3 HEMTT M113 M60A3 M1A1
Width, cm (in.) 265.4
(104.5) 265.4
(104.5) 244 (96)
268.7 (105.8)
363.2 (143)
365.2 (143.8)
Length, cm (in.) 693
(273) 692
(272.3) 917
(361) 488
(192) 639.4 (273)
792 (311.7)
Weight, kg (lb) 17,745
(39,120) 17,877
(39,412) 27,386
(60,375) 10,614
(23,400) 52,617
(116,000) 57,811
(127,451) Contact pressure,
kPa (psi) 193
(27.94) 182
(26.38) 121
(17.56) 51
(7.4) 76.5
(11.1) 90
(13.1) Tractive force,
asphalt Tractive force, ice
kN (lb)
125.8 (28,283)
17.4 (3,912)
126.7 (28,495)
17.5 (3,941)
194.2 (43,651)
26.8 (6,037)
75.3 (16,918)
10.4 (2,340)
373 (83,868)
51.6 (11,600)
441.1 (99,178)
61.0 (13,718)
Ground clearance, cm
(in.) 44.3
(17.43) 43.1
(16.97) 33
(13) 40.6
(16.0) 45.7
(18.0) 43.2
(17.0) % Slope
performance Frontal/side
60 30
60 30
60 30
60
60
60
Cross-country tire pressure, kPa
(psi) 275.8 (40)
172.4 (25)
241–276 (35 front, 40 rear) — — —
Max cross-country speed,
kph (mph) 64.36 (40)
32.2 (20)
64.36 (40)
67.6 (42)
48.3 (30)
72.4 (45)
General description
8 × 8 (4 axles, 8 tires)
8 × 8 (4 axles, 8 tires)
8 × 8 (4 axles, 8 tires)
Metal track pad
Metal track pad
Metal track pad
Track or Tire Properties bi, Undeflected width, cm (in.)
31 (12.2)
31 (12.2)
40.6 (16.0)
38.1 (15)
71.1 (28)
63.5 (25)
Li, Track length, cm (in.) — — —
276.9 (109)
434.3 (171)
465.1 (183.1)
ri, tire radius, cm (in.)
56.6 (22.245)
56.6 (22.245)
66.8 (26.3) — — —
hi, Unloaded section height,
cm (in.) 31.1
(12.24) 31.1
(12.24) 35.1
(13.8) — — —
δi, Deflection, cm (in.)
5.2 (2.05)
5.2 (2.16)
8.1 (3.2) — — —

Disturbance Measurements from Off-Road Vehicles 15
3.2 Volumetric Soil Displacement
A method to calculate the volume of deformation (rutting) can be achieved using the rut depth measurements from a profilometer. Using the picture file of rut depth data, the soil displacement or deformation area of the rut can be calcu-lated using image processing software (Image Pro Plus). The area is determined using the correct scale of the profilometer from the rod increments and spacing in centimeters, then tracing the enclosed area of the rut and counting the number of pixels inside it (Fig. 5). Using a conservative assumption that soil being displaced is uniform within 1 m of track length, the volumetric displacement is computed by multiplying the area of soil displaced by 100 cm of track length.
Figure 5. Soil displacement calculation using image processing software to determine the area of a rut.
3.3 Impact Severity
The disturbance categories included an imprint, a scrape, and a pile, or a combination of both as illustrated in Figure 6 (Ayers et al. 2000, Haugen 2002, Haugen et al. 2002). An imprint is defined as an occurrence in which soil and vegetation are compressed in the vehicle track. A scrape is an occurrence in which the soil and vegetation have been stripped away from the vehicle track. A pile disturbance happens when soil and vegetation have been displaced from the vehicle track and piled on the side(s). The impact severity was characterized by the amount of vegetation disturbed and removed, and the amount of bare soil
16 ERDC/CRREL TR-05-12
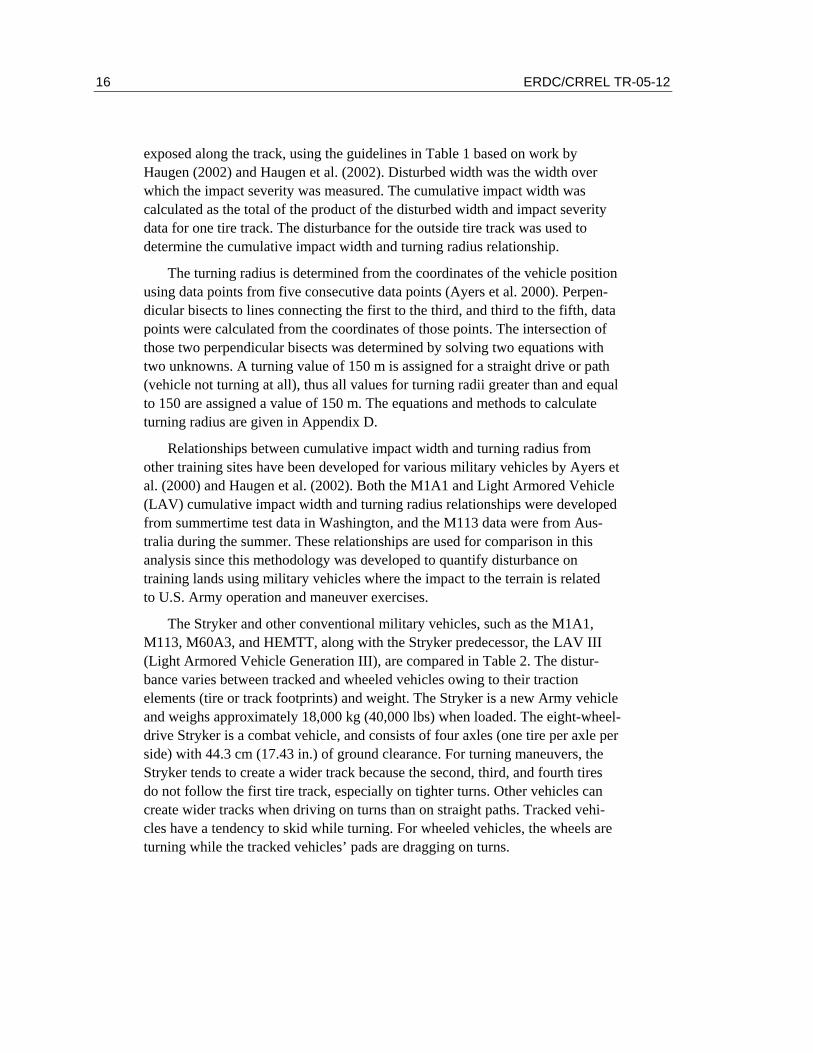
exposed along the track, using the guidelines in Table 1 based on work by Haugen (2002) and Haugen et al. (2002). Disturbed width was the width over which the impact severity was measured. The cumulative impact width was calculated as the total of the product of the disturbed width and impact severity data for one tire track. The disturbance for the outside tire track was used to determine the cumulative impact width and turning radius relationship.
The turning radius is determined from the coordinates of the vehicle position using data points from five consecutive data points (Ayers et al. 2000). Perpen-dicular bisects to lines connecting the first to the third, and third to the fifth, data points were calculated from the coordinates of those points. The intersection of those two perpendicular bisects was determined by solving two equations with two unknowns. A turning value of 150 m is assigned for a straight drive or path (vehicle not turning at all), thus all values for turning radii greater than and equal to 150 are assigned a value of 150 m. The equations and methods to calculate turning radius are given in Appendix D.
Relationships between cumulative impact width and turning radius from other training sites have been developed for various military vehicles by Ayers et al. (2000) and Haugen et al. (2002). Both the M1A1 and Light Armored Vehicle (LAV) cumulative impact width and turning radius relationships were developed from summertime test data in Washington, and the M113 data were from Aus-tralia during the summer. These relationships are used for comparison in this analysis since this methodology was developed to quantify disturbance on training lands using military vehicles where the impact to the terrain is related to U.S. Army operation and maneuver exercises.
The Stryker and other conventional military vehicles, such as the M1A1, M113, M60A3, and HEMTT, along with the Stryker predecessor, the LAV III (Light Armored Vehicle Generation III), are compared in Table 2. The distur-bance varies between tracked and wheeled vehicles owing to their traction elements (tire or track footprints) and weight. The Stryker is a new Army vehicle and weighs approximately 18,000 kg (40,000 lbs) when loaded. The eight-wheel-drive Stryker is a combat vehicle, and consists of four axles (one tire per axle per side) with 44.3 cm (17.43 in.) of ground clearance. For turning maneuvers, the Stryker tends to create a wider track because the second, third, and fourth tires do not follow the first tire track, especially on tighter turns. Other vehicles can create wider tracks when driving on turns than on straight paths. Tracked vehi-cles have a tendency to skid while turning. For wheeled vehicles, the wheels are turning while the tracked vehicles’ pads are dragging on turns.

Disturbance Measurements from Off-Road Vehicles 17
a. Example of imprint disturbance.
b. Example of a combination of pile and scrape disturbances.
Figure 6. Disturbance categories used to determine impact severity.
18 ERDC/CRREL TR-05-12
4 TEST SITES
4.1 Locations
4.1.1 Donnelly Training Area (DTA [formerly Fort Greely]), Alaska
Rut depth and disturbance measurements were collected from the maneuver impact tests performed during spring breakup at three locations east of the Delta River. These tests were conducted at the Arkansas Range, Eddy Drop Zone, and Texas Range (Fig. 1) in May 2003 using the 20-ton wheeled Stryker vehicle. A preliminary analysis of this test is reported by Affleck et al. (2004a).
The winter test was conducted in March 2003 at the Texas Range using the Stryker vehicle. This test is briefly discussed in Affleck et al. (2004b) and Shoop et al. (2004a, b).
4.1.2 Fort McCoy, Wisconsin
Rut depth data used in this report were measured on the control sections of a trail and were collected for a stabilization demonstration study at Fort McCoy for M60A3 (tracked) and HEMTT (wheeled) vehicles in April 1995 as documented in Kestler et al. (1999) (Fig. 2). Stabilization techniques were applied and control sections were selected along the trails before trafficking was conducted. Each stabilization method was evaluated. Rut depths and other soil properties data were collected after trafficking.
4.2 Climatic Conditions
4.2.1 DTA, Alaska
DTA is subjected to a wide range of weather extremes and seasonal varia-tions. The terrain condition can be described by the soils, vegetation, and loca-tions of discontinuous permafrost. In winter, frozen ground allows vehicle maneuvers in areas that would not otherwise be maneuverable due to weaker ground conditions such as a thawed, active layer above permafrost, bogs, or wet areas. Frozen ground along with sufficient snow cover can minimize the distur-bance to soil and vegetation. The terrain is most severely damaged by off-road maneuvering when the ground is saturated during the thawing season or when it is subjected to freeze–thaw cycling in the spring and fall, but especially during the spring-thaw period when an impermeable frozen layer exists beneath the freeze–thaw layer.

Disturbance Measurements from Off-Road Vehicles 19
Based on the daily mean temperature data from the National Climatic Data Center (NCDC), the 2002–2003 winter season had 153 days of temperature below 0 °C and a freezing index of 1589 °C-days (Fig. 7a). The chart of the daily average temperature for the 2002–2003 winter season is shown in Figure 7b. The winter season of 2002–2003 was considerably warmer than the previous winter season of 2001–2002, with a freezing index of 2564 °C-days (Fig. 7a).
Frost penetration calculations using the Stefan and modified Berggren equations for each site are given in Appendix B, based on the air freezing index and annual mean temperature prior to spring breakup. Frost depth results do not account for permafrost depth and conditions, especially at the Texas Range site. Observations of ground temperature measured for Big Delta, Alaska, were reported by Aitken (1964). It was noted in Aitken’s report that the average measured seasonal frost penetration of the area from the temperature profile was approximately 4.3 m (14 ft), and the mean annual snowfall was 93.7 cm (36.9 in.). The mean annual air temperature ranges from 0.8 to –1.9 °C based on 1999–2003 temperature data.
0
500
1000
1500
2000
2500
3000
26-A
ug
20-S
ep
15-O
ct
9-Nov
4-Dec
29-D
ec
23-Ja
n
17-Fe
b
14-M
ar8-A
pr3-M
ay
28-M
ay
Time
AFD
D (°
C-d
ays)
1999-20002000-20012001-20022002-2003
Maneuver Test
a. Air freezing degree days chart.
Figure 7. Air freezing degree days and daily average temperatures for Delta Junction, Alaska, for four winter seasons.

20 ERDC/CRREL TR-05-12
-40
-30
-20
-10
0
10
20
30
1-Aug
26-A
ug
20-S
ep
15-O
ct
9-Nov
4-Dec
29-D
ec
23-Ja
n
17-F
eb
14-M
ar8-A
pr3-M
ay
28-M
ay
22-Ju
n17
-Jul
Time
Ave
rage
Air
Tem
pera
ture
(°C
)
1999-20002000-20012001-20022002-2003
b. Daily average temperatures.
Figure 7 (cont’d). Air freezing degree days and daily average temperatures for Delta Junction, Alaska, for four winter seasons.
4.2.2 Fort McCoy, Wisconsin
The average freezing season for the area is 117 days, with a freezing index of 608 °C-days for the winter season of 1994–1995 (Fig. 8). The area’s mean annual air temperature is 6.8 °C. The expected frost depth of this site based on modified Berggren equations was 0.7 m (2.3 ft) for the 1994–1995 winter season (Table B1).

Disturbance Measurements from Off-Road Vehicles 21
0
100
200
300
400
500
600
700
11/2/
1994
11/27
/1994
12/22
/1994
1/16/1
995
2/10/1
995
3/7/19
95
4/1/19
95
Time
AFD
D (°
C-d
ays)
Maneuver Test
a. Air freezing degree days chart.
-25-20-15
-10-505
1015
202530
8/1/19
94
8/26/1
994
9/20/1
994
10/15
/1994
11/9/
1994
12/4/
1994
12/29
/1994
1/23/1
995
2/17/1
995
3/14/1
995
4/8/19
95
5/3/19
95
5/28/1
995
6/22/1
995
Time
Ave
rage
Air
Tem
pera
ture
(°C
)
b. Daily average temperatures.
Figure 8. Graph of air freezing degree days and daily average temperature for Sparta, Wisconsin, for the 1994–1995 winter season.
22 ERDC/CRREL TR-05-12
4.3 Terrain Description—Soils
4.3.1 DTA, Alaska
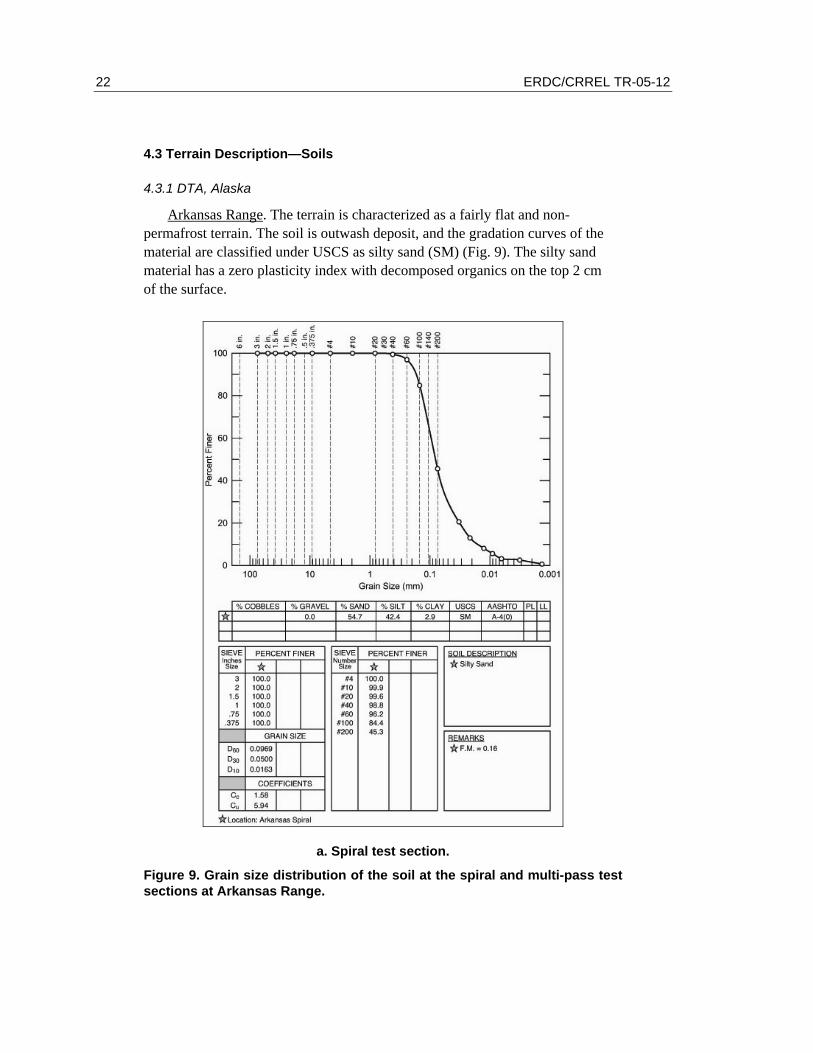
Arkansas Range. The terrain is characterized as a fairly flat and non-permafrost terrain. The soil is outwash deposit, and the gradation curves of the material are classified under USCS as silty sand (SM) (Fig. 9). The silty sand material has a zero plasticity index with decomposed organics on the top 2 cm of the surface.
a. Spiral test section.
Figure 9. Grain size distribution of the soil at the spiral and multi-pass test sections at Arkansas Range.

Disturbance Measurements from Off-Road Vehicles 23
b. Multi-pass test section.
Figure 9 (cont’d).
The vegetation is composed of grass and short bushes, and was previously mowed in the fall (Fig. 10a). Figure 10b is a map of the GPS tracks, showing the maneuver pattern overlying the ortho-photo. The thirteen-pass test section was located near the tree line, as seen on a map of the maneuver pattern (Fig. 10b). Big roots from the trees were visible on the surface in some areas. The spiral section and the easternmost portion of the multi-pass area were very wet, with surface water ponding; however, the rest of the multi-pass section was fairly dry.

24 ERDC/CRREL TR-05-12
a. Vegetation features.
b. Pattern of maneuver impact test.
Figure 10. Photo and map of terrain at Arkansas Range showing vegetation features and pattern of maneuver impact test: spiral section and multi-pass section, with arrows indicating direction of vehicle travel (May 2003).

Disturbance Measurements from Off-Road Vehicles 25
Eddy Drop Zone. This site was located on fairly flat, non-permafrost terrain. The soil is glacial outwash deposit and is classified as silty sand (SM) according to USCS. Figure 11 shows the grain size analysis of the soil at the site with zero liquid and plastic limits (non-plastic material). An organic layer ranging from 5 to 10 cm (2 to 5 in.) overlays the soil.
Figure 11. Gradation curve of the soil at Eddy Drop Zone.
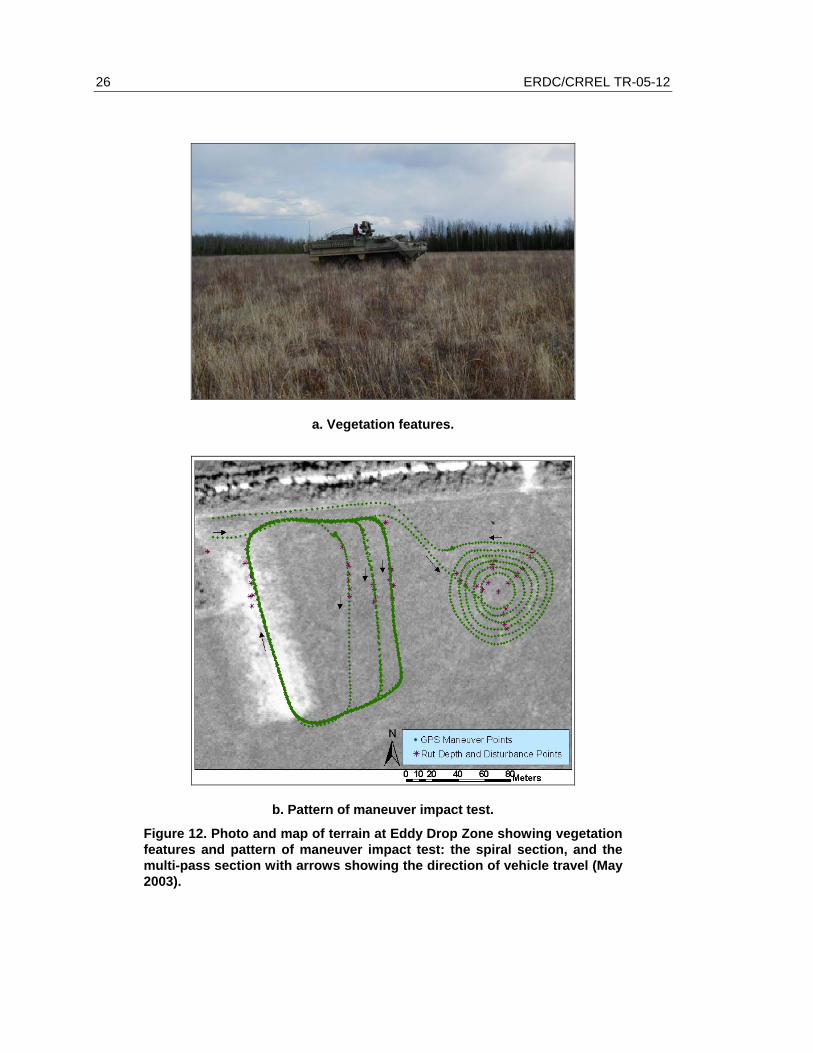
The vegetation is composed of sphagnum moss, sedge, tall grass, and thick bushes up to 1 m (3.5 ft) tall (Fig. 12a). A GIS map with the GPS points tracks maneuver pattern for the multi-pass and spiral test sections is shown over the ortho-photo in Figure 12b. (The vegetation appears as a darker gray on the map.)
26 ERDC/CRREL TR-05-12
a. Vegetation features.
b. Pattern of maneuver impact test.
Figure 12. Photo and map of terrain at Eddy Drop Zone showing vegetation features and pattern of maneuver impact test: the spiral section, and the multi-pass section with arrows showing the direction of vehicle travel (May 2003).
Disturbance Measurements from Off-Road Vehicles 27
The test area previously was mowed in 2000,* with remnant, noticeable linear undulations of the ground surface. A thick organic layer of varying depths (ap-proximately 20 cm in some areas) has overlain this dense vegetative area. The lighter area, where the thirteen-pass test was done, was disturbed several years ago. This section was leveled with a grader for helicopter landing and fueling.* The disturbed section’s vegetation is mostly tall grass with bare ground and minimal organic materials. Thaw depth in the disturbed section was up to 46 cm with a minimum thaw depth of 11.4 cm in the dense vegetation area.
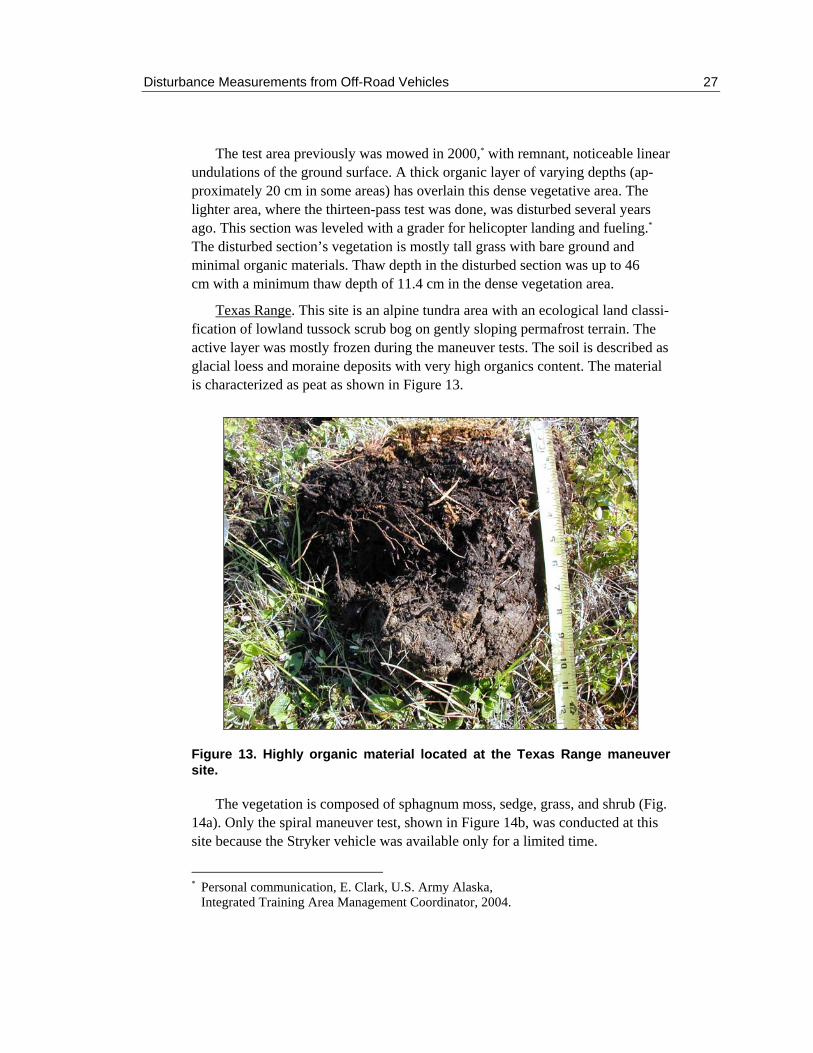
Texas Range. This site is an alpine tundra area with an ecological land classi-fication of lowland tussock scrub bog on gently sloping permafrost terrain. The active layer was mostly frozen during the maneuver tests. The soil is described as glacial loess and moraine deposits with very high organics content. The material is characterized as peat as shown in Figure 13.
Figure 13. Highly organic material located at the Texas Range maneuver site.
The vegetation is composed of sphagnum moss, sedge, grass, and shrub (Fig. 14a). Only the spiral maneuver test, shown in Figure 14b, was conducted at this site because the Stryker vehicle was available only for a limited time.
* Personal communication, E. Clark, U.S. Army Alaska, Integrated Training Area Management Coordinator, 2004.

28 ERDC/CRREL TR-05-12
a. Vegetation features.
b. Pattern of maneuver impact test.
Figure 14. Photo and map of terrain at Texas Range showing vegetation features and pattern of maneuver impact test showing the spiral section with arrows indicating the direction of vehicle travel (May 2003).

Disturbance Measurements from Off-Road Vehicles 29
4.3.2 Wooded Trail at Fort McCoy, Wisconsin
The trail consisted of a 0- to 10-cm (0- to 4-in.) vegetative/organic mat on top of a sandy soil. The particle size distribution curves of the two control sections are shown in Figure 15. The soils are classified as silty sand (SM) and poorly graded sand with silt (SP-SM) on wet and on dry test sections, respec-tively. Both of these soils have a zero plasticity index. The frost susceptibility classification of the soil varies from a very low to a very high frost-susceptible range, classified as F2 on Table 2-7 by Andersland and Ladanyi (1994). The terrain is relatively flat with a slope ranging from a 0.6 to 2.8% grade (Fig. 16). The groundwater table was close to the surface. The average gravimeter water contents on the two control sections used in this report are 15% and 22%.
a. Wet section.
Figure 15. Gradation curves for soils on control sections of wooded trail at Fort McCoy. (After Kestler et al. 1999.)

30 ERDC/CRREL TR-05-12
b. Dry section.
Figure 15 (cont’d). Gradation curves for soils on control sections of wooded trail at Fort McCoy. (After Kestler et al. 1999.)

Disturbance Measurements from Off-Road Vehicles 31
Figure 16. Control section of the wooded trail at Fort McCoy trafficked by an M60A3 in April 1995.

32 ERDC/CRREL TR-05-12
5 DATA COLLECTION
5.1 Spring Field Measurements
5.1.1 DTA, Alaska
A 20-ton Stryker vehicle (Infantry Carrier Vehicle) was used to perform maneuver impact tests in May 2003 at the Arkansas Range, Eddy Drop Zone, and Texas Range during spring breakup. It was operated using on-road tire pressures of 550 kPa (80 psi) on all eight tires. Tests consisted of spiral and multi-pass tests as shown in Figures 10b, 12b, and 14b. For the spiral test, the vehicle performed turning maneuvers by traversing from a small radius to larger radii, the idea being that the disturbance is significantly different when the vehicle is turning rather than when moving straight ahead. The multi-pass tests were composed of lanes with one, four, eight, and thirteen passes, and were intended to simulate the disturbance from multiple vehicles traveling in column formation.
A Global Positioning System (GPS) unit was mounted on the Stryker vehicle to track its position. Similar GPS units have been used by Ayers et al. (2000). The GPS unit recorded the position data of the test at one-second intervals. The GPS data were used to determine vehicle speed and turning radius.
The velocity of the vehicle is a function of the location changes over time and was derived from GPS coordinates (Ayers et al. 2000, Haugen et al. 2002). Because the vehicle position is recorded at one-second intervals, vehicle speed at a point was calculated by determining the distance to the previous point; this yields the speed in meters per second. Details to calculate the vehicle speed are described in Appendix D.
The turning radius on both the spiral and multi-pass sections was determined by using the data points from five consecutive positions (Ayers et al. 2000). Perpendicular bisects to lines connecting the first to the third, and third to the fifth data points were calculated from the coordinates of those points. The intersection of those two perpendicular bisects was determined by solving two simultaneous equations. Turning radii greater than and equal to 150 m are assigned a value of 150 m, and are considered as a straight path. Equations used to determine the vehicle turning radius are described in Appendix D.
State-of-the-ground measurements, including gravimeter water content, soil strength, and thaw depth, were conducted during the test. Soil samples were taken in the middle of the tracks after the maneuver impact tests to determine the gravimetric water content. The amount of terrain disturbance was measured

Disturbance Measurements from Off-Road Vehicles 33
at many locations along the spiral and multi-pass maneuver paths, and was characterized by rut depth, width, and percent and type of disturbance to soil and vegetation.
The soil strength was measured in the middle of the tracks using a 30° circular stainless steel cone penetrometer, with 12.83-mm (0.505-in.) diameter and 0.13-mm2 (0.2-in.2) cone base area. The cone is pushed into the soil at a uniform rate and readings are recorded at 2.54-cm (1-in.) intervals. Typically, for vehicle mobility, Cone Index (CI) is expressed by averaging the CI for layers of soil from 0 to 15 cm (0 to 6 in.) in depth and from 15 to 30 cm (6 to 12 in.) in depth. However, for strongly layered soil such as thawing soil, the CI value used is the average of thawed layer values.
Rut depth measurements were conducted one month after the maneuver impact tests to minimize additional disturbance from foot traffic, because most of the ground was very soft during testing. The effects of soil settlement, poten-tial erosion due to water flow, and slumping of soil into the ruts as a result of freeze–thaw could possibly have happened during the time between testing and measuring, but were assumed to be small relative to the total depth and thus were not considered.
Rut depth measurements along the spiral and multi-pass areas were con-ducted at three sites in June using a profilometer, which consisted of rods that slide on a metal bar. The rods were spaced every 2 cm horizontally and each rod was marked at 1-cm intervals vertically. As noted earlier, the profilometer was placed at the center of the rut and a photo of the rut depth taken and its location recorded using a handheld GPS unit. The photos were printed and lines were drawn of the natural (undisturbed) ground surface profile (the outside of the ruts) and maximum level of the rut. Rut depth is determined by counting the 1-cm intervals on the rod between the surface and rut lines as shown in Figure 3. The area of the soil displacement or deformation from the rut depth photos is com-puted using image processing software called Image Pro Plus (Fig. 5). The volumetric displacement per 1-m track length is calculated by multiplying the area of soil displaced by 100 cm of track length (units used in the analysis are cm3/m).
The impact severity measurements were taken in August (three months after the maneuver impact tests) based on impact severity and disturbance width categories (Fig. 6) along the tracks using the guidelines listed in Table 1. The cumulative impact width was computed by multiplying the disturbance width and the impact severity (in decimal form) for each track. With the time gap between testing and measuring, the cumulative impact width most likely exhibited reasonable values where the tracks, soil piles, crushed vegetation, and ruts were
34 ERDC/CRREL TR-05-12
still visible but limited vegetation rebound had occurred. Reasonable values were also likely on tracks with minimal disturbance.
The in-situ dry density and moisture content adjacent to the test sites were taken from drive cylinder samples in June 2003 as additional information. The dry densities were 1633, 1356, and 559 kg/m3 with moisture contents of 30, 39, and 157% for the Arkansas Range, Eddy DZ, and Texas Range, respectively (Table A1). As expected, these moisture contents were drier relative to those samples taken during the tests since samples were collected in the beginning of summer and the ground was able to drain.
5.1.2 Fort McCoy, Wisconsin
The wooded trail consisted of a saturated, thawing soil layer over frozen ground. The trail was trafficked with both the M60A3 and HEMTT to evaluate several stabilization methods. The M60A3 has contact pressure of 76.5 kPa. The HEMTT has four axles, two tires per axle, and was operated using both on- and off-road tire pressures. The on-road tire inflations used for the HEMTT were 413 kPa (60 psi) on the four front tires and 689 kPa (100 psi) on the four rear tires. The off-road tire inflations used during the test were 138 kPa (20 psi) on the four front tires and 689 kPa (100 psi) on the four rear tires.
Rut depth was measured using a profilometer and rod after 1, 10, 25, and 50 passes. The ground condition of two control sections was measured. Measure-ments included the thaw depth, moisture content, soil strength, and densities. The average in-situ dry density and moisture content were 1800 kg/m3 and 15.64%, respectively. The two control sections are grouped into wet and dry areas. The wet section contained an average moisture content of 22%, while the dry section had a 15% moisture content.
5.2 Winter Test
A disturbance test was conducted using the Stryker vehicle in March 2003 as shown in Figure 17. Both multi-pass and spiral tests were performed. The test was located on the southwest area of the spiral section in May at the Texas Range shown in Figure 14. Snow depth during the test was very shallow, approximately 10 cm (4 in.). Snow density was not recorded. The site had no snow cover in February and the winter was considerably mild for the area, as noted in Section 4.2.1. The ground was observed to be frozen. As stated in Section 4.3, the terrain at the Texas Range is on permafrost. However, the depth of permafrost was not determined for this test. The active layer is assumed to be frozen all the way to the permafrost.

Disturbance Measurements from Off-Road Vehicles 35
The vehicle track was not recorded because the GPS was not functioning. However, rutting was measured in June using a profilometer, and the impact severity was surveyed in August 2003.
Figure 17. Stryker disturbance test in March 2003 at the Texas Range.

36 ERDC/CRREL TR-05-12
6 ANALYSIS AND RESULTS
Table 3 presents the site description and test conditions during the trafficking to quantify terrain disturbance. As stated earlier, the winter test was conducted only at Texas Range. Data for all of the sites are summarized in Appendix A.
Rut depth was analyzed with respect to soil moisture, thaw depth, soil strength (CI), vehicle speed, turning radius, and number of passes. Results of each test are discussed in detail in Section 6.1. Measured rut depth datasets also were compared with the predictions from the semi-empirical rut depth equations. Volumetric soil displacement was also evaluated.
Table 3. Test site locations, terrain description, and conditions during trafficking. Alaska
Test sites Arkansas Range Eddy Drop Zone Texas Range
Fort McCoy, Wisconsin
Terrain description Flat, non permafrost Flat, non permafrost
Gently sloping,
permafrost Gently sloping,
seasonal frost area
Vegetation Grass and short bushes
Sphagnum moss,
sedge, tall grass, and
thick bushes
Tall grass with bare ground
Sphagnum moss, sedge,
and shrub
Wooded trail with grass
and organic mat
Soil type Silty sand (SM)
Silty sand (SM) with thick organic layer in dense
vegetative area Peat,
organics Silty sand
(SM)
Poorly graded
sand with silt
(SP-SM)
Vehicle used Stryker Stryker Stryker M60A3, HEMTT
Test sections Wet Dry Dense
vegetation Sparse
vegetation Wet Dry
Avg. water
content (%) 49.3 33.9 94.5 36.2 315.7 21.8 15.3
Spring thaw
conditions
Avg. thaw depth (cm) 28.8 23.4 14.5 44.5 7.6 16.0 31.2
Winter conditions
Snow depth (cm) — — — — 10.0 — —
Disturbance Measurements from Off-Road Vehicles 37
6.1 Rut Depth Measurements
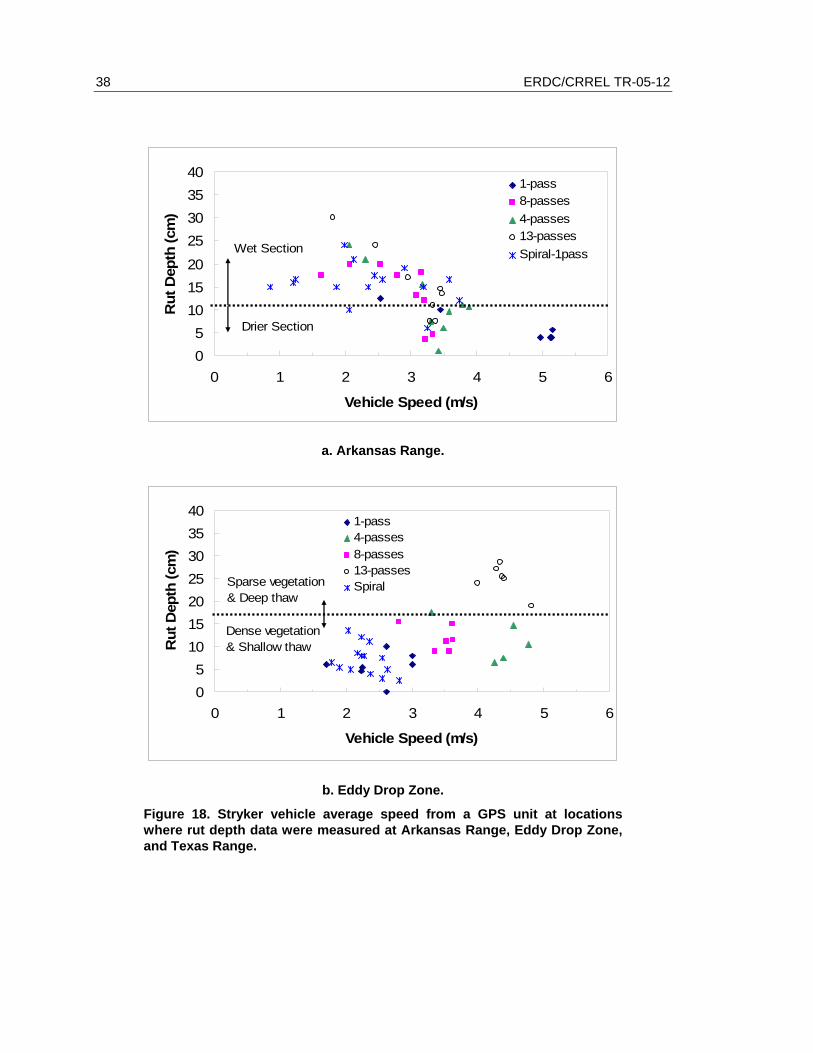
Overall vehicle speed during the maneuver tests ranged from 1 to 5 m/s (2.2 to 11.2 mph) (Fig. 18). This was considered low speed, as the vehicle is designed for moving cross-country at 18 m/s (40 mph). Generally, the results showed that the vehicle speed variation in these ranges did not influence the disturbance on the terrain (Fig. 18).
The spiral section at the Arkansas Range was considerably wet. In particular, the easternmost portion of the multi-pass section had visible water ponding. The wet section displayed higher rut depth than the drier section at Arkansas Range, as shown in Figure 18a. However, two-thirds of the multi-pass section was fairly dry. Moisture content ranged from 26% in the dry portion of the multi-pass section to 58.5% in the spiral section. Thaw depth in the spiral section was approximately 30.5–33.0 cm (12–13 in.). In the multi-pass section, ruts were deeper in the easternmost portion, the very wet part, where the average rut depth was 24 cm (Fig. 19a). As expected, in the dryer parts of the multi-pass section, the ruts were as shallow as 1 cm, as shown in the summary table (Table A1).
The rut depth measurement averages of right and left wheel paths on the previously disturbed section with sparse vegetation at Eddy Drop Zone, which hosted the thirteen-pass lane, ranged from 19 to 36.5 cm (7.5 to 14 in.) where the maximum thaw depth of the area was 45.7 cm (18 in.) as summarized in Table A2. The speed was significantly lower in the spiral and one-pass section than in the thirteen-pass section at Eddy Drop Zone (Fig. 18b). However, rutting in the spiral and single pass lanes did not exceed 14 cm (5.5 in.) where thaw depth was shallower (up to 20 cm) (Fig. 19b). Moisture content ranged from 30.5 to 42% on the disturbed section where the thirteen-pass test was located, while the rest of the test section at this site had a moisture content of up to 133.4%. Also, the dense vegetation in this area certainly helped minimize the rutting.
The speeds along the spiral section at Texas Range were variable (Fig. 18c). This test section had very shallow thaw depths, ranging from 7.6 to 10 cm (3–4 in.); thus, the rutting disturbance to vegetation was minimal in comparison (Fig. 18c). The disturbance was mostly exhibited as imprints from the tire track, where the vegetation was compressed to the ground with minimal shear or vegetation removal and bare ground. The soil samples that were taken at this site contained ice lenses, and the moisture content was up to 356.7%.
38 ERDC/CRREL TR-05-12
05
101520
25303540
0 1 2 3 4 5 6
Vehicle Speed (m/s)
1-pass8-passes4-passes13-passesSpiral-1passWet Section
Drier Section
Rut
Dep
th (c
m)
a. Arkansas Range.
05
10152025303540
0 1 2 3 4 5 6
Vehicle Speed (m/s)
1-pass4-passes8-passes13-passesSpiral
Dense vegetation & Shallow thaw
Sparse vegetation& Deep thaw
Rut
Dep
th (c
m)
b. Eddy Drop Zone.
Figure 18. Stryker vehicle average speed from a GPS unit at locations where rut depth data were measured at Arkansas Range, Eddy Drop Zone, and Texas Range.

Disturbance Measurements from Off-Road Vehicles 39
0
5
10
15
0 1 2 3 4 5 6
Vehicle Speed (m/s)
Spiral
Rut
Dep
th (c
m)
c. Texas Range.
Figure 18 (cont’d).
05
10152025303540
20 30 40 50 60 70
Moisture Content (%)
1-pass8-passes4-passes13-passesSpiral-1pass
Rut
Dep
th (c
m)
Wet Section
Drier Section
a. Arkansas Range.
Figure 19. Gravimeter water content versus rut depth at Arkansas Range and Eddy Drop Zone.

40 ERDC/CRREL TR-05-12
05
10
15202530
3540
20 40 60 80 100 120 140
Moisture Content (%)
1-pass4-passes8-passes13-passesSpiral
Dense vegetation& Shallow thaw
Sparse vegetation,drier soil, & deep thaw
Rut
Dep
th (c
m)
b. Eddy Drop Zone.
Figure 19 (cont’d). Gravimeter water content versus rut depth at Arkansas Range and Eddy Drop Zone.
The measured rut depths on spiral sections, single pass, and multi-passes at three sites are plotted against the thaw depth, and the result exhibited a linear correlation (Fig. 20). Rut depth is expected to be at least 58% of the thaw depth and possibly equal to the thaw depth for saturated thawing terrain. However, a couple of data points at the Eddy Drop Zone indicated inconsistency.
The typical rut profile of deep ruts on the straight sections at the Arkansas Range and Eddy Drop Zone comprised a symmetrical deformation showing exposed soil in the center of the tire track, with steep sidewall and capped lip of displaced soil and vegetation raised 10 cm or more above the adjacent uncom-pacted soil. Ruts on turns often exhibited one lip (outer side) higher, with a bigger quantity of displaced soil and vegetation next to the adjacent undisturbed soil, than the other lip. The profile of the shallow ruts, such as in the case at the Texas Range and spiral section at the Eddy Drop Zone, with deeper organic layer and dense vegetation, was mainly compression to the thawed layer with a small sidewall and often no distinct lip. Selected photos of rut profiles at each site at DTA are shown in Figures A1–A9.
Disturbance Measurements from Off-Road Vehicles 41
y = 0.5878xR2 = 0.7088
0
5
10
15
20
25
30
35
40
0 10 20 30 40 50
Thaw Depth (cm)
Rut
Dep
th (c
m)
Arkansas RangeEddy DZTexas Range
Figure 20. Relationship between average rut depth and thaw depth for all three sites at DTA.
The two control locations along the wooded trail at Fort McCoy are cate-gorized into wet and dry sections. Figure 21 shows relationships between rut depth and number of passes. The results demonstrate a significant increase in rut depth as the number of passes increase. The dry section exhibited relatively shallower rutting than the wet area for both M60A3 and HEMTT.
6.2 Rut Depth Model Comparison
The rut depth was calculated using the semi-empirical rut depth equation (eq 1) for 20, and 50% slip. Slip greater than 50% can occur during vehicle maneuvering in thawing terrain. The actual rut depth measurements are plotted with the calculated rut depth values (eq 1). The calculations use the measured soil strengths of the thawed layer shown in Figure 22. The actual rut depth measure-ments show a significant variability, especially for the Arkansas Range. Figure 22 shows that the calculated values significantly underpredict the actual measured rut depths at high CI values.

42 ERDC/CRREL TR-05-12
0
20
40
60
80
1 10 25 50
Rut
Dep
th (c
m) Dry Area
Wet Area
Vehicle clearance
a. Number of passes for M60A3.
0
20
40
60
80
1 10 25 50
Rut
Dep
th (c
m) Dry Area
Wet Area
Vehicle clearance
b. Number of passes for HEMTT.
Figure 21. Number of passes and rut depth relationships on the dry and wet sections of the wooded trail.

Disturbance Measurements from Off-Road Vehicles 43
0
5
10
15
0 50 100 150 200 250Cone Index
Rut
Dep
th (i
n)
1-pass4-passes8-passes13-passesSpiral-1pass
1-pass, 20%
1-pass, 50%
13-passes, 50%
13-passes, 20%
a. Arkansas Range.
0
5
10
15
0 50 100 150Cone Index
Rut
Dep
th (i
n)
1.pass4-passes8-passes13-passes
1-pass, 20%
1-pass, 50%
13-passes, 20%
13-passes, 50%
b. Eddy Drop Zone.
Figure 22. Comparison of measured rut depth to predicted rut depth using eq 1 for two values of wheel slip at Arkansas Range and Eddy Drop Zone.
The cone index (CI) was measured on the control sections at Fort McCoy with a value of 25 for 0- to 15-cm (0 to 6 in.) layer. The CI of 75 was measured on the wet section at depth of 15 cm (6 in.); on the dry section, the CI was measured to have a value of 98 at 16.5 cm (6.5 in.) from the surface. These CI values were used to calculate the estimated rut depths for the M60A3 and HEMTT vehicles. The comparison between the actual measurements and esti-mated rut depth are shown in Figure 23. It was observed that the wet section

44 ERDC/CRREL TR-05-12
became impassable after 15 passes of the HEMTT as a result of rut depths exceeding the vehicle ground clearance (Kestler et al. 1999).
6.3 Volumetric Soil Displacement
The volume of the soil being displaced by the vehicle was computed based on the enclosed rut area within 1 m of the track length. The volumetric soil displacement is an average of the volume of soil displaced for left and right wheel paths. This analysis was calculated only for the Stryker data at DTA because these were the only data with comprehensive photos of rut depth from the profilometer measurements.
0
5
10
15
20
25
0 50 100 150 200Cone Index (psi)
Rut
Dep
th (i
n
Measured 1-pass, M60A3Measured 1-pass, HEMTTMeasured 10-passes, M60A3Measured 10-passes, HEMTTPredicted, 1-pass, M60A3Predidted, 1-pass HEMTT, 20% slippredicted, 10-passes, M60A3predicted, 10-passes HEMTT, 20% slip
Rut
Dep
th (i
n.)
Figure 23. Comparison of measured rut depth to predicted rut depth using eq 1 and 2 on both control sections of the wooded trail.
The soil displacement showed an increase in volume as the number of passes increased, as shown in Figure 24. Note that turning radii of 150 m are assigned on the straight section of the multi-pass. At Arkansas Range the analysis was conducted only on the wet section since the disturbance was more significant there than on the drier section. The volumetric soil displacement on the one-pass and spiral sections is combined with a gradual increase as the turning radius decreases. The soil displacement for thirteen passes is three times more in volume than on the one-pass section, with a considerable increase as the turning radius decreases (Fig. 24a). Similarly, the volumetric soil displacement for thirteen passes at Eddy Drop Zone is fivefold higher than one pass on the straight

Disturbance Measurements from Off-Road Vehicles 45
section of the multi-pass section (Fig. 24b). The increase in soil displacement as the turning radius decreases is due to the wider track that is created, since the second, third, and fourth tires do not follow the first tire track.
0
500
1000
1500
2000
2500
3000
0 25 50 75 100 125 150
Turning Radius (m)
Soil
Dis
plac
ed, x
102 (c
m3 /m
) 1-pass4-passes8-passes13-passesSpiral-1passLog. (1-pass)Log. (4-passes)Log. (13-passes)
a. Arkansas Range.
0
500
1000
1500
2000
2500
3000
0 25 50 75 100 125 150
Turning Radius (m)
Soil
Dis
plac
ed, x
102
(cm
3 /m) 1-pass
4-passes8-passes13-passesSpiralLog. (Spiral & 1-pass)Log. (4-passes)Log. (8-passes)Log. (13-passes)
b. Eddy Drop Zone.
Figure 24. Stryker vehicle turning radius versus average volumetric soil displacement for the wet section at Arkansas Range and Eddy Drop Zone.

46 ERDC/CRREL TR-05-12
Compiling the correlations between the volume of soil displaced and turning radius for Eddy DZ and Arkansas Range sites exhibited a series of relationships (Table 4). These relationships are derived from ranges of soil and vegetation conditions as a function of number of vehicle passes.
Table 4. Relationships derived between volume of soil displaced along the track and turning radius.
Maneuver Tracks Test conditions Locations
Correlations, where y = vol. of soil displaced, 102 (cm3/m)
x = turning radius (m) R2
values Spiral and
1 pass Dense vegetation Eddy DZ y = –82.35 ln x + 566.45 0.2436 1 pass Wet area Arkansas y = –134.98 ln x + 856.88 0.9690
Dense vegetation Eddy DZ y = –115.23 ln x + 849.20 0.5292 4 passes Wet area Arkansas y = –213.88 ln x + 1379.30 0.6133 8 passes Dense vegetation Eddy DZ y = –282.30 ln x + 1763.10 0.9217
Sparse vegetation Eddy DZ y = –359.21 ln x + 2759.70 0.8943 13 passes Wet area Arkansas y = –654.70 ln x + 3827.90 0.9672
Correlations between soil displacement and rut depth are shown in Figure 25 for all DTA sites. The results showed a significant increase in volumetric soil displacement with increasing rut depth, indicating that the material was increas-ingly being moved rather than compressed. The deformation is due to plastic flow, which consisted of both compaction and shear of wet, thawed soil.
6.4 Cumulative Impact Width
The cumulative impact width was calculated only for the spiral and single pass sections of the multi-pass maneuver tests. Because the cumulative impact width accounts for only one tire track, the disturbance used in this analysis is for the outside tire track only (Fig. 26). Texas Range had significantly less cumula-tive impact width than Arkansas Range and Eddy Drop Zone (Fig. 26). This was attributable to shallow thaw at Texas Range, while Arkansas Range and Eddy Drop Zone had deeper thaw. The cumulative impact width trend for Texas Range appears to have a linear relationship to the turning radius (Fig. 26). In general, the cumulative impact width showed less on straight sections and higher as the vehicle is turning. This is due to the higher force required for the vehicle to turn, and generating larger shearing effect on to the thawed, soft soil.

Disturbance Measurements from Off-Road Vehicles 47
y = 0.6522x2 + 28.236xR2 = 0.7676
0
500
1000
1500
2000
2500
3000
0 10 20 30 40 Rut Depth (cm)
ArkansasEddy DZTexas Range
Soil
Dis
plac
ed, x
10 2 (c
m 3 /m
)
)
Figure 25. Rut depth versus average volumetric soil displacement at Arkan-sas Range, Eddy Drop Zone, and Texas Range.
0
20
40
60
80
0 50 100 150Turning Radius, m
Cum
ulat
ive
Impa
ct W
itdh,
cm
Arkansas Range, rwEddy DZ, rwTexas Range, lwLog. (Arkansas Range, rw)Log. (Eddy DZ, rw)Linear (Texas Range, lw)
Figure 26. Stryker vehicle turning radius and cumulative impact width rela-tionships for the outside tracks for Alaska sites (single pass and spiral only). Arkansas Range and Eddy Drop Zone are considered deep thaw; Texas Range has a shallow thaw depth.
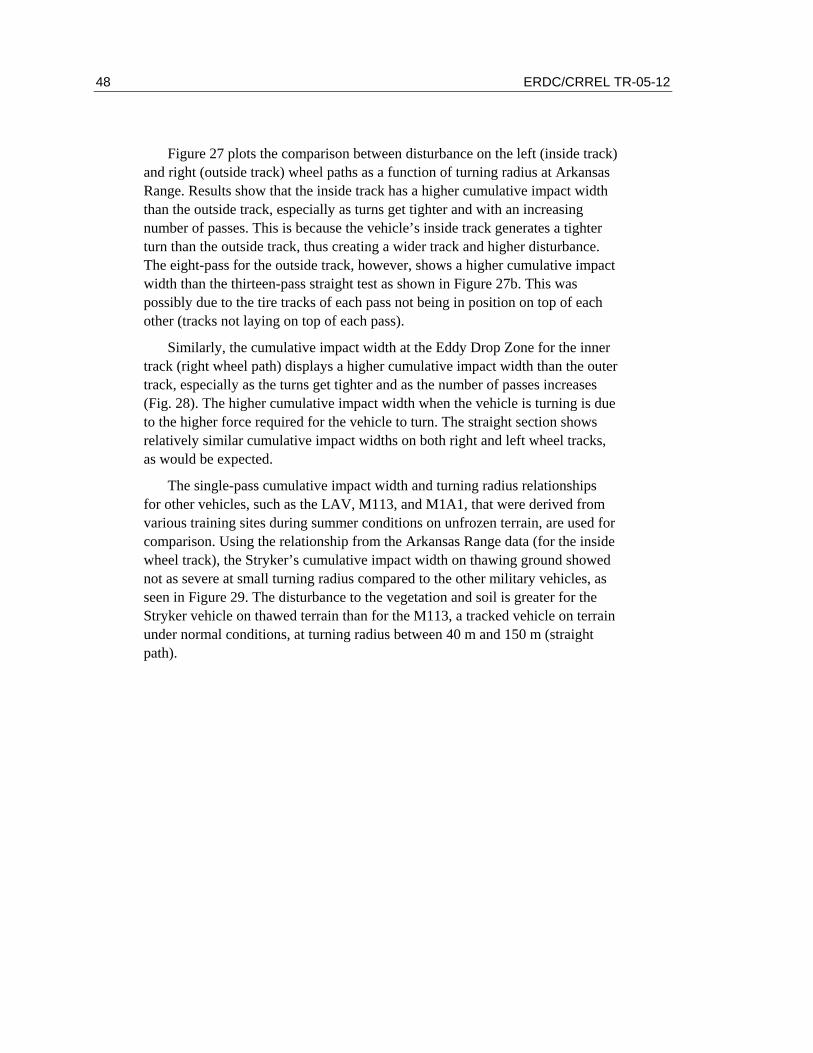
48 ERDC/CRREL TR-05-12
Figure 27 plots the comparison between disturbance on the left (inside track) and right (outside track) wheel paths as a function of turning radius at Arkansas Range. Results show that the inside track has a higher cumulative impact width than the outside track, especially as turns get tighter and with an increasing number of passes. This is because the vehicle’s inside track generates a tighter turn than the outside track, thus creating a wider track and higher disturbance. The eight-pass for the outside track, however, shows a higher cumulative impact width than the thirteen-pass straight test as shown in Figure 27b. This was possibly due to the tire tracks of each pass not being in position on top of each other (tracks not laying on top of each pass).
Similarly, the cumulative impact width at the Eddy Drop Zone for the inner track (right wheel path) displays a higher cumulative impact width than the outer track, especially as the turns get tighter and as the number of passes increases (Fig. 28). The higher cumulative impact width when the vehicle is turning is due to the higher force required for the vehicle to turn. The straight section shows relatively similar cumulative impact widths on both right and left wheel tracks, as would be expected.
The single-pass cumulative impact width and turning radius relationships for other vehicles, such as the LAV, M113, and M1A1, that were derived from various training sites during summer conditions on unfrozen terrain, are used for comparison. Using the relationship from the Arkansas Range data (for the inside wheel track), the Stryker’s cumulative impact width on thawing ground showed not as severe at small turning radius compared to the other military vehicles, as seen in Figure 29. The disturbance to the vegetation and soil is greater for the Stryker vehicle on thawed terrain than for the M113, a tracked vehicle on terrain under normal conditions, at turning radius between 40 m and 150 m (straight path).

Disturbance Measurements from Off-Road Vehicles 49
0
20
40
60
80
100
120
0 25 50 75 100 125 150Turning Radius, m
Cum
ulat
ive
Impa
ct W
itdh,
cm
Arkansas Range,1-passArkansas Range, 4-passesArkansas Range, 8-passesArkansas Range, 13-passesLog. (Arkansas Range,1-pass)Log. (Arkansas Range, 4-passes)Log. (Arkansas Range, 8-passes)Log. (Arkansas Range, 13-passes)
a. Inside track.
0
20
40
60
80
100
120
0 25 50 75 100 125 150Turning Radius, m
Cum
ulat
ive
Impa
ct W
itdh,
cm
Arkansas Range, spiralArkansas Range, 4-passesArkansas Range, 8-passesArkansas Range, 13-passesLog. (Arkansas Range, spiral)Log. (Arkansas Range, 4-passes)Log. (Arkansas Range, 8-passes)Log. (Arkansas Range, 13-passes)
b. Outside track.
Figure 27. Turning radius and cumulative impact width of single and multi-pass tests at Arkansas Range.
50 ERDC/CRREL TR-05-12
0
40
80
120
160
200
0 25 50 75 100 125 150Turning Radius, m
Cum
ulat
ive
Impa
ct W
itdh,
cm
Eddy DZ, 1-passEddy DZ, 4-passesEddy DZ, 8-passesEddy DZ, 13-passesLog. (Eddy DZ, 1-pass)Log. (Eddy DZ, 4-passes)Log. (Eddy DZ, 8-passes)Log. (Eddy DZ, 13-passes)
a. Inside track.
0
40
80
120
160
200
0 25 50 75 100 125 150Turning Radius, m
Cum
ulat
ive
Impa
ct W
itdh,
cm
Eddy DZ, 1-passEddy DZ, 4-passesEddy DZ, 8-passesEddy DZ, 13-passesLog. (Eddy DZ, 1-pass)Log. (Eddy DZ, 4-passes)Log. (Eddy DZ, 8-passes)Log. (Eddy DZ, 13-passes)
b. Outside track.
Figure 28. Right and left wheel plots of turning radius versus cumulative impact width for single and multi-pass runs at Eddy Drop Zone.

Disturbance Measurements from Off-Road Vehicles 51
160
200
120
80
40
0
Cum
ulat
ive
Impa
ct W
idth
(cm
)
0 20 40 60 80 100 120 140Turning Radius (m)
M1A1M1A1
M113M113
LAVLAV STRYKER
160
200
120
80
40
0
Cum
ulat
ive
Impa
ct W
idth
(cm
)
0 20 40 60 80 100 120 140Turning Radius (m)
M1A1M1A1
M113M113
LAVLAV
160
200
120
80
40
0
Cum
ulat
ive
Impa
ct W
idth
(cm
)
0 20 40 60 80 100 120 140Turning Radius (m)
M1A1M1A1
M113M113
LAVLAV STRYKER
Figure 29. Comparison of cumulative impact width versus turning radius for various military vehicles for single pass. LAV, M113, and M1A1 data were collected from other military lands during the summer season (Ayers et al. 2000, Haugen 2002, Haugen et al. 2002).
6.5 Disturbance on Winter Terrain
There were no measurable ruts at both the multi-pass and spiral section during the winter disturbance test. Figure 30 is a rut profile at the thirteen-pass section of the multi-pass section. The impact severity of 10% resulted from the survey showing the track imprint with vegetation roots still intact, laying down of vegetation, and few broken branches.

52 ERDC/CRREL TR-05-12
Figure 30. Minor vegetation disturbance and no measurable rut depth resulted from the winter disturbance test.
Disturbance Measurements from Off-Road Vehicles 53
7 DISCUSSION
In general, the ruts that resulted from the Stryker test depended on how deep the thaw was in the area. In some areas, rut depth was the same as thaw depth, while in other areas, rut depth was less than thaw depth. Rut depth was limited when thaw depth was shallow, as seen at Texas Range. Rut depth was deeper in wet areas, such as wet sections of the spiral and multi-pass at Arkansas Range, and wet control section on the wooded trail at Fort McCoy. Rut depths also were severe in areas with sparse vegetation at Eddy Drop Zone. The dense vegetative area at Eddy Drop Zone showed relatively less rutting than the sparse vegetation that was previous disturbed, indicating the additional flotation provided by the vegetation.
Rut depth increased as the number of vehicle passes increased, as observed at Arkansas Range, Eddy Drop Zone, and control sections at Fort McCoy. As rut depth increased, the volumetric soil displacement also increased, resulting in a polynomial relationship from the Stryker ruts at DTA. The volumetric soil displacement increased considerably as the number of passes increased on straight paths and was significantly higher on tighter turns. As the turning radius decreased, a gradual increase was observed in the volumetric soil displacement on the one-pass and spiral sections. A more drastic increase in the volumetric soil displacement with increasing number of vehicle passes was observed as the turning radius decreased. The results also show that the disturbance was more severe on turns than on straight sections.
No correlation was found between moisture content and rut depth. Similarly, there was no correlation found between rut depth and speed. The Stryker’s speed was considered to be low.
CI values from the 12.83-mm- (0.505-in.-) diameter cone are found to be noticeably variable, and are quite high for the thawed layer. The variability could be attributed to nonhomogenous soil and vegetation conditions. Rut depth esti-mation of semi-empirical equations showed underpredicting of the measured rut depth at high CI values. The CI values used in the equations were measured from the thawed layer. These equations, however, were developed on soft soil with no layering effects such as frost depth, and no vegetative cover.
The disturbance to the terrain was minimal (tire imprint with vegetation still intact) when the ground was totally frozen, such as the case for Texas Range. Severe disturbances occurred in locations during thaw, including deep ruts, piles, and clumps of dirt piled on the side of the ruts.

54 ERDC/CRREL TR-05-12
For the most part, the Stryker vehicle showed a vehicle impact profile similar to the other military vehicles. The disturbance to the vegetation and soil for the Stryker vehicle on thawed soil is within the range or even higher than the M113, although the vehicle impact relationships for the M1A1, M113, and LAV were derived from tests on terrain with no influence of freezing and thawing condi-tions. However, the Stryker vehicle impact is minimal for shallow thaw and within the trend of LAV, the Stryker predecessor. The terrain disturbance from the off-road vehicle operations varies from site to site depending on the ground conditions.
Minimal vegetation disturbance and no rutting were observed in winter when the ground was frozen, even with limited snow cover. This area could have severe rutting and vegetation disturbance if the test is conducted during spring thaw and would have detrimental consequences to the permafrost.

Disturbance Measurements from Off-Road Vehicles 55
8 CONCLUSION
Rutting and disturbance from off-road vehicles can be quantified using rut depth, impact severity, and volumetric soil displacement. It is important to note that rut depth is not equal to impact severity. Rut depth is a measure of the terrain deformation by the vehicle tire, while the impact severity is the physical distur-bance, which is related to vegetation damage and underlying soil exposure caused by the vehicle traffic.
It is essential to understand that findings from the studies during the spring thaw season are for the worst-case scenario when terrain is trafficked using large and heavy military vehicles. The following findings can be concluded from this study:
a. Rut depth and cumulative impact width are minimal when thaw depth is shallow. Off-road vehicles can traverse when thaw depth is less than 6 cm with minimal disturbance and limited ecologi-cal consequences. The underlying frozen layer helps minimize the disturbance and helps support the vehicle load.
b. The deformation of the loose, weak, thawing layer is largely plastic, consisting of both compaction and shear, which cor-responds to severe rutting on saturated soils and with deeper thaw. Vehicles should not be allowed to traverse on the terrain during these conditions. It may be necessary to monitor terrain conditions before conducting any off-road vehicle traffic.
c. Rut depth, volumetric soil displacement, and cumulative impact width are relatively moderate on areas with dense vegetation (short bushes) and when thaw depth is shallow. During wet soil conditions, vehicular traffic should avoid areas that were pre-viously disturbed, because the vegetation is damaged and may not provide adequate support.
d. It is expected that rut depth and volumetric soil displacement increase with increasing number of vehicle passes. Because the soil bearing capacity is insufficient when spring thaw occurs as a result of its saturated condition, repetitive loading should be avoided.
e. Disturbance in terms of volumetric soil displacement and cumulative impact width are significantly higher when vehicles are performing turning maneuvers than on a straight path. The

56 ERDC/CRREL TR-05-12
vehicle requires higher tractive force in order to turn. Vehicle impact to the soil and vegetation was relatively higher on the inside track than on the outside track when the vehicle was turning. Vehicles with more than two axles, such as the Stryker and HEMTT, will create a wider track because the second, third, and fourth tires do not follow the first tire track, especially on tighter turns.
f. Cumulative impact width and turning radius relationship for the Stryker vehicle showed a pattern similar to other military vehicles. The relationship can be used as a baseline for addi-tional measurements for summer or dry conditions.
g. Estimation of rut depth using the semi-empirical equations underpredicted the measured rut depth under thawing and saturated conditions. The semi-empirical rut depth equations can predict a single-pass rut depth under normal soil conditions.
h. The frozen ground occurring in winter allows vehicles to utilize permafrost terrain and wet areas that are not maneuverable in summer. Off-road operations, especially military exercises, can be maximized in winter in order to limit the disturbance to soil and vegetation.

Disturbance Measurements from Off-Road Vehicles 57
9 RECOMMENDATIONS
Recovery study on the vegetation and healing of soil (ground) due to freeze–thaw action should be evaluated. This is important for development of planning strategy (timing or rotation) of training lands in order to maximize the capacity but limit the disturbance consequences.
In the literature review, there was no topic being discussed or studied on disturbance and rutting of off-road vehicles due to high speed, including acceleration. One can expect that the disturbance is severe when a vehicle is traversing on soft soil terrain at high speed. Fast acceleration could shear off vegetation and displace large amounts of soil, creating a severe impact on the terrain. Recommendation on these topics in future should include research impact studies.
GIS applications and GPS units to track off-road vehicle disturbance have been used recently on several research studies. These tools are helpful for quan-tifying the impact of off-road vehicles, and observation on terrain recovery assessment can be easily surveyed. Aerial photos also can be used to observe terrain disturbance from off-road vehicles.
Limited studies have been conducted on the influence of vegetation as an additional bearing strength of the ground (soil) to support the vehicle load, thus minimizing the disturbance. The strength of vegetation layer such as the root systems and vegetation mat can be difficult to quantify. It would be helpful to determine the tensile and compression strengths of various vegetation types and layer thickness.
58 ERDC/CRREL TR-05-12
10 REFERENCES
Abele, G., D.A. Walker, J. Brown, M.C. Brewer, and D.M. Atwood (1978) Effects of low ground pressure vehicle traffic on tundra at Lonely, Alaska. U.S. Army Cold Regions Research and Engineering Laboratory, Hanover, New Hampshire, Special Report 78-16.
Abele, G., J. Brown, and M.C. Brewer (1984) Long-term effects of off-road vehicle traffic on tundra terrain. Journal of Terramechanics, Volume 21, No. 3, p. 283–294.
Affleck, R.T., S. Shoop, K. Simmons, and P. Ayers (2004a) Disturbance from off-road vehicle during spring thaw. In Proceedings, 12th American Society of Civil Engineers, International Winter Construction Symposium and Expo on Cold Regions Engineering, Alberta, Canada, 16–19 May 2004.
Affleck, R.T., S. Shoop, G. Larsen, E. Clark, C. Collins, and J. Reagan (2004b) Stryker terrain impact tests at Donnelly Training Area, Integrated Training Area Management (ITAM), Issue 23, March 2004.
Aitken, G.W. (1964) Ground temperature observations: Big Delta, Alaska. U.S. Army Cold Regions Research and Engineering Laboratory, Hanover, New Hampshire, CRREL Technical Report 104.
Andersland, O.B., and B. Ladanyi (1994) An Introduction to Frozen Ground Engineering. New York: Chapman and Hall.
ASAE Standard S313.3 (1999) Soil cone penetrometer.
Aust, W.M., M.D. Tippett, J.A. Burger, and W.H. McKee (1995) Compaction and rutting during harvesting affect better drained soils more than poorly drained soils on wet pine flats. Southern Journal of Applied Forestry, Volume 19, Num-ber 2, p. 72–77, May 1995.
Ayers, P. (1994) Environmental damage from tracked vehicles operations. Journal of Terramechanics, 14(3): 173–183.
Ayers, P., M. Vance, L. Haugen, and A.B. Anderson (2000) An evaluation of DGPS-based continuously operating vehicle monitoring systems to determine site-specific event severity factors. U.S. Army Engineer Research and Develop-ment Center, Construction Engineering Research Laboratory, Champaign, Illinois, ERDC/CERL Technical Report TR-00-43.
Braunack, M. (1986a) Changes in physical properties of two dry soils during tracked vehicle passage. Journal of Terramechanics, 23(3): 141–151.

Disturbance Measurements from Off-Road Vehicles 59
Braunack, M. (1986b) The residual effects of tracked vehicles on soil surface properties. Journal of Terramechanics, 23(1): 37–50.
Emers, M., J.C. Jorgenson, and M.K. Raynolds (1995) Response of arctic tundra plant communities to winter vehicle disturbance. Canadian Journal of Botany, 73: 905–917.
Everett, K.R., B.M. Murray, D.F. Murray, A.W. Johnson, A.E. Linkins, and P.J. Webber (1985) Reconnaissance observations of long-term natural vegeta-tion recovery in the Cape Thompson region, Alaska, and additions to the check-list of flora. U.S. Army Cold Regions Research and Engineering Laboratory, Hanover, New Hampshire, CRREL Report 85-11.
Gatto, L.W. (2002) Sediment dynamics in vehicle ruts. In Proceedings of 12th International Soil Conservation Organization (ISCO), Volume 2, p. 393–399.
Gersper, P.L, and J.L. Challinor (1975) Vehicle perturbation effects upon a tundra soil-plant system: I. Effects on morphological and physical environmental properties of the soils. Soil Science Society of America Proceedings, 39, p. 737–744.
Halvorson, J.J., D.K. McCool, L.G. King, and L.W. Gatto (2001) Soil compaction and over-winter changes to tracked-vehicle ruts, Yakima Training Center, Washington. Journal of Terramechanics, Volume 38, p. 133–151.
Haugen, L. (2002) Design and testing of a vehicle tracking system for moni-toring environmental impact at U.S. Army Training Installations. MS thesis, Colorado State University, Fort Collins, Colorado.
Haugen, L.B., P.D. Ayers, A.B. Anderson, and P.E. Nissen (2002) Using GPS to evaluate movement patterns and impacts during training maneuvers. In Pro-ceedings of the 14th International Society for Terrain-Vehicle Systems (ISTVS), Vicksburg, Mississippi.
Hok, J. (1969) A reconnaissance of tractor trails and related phenomena on the north slope of Alaska. Bureau of Land Management, U.S. Department of Interior, Anchorage, Alaska, p. 66.
Jorgenson, M.T., J.E. Roth, E.R. Pullman, C.T. Schick, B.A. Anderson, S.F. Schlentner, A.G. Palmer, J.H. Boisvert (2004) An ecological land evaluation for Fort Richardson, Alaska: Trafficability, disturbance, and habitat use. Prepared by ABR, Inc., for U.S. Army Alaska, Directorate of Public Works.
60 ERDC/CRREL TR-05-12
Kestler, M.A., S.A. Shoop, K.S. Henry, J.A. Stark, and R.T. Affleck (1999) Rapid stabilization of thawing soils for enhanced vehicle mobility: A field demonstration project. U.S. Army Cold Regions Research and Engineering Laboratory, Hanover, New Hampshire, CRREL Report 99-3.
Lawson, D.E. (1982) Long-term modifications of perennially frozen sediment and terrain at East Oumalik, northern Alaska. U.S. Army Cold Regions Research and Engineering Laboratory, Hanover, New Hampshire, CRREL Report 82-36.
Nugent, C., C. Kanali, P.M.O. Owende, M. Nieuwenhuis, and S. Ward (2003) Characteristic site disturbance due to harvesting and extraction machinery traffic on sensitive forest sites with peat soils. Forest Ecology and Management, Volume 180, p. 85–98.
Racine, C.H., and G.M. Ahlstrand (1985) Thaw response of tussock-shrub tundra to experimental all-terrain vehicle disturbance in South-Central Alaska, Arctic, Volume 44, Number 1, p. 31–37.
Richmond, P., S. Shoop, and G. Blaisdell (1995) Cold Regions Mobility Models. U.S. Army Cold Regions Research and Engineering Laboratory, Hanover, New Hampshire, CRREL Report 95-1.
Shoop, S.A. (1993) Effect of soil thaw on off-road vehicle traction. In Pro-ceedings, 6th International Conference on Permafrost, Beijing, China, 5–9 July 1993, Volume 1, p. 559–563.
Shoop, S., R. Affleck, C. Collins, and G. Larsen (2004a) Stryker brigade transformation impact on Alaska training lands. In Proceedings, Sustainable Range Management Conference, New Orleans, Louisiana, January 2004.
Shoop, S., R. Affleck, C. Collins, G. Larsen, and P. Sullivan (2004b) Maneuver analysis methodology to assess vehicle impacts on training lands. American Society of Agronomy Special Symposium on Assessing the Impact of Vehicular Traffic on Natural Areas, Denver, Colorado, November 2003, submitted as a Special Issue of the Journal of Terramechanics.
Slaughter, C.W., C.H. Racine, D.A. Walker, L.A. Johnson, and G. Abele (1990) Use of off-road vehicles and mitigation of effects of Alaska permafrost environments: A review. Environmental Management, Volume 14, p. 63–72.
Sparrow, S.D., F.J. Wooding, and E.H Whiting (1978) Effects of off-road vehicle traffic on soils and vegetation in the Denali Highway Region of Alaska. Journal of Soil and Water Conservation, 33, p. 20–27.

Disturbance Measurements from Off-Road Vehicles 61
Stone, D.M. (2002) Logging options to minimize soil disturbance in the Northern Lake States. Northern Journal of Applied Forestry, Volume 19, Number 3, p. 115–121.
Sullivan, P., and A. Anderson (2000) A methodology for estimating Army Training and Testing Area Carrying Capacity (ATTACC) vehicle severity factors and local condition factors. U.S. Army Engineer Research and Development Center, Construction Engineering Research Laboratory, Champaign, Illinois, ERDC/CERL Technical Report TR-00-02.
Walker, D.A., P.J. Webber, K.R. Everett, and J. Brown (1977) The effects of low-pressure wheeled vehicles on plant communities and soils at Prudhoe Bay, Alaska. U.S. Army Cold Regions Research and Engineering Laboratory, Hanover, New Hampshire, Special Report 77-17.
Walker, D.A., D. Cate, J. Brown, and C. Racine (1987) Disturbance and recovery of Arctic Alaskan tundra terrain: A review of recent investigations. U.S. Army Cold Regions Research and Engineering Laboratory, Hanover, New Hampshire, CRREL Report 87-11.
Willoughby, W.E., and G.W. Turnage (1990) Review of a procedure for predicting rut depth. Internal Working Document.
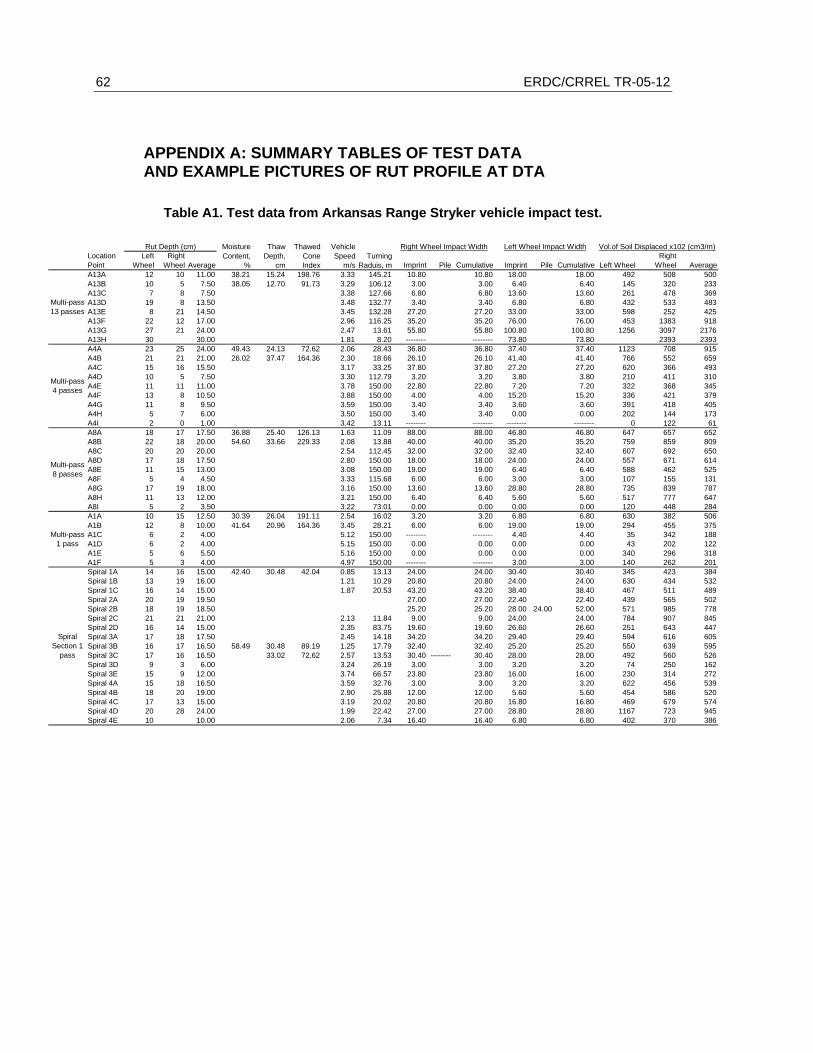
62 ERDC/CRREL TR-05-12
APPENDIX A: SUMMARY TABLES OF TEST DATA AND EXAMPLE PICTURES OF RUT PROFILE AT DTA
Table A1. Test data from Arkansas Range Stryker vehicle impact test.
Location Point
Left Wheel
Right Wheel Average Imprint Pile Cumulative Imprint Pile Cumulative Left Wheel
Right Wheel Average
A13A 12 10 11.00 38.21 15.24 198.76 3.33 145.21 10.80 10.80 18.00 18.00 492 508 500A13B 10 5 7.50 38.05 12.70 91.73 3.29 106.12 3.00 3.00 6.40 6.40 145 320 233A13C 7 8 7.50 3.38 127.66 6.80 6.80 13.60 13.60 261 478 369A13D 19 8 13.50 3.48 132.77 3.40 3.40 6.80 6.80 432 533 483A13E 8 21 14.50 3.45 132.28 27.20 27.20 33.00 33.00 598 252 425A13F 22 12 17.00 2.96 116.25 35.20 35.20 76.00 76.00 453 1383 918A13G 27 21 24.00 2.47 13.61 55.80 55.80 100.80 100.80 1256 3097 2176A13H 30 30.00 1.81 8.20 -------- -------- 73.80 73.80 2393 2393A4A 23 25 24.00 49.43 24.13 72.62 2.06 28.43 36.80 36.80 37.40 37.40 1123 708 915A4B 21 21 21.00 26.02 37.47 164.36 2.30 18.66 26.10 26.10 41.40 41.40 766 552 659A4C 15 16 15.50 3.17 33.25 37.80 37.80 27.20 27.20 620 366 493A4D 10 5 7.50 3.30 112.79 3.20 3.20 3.80 3.80 210 411 310A4E 11 11 11.00 3.78 150.00 22.80 22.80 7.20 7.20 322 368 345A4F 13 8 10.50 3.88 150.00 4.00 4.00 15.20 15.20 336 421 379A4G 11 8 9.50 3.59 150.00 3.40 3.40 3.60 3.60 391 418 405A4H 5 7 6.00 3.50 150.00 3.40 3.40 0.00 0.00 202 144 173A4I 2 0 1.00 3.42 13.11 -------- -------- -------- -------- 0 122 61A8A 18 17 17.50 36.88 25.40 126.13 1.63 11.09 88.00 88.00 46.80 46.80 647 657 652A8B 22 18 20.00 54.60 33.66 229.33 2.08 13.88 40.00 40.00 35.20 35.20 759 859 809A8C 20 20 20.00 2.54 112.45 32.00 32.00 32.40 32.40 607 692 650A8D 17 18 17.50 2.80 150.00 18.00 18.00 24.00 24.00 557 671 614A8E 11 15 13.00 3.08 150.00 19.00 19.00 6.40 6.40 588 462 525A8F 5 4 4.50 3.33 115.68 6.00 6.00 3.00 3.00 107 155 131A8G 17 19 18.00 3.16 150.00 13.60 13.60 28.80 28.80 735 839 787A8H 11 13 12.00 3.21 150.00 6.40 6.40 5.60 5.60 517 777 647A8I 5 2 3.50 3.22 73.01 0.00 0.00 0.00 0.00 120 448 284A1A 10 15 12.50 30.39 26.04 191.11 2.54 16.02 3.20 3.20 6.80 6.80 630 382 506A1B 12 8 10.00 41.64 20.96 164.36 3.45 28.21 6.00 6.00 19.00 19.00 294 455 375A1C 6 2 4.00 5.12 150.00 -------- -------- 4.40 4.40 35 342 188A1D 6 2 4.00 5.15 150.00 0.00 0.00 0.00 0.00 43 202 122A1E 5 6 5.50 5.16 150.00 0.00 0.00 0.00 0.00 340 296 318A1F 5 3 4.00 4.97 150.00 -------- -------- 3.00 3.00 140 262 201Spiral 1A 14 16 15.00 42.40 30.48 42.04 0.85 13.13 24.00 24.00 30.40 30.40 345 423 384Spiral 1B 13 19 16.00 1.21 10.29 20.80 20.80 24.00 24.00 630 434 532Spiral 1C 16 14 15.00 1.87 20.53 43.20 43.20 38.40 38.40 467 511 489Spiral 2A 20 19 19.50 27.00 27.00 22.40 22.40 439 565 502Spiral 2B 18 19 18.50 25.20 25.20 28.00 24.00 52.00 571 985 778Spiral 2C 21 21 21.00 2.13 11.84 9.00 9.00 24.00 24.00 784 907 845Spiral 2D 16 14 15.00 2.35 83.75 19.60 19.60 26.60 26.60 251 643 447Spiral 3A 17 18 17.50 2.45 14.18 34.20 34.20 29.40 29.40 594 616 605Spiral 3B 16 17 16.50 58.49 30.48 89.19 1.25 17.79 32.40 32.40 25.20 25.20 550 639 595Spiral 3C 17 16 16.50 33.02 72.62 2.57 13.53 30.40 -------- 30.40 28.00 28.00 492 560 526Spiral 3D 9 3 6.00 3.24 26.19 3.00 3.00 3.20 3.20 74 250 162Spiral 3E 15 9 12.00 3.74 66.57 23.80 23.80 16.00 16.00 230 314 272Spiral 4A 15 18 16.50 3.59 32.76 3.00 3.00 3.20 3.20 622 456 539Spiral 4B 18 20 19.00 2.90 25.88 12.00 12.00 5.60 5.60 454 586 520Spiral 4C 17 13 15.00 3.19 20.02 20.80 20.80 16.80 16.80 469 679 574Spiral 4D 20 28 24.00 1.99 22.42 27.00 27.00 28.80 28.80 1167 723 945Spiral 4E 10 10.00 2.06 7.34 16.40 16.40 6.80 6.80 402 370 386
Rut Depth (cm) Right Wheel Impact Width Left Wheel Impact Width Vol.of Soil Displaced x102 (cm3/m)Moisture Content,
%
Thaw Depth,
cm
Thawed Cone Index
Vehicle Speed
m/sTurning
Raduis, m
Spiral Section 1
pass
Multi-pass 13 passes
Multi-pass 1 pass
Multi-pass 4 passes
Multi-pass 8 passes

Disturbance Measurements from Off-Road Vehicles 63
Table A2. Test data from Eddy Drop Zone Stryker vehicle impact test.
Location Point
Right Wheel
Left Wheel Average Imprint Pile Cumulative Imprint Pile Cumulative
Right Wheel Left Wheel Average
E13A 28 20 24.00 42.07 43.18 89.19 4.00 150.00 36.00 19.80 55.80 39.60 39.60 1260 942 1101E13B 30 27 28.50 31.75 45.72 114.67 4.34 150.00 39.60 39.60 46.80 46.80 1136 917 1027E13C 27 27 27.00 40.35 4.29 150.00 1061 986 1023E13D 28 23 25.50 30.53 4.38 150.00 38.00 21.60 59.60 54.00 4.50 58.50 831 794 813E13E 28 10 19.00 4.82 150.00 40.00 40.00 46.00 46.00 1248 474 861E13F 27 23 25.00 4.41 150.00 33.60 33.60 42.00 42.00 1006 793 899E13G 32 32 32.00 3.01 27.34 50.40 21.60 72.00 60.00 60.00 1825 1596 1711E13H 38 35 36.50 3.04 15.21 60.00 41.40 101.40 72.00 27.00 173.40 1755 1601 1678E4A 5 10 7.50 114.14 13.97 66.25 4.39 93.16 27.20 27.20 26.60 26.60 97 288 193E4B 14 15 14.50 95.96 12.70 81.54 4.54 150.00 25.20 25.20 28.00 28.00 344 340 342E4C 3 10 6.50 110.29 12.70 73.90 4.25 150.00 12.00 12.00 10.80 10.80 77 319 198E4D 8 13 10.50 133.42 15.24 71.35 4.78 150.00 12.60 12.60 8.00 8.00 247 514 381E4E 14 21 17.50 3.30 17.46 32.40 32.40 57.60 25.20 82.80 954 145 549E8A 8 10 9.00 82.28 12.70 91.73 3.35 150.00 39.60 39.60 36.00 36.00 179 316 247E8B 17 13 15.00 131.35 15.24 50.96 3.62 150.00 30.40 30.40 34.20 34.20 591 396 493E8C 13 9 11.00 97.75 15.24 112.12 3.53 150.00 32.40 32.40 36.00 36.00 445 271 358E8D 7 11 9.00 11.43 86.64 3.57 150.00 36.00 36.00 27.20 27.20 247 333 290E8E 14 9 11.50 3.63 137.90 34.20 34.20 39.60 39.60 500 258 379E8F 16 15 15.50 2.80 12.29 37.80 48.60 86.40 41.40 56.00 97.40 1265 845 1055E1A 5 6 5.50 69.22 15.24 71.35 2.24 150.00 3.40 3.40 6.80 6.80 330 219 274E1B 2 7 4.50 69.57 20.32 78.99 2.24 114.38 6.80 6.80 2.60 2.60 105 200 153E1C 0 0 0.00 83.93 2.62 141.42 2.40 2.40 0 0 0E1D 10 10 10.00 70.33 2.62 150.00 7.20 7.20 10.80 10.80 224 286 255E1E 6 10 8.00 3.01 150.00 7.20 7.20 3.60 3.60 142 293 217E1F 5 7 6.00 3.01 150.00 6.40 6.40 2.60 2.60 143 191 167E1G 6 6.00 1.70 35.07 6.00 6.00 131 131ES-1A 8 9 8.50 75.18 2.17 17.22 7.20 7.20 17.00 17.00 185 382 283ES-1B 11 11.00 2.36 11.59 6.80 6.80 20.00 20.00 288 362 325ES-1C 8 8.00 2.23 15.55 19.00 19.00 14.40 14.40 266 474 370ES-1D 5 0 2.50 2.81 14.84 1134 0 567ES-2A 9 2 5.50 1.90 25.56 30.40 30.40 24.00 24.00 237 129 183ES-2B 0 6 3.00 2.55 18.94 25.60 25.60 16.00 16.00 638 334 486ES-2C 4 9 6.50 1.79 17.98 28.80 28.80 28.80 28.80 382 492 437ES-2D 5 3 4.00 2.37 28.46 27.20 27.20 32.40 32.40 130 105 117ES-3A 14 13 13.50 2.03 21.31 25.60 25.60 28.80 28.80 350 354 352ES-3B 12 12 12.00 2.23 18.81 13.60 13.60 19.20 19.20 726 540 633ES-3C 7 8 7.50 22.40 22.40 22.40 22.40 198 273 235ES-3D 5 5 5.00 2.08 15.03 27.00 27.00 127 188 157ES-4A 10 6 8.00 2.27 29.36 17.60 17.60 25.60 25.60 368 111 240ES-4B 4 4 4.00 5.60 5.60 9.00 9.00 90 130 110ES-4C 10 14 12.00 16.00 16.00 28.80 28.80 275 326 300ES-4D 7 3 5.00 2.63 21.18 284 103 193ES-5A 11 9 10.00 57.96 11.20 11.20 14.00 14.00 312 514 413ES-5B 9 6 7.50 2.54 25.51 21.60 21.60 178 205 192
Rut Depth (cm) Left Wheel Impact Width Right Wheel Impact Width Vol.of Soil Displaced x102 (cm3/m)Moisture Content,
%
Thaw Depth,
cm
Thawed Cone Index
Vehicle Speed
m/sTurning
Raduis, m
Spiral Section 1
pass
Multi-pass 13 passes
Multi-pass 1 pass
Multi-pass 4 passes
Multi-pass 8 passes

64 ERDC/CRREL TR-05-12
Table A3. Test data from Texas Range Stryker vehicle impact test.
Location Point
Right Wheel
Left Wheel Average Left Wheel Right Wheel Left Wheel
Right Wheel Average
TSS1A 0 0 0.00 356.75 7.62 61.16 2.34 7.82 0.00 0.00 0 0 0TSS1B 0 0 0.00 0 0 0TSS1C 3 6 4.50 3.20 6.80 251 48 149TSS1D 0 0 0.00 2.20 0 0 0TSS2A 2 5 3.50 3.20 1.60 269 34 152TSS2B 4 0 2.00 2.60 6.80 0 125 63TSS2C 10 10 10.00 2.20 10.74 6.00 3.40 298 613 456TSS2D 4 6 5.00 2.38 14.40 3.00 2.40 313 71 192TSS3A 3 6 4.50 3.00 3.00 378 156 267TSS3B 4 0 2.00 2.60 3.80 0 247 124TSS3C 11 3 7.00 3.28 36.41 6.00 30.40 199 529 364TSS3D 0 0 0.00 2.95 21.99 6.00 5.60 0 0 0TSS4A 6 5 5.50 3.80 2.80 145 422 284TSS4B 3 4 3.50 3.40 108 82 95TSS4C 4 5 4.50 3.28 36.41 3.60 3.80 97 212 155TSS4D 11 0 5.50 3.40 29.09 9.60 0 451 226TSS4E 0 4 2.00 3.20 0.00 334 0 167TSS5A 12 0 6.00 274.55 7.62 53.51 3.71 38.67 6.80 0 543 271TSS5B 4 0 2.00 10.80 0 157 79TSS6A 5 0 2.50 4.12 56.79 3.00 3.40 0 77 38TSS6B 0 2 1.00 4.95 43.66 3.60 5.60 121 0 61
Spiral Section 1
pass
Rut Depth (cm) Cumulative Impact Width Vol.of Soil Displaced x102 (cm3/m)Moisture Content
(%)
Thaw Depth
(cm)
Thawed Cone Index
Vehicle Speed
m/s
Turning Raduis
(m)

Disturbance Measurements from Off-Road Vehicles 65
Table A4. Test data from the M60 and HEMTT vehicles, from the control sections along the wooded trail at Fort McCoy, Wisconsin.
Soil Strength
StationsDate measured Vehicle 1 10 25 50 1 10 25 50 CI0-6 CI
Thaw Depth (cm)
1+50 to 2+50 3/24/1995 M60 10 25 30 36 13 17 27 34 25.33 [email protected] 15.277+00 to 8+25 3/24/1995 M60 28 38 46 61 23 36 46 61 25.00 75@6 21.83
1+50 to 2+50 3/26/1995 HEMTT 10 13 13 23 15 15 15 17 31.27+00 to 8+20 3/26/1995 HEMTT 46 53 53 53 38 38 38 61 16
Grav Water Content (%)
Left Rut Depth (cm) Right Rut Depth (cm)Number of passes Number of passes
A few rut profiles at DTA are shown on the following pages.

66 ERDC/CRREL TR-05-12
a. Left track.
b. Right track.
Figure A1. Rut profiles on point A13H on turn section of thirteen-pass at the Arkansas Range.

Disturbance Measurements from Off-Road Vehicles 67
a. Left track.
b. Right track.
Figure A2. Rut profiles on point A8A on turn section of eight-pass at the Arkansas Range.

68 ERDC/CRREL TR-05-12
a. Left track.
b. Right track.
Figure A3. Rut profiles on point A4D on drier section of four-pass at the Arkansas Range.
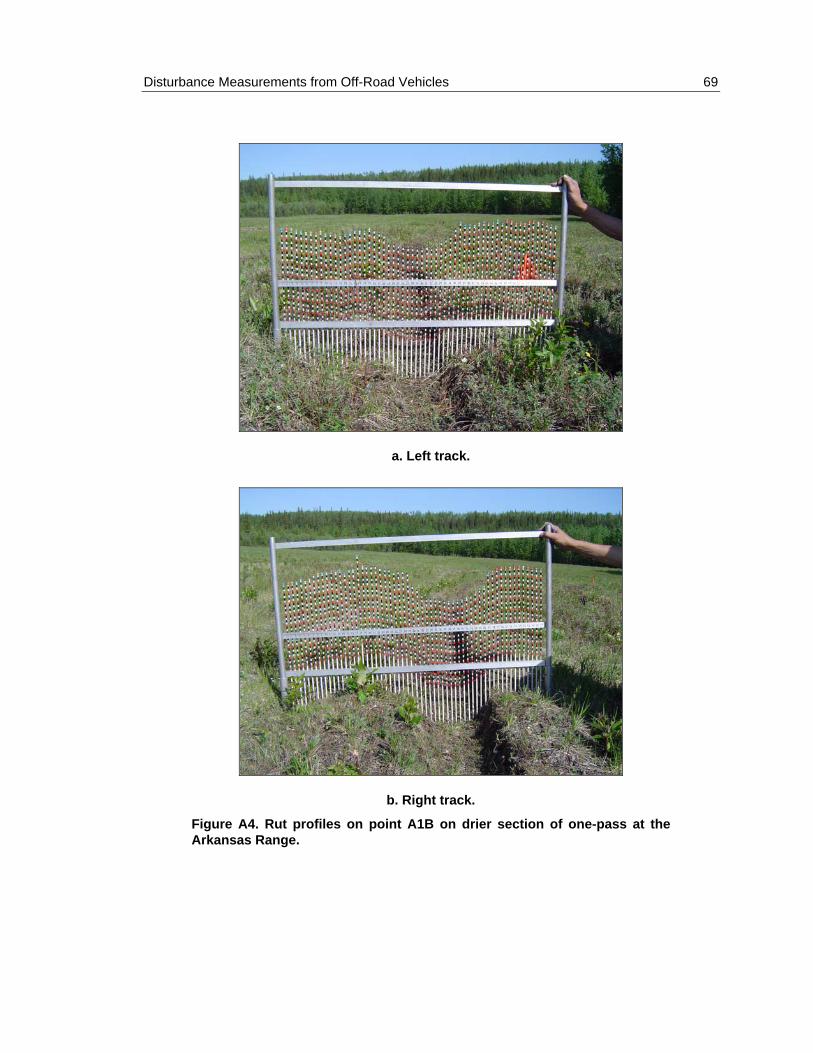
Disturbance Measurements from Off-Road Vehicles 69
a. Left track.
b. Right track.
Figure A4. Rut profiles on point A1B on drier section of one-pass at the Arkansas Range.

70 ERDC/CRREL TR-05-12
a. Left track.
b. Right track.
Figure A5. Rut profiles on point AS2B on spiral section at the Arkansas Range.

Disturbance Measurements from Off-Road Vehicles 71
a. Left track.
b. Right track.
Figure A6. Rut profiles on point E13G on turn section of thirteen-pass at the Eddy Drop Zone.

72 ERDC/CRREL TR-05-12
a. Left track.
b. Right track.
Figure A7. Rut profiles on point E4C on straight section of four-pass at the Eddy Drop Zone.
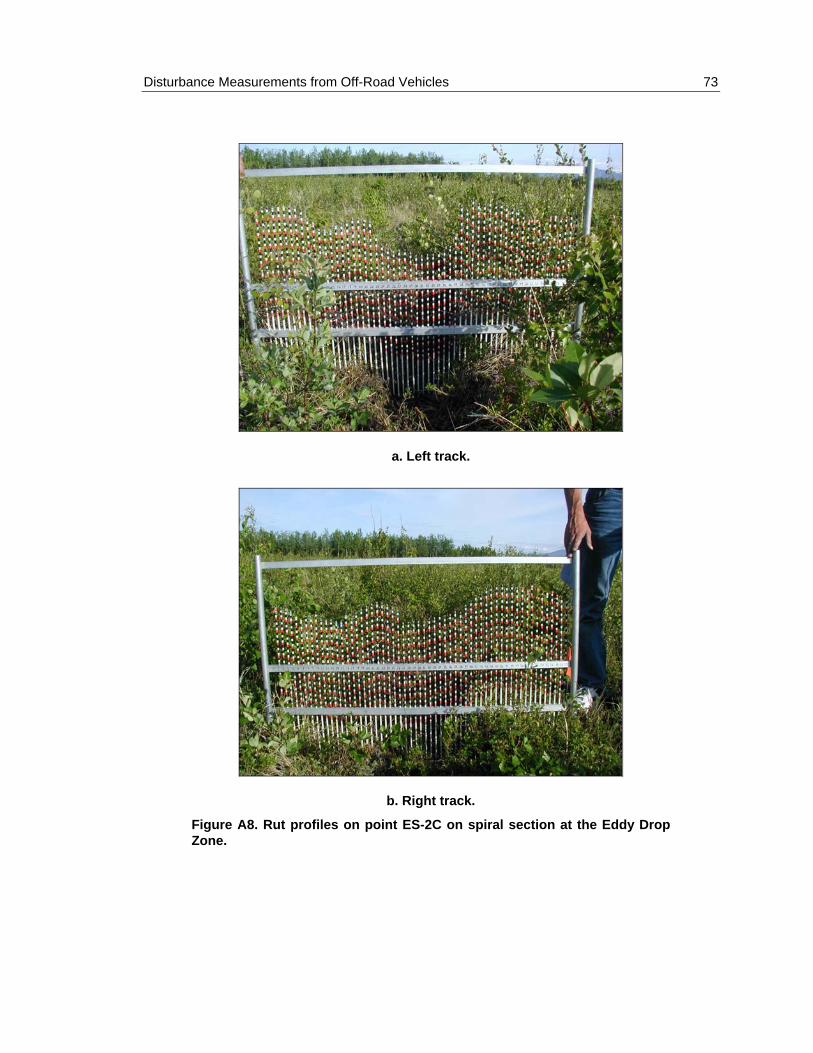
Disturbance Measurements from Off-Road Vehicles 73
a. Left track.
b. Right track.
Figure A8. Rut profiles on point ES-2C on spiral section at the Eddy Drop Zone.

74 ERDC/CRREL TR-05-12
a. Left track.
b. Right track.
Figure A9. Rut profiles on point TSS4A on spiral section at the Texas Range.

Disturbance Measurements from Off-Road Vehicles 75
APPENDIX B: CALCULATION OF FROST DEPTH
Table B1. Frost depth penetration for sites based on air temperature data from NCDC. Sites and season
DTA, Alaska 1 August 2002–31July 2003
Parameters Arkansas
Range Eddy Drop
Zone Texas Range
Fort McCoy, Wisconsin
1 August 1994–31July 1995
Dry density, ρd, kg/m3 1634 1356 559 1800
Water content, ω, % 30 39 157 15.6 Air freezing index, Iaf, °C-days 1589a 1589a 1589a 608b Temperature difference between mean annual air temperature and freezing temperature, vo, °C 0.8a 0.8a 0.8a 6.8b Surface n-factor for freezing, nf, dimensionless 0.33 0.33 0.29 (peat) 0.33 Unfrozen thermal conductivity, ku, J/s-m-°C 2.0 1.2 0.55 2.4 Frozen thermal conductivity, kf, J/s-m-°C 4.2 2.0 1.3 3.5 Latent heat of the soil, L, J/m3 9.39 × 10⁷ 16.36 × 10⁷ 17.65 × 10⁷ 29.3 × 10⁷
Thermal ratio, α, dimensionless 0.23 0.23 0.26 3.97
Fusion parameter, μ, dimensionless 0.06 0.05 0.03 0.04
Correction coefficient, λ, dimensionless 0.98 0.98 0.96 0.70 Frost depth, Xc, m (ft) 0.34 (1.14) 0.23 (0.76) 0.14 (0.45) 0.30 (0.86) Frost depth, Xd, m 1.3 0.9 0.5e* 0.7 a Air temperature data from 1 August 2002 to 31 July 2003 b Air temperature data from 1 August 1994 to 31 July 1995 c Denotes results from Stefan equation d Denotes results from modified Berggren equation e Not accounting for the influence and depth of permafrost
Two numerical methods to calculate frost depth penetration include the Stefan equation and the modified Berggren equation. The Stefan equation does not account for the volumetric heat of the frozen and unfrozen soil, which estimates a higher value frost depth than modified Berggren equation. The equations are written

76 ERDC/CRREL TR-05-12
( )1/ 2
sf48 Stefan equation, in English unitskIXL
⎛ ⎞= ⎜ ⎟⎝ ⎠
(B1)
( )1/ 2
fλ 172,800 modified Berggren equation, in SI unitsL
skIX ⎛ ⎞= ⎜ ⎟⎝ ⎠
(B2)
where X is the frost depth, Isf is the surface freezing index, L the latent heat of the soil, k the soil thermal conductivity, and λ the correction coefficient.

Disturbance Measurements from Off-Road Vehicles 77
APPENDIX C: OFF-ROAD VEHICLE GUIDELINES AND RATINGS FROM STUDIES IN ALASKA
Table C1. Rating scheme for evaluating vehicle traffic impact on vegetation. (After Abele et al. 1978.)
Impact category Compression to tundra surface: Refers to the bending and compressing of live and standing dead vegetation to the tundra surface so that it becomes flattened and oriented to the direction of travel.
Score 0 No observable compression vegetation to tundra surface. 1 Slight compression of vegetation (1–10% of plants affected). 2 Moderate compression of vegetation (11–50% of plants affected). 3 Severe compression of vegetation (>50% of plants affected)
Impact category Displacement: Refers to several categories of disturbance, including tussocks of moss or cottongrass moved and overturned, displacement of wet mosses by splashing action, and exposure of bare soil by removal of vegetation mat.
Score 0 No displacement of vegetation. 1 Some displacement of vegetation (1–10% of plants affected). 2 Moderate displacement of vegetation (11–50% of plants affected). 3 Severe displacement of vegetation (>50% of plants affected).
Impact category Breakage: Refers to breakage of plant stems or flowering stalks.
Score 0 No breakage observed. 1 Some breakage observed (1–10% of plants affected). 2 Moderate breakage observed (11–50% of plants affected). 3 Severe breakage observed (>50% of plants affected).
Impact category Deposition: Refers to accumulation at sides of tracks.
Score 0 No mud or moss accumulation at sides of tracks. 1 Few shallow patches of mud or mud or moss. 2 Many shallow patches of mud or mud or moss. 3 Continuous thick deposit of mud or mud or moss.

78 ERDC/CRREL TR-05-12
Table C2. Summary of documented off-road vehicle impacts in Alaskan arctic and subarctic terrain. (After Slaughter et al. 1990.)
Subjective impact rating (1 = low; 8 = high) Location (source) and
vehicle type
Setting and number of passes
made by vehicle Microrelief Soils Vegetation Cumulative
impact* Prudhoe Bay, Alaska (Walker et al. 1987)
Moist, nontussock sedge; dwarf-shrub tundra
1 2 1 2 5
30 5 5 5 15
Wet sedge tundra
1 4 4 6 13
Rolligon
30 7 8 9 24
Barrow, Alaska (Abele et al. 1984)
Wet sedge meadow (drained lake bed)
5 4 2 2 8 Rolligon (Houston)
15 7 5 5 17
5 Weasel
50
Nebesna, Alaska (Racine and Ahlstrand 1985)
Moist, tussock sedge; dwarf-shrub tundra
10 2 1 3 6
50 3 1 3 7 Three-wheel Honda
150 4 3 5 12
10 2 1 3 6
50 5 3 6 14 Six-wheel Sidewinder
15 7 6 8 23
10 2 2 5 9
50 5 4 6 15 Weasel
150 8 7 8 23
Denali Highway Region, Alaska (Sparrow et al. 1978)
Dry tundra (light use) 5 5 5 15
Dry tundra (light use) 7 8 6 21
Moist tundra (medium use) 4 4 6 14
Moist tundra (medium use) 8 7 8 23
Alpine tundra (heavy use) 8 8 8 24
Uncontrolled off-road vehicles ranging from three-wheeler up to
Weasel-size vehicles
Alpine tundra (heavy use) 4 5 6 15
Weasel-size Open coniferous woodland 4 7 8 23
* Total disturbance: Greater than 20 = high; 10–20 = moderate; 3–10 = low.

Disturbance Measurements from Off-Road Vehicles 79
Table C3. Representative small off-road vehicle characteristics for personal and indus-trial use in Alaska. (From Slaughter et al. 1990.)
Class Weight
(kg)
Ground pressure (kg/cm2) Remarks
I. Small: Personal use
Three-wheeler all-terrain cycle 90–120 0.10 1 passenger, 3 wheels, knobby or cleated tread
Four-wheeler all-terrain cycle 110–170 0.10 1 passenger, 4 wheels,
knobby tread
Goot or Pug 500–600 0.70 2–4 passengers, 4 wheels,
four-wheel drive, cleated tread Trackster 450 0.04 2 passenger, rubber tracks
Argo, Huster, Max, Sidewinder 400–600 0.18 2–4 passengers, cleated tread II. Medium: Personal
and industrial use
Weasel 1,200 0.07 2–6 passengers, tracked,
skid steering
Bombardier Bombi 1,100 0.06 2 passengers, tracked,
skid steering
Jeep 1,180 2.24 4 passengers, four-wheel drive, may
be equipped with oversized tires
Thiokol IMP 1,200 0.06 Rubber track, steel cleated,
skid steering
Pasquali 993 tractor 815 0.84 4 wheels, cleated tires,
articulated steering III. Large—industrial use
Norwell RN-110 5,400 0.09 Rubber tracks, steel cleats,
skid steering Rolligon (Houston) 6,800 0.25 6 wheels, ribbed tires
Bombardier Muskeg Tractor 3,200 0.09 Rubber tracks, steel cleated,
skid steering Rolligon (CATCO) 11,700 0.35 8 wheels, smooth tires
Caterpillar D-7 15,800 0.70 Prime mover, steel cleated tracks

80 ERDC/CRREL TR-05-12
Table C4. Static contact pressure estimates for selected harvesting equipment. (From Stone 2002.)
Static ground pressure Equipment type (kPa) (psi)
Flexible tracked skidders 20–40 3–6 Rigid tracked crawlers 40–70 6–10
Forwarder with 3 to 4 axles 55–70 8–10 Rubber-tired skidders 80–110 12–16 Forwarder with 2 axles 100–125 14–18

Disturbance Measurements from Off-Road Vehicles 81
APPENDIX D: METHODS TO CALCULATE VEHICLE SPEED AND TURNING RADIUS FROM GPS DATA. (AFTER AYERS ET AL. 2000.)
A Global Positioning System (GPS) unit was mounted on the vehicle for tracking its position during the Stryker maneuver tests at DTA. This was similar to a GPS unit used by Ayers et al. (2000). The GPS unit recorded the position data at the 1-Hz frequency in latitude and longitude coordinates. The data then were converted to Universal Transverse Mercator (UTM) system coordinates to calculate the vehicle speed and turning radius.
The distance between the position points is equal to the speed of the vehicle. Distance in meters from Position Point A to Position Point B (on northing versus easting axis) is
( ) ( )2 2A-B N N E EDistance = − + −A B A B .
Since the GPS recorded at the 1-Hz frequency, the time from Position Point A to Position Point B was one second. Velocity in meters per second from Posi-tion Point A to Position Point B is
A-B
A-B
DistanceVelocity (m/sec)Time
= .
Turning radius was calculated using five data points with plane geometry referencing the northing and easting of each point. The equations used to cal-culate the turning radius for the points are illustrated in Figure D1. Perpendicular bisects to lines connecting the first to the third, and third to the fifth, data points were calculated from the coordinates of those points. The intersection of those two perpendicular bisects was determined by solving two equations with two unknowns. Turning radii greater than and equal to 150 m are assigned a value of 150 m, and are considered as straight path.

82 ERDC/CRREL TR-05-12
Figure D1. Turning radius.
The slope of the line from position A to position C is
N NA-C
E E
C AmC A
−=
−.
The slope of the line from position C to position E is
N NC-E
E E
E CmE C
−=
−.
The slope of the perpendicular bisect to line A-C at position B is
B-IA-C
1mm−
= .
The slope of the perpendicular bisect to line C–E at position D is
D-IC-E
1mm−
= .

Disturbance Measurements from Off-Road Vehicles 83
Equations to determine the intercepts of the perpendicular bisects are
B-I N B-I Eb B m B= −
D-I N D-I Eb D m D= − .
Equations to determine the positions of the intersection I of the two bisects are
N B-I E B-II m I b= +
N D-I E D-II m I b= + .
The equation to determine distance from point C to intersection I is
( ) ( )2 2N N E ETurningRadius ( )m I C I C= − + − .


REPORT DOCUMENTATION PAGE Form Approved
OMB No. 0704-0188 Public reporting burden for this collection of information is estimated to average 1 hour per response, including the time for reviewing instructions, searching existing data sources, gathering and maintaining the data needed, and completing and reviewing this collection of information. Send comments regarding this burden estimate or any other aspect of this collection of information, including suggestions for reducing this burden to Department of Defense, Washington Headquarters Services, Directorate for Information Operations and Reports (0704-0188), 1215 Jefferson Davis Highway, Suite 1204, Arlington, VA 22202-4302. Respondents should be aware that notwithstanding any other provision of law, no person shall be subject to any penalty for failing to comply with a collection of information if it does not display a currently valid OMB control number. PLEASE DO NOT RETURN YOUR FORM TO THE ABOVE ADDRESS.
1. REPORT DATE (DD-MM-YYYY) July 2005
2. REPORT TYPE Technical Report
3. DATES COVERED (From - To)
5a. CONTRACT NUMBER
5b. GRANT NUMBER
4. TITLE AND SUBTITLE
Disturbance Measurements from Off-Road Vehicles on Seasonal Terrain
5c. PROGRAM ELEMENT NUMBER
5d. PROJECT NUMBER
5e. TASK NUMBER
6. AUTHOR(S)
Rosa T. Affleck
5f. WORK UNIT NUMBER
7. PERFORMING ORGANIZATION NAME(S) AND ADDRESS(ES) 8. PERFORMING ORGANIZATION REPORT NUMBER
U.S. Army Engineer Research and Development Center Cold Regions Research and Engineering Laboratory 72 Lyme Road Hanover, New Hampshire 03755-1290
ERDC/CRREL TR-05-12
9. SPONSORING / MONITORING AGENCY NAME(S) AND ADDRESS(ES) 10. SPONSOR/MONITOR’S ACRONYM(S)
11. SPONSOR/MONITOR’S REPORT NUMBER(S)
12. DISTRIBUTION / AVAILABILITY STATEMENT Approved for public release; distribution is unlimited. Available from NTIS, Springfield, Virginia 22161. 13. SUPPLEMENTARY NOTES
14. ABSTRACT Vehicle operations on cross-country terrain for military, commercial or industrial, and recreational purposes can disturb the terrain,
especially during spring thaw season. Terrain disturbance from off-road vehicle operations can be measured in terms of rut depth and vegetation damage. Ruts occur when vehicle load is greater than the terrain’s bearing capacity, especially in soft soils. Rutting is the physical disturbance of the soil, including compaction and deformation. Estimates of rut depth for wheeled and tracked vehicles in soft, unfrozen soils can be calculated using an empirical equation based on the vehicle and soil properties. The vehicle parameters include vehicle load, tire or tracked footprint area, and wheel slip. The terrain soil properties are very important elements for estimating rut depth, including soil type and strength. Rut depth measurements were collected from military vehicles during Stryker (wheeled) vehicle impact tests at three locations at Donnelly Training Area, Alaska, and from M60A3 (tracked) and HEMTT (wheeled) vehicles at Fort McCoy, Wisconsin, during spring thaw seasons. These rut depth data are coupled with information about vehicle maneuvers (multiple passes and turning) and soil properties, such as soil type, moisture content, and soil strength. The scope of this report is to compare the actual rut depth measurements with the empirical equations to relate the physical disturbance of the soil and vegetation to a severity index, quantify the volumetric soil displacement, and assess disturbance on winter operations.
15. SUBJECT TERMS Cumulative impact Rut depth
Rutting Severity index Sinkage
Terrain disturbance Vehicle impact Volumetric soil displacement
16. SECURITY CLASSIFICATION OF: 17. LIMITATION OF ABSTRACT
18. NUMBER OF PAGES
19a. NAME OF RESPONSIBLE PERSON
a. REPORT
U b. ABSTRACT
U c. THIS PAGE
U U 99 19b. TELEPHONE NUMBER (include area code)
Standard Form 298 (Rev. 8-98) Prescribed by ANSI Std. 239.18


DE
PA
RT
ME
NT
OF
TH
E A
RM
YE
NG
INE
ER
RE
SE
AR
CH
AN
D D
EV
EL
OP
ME
NT
CE
NT
ER
, CO
RP
S O
F E
NG
INE
ER
S
CO
LD
RE
GIO
NS
RE
SE
AR
CH
AN
D E
NG
INE
ER
ING
LA
BO
RA
TO
RY, 7
2 L
YM
E R
OA
D
HA
NO
VE
R, N
EW
HA
MP
SH
IRE
03
75
5-1
29
0
Offic
ial B
usin
ess