district skill development plan for erode district
TRANSCRIPT

Skilling for the Future
Skill Gap Assessment & Action Plan for Tamil Nadu
District Skill Development Plan for Erode District
November 2019
Tamil Nadu Skill Development Corporation, Integrated Employment Offices Campus (1st Floor) Thiru. Vi .Ka Industrial Estate, Guindy, Chennai-600 032

1
2
Tamil Nadu Skill Development Corporation (TNSDC)
Integrated Employment Offices Campus (1st Floor) Thiru. Vi .Ka Industrial Estate, Guindy, Chennai-600 032 T +044 2250 0107 E [email protected] W https://www.tnskill.tn.gov.in Published by TNSDC, Chennai Disclaimer The Report includes projections, forecasts and other predictive statements which are based on assumptions and expectations in the light of currently available information. These projections and forecasts are based on industry trends, circumstances and factors which involve risks, variables and uncertainties. TNSDC disclaims all warranties as to the accuracy, completeness or adequacy of such information. TNSDC and/or its Affiliates and its officers, directors and employees including the analysts/authors/advisors shall not be in any way responsible for any direct, indirect, special or consequential damages that may arise to any person from any inadvertent error in the information or judgement or opinion contained in the report nor do they take guarantee or assume liability for any omissions of the information contained therein. The projections and forecasts described in this report should be evaluated keeping in mind the fact that these are not scientifically proven to guarantee certain intended results and are not published as a warranty and do not carry any evidentiary value. Opinions expressed therein are current opinion as of the date appearing on the report only. Data may be subject to update and correction without notice. Every effort has been made to trace the owners of the copyright material included in this Report. The material in this publication is copyrighted. Reproduction or dissemination, directly or indirectly, either on paper or on electronic media, of the research data and report in any form is prohibited except with the written permission of TNSDC. The user should consult their own advisors before making use of any information or data contained in the report. The publishers would be grateful for any omissions brought to their notice for acknowledgement in future editions of the report

3

4
Acknowledgement
We extend our thanks to district officials of Erode, youth, employers, industrial associations and training service providers who participated in focus group discussions and surveys, for their support in conducting research and drafting this report.

5
6
Table of Contents
Acknowledgement ............................................................................................................................................ 4
Executive Summary .......................................................................................................................................... 10
1. District Profile ................................................................................................................................................ 14
1.1. Demographic Profile .............................................................................................................................. 14
1.2. Economic Profile .................................................................................................................................... 15
1.2.1. Sector wise Analysis .................................................................................................................... 15
1.2.2. Investments and key economic drivers ........................................................................................ 18
1.3. Labour Market Profile ............................................................................................................................ 19
1.4. Education and Skill Development Profile ............................................................................................... 20
1.4.1. Education Profile .......................................................................................................................... 20
1.4.2. Vocational Education and Skill Development Profile ................................................................... 20
2. Youth Perspective ......................................................................................................................................... 23
2.1. Profile of Respondent Youth .................................................................................................................. 23
2.2. Youths’ Educational and Economic Engagement Status ....................................................................... 24
2.3. Economic Engagement of Youth ........................................................................................................... 24
2.4. Youth under NEET Category ................................................................................................................. 25
2.5. Vocational Training Awareness and Experience of Youth ..................................................................... 25
2.6. Youth Career Aspiration ........................................................................................................................ 25
2.7. Skill Training Preferences of Youth ....................................................................................................... 29
3. Employers’ and Other Stakeholders’ Perspective ..................................................................................... 30
3.1. Employers’ Perspective ......................................................................................................................... 30
3.2. Other Stakeholders’ Perspective ........................................................................................................... 32
4. Skill Gap Analysis ......................................................................................................................................... 34
4.1. Skill Gap Assessment - Incremental Demand for Skilled & Semi Skilled Workforce ............................. 34
5. District Action Plan and Recommendations .............................................................................................. 35
5.1. Key Findings and Inferences ................................................................................................................. 35
5.2. District Action Plan................................................................................................................................. 35
5.3. Key Recommendations.......................................................................................................................... 44
Appendix ............................................................................................................................................................ 46
A.1 Methodology for Block Selection in Youth Aspiration Survey ................................................................. 46
A.2 Methodology for Present and Future Labour Demand – Supply and Gap Estimation ........................... 48
A.3 List of Stakeholders ................................................................................................................................ 50
7
List of Tables
Table 1: Key Demographic Indicators – Erode vs Tamil Nadu .............................................................................. 14 Table 2: Sector wise- Annual Growth Rate in Erode (Directorate of Economics and Statistics, TN) ..................... 16 Table 3 Profile of Manufacturing Sector from ASI .................................................................................................. 17 Table 4 Vocational Training under Short Term Skill Development Programs ........................................................ 20 Table 5 Vocational Training under Long Term Skill Development Programs (ITI) ................................................. 21 Table 6 Education Qualification of Respondents and Employment Type* ............................................................. 25 Table 7 NEET Category Respondents ................................................................................................................... 25 Table 8 Career Aspiration - Factors, Preparedness and Availability of Jobs ......................................................... 26 Table 9 Career Aspiration – Challenges in pursuing desired career ...................................................................... 26 Table 10 Key Requirements to enhance employability and steps to achieve aspirations ...................................... 27 Table 11 Sector wise coverage of Industries in Employer Survey ......................................................................... 30 Table 12 Modes and Challenges in Recruitment Process* .................................................................................... 31 Table 13 Growth Prospects and prospective adoption of technology .................................................................... 32 Table 14 Demand for workers by Skill Level and type of training provided to workers .......................................... 32 Table 15: Qualitative findings in Erode .................................................................................................................. 33 Table 16 Sector wise Incremental Demand for Skilled and Semi Semi-Skilled Workers between 2019 and 2025 34 Table 17 Summary of Trainings ............................................................................................................................. 35 Table 18 Training Project 1: Tourism and Hospitality ........................................................................................... 38 Table 19 Training Project 2: Fabrication ............................................................................................................... 39 Table 20 Training Project 3: Textile and Apparel .................................................................................................. 40 Table 21 Training Project 4: Healthcare ................................................................................................................ 41 Table 22 Training Project 5: Domestic Appliance Service .................................................................................... 42 Table 23 Training Project 6: Food processing ...................................................................................................... 43 Table 24 Training Project 7: Construction ............................................................................................................. 44 Table 25: List of Stakeholders ................................................................................................................................ 50
8
List of Figures
Figure 1 Age-wise Population Pyramid of Erode (2011 vs 2026) .......................................................................... 15 Figure 2 Key Economic Indicators of Erode District ............................................................................................... 15 Figure 3 Sectoral Snapshot of GVA 2016-17 ......................................................................................................... 15 Figure 4 Sectoral Share of GVA (2011-12 & 2016-17) .......................................................................................... 16 Figure 5 Share of GVA by Industry of Origin (2016-17) ......................................................................................... 16 Figure 6 GVA of Agriculture and Allied Sectors (2016-17) ..................................................................................... 17 Figure 7 Industrial Sector GVA (2016-17) .............................................................................................................. 17 Figure 8 GVA of Services Sector (2016-17) ........................................................................................................... 18 Figure 9 Sector-specific growth of Credit off Take (2013-16) – RBI ...................................................................... 18 Figure 10 Large-scale Investments in Erode ......................................................................................................... 19 Figure 11 Key Labour Market Indicators ................................................................................................................ 19 Figure 12 Distribution of Working status by Qualification: District Level Estimates ............................................... 19 Figure 13 Sector-wise share of Employment ......................................................................................................... 20 Figure 14 GER and Drop-out Rates - DISE ........................................................................................................... 20 Figure 15 Proportion Undergone Vocational training 2015-16, MoLE ................................................................... 22 Figure 16 Respondent Profile of Youth Aspiration Survey ..................................................................................... 23 Figure 17 Current Status of Respondent by gender .............................................................................................. 24 Figure 18 Current Status of Respondent by Age Category .................................................................................... 24 Figure 19 Distribution of Respondents across Monthly Income Category across gender ..................................... 24 Figure 20 Career Aspiration of Youth ..................................................................................................................... 26 Figure 21 Aspired monthly salary of respondents .................................................................................................. 28 Figure 22 Preference for Work Location ................................................................................................................ 28 Figure 23 Sources for Job Information* ................................................................................................................. 28 Figure 24 Preferred Sectors* ................................................................................................................................. 29 Figure 25 Duration of Skill Training type interested in ........................................................................................... 29 Figure 26 Skill Training type interested in .............................................................................................................. 29 Figure 27 Distribution of Industries by Size ............................................................................................................ 30 Figure 28 Average distribution of workers by Sex .................................................................................................. 31 Figure 29 Distribution of workers by Skill Levels .................................................................................................... 31 Figure 30 Key causes of Attrition ........................................................................................................................... 31 Figure 31 Skills required for workers ...................................................................................................................... 32 Figure 32: Blocks Selected for Survey in Erode ..................................................................................................... 46 Figure 33: Steps in Demand Estimation ................................................................................................................. 48 Figure 34: Steps in Supply Estimation ................................................................................................................... 49
9
List of Abbreviations
S.No Abbreviation Expanded Form
1. ASI Annual Survey of Industries
2. BFSI Banking Financial Services and Insurance Sector
3. DDU-GKY Deen Dayal Upadhyaya Grameen Kaushalya Yojana
4. DES Directorate of Economics and Statistics
5. DISE District Information System for Education
6. GDDP Gross District Domestic Product
7. EEDISSIA Erode District Small Scale Industries Association
8. GVA Gross Value Added
9. GSVA Gross State Value Add
10. ITI Industrial Training Institute
11. IT-ITES Information Technology and Information Technology Enabled Services
12. LFPR Labour Force Participation Rate
13. Manuf. Manufacturing
14. MIS Management Information System
15. MSME Micro, Small and Medium Industries
16. NCVT National Council for Vocational Training
17. NEET Not in Education, Employment, or Training
18. NSDC National Skill Development Corporation
19. NSQF National Skills Qualification Framework
20. PMKVY Pradhan Mantri Kaushal Vikas Yojana
21. PSU Public Sector Undertaking
22. Pub. Admin. Public Administration
23. QP-NOS Qualification Pack – National Occupational Standards
24. SIDCO Tamil Nadu Small Industries Development Corporation Limited
25. SIPCOT State Industries Promotion Corporation of Tamil Nadu
26. SSC Sector Skill Council
27. TANSIDCO Tamil Nadu Small Industries Development Corporation Limited
28. TIDCO Tamil Nadu Industrial Development Corporation
29. TN-GIM Tamil Nadu Global Investors Meet
30. TNSDC Tamil Nadu Skill Development Corporation
31. TNSRLM Tamil Nadu State Rural Livelihood Mission
32. Tr. & Tou. Trade and Tourism Sectors
33. WPR Worker Population Ratio
10
Executive Summary
Background: The Vision 2023 of Tamil Nadu envisages shaping its future by empowering the youth in the state, through imparting market relevant skill training; to become responsible and participating citizens who drive a new era of development, growth, and productivity. Tamil Nadu has formulated a State Youth Policy, which aims at reinforcing and accomplishing the broader objectives of ‘Vision Tamil Nadu 2023’. The policy focuses on upgrading the human capital of the state by building on the intellectual and creative potential of youth in various fields, thereby transforming Tamil Nadu into the innovation hub and knowledge capital of India. It also aims at enabling Tamil Nadu to collaborate with other States in the country and the rest of the world on multiple dimensions: increasing the flow of workforce and goods/services, enhancing the levels of exchange of ideas and culture, and facilitating the movement of people to and from Tamil Nadu for opportunities. To attain this objective the State envisages training and skilling of 20 million persons by 20231. Tamil Nadu currently has the highest Gross Enrolment Ratio in Higher Education (48.6)2, among all the states in India. The state faces a mandate of developing and maintaining high quality human resources to deal with the evolving economy, and ensuring social justice in the form of decent employment for its educated populace. Thus, it is essential to carefully analyse the industry demand, investment patterns, youth aspirations and re-align policy/ programmatic initiatives in that direction. Thus, taking youth aspiration and industry growth potential is critical to be able to avoid labour demand-supply mismatch, and support overall development of the State. Context for Present Study: In 2012, The National Skill Development Corporation commissioned a skill gap study for Tamil Nadu. The study covered 13 Districts, based on which an extrapolation was done for the remaining districts. The study adopted a mix of secondary and primary research and relied largely on focus group discussions with various stakeholder groups such as youth, employers, industry associations, government officials, and skill training providers. Skill gaps were estimated for a period of 10 years, up to FY 2022. Given the rapid change in the state’s social and economic context, there was a need for a fresh assessment of the state’s skill ecosystem. There is also a need to understand the needs of the youth from diverse geographical backgrounds across the state, especially reaching out to economically backward regions. It is expected that a contemporary estimation, using both quantitative and qualitative analysis would reveal more relevant insights and findings related to the demographic profile, socio-economic characteristics of the youth, emerging sectors and job roles, and the skill-sets in demand. The Present Study: The Tamil Nadu Skill Development Corporation (TNSDC) has, through a competitive procurement process, engaged PricewaterhouseCoopers Private Limited (PwC) to carry out “Skill Gap Assessment and Action Plan” for the state. This is the first time such a comprehensive State-wide skill gap study taking into consideration block-level information from each district has been conducted in Tamil Nadu. The study aims at identifying sources for self and wage employment in all 32 districts, estimating the sector-wise current and future labour demand (over the next six years) by industry, and assessing the overall labour supply and estimating the existing and emerging skill gaps. The Skill Gap study offers insights into: (i) which skills are required to support the State’s economic growth, while also catering to the career aspirations of the youth; and (ii) how to design appropriate interventions that will enable active collaboration between various stakeholders for the common good. Workforce demand-projection for the upcoming years, disaggregated as skilled and semi-skilled workforce requirement has been estimated at the district level. Methodology for Study: Mixed-method research design was adopted encompassing a blend of quantitative and qualitative data collection techniques, and desk research on secondary data sources. Structured into two phases, the first phase of the study comprised a comprehensive desk review of the state’s demography, economy, labour market, educational and skill development profile. The second phase of the study comprised the following:
1. Youth aspiration survey: a quantitative survey covering 360 youth across the following groups – engaged in economic activity (self-employed, wage-employed, entrepreneurs), students in formal education, vocational and skill training institutions (Polytechnics, ITI), and those who fall under the Not in Education, Employment or Training (NEET) category. Six blocks in the district were covered: Ammapet, Talavedi, Andiyur, Erode, Bhavani and Perundurai
1 Tamil Nadu Skill Development Corporation [https://www.tnskill.tn.gov.in/index.php/link/abouttnsdc] 2 All India Survey on Higher Education 2017-18

11
2. Quantitative employer survey: covering 45 employers with adequate representation from Large, Medium, Small and Micro Industries across the key sectors defining the district economy.
3. Focus- Group Discussions (FGD’s) and stakeholder consultations across a wide group of stakeholders including, representatives from Industrial units (with additional focus on MSME sector), district-level Industry Associations across priority sectors, officials from various government departments, representatives from various higher education institutions, and training service providers. In all, more than twenty five focus group discussions and nearly twenty individual consultations have been conducted across the state.
Estimation of labour demand and supply were undertaken based on the analysis of data sourced from the Census of India, the Department of Economics and Statistics of Government of Tamil Nadu, the Reserve Bank of India, the National Sample Survey Organisation and the Bureau of Labour and Employment under the Ministry of Labour and Employment, Government of India. Estimates were further refined based on the data pertaining to the proposed investments (pragmatically rationalised and considered), and the anticipated developments within key sectors; in addition, due consideration is given to the emerging sectors and job roles. The sectors and job roles in demand have been organized into training projects, which are informed by the demand estimations, and validated through quantitative survey findings and qualitative consultations. Budgetary requirements for the training projects have been estimated based on the cost categories as defined within the recent Common Cost Norms published by the Ministry of Skill Development and Entrepreneurship, Government of India. Key Findings: Key findings of the study are presented hereunder:
Demographic Analysis
• The decadal growth rate of the population in the district was 12% between 2001 and 2011, compared to 16% at state level.
• 32% of the population was between 15-34 years in 2011; and the Median age of the District was 26 years, which is much lower than the median age of the state, which was 29 years.
Economic Analysis
• Erode is known for textile, sugar and other food processing industries. Some of the prominent industries include: cotton mills, sugar processing and steel fabrication. Erode ranks twelfth in per capita GDDP across the state. Between 2011-12 and 2016-17, the GDDP grew by 7%.
• All sectors have had a fluctuating growth during the past five years. The economy of the District is dominated by the service sector, which accounts to about 43% of the GVA in 2016-17. However, the industrial sector’s share in the GVA grew by 10% from 2011-12 to 2016-17.
Labour Market Analysis
• The overall labour force participation rate is 67% and worker population ratio is 66% - higher at the district level than at state. About 54% of workers in the district are casual labourers and 25% are self-employed.
• About 39% of the workers are involved in agriculture and allied activities, 22% in manufacturing and 19% in trade related activities.
Education & Skill
Development
• With respect to school education, Erode is one of the preferred districts. The Gross Enrolment Ratio at both Primary and Upper Primary are higher than the state averages. The dropout rates is also lower – 0.5% at the primary level and 2.1% at the upper primary level.
• Erode has 16 ITIs. There are also 9 polytechnics and 34 colleges of higher education.
Findings from Primary Survey
Youth Profile and
Aspirations
• Only 49% of the respondents are currently engaged in some economic activity; out of which 83% are involved in a work related to their education/training.
• About 30% of technical diploma holders claim to be employed as unskilled workers.
• Only 11% of respondents reported to be aware of government run skill development programmes and only 7 respondents out of 360 have undergone such training.
• The youth in the district mostly prefer to be self-employed (36%). About 28% prefer wage / salaried employment with the private sector
• The main factors determining the aspiration of the youth are Salary (wages) / Income (91%), job security (47%) and closeness to residence (35%).
• Location of the job seems to be a major determinant of youth’s attitudes towards work. About 93% of female respondents and 89% of males wanted a job in their own hometown.
• About 16% of youth aspire to work in the auto and auto components sector and 13% wish to work in healthcare. About 8% also wish to work in handloom and handicrafts.
Employer & Other Key
Stakeholder Perspectives
Quantitative Survey
• Employee reference is the major mode of recruitment (73%). Employers also use local community and media advertisements and manpower agencies for recruiting labourers.
• The most common challenge faced by employers was candidates’ disinterest and attitude (48%), followed by high local wages (23%) and lack of prior experience (18%).

12
• The employers had a majority of female employees – on an average, the enterprises employed 72% females.
• Skilled workers dominated the share of workforce (57%), followed by semi-skilled workers (16%) and unskilled workers (17%).
• Over 43% of the employers feel there is high growth prospects in their respective industries.
Qualitative Inputs
• Employers feel that the workforce is not fully aware of skill training programmes. There is also not much interest to continue a job after skilling.
• Youth respondents prefer pursuing jobs within their hometown.
• Candidates prefer to work in the informal sector and do not desire jobs that involves working in the shop floor. Women are mostly involved in the textile spinning and garment manufacturing industry.
• Migrant workers are majorly employed in the textile mills.
• Most migrants in Erode are from the southern districts of Tamil Nadu. There are also migrants from East Indian states working as unskilled workers.
Incremental Demand
• In the next 6 years, Erode will see a demand for about 1.4 lakh workers. Major sectors that drive the demand are textile, food processing, construction, transportation and real estate.
Recommendations: Based on qualitative, quantitative and secondary information findings and inferences, the following recommendations have been identified for consideration:
Farmers who wish undergo skill upgradation training have to travel from their villages to one designated facility/location, on a daily-basis throughout the duration of the course. This constrains the interested candidates economically (economic opportunity costs, transportation cost, etc.). Alternatively, groups of farmers can be identified, and skill training can be offered at their respective villages and be structured conveniently to enable lesser economic loss and full participation from the target candidates. Mandatory field visits would help farmers to understand different agricultural practices suited to different soil and land types.
A set of QP/NOS along with a Q-File can be developed and secured approval from NSDA, for Sago Processing, which is a major industry in Erode.
The appetite for skill training is very low among the youth in the district. Village level awareness drives and mobilization workshops should also be planned in order to make the youth more interested in skilling.
There is a need for improved counselling services as part of skill training to improve candidate attitudes towards jobs. Alumni can also be invited to give talks on the employment scenario and success stories of hardworking candidates needs to be documented and showcased by every skill training provider.

13

14
1. District Profile
Erode district, a part of the Kongu region of Tamil Nadu, was formed after Coimbatore district was bifurcated in
1979. It shares its boundaries with Namakkal and Karur to the East, Dindigul to the South, Coimbatore and Nilgiris
to the West. The river Kaveri and its tributaries run through the region. The dense Sathyamangalam forest areas
are located here forming a part of the Western Ghats.
1.1. Demographic Profile
Table 1: Key Demographic Indicators – Erode vs Tamil Nadu3
SN Indicator Erode Tamil Nadu
1 Total population 22,51,744 72,147,030
2 Female Population 11,21,876 36,009,055
3 Population Density per sq.km (2011) 391 555
4 Urbanization 51% 48%
5 SC population (as % of total population) 16% 20%
6 ST population (as % of total population) 1% 1%
7 Differently abled population (as % of total population) 2% 2%
8 Population in age group 15-34 years (as % of total population) 34% 35%
9 SC population aged 15-34 years (as % of SC population) 35% 37%
10 ST population aged 15-34 years (as % of ST population) 33% 35%
11 Literacy rate 73% 80%
3 Census 2011 & 2011
15
Key Highlights from the analysis of Census Data:
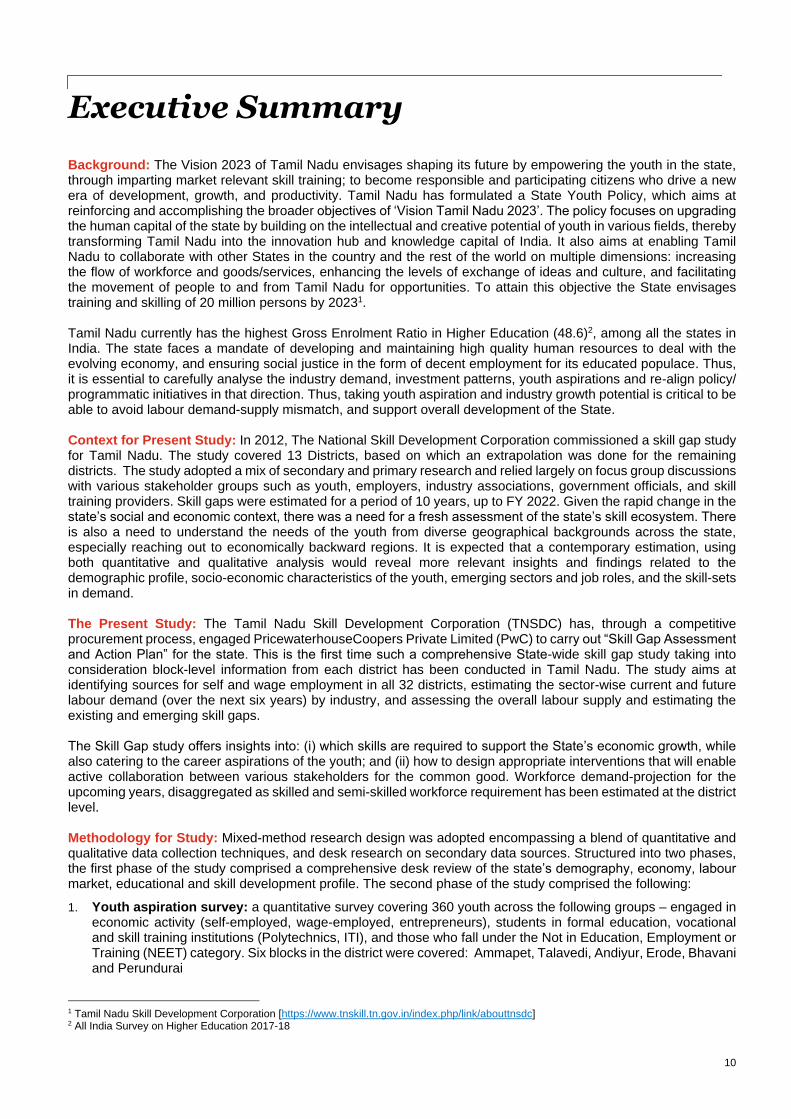
• Population Growth and Urbanization: The decadal growth rate of the population in the district was
12% between 2001 and 2011, compared to 16% at the State level.
• Literacy: The district has a lower literacy rate compared to the State. The female literacy rate is at 65%
while the male literacy rate was 80%.
• Youth Demography: 32% of the population was between 15-34 years in 2011 with a Median age of 26
years, much lower than the median age of the State, which was 29 years.
Figure 1 Age-wise Population Pyramid of Erode (2011 vs 2026)4
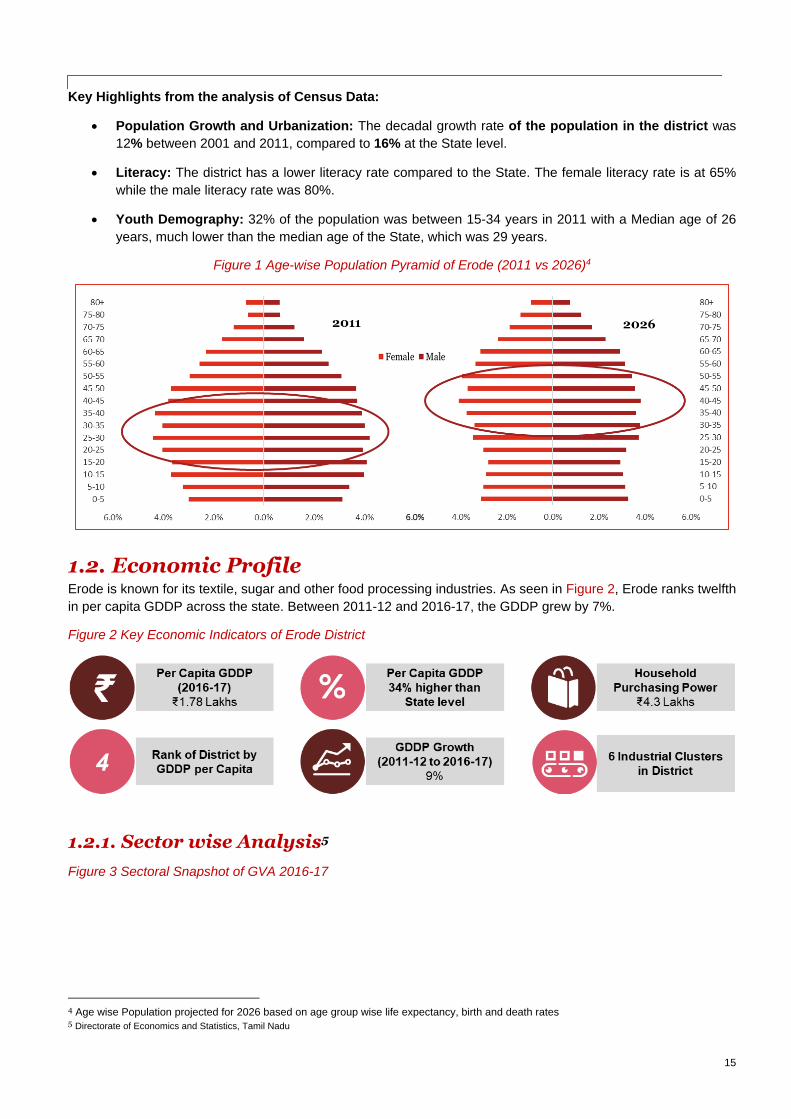
1.2. Economic Profile Erode is known for its textile, sugar and other food processing industries. As seen in Figure 2, Erode ranks twelfth
in per capita GDDP across the state. Between 2011-12 and 2016-17, the GDDP grew by 7%.
Figure 2 Key Economic Indicators of Erode District
1.2.1. Sector wise Analysis5
4 Age wise Population projected for 2026 based on age group wise life expectancy, birth and death rates 5 Directorate of Economics and Statistics, Tamil Nadu
Figure 3 Sectoral Snapshot of GVA 2016-17
16
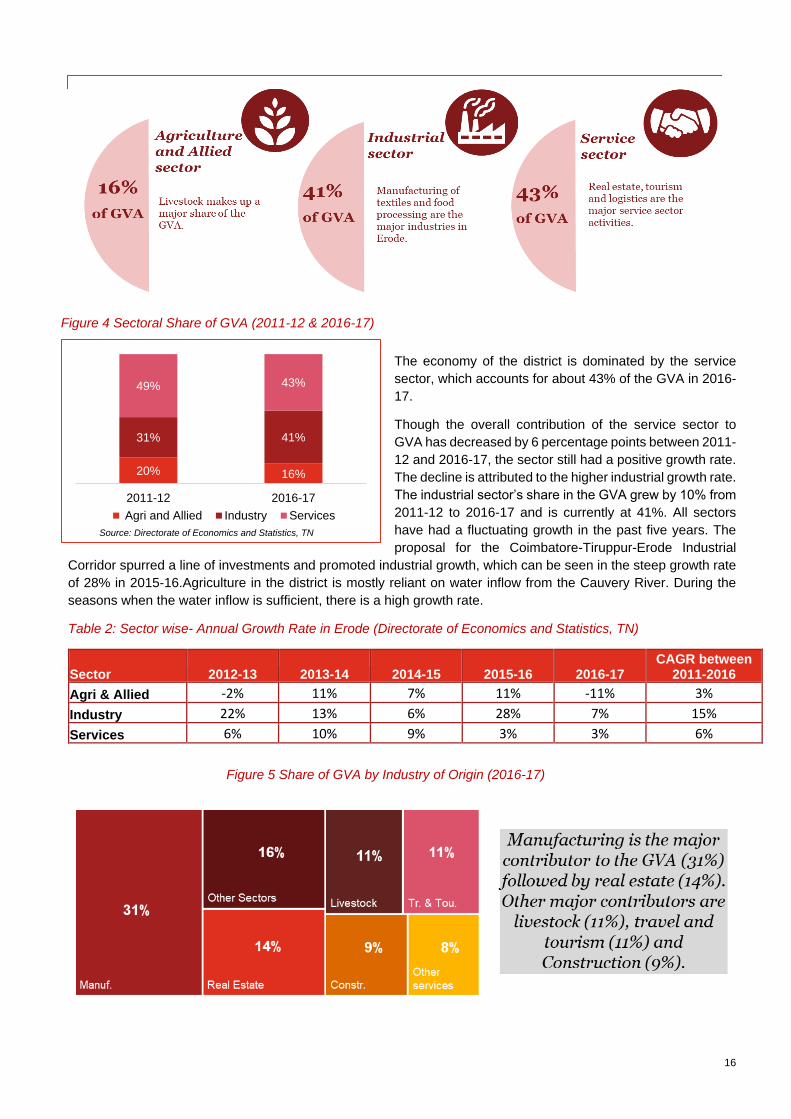
The economy of the district is dominated by the service
sector, which accounts for about 43% of the GVA in 2016-
17.
Though the overall contribution of the service sector to
GVA has decreased by 6 percentage points between 2011-
12 and 2016-17, the sector still had a positive growth rate.
The decline is attributed to the higher industrial growth rate.
The industrial sector’s share in the GVA grew by 10% from
2011-12 to 2016-17 and is currently at 41%. All sectors
have had a fluctuating growth in the past five years. The
proposal for the Coimbatore-Tiruppur-Erode Industrial
Corridor spurred a line of investments and promoted industrial growth, which can be seen in the steep growth rate
of 28% in 2015-16.Agriculture in the district is mostly reliant on water inflow from the Cauvery River. During the
seasons when the water inflow is sufficient, there is a high growth rate.
Table 2: Sector wise- Annual Growth Rate in Erode (Directorate of Economics and Statistics, TN)
Sector 2012-13 2013-14 2014-15 2015-16 2016-17 CAGR between
2011-2016
Agri & Allied -2% 11% 7% 11% -11% 3%
Industry 22% 13% 6% 28% 7% 15%
Services 6% 10% 9% 3% 3% 6%
Figure 5 Share of GVA by Industry of Origin (2016-17)
Figure 4 Sectoral Share of GVA (2011-12 & 2016-17)
Source: Directorate of Economics and Statistics, TN
20% 16%
31% 41%
49% 43%
2011-12 2016-17
Agri and Allied Industry Services

17
Agriculture and Allied Sector
Figure 6 shows the share of the different
components in the agriculture and allied sector GVA
of 2016-17. Livestock accounts for 69% of the
district GVA. Erode is also home to the specific
breed of Kangayam and Bargur cows. The
Veterinary University Training and Research center
is located here which conducts regular trainings on
livestock rearing. A cattle research station is also
located in Bargur.
The major crops grown are sugarcane, coconut, paddy and oilseeds. The turmeric grown here is of special quality
and has recently acquired its own GI tag. Tubers are also grown in the district which are processed for their starch
in the sago processing industries.
Industrial Sector
Manufacturing makes up 77% of the industrial sector
GVA and construction contributes to 22%. Though
not a significant contributor to GVA, some mining
activities are carried out in Erode. The CAGR of
manufacturing sector is 22% between 2011-12 and
2016-17. This indicates that the sector has been
growing and has potential for future growth with
relevant investments coming in.
Prominent large scale industries in the District are
cotton mills, sugar processing and steel fabrication.
Key Clusters and Traditional Industries
Leather (Erode) Oil Mill (Kangeyam, Vellakovil) Coir (Erode, Pollachi)
Moon Stone (Devangapuram) Readymade garments (Erode) Rice Mill (Kangayam)
Table 3 Profile of Manufacturing Sector from ASI Industry No. of
Units Gross Value
Added (share in
total GVA)
No. of Employees
Share of Employment
Average workers per unit
Manufacture of knitted and crocheted apparel 72 1,94,958 17,158 17% 238
Spinning, weaving and finishing of textiles 330 1,37,010 52,410 52% 159
Manufacture of other food products 38 1,18,196 7,728 8% 203
Manufacture of prepared animal feeds 14 42,341 2,241 2% 160
Manufacture of grain mill products, starches and starch products
108 21,727 1,517 2% 14
Sale, maintenance and repair of motorcycles and related parts and accessories
12 19,980 NA NA NA
Repair of fabricated metal products, machinery and equipment
22 19,281 307 0% 14
Manufacture of other textiles 62 15,412 2,559 3% 41
Manufacture of dairy products 14 13,618 2,082 2% 149
Casting of metals 8 12,785 546 1% 68
Manufacture of plastics products 17 10,293 860 1% 51
Source: Annual Survey of Industries 2014-15
Figure 6 GVA of Agriculture and Allied Sectors (2016-17)
Figure 7 Industrial Sector GVA (2016-17)
Source: Directorate of Economics and Statistics, TN
Source: Directorate of Economics and Statistics, TN
69% 29% 2%
0%
Livestock Agri. Forestry Fishing
77%
22%
1% 0%
Manuf.
Constr.
Utilities
Mining

18
According to the ASI 2014-15, most of the industries belong to the textile manufacturing sector. Manufacture of food products is also an important sector in Erode. About 52% of the industrial workforce is employed in spinning, weaving and finishing of textiles.
Services Sector
Real estate, logistics, travel and tourism are major contributors to service sector GVA. Real estate accounts for 32% of the service sector in 2016-17 and had a CAGR of 8% between 2011-12 and 2016-17. The travel and tourism industry has also been growing at a CAGR of 5%.
The major tourist attractions in the district are temples and the Sathyamangalam forest reserve which houses a wide variety of flora and fauna. The Vellode bird sanctuary also attracts tourists.
Figure 8 GVA of Services Sector (2016-17)
1.2.2. Investments and key economic drivers
Figure 9 Sector-specific growth of Credit off Take (2013-16) – RBI
The district has witnessed a growth in credit across most sectors but especially in finance, trade, and industry.
According to the data collected from the RBI, the trade sector has seen the highest credit growth at 16%. Erode is also expected to see large-scale investments mainly in textile and food processing.
Existing Industrial Estates
• Govt Industrial Estate, Erode
• SIDCO, Nanjai Uthukuli, Perundurai
• SIPCOT, Perundurai
Proposed Industrial Estate:
• SIDCO, Rasathivalasu, Vadamugam Kangayampalayam, Chennimalai
❑ Proposed Industrial Estate & Plants:
❑ SIDCO, Rasathivalasu, Vadamugam Kangayampalayam, Chennimalai
Source: Directorate of Economics and Statistics, TN
32% 25% 18% 9% 8% 5% 3%
Real Estate Tr. & Tou. Other services Logistics BFSI Pub Admin Comm.

19
Figure 10 Large-scale Investments in Erode6
1.3. Labour Market Profile7
The overall labourforce participation rate is 67% and worker population ratio is 66% - higher at the district level than at state. About 54% of workers in the district are casual labourers and 25% are self-employed. The overall unemployment rate is at 3% but the youth (15-29 years) unemployment rate is much higher at 11%.
Figure 11 Key Labour Market Indicators8
The education-level classification of the district population reveals that a significant working age population is not in the labour force. Among graduates, 58% are not in the labour force. The youth survey conducted in the district also shows that about 25% of the overall respondents are in neither in education, nor in employment nor in any training. Women in the district have lesser tendency to seek employment.
About 39% are involved in agriculture and allied activities, 22% in manufacturing and 19% in trade related activities.
6 CAPEX data 7 Analysis in this section are based on the District Level Estimates, EUS, 2013-14, Labour Bureau 8 District Level Estimates, EUS, 2013-14, Labour Bureau
Figure 12 Distribution of Working status by Qualification: District Level Estimates
72%
38%
69%
58%
40%
0%
2%
11%
10%
15%
28%
60%
21%
33%
45%
Secondary and below
Higher secondary
Diploma/ certificate
Graduate
Post graduate & above
Employed Unemployed Not in Labour Force

20
Figure 13 Sector-wise share of Employment
Source: District Level Estimates, EUS, 2013-14, Labour Bureau
1.4. Education and Skill Development Profile
1.4.1. Education Profile
With respect to school education, Erode is one of the preferred districts. The Gross Enrolment Ratio at both Primary and Upper Primary are higher than the state averages. The dropout rates is also lower – 0.5% at the primary level and 2.1% at the upper primary level.
Erode has 16 ITIs. There are also 9 polytechnics and 34 colleges of higher education.
Type of Education Institute No. of Institutions
Enrolment
Arts and Science Colleges 20 33,770
Pharmacy 3 1,095
Engineering 11 23,071
Polytechnics 9 10,080
ITIs 16 789
1.4.2. Vocational Education and Skill Development Profile
The skill training infrastructure of the district include skill training centres implementing schemes like TNSDC, Pradhan Mantri Kaushal Vikas Yojana (PMKVY) and Deen Dayal Upadhyaya Grameen Kaushalya Yojana (DDU-GKY) courses.
Table 4 Vocational Training under Short Term Skill Development Programs9
Scheme Sector Job Role No. of Training Centres
Pradhan Mantri Kaushal Vikas Yojana
Logistics Documentation Assistant 1
Handicrafts and Carpet Handloom Weaver (Carpets) 1
Media and Entertainment Makeup Artist 2
Hairdresser 1
Retail Retail Sales Associate 1
Trainee Associate 1
Apparel Self Employed Tailor 1
Export Assistant 1
IT-ITeS CRM Domestic Non-Voice 1
Green Jobs Solar PV Installer - Electrical 1
TNSDC Automotive Repair Basic Automotive Servicing 2 Wheeler 3
Wheeler 1
9 2017-2018 training year report.
39% 22% 19% 7% 5% 4%
Agriculture, forestry and fishing Manufacturing
Wholesale and retail trade Construction
Financial and insurance, Real estate Public administration and other social work activities
Figure 14 GER and Drop-out Rates - DISE
21
Basic Automotive Servicing 4 Wheeler 2
Health Care
Emergency Medical Technician Basic 1
Assistant Physiotherapist 1
Operating Theatre Technician 1
Radiology Technician 1
Dental Assistant 1
Medical Laboratory Technician 1
Refractionist 1
Pharmacy Assistant 1
General Duty Assistant 3
Production And Manufacturing
CNC Turning 1
Garment Making Hand Embroider 3
Tailor (Basic Sewing Operator) 2
Leather Others Cutting And Tailoring 1
Electrical Electrician Domestic 1
Information And Communication Technology
Accounts Assistant Using Tally 2
Banking & Accounting Accounting 2
Apparel Sewing Machine Operator 1
Capital Goods Draughtsman Mechanical 1
Electronics Field Technician Networking And Storage 1
Electronics Mobile Phone Hardware Repair Technician 1
Insurance Insurance Sales Associate 1
Gem And Jewellery Foundation Course For Jewellery 1
BFSI Accounts Executive Receivables & Payable) 1
Agriculture Organic Grower 1
Beauty And Wellness Mehendi Specialist 1
IT/ITES Domestic Data Entry Operator 1
Business & Commerce
Junior Human Resource Associate 1
Small Office/ Home Office Coordinator 1
Junior Marketing Associate 1
Iron & Steel EOT/ Overhead Crane Operator 1
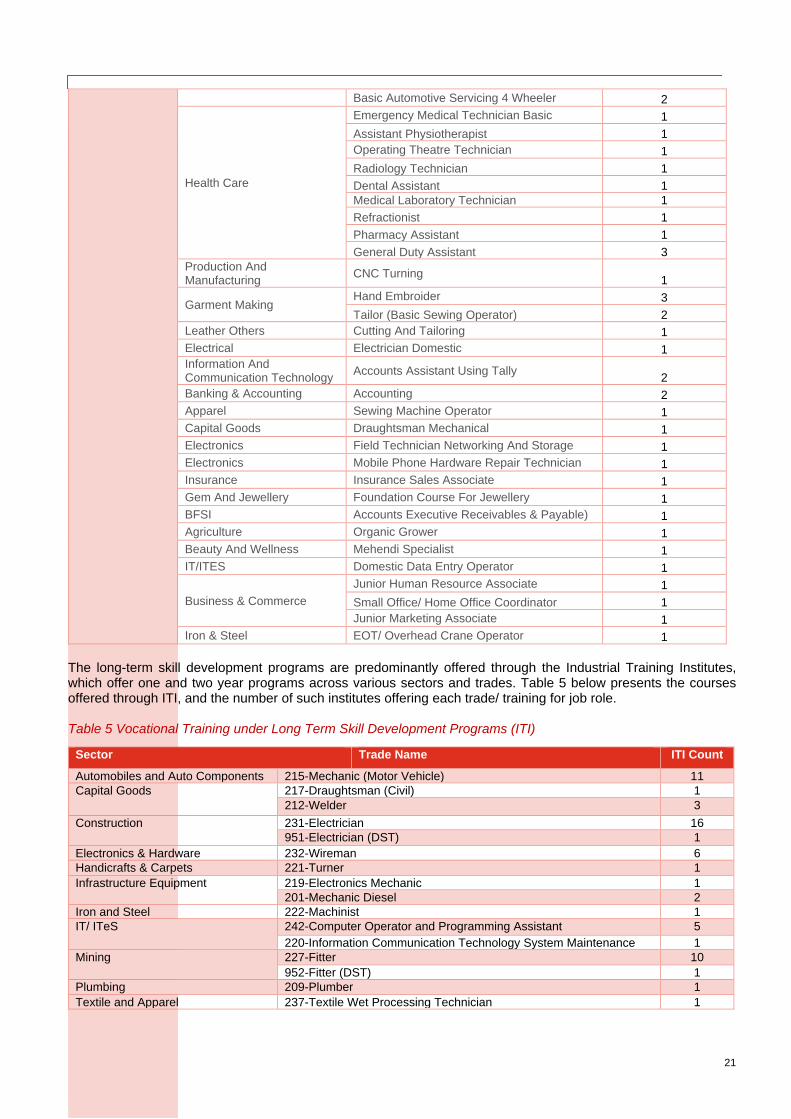
The long-term skill development programs are predominantly offered through the Industrial Training Institutes, which offer one and two year programs across various sectors and trades. Table 5 below presents the courses offered through ITI, and the number of such institutes offering each trade/ training for job role. Table 5 Vocational Training under Long Term Skill Development Programs (ITI)
Sector Trade Name ITI Count
Automobiles and Auto Components 215-Mechanic (Motor Vehicle) 11
Capital Goods
217-Draughtsman (Civil) 1
212-Welder 3
Construction
231-Electrician 16
951-Electrician (DST) 1
Electronics & Hardware 232-Wireman 6
Handicrafts & Carpets 221-Turner 1
Infrastructure Equipment
219-Electronics Mechanic 1
201-Mechanic Diesel 2
Iron and Steel 222-Machinist 1
IT/ ITeS
242-Computer Operator and Programming Assistant 5
220-Information Communication Technology System Maintenance 1
Mining
227-Fitter 10
952-Fitter (DST) 1
Plumbing 209-Plumber 1
Textile and Apparel 237-Textile Wet Processing Technician 1
22
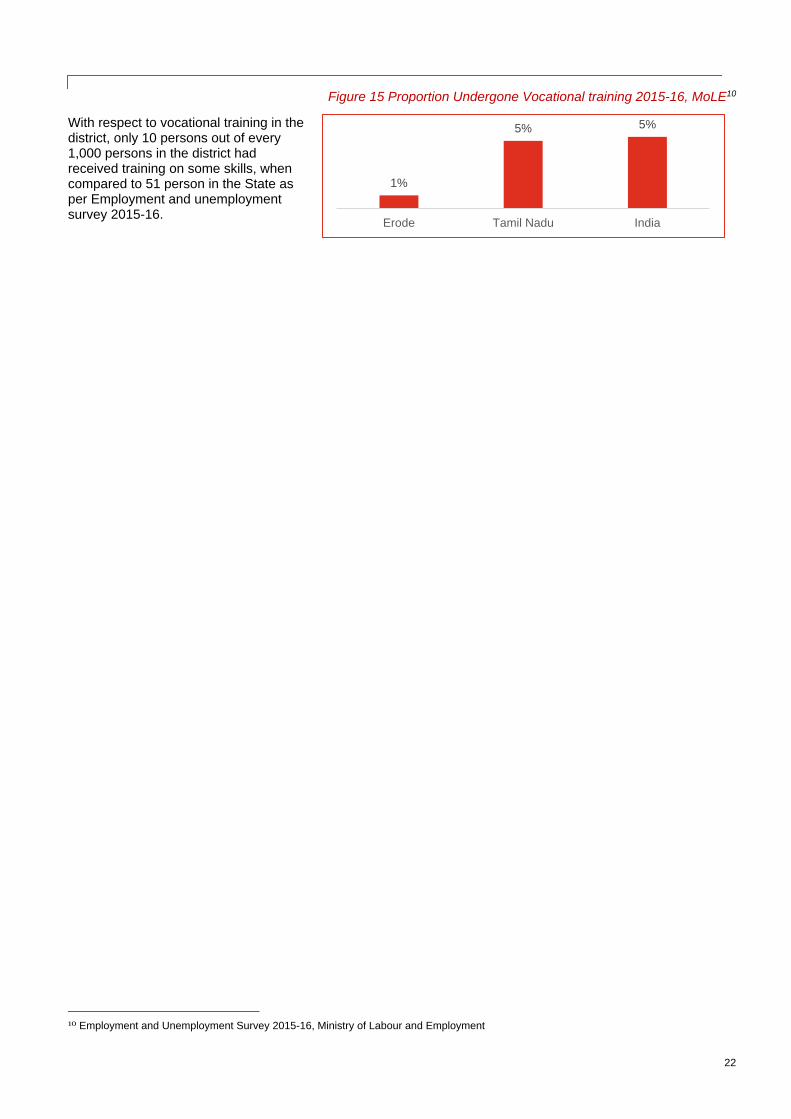
Figure 15 Proportion Undergone Vocational training 2015-16, MoLE10
With respect to vocational training in the district, only 10 persons out of every 1,000 persons in the district had received training on some skills, when compared to 51 person in the State as per Employment and unemployment survey 2015-16.
10 Employment and Unemployment Survey 2015-16, Ministry of Labour and Employment
1%
5% 5%
Erode Tamil Nadu India

23
2. Youth Perspective
In order to understand the youth perspective, a survey was administered across the district. The detailed survey captures the current status of the respondent, their economic and educational background, their preference in employment and skill training.
2.1. Profile of Respondent Youth
A total of 360 youth in the age group of 15-34 years were covered through a structured household survey tool. This covered a sample of six blocks out of the 14 blocks in the district – Ammapet, Talavedi, Andiyur, Erode, Bhavani and Perundurai. About 46% of the overall respondents were female and about 53% were from rural areas. The survey has tried to achieve a balanced representation of various socioeconomic and demographic characteristics of the population.
Figure 16 Respondent Profile of Youth Aspiration Survey
24
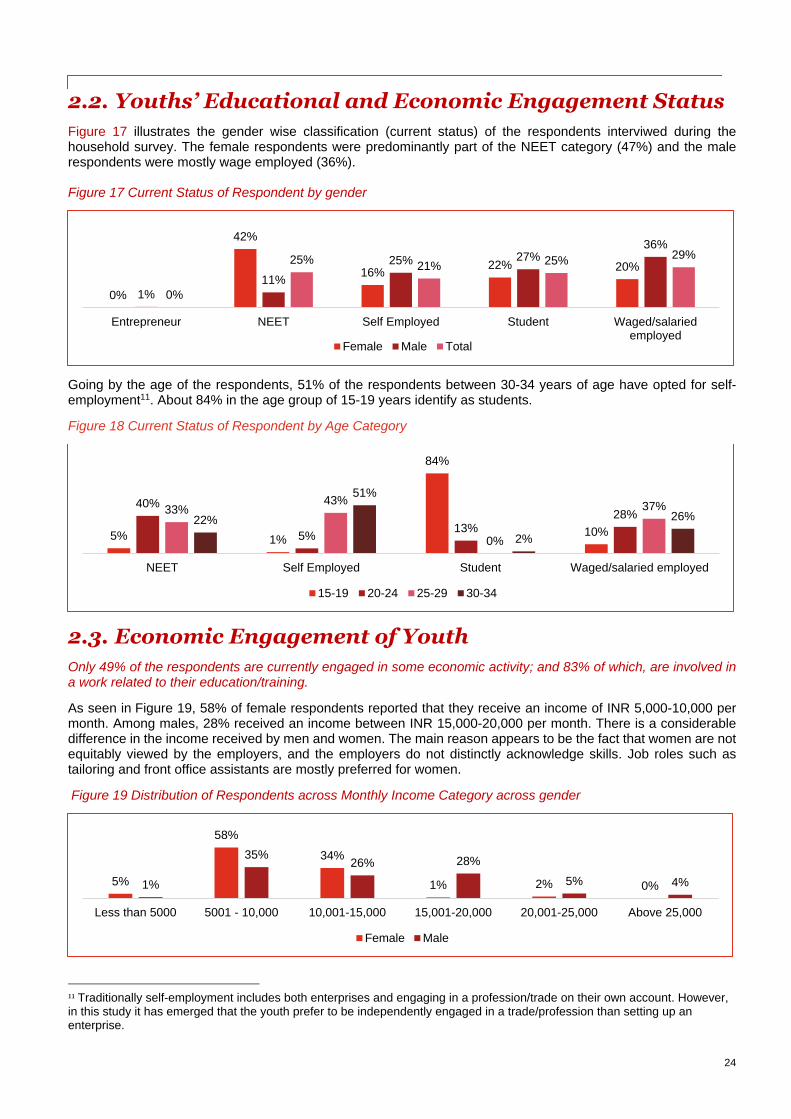
2.2. Youths’ Educational and Economic Engagement Status
Figure 17 illustrates the gender wise classification (current status) of the respondents interviwed during the household survey. The female respondents were predominantly part of the NEET category (47%) and the male respondents were mostly wage employed (36%). Figure 17 Current Status of Respondent by gender
Going by the age of the respondents, 51% of the respondents between 30-34 years of age have opted for self-employment11. About 84% in the age group of 15-19 years identify as students.
Figure 18 Current Status of Respondent by Age Category
2.3. Economic Engagement of Youth
Only 49% of the respondents are currently engaged in some economic activity; and 83% of which, are involved in a work related to their education/training.
As seen in Figure 19, 58% of female respondents reported that they receive an income of INR 5,000-10,000 per month. Among males, 28% received an income between INR 15,000-20,000 per month. There is a considerable difference in the income received by men and women. The main reason appears to be the fact that women are not equitably viewed by the employers, and the employers do not distinctly acknowledge skills. Job roles such as tailoring and front office assistants are mostly preferred for women.
Figure 19 Distribution of Respondents across Monthly Income Category across gender
11 Traditionally self-employment includes both enterprises and engaging in a profession/trade on their own account. However, in this study it has emerged that the youth prefer to be independently engaged in a trade/profession than setting up an enterprise.
0%
42%
16%22% 20%
1%
11%
25% 27%36%
0%
25%21% 25%
29%
Entrepreneur NEET Self Employed Student Waged/salariedemployed
Female Male Total
5% 1%
84%
10%
40%
5%13%
28%33%43%
0%
37%22%
51%
2%
26%
NEET Self Employed Student Waged/salaried employed
15-19 20-24 25-29 30-34
5%
58%
34%
1% 2% 0%1%
35%26% 28%
5% 4%
Less than 5000 5001 - 10,000 10,001-15,000 15,001-20,000 20,001-25,000 Above 25,000
Female Male

25
The table below gives the employment category of respondents according to their educational qualification. Respondents with a low level of education (primary and below) are predominantly employed in farm activities (50%). About 30% of diploma holders claim to be employed as unskilled workers.
Table 6 Education Qualification of Respondents and Employment Type*
Primary and below
Upper Primary
Secondary Higher secondary
Diploma Graduate Post Graduate
Farm Activities 50% 28% 9% 2% - - -
Livestock 0% 7% - - - - -
Unskilled worker 25% 34% 28% 33% 30% 4% 11%
Salaried Employment (teacher, government official, etc.)
- 3% 8% 15% 14% 54% 67%
Skilled worker (tailor, mason, electrician, plumber etc.)
- 24% 35% 27% 35% 18% 11%
Petty Business/ Trade/ Manufacturing
25% 14% 22% 25% 22% 22% 11%
Number of Respondents
4 29 65 55 37 50 9
*Multiple response question
2.4. Youth under NEET Category
25% of the total respondents were neither in education, nor in employment nor in any training.
About 42% of women were in the NEET category. Table 7 shows the profile of NEET category respondents based on their duration in the category and their desire to enter the workforce. Though 80% of NEET category respondents wish to work, only 48% are actively seeking work. Most males (48%) have been part of the NEET category only for the previous six months.
Table 7 NEET Category Respondents
Duration in NEET Category (n=91)
Wish to Work (n=91)
Female Male Total Female Male Total
Less than 6 months 3% 48% 13%
Yes 77% 90% 80%
6 months- 1 year 11% 29% 15% Total 54 19 73
1- 2 years 33% 0% 25% Actively Seeking Work (n=73)
2- 3 years 24% 5% 20% Female Male Total
3 - 4 years 4% 5% 4%
4 - 5 years 3% 0% 2% Yes 33% 89% 48%
More than 5 years 21% 14% 20% Total 18 17 35
2.5. Vocational Training Awareness and Experience of Youth
Only 11% of respondents are aware of government run skill development programmes and only 7 respondents out of 360 have undergone such training.
2.6. Youth Career Aspiration
The youth in the district mostly prefer to be self-employed (36%). About 28% prefer wage / salaried employment with the private sector as seen in the figure below.

26
Figure 20 Career Aspiration of Youth
The main factors determining the aspiration of the youth are Salary (wages) / Income (91%), job security (47%) and closeness to residence (35%). About 47% of the total respondents feel they are completely prepared for requirements for a job. About 46% respondents also feel that the availability of job opportunities in the district is very adequate.
Table 8 Career Aspiration - Factors, Preparedness and Availability of Jobs
Factors Determining Aspiration* (n=360)
Responses
Perception of Preparedness for Jobs (n=171)
Responses
Salary (wages) / Income 91% Completely Prepared 47%
Gender suitable role 5% Moderately Prepared 28%
Social Status 11% Somewhat prepared 14%
Traditionally Acquired Skills / Family Business
1% Not Prepared
7%
Flexible work arrangements (location, schedule)
33% No Answer/ Don’t Know 4%
Job Security 47% Availability of Job Opportunities (n=360)
Responses
Opportunities for promotion and career development
1% Neither adequate nor inadequate 5%
Closeness to Residence 35%
Somewhat adequate 9%
Somewhat inadequate 7%
Emigration Prospects 0% Very adequate 46%
Retirement Plans 5% Very inadequate 6%
Safety / Security 16% No Answer/ Don’t Know 5%
Employer provided benefits and perks 3%
*Multiple response question
Unsafe working environment, lack of local jobs and low financial strength are the major reasons given by respondents on the challenges in pursuing their desired career. About 12% also said that the pressure to get married was a reason in not being able to pursue their desired job.
Table 9 Career Aspiration – Challenges in pursuing desired career
Challenges (n=360) Responses* Challenges (n=360) Responses*
Lack of family support / social acceptance of girls being engaged in economic activity
1% Lack of jobs locally 28%
1%
26% 26% 25%
3%
44%
31%
15%
2%
36%28%
20%
Entrepreneurship Self –employment Wage/Salaried employmentwith Private Sector
Wage/Salaried employmentwith Public Sector
Female Male TotalN=360
27
Challenges (n=360) Responses* Challenges (n=360) Responses*
Pressure related to getting married 12% Lack of Soft Skills 0%
Lack of guidance / information on appropriate job available for skill levels
10% Low financial strength 14%
Lack of sufficient education qualification 11% Inadequate infrastructure to access work-place
1%
Lack of technical / vocational skills 12% Unsafe working environment 22%
Lack of work experience 2% No Challenge 30%
*Multiple response question, responses may add up to more than 100%
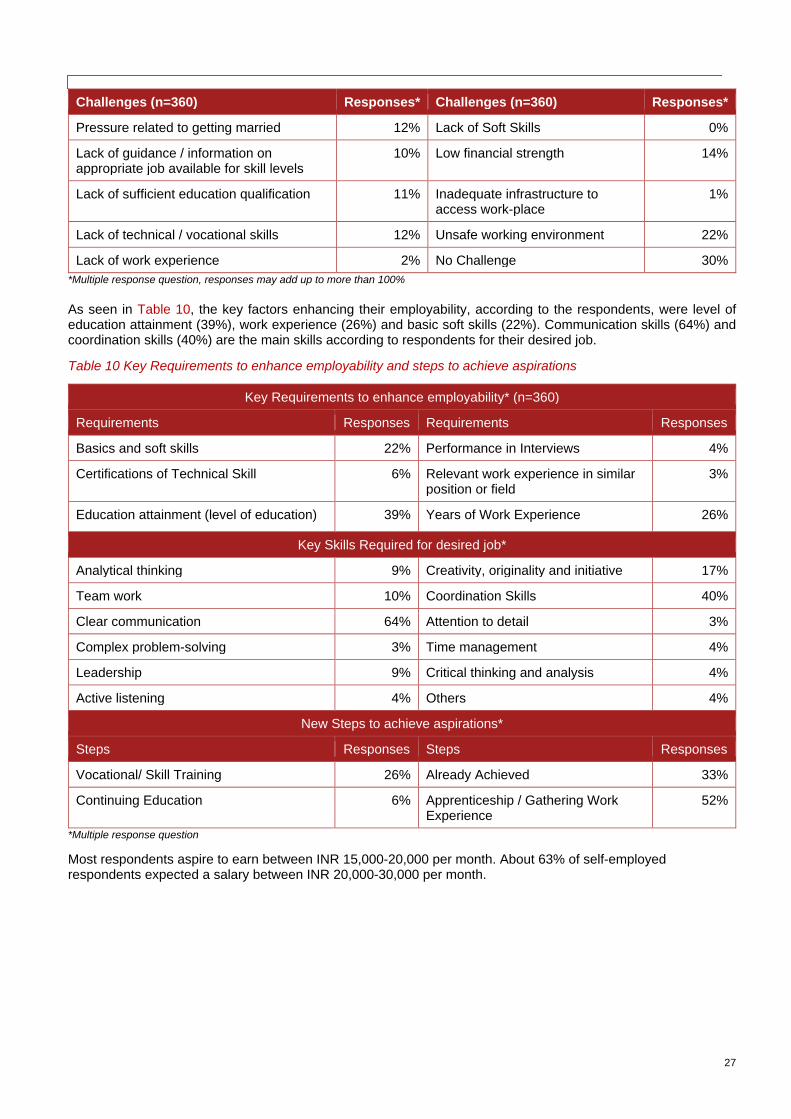
As seen in Table 10, the key factors enhancing their employability, according to the respondents, were level of education attainment (39%), work experience (26%) and basic soft skills (22%). Communication skills (64%) and coordination skills (40%) are the main skills according to respondents for their desired job.
Table 10 Key Requirements to enhance employability and steps to achieve aspirations
Key Requirements to enhance employability* (n=360)
Requirements Responses Requirements Responses
Basics and soft skills 22% Performance in Interviews 4%
Certifications of Technical Skill 6% Relevant work experience in similar position or field
3%
Education attainment (level of education) 39% Years of Work Experience 26%
Key Skills Required for desired job*
Analytical thinking 9% Creativity, originality and initiative 17%
Team work 10% Coordination Skills 40%
Clear communication 64% Attention to detail 3%
Complex problem-solving 3% Time management 4%
Leadership 9% Critical thinking and analysis 4%
Active listening 4% Others 4%
New Steps to achieve aspirations*
Steps Responses Steps Responses
Vocational/ Skill Training 26% Already Achieved 33%
Continuing Education 6% Apprenticeship / Gathering Work Experience
52%
*Multiple response question
Most respondents aspire to earn between INR 15,000-20,000 per month. About 63% of self-employed respondents expected a salary between INR 20,000-30,000 per month.

28
Figure 21 Aspired monthly salary of respondents
Figure 22 Preference for Work Location12
Location of the job seems to be a major determinant of youth’s attitudes towards work. About 93% of female respondents and 89% of males wanted a job in their own hometown. Very few preferred jobs outside the district and within the state.
Figure 23 Sources for Job Information*
The most important source for the job related information was through friends and peers (86%) and newspaper/media (57%). About 24% responded saying they also used internet and online job portals to search for jobs.
About 16% of youth aspire to work in the auto and auto components sector and 13% wish to work in healthcare. About 8% also wish to work in handloom and handicrafts.
12 Multiple Response, Sum may exceed 100%
8% 0% 1% 3%
58%
13%
63%43%
20%
63%
18%39%
5%
15%8% 10%
1% 9% 8% 5%
NEET Self-Employed Student Wage/Salaried Employee
Less than 10,000 10,001-20,000 20,001-30,000 30,001-40,000 Greater than 40,000
14%
86%
14%
57%
6%
24%
2%
4%
Parents and other family members
Friends and Peers
District Employment Office / National Career Services
Newspaper / Other media
Community
Internet and Online Job Portals
School/ University career counselling centres
Others
N=360
93%
35%
8% 1% 0%
89%
58%
14%3% 1%
InHometown
WithinDistrict
OutsideDistrict butwithin Tamil
Nadu
OutsideTamil Nadubut within
India
OutsideIndia
Female Male

29
Figure 24 Preferred Sectors*
*Multiple response question
2.7. Skill Training Preferences of Youth
About 72% of the total respondents are interested in undergoing part-time training courses. However, most are interested only in short term certificate courses of less than 6 months duration (68%).
16%
13%
8%
6%
6%
5%
5%
5%
5%
Auto and Auto Components
Healthcare Services
Handloom & Handicrafts
Food Processing
Iron & Steel
Agro-business
Building, Construction Industry
Furniture and Furnishing
Domestic Help
Figure 25 Duration of Skill Training type interested in Figure 26 Skill Training type interested in
28%
72%
Full-time
Part-time
19%
8%
5%
68%
Diploma courses (1 Year to 2Year duration)
Entrepreneurship/Self-employment specific short
term courses
Short term certificate courses(6 Months to 1 Year duration)
Short term certificate courses(less than 6 Months duration)

30
3. Employers’ and Other Stakeholders’ Perspective
The study covered employers, industrial associations and other key stakeholders to understand the demand side perspectives of skills. The information was collected through both quantitative survey and qualitative approaches including In-depth interviews and focus group discussions.
3.1. Employers’ Perspective
The survey covered 45 Industries covering fourteen sectors. The sector wise coverage of industries is given in
Table 11. Majority of industries were from the textile and apparel, plastics, food processing and the iron and steel sector. Of the overall sample, 22% were micro industries, 24% were small scale industries, 36% were medium industries and 18% were large industries.
Table 11 Sector wise coverage of Industries in Employer Survey
S.No Sector Number of Industries Surveyed
S.No Sector Number of Industries Surveyed
1. Agro-business 2 2. IT and ITES 1
3. Auto and Auto Components 1 4. Leather & Leather Goods 2
5. Building Construction Painting Industry
4 6. Textile and Apparel 9
7. Chemical & Pharmaceuticals 1 8. Tourism Travel and Hospitality 1
9. Food Processing 5 10. Machinery Equipment 4
11. Furniture and Furnishings 1 12. Plastics 7
13. Healthcare Services 1 14. Paper and Paper Products 1
15. Iron, Steel and Other Metals 5
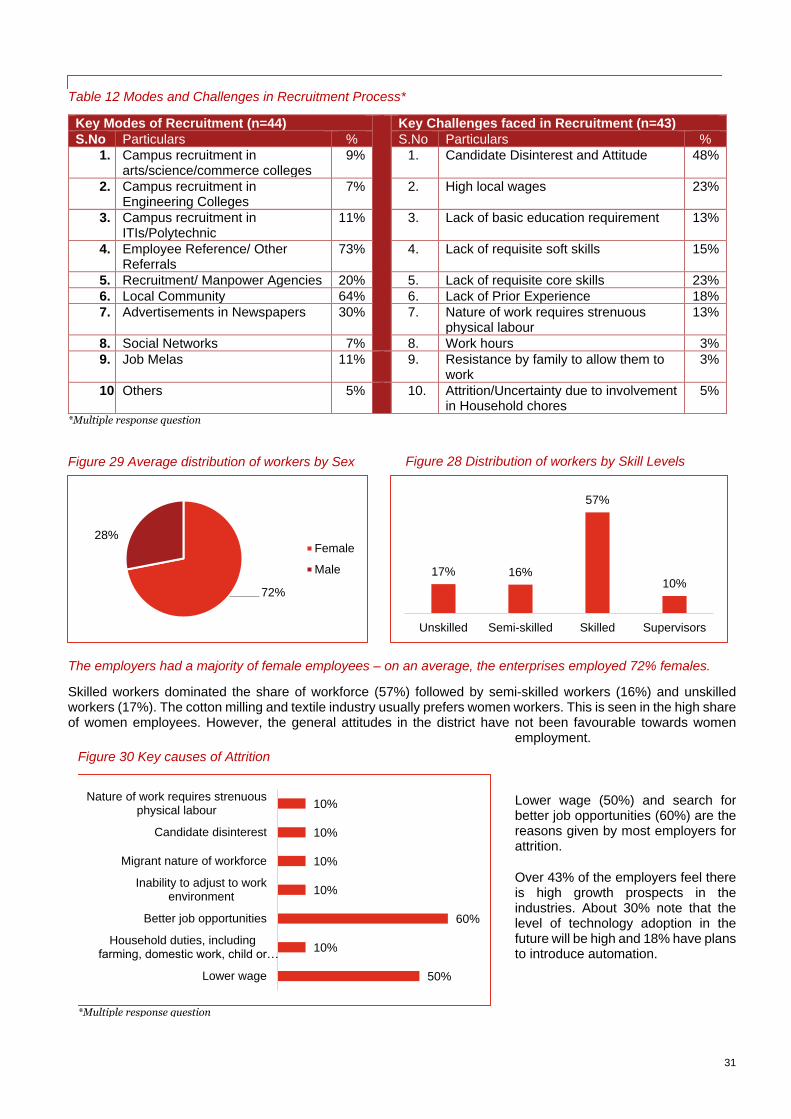
As seen in Table 12, employee reference is the major mode of recruitment (73%). Employers also use local community and media advertisements and manpower agencies for recruiting labourers. The most common challenge faced by employers was candidates’ disinterest and attitude (48%), followed by high local wages (23%) and lack of prior experience (18%).
Figure 27 Distribution of Industries by Size
Large18%
Medium36%
Small24%
Micro22%
31
Table 12 Modes and Challenges in Recruitment Process*
Key Modes of Recruitment (n=44) Key Challenges faced in Recruitment (n=43)
S.No Particulars % S.No Particulars %
1. Campus recruitment in arts/science/commerce colleges
9% 1. Candidate Disinterest and Attitude 48%
2. Campus recruitment in Engineering Colleges
7% 2. High local wages 23%
3. Campus recruitment in ITIs/Polytechnic
11% 3. Lack of basic education requirement 13%
4. Employee Reference/ Other Referrals
73% 4. Lack of requisite soft skills 15%
5. Recruitment/ Manpower Agencies 20% 5. Lack of requisite core skills 23%
6. Local Community 64% 6. Lack of Prior Experience 18%
7. Advertisements in Newspapers 30% 7. Nature of work requires strenuous physical labour
13%
8. Social Networks 7% 8. Work hours 3%
9. Job Melas 11% 9. Resistance by family to allow them to work
3%
10. Others 5% 10. Attrition/Uncertainty due to involvement in Household chores
5%
*Multiple response question
The employers had a majority of female employees – on an average, the enterprises employed 72% females.
Skilled workers dominated the share of workforce (57%) followed by semi-skilled workers (16%) and unskilled workers (17%). The cotton milling and textile industry usually prefers women workers. This is seen in the high share of women employees. However, the general attitudes in the district have not been favourable towards women
employment.
Lower wage (50%) and search for better job opportunities (60%) are the reasons given by most employers for attrition.
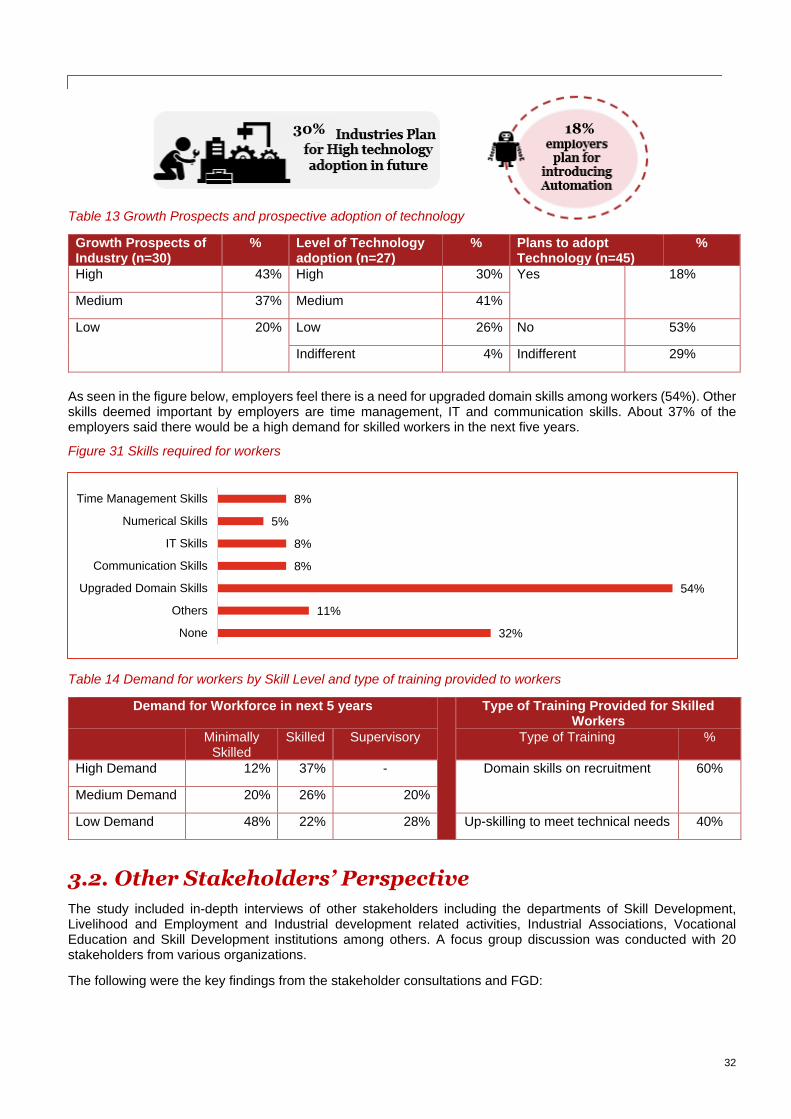
Over 43% of the employers feel there is high growth prospects in the industries. About 30% note that the level of technology adoption in the future will be high and 18% have plans to introduce automation.
Figure 29 Average distribution of workers by Sex Figure 28 Distribution of workers by Skill Levels
Figure 30 Key causes of Attrition
*Multiple response question
50%
10%
60%
10%
10%
10%
10%
Lower wage
Household duties, includingfarming, domestic work, child or…
Better job opportunities
Inability to adjust to workenvironment
Migrant nature of workforce
Candidate disinterest
Nature of work requires strenuousphysical labour
72%
28%Female
Male 17% 16%
57%
10%
Unskilled Semi-skilled Skilled Supervisors
32
Table 13 Growth Prospects and prospective adoption of technology
Growth Prospects of Industry (n=30)
% Level of Technology adoption (n=27)
% Plans to adopt Technology (n=45)
%
High 43% High 30% Yes 18%
Medium 37% Medium 41%
Low 20% Low 26% No 53%
Indifferent 4% Indifferent 29%
As seen in the figure below, employers feel there is a need for upgraded domain skills among workers (54%). Other skills deemed important by employers are time management, IT and communication skills. About 37% of the employers said there would be a high demand for skilled workers in the next five years.
Table 14 Demand for workers by Skill Level and type of training provided to workers
Demand for Workforce in next 5 years Type of Training Provided for Skilled Workers
Minimally Skilled
Skilled Supervisory Type of Training %
High Demand 12% 37% - Domain skills on recruitment 60%
Medium Demand 20% 26% 20%
Low Demand 48% 22% 28% Up-skilling to meet technical needs 40%
3.2. Other Stakeholders’ Perspective
The study included in-depth interviews of other stakeholders including the departments of Skill Development, Livelihood and Employment and Industrial development related activities, Industrial Associations, Vocational Education and Skill Development institutions among others. A focus group discussion was conducted with 20 stakeholders from various organizations.
The following were the key findings from the stakeholder consultations and FGD:
32%
11%
54%
8%
8%
5%
8%
None
Others
Upgraded Domain Skills
Communication Skills
IT Skills
Numerical Skills
Time Management Skills
30% 18%
Figure 31 Skills required for workers

33
Table 15: Qualitative findings in Erode
S No Topic Responses
1. Awareness of government skill training programs/ jobs/ job melas
• The workforce is not fully aware of Government-sponsored skill training programmes. There is also not much interest to attend skilling.
2. Education- schools, ITI/ Polytechnics/ Engineering colleges in the district
• Most candidates in the district do not prefer a diploma or ITI education.
• The enrolment levels in ITIs is only three fourth the capacity. Low student attendance and dropouts has also been a major issue.
3. Candidate Attitudes/ Abilities
• Candidates aspire for employment within their hometown for jobs.
• Candidates prefer to work in the informal sector and are not willing to pursue any job that involves working in the shop floor.
4. Women Employment • Women are mostly involved in the textile spinning and garment manufacturing industry.
• Due to long hours of work in the textile sector, there needs to be additional benefits for workers such as better working conditions, crèches for children, etc.
5. Migrant workers • Migrant workers are majorly employed in the textile mills.
• Skilling in these trades is necessary as most of them join as unskilled workers.
• Most migrants in Erode are from the southern districts of Tamil Nadu. There are also migrants from East Indian states working as unskilled workers.
6. Skill Gaps • There is a need for skilled persons in food processing and textile sector.

34
4. Skill Gap Analysis
4.1. Skill Gap Assessment - Incremental Demand13 for Skilled & Semi Skilled Workforce
In the next 6 years, Erode will see a demand for about 1.4 lakh workers. Major sectors that drive the demand are manufacturing, construction, transportation and real estate.
Table 16 Sector wise Incremental Demand for Skilled and Semi Semi-Skilled Workers between 2019 and 2025
Sectors
Incremental Demand for Skilled Workers
Incremental Demand for Semi Skilled Workers
Total Incremental
Demand
2019-21 2022-25 Total 2019-21 2022-25 Total Total
Agriculture
32
42
74
221
295
516 590
Allied Activities
137
194
330
956
1,355
2,312 2,642
Mining and quarrying
11
15
25
18
24
42 67
Manufacturing
9,679
14,463
24,143
19,359
28,927
48,285 72,428
Electricity, gas, water supply and other utility services
(24)
(31)
(55)
(48)
(62)
(110) (165)
Construction
1,179
1,837
3,016
2,947
4,593
7,539 10,555
Trade & Repair Services
606
850
1,455
2,096
2,941
5,037 6,492
Hotels and restaurants
248
347
595
480
673
1,152 1,747
Transportation and storage;
602
852
1,454
1,445
2,044
3,489 4,943
Communication and services related to broadcasting
1,282
1,975
3,257
641
988
1,629 4,886
Financial and insurance activities
1,738
2,710
4,448
869
1,355
2,224 6,672
Real estate, ownership of dwelling and business services
290
437
727
725
1,091
1,817 2,544
Public Administration
155
213
369
124
171
295 664
Education; Healthcare & Social Work Activities
3,123
4,708
7,830
2,498
3,766
6,264 14,095
Arts, entertainment and recreation
609
894
1,503
487
715
1,202 2,705
Other Services
967
1,420
2,387
774
1,136
1,910 4,297
Total Demand
22,699
33,953
56,652
35,274
52,471
87,745 144,397
Total Supply 11,067
14,756
25,823
16,598
22,131
38,729 64,552
Total Skill Gap
11,632
19,197
30,829
18,675
30,340
49,015 79,844
As seen in the table, the major demand is from the growing textile industry. A skill gap of about 80,000 workers will be seen in the next six years. In order to ensure this growing economy is sustained, skill trainings have been proposed across these sectors.
13 Incremental Demand Estimates the additional stock of workforce that are to be created given the expected Economic Conditions in the
period of study. This may help in estimating requirement for fresh trainings.

35
5. District Action Plan and Recommendations
5.1. Key Findings and Inferences
Some major findings from the study are as follows:
• Youth Attitudes: There is a strong disinterest among youth to move out of their hometown for work. Despite the availability of employment opportunities across the district, youth do not stay for beyond 6 months in a job and return to their hometowns.
• Gig work: An increasing number of youth are more interested in the cab driving, food service delivery and other service sector work that allows for flexible timings. Even graduates and diploma holders prefer these jobs as shop floor work is disliked by all.
• Agricultural skill training: More people are moving out of agriculture jobs (farming and casual labour). As the number of workers reduce, there is a need for mechanisation and adoption of newer practices with the latest technology. Skill training in agriculture should focus on that as the agricultural produce is the backbone for the food processing sector in the district.
5.2. District Action Plan
The district level training projects below suggests the potential areas for skill development interventions and job opportunities in the future. It identifies the potential job roles mapped with NSQF linked QPs and the potential of employment opportunities over the next six years with a focus on youth. The job roles have been shortlisted based on the analysis of findings from the skill gap analysis, secondary research, youth aspiration survey, enterprise survey, district level consultations and discussions with industry associations.
The below table presents the summary of training projects for Erode:
Table 17 Summary of Trainings
S No Sector Trades Target (Persons)
Budget (₹)
1. Agriculture and allied
• Mango grower
• Banana farmer
• Organic Grower
• Ripening Chamber Operator
• Paddy Cultivator
• Tuber Crop Cultivator
• Micro irrigation technician
• Coconut Grower
2,000 ₹2.24 Crores
2. Fabrication • Fitter – Fabrication
• Assistant Manual Metal Arc Welder
• Assistant Oxy fuel gas cutter
• CNC Setter cum operator – Turning
• Draughtsman – Mechanical
3,000 ₹8.38 Crores
3. Textile and Apparel
• Industrial Sewing Machine Operator
• Power Loom Operator
• Packing Checker
• Knotting Machine Operator
• Automatic shuttle loom operator
• Compacting Machine Operator
40,000 ₹6.51 Crores

36
S No Sector Trades Target (Persons)
Budget (₹)
• Fabric Mender
4. Healthcare • General Duty Assistant
• Blood Bank Technician
• Cardiac Care Technician
• Diabetes Educator
• Emergency Medical Technician – Basic
• Medical Records & health Information Technician
1,000 ₹2.85 Crores
5. Domestic Appliance Services
• Helper Electrician
• Plumber (General)
• Field Technician – AC
• Field Technician – Refrigerator
• Field Technician – Washing Machine
• Field Technician – Other Home Appliances
3,000 ₹6.35 Crores
6. Food Processing • Fruit Ripening Technician
• Cold Storage Technician
• Multi Skill Technician (Food Processing)
• Fruit Pulp Processing Technician
• Packaging Technician
• Sago processor
6,000 ₹3.74 Crores
7. Construction • Foreman – Electrical Works (Construction)
• Metal Inert Gas/Metal Active Gas/Gas Metal Arc Welder (MIG/MAG/GMAW)
• Mason Marble, Granite and Stone
• Foreman Wet Finishing and Flooring
• Bar Bender and Steel Fixer
• Assistant Electrician
5,000 ₹16.43 Crores
Total 20,000 ₹ 46.48 crore
Note: 1. The intended target groups are different from the eligibility criteria prescribed as part of the Qualification Pack. Target Group
refers to the preferred set of youth who stakeholders have identified are most likely to benefit from the training. This could come from the Aspirations expressed in the Quantitative Survey, feedback from Industry and Govt. Stakeholders. For instance, though a training in handicrafts might require only 5th grade as an eligibility- criteria, the target group would be rural women in a cluster. TNSDC and the TSPs can continue to use the minimum criteria as mentioned in the Qualification Pack; however, qualifications that may constrain an interest-group may appropriately considered on a case-to-case basis (as approved by TNSDC).
2. The QP NOS reference numbers and the training hours have been taken as per the latest QP NOS compilation (as on 17th October 2019). However, in the same compilation, some job roles do not have training hours mentioned. In such cases, we have taken the average training hours for the sector and NSQF level within the sector and applied those as notional hours. We have also used insights from field consultations to arrive at training hour estimates which to reflect the market requirements.
3. An attempt was made to map each proposed job role with a QP NOS reference number. In the cases where accurate mapping has not been possible, we have mapped the job role with the nearest QP NOS reference number. In cases where we have proposed new job roles, we have indicated that a QP NOS reference is to be designed for the same.
4. The Cost of Training has been calculated using the following method: Each job role has training hours, training target (persons), and a cost category. The cost category has been determined by the National Skills Qualification Framework (NSQF) with respect to the level of capital expenditure and operational expenditure for imparting the course aligned to that specific job role. Therefore, each cost category corresponds to a particular cost norm calculated per trainee per hour. The calculations have been done as per the Government order (H-22011/2/2014-SDE-III) issued by MSDE on 4th January 2019. The categories are defined as follows:
• INR 42.40 for Category-I
• INR 36.30 for Category -II
• INR 30.30 for Category-III The Cost of training in the project shelves represents the calculation of: (training target × training hours × per hour cost) + (training target × number of days of training × INR 100). Where:

37
Number of days of training = training hours / 8 Transportation costs per trainee per day = INR 100
To the figures arising from the above formula, the training and assessment costs (INR 1,000 per trainee × training target for
the whole project) has also been added. The total training cost for each project arrived through such a process has been
added to the summary table above.

38
The training projects are described below:
Table 18 Training Project 1: Agriculture and allied sector
Name of the Project: Agriculture and allied sector training
Key Economic Drivers:
• Agricultural products directly support the food processing sector in Erode. The food processing sector is set to grow with a new mega food park.
Key Partners: Dept. of Horticulture, Dept. of Agriculture
Job Roles: NSQF Level
NSQF Codes
Cost Category Duration
of Training
Target Group
Training Target
(People)
Cost of Training (₹)
Mango grower 4 AGR/Q0302 2 2oo hours Class V Pass
200 ₹0.2 Crores
Banana farmer 4 AGR/Q0301 2 2oo hours 200 ₹0.2 Crores
Organic Grower 4 AGR/Q1201 2 2oo hours 300 ₹0.29 Crores
Ripening Chamber Operator
4 AGR/Q7504 1 2oo hours 300 ₹0.33 Crores
Paddy Cultivator 4 AGR/Q0101 2 2oo hours 200 ₹0.2 Crores
Tuber Crop Cultivator
4 AGR/Q0403 2 2oo hours 200 ₹0.2 Crores
Micro irrigation technician
4 AGR/Q1002 1 2oo hours 400 ₹0.44 Crores
Coconut Grower 4 AGR/Q0503 2 2oo hours 200 ₹0.2 Crores
Total Training Cost 2,000 ₹2.04 Crores
Total Assessment and Certification cost (₹1,000 per candidate) ₹0.2 Crores
Total cost ₹2.04 Crores

39
Table 19 Training Project 2: Fabrication
Name of the Project: Training in Capital Goods – Metal and Engineering
Key Economic Drivers:
• Erode has large-scale units in steel fabrication • There is a constant need for skilled workers in this sector.
Key Partners: DMW CNC Centre
Job Roles: NSQF Level
NSQF Code Cost
Category
Duration of
Training Target Group
Training Target
(People)
Cost of Training
(₹)
Fitter – Fabrication
3 CSC/ Q0303 1 500 hours 10th Class Pass
600 ₹ 1.65 Crores
Assistant Manual Metal Arc Welder
4 CSC/ Q0204 1 500 hours
10th Class Pass
400 ₹ 1.1 Crores
Assistant Oxy fuel gas cutter
3 CSC/ Q0203 1 300 hours 5th Class Pass
300 ₹ 0.5 Crores
CNC Setter cum operator – Turning
4 CSC/ Q0121 1 600 hours
10th Class Pass,
1,000 ₹ 3.29 Crores
Draughtsman – Mechanical
3 CSC/ Q0402 1 400 hours 10th Class Pass
700 ₹ 1.54 Crores
Total training cost 3,000 ₹ 8.08 Crores
Total Assessment and Certification cost (₹1,000 per candidate) ₹ 0.30 Crores
Total cost ₹ 8.38 Crores
40
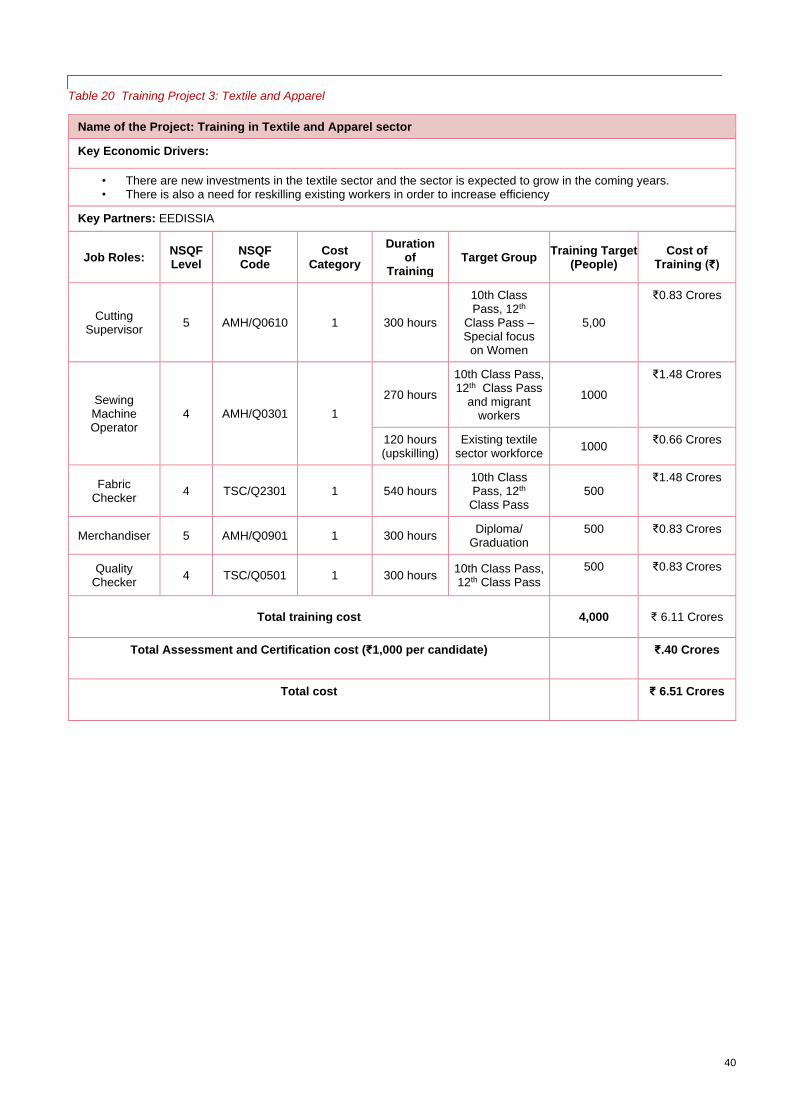
Table 20 Training Project 3: Textile and Apparel
Name of the Project: Training in Textile and Apparel sector
Key Economic Drivers:
• There are new investments in the textile sector and the sector is expected to grow in the coming years. • There is also a need for reskilling existing workers in order to increase efficiency
Key Partners: EEDISSIA
Job Roles: NSQF Level
NSQF Code
Cost Category
Duration of
Training Target Group
Training Target (People)
Cost of Training (₹)
Cutting Supervisor
5 AMH/Q0610 1 300 hours
10th Class Pass, 12th
Class Pass – Special focus
on Women
5,00
₹0.83 Crores
Sewing Machine Operator
4 AMH/Q0301 1
270 hours
10th Class Pass, 12th Class Pass
and migrant workers
1000
₹1.48 Crores
120 hours (upskilling)
Existing textile sector workforce
1000 ₹0.66 Crores
Fabric Checker
4 TSC/Q2301 1 540 hours 10th Class Pass, 12th
Class Pass 500
₹1.48 Crores
Merchandiser 5 AMH/Q0901 1 300 hours Diploma/
Graduation 500 ₹0.83 Crores
Quality Checker
4 TSC/Q0501 1 300 hours 10th Class Pass, 12th Class Pass
500 ₹0.83 Crores
Total training cost 4,000 ₹ 6.11 Crores
Total Assessment and Certification cost (₹1,000 per candidate) ₹.40 Crores
Total cost ₹ 6.51 Crores
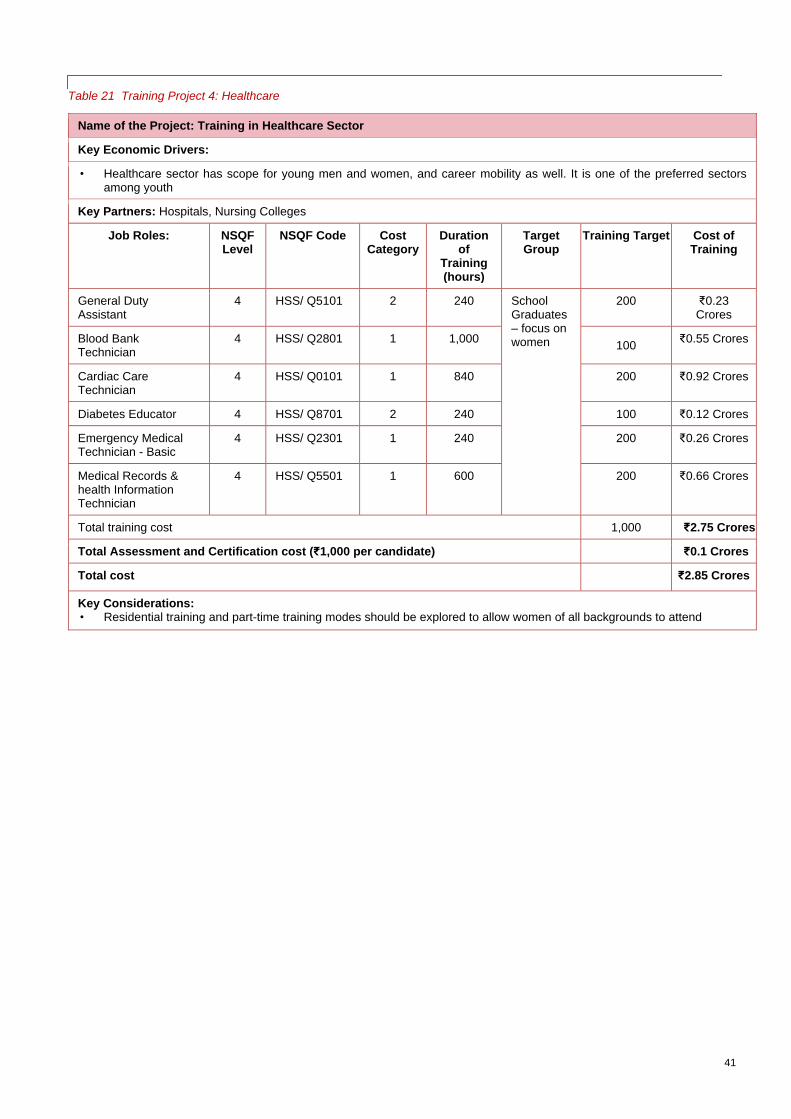
41
Table 21 Training Project 4: Healthcare
Name of the Project: Training in Healthcare Sector
Key Economic Drivers:
• Healthcare sector has scope for young men and women, and career mobility as well. It is one of the preferred sectors among youth
Key Partners: Hospitals, Nursing Colleges
Job Roles: NSQF Level
NSQF Code Cost Category
Duration of
Training (hours)
Target Group
Training Target Cost of Training
General Duty Assistant
4 HSS/ Q5101 2 240 School Graduates – focus on women
200 ₹0.23 Crores
Blood Bank Technician
4 HSS/ Q2801 1 1,000 100
₹0.55 Crores
Cardiac Care Technician
4 HSS/ Q0101 1 840 200 ₹0.92 Crores
Diabetes Educator 4 HSS/ Q8701 2 240 100 ₹0.12 Crores
Emergency Medical Technician - Basic
4 HSS/ Q2301 1 240 200 ₹0.26 Crores
Medical Records & health Information Technician
4 HSS/ Q5501 1 600 200 ₹0.66 Crores
Total training cost 1,000 ₹2.75 Crores
Total Assessment and Certification cost (₹1,000 per candidate) ₹0.1 Crores
Total cost ₹2.85 Crores
Key Considerations: • Residential training and part-time training modes should be explored to allow women of all backgrounds to attend
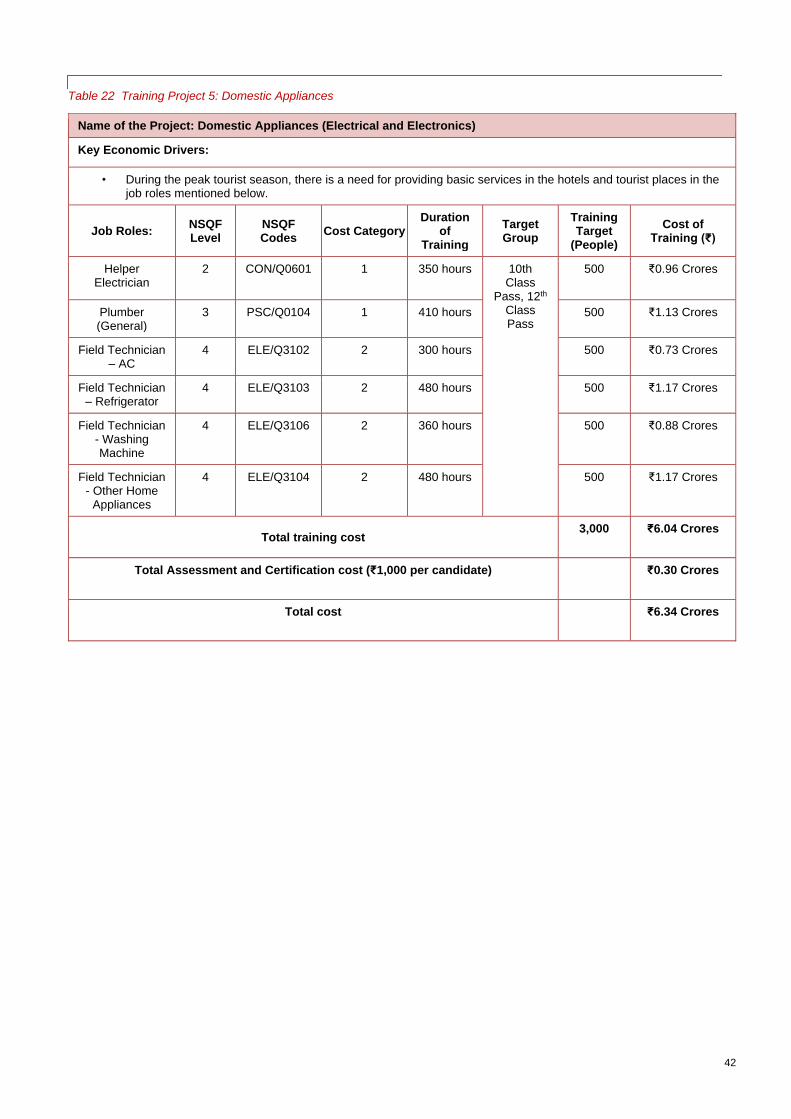
42
Table 22 Training Project 5: Domestic Appliances
Name of the Project: Domestic Appliances (Electrical and Electronics)
Key Economic Drivers:
• During the peak tourist season, there is a need for providing basic services in the hotels and tourist places in the job roles mentioned below.
Job Roles: NSQF Level
NSQF Codes
Cost Category Duration
of Training
Target Group
Training Target
(People)
Cost of Training (₹)
Helper Electrician
2 CON/Q0601 1 350 hours 10th Class
Pass, 12th Class Pass
500 ₹0.96 Crores
Plumber (General)
3 PSC/Q0104 1 410 hours 500 ₹1.13 Crores
Field Technician – AC
4 ELE/Q3102 2 300 hours 500 ₹0.73 Crores
Field Technician – Refrigerator
4 ELE/Q3103 2 480 hours 500 ₹1.17 Crores
Field Technician - Washing Machine
4 ELE/Q3106 2 360 hours 500 ₹0.88 Crores
Field Technician - Other Home
Appliances
4 ELE/Q3104 2 480 hours 500 ₹1.17 Crores
Total training cost 3,000 ₹6.04 Crores
Total Assessment and Certification cost (₹1,000 per candidate) ₹0.30 Crores
Total cost ₹6.34 Crores

43
Table 23 Training Project 6: Food processing
Name of the Project: Training in Food Processing
Key Economic Drivers:
• Food processing is a major sector in the district, and has scope for growth due to increasing incomes, population growth and urbanization.
• A new food park is planned to be constructed in the district
Key Partners: ITI/ Degree colleges, engineering colleges
Job Roles: NSQF Level
NSQF Code
Cost Category Duration of
Training (hours)
Target Group
Training Target
Cost of Training
Fruit Ripening Technician
4 FIC/Q2002 1 240 hours School and
College students
200 ₹0.26 Crores
Cold Storage Technician
4 FIC/Q7004 3 240 hours 300 ₹0.31 Crores
Fruit Pulp Processing Technician
4 FIC/Q0106 1 240 hours 300 ₹0.4 Crores
Packaging Technician
5 FIC/Q7001 1 240 hours 200 ₹0.26 Crores
Sago processor - QP to be developed
1 240 hours 500 ₹0.66 Crores
Multi Skill Technician (Food Processing)
4 FIC/Q9007 1 600 hours 500 ₹1.65 Crores
Total training cost 2,000 ₹ 3.54 Crores
Total Assessment and Certification cost (₹1,000 per candidate) ₹ 0.20 Crores
Total cost ₹ 3.74 Crores
Key Considerations: • Students in degree and engineering colleges can be targeted. • Sago processing is a major industry. A set of QP/NOS can be developed for this.

44
Table 24 Training Project 7: Construction
Name of the Project: Training in Construction Sector
Key Economic Drivers:
•
Key Partners: ITI, engineering colleges, Granite Processing units
Job Roles: NSQF Level
NSQF Code
Cost Category
Duration of Training (hours)
Target Group
Training Target
Cost of Training
Foreman – Electrical Works (Construction)
5 CON/Q0604 1 900 Youth and migrant workers
1,000 ₹4.95 Crores
Metal Inert Gas/Metal Active Gas/Gas Metal Arc Welder (MIG/MAG/GMAW)
4 CSC/Q0209 1 600 500 ₹1.65 Crores
Marble, Granite and Stone
4 CON/Q0106 1 600 500 ₹1.65 Crores
Foreman Wet Finishing and Flooring
5 CON/Q0109 1 600 1,000 ₹3.29 Crores
Bar Bender and Steel Fixer
4 CON/Q0203 1 400 1,000 ₹2.2 Crores
Assistant Electrician 3 CON/Q0602 1 400 1,000 ₹2.2 Crores
Total training cost 5,000 ₹16.43 Crores
Total Assessment and Certification cost (₹1,000 per candidate) ₹ 0.50 Crores
Total cost ₹16.93 Crores
Key Considerations: • The trainings should be inclusive of school drop-outs/ young men in NEET category and migrant workers. • Trainings can be accompanied by stipends. • Trainings can focus on sustainable practices.
5.3. Key Recommendations
Erode district is expected to have a growing economy due to the textile and food processing industry here. In the next six years, there is an emerging demand for skilled workforce in fabrication, textile, food processing and other sectors.
Recommendation on key interventions that needs to be taken up in order to foster the participation of youth in the economy are as follows:
Revision of Agriculture skill training norms Skilling courses in agriculture such as organic farming, micro irrigation technician and other farming techniques have the same requirements as other industrial training courses. This requires the skill training provider to give training in one field throughout the entire training duration as mandated by NSDC norms. However, skill training providers feel that this is restrictive for agriculture. Mandatory field visits would help farmers to understand different agricultural practices suited to different soil and land types. Development of QP/NOS for Sago Processing Sago processing is a method of extracting the starch from tuber crops. This is a major activity carried out in Erode. However, there are no specific QP/NOS that cover sago processing. This can be developed and course can be offered in this job role under the food processing sector.
Creating Awareness on Skilling:

45
The appetite for skill training is very low in the district among the local population as seen in the youth survey findings and stakeholder perspective. In order to make the youth recognise the employment opportunities that are available through skilling, better awareness sessions need to be conducted in schools, ITIs, polytechnics and colleges. Skill training can be introduced as part of the school syllabus.
Counselling sessions as part of skill training:
There is a need for improved counselling services as part of skill training. The study finds that youth attitudes (strong preference for flexible work and the need to be employed in their hometown) to employment is affecting their ability to continue employment. In order to overcome this, weekly counselling sessions can be conducted as part of the training. Alumni can be invited to give talks on the employment scenario and success stories of hardworking candidates needs to be documented and showcased by every skill training provider.

46
Appendix
A.1 Methodology for Block Selection in Youth Aspiration Survey
Sampling Design for Youth Survey A total of 360 youth were surveyed in the District, which included youth in both self-employment and wage-employment, unemployed youth, youth on education system, and youth under NEET category to get a balanced representation of various socioeconomic and demographic characteristics of the population. 1. Students from educational and training institutions: The list of General arts/science/commerce colleges, engineering colleges, polytechnic colleges and Industrial Training Institutions was obtained. A list of educational institutions was randomly sampled from the list. Of the selected institutions, a list of randomly selected students were interviewed. 2. Household Level Survey: In the selected blocks, few villages and wards were randomly selected. After consultation with the head of the village/ward, a sample of households was selected. 3. Self – Employed Youth: To cover Self – Employed Youth in the sample, a roster of beneficiaries from the Pradhan Mantri Employment Generation Programme (PMEGP) shall be randomly selected from the list which will be obtained from the concerned authority at the District level. 4. Employed in the informal sector: The youth from unorganized sector were identified at the cluster-level after obtaining and examining the list of enterprises that are not registered and those workers were doing job-work type of activities Selection of Blocks The block selection methodology involved the identification of blocks by categorizing them into High development, Medium development and Low development. The adjacent picture shows the blocks in Erode selected for the survey. The methodology is explained below: To categorize blocks, the following data points were used. 1. Count of MSME Clusters (based on
DC-MSME Report) 2. Number of SIDCO Industrial Estates 3. Number of SIPCOT Industrial
Estates 4. Credit Outstanding, 2017-18 at
Centre-level (Annual Data published by the Reserve Bank of India)
The following weights were assigned post award of marks: 1. MSME Cluster – 25% 2. SIDCO Cluster – 25% 3. SIPCOT Industrial Estate – 5% 4. Annual Centre-level Credit Data –
45%
Based on the above weights, the total score of each block was calculated. The total score was capped at 100. To classify the block as High/Medium/Low, the total score was converted into
Figure 32: Blocks Selected for Survey in Erode

47
percentile values and categorized into three groups – 0-33.33th percentile values, 33.33 to 66.67 percentile value and 66.67 to 100 percentile values. The percentile values are calculated with respect to each district as the base. Based on the percentile classification obtained, blocks were classified as follows: - 0 to 33.33 percentile value: Low - 33.33 to 66.67 percentile value: Medium - 66.67 to 100 percentile values: High
After deriving the above values for the blocks, two blocks are randomly selected from each category. High- Perundurai, Erode Medium- Bhavani Gopichettipaliayam, Andiyur Low- Talavadi, Ammapet

48
A.2 Methodology for Present and Future Labour Demand – Supply and Gap Estimation
Demand Estimation We adopted employment elasticity approach to forecast the labour demand. Employment elasticity is the measure of percentage change in employment associated with one percentage change in economic growth. The employment elasticity approach indicates the ability of an economy to generate employment opportunities. We estimated sector specific employment elasticity using historical data and assumed it to remain constant in the near future. If the estimated sector specific elasticities at district level varied significantly with national and state level estimates, we rationalized the estimated elasticities based on national and state level trends. Automation and sector specific investments are other factors considered before arriving at the final labour demand estimates in different sectors. While some jobs may become obsolete with the technological advancement, new opportunities will arise for professionals who understand technology. Therefore, demand estimates were further revised based on employer consultation. The flowchart below explains the step involved:
E1 = Employment in i-th sector in Year 2000-01 E2 = Employment in i-th sector in Year 2010-11
ΔE = Annual Growth Rate of Employment in i-th sector ΔE = [(E2/E1) ^ (1/10)-1] × 100
Source: Census 2000-01, 2010-11
G1 = Gross Value Added in i-th sector in Year 2000-01 G2 = Gross Value Added in i-th sector in Year 2010-11
ΔG = Annual Growth Rate of GVA in i-th sector ΔG = [(G2/G1) ^ (1/10)-1] × 100
Source: Department of Economics & Statistics
e = Employment Elasticity in the i-th sector in the Period 2000-10 = ΔE/ΔG ΔG* = Projected Annual Gross Value Added growth in i-th sector
ΔE* = Projected Annual Growth Rate of Employment in i-th sector. ΔE* = ΔG* × e
LDn = Projected Labour Demand in i-th sector, n Years after 2010-11 LDn = E2 × (1+ ΔE*) ^ n
Labour Demand is estimated for the period 2019-25.
Figure 33: Steps in Demand Estimation

49
Supply Estimation We estimated the average incremental supply of labour for the period 2011-16 and assume it to remain constant for the period of 2019-25. Although the population (15 & above) is increasing, the labour force participation is decreasing in the state14. The labour force participation rate may continue to follow the decreasing trend, especially for the age category 15-29 years, primarily because of increasing economic well-being, high educational aspiration and higher salary expectations. The flowchart below explains the step involved in supply estimation:
14 Report on Employment-Unemployment Survey, 2011-12, 2012-13, 2013-14, 2015-16 & 2017-18.
P1, P2 ……., P6 refers to projected population (15 &
Above) for the year 2011-16.
L1, L2 ……, L6 refers to
Labour Force
Participation Rate (15 & Above) for
the period of 2011-16.
P1 × L1, P2 × L2 …….,
P6 ×L6 refers to Projected Labour
Force for the 2011-16.
I1, I2 ……, I6 refers to Incremental Supply of Labour for the period 2011-16. I1 = (P2 ×
L2) – (P1 × L1)
Average Incremental Supply of
Labour = (I1 + I2 + I3 + I4 + I5 + I6)/6
Figure 34: Steps in Supply Estimation

50
A.3 List of Stakeholders
Table 25: List of Stakeholders
S.No Stakeholder Category
1. District Industries Centre- General Manager Govt. official
2. District Assistant Director, District Skills Department Govt. official
3. District Employment Officer Govt. official
4. SIDCO Branch Manager Govt. official
5. EEDISSIA Industry Association
6. DMW CNC Solutions Industry
7. Sree jagajothi Exports Industry
8. Prisma Garments Industry
9. Government ITI, Erode Training Service Provider
10. Erode Academy Training Service Provider
11. The Imaigal Trust Training Service Provider
12. DMW CNC Centre Training Service Provider
13. Skills India Foundation Training Service Provider

.