district of columbia water and sewer authority 20, 2015 finance and budget...overall portfolio...
TRANSCRIPT

* The DC Water Board of Directors may go into executive session at this meeting pursuant to the District of Columbia Open Meetings Act of 2010, if such action is approved by a majority vote of the Board members who constitute a quorum to discuss: matters prohibited from public disclosure pursuant to a court order or law under D.C. Official Code § 2-575(b)(1); contract negotiations under D.C. Official Code § 2-575(b)(1); legal, confidential or privileged matters under D.C. Official Code § 2-575(b)(4); collective bargaining negotiations under D.C. Official Code § 2-575(b)(5); facility security under D.C. Official Code § 2-575(b)(8); disciplinary matters under D.C. Official Code § 2-575(b)(9); personnel matters under D.C. Official Code § 2-575(b)(10);proprietary matters under D.C. Official Code § 2-575(b)(11); decision in an adjudication action under D.C. Official Code § 2-575(b)(13); civil or criminal matters where disclosure to the public may harm the investigation under D.C. Official Code § 2-575(b)(14), and other matters provided in the Act.
DISTRICT OF COLUMBIA
WATER AND SEWER AUTHORITY
Board of Directors
Finance and Budget Committee
Friday, November 20, 2015
11:00 a.m.
1. Call to Order.....................................................................................Timothy L. Firestine, Chairperson
2. October 2015 Financial Report (Attachment 1) ..................................................................Mark Kim
3. FY 2015 Net Income – Budget vs. Actual (Attachment 2) .................................................. Mark Kim
4. FY 2017 Proposed Budget (Attachment 3)..........................................................................Mark Kim
5. Digester Project Update (Attachment 4) ........................................... Leonard Benson and Mark Kim
6. Action Items..........................................................................................................Timothy L. Firestine
A. Recommendation for Approval of the FY 2017 Proposed Budget (Attachment 5)Action Item 5A: Fiscal Year 2017 Proposed Operating BudgetAction Item 5B: Fiscal Year 2016 – 2025 Ten Year Financial PlanAction Item 5C: Fiscal Year 2016 – 2025 Capital Improvement Program and Lifetime BudgetAction Item 5D: Intent to Reimburse Capital Expenditures with Proceeds of a Borrowing
B. Recommendation for FY 2015 Rate Stabilization Fund (Attachment 6)Action Item 6A: Transfer of Funds to the Rate Stabilization Fund
7. Agenda for December Committee Meeting (Attachment 7) ...............................Timothy L. Firestine
8. Executive Session*
9. Adjournment
FOLLOW-UP ITEMS – There were no Follow-up Items from the meeting held October 22, 2015.
1. Provide an update on the Digester project and fiscal impact analysis. (Chairperson Firestine)Status: Will be provided during Agenda Item 5 at the meeting.
Finance and Budget Committee - 1. Call to Order- Timothy Firestine
1

Fiscal Year 2015
Monthly Financial Report
Period Ending October 31, 2015
DEPARTMENT OF FINANCE, ACCOUNTING & BUDGET
Mark Kim, Chief Financial Officer
Gail Alexander-Reeves, Director, Budget
Robert Hunt, Director, Finance
Syed Khalil, Manager, Financial Planning & Revenues
John Madrid, Controller
Finance and Budget Committee - 2. October 2015 Financial Report (Attachment 1) - Mark Kim
2

Monthly Financial Report
Page 2
OCTOBER 2015
EXECUTIVE SUMMARY
The table below summarizes the first month of FY 2016 with approximately 8.3 percent of the fiscal year completed. At this early stage in FY 2016, we are on track with budgetary expectations and targeted performance metrics.
($ in millions)
YTD
Budget Budget Actual
Revenues (Receipts) $580.5 $48.4 $57.1 $8.7 18.0% 10%
Expenditures $541.6 $45.13 $35.6 $9.5 21.1% 7%
Capital Disbursements $549.0 $47.6 $71.7 ($24.1) (50.7%) 13%
* Straight-lined (1/12 of revised budget)
Actual % Budget
Variance
Favorable (Unfavorable)
Highlights:
∑ Budget reviews by Committees and board adoption anticipated in December∑ Effective October 1, 2015, DC Water implemented a new rate structure and a new monthly,
fixed Water System Replacement fee∑ In December, DC Water intends to close a new Extendable Municipal Commercial Paper
(EMCP) program. The EMCP program is authorized at a level of $100 million. EMCP is a cost effective means of finance in that it does not require the Authority to purchase a letter of credit from a bank to support the paper
∑ In November, DC Water intends to enter into a Forward Purchase Agreement (FPA) with Barclay’s Bank. The FPA will allow DC Water to exchange a portion of the cash set aside with the trustee for debt service to Barclays Bank in return for specified liquid securities that mature on or before the payment date to the bondholders. The rate of return earned on the securities is expected to yield a significant increase over current earnings. The term of the final agreement is expected to be set at between five and seven years.
Mark T. Kim, Chief Financial Officer
Revenues(Receipts)
Operating Expenditures
Capital Disbursements
Operating Reserve Balance
Investment Portfolio Return
Debt Service
Coverage
On Target
Caution
Over Target
Finance and Budget Committee - 2. October 2015 Financial Report (Attachment 1) - Mark Kim
3

Monthly Financial Report
Page 3
Fiscal Year-to-DateAs of October 31, 2015
*Straight-lined (1/12 of revised budget)
VARIANCE ANALYSIS FOR MAJOR REPORTED ITEMS
At this early stage of FY 2016, cash receipts are within budget. At the end of October 2015, cash receipts totaled $57.1 million, or 9.8 percent of the revised FY 2015 budget. Several categories of customers make payments on a quarterly basis, including the Federal Government (which made their first quarterly payment in October), and wholesale customers (scheduled to make their first quarter payment in November).
A B* C D = C/A E = C- B F = E/B
FY 2016 YTD YTD ACTUAL % VARIANCE $ VARIANCE %
Category BUDGET BUDGET ACTUAL BUDGET Fav/(Unfav) Fav/(Unfav)
Res. / Comm. / Multi. $311,897 $25,991 $29,778 9.5% $3,787 14.6%
Federal 62,989 5,249 14,910 23.7% 9,661 184.0%
Municipal (DC Govt.) 15,175 1,265 2,504 16.5% 1,239 98.0%
DC Housing 8,083 674 1,446 17.9% 772 114.7%
Metering Fee 10,776 898 1,087 10.1% 189 21.0%
Water System Replacement Fee (WSRF) 40,000 3,333 0 0.0% (3,333) (100.0%)
Wholesale 79,458 6,622 3,525 4.4% (3,097) (46.8%)
PILOT/ROW 20,584 1,715 2,714 13.2% 999 58.2%
All Other 31,553 2,629 1,124 3.6% (1,505) (57.3%)
TOTAL $580,514 $48,376 $57,088 9.8% $8,712 18.0%
Operating Revenues ($000’s)
Finance and Budget Committee - 2. October 2015 Financial Report (Attachment 1) - Mark Kim
4

Monthly Financial Report
Page 4
Fiscal Year-to-DateAs of October 31, 2015
*Straight-lined (1/12 of revised budget)
VARIANCE ANALYSIS FOR MAJOR REPORTED ITEMS
Total Operating expenditures for this period are in line with expectations. For this period, operating expenditures (including debt services and the right of way and PILOT fees) totaled 35.6 million or6.6 percent of the FY 2016 Board-approved budget of $542 million.
These numbers include estimated incurred but unpaid invoices and are subject to revision in subsequent months. The FY 2015 closeout process continues, which entails finalizing a number of GAAP-related accruals.
Utilities – We have 15MW of the Authority’s FY 2016 electricity load locked at an average Western Hub unit price of $40.43/MWh.
A B* C D = C/A E = B- C F = E/B
FY 2016 YTD YTD ACTUAL % VARIANCE $ VARIANCE %
Category BUDGET BUDGET ACTUAL BUDGET Fav/(Unfav) Fav/(Unfav)
Personnel $140,034 $11,670 $11,502 8.2% $168 1.4%
Contractual Services 79,244 6,604 4,015 5.1% 2,589 39.2%
Water Purchases 30,740 2,562 2,367 7.7% 195 7.6%
Supplies & Chemicals 35,951 2,996 2,289 6.4% 707 23.6%
Utilities 35,018 2,918 2,089 6.0% 829 28.4%
Small Equipment 1,465 122 66 4.5% 56 45.9%
SUBTOTAL O&M $322,452 $26,871 $22,328 6.9% $4,543 16.9%
Debt Service 174,766 14,564 11,551 6.6% 3,013 20.7%
PILOT/ROW 20,744 1,729 1,729 8.3% (0) (0.0%)
Cash Financed Capital Improvements 23,644 1,970 0 0.0% 1,970 100.0%
TOTAL OPERATING $541,606 $45,134 $35,608 6.6% $9,526 21.1%
Capital Labor (18,993) (1,583) (1,474) 7.8% (109) 6.9%
TOTAL NET OPERATING $522,613 $43,551 $34,134 6.5% $9,417 21.6%
Operating Expenditures ($000’s)
Finance and Budget Committee - 2. October 2015 Financial Report (Attachment 1) - Mark Kim
5

Monthly Financial Report
Page 5
Fiscal Year-to-DateAs of October 31, 2015
VARIANCE ANALYSIS FOR MAJOR REPORTED ITEMS
At the end of October 2015, capital disbursements are $71.7 million or 13.1 percent of the revised FY 2016 budget. Higher than planned disbursements are mainly attributable to additional vendor payments that were processed for year-end.
Capital Projects - Project performance will be reviewed in detail as part of the quarterly CIP update by DETS at the February 2016 Environmental Quality and Sewerage Services Committee meeting.
Capital Equipment - Lower than planned disbursements are driven by the unspent reserve funds in the Office of the CFO to accommodate requests for projects Authority-wide.
Washington Aqueduct (WAD) - Lower disbursements represents WAD’s plan to postpone wholesale customer billing until 2nd quarter to draw down the pre-paid balances currently in escrow and US Treasury accounts.
A B C D = C/A E = B-C F = E/B
FY 2016 YTD YTD ACTUAL % VARIANCE $ VARIANCE %
Service Area BUDGET BUDGET ACTUAL BUDGET Fav/(Unfav) Fav/(Unfav)
Non Process Facilities $9,309 $776 $523 5.6% $252 32.5%
Wastewater 168,637 14,053 25,472 15.1% (11,419) (81.3%)
Combined Sewer Overflow 223,105 18,592 24,125 10.8% (5,533) (29.8%)
Stormwater 1,263 105 44 3.5% 61 58.1%
Sanitary Sewer 34,786 2,899 7,182 20.6% (4,283) (147.8%)
Water 61,878 5,156 11,824 19.1% (6,668) (129.3%)
SUBTOTAL: CAPITAL PROJECTS $498,977 $41,581 $69,172 13.9% ($27,590) (66.4%)
Capital Equipment 39,226 3,269 2,510 6.4% 759 23.2%
Washington Aqueduct 10,838 2,709 - 0.0% 2,709 100.0%
SUBTOTAL: ADD'L CAPITAL PROGRAMS $50,063 $5,978 $2,510 5.0% 3,468 58.0%
TOTAL $549,040 $47,560 $71,682 13.1% ($24,122) (50.7%)
Capital Disbursements ($000’s)
Finance and Budget Committee - 2. October 2015 Financial Report (Attachment 1) - Mark Kim
6

Monthly Financial Report
Page 6
Fiscal Year-to-DateAs of October 31, 2015
OVERALL PORTFOLIO PERFORMANCE
∑ The operating reserve balance was $143.3 million as compared to the operating reserve level objective of $125.5 million for FY 2016
∑ Average cash balance for the month of October was $153.0 million∑ Total investment portfolio was in compliance with the Authority’s Investment Policy∑ Returns exceeded the established benchmarks for short term (less than one year) and core
(one plus years) funds∑ Operating funds interest income for October (on a cash basis) was $17,482∑ A detailed investment performance report is attached
Cash Investments and Insurance ($ in millions)
Rate Stabilization Fund Account (RSF) $32.5DC Insurance Reserve 1.0Operating Reserve Accounts 143.3
Operating Cash Balance Including RSF $176.8
Debt Service Reserve - Series 1998 23.6Bond Fund- Construction Fund 2014A 67.6Bond Fund- Construction Fund 2015A 115.7Bond Fund- Construction Fund 2015B 195.4
Total All Funds $579.1
Cash Balances
Finance and Budget Committee - 2. October 2015 Financial Report (Attachment 1) - Mark Kim
7

Monthly Financial Report
Page 7
Fiscal Year-to-DateAs of October 31, 2015
YTDAnnual YTD Actual CashBudget 8% Oct. 1, 2015 -
Cash Basis Cash Budget Oct. 31, 2015
OPERATING BUDGETCash ProvidedRetail $448,920 $37,410 $49,724 $12,314 33%Wholesale 79,458 6,621 3,525 (3,096) -47%Other 51,890 4,324 3,838 (486) -11%Total Cash Provided 580,268 48,356 57,088 8,732 18%
Operating Cash UsedPersonnel Services 121,041 10,087 9,829 258 3%Contractual Services 79,243 6,604 9,025 (2,422) -37%Chemicals & Supplies 35,951 2,996 4,518 (1,522) -51%Utilities 35,018 2,918 3,559 (641) -22%Water Purchases 30,740 2,562 2,724 (163) -6%Small Equipment 1,465 122 44 78 64% Total Operating Cash Used 303,458 25,288 29,699 (4,411) -17%
Defeasance D.S./Cash Financed Capital Construction 23,475 1,956 1,956 100%
Other Cash UsedDebt Service 157,640 13,137 11,500 1,637 12%Payment In Lieu of Taxes/Right of Way 20,744 1,729 1,729 100% Total Other Cash Used 178,384 14,865 11,500 3,366 23% Total Cash Used 505,317 42,110 41,199 911 2%
Net Cash Provided (Used) by Operating Act. 74,950 6,246 15,889 9,643
CAPITAL BUDGETCash ProvidedDebt Proceeds 238,487 19,874 31,201 11,327 57%EPA Grants 27,244 2,270 1,419 (851) -37%CSO Grants 14,000 1,167 (1,167) -100%Transfer from Operations 82,548 6,879Interest Income 998 83 1 (82) -99%Wholesale Capital Contributions 126,693 10,558 8,521 (2,037) -19% Total Cash Provided 489,969 40,831 41,141 311 1%
Cash UsedDC Water Capital Program 538,204 44,850 71,682 (26,832) -60%Washington Aqueduct Projects 10,838 903 903 100% Total Cash Used 549,042 45,754 71,682 (25,929) -57%
Net Cash/PAYGO Provided (Used) by Cap. Act. ($59,073) ($4,923) ($30,541) ($25,618)
Beginning Balance, October 1 (Net of Rate Stab. Fund) Projected $160,055 $160,055Plus (Less) Operating Surplus 74,950 6,246 15,889Wholesale Customer Refunds from Prior Years (5,500) (458)Interest Earned From Bond Reserve 247 21Transfer to Rate Stabilization Fund (19,000) (1,583)Prior Year Federal Billing Reconciliation (11,679) (973) (2,920)DC Fleet Payment 819Cash Used for Capital (59,073) (4,923) (30,541)
Balance Attributable to O&M Reserve $140,000 $143,302
CurrentOTHER CASH RESERVES BalanceRate Stabilization Fund $32,450DC Insurance Reserve 1,039
VarianceFavorable
(Unfavorable)
Cash Flow Summary ($000’s)
Finance and Budget Committee - 2. October 2015 Financial Report (Attachment 1) - Mark Kim
8

Monthly Financial Report
Page 8
APPENDIX
Operating Revenues Detail................................................................................... 9Retail Accounts Receivable................................................................................ 10Capital Disbursements Detail ............................................................................. 11Investment Report .............................................................................................. 12
Finance and Budget Committee - 2. October 2015 Financial Report (Attachment 1) - Mark Kim
9

Monthly Financial Report
Page 9
Fiscal Year-to-DateAs of October 31, 2015
($ in millions)
BREAKDOWN OF RETAIL RECEIPTS BY CUSTOMER CATEGORY($ in 000's)
Revenue Category BudgetYTD
BudgetYTD
Actual YTD % of Budget
Residential, Commercial, and Multi-family $311.9 $26.0 $29.8 $3.8 14.6% 9.5%
Federal 63.0 5.2 14.9 9.7 184.1% 23.7%
District Government 15.2 1.3 2.5 1.2 98.0% 16.1%
DC Housing Authority 8.1 0.7 1.5 0.8 114.6% 18.0%
Customer Metering Fee 10.8 0.9 1.1 0.2 21.0% 10.1%
Water System Replacement Fee (WSRF) 40 3.3 0.0 (3.3) -100.0% 0.0%
Wholesale 79.5 6.6 3.5 (3.1) -46.8% 4.4%
Right-of-Way Fee/PILOT 20.6 1.7 2.7 1.0 58.2% 13.2%Subtotal (before Other Revenues) $548.9 $45.7 $56.0 $10.2 22.3% 10.2%
Other Revenue without RSF
IMA Indirect Cost Reimb. For Capital Projects 8.0 0.7 0.0 (0.7) -100.0% 0.0% DC Fire Protection Fee 10.8 0.9 0.0 (0.9) -100.0% 0.2% Stormwater (MS4) 1.0 0.1 0.2 0.1 100.0% 20.0% Interest 1.3 0.1 0.0 (0.1) -100.0% 0.0% Developer Fees (Water & Sewer) 7.5 0.6 0.4 (0.2) -33.3% 5.3% Others 2.9 0.2 0.5 0.3 150.0% 17.2%
Subtotal $31.6 $2.6 $1.1 ($1.5) -57.4% 3.5%
Rate Stabilization Fund Transfer $0.0 $0.0 $0.0 $0.0 0.0% 0.0%
Other Revenue Subtotal $31.55 $2.6 $1.1 ($1.5) -57.7% 3.5%
Grand Total $580.5 $48.4 $57.1 $8.7 18.0% 9.8%
Variance Favorable / (Unfavorable)
VarianceFY2016 Year-To-Date Actual Favorable / Variance % Actual %
Customer Category Budget Budget Received <Unfavorable> of YTD Budget of Budget
Residential $26,086 $2,174 $2,101 ($73) -3% 8%Commercial 30,532 2,544 2,687 143 6% 9%Multi-family 10,202 850 855 5 1% 8%Federal 18,739 1,562 4,685 3,123 200% 25%District Govt 8,357 696 (1,639) (2,335) -335% -20%DC Housing Authority 1,221 102 86 (15) -15% 7%
Total: $95,137 $7,928 $8,776 $847 11% 9%
Clean RiversCustomer Category Water Sewer IAC Metering Fee Total
Residential $2,807 $3,417 $2,101 $426 $8,751Commercial 5,876 6,061 2,687 325 14,949Multi-family 2,724 3,249 855 91 6,919Federal 5,246 4,980 4,685 198 15,108District Govt 1,864 2,278 (1,639) 36 2,540DC Housing Authority 616 744 86 11 1,457
Total: $19,132 $20,730 $8,776 $1,087 $49,724
Note: The breakdown of Collections into Residential, Commercial, & Multi-family and Water and sewer is approximate as it is based on percentages of historical data and does not take into account adjustments and timing differences
Operating Revenues Detail
Finance and Budget Committee - 2. October 2015 Financial Report (Attachment 1) - Mark Kim
10

Monthly Financial Report
Page 10
Fiscal Year-to-DateAs of October 31, 2015
The following tables show retail accounts receivable over 90 days including a breakdown by customer class.
Greater Than 90 Days by Month
Greater Than 90 Days by Customer
$ in millions # of accountsSeptember 30, 2012 $5.5 13,063September 30, 2013 $4.9 11,920September 30, 2014 $5.3 12,442September 30, 2015 $6.5 11,981October 31, 2015 $7.1 11,737
Total DelinquentW &S Impervious Only Total No. of No. of Amount No. of Amount No. of Amount No. of Amount
a/c a/c a/c a/c ($) a/c ($) a/c Sept. ($) a/c Oct. ($)
Commercial 10,800 3,290 14,090 1,002 2,069,252 169 127,251 1,323 1,495,500$ 1,171 2,196,503$
Multi-family 8,150 448 8,598 651 1,545,472 163 87,688 843 1,661,224 814 1,633,160$
Single-Family Residential 105,737 3,301 109,038 7,401 2,667,039 2,351 648,495 9,815 3,325,590 9,752 3,315,534$
Total 124,687 7,039 131,726 9,054 6,281,763$ 2,683 863,434$ 11,981 6,482,314$ 11,737 7,145,197$
-Reportable delinquencies do not include balances associated with a long standing dispute between DC Water and a large commercial customer.
Active Inactive
Month of September (All Categories)
Notes: Included in the above $6.28M (or 9,054 accounts) of the DC Water Over 90 days delinquent accounts, $2,010,567.23 (or 1,872 accounts) represents Impervious only accounts over 90 days delinquent.
Number of Accounts
Retail Accounts Receivable (Delinquent Accounts)
Finance and Budget Committee - 2. October 2015 Financial Report (Attachment 1) - Mark Kim
11

Monthly Financial Report
Page 11
Fiscal Year-to-DateAs of October 31, 2015
Service Areas Annual YTD Oct. 2015 YTDYTD %Budget
YTD $Fav/(Unfav)
YTD %Fav/(Unfav)
NON PROCESS FACILITIES Facility Land Use $9,309 $776 $523 $523 5.6% $252 32.5%
Subtotal 9,309 776 523 523 5.6% 252 32.5%
WASTEWATER TREATMENT
Liquid Processing 16,193 1,349 1,354 1,354 8.4% (5) (0.4%) Plantwide 15,798 1,317 2,229 2,229 14.1% (913) (69.3%) Solids Processing 28,652 2,388 7,528 7,528 26.3% (5,140) (215.3%) Enhanced Nitrogen Removal Facilities 107,994 8,999 14,361 14,361 13.3% (5,362) (59.6%)
Subtotal 168,637 14,053 25,472 25,472 15.1% (11,419) (81.3%)
COMBINED SEWER OVERFLOW D.C. Clean Rivers 212,012 17,668 22,767 22,767 10.7% (5,100) (28.9%) Program Management 1,832 153 340 340 18.5% (187) (122.5%) Combined Sewer 9,261 772 1,018 1,018 11.0% (247) (31.9%)
Subtotal 223,105 18,592 24,125 24,125 10.8% (5,533) (29.8%)
STORMWATER Local Drainage 223 19 0 0 0.0% 19 100.0% On-Going 459 38 16 16 3.5% 22 58.3% Pumping Facilities 0 0 0 0 0.0% 0 0.0% DDOT 18 1 0 0 0.0% 1 100.0% Research and Program Management 256 21 28 28 11.0% (7) (31.5%) Trunk/Force Sewers 307 26 0 0 0.0% 26 100.0%
Subtotal 1,263 105 44 44 3.5% 61 58.1%
SANITARY SEWER Collection Sewers 4,190 349 12 12 0.3% 337 96.5% On-Going 7,463 622 3,736 3,736 50.1% (3,114) (500.7%) Pumping Facilities 2,267 189 203 203 8.9% (14) (7.2%) Program Management 6,742 562 1,031 1,031 15.3% (469) (83.5%) Interceptor/Trunk Force Sewers 14,124 1,177 2,201 2,201 15.6% (1,024) (87.0%)
Subtotal 34,786 2,899 7,182 7,182 20.6% (4,283) (147.8%)
WATER Distribution Systems 35,667 2,972 5,667 5,667 15.9% (2,695) (90.7%) Lead Program 1,575 131 139 139 8.8% (8) (6.1%) On-Going 5,105 425 1,686 1,686 33.0% (1,261) (296.3%) Pumping Facilities 3,833 319 1,152 1,152 30.1% (833) (260.7%) DDOT 893 74 0 0 0.0% 74 99.6% Storage Facilities 9,515 793 2,212 2,212 23.2% (1,419) (179.0%) Program Management 5,288 441 967 967 18.3% (526) (119.5%)
Subtotal 61,878 5,156 11,824 11,824 19.1% (6,668) (129.3%)
Capital Projects $498,977 $41,581 $69,172 $69,172 13.9% ($27,590) (66.4%)
CAPITAL EQUIPMENT 39,226 3,269 2,510 2,510 6.4% 759 23.2%WASHINGTON AQUEDUCT 10,838 2,709 0 0 0.0% 2,709 100.0%
Additional Capital Programs $50,063 $5,978 $2,510 $2,510 5.0% $3,468 58.0%
Total $549,040 $47,560 $71,682 $71,682 13.1% ($24,122) (50.7%)
Budget Actual Variance
Capital Disbursements Detail by Program ($000’s)
Finance and Budget Committee - 2. October 2015 Financial Report (Attachment 1) - Mark Kim
12

DC WaterInvestment Performance Report –October 2015
Finance and Budget Committee - 2. October 2015 Financial Report (Attachment 1) - Mark Kim
13

Investment Performance Report – October 2015
Prepared by PFM Asset Management LLC
DC WaterFinance Division
1
ECONOMIC COMMENTARY PORTFOLIO RECAP
ÿ The portfolio is diversified among Bank Deposits, U.S. Treasuries, Federal Agencies, Commercial Paper, Negotiable CDs, Corporate Notes/Bonds, Municipal Bonds, FDIC Insured CDs, and SEC registered money market funds.
ÿ The overall yield-to-maturity on cost of the portfolio is 0.44%.
Operating Reserve Accounts
ÿ During the month, PFM completed two extension trades. We sold $2.7 million of 8-month U.S. Treasuries and purchased 3-year U.S. Treasuries picking up 0.70% of additional yield.
ÿ We also sold $1.2 million of 9-month Wells Fargo corporate notes in favor of 3¼-year Wells Fargo corporate notes. This trade will generate 1.11% of additional yield.
2014A Construction Fund
ÿ During the month, PFM purchased $51.5 million of 3- to 6-month commercial paper at an average yield of 0.29%. Issuers included Bank of Tokyo Mitsubishi UFJ, Rabobank, and Credit Agricole.
2015A Construction Fund
ÿ The 2015A Construction Fund account was opened in October. PFM purchased $32.4 million of 10-12 month U.S. Treasuries at an average yield of 0.44% and $38.8 million of 1 ¼-year Federal Agencies at an average yield of 0.56%.
2015B Construction Fund
ÿ The 2015B Construction Fund account was also opened in October. PFM purchased $45 million of 5- to 8-month commercial paper at an average yield of 0.44% and $51.4 million of 7- to 12-month U.S. Treasuries at an average yield of 0.42%.
Economic Update
ÿ U.S. Gross Domestic Product (“GDP”) increased by 1.5% during the 3rd quarter.
ÿ In October, the U.S. economy posted one of the largest gains in payroll for the year with an addition of 271,000 jobs. This addition was well above estimates of 185,000 for the month. The unemployment rate fell to 5.0%, a seven year low.
ÿ The Federal Open Market Committee (“FOMC”) decided against increasing the fed funds target rate at its October meeting. The FOMC did leave the possibility of a December rate hike open stating that they will “assess progress—both realized and expected—toward its objectives of maximum employment and 2% inflation.” With the release of the strong October employment report, the probability of a December rate hike increased from 56% to 70%.
Finance and Budget Committee - 2. October 2015 Financial Report (Attachment 1) - Mark Kim
14
Investment Performance Report – October 2015
Prepared by PFM Asset Management LLC
DC WaterFinance Division
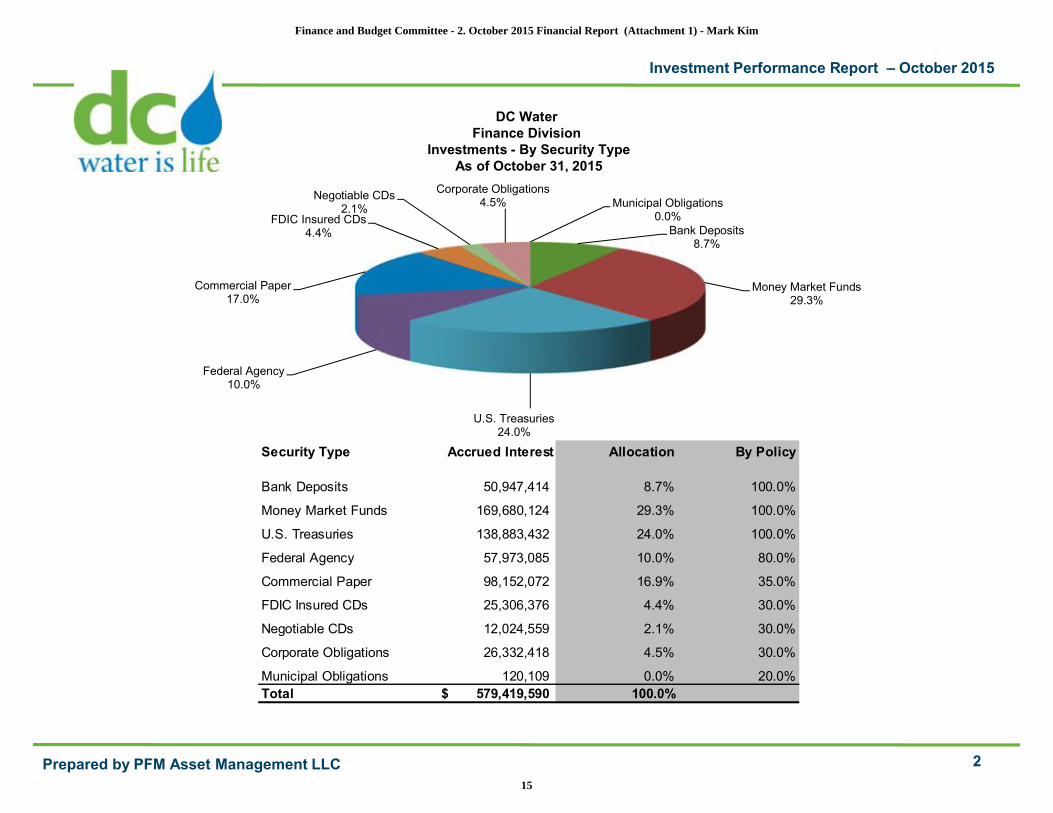
2
Investments - By Security TypeAs of October 31, 2015
Security Type Accrued Interest Allocation By Policy
Bank Deposits 50,947,414 8.7% 100.0%
Money Market Funds 169,680,124 29.3% 100.0%
U.S. Treasuries 138,883,432 24.0% 100.0%
Federal Agency 57,973,085 10.0% 80.0%
Commercial Paper 98,152,072 16.9% 35.0%
FDIC Insured CDs 25,306,376 4.4% 30.0%
Negotiable CDs 12,024,559 2.1% 30.0%
Corporate Obligations 26,332,418 4.5% 30.0%
Municipal Obligations 120,109 0.0% 20.0%Total 579,419,590$ 100.0%
Bank Deposits8.7%
Money Market Funds29.3%
U.S. Treasuries24.0%
Federal Agency10.0%
Commercial Paper17.0%
FDIC Insured CDs4.4%
Negotiable CDs2.1%
Corporate Obligations4.5% Municipal Obligations
0.0%
Finance and Budget Committee - 2. October 2015 Financial Report (Attachment 1) - Mark Kim
15

Investment Performance Report – October 2015
Prepared by PFM Asset Management LLC
DC WaterFinance Division
3
Yield-to- Effective WeightedBook Value + Maturity Duration Average
Fund Name Accrued Interest at Cost (years) Maturity (days)
Rate Stabilization Fund 32,450,000$ 0.63% 0.00 1.0
Operating Reserve Accounts 144,652,236$ 0.83% 1.08 396.6
Debt Service Reserve 23,455,268$ 0.56% 1.07 397.4
CSO LTCP Appropriations Account 884$ 0.90% 0.00 1.0
2014A Construction Fund 67,605,776$ 0.22% 0.22 82.2
2015A Construction Fund 115,870,751$ 0.32% 0.74 275.0
2015B Construction Fund 195,384,674$ 0.22% 0.36 131.2
Total 579,419,590$ 0.43% 0.61 224.0
Investment Analysis – By FundAs of October 31, 2015
Rate Stabilization Fund, 5.6% Operating Reserve
Accounts, 25.0%
Debt Service Reserve 4.0%
CSO LTCP Appropriations Account,
0.0%
2014A Construction Fund, 11.8%
2015A Construction Fund 20.0%
2015B Construction Fund , 33.7%
Finance and Budget Committee - 2. October 2015 Financial Report (Attachment 1) - Mark Kim
16

Investment Performance Report – October 2015
Prepared by PFM Asset Management LLC
DC WaterFinance Division
4
Investment Analysis – By Maturity
Maturity Distribution October 31, 2015 September 30, 2015 August 31, 2015
Overnight 220,627,538.39$ 145,657,069.51$ 114,034,522.67$
Under 6 Months 111,342,939.64 37,134,351.18 57,027,013.48
6 - 12 Months 61,174,880.80 14,921,805.28 28,477,314.20
1 - 2 Years 157,704,099.31 60,558,275.13 54,632,716.76
2 - 3 Years 27,447,183.96 26,565,508.62 34,230,008.80
3 - 4 Years 1,122,948.12 - -
4 - 5 Years - - -
5 Years and Over - - -
Totals 579,419,590.22$ 284,837,009.72$ 288,401,575.91$
$-
$50,000,000
$100,000,000
$150,000,000
$200,000,000
$250,000,000
Overnight Under 6 Months 6 - 12 Months 1 - 2 Years 2 - 3 Years 3 - 4 Years 4 - 5 Years 5 Years andOver
October 31, 2015
September 30, 2015
August 31, 2015
Finance and Budget Committee - 2. October 2015 Financial Report (Attachment 1) - Mark Kim
17

Investment Performance Report – October 2015
Prepared by PFM Asset Management LLC
DC WaterFinance Division
5
Credit Ratings Investment Policy Compliance withS&P / Moody's Book Value Limit Investment Policy
Bank DepositsTD Bank 45,859,468.31 7.9% 100.0% YesCapital One Bank 5,087,945.74 0.9% 100.0% Yes
Sub-Total Bank Deposits 50,947,414.05 8.8% 100.0% Yes
Money Market Mutual FundsWells Fargo Treasury Plus MMF AAAm 159,496,434.61 27.5% 50.0% YesFederated Government MMF AAAm 10,183,689.73 1.8% 50.0% Yes
Sub-Total Money Market Mutual Funds 169,680,124.34 29.3% 100.0% Yes
U.S. TreasuriesTreasury Note AA+ / Aaa 138,883,432.28 24.0% 100.0% Yes
Sub-Total Treasuries 138,883,432.28 24.0% 100.0% Yes
Federal AgenciesFannie Mae AA+ / Aaa 4,522,289.04 0.8% 40.0% YesFederal Home Loan Bank AA+ / Aaa 13,407,074.92 2.3% 40.0% YesFreddie Mac AA+ / Aaa 40,043,720.55 6.9% 40.0% Yes
Sub-Total Federal Agencies 57,973,084.51 10.0% 80.0% Yes
Commercial PaperBank Of Tokyo Mitsubishi UFJ A-1 / P-1 20,476,090.89 3.5% 5.0% YesBNP Paribas NY Branch A-1 / P-1 18,978,287.18 3.3% 5.0% YesCredit Agricole CIB NY Comm Paper A-1 / P-1 18,993,582.18 3.3% 5.0% YesJP Morgan Securities LLC A-1 / P-1 20,732,590.96 3.6% 5.0% YesRabobank Nederland NV NY A-1 / P-1 18,971,521.09 3.3% 5.0% Yes
Sub-Total Commercial Paper 98,152,072.30 16.9% 35.0% Yes
FDIC Insured Certificates of DepositCDARS - Placed by Industrial Bank NR / NR 15,190,422.57 2.6% 5.0% YesCDARS - Placed by City First Bank NR / NR 10,115,953.28 1.7% 5.0% Yes
Sub-Total FDIC-Insured Certificates of Deposit 25,306,375.85 4.4% 30.0% Yes
Investments – Issuer Allocation
Finance and Budget Committee - 2. October 2015 Financial Report (Attachment 1) - Mark Kim
18

Investment Performance Report – October 2015
Prepared by PFM Asset Management LLC
DC WaterFinance Division
6
Credit Ratings Investment Policy Compliance withS&P / Moody's Book Value Limit Investment Policy
Negotiable Certificates of DepositBNP Paribas NY Branch A-1 / P-1 1,806,608.00 0.3% 5.0% YesCanadian Imperial Bank NY A-1 / P-1 1,801,262.50 0.3% 5.0% YesCredit Suisse NY A-1 / P-1 1,802,747.00 0.3% 5.0% YesHSBC Bank USA NA A-1+ / P-1 1,803,344.00 0.3% 5.0% YesNordea Bank Finland NY AA- / Aa3 1,808,970.00 0.3% 5.0% YesRabobank Nederland NV A-1 / P-1 1,800,535.00 0.3% 5.0% YesUS Bank NA Cincinatti AA- / A1 1,201,092.98 0.2% 5.0% Yes
Sub-Total Negotiable Certificates of Deposit 12,024,559.48 2.1% 30.0% Yes
Corporate ObligationsANZ Banking Group Ltd. AA- / Aa2 1,760,337.55 0.3% 5.0% YesBank of Montreal A+ / Aa3 1,757,854.12 0.3% 5.0% YesBank of New York Mellon A+ / A1 1,812,018.92 0.3% 5.0% YesBank of Nova Scotia A+ / Aa2 1,811,161.33 0.3% 5.0% YesCisco Systems Inc. AA- / A1 1,559,287.79 0.3% 5.0% YesChevron AA / Aa1 1,791,554.49 0.3% 5.0% YesExxon Mobil AAA / Aaa 1,803,588.75 0.3% 5.0% YesGeneral Electric Capital Corporation AA+ / A1 1,841,952.42 0.3% 5.0% YesIBM AA- / Aa3 2,250,775.51 0.4% 5.0% YesMerck & Co. AA / A2 735,031.64 0.1% 5.0% YesRoyal Bank of Canada AA- / Aa3 1,751,243.11 0.3% 5.0% YesToronto Dominion Bank NY AA- / Aa1 1,999,888.65 0.3% 5.0% YesToyota Motor Credit Corp AA- / Aa3 1,530,625.76 0.3% 5.0% YesUS Bank AA- / A1 552,328.74 0.1% 5.0% YesWalmart Stores Inc. AA / Aa2 834,998.03 0.1% 5.0% YesWells Fargo & Company Notes A+ / A2 1,122,948.12 0.2% 5.0% YesWestpac Banking AA- / Aa2 1,416,823.48 0.2% 5.0% Yes
Sub-Total Corporate Obligations 26,332,418.41 4.5% 30.0% Yes
Municipal Obligations
Mississippi State AA / Aa2 120,109.00 0.0% 5.0% Yes
Sub-Total Municipal Obligations 120,109.00 0.0% 20.0% YesGrand Total 579,419,590.22$ 100.0%
Investments – Issuer Allocation
Finance and Budget Committee - 2. October 2015 Financial Report (Attachment 1) - Mark Kim
19

Investment Performance Report – October 2015
Prepared by PFM Asset Management LLC
DC WaterFinance Division
7
Book Value PerformanceAs of October 31, 2015
The portfolio is in compliance with the Authority’s Investment Policy
(1) The Merrill Lynch 3-Month Treasury Bill is an unmanaged index tracking the on-the-run Treasury Bill. The Index is produced and maintained by Merrill Lynch & Co. Performance for this index is shown on a book value basis.
(2) The Merrill Lynch 3-Month Treasury Bill is an unmanaged index tracking a basket of U.S. Treasuries with 1 to 3 year maturities. The Index is produced and maintained by Merrill Lynch & Co. Performance for this index is shown on a book value basis.
Trailing 12 MonthsPeriodic Annualized Periodic Annualized Periodic Annualized
Total Rate Stabilization Fund 0.05% 0.63% 0.15% 0.59% 0.27% 0.55% 0.55%Operating Reserve Accounts 0.07% 0.87% 0.21% 0.83% 0.41% 0.81% 0.77%Total Debt Service Reserve 0.05% 0.55% 0.14% 0.56% 0.39% 0.78% 0.64%2014A Construction Fund 0.00% 0.03% 0.01% 0.05% 0.05% 0.10% 0.14%
Short-Term 0.03% 0.30% 0.09% 0.35% 0.17% 0.34% 0.33%
Merrill Lynch 3-Month Treasury Index (Book Value)1 0.00% 0.04% 0.00% 0.02% 0.01% 0.02% 0.02%
Core (1+ Years) 0.06% 0.72% 0.22% 0.87% 0.44% 0.88% 0.80%
Trailing 3 Months Trailing 6 MonthsTrailing 1 Months
Finance and Budget Committee - 2. October 2015 Financial Report (Attachment 1) - Mark Kim
20

Investment Performance Report – October 2015
Prepared by PFM Asset Management LLC
DC WaterFinance Division
8
DESCRIPTION CUSIP PAR AMOUNTCOUPON
RATEMATURITY
DATESETTLEMENT
DATEYTM AT COST
ORIGINAL COST
MARKET VALUE + ACCRUED INTEREST
AMORTIZED COST + ACCRUED INTEREST TOTAL VALUE
Rate Stabilization FundTD BANK BANK DEPOSIT 22,450,000$ 11/1/2015 0.90% 22,450,000$ 22,450,000$ 22,450,000$ FEDERATED GOVERNMENT MONEY MARKET FUND 10,000,000 11/1/2015 0.01% 10,000,000 10,000,000 10,000,000$
32,450,000.00$ Operating Reserve AccountsTD BANK BANK DEPOSIT 23,408,584$ 11/1/2015 0.90% 23,408,584$ 23,408,584$ 23,408,584$ CAPITAL ONE BANK 5,087,946 11/1/2015 0.50% 5,087,946 5,087,946 5,087,946FEDERATED GOVERNMENT MONEY MARKET FUND 183,690 11/1/2015 0.01% 183,690 183,690 183,690INDUSTRIAL BANK CDARS RE0908161 5,024,994 0.400 11/12/2015 11/13/2014 0.40% 5,024,994 5,044,493 5,044,493CITY FIRST BK OF WASHINGTON, DC (CDARS) RE0908179 5,019,985 0.300 11/12/2015 11/13/2014 0.30% 5,019,985 5,034,595 5,034,595BNP PARIBAS NY BRANCH CERT DEPOS 05574RSY2 1,800,000 0.560 12/4/2015 3/10/2015 0.56% 1,800,000 1,807,188 1,806,608INDUSTRIAL BANK CDARS RE0907999 2,545,282 0.750 1/21/2016 1/23/2014 0.75% 2,545,282 2,579,260 2,579,260INDUSTRIAL BANK CDARS RE0908229 2,539,450 0.450 1/21/2016 1/22/2015 0.45% 2,539,450 2,548,363 2,548,363CITY FIRST BK OF WASHINGTON, DC (CDARS) RE0908013 2,530,097 0.400 3/17/2016 3/20/2014 0.40% 2,530,097 2,546,528 2,546,528CITY FIRST BK OF WASHINGTON, DC (CDARS) RE0908278 2,530,097 0.300 3/17/2016 3/19/2015 0.30% 2,530,097 2,534,830 2,534,830JP MORGAN SECURITIES LLC COMM PAPER 46640PDV2 1,800,000 - 4/29/2016 8/3/2015 0.62% 1,791,630 1,796,333 1,794,420CREDIT SUISSE NEW YORK CERT DEPOS 22549VX73 1,800,000 0.670 5/6/2016 8/11/2015 0.67% 1,800,000 1,804,055 1,802,747US TREASURY NOTES 912828WQ9 1,000,000 0.500 6/30/2016 7/15/2014 0.46% 1,000,820 1,002,544 1,001,963US TREASURY NOTES 912828QX1 3,035,000 1.500 7/31/2016 7/15/2014 0.50% 3,096,767 3,071,401 3,069,154HSBC BANK USA NA CD 40428AC54 1,800,000 0.880 8/15/2016 2/13/2015 0.88% 1,800,000 1,805,882 1,803,344FHLB NOTES 3130A2T97 1,595,000 0.500 9/28/2016 8/7/2014 0.61% 1,591,411 1,596,685 1,594,203INDUSTRIAL BANK CDARS RE0908369 5,017,482 0.350 10/13/2016 10/15/2015 0.35% 5,017,482 5,018,307 5,018,307US TREASURY NOTES 912828WF3 4,600,000 0.625 11/15/2016 7/15/2014 0.64% 4,598,563 4,620,531 4,612,642US TREASURY NOTES 912828MD9 4,225,000 3.250 12/31/2016 11/24/2014 0.61% 4,457,375 4,405,501 4,400,290US TREASURY NOTES 912828RX0 5,000,000 0.875 12/31/2016 11/21/2014 0.60% 5,029,102 5,036,357 5,030,839US TREASURY NOTES 912828RX0 3,075,000 0.875 12/31/2016 12/9/2014 0.69% 3,086,531 3,097,359 3,090,598GENERAL ELEC CAP CORP GLOBAL NOTES 36962G5N0 1,200,000 2.900 1/9/2017 7/15/2014 1.03% 1,254,912 1,237,841 1,237,284US BANK CORP NOTE (CALLABLE) 90331HMC4 550,000 1.100 1/30/2017 11/26/2014 0.98% 551,430 552,797 552,329US TREASURY NOTES 912828SC5 3,500,000 0.875 1/31/2017 7/14/2014 0.72% 3,513,945 3,523,279 3,514,600US TREASURY NOTES 912828SM3 100,000 1.000 3/31/2017 10/6/2014 0.80% 100,488 100,656 100,366CANADIAN IMPERIAL BANK NY YCD 13606JYY9 1,800,000 1.010 4/6/2017 4/10/2015 1.01% 1,800,000 1,796,700 1,801,263RABOBANK NEDERLAND NV CERT DEPOS 21684BXH2 1,800,000 1.070 4/21/2017 4/27/2015 1.07% 1,800,000 1,797,421 1,800,535FNMA NOTES 3135G0JA2 4,500,000 1.125 4/27/2017 11/21/2014 0.80% 4,535,370 4,530,033 4,522,289TORONTO DOMINION BANK NY CORP NT 89114QAQ1 1,200,000 1.125 5/2/2017 7/15/2014 1.14% 1,199,628 1,206,506 1,206,514TORONTO DOMINION BANK NY CORP NT 89114QAQ1 790,000 1.125 5/2/2017 11/26/2014 1.21% 788,317 794,283 793,375NORDEA BANK FINLAND NY CD 65558LFA5 1,800,000 1.150 5/26/2017 5/29/2015 1.15% 1,800,000 1,806,027 1,808,970FHLB GLOBAL NOTES 3130A5EP0 1,775,000 0.625 5/30/2017 5/15/2015 0.67% 1,773,527 1,778,001 1,778,510ANZ BANKING GROUP LTD CORP NOTES 05253JAF8 1,200,000 1.250 6/13/2017 10/30/2014 1.15% 1,203,084 1,205,710 1,207,666ANZ BANKING GROUP LTD CORP NOTES 05253JAF8 550,000 1.250 6/13/2017 11/26/2014 1.25% 550,055 552,617 552,671US TREASURY NOTES 912828TB6 1,850,000 0.750 6/30/2017 11/3/2014 0.79% 1,848,121 1,857,397 1,853,497BANK OF MONTREAL CORP NOTES (CALLABLE) 06366RVD4 1,200,000 1.300 7/14/2017 7/15/2014 1.27% 1,201,116 1,206,867 1,205,263BANK OF MONTREAL CORP NOTES (CALLABLE) 06366RVD4 550,000 1.300 7/14/2017 11/26/2014 1.25% 550,726 553,148 552,591FREDDIE MAC GLOBAL NOTES 3137EADJ5 1,015,000 1.000 7/28/2017 8/14/2014 1.00% 1,014,932 1,021,852 1,017,582US TREASURY NOTES 912828NR7 150,000 2.375 7/31/2017 7/18/2014 0.97% 156,311 155,273 154,554US TREASURY NOTES 912828TG5 3,260,000 0.500 7/31/2017 2/4/2015 0.63% 3,249,685 3,254,313 3,256,862US TREASURY NOTES 912828TG5 100,000 0.500 7/31/2017 2/10/2015 0.84% 99,164 99,826 99,534US BANK NA CINCINNATI (CALLABLE) CD 90333VPF1 1,200,000 1.375 9/11/2017 9/11/2014 1.41% 1,198,068 1,201,730 1,201,093MS ST TXBL GO BONDS 605581FX0 120,000 1.090 10/1/2017 2/18/2015 1.09% 120,000 119,991 120,109ROYAL BANK OF CANADA CORP NOTES 78010U4A2 1,200,000 1.400 10/13/2017 10/15/2014 1.41% 1,199,820 1,199,089 1,200,722
Portfolio Holdings by Fund
Finance and Budget Committee - 2. October 2015 Financial Report (Attachment 1) - Mark Kim
21

Investment Performance Report – October 2015
Prepared by PFM Asset Management LLC
DC WaterFinance Division
9
Portfolio Holdings by Fund
DESCRIPTION CUSIP PAR AMOUNTCOUPON
RATEMATURITY
DATESETTLEMENT
DATEYTM AT COST
ORIGINAL COST
MARKET VALUE + ACCRUED INTEREST
AMORTIZED COST + ACCRUED INTEREST TOTAL VALUE
Operating Reserve AccountsROYAL BANK OF CANADA CORP NOTES 78010U4A2 550,000 1.400 10/13/2017 11/26/2014 1.39% 550,198 549,583 550,521CHEVRON CORP NOTE 166764AL4 885,000 1.345 11/15/2017 11/18/2014 1.35% 885,000 893,669 890,489CHEVRON CORP (CALLABLE) GLOBAL NOTES 166764AA8 900,000 1.104 12/5/2017 11/26/2014 1.26% 895,743 904,485 901,066GENERAL ELECTRIC CO NOTES 369604BC6 550,000 5.250 12/6/2017 11/26/2014 1.45% 611,727 605,244 604,668TOYOTA MOTOR CREDIT CORP NOTE 89236TCA1 590,000 1.450 1/12/2018 1/12/2015 1.50% 589,192 593,642 591,995WESTPAC BANKING CORP NOTES 961214BZ5 1,400,000 1.600 1/12/2018 4/29/2015 1.27% 1,412,306 1,410,025 1,416,823IBM CORP NOTES 459200HZ7 2,250,000 1.125 2/6/2018 2/6/2015 1.23% 2,243,138 2,250,617 2,250,776WAL MART STORES INC. CORP NOTES 931142CJ0 750,000 5.800 2/15/2018 6/12/2015 1.30% 838,382 838,902 834,998EXXON MOBIL CORP NOTES 30231GAL6 1,800,000 1.305 3/6/2018 3/6/2015 1.31% 1,800,000 1,813,190 1,803,589US TREASURY NOTES 912828UU2 2,200,000 0.750 3/31/2018 2/27/2015 1.04% 2,180,578 2,193,536 2,186,219US TREASURY NOTES 912828UU2 4,400,000 0.750 3/31/2018 3/27/2015 1.00% 4,368,031 4,387,072 4,377,197MERCK & CO GLOBAL NOTES 58933YAG0 731,000 1.300 5/18/2018 3/27/2015 1.31% 730,664 736,951 735,032BANK OF NEW YORK MELLON CORP (CALLABLE) 06406HDB2 1,800,000 1.600 5/22/2018 5/29/2015 1.60% 1,799,838 1,814,538 1,812,019BANK OF NOVA SCOTIA CORP NOTE (CALLABLE) 064159GM2 1,800,000 1.700 6/11/2018 6/11/2015 1.72% 1,799,154 1,811,531 1,811,161CISCO SYSTEMS INC CORP NOTE 17275RAU6 1,550,000 1.650 6/15/2018 6/17/2015 1.66% 1,549,737 1,572,039 1,559,288TOYOTA MOTOR CREDIT CORP 89236TCP8 935,000 1.550 7/13/2018 7/13/2015 1.58% 934,205 943,734 938,631US TREASURY NOTES 912828VQ0 1,975,000 1.375 7/31/2018 7/6/2015 1.11% 1,990,893 2,002,642 1,996,117US TREASURY NOTES 912828RH5 2,700,000 1.375 9/30/2018 10/9/2015 0.94% 2,734,594 2,730,246 2,737,118WELLS FARGO & COMPANY NOTES 94974BFQ8 1,103,000 2.150 1/15/2019 10/7/2015 1.77% 1,116,225 1,121,106 1,122,948
144,652,236.01$ Debt Service Reserve WELLS FARGO TREASURY PLUS MMF 217,943$ 11/1/2015 0.01% 217,943$ 217,943$ 217,943$ WELLS FARGO GOVERNMENT MMF -$ 11/1/2015 0.01% -$ -$ -$ FHLB NOTES 313375RN9 10,000,000 1.000 3/11/2016 5/22/2013 0.43% 10,158,100 10,040,649 10,034,361US TREASURY NOTES 912828MV9 6,538,000 3.250 3/31/2017 6/29/2015 0.56% 6,844,213 6,800,223 6,803,419US TREASURY NOTES 912828PA2 6,257,000 1.875 9/30/2017 6/29/2015 0.76% 6,412,692 6,401,845 6,399,544
23,455,268.21$ CSO LTCP Appropriations AccountTD BANK BANK DEPOSIT 884$ 11/1/2015 0.90% 884$ 884$ 884$
884.49$ 2014A Construction FundWELLS FARGO TREASURY PLUS MMF 16,155,406$ 11/1/2015 0.01% 16,155,406$ 16,155,406$ 16,155,406$ BANK OF TOKYO MITSUBISHI UFJ COMM PAPER 06538BA45 7,500,000 - 1/4/2016 10/30/2015 0.25% 7,496,563 7,496,618 7,496,667CREDIT AGRICOLE CIB NY COMM PAPER 22533TA48 19,000,000 - 1/4/2016 10/30/2015 0.19% 18,993,382 18,992,552 18,993,582BANK OF TOKYO MITS UFJ LTD COMM PAPER 06538BD18 6,000,000 - 4/1/2016 10/30/2015 0.45% 5,988,450 5,988,654 5,988,600RABOBANK NEDERLAND NV NY COMM PAPER 21687AD18 19,000,000 - 4/1/2016 10/30/2015 0.36% 18,971,146 18,968,061 18,971,521
67,605,776.28$ 2015A Construction Fund
WELLS FARGO TREASURY PLUS MMF 44,347,199$ 11/1/2015 0.01% 44,347,199$ 44,347,199$ 44,347,199$ US TREASURY NOTES 912828RF9 6,450,000 1.000 8/31/2016 10/30/2015 0.39% 6,482,754 6,491,308 6,493,525US TREASURY NOTES 912828H29 25,900,000 0.625 12/31/2016 10/30/2015 0.46% 25,949,574 25,991,634 26,003,890FHLMC NOTES 3137EADT3 38,800,000 0.875 2/22/2017 10/30/2015 0.56% 38,961,408 39,009,756 39,026,138
115,870,751.22$ 2015B Construction FundWELLS FARGO TREASURY PLUS MMF 98,775,886$ 11/1/2015 0.01% 98,775,886$ 98,775,886$ 98,775,886$ BANK OF TOKYO MITSUBISHI COMM PAPER 06538BC19 7,000,000 - 3/1/2016 10/30/2015 0.39% 6,990,673 6,991,005 6,990,824BNP PARIBAS NY BRANCH COMM PAPER 09659BC16 19,000,000 - 3/1/2016 10/30/2015 0.34% 18,977,928 18,976,896 18,978,287US TREASURY NOTES 912828WM8 7,000,000 0.375 5/31/2016 10/30/2015 0.30% 7,003,008 7,012,319 7,014,025
Finance and Budget Committee - 2. October 2015 Financial Report (Attachment 1) - Mark Kim
22

Investment Performance Report – October 2015
Prepared by PFM Asset Management LLC
DC WaterFinance Division
10
Portfolio Holdings by Fund
DESCRIPTION CUSIP PAR AMOUNTCOUPON
RATEMATURITY
DATESETTLEMENT
DATEYTM AT COST
ORIGINAL COST
MARKET VALUE + ACCRUED INTEREST
AMORTIZED COST + ACCRUED INTEREST TOTAL VALUE
2015B Construction FundJP MORGAN SECURITIES LLC COMM PAPER 46640PF16 19,000,000 - 6/1/2016 10/30/2015 0.55% 18,937,590 18,948,377 18,938,171US TREASURY NOTES 912828RJ1 14,350,000 1.000 9/30/2016 10/30/2015 0.41% 14,427,355 14,435,229 14,439,442US TREASURY NOTES 912828RU6 30,000,000 0.875 11/30/2016 10/30/2015 0.45% 30,138,281 30,237,801 30,248,038
195,384,674.01$
579,158,544.65$ 579,484,783.64$ 579,419,590.22$ 579,419,590.22$
Finance and Budget Committee - 2. October 2015 Financial Report (Attachment 1) - Mark Kim
23

Investment Performance Report – October 2015
Prepared by PFM Asset Management LLC
DC WaterFinance Division
11
CUSIP DESCRIPTION PAR COUPON MATURITY DATE SETTLE DATE YTMTRANSACTION
AMOUNT
Operating Reserve Accounts3130A5EP0 FHLB GLOBAL NOTES 1,775,000.00 0.63 5/30/2017 5/15/2015 0.67 1,773,526.7506406HDB2 BANK OF NEW YORK MELLON CORP (CALLABLE) 1,800,000.00 1.60 5/22/2018 5/29/2015 1.60 1,799,838.0065558LFA5 NORDEA BANK FINLAND NY CD 1,800,000.00 1.15 5/26/2017 5/29/2015 1.15 1,800,000.00064159GM2 BANK OF NOVA SCOTIA CORP NOTE (CALLABLE) 1,800,000.00 1.70 6/11/2018 6/11/2015 1.72 1,799,154.00931142CJ0 WAL MART STORES INC. CORP NOTES 750,000.00 5.80 2/15/2018 6/12/2015 1.30 852,519.7517275RAU6 CISCO SYSTEMS INC CORP NOTE 1,550,000.00 1.65 6/15/2018 6/17/2015 1.66 1,549,736.50912828VQ0 US TREASURY NOTES 2,900,000.00 1.38 7/31/2018 7/6/2015 1.11 2,940,519.6489236TCP8 TOYOTA MOTOR CREDIT CORP 935,000.00 1.55 7/13/2018 7/13/2015 1.58 934,205.2546640PDV2 JP MORGAN SECURITIES LLC COMM PAPER 1,800,000.00 - 4/29/2016 8/3/2015 0.63 1,791,630.0022549VX73 CREDIT SUISSE NEW YORK CERT DEPOS 1,800,000.00 0.67 5/6/2016 8/11/2015 0.68 1,800,000.0094974BFQ8 WELLS FARGO & COMPANY NOTES 1,103,000.00 2.15 1/15/2019 10/7/2015 1.77 1,121,626.61912828RH5 US TREASURY NOTES 2,700,000.00 1.38 9/30/2018 10/9/2015 0.94 2,735,506.66RE0908369 INDUSTRIAL BANK CDARS 5,017,482.34 0.35 10/13/2016 10/15/2015 0.35 5,017,482.34
Total Debt Service Reserve 912828MV9 US TREASURY NOTES 6,538,000.00 3.25 3/31/2017 6/29/2015 0.56 6,896,463.77912828PA2 US TREASURY NOTES 6,257,000.00 1.88 9/30/2017 6/29/2015 0.76 6,441,540.63
2014A Construction Fund22533UUD3 CREDIT AGRICOLE CIB NY COMM PAPER 12,000,000.00 - 7/13/2015 5/1/2015 0.15 11,996,350.0006538CVU2 BANK OF TOKYO MITS UFJ LTD COMM PAPER 6,000,000.00 - 8/28/2015 6/12/2015 0.23 5,997,048.3336959JWB5 GENERAL ELEC CAP CORP COMM PAPER 6,000,000.00 - 9/11/2015 6/12/2015 0.19 5,997,118.3389233HWG5 TOYOTA MOTOR CREDIT CORP COMM PAPER 6,000,000.00 - 9/16/2015 6/12/2015 0.21 5,996,640.0009659CWB0 BNP PARIBAS NY BRANCH COMM PAPER 6,000,000.00 - 9/11/2015 6/29/2015 0.24 5,997,040.0006538BA45 BANK OF TOKYO MITSUBISHI UFJ COMM PAPER 7,500,000.00 - 1/4/2016 10/30/2015 0.25 7,496,562.5006538BD18 BANK OF TOKYO MITS UFJ LTD COMM PAPER 6,000,000.00 - 4/1/2016 10/30/2015 0.46 5,988,450.0021687AD18 RABOBANK NEDERLAND NV NY COMM PAPER 19,000,000.00 - 4/1/2016 10/30/2015 0.36 18,971,146.3922533TA48 CREDIT AGRICOLE CIB NY COMM PAPER 19,000,000.00 - 1/4/2016 10/30/2015 0.19 18,993,381.67
2015A Construction Fund3137EADT3 FHLMC NOTES 38,800,000.00 0.88 2/22/2017 10/30/2015 0.56 39,025,535.78912828H29 US TREASURY NOTES 25,900,000.00 0.63 12/31/2016 10/30/2015 0.46 26,003,239.30912828RF9 US TREASURY NOTES 6,450,000.00 1.00 8/31/2016 10/30/2015 0.39 6,493,385.78
2015A Construction Fund912828RJ1 US TREASURY NOTES 14,350,000.00 1.00 9/30/2016 10/30/2015 0.41 14,439,117.76912828RU6 US TREASURY NOTES 30,000,000.00 0.88 11/30/2016 10/30/2015 0.45 30,247,297.64912828WM8 US TREASURY NOTES 7,000,000.00 0.38 5/31/2016 10/30/2015 0.30 7,013,909.4506538BC19 BANK OF TOKYO MITSUBISHI COMM PAPER 7,000,000.00 - 3/1/2016 10/30/2015 0.40 6,990,672.5009659BC16 BNP PARIBAS NY BRANCH COMM PAPER 19,000,000.00 - 3/1/2016 10/30/2015 0.35 18,977,928.3346640PF16 JP MORGAN SECURITIES LLC COMM PAPER 19,000,000.00 - 6/1/2016 10/30/2015 0.56 18,937,590.32
Security PurchasesLast 6 Months
Securities highlighted in blue font denote trades executed during the current month.
Finance and Budget Committee - 2. October 2015 Financial Report (Attachment 1) - Mark Kim
24

Investment Performance Report – October 2015
Prepared by PFM Asset Management LLC
DC WaterFinance Division
12
Security SalesLast 6 Months
Securities highlighted in blue font denote trades executed during the current month.
CUSIP DESCRIPTION PAR COUPON MATURITY DATE SETTLE DATE YTMTRANSACTION
AMOUNT
Operating Reserve Accounts912828MD9 US TREASURY NOTES 1,775,000.00 3.25 12/31/2016 5/15/2015 0.47 1,876,318.95912828QF0 US TREASURY NOTES 1,775,000.00 2.00 4/30/2016 5/29/2015 0.27 1,806,017.28912828QF0 US TREASURY NOTES 1,075,000.00 2.00 4/30/2016 5/29/2015 0.26 1,093,869.09912828QP8 US TREASURY NOTES 550,000.00 1.75 5/31/2016 5/29/2015 0.30 562,751.81912828QP8 US TREASURY NOTES 1,775,000.00 1.75 5/31/2016 6/11/2015 0.31 1,800,617.16912828TG5 US TREASURY NOTES 850,000.00 0.50 7/31/2017 6/12/2015 0.79 846,370.03912828TG5 US TREASURY NOTES 310,000.00 0.50 7/31/2017 6/17/2015 0.81 308,576.44912828TG5 US TREASURY NOTES 1,240,000.00 0.50 7/31/2017 6/17/2015 0.81 1,234,305.79912828QP8 US TREASURY NOTES 2,675,000.00 1.75 5/31/2016 7/6/2015 0.30 2,714,400.41912828VQ0 US TREASURY NOTES 925,000.00 1.38 7/31/2018 7/13/2015 0.94 942,795.31912828WQ9 US TREASURY NOTES 450,000.00 0.50 6/30/2016 8/3/2015 0.30 451,016.47912828WQ9 US TREASURY NOTES 600,000.00 0.50 6/30/2016 8/11/2015 0.35 601,115.8394974BFL9 WELLS FARGO & COMPANY 1,200,000.00 1.25 7/20/2016 10/7/2015 0.66 1,208,752.33912828WQ9 US TREASURY NOTES 2,650,000.00 0.50 6/30/2016 10/9/2015 0.24 2,658,708.82
Total Debt Service Reserve 912828QX1 US TREASURY NOTES 3,550,000.00 1.50 7/31/2016 6/29/2015 0.36 3,615,876.80912828QX1 US TREASURY NOTES 1,200,000.00 1.50 7/31/2016 6/29/2015 0.36 1,222,268.22912828TG5 US TREASURY NOTES 3,600,000.00 0.50 7/31/2017 6/29/2015 0.70 3,592,502.59313384KQ1 FEDERAL HOME LOAN BANKS DISC NOTE 4,900,000.00 - 8/19/2015 6/29/2015 0.06 4,899,618.21
2014A Construction Fund3130A45M0 FHLB NOTES 12,000,000.00 0.13 9/11/2015 6/12/2015 0.11 12,005,963.333134G3ZA1 FREDDIE MAC GLOBAL NOTES 6,000,000.00 0.50 8/28/2015 6/12/2015 0.11 6,013,826.673130A45M0 FHLB NOTES 6,000,000.00 0.13 9/11/2015 6/29/2015 0.11 6,003,230.00
Finance and Budget Committee - 2. October 2015 Financial Report (Attachment 1) - Mark Kim
25

Investment Performance Report – October 2015
Prepared by PFM Asset Management LLC
DC WaterFinance Division
13
Security MaturitiesLast 6 Months
Securities highlighted in blue font denote trades executed during the current month.
CUSIP DESCRIPTION PAR COUPON MATURITY DATE SETTLE DATE YTMTRANSACTION
AMOUNT
Operating Reserve Accounts69349KV31 PNC BANK NA COMM PAPER 1,225,000.00 - 8/3/2015 8/3/2015 0.00 1,225,000.0017304UYB0 CITIBANK NA FLOATING CERT DEPOS 1,200,000.00 0.42 8/11/2015 8/11/2015 0.00 1,200,000.00RE0908153 INDUSTRIAL BANK CDARS 5,000,000.00 0.35 10/15/2015 10/15/2015 0.00 5,017,500.00
2014A Construction Fund313379ER6 FEDERAL HOME LOAN BANK BONDS 12,235,000.00 0.50 6/12/2015 6/12/2015 0.00 12,235,000.00313379ER6 FEDERAL HOME LOAN BANK BONDS 2,345,000.00 0.50 6/12/2015 6/12/2015 0.00 2,345,000.003133XWNB1 FHLB TAP BONDS 6,000,000.00 2.88 6/12/2015 6/12/2015 0.00 6,000,000.003133XWNB1 FHLB TAP BONDS 8,955,000.00 2.88 6/12/2015 6/12/2015 0.00 8,955,000.003135G0LN1 FANNIE MAE GLOBAL NOTES 6,000,000.00 0.50 7/2/2015 7/2/2015 0.00 6,000,000.003134G4TH1 FHLMC NOTES 24,000,000.00 0.30 7/8/2015 7/8/2015 0.00 24,000,000.0022533UUD3 CREDIT AGRICOLE CIB NY COMM PAPER 12,000,000.00 - 7/13/2015 7/13/2015 0.00 12,000,000.0031398AU34 FNMA NOTES 24,450,000.00 2.38 7/28/2015 7/28/2015 0.00 24,450,000.003130A2WK8 FHLB AGENCY NOTES 16,950,000.00 0.13 8/28/2015 8/28/2015 0.00 16,950,000.003134G3ZA1 FREDDIE MAC GLOBAL NOTES 2,000,000.00 0.50 8/28/2015 8/28/2015 0.00 2,000,000.0006538CVU2 BANK OF TOKYO MITS UFJ LTD COMM PAPER 6,000,000.00 - 8/28/2015 8/28/2015 0.00 6,000,000.003130A45M0 FHLB NOTES 17,000,000.00 0.13 9/11/2015 9/11/2015 0.00 17,012,891.6709659CWB0 BNP PARIBAS NY BRANCH COMM PAPER 6,000,000.00 - 9/11/2015 9/11/2015 0.00 6,000,000.0036959JWB5 GENERAL ELEC CAP CORP COMM PAPER 6,000,000.00 - 9/11/2015 9/11/2015 0.00 6,000,000.0089233HWG5 TOYOTA MOTOR CREDIT CORP COMM PAPER 6,000,000.00 - 9/16/2015 9/16/2015 0.00 6,000,000.00
2014B Construction Fund06538CSV4 BANK OF TOKYO MITSUBISHI LTD COMM PAPER 16,000,000.00 - 5/29/2015 5/29/2015 0.00 16,000,000.000556N1T86 BNP PARIBAS FINANCE INC COMM PAPER 16,000,000.00 - 6/8/2015 6/8/2015 0.00 16,000,000.00
Finance and Budget Committee - 2. October 2015 Financial Report (Attachment 1) - Mark Kim
26

Investment Performance Report – October 2015
Prepared by PFM Asset Management LLC
DC WaterFinance Division
14
DATE TRANSACTION CUSIP DESCRIPTION COUPON MATURITY DATE PAR VALUE/SHARES PRINCIPAL INTEREST TOTAL
11/02/15 INTEREST 89114QAQ1 TORONTO DOMINION BANK NY CORP NT 1.125 05/02/17 790,000.00 0.00 4,443.75 4,443.75
11/02/15 INTEREST 89114QAQ1 TORONTO DOMINION BANK NY CORP NT 1.125 05/02/17 1,200,000.00 0.00 6,750.00 6,750.00
11/12/15 MATURITY RE0908161 INDUSTRIAL BANK CDARS 0.400 11/12/15 5,024,994.00 5,024,994.20 20,099.98 5,045,094.18
11/12/15 MATURITY RE0908179 CITY FIRST BK OF WASHINGTON, DC (CDARS) 0.300 11/12/15 5,019,985.00 5,019,985.06 15,059.96 5,035,045.02
11/15/15 INTEREST 166764AL4 CHEVRON CORP NOTE 1.345 11/15/17 885,000.00 0.00 5,951.63 5,951.63
11/15/15 INTEREST 912828WF3 US TREASURY NOTES 0.625 11/15/16 4,600,000.00 0.00 14,375.00 14,375.00
11/18/15 INTEREST 58933YAG0 MERCK & CO GLOBAL NOTES 1.300 05/18/18 731,000.00 0.00 4,751.50 4,751.50
11/22/15 INTEREST 06406HDB2 BANK OF NEW YORK MELLON CORP (CALLABLE) 1.600 05/22/18 1,800,000.00 0.00 13,840.00 13,840.00
11/26/15 INTEREST 65558LFA5 NORDEA BANK FINLAND NY CD 1.150 05/26/17 1,800,000.00 0.00 10,407.50 10,407.50
11/30/15 INTEREST 3130A5EP0 FHLB GLOBAL NOTES 0.625 05/30/17 1,775,000.00 0.00 5,546.88 5,546.88
Upcoming Transaction Cash FlowsNext 30 Days
Finance and Budget Committee - 2. October 2015 Financial Report (Attachment 1) - Mark Kim
27

Investment Performance Report – October 2015
Prepared by PFM Asset Management LLC 15
Appendix:Economic Update
Finance and Budget Committee - 2. October 2015 Financial Report (Attachment 1) - Mark Kim
28

Investment Performance Report – October 2015
Prepared by PFM Asset Management LLC 16
Gross Domestic Product
• Third quarter gross domestic product (GDP) was released showing growth of only 1.5%.
• As Consumer Confidence has rebounded from its depths during the recession, so has spending.
Source: Bloomberg
-10%
-8%
-6%
-4%
-2%
0%
2%
4%
6%
1Q20
08
1Q20
09
1Q20
10
1Q20
11
1Q20
12
1Q20
13
1Q20
14
1Q20
15
1Q20
16
Gross Domestic ProductJanuary 2008 – September 2016 (Projected)
University of Michigan Consumer ConfidenceJanuary 2007 – September 2015
October 2015 Bloomberg Survey of
Economists
0
20
40
60
80
100
120
140
160
Jan
'07
Jan
'08
Jan
'09
Jan
'10
Jan
'11
Jan
'12
Jan
'13
Jan
'14
Jan
'15
Finance and Budget Committee - 2. October 2015 Financial Report (Attachment 1) - Mark Kim
29

Investment Performance Report – October 2015
Prepared by PFM Asset Management LLC 17
-1000
-800
-600
-400
-200
0
200
400
600
800
0.00%
2.00%
4.00%
6.00%
8.00%
10.00%
12.00%
14.00%
16.00%
18.00%
Oct 07 Oct 08 Oct 09 Oct 10 Oct 11 Oct 12 Oct 13 Oct 14 Oct 15
Employment Growth – Well Above Expectations
Unemployment vs. Non-Farm PayrollsMay 2007 – October 2015
Source: Bloomberg
U-6 Unemployment Rate
• In October, the U.S economy added 271,000 jobs, the largest gain this year and well above the estimate of 185,000
for the month.
• The unemployment rate fell to a seven-year low of 5.0%.
U-3 Unemployment Rate
Finance and Budget Committee - 2. October 2015 Financial Report (Attachment 1) - Mark Kim
30

Investment Performance Report – October 2015
Prepared by PFM Asset Management LLC 18
FOMC Statement and Outlook
Source: Federal Reserve and Bloomberg
• The current 0 – 0.25% target range for the federal funds rate remains appropriate …the
Committee will assess progress - both realized and expected - toward its objective of
maximum employment at 2% inflation.
• Committee anticipates that it will be appropriate to raise the target range for the
federal funds rate when it has seen further improvements in the labor market and is
reasonably confident that inflation will move back to its 2% objective over the
medium term.
October
28
30%
40%
50%
60%
70%
80%
90%
6/30/15 7/31/15 8/31/15 9/30/15 10/31/15
Probability of December Rate Hike
0%
20%
40%
60%
80%
100%
120%
De
c-15
Jan-
16
Mar
-16
Apr
-16
Jun-
16
Jul-1
6
Sep
-16
Nov
-16
De
c-16
Feb
-17
Pro
bab
ility
FOMC Meeting Dates
Current Outlook for Fed Funds Target Range
0.25-0.50
0.50-0.75
0.75-1.00
1.00-1.25
1.25-1.50
1.50-1.75
Finance and Budget Committee - 2. October 2015 Financial Report (Attachment 1) - Mark Kim
31

Investment Performance Report – October 2015
Prepared by PFM Asset Management LLC 19
1.90%
2.00%
2.10%
2.20%
2.30%
2.40%
2.50%
6/30/15 7/31/15 8/31/15 9/30/15 10/31/15
U.S. 10 Year Treasury Yield
Drivers of Yield Changes in the 3rd Quarter
Source: Bloomberg
• The three major headlines throughout the quarter – Greece debt woes, China growth scare, and FOMC’s “no hike” decision – impacted the yield curve differently.
• Short and intermediate maturities were
most impacted by changing FOMC
expectations. Longer maturities were
driven by slowing global growth and
inflation expectations. 0.50%
0.55%
0.60%
0.65%
0.70%
0.75%
0.80%
0.85%
6/30/15 7/31/15 8/31/15 9/30/15 10/31/15
U.S. 2 Year Treasury Yield
Greece Concerns
China Devaluation
FOMC Decision
Finance and Budget Committee - 2. October 2015 Financial Report (Attachment 1) - Mark Kim
32

Investment Performance Report – October 2015
Prepared by PFM Asset Management LLC 20
Interest Rates Rose Slightly in October
U.S. Treasury Yield CurveOctober 31, 2015 vs. September 30, 2015
Source: Bloomberg
9/30/2015 10/31/2015 Change
3 month -0.02% 0.07% 0.09%
6 month 0.07% 0.23% 0.16%
1 year 0.31% 0.32% 0.01%
2 year 0.63% 0.73% 0.10%
3 year 0.96% 1.10% 0.14%
5 year 1.42% 1.57% 0.15%
10 year 2.04% 2.14% 0.10%
30 year 2.85% 2.92% 0.07%0.00%
0.50%
1.00%
1.50%
2.00%
2.50%
3.00%
3.50%
Yield(%)
10/31/2015 9/30/2015
Finance and Budget Committee - 2. October 2015 Financial Report (Attachment 1) - Mark Kim
33

Investment Performance Report – October 2015
Prepared by PFM Asset Management LLC 21
Disclosure
This material is based on information obtained from sources generally believed to be reliable and available to the public, however PFM Asset Management LLC cannot guarantee its accuracy, completeness or suitability. This material is for general information purposes only and is not intended to provide specific advice or a specific recommendation. All statements as to what will or may happen under certain circumstances are based on assumptions, some but not all of which are noted in the presentation. Assumptions may or may not be proven correct as actual events occur, and results may depend on events outside of your or our control. Changes in assumptions may have a material effect on results. Past performance does not necessarily reflect and is not a guaranty of future results. The information contained in this presentation is not an offer to purchase or sell any securities.
Finance and Budget Committee - 2. October 2015 Financial Report (Attachment 1) - Mark Kim
34

Board ApprovedFY2015 Financial Plan FY2015 Actual*
Total Revenue 542,643,172 546,095,590Total Expense 475,363,789 434,594,969CFCI 20,058,317 20,058,317Operating Income 47,221,066 91,442,304Other Transfers/Credits (23,152,805) (7,535,721)Net Income 24,068,261 83,906,583Beginning Cash Balance over Target 17,642,005 17,642,005Transfer to CIP (41,710,266) (41,710,266)Surplus - 59,838,322Recommendation:Transfer to RSF (17,500,000)Balance to Paygo (22,283,565)Ending Cash Balance over Target (20,054,757)
* Preliminary unaudited year-end projections, subject to change
Attachment 2
FY2015 Net Income – Budget vs. Actual
Finance and Budget Committee - 3. FY 2015 Net Income - Budget vs. Actual (Attachment 2) - Mark Kim
35

District of Columbia Water and Sewer Authority
Proposed FY 2017 Budget
Blue Plains Advanced Wastewater Treatment Plant
Presentation to the Finance & Budget Committee, November 20, 2015
ATTACHMENT 3
Finance and Budget Committee - 4. FY 2017 Proposed Budget (Attachment 3) - Mark Kim
36

Finance & Budget Committee
Proposed FY 2017 Budget Overview
• 10-Year Disbursement - $3.66B• FY 2017 Disbursement - $472.2M • Lifetime Budget - $10.4B
CIP Budget
• Total Operating Budget - $535.8M• Operations & Maintenance - $321.4M• Debt Service - $169.3M• CFCI - $24.0M • PILOT/ROW - $21.1M
Operating Budget
2
Finance and Budget Committee - 4. FY 2017 Proposed Budget (Attachment 3) - Mark Kim
37

Finance & Budget Committee
10-Year Capital Improvement Program:Disbursement & Lifetime
3
Service Area
($000’s)
FY 2016
Revised
FY 2017
ProposedFY 2018 FY 2019 FY 2020 FY 2021 FY 2022 FY 2023 FY 2024 FY 2025
10-Year
Total
Lifetime
Budget
Non Process Facilities $ 9,309 $ 28,613 $ 13,048 $ 6,979 $ 1,588 $ 1,684 $ 7,002 $ 2,475 $ 668 $ 2 $ 71,368 $ 139,297
Wastewater Treatment 168,637 117,814 112,562 79,528 70,980 62,014 53,700 46,753 35,028 50,142 797,159 3,066,979
Combined Sewer Overflow 223,105 151,125 148,159 145,945 169,272 146,994 95,429 89,666 84,037 76,648 1,330,380 3,174,995
Stormwater 1,263 1,430 2,902 2,011 745 2,022 6,318 1,256 1,797 1,650 21,396 84,898
Sanitary Sewer 34,786 61,144 54,102 53,215 62,566 51,543 42,443 45,439 50,498 52,201 507,937 1,429,216
Water 61,878 62,537 44,909 60,975 56,201 59,170 61,158 68,675 80,703 79,790 635,995 1,847,670
Capital Projects 498,977 422,663 375,682 348,654 361,353 323,426 266,052 254,263 252,731 260,434 3,364,235 9,743,055
Capital Equipment 39,226 38,737 27,127 26,289 10,401 10,035 9,413 9,119 8,896 8,915 188,156 205,861
Washington Aqueduct 10,838 10,838 10,838 10,888 11,018 11,199 11,184 11,054 10,816 9,537 108,209 108,209
Additional Capital Programs 50,063 49,575 37,964 37,177 21,419 21,234 20,597 20,173 19,712 18,452 296,365 314,070
Labor 352,774
Total CIP $ 549,040 $472,238 $413,646 $385,831 $382,772 $344,660 $286,649 $274,436 $272,442 $278,886 $3,660,600 $ 10,409,899
FY 2016 - FY 2025 Disbursement Plan
Finance and Budget Committee - 4. FY 2017 Proposed Budget (Attachment 3) - Mark Kim
38

Finance & Budget Committee
10-Year Capital Disbursement Plan
4
$589
$549
$472
$414
$386
$383
$345
$287
$274
$272
$279
$0
$100
$200
$300
$400
$500
$600
$700
$ in
mill
ion
s
FY16-18 Budget Cap = $1.44BFY16-25 Budget = $3.66B
Maintained FY 2016 budget at prior Board-approved level of $549.0MIncreased FY 2017 $30.1M from $442.1M to $472.2M
Increased FY 2018 $40.5M from $373.1M to $413.6MEstablished a new 3-year “rolling cap” of $1.44B with no further revisions to FY 2017
Finance and Budget Committee - 4. FY 2017 Proposed Budget (Attachment 3) - Mark Kim
39

Finance & Budget Committee
20-Year Capital Disbursements
5
$191 $177
$303
$255 $262
$397
$463
$548
$682
$589
$549
$472
$414 $386 $383
$345
$287 $274 $272 $279
$0
$100
$200
$300
$400
$500
$600
$700
$800
$ in
mill
ion
s
Historical Projected
Finance and Budget Committee - 4. FY 2017 Proposed Budget (Attachment 3) - Mark Kim
40

Finance & Budget Committee 6
FY 2016 vs. FY 2017 Expenditure Budgets
Approved FY 2016$541,605
Proposed FY 2017$535,825
Personnel Services$144,761
27.0%
Contractual Services$82,760 15.4%
Water Purchases$29,278
5.5%
Chemicals and Supplies$34,709
6.5%
Utilities$28,670
5.4%
Small Equipment
$1,230 0.2%
Debt Service$169,346
31.6%
Cash Financed Capital
Improvements$24,014
4.5%
PILOT$15,957
3.0%ROW$5,100 1.0%Personnel
Services$140,034 25.9%
Contractual Services$79,243 14.6%
Water Purchases$30,740 5.7%
Chemicals and Supplies$35,951 6.6%
Utilities$35,018 6.5%
Small Equipment
$1,465 0.3%
Debt Services$174,766 32.3%
Cash Financed Capital
Improvements$23,644 4.4%
PILOT$15,644 2.9%
ROW$5,100 0.9%
($000’s)
Finance and Budget Committee - 4. FY 2017 Proposed Budget (Attachment 3) - Mark Kim
41

Finance & Budget Committee
Key Drivers: Personnel Services
*
* Actual result is subject to change after completion of year-end financial audit
Personnel Services – Increase of $4.7M is mainly for projected payroll increase due to hiring efforts, overtime and health benefits costs. Excludes merit and bonus payHeadcount – No increase to the Board-authorized headcount until single-digit vacancy rate is achieved
Benefits – Increase attributable to health costs consistent with industry trends
7
Actual Approved Proposed
FY 2013 FY 2014 FY 2015 FY 2016 FY 2017
Authorized 1,243 1,260 1,260 1,260 1,260
Filled 1,080 1,081 1,127
Vacant 163 179 133
Vacancy Rate 13% 14% 11%
Actual Approved Proposed
FY 2013 FY 2014 FY 2015* FY 2016 FY 2017
Life Insurance 0.1% 0.1% 0.1% 0.1% 0.1%
Health 11.6% 12.6% 12.8% 14.1% 15.4%
Dental 0.5% 0.5% 0.5% 0.5% 0.5%
Optical 0.1% 0.1% 0.1% 0.2% 0.2%
Retirement 8.9% 9.6% 9.6% 9.7% 9.4%
Employment Taxes 6.2% 6.5% 6.7% 6.5% 7.1%
Total Benefits
(as a % of regular salary) 27.5% 29.4% 29.8% 31.1% 32.8%
Finance and Budget Committee - 4. FY 2017 Proposed Budget (Attachment 3) - Mark Kim
42

Finance & Budget Committee
Key Drivers: Utility Costs
Utilities – $6.3M decrease mainly for electricity (assumes authority-wide usage of 27MW, net of Combined Heat & Power (CHP) electric generation of 7.2 MW)Purchase Strategy – To ensure greater budget certainty and take advantage of the decline in the energy prices, 17 MW and 10 MW have been hedged in FY 2017 and FY 2018 respectively
* Actual result is subject to change after completion of year-end financial audit
30 29 3033
27
0
5
10
15
20
25
30
35
$-
$5,000
$10,000
$15,000
$20,000
$25,000
$30,000
FY 2013 FY 2014 FY 2015* FY 2016Approved
FY 2017Proposed
Ave
rage
Usa
ge (
MW
)
Elec
tric
ity E
xpen
ditu
res
($00
0's)
Total Electricity Expenditures Average Usage (MW)
8
Actual
Finance and Budget Committee - 4. FY 2017 Proposed Budget (Attachment 3) - Mark Kim
43

Finance & Budget Committee
Key Drivers: Contracts & Chemicals Costs
Contracts – $3.5M net increase for various professional and maintenance services including software matrix, claims costs and DC Water Works program; offset by decrease in biosolidshauling costs (assumes 500 wet tons/day). Reduction in Biosolids volume effective Feb. 2015Chemicals & Supplies – $1.2M net decrease due to reduction in use of lime and polymer attributable to new processes. Increase in supplies due to impact of new safety requirements for fire retardant uniforms consistent with the Unions’ working conditions requirements
* Actual result is subject to change after completion of year-end financial audit
9
0
200
400
600
800
1000
1200
$0
$5,000
$10,000
$15,000
$20,000
$25,000
FY 2013 FY 2014 FY 2015* FY 2016Approved
FY 2017Proposed
Wet
Ton
s/D
ay
Expe
nditu
res
($00
0's)
Biosolid Hauling Costs
Total Hauling Cost Average (Wet Tons/Day)
0
50
100
150
200
250
300
$0
$5,000
$10,000
$15,000
$20,000
$25,000
$30,000
FY 2013 FY 2014 FY 2015* FY 2016Approved
FY 2017Proposed
Ave
rage
Pla
nt F
low
s (M
GD
)
Expe
nditu
res
($00
0's)
Chemicals
Chemical Cost Average Plant Flow (MGD)
Actual Actual
Finance and Budget Committee - 4. FY 2017 Proposed Budget (Attachment 3) - Mark Kim
44

Finance & Budget Committee
FY 2016 FY 2017 FY 2018 FY 2019 FY 2020 FY 2021 FY 2022 FY 2023 FY 2024 FY 2025O&M* $303,458 $299,474 $308,458 $320,706 $330,333 $340,243 $350,451 $360,964 $371,793 $382,947Debt Service $174,766 $169,346 $188,374 $204,397 $222,365 $240,841 $250,777 $258,414 $265,823 $273,229
$0
$50,000
$100,000
$150,000
$200,000
$250,000
$300,000
$350,000
$400,000
$450,000
$000
’s
* O&M excludes Capital Labor Charges
Key Drivers: Debt Service
Debt Service – Net decrease of $5.4M mainly due to no issuance of revenue bonds during FY 2016
10
Finance and Budget Committee - 4. FY 2017 Proposed Budget (Attachment 3) - Mark Kim
45

Finance & Budget Committee 11
FY 2016 vs. FY 2017 Operating Revenues
Approved FY 2016$580,514
Proposed FY 2017$592,803
($000’s)
Residential$99,03717.1%
Commercial$140,724
24.2%
Multi-family$72,13612.4%
Federal Government
$62,98910.9%
Municipal Housing$23,258
4.0%
Water System Replacement
Fee$40,000
6.9%
Metering Fee$10,776
1.9%
Wholesale$79,45813.7%
Other Revenue$52,136
9.0% Residential$104,665
17.7%
Commercial$149,820
25.3%
Multi-family$75,63412.8%
Federal Government
$53,5909.0%
Municipal Housing$24,816
4.2%
Water System Replacement
Fee$40,000
6.7%
Metering Fee$10,776
1.8%
Wholesale$79,94613.5%
Other Revenue$53,556
9.0%
Finance and Budget Committee - 4. FY 2017 Proposed Budget (Attachment 3) - Mark Kim
46

Finance & Budget Committee 12
Revenue Comparison by Customer Class
($000's) Approved Proposed
FY 2016 FY 2017 $ %
Retail Revenue $448,920 $459,301 $10,381 2.3%
Wholesale Revenue
Potomac Interceptor (PI) 1,960 1,960 - -
Loudoun County Sanitation Authority (LCSA) 5,528 5,574 46 0.8%
Washington Suburban Sanitary Commission (WSSC) 57,869 58,204 335 0.6%
Fairfax County 14,101 14,208 107 0.8%
Total Wholesale Revenue 79,458 79,946 488 0.6%
Other Revenue 52,136 53,556 1,420 2.7%
Rate Stabilization Fund - - - -
Total Revenues $580,514 $592,803 $12,289 2.1%
Increase/(Decrease)
Total revenue is projected to increase by $12.3M or 2.1%
Retail revenue is projected to increase by $10.4M or 2.3%
Wholesale revenue is projected to increase by $0.5M or 0.6%
Finance and Budget Committee - 4. FY 2017 Proposed Budget (Attachment 3) - Mark Kim
47

Finance & Budget Committee
IMA Billing Methodology
13
Historically, estimated Inter Municipal Agreement (IMA) operating costs were determined by allocating the operating budget to IMA participants based on proportionate flows• Resulted in average overestimated charges in years FY 2011 – FY 2013 of
$7.8 million
Revised Methodology – Tighter Operating Budgets• Removed excess contingency funding in Authority-wide budget
• Resulted in overestimated charges in FY 2014 of $1.7 million
• Incorporated 3-year average of actuals where applicable, budget adjustments, and departmental re-organizations for IMA estimated billing
Finance and Budget Committee - 4. FY 2017 Proposed Budget (Attachment 3) - Mark Kim
48

Finance & Budget Committee 14
Financial Plan – Projected Water & Sewer Rates
Combined water and sewer rate is projected to increase by 55% from $8.84 per Ccf in FY 2016 to $13.72 in FY 2025
Annual rate increase of 5% for FY 2017 to FY 2025
* Rates shown above reflect weighted water and sewer rates for the Residential customer category
6.5%
5.0% 5.0% 5.0% 5.0% 5.0% 5.0% 5.0% 5.0% 5.0%
$8.84 $9.27 $9.74 $10.23
$10.74 $11.28 $11.85
$12.45 $13.07 $13.72
$0.0
$2.0
$4.0
$6.0
$8.0
$10.0
$12.0
$14.0
$16.0
0.0%
2.0%
4.0%
6.0%
8.0%
10.0%
12.0%
14.0%
16.0%
FY 2016 FY 2017 FY 2018 FY 2019 FY 2020 FY 2021 FY 2022 FY 2023 FY 2024 FY 2025
Rat
e pe
r C
cf
Rat
e In
crea
se %
Projected Rate Increase (%) Residential Projected Rate ($)
Finance and Budget Committee - 4. FY 2017 Proposed Budget (Attachment 3) - Mark Kim
49

Finance & Budget Committee 15
Financial Plan – Projected Customer Bills
The average residential customer monthly bill is projected to increase by 57% from $97 in FY 2016 to $152 in FY 2025
$97$101
$108$114
$121$128
$134$140
$146$152
$0
$20
$40
$60
$80
$100
$120
$140
$160
FY 2016 FY 2017 FY 2018 FY 2019 FY 2020 FY 2021 FY 2022 FY 2023 FY 2024 FY 2025
Aver
age
Resi
dent
ial C
usto
mer
Mon
thly
BIll
($)
Clean Rivers IAC
Water & SewerCharges
District of ColumbiaFees (PILOT, ROW& Stormwater)
Customer MeteringFee
Water SystemReplacement Fee
Finance and Budget Committee - 4. FY 2017 Proposed Budget (Attachment 3) - Mark Kim
50

Finance & Budget Committee
Operational Risks
• Collective bargaining agreement (expired September 30, 2015)
• Overtime to meet emergency and understaffing needs
• Higher plant flows and biosolids production
Financing Risks
• Credit ratings
• Market access
• Interest rates
16
Budget Risks and Considerations
Finance and Budget Committee - 4. FY 2017 Proposed Budget (Attachment 3) - Mark Kim
51

Finance & Budget Committee
Appendix
17
Finance and Budget Committee - 4. FY 2017 Proposed Budget (Attachment 3) - Mark Kim
52

Finance & Budget Committee
Ten Year Capital Improvement ProgramCash disbursements from FY 2016 - FY 2025, $ in thousands
FY 2016 FY 2017 FY 2018 FY 2019 FY 2020 FY 2021 FY 2022 FY 2023 FY 2024 FY 2025 10 Yr Total
NON PROCESS FACILITIES Facility Land Use 9,309 28,613 13,048 6,979 1,588 1,684 7,002 2,475 668 2 71,368
Subtotal $9,309 $28,613 $13,048 $6,979 $1,588 $1,684 $7,002 $2,475 $668 $2 $71,368
WASTEWATER TREATMENT Liquid Processing 16,193 23,871 33,857 38,248 20,311 18,334 21,093 9,546 4,208 9,838 195,499 Plantwide 15,798 16,207 17,013 22,534 36,598 26,048 28,560 34,936 24,521 16,636 238,853 Solids Processing 28,652 5,130 8,247 12,912 10,154 16,684 3,448 1,019 780 507 87,531 Enhanced Nitrogen Removal Facilities 107,994 72,606 53,445 5,834 3,917 947 600 1,252 5,520 23,161 275,277
Subtotal $168,637 $117,814 $112,562 $79,528 $70,980 $62,014 $53,700 $46,753 $35,028 $50,142 $797,159
COMBINED SEWER OVERFLOW D.C. Clean Rivers 212,012 141,323 130,177 124,526 158,111 135,594 82,990 82,447 77,753 62,581 1,207,515 Program Management 1,832 2,844 3,033 2,333 2,593 2,404 3,890 4,359 3,060 1,846 28,195 Combined Sewer 9,261 6,958 14,950 19,086 8,567 8,996 8,549 2,860 3,224 12,220 94,671
Subtotal $223,105 $151,125 $148,159 $145,945 $169,272 $146,994 $95,429 $89,666 $84,037 $76,648 $1,330,380
STORMWATER Local Drainage 223 66 822 290 8 63 608 265 844 1,024 4,214 On-Going 459 438 390 455 487 535 693 698 744 463 5,361 Pumping Facilities - 126 774 964 78 1,280 4,787 23 - - 8,031 DDOT 18 10 26 - - - - - - - 54 Research and Program Management 256 179 194 158 172 145 230 269 210 163 1,977 Trunk/Force Sewers 307 611 696 144 - - - - - - 1,758
Subtotal $1,263 $1,430 $2,902 $2,011 $745 $2,022 $6,318 $1,256 $1,797 $1,650 $21,396
SANITARY SEWER Collection Sewers 4,190 6,318 7,629 7,108 8,140 17,982 17,299 17,894 21,345 22,394 130,300 On-Going 7,463 9,299 8,734 7,223 6,334 7,421 7,749 8,139 8,440 8,637 79,440 Pumping Facilities 2,267 1,743 1,800 795 165 1,378 151 229 - - 8,528 Program Management 6,742 12,269 10,382 6,036 5,827 4,840 6,521 7,442 6,756 5,278 72,092 Interceptor/Trunk Force Sewers 14,124 31,514 25,556 32,053 42,099 19,921 10,723 11,736 13,958 15,893 217,577
Subtotal $34,786 $61,144 $54,102 $53,215 $62,566 $51,543 $42,443 $45,439 $50,498 $52,201 $507,937
WATER Distribution Systems 35,667 32,929 25,610 38,203 38,356 36,401 42,808 51,372 57,333 63,136 421,815 Lead Program 1,575 1,171 870 1,547 2,114 2,507 2,885 3,190 3,129 3,633 22,622 On-Going 5,105 7,116 5,306 6,310 5,931 5,716 5,799 5,879 6,171 6,338 59,672 Pumping Facilities 3,833 5,083 4,211 2,454 2,105 747 735 1,824 8,468 1,510 30,970 DDOT 893 627 389 - - - - - - - 1,909 Storage Facilities 9,515 9,115 3,427 7,420 3,779 7,582 2,459 2,188 1,343 557 47,387 Program Management 5,288 6,495 5,096 5,042 3,916 6,218 6,471 4,221 4,259 4,616 51,621
Subtotal $61,878 $62,537 $44,909 $60,975 $56,201 $59,170 $61,158 $68,675 $80,703 $79,790 $635,995
CAPITAL PROJECTS $498,977 $422,663 $375,682 $348,654 $361,353 $323,426 $266,052 $254,263 $252,731 $260,434 $3,364,235
CAPITAL EQUIPMENT 39,226 38,737 27,127 26,289 10,401 10,035 9,413 9,119 8,896 8,915 188,156WASHINGTON AQUEDUCT 10,838 10,838 10,838 10,888 11,018 11,199 11,184 11,054 10,816 9,537 108,209
ADDITIONAL CAPITAL PROGRAMS $50,063 $49,575 $37,964 $37,177 $21,419 $21,234 $20,597 $20,173 $19,712 $18,452 $296,365
TOTAL 10-YEAR CIP BUDGETS $549,040 $472,238 $413,646 $385,831 $382,772 $344,660 $286,649 $274,436 $272,442 $278,886 $3,660,600
18
Finance and Budget Committee - 4. FY 2017 Proposed Budget (Attachment 3) - Mark Kim
53

Finance & Budget Committee
Major Initiatives Funded in Current CIP
DC Clean Rivers (Total = $1,208M)• Northeast Boundary Tunnel ($506M)• Potomac LTCP Projects ($237M)• Rock Creek LTCP Projects ($72M)
Water Pipe Program ($421M)• Small Diameter Water mains (1% replacement) ($299M)• Large Valve Replacements ($29M)• Large Diameter Water Mains ($93M)
Water Pump Stations and Storage Rehab ($78M)• St. Elizabeth Water Tank ($15M)• 2nd High Water Storage ($10M)• Bryant St Pump Station ($13M)
($’s – Projected FY 2016 - FY 2025 Disbursements)
Grey Infrastructure ($180M)Green Infrastructure ($129M)
19
Finance and Budget Committee - 4. FY 2017 Proposed Budget (Attachment 3) - Mark Kim
54

Finance & Budget Committee
Major Initiatives Funded in Current CIP (cont.)
Sewer Pipe Program ($374M)• Sewer Restoration Program ($148M)
• Creek Bed Sewer Rehab ($43M)
• Major Facility Plan Sewer Rehabs ($183M)ß Potomac Interceptor ($43M)
Sewer Pump Stations Rehab ($67M)• Potomac Pump Station ($10M)
• Main and O Street Pump Station ($48M)
Wastewater Blue Plains ($797M)• Enhanced Clarification Facility ($97M)• Tunnel Dewatering Pump Station ($18M = ENR allocation)• Division D Bolling Overflow and Diversion ($31M)• Filtrate Treatment Facility ($46M)
Headquarters Building ($55M)
($’s – Projected Disbursements)
20
Finance and Budget Committee - 4. FY 2017 Proposed Budget (Attachment 3) - Mark Kim
55

Finance & Budget Committee
Below the Line Projects are not included in the Proposed 10-year Cash Disbursements or Lifetime Budget
Blue Plains ($229M) - for example:
• Full Plant Deammonification ($45M)
• Various Plantwide Rehabilitation Projects ($33M)
• End of useful life rebuild projects ($71M)
Planned Sewer Projects ($290M) – for example:
• Rehab Northeast Boundary Sewer Phase 2 ($45M)
• Tiber Creek Sewer Lining Ph 1 ($40M)
• Rehab of Influent Sewers ($81M)
• Rehab of Anacostia Force Main ($16M)
Planned Water Projects ($91M) – for example:
• 1 MG 4th High East Storage Tank ($8M)
• Large Valve Replacements ($18M)
($’s – Projected Disbursements)
Unfunded Projects
21
Finance and Budget Committee - 4. FY 2017 Proposed Budget (Attachment 3) - Mark Kim
56

Finance & Budget Committee
Regulatory/Consent Decree:• MS4 Regulations/Policy - Not in plan. $’s unknown• DC Clean Rivers Green Infrastructure Consent Decree (GI CD) Modification –
Public comment period over with EPA• DC Clean Rivers Potomac River and Rock Creek Basin, both green and grey do not
include risk allowance• Blue Plains NPDES Permit renewal 2015 review ongoing• Chesapeake Bay Total Maximum Daily Loads (TMDL) 2017 mid term assessment• TMDL – E. coli
Other Risks/Sensitivities:• Pepco DC Power Line Undergrounding (DC PLUG)• Blue Plains Odor Control• FY 2016 Water and Sewer Facility Plan updates likely to identify additional needs• Ramped up condition assessment on large sewers• Determination of responsibility for storm water pumping stations
CIP Risks/Sensitivities
22
Finance and Budget Committee - 4. FY 2017 Proposed Budget (Attachment 3) - Mark Kim
57

Finance & Budget Committee
Capital Equipment ($188.2M)• IT/Executive Steering Committee working to prioritize IT initiatives• To right-size budgets within operating departments, allocation reduced closer
to historical spending average• Authority-wide reserve fund of $40.7M for FY 2016 - FY 2025, to support
operating departments with additional funding (if required)
Washington Aqueduct ($108.2M)• Budget represents approximately 72% of Washington Aqueduct’s total 10-year
CIP• Project progress has been slow due to loss of talented engineering staff and
unexpected project delays ß Project expenditures expected to increase in the 2nd quarter of FY 2016ß Billing will be suspended for a least 3 quarters to use prepaid, uncommitted
funds from escrow/US Treasury account
23
FY 2016 - FY 2025 CIP: Additional Capital Programs
Finance and Budget Committee - 4. FY 2017 Proposed Budget (Attachment 3) - Mark Kim
58

Finance & Budget Committee
Historical & Projected Operating Expenditure
* Actual result is subject to change after completion of year-end financial audit.
($000's) FY 2009 FY 2010 FY 2011 FY 2012 FY 2013 FY 2014 FY 2015 FY 2015 FY 2016 FY 2017
Revised Projections Approved Proposed
Authorized Headcount 1124 1124 1165 1202 1243 1260 1260 1260 1260 1260
Filled/Budgeted Headcount 1000 1004 1032 1051 1080 1081 1222 1114 1260 1260
Salary 74,803$ 79,234$ 82,220$ 85,107$ 94,473$ 98,864$ 106,685$ 105,531$ 108,392$ 110,664$
Benefits 16,954 18,958 20,926 22,227 24,094 26,892 28,860 28,733 31,642 34,096
Total Personnel Services 91,757 98,192 103,146 107,335 118,567 125,756 135,544 134,263 140,034 144,761
Chemicals 22,222 21,779 21,042 21,359 21,401 24,141 27,395 23,296 28,106 26,288
Supplies 5,559 4,945 5,370 5,385 5,719 6,577 8,791 8,036 7,845 8,422
Utilities 32,813 29,929 29,429 26,786 26,098 29,939 30,416 31,261 35,018 28,670
Contractual Services 64,513 69,498 71,067 64,939 68,430 68,178 76,944 70,535 79,244 82,760
Water Purchases 25,371 27,587 27,170 28,389 27,223 28,407 28,831 29,200 30,740 29,278
Small Equipment 526 858 694 1,139 1,192 317 1,028 536 1,465 1,230
Total Non-Personnel Services 151,004 154,596 154,772 147,997 150,063 157,559 173,406 162,864 182,417 176,647
Total O&M Expenses 242,761$ 252,787$ 257,917$ 255,332$ 268,630$ 283,316$ 308,950$ 297,127$ 322,451$ 321,408$
Debt Service 74,777 83,514 91,888 99,272 107,700 120,165 160,264 140,671 174,766 169,346
Payment in Lieu of Taxes 14,083 15,374 16,882 16,882 16,882 6,358 21,587 15,337 15,644 15,957
Right of Way 5,100 5,100 5,100 5,100 5,100 5,100 5,100 5,100 5,100 5,100
Cash Financed Capital Improvements - - - - - - 20,058 - 23,644 24,014
Total Debt Service/PILOT/ROW/CFCI 93,960 103,988 113,870 121,254 129,682 131,624 207,009 161,108 219,154 214,417
Total Operating Expenditures 336,721$ 356,775$ 371,788$ 376,586$ 398,312$ 414,939$ 515,959$ 458,235$ 541,605$ 535,825$
Less: PS charged to Capital Projects (9,509) (9,982) (9,906) (9,550) (14,659) (17,289) (17,266) (18,741) (18,993) (21,934)
Total Net Operating Expenditures 327,212$ 346,793$ 361,882$ 367,036$ 383,653$ 397,650$ 498,693$ 439,494$ 522,612$ 513,891$
Actuals
24
Finance and Budget Committee - 4. FY 2017 Proposed Budget (Attachment 3) - Mark Kim
59

Finance & Budget Committee
Historical & Projected Operating Budget Performance
* Actual result is subject to change after completion of year-end financial audit.
FY 2010 FY 2011 FY 2012 FY 2013 FY 2014 FY 2015* FY 2016 FY 2017
Budget $271,148 $282,674 $290,765 $297,009 $286,416 $308,950 $322,451 $321,408
Actual $252,787 $257,917 $255,331 $268,630 $283,316 $297,126
$-
$100,000
$200,000
$300,000
$400,000
$500,000
$600,000
$000
's
O & M Expenditures
FY 2010 FY 2011 FY 2012 FY 2013 FY 2014 FY 2015* FY 2016 FY 2017
Budget $382,279 $403,382 $415,360 $440,321 $441,717 $515,959 $541,605 $535,825
Actual $356,775 $371,788 $376,586 $398,312 $414,939 $458,235
$-
$100,000
$200,000
$300,000
$400,000
$500,000
$600,000
$000
's
Total Operating Expenditures
25
Finance and Budget Committee - 4. FY 2017 Proposed Budget (Attachment 3) - Mark Kim
60

Finance & Budget Committee 26
Proposed FY 2017 & FY 2018 Rates, Charges & Fees
Units ApprovedFY 2016
Proposed FY 2017
Proposed FY 2018
Incr. /(Decr.)FY 2017
Incr. /(Decr.)FY 2018
$ % $ %
DC Water Retail Rates – Water: Residential – Lifeline (0- 4 Ccf)Residential – (> 4 Ccf)Multi-family Non-Residential
CcfCcfCcf Ccf
$3.083.873.45 3.99
$3.234.063.62 4.19
$3.394.263.80 4.40
$0.15 5.0% $0.16 5.0%0.19 5.0 0.20 5.00.17 5.0 0.18 5.00.20 5.0 0.21 5.0
DC Water Retail Rates – Sewer Ccf 5.44 5.71 6.00 0.27 5.0 0.29 5.0
DC Water Clean Rivers IAC ERU 20.30 22.24 25.18 1.94 9.6 2.94 13.2
DC Water Customer Metering Fee 5/8” 3.86 3.86 3.86 - - - -
DC Water System Replacement Fee 5/8” 6.30 6.30 6.30 - - - -
District of Columbia PILOT Fee Ccf 0.47 0.48 0.49 0.01 2.0 0.01 2.0
District of Columbia Right of Way Fee Ccf 0.17 0.17 0.18 - - 0.01 1.0
District of Columbia Stormwater Fee ERU 2.67 2.67 2.67 - - - -
Finance and Budget Committee - 4. FY 2017 Proposed Budget (Attachment 3) - Mark Kim
61
Biosolids Management Program:Fiscal Impact Analysis - Update
Presented to Finance & Budget CommitteeNovember 20, 2015
ATTACHMENT 4
Finance and Budget Committee - 5. Digester Project UPdate (Attachment 4) - Leonard Benson and Mark Kim
62

Agenda
• Program Background
• Program Benefits
• Construction Projects Status
• Commissioning and Performance Status
• Operational Budget Assumptions & Fiscal Impact
Finance and Budget Committee - 5. Digester Project UPdate (Attachment 4) - Leonard Benson and Mark Kim
63

• In 2008, the Biosolids Management Plan (BMP) update identified Thermal Hydrolysis Process (THP) and digestion as the most effective solution for biosolids management at DC Water
• The program benefits:o Hedging against Class B biosolids land application restrictionso Hedge against electricity cost uncertainty
ÿ Reliable supplemental power providing up to 1/3 of the energy use at Blue Plains
o Generation of Class A biosolids increases diversity of product use by expanding markets which provides greater sustainability
o Approx. 50% Reduction in quantity of biosolids and disposal costso Reduction of operating power costs o Avoids substantial upgrades to the Lime Stabilization process facilities:
ÿ There was No “Do Nothing” alternative examined
Page 3
Program Background
Finance and Budget Committee - 5. Digester Project UPdate (Attachment 4) - Leonard Benson and Mark Kim
64

• The program estimated financial benefits are in the following areas of operations:o Hauling costs through reduction in volume R Completeo Chemical Costs: Discontinue use of lime stabilization R Completeo Electricity: on-site power generation with a net installed capacity
of 10 MW R Complete
Page 4
Program Benefits
Finance and Budget Committee - 5. Digester Project UPdate (Attachment 4) - Leonard Benson and Mark Kim
65

Biosolids Program - Major Components• Main Process Train 99% complete
o Seeding of digesters on 09/30/2014o Cambi start-up on 10/14/2014o All biosolids through new Facilities as of 02/16/2015
• Combined Heat and Power 98% completeo Steam production started for CAMBI on Temporary boilers on
02/26/2014o CHP generation started in June 2015
• Final Dewatering Facilities 95% completeo Started receiving THP digested sludge on 11/25/2014o All BFPs were ready to receive Class A as of 03/02/2015
Page 5
Construction Project Status
Finance and Budget Committee - 5. Digester Project UPdate (Attachment 4) - Leonard Benson and Mark Kim
66

Commissioning and Performance Status
• THP and Digestion Facilities are in full operation and performance tests are ongoing
• Reached Class A quality in Feb 2015o Certification pending
• Belt press facility is fully commissioned• CHP is being commissioned
o Gas turbine operation began in Juneo 3 turbines, 1 duct burner typically in
service over the past 3 monthso Producing about 6 MW of power under
current conditionsÿ Lower than expected solids loading due to less
growth than predicted and seasonal variability
ÿ Performance testing is ongoing and optimization to follow
ÿ Variability of turbine performance based on humidity and temperature in addition to impact of loading on performance
Page 6
Finance and Budget Committee - 5. Digester Project UPdate (Attachment 4) - Leonard Benson and Mark Kim
67

• The digesters have been exceeding the expected process performance:o Better Volatile Solids destruction: up to 61% versus 55-58% in designo Better dewaterability: up to 31.5% versus 29-30% in designo Lower polymer dosages than expected 12-16 lbs/DT versus 20-30 lbs/DT
in designo Better biosolids product
ÿ Low odor
ÿ Better granularity for mixing
• Optimization Opportunities – starting spring 2016o Develop baseline operational info (first two calendar years)o Fully train Operations and Maintenance Staff o Optimize flocculant polymer dosing to reduce Nitrogen in recycleo Test additional coagulant polymers for better bid priceo Optimize CHP operations: potential for Natural Gas Blending
Page 7
Commissioning and Performance Status
Finance and Budget Committee - 5. Digester Project UPdate (Attachment 4) - Leonard Benson and Mark Kim
68

Operating Budget Assumptions: Wastewater Treatment - Operations
Page 8
($000’s)FY 2015
ApprovedBudget
FY 2015Year-End
Projections3
FY 2016ApprovedBudget4
FY 2017Proposed
Budget
Inc./(Dec.)FY 2017 vs
FY 2016
Budget DevelopmentTimelines
CY 2013Fall/Winter
CY 2015Summer
CY 2014Fall/Winter
CY 2015Fall
Total Expenditure – WWT -Operations $82,415 $77,136 $86,972 $80,466 ($6,506)
Major Expenditure Line Items (including Digesters)Chemicals (1) $27,260 $23,223 $27,688 $25,895 ($1,793)
Electricity Cost (1)
- Average Usage (2) (MW)$19,073
26MW$19,495
25MW$22,599
29MW$17,089
23MW($5,510)
(7MW)
CHP O&M Fee $4,000 $- $4,000 $4,000 $-
Hauling Cost- Average Wet Tons/Day
$11,213647
$12,065595
$10,783600
$9,600500
($1,183)(100)
Subtotal $61,546 $54,783 $65,070 $56,584 ($8,486)(1) This represents the total chemical and electricity costs for operations of the various WWT facilities, inclusive of the Digesters(2) FY 2017 usage assumes net on-site generation of 7.2MW from the CHP and additional 1.6MW for the FTF coming online in FY 2017(3) Subject to change after completion of year-end financial audit(4) Reflects Board adoption on February 5, 2015. Excludes the impact of the Digesters’ project, estimated at $10.8 million pending completion of the
acceptance testing period by contractor. The projected FY 2016 IMA customers’ bill adjusted for proportionate share of projected savings in electricity
Finance and Budget Committee - 5. Digester Project UPdate (Attachment 4) - Leonard Benson and Mark Kim
69

• FY 2016o Expenditure & Revenue Budgets – Net zero impact
ÿ No revisions to the board-approved operating budgets for the estimated savings (approx. $10.8M)
o Wholesale Revenuesÿ Projected customers’ bills adjusted for proportionate share of the
estimated savings from electricity (approx. $6.7M)
• FY 2017o Budget proposals reflect operational efficiencies from the digester
projecto Wholesale Revenues based on the revised billing estimation
methodology
Page 9
Fiscal Impact – Operating
Finance and Budget Committee - 5. Digester Project UPdate (Attachment 4) - Leonard Benson and Mark Kim
70

FINANCE & BUDGET COMMITTEE
ACTION ITEMS
FY 2017 BUDGET
ATTACHMENT 5
Finance and Budget Committee - 6. Action Items
71

FINANCE AND BUDGET COMMITTEEFISCAL YEAR 2017 PROPOSED OPERATING BUDGET ACTION ITEM
ACTION ITEM 5A: Proposed FY 2017 Operating Budget
The Proposed FY 2017 Operating Budget to be considered by the Board of Directors totals $535,825,000.
Operations & Maintenance Expenditures $321,408,000
Debt Service 169,346,000Cash Financed Capital Improvements (CFCI) 24,014,000Payment In Lieu of Taxes (PILOT) 15,957,000 Right of Way Fee (ROW) 5,100,000 Subtotal (Debt Service/CFCI/PILOT/ROW) $214,417,000
Proposed FY 2017 Operating Budget $535,825,000
Finance and Budget Committee - 6. Action Items
72

FINANCE AND BUDGET COMMITTEEFISCAL YEAR 2016 – 2025 TEN-YEAR FINANCIAL PLAN ACTION ITEM
ACTION ITEM 5B: FY 2016 – FY 2025 Financial Plan
1. Attached is a summary of the 10-year Financial Plan, which is based on the following key assumptions for FY 2017 and FY 2018:
FY 2017
ß Operating receipts totaling $592.8 million, an increase of $12.3 million over FY 2016 funded through;
• Retail Revenue – increase of $10.4 million
• Wholesale Revenue – increase of $0.5 million
• Other Revenue – increase of $1.4 million
ß Operating disbursements of $513.9 million in FY 2017; and
ß A ten-year capital improvement plan (FY 2016 – FY 2025) of $3.66 billion on a cash disbursement basis.
FY 2018
ß Operating receipts totaling $618.7 million, an increase of $25.9 million over FY 2017 funded through;
• Retail Revenue – increase of $25.5 million
• Wholesale Revenue – increase of $2.4 million
• Other Revenue – decrease of ($2.0) million
ß Operating disbursements of $543.5 million in FY 2018; and
ß A ten-year capital improvement plan (FY 2016 – FY 2025) of $3.66 billion on a cash disbursement basis.
The FY 2016 – FY 2025 Financial Plan is projected to meet the Board’s policy requirement of senior debt coverage of 140 percent and an operating reserve of 120 days of budgeted operations and maintenance costs with the objective of maintaining at least$125.5 million in operating reserves.
Finance and Budget Committee - 6. Action Items
73

OPERATING FY 2016 FY 2017 FY 2018 FY 2019 FY 2020 FY 2021 FY 2022 FY 2023 FY 2024 FY 2025
Retail* 469,504 480,278 506,124 532,993 561,367 590,311 616,271 640,056 663,883 687,688Wholesale* 79,458 79,946 82,344 84,814 87,359 89,979 92,679 95,459 98,323 101,273Other 31,553 32,580 30,217 32,107 33,398 37,087 39,695 40,220 40,571 41,405RSF - - - - - - - - - -Operating Receipts (1) 580,514$ 592,803$ 618,685$ 649,914$ 682,123$ 717,378$ 748,644$ 775,735$ 802,777$ 830,366$
Operating Expenses (324,202) (320,531) (329,834) (342,414) (352,367) (362,616) (373,168) (384,034) (395,223) (406,743)
Debt Service (157,640) (169,346) (188,374) (204,397)$ (222,365)$ (240,841)$ (250,777)$ (258,414)$ (265,823)$ (273,229)$
Cash Financed Capital Improvement (CFCI) (23,475)$ (24,014)$ (25,306)$ (26,650)$ (28,068)$ (29,516)$ (30,814)$ (32,003)$ (33,194)$ (34,384)$
Net Revenues After Debt Service 75,197$ 78,912$ 75,170$ 76,454$ 79,323$ 84,405$ 93,886$ 101,284$ 108,536$ 116,010$
Operating Reserve-Beg Balance 160,055 140,000 140,000 140,000 140,000 140,000 140,000 140,000 140,000 140,000
Other Misc (Disbursements)/Receipts Wholesale/Federal True Up (17,179) (24,201) (4,752) - - - - - - - Customer Rebate - - - - - - - - - - Transfers To RSF (19,000) - (9,000) (5,000) (5,000) (4,000) (7,000) (9,000) (19,000) (12,000) Transfers To DC PILOT Fund - - - - - - - - Pay-Go Financing (59,073) (54,711) (61,419) (71,454) (74,323) (80,405) (86,886) (92,284) (89,536) (102,194)
Operating Reserve - Ending Balance 140,000$ 140,000$ 140,000$ 140,000$ 140,000$ 140,000$ 140,000$ 140,000$ 140,000$ 141,816$
Rate Stabilization Fund Balance RSF (2) (51,450)$ (51,450)$ (60,450)$ (65,450)$ (70,450)$ (74,450)$ (81,450)$ (90,450)$ (109,450)$ (121,450)$
Senior Debt Service Coverage 462% 430% 406% 442% 460% 452% 473% 470% 551% 582%
Combined Debt Service Coverage 153% 159% 157% 159% 156% 155% 156% 157% 155% 159%
Actual/Projected Water/Sewer Rate Increases 6.5% 5.0% 5.0% 5.0% 5.0% 5.0% 5.0% 5.0% 5.0% 5.0%
*Operating Receipts $ Increase/DecreaseRetail 65,394 10,774 25,846 26,869 28,374 28,944 25,960 23,785 23,827 23,806Wholesale (1,772) 488 2,398 2,470 2,544 2,621 2,699 2,780 2,864 2,950
*Operating Receipts % Increase/DecreaseRetail 16.2% 2.3% 5.4% 5.3% 5.3% 5.2% 4.4% 3.9% 3.7% 3.6%Wholesale -2.2% 0.6% 3.0% 3.0% 3.0% 3.0% 3.0% 3.0% 3.0% 3.0%
(1) Includes interest earnings on senior lien revenue bonds' debt service reserve fund(2) FY 2016 planned transfer of $19.0 million to Rate Stabilization Fund will bring the total fund balance to $51.45 million
District of Columbia Water & Sewer AuthorityFY 2016 – 2025 Financial Plan
(In 000’s)
Finance and Budget Committee - 6. Action Items
74

UnitsCurrent FY 2016
Proposed FY 2017
Proposed FY 2018 FY 2019 FY 2020 FY 2021 FY 2022 FY 2023 FY 2024 FY 2025
DC Water and Sewer Retail Rates (1) Ccf 59.12$ 62.04$ 65.16$ 68.41$ 71.86$ 75.45$ 79.26$ 83.28$ 87.43$ 91.80$
DC Water Clean Rivers IAC ERU 20.30 22.24 25.18 28.19 31.43 34.67 37.16 39.06 40.84 42.49
DC Water Customer Metering Fee 5/8" 3.86 3.86 3.86 3.86 3.86 3.86 3.86 3.86 3.86 3.86
DC Water Water System Replacement Fee (3) 5/8" 6.30 6.30 6.30 6.30 6.30 6.30 6.30 6.30 6.30 6.30
Subtotal DC Water Rates & Charges 89.58$ 94.44$ 100.50$ 106.76$ 113.45$ 120.28$ 126.58$ 132.50$ 138.43$ 144.45$
Increase / Decrease 11.30$ 4.86$ 6.06$ 6.26$ 6.69$ 6.83$ 6.30$ 5.92$ 5.93$ 6.02$
District of Columbia PILOT (1) Ccf 3.14$ 3.21$ 3.28$ 3.35$ 3.41$ 3.48$ 3.55$ 3.61$ 3.68$ 3.75$
District of Columbia Right-of-Way Fee (1) Ccf 1.14 1.14 1.20 1.20 1.20 1.20 1.20 1.20 1.27 1.27
District of Columbia Stormwater Fee (2) ERU 2.67 2.67 2.67 2.67 2.67 2.67 2.67 2.67 2.67 2.67
Subtotal District of Columbia Charges 6.95$ 7.02$ 7.15$ 7.22$ 7.28$ 7.35$ 7.42$ 7.48$ 7.62$ 7.69$
Total Amount Appearing on DC Water Bill 96.53$ 101.46$ 107.65$ 113.98$ 120.73$ 127.63$ 134.00$ 139.98$ 146.05$ 152.14$
Increase / Decrease Over Prior Year 11.36$ 4.93$ 6.19$ 6.33$ 6.75$ 6.90$ 6.37$ 5.98$ 6.07$ 6.09$
Percent Increase in Total Bill 13.3% 5.1% 6.1% 5.9% 5.9% 5.7% 5.0% 4.5% 4.3% 4.2%
(1) Assumes average monthly consumption of 6.69 Ccf, or (5,004 gallons)
(2) District Department of the Environment stormwater fee of $2.67 effective November 1, 2010
(3) DC Water "Water System Replacement Fee" of $6.30 effective October 1, 2015
FY 2016 - FY 2025 Average Residential Customer Monthly Bill
District of Columbia Water & Sewer Authority
Finance and Budget Committee - 6. Action Items
75

UnitsCurrent FY 2016
Proposed FY 2017
Proposed FY 2018
DC Water Retail Rates Water (Residential Lifeline 0 - 4 Ccf) Ccf 3.08$ 3.23$ 3.39$
DC Water Retail Rates Water (Residential > 4 Ccf) Ccf 3.87$ 4.06$ 4.26$
DC Water Retail Rates Water (Multi-Family) Ccf 3.45$ 3.62$ 3.80$
DC Water Retail Rates Water (Non-Residential) Ccf 3.99$ 4.19$ 4.40$
DC Water Retail Rates Sewer Ccf 5.44$ 5.71$ 6.00$
DC Water Clean Rivers IAC ERU 20.30$ 22.24$ 25.18$
DC Water Customer Metering Fee 5/8" 3.86$ 3.86$ 3.86$
DC Water Water System Replacement Fee 5/8" 6.30$ 6.30$ 6.30$
District of Columbia PILOT Fee Ccf 0.47$ 0.48$ 0.49$
District of Columbia Right of Way Fee Ccf 0.17$ 0.17$ 0.18$
District of Columbia Stormwater Fee ERU 2.67$ 2.67$ 2.67$
District of Columbia Water & Sewer Authority Retail Rates, Charges and Fees
Finance and Budget Committee - 6. Action Items
76

FINANCE AND BUDGET COMMITTEEFISCAL YEAR 2016 – 2025 PROPOSED CAPITAL IMPROVEMENT
PROGRAM AND LIFETIME BUDGETACTION ITEM
ACTION ITEM 5C: FY 2016 – FY 2025 Proposed Capital Improvement Program (10-Year Disbursement Plan and Lifetime Budget)
DC Water presents its capital improvement program on two different bases:
a. 10-Year Disbursement Plan – The cash disbursement-based capital plan is utilized to forecast the timing and amount of capital financing, which is the primary basis for projected retail rate increases. As shown in Attachment A-1, the Board of Directors will be asked to approve a 10-year disbursement plan of $3.66 billion.
b. Lifetime Budget – The project lifetime budget reflects the total costs of each project active during the 10-year planning period. These costs include historical and projected spending, project contingencies, and labor (listed as separate line item). As shown in Attachment A-1, the Board of Directors will be asked to approve a lifetime budget of $10.4 billion.
Finance and Budget Committee - 6. Action Items
77

10-Year Disbursement Plan & Lifetime Budget Attachment A-1$ in thousands
Lifetime
FY 2016 FY 2017 FY 2018 FY 2019 FY 2020 FY 2021 FY 2022 FY 2023 FY 2024 FY 2025 10-Yr Total Budget
NON PROCESS FACILITIES
Facility Land Use $9,309 $28,613 $13,048 $6,979 $1,588 $1,684 $7,002 $2,475 $668 $2 $71,368 $139,297
Subtotal 9,309 28,613 13,048 6,979 1,588 1,684 7,002 2,475 668 2 71,368 139,297
WASTEWATER TREATMENT
Liquid Processing 16,193 23,871 33,857 38,248 20,311 18,334 21,093 9,546 4,208 9,838 195,499 808,430
Plantwide 15,798 16,207 17,013 22,534 36,598 26,048 28,560 34,936 24,521 16,636 238,853 496,407
Solids Processing 28,652 5,130 8,247 12,912 10,154 16,684 3,448 1,019 780 507 87,531 722,944
Enhanced Nitrogen Removal Facilities 107,994 72,606 53,445 5,834 3,917 947 600 1,252 5,520 23,161 275,277 1,039,198
Subtotal 168,637 117,814 112,562 79,528 70,980 62,014 53,700 46,753 35,028 50,142 797,159 3,066,979
COMBINED SEWER OVERFLOW
D.C. Clean Rivers 212,012 141,323 130,177 124,526 158,111 135,594 82,990 82,447 77,753 62,581 1,207,515 2,771,514
Program Management 1,832 2,844 3,033 2,333 2,593 2,404 3,890 4,359 3,060 1,846 28,195 64,563
Combined Sewer 9,261 6,958 14,950 19,086 8,567 8,996 8,549 2,860 3,224 12,220 94,671 338,918
Subtotal 223,105 151,125 148,159 145,945 169,272 146,994 95,429 89,666 84,037 76,648 1,330,380 3,174,995
STORMWATER
Local Drainage 223 66 822 290 8 63 608 265 844 1,024 4,214 16,636
On-Going 459 438 390 455 487 535 693 698 744 463 5,361 12,415
Pumping Facilities 0 126 774 964 78 1,280 4,787 23 0 0 8,031 25,000
DDOT 18 10 26 0 0 0 0 0 0 0 54 3,237
Research and Program Management 256 179 194 158 172 145 230 269 210 163 1,977 12,013
Trunk/Force Sewers 307 611 696 144 0 0 0 0 0 0 1,758 15,597
Subtotal 1,263 1,430 2,902 2,011 745 2,022 6,318 1,256 1,797 1,650 21,396 84,898
SANITARY SEWER
Collection Sewers 4,190 6,318 7,629 7,108 8,140 17,982 17,299 17,894 21,345 22,394 130,300 338,534
On-Going 7,463 9,299 8,734 7,223 6,334 7,421 7,749 8,139 8,440 8,637 79,440 209,243
Pumping Facilities 2,267 1,743 1,800 795 165 1,378 151 229 0 0 8,528 34,759
Program Management 6,742 12,269 10,382 6,036 5,827 4,840 6,521 7,442 6,756 5,278 72,092 133,321
Interceptor/Trunk Force Sewers 14,124 31,514 25,556 32,053 42,099 19,921 10,723 11,736 13,958 15,893 217,577 713,359
Subtotal 34,786 61,144 54,102 53,215 62,566 51,543 42,443 45,439 50,498 52,201 507,937 1,429,216
WATER
Distribution Systems 35,667 32,929 25,610 38,203 38,356 36,401 42,808 51,372 57,333 63,136 421,815 1,087,947
Lead Program 1,575 1,171 870 1,547 2,114 2,507 2,885 3,190 3,129 3,633 22,622 208,640
On-Going 5,105 7,116 5,306 6,310 5,931 5,716 5,799 5,879 6,171 6,338 59,672 135,714
Pumping Facilities 3,833 5,083 4,211 2,454 2,105 747 735 1,824 8,468 1,510 30,970 178,399
DDOT 893 627 389 0 0 0 0 0 0 0 1,909 33,933
Storage Facilities 9,515 9,115 3,427 7,420 3,779 7,582 2,459 2,188 1,343 557 47,387 101,834
Program Management 5,288 6,495 5,096 5,042 3,916 6,218 6,471 4,221 4,259 4,616 51,621 101,203
Subtotal 61,878 62,537 44,909 60,975 56,201 59,170 61,158 68,675 80,703 79,790 635,995 1,847,670
CAPITAL PROJECTS 498,977 422,663 375,682 348,654 361,353 323,426 266,052 254,263 252,731 260,434 3,364,235 9,743,055
CAPITAL EQUIPMENT 39,226 38,737 27,127 26,289 10,401 10,035 9,413 9,119 8,896 8,915 188,156 205,861
WASHINGTON AQUEDUCT 10,838 10,838 10,838 10,888 11,018 11,199 11,184 11,054 10,816 9,537 108,209 108,209
ADDITIONAL CAPITAL PROGRAMS 50,063 49,575 37,964 37,177 21,419 21,234 20,597 20,173 19,712 18,452 296,365 314,070
LABOR 352,774
TOTAL CAPITAL BUDGETS $549,040 $472,238 $413,646 $385,831 $382,772 $344,660 $286,649 $274,436 $272,442 $278,886 $3,660,600 $10,409,899
FY 2016 - FY 2025 Disbursement Plan
Finance and Budget Committee - 6. Action Items
78

FINANCE AND BUDGET COMMITTEEINTENT TO REIMBURSE CAPITAL EXPENDITURES WITH PROCEEDS
OF A BORROWING ACTION ITEM
ACTION ITEM 5D: Capital Projects Reimbursement Resolution
The Board will be asked to approve a reimbursement resolution, which wouldallow for reimbursement of eligible capital project expenditures from bond proceeds. The action under consideration is to utilize the proceeds of tax-exempt bonds, taxable bonds or notes (the “bonds”) or other debt in an amount not currently expected to exceed $443,000,000 to pay the costs of capital projects. These costs include amounts heretofore unreimbursed pursuant to Resolution 15-20 of the Board adopted on February 5, 2015, plus amounts projected to be reimbursed during Fiscal Years 2016 - 2017.
EXHIBIT A – LIST OF PROJECTS
Blue Plains SystemNon Process Facilities Sanitary Sewer System Combined Sewer System DC Clean Rivers Stormwater Sewer System Water Pumping, Distribution and Storage Metering and Capital EquipmentWashington Aqueduct
Finance and Budget Committee - 6. Action Items
79

FINANCE & BUDGET COMMITTEE
ACTION ITEM
RECOMMENDATION FOR FY 2015RATE STABILIZATION FUND
ATTACHMENT 6
Finance and Budget Committee - 6. Action Items
80

FINANCE & BUDGET COMMITTEEFY 2015 TRANSFER OF EXCESS FUNDS
TO THE RATE STABILIZATION FUND
ACTION ITEM 6A: Approval of transfer of funds from the operating account to the Rate Stabilization Fund.
The Board will be asked to approve a resolution to approve the transfer of excess FY 2015 operating funds to the Rate Stabilization Fund in the amount of seventeen million five hundred thousand dollars ($17,500,000).
Finance and Budget Committee - 6. Action Items
81

*Detailed agenda can be found on DC Water’s website at www.dcwater.com/about/board_agendas.cfm
D.C. WATER AND SEWER AUTHORITYBOARD OF DIRECTORS
FINANCE & BUDGETDECEMBER COMMITTEE MEETING
Friday, December 18, 2015; 9:30 a.m.Blue Plains Wastewater Treatment Plant
5000 Overlook Avenue, SW, DCAGENDA
Call to Order ..................................................................................................................Chairman
November 2015 Financial Report ............................................................ Chief Financial Officer
Agenda for January Committee Meeting .....................................................................Chairman
Adjournment .................................................................................................................Chairman
ATTACHMENT 7
Finance and Budget Committee - 7. Agenda for December Committee Meeting (Attachment 7) - Timothy L. Firestine
82