district of columbia green bank report, april 3, 201 - doee · pdf filedistrict of columbia...
TRANSCRIPT
1
District of Columbia Green Bank Report
Prepared for the District Department of Energy and Environment (DOEE)
April 3, 2017
Prepared by the Coalition for Green Capital
This report represents the research and recommendations of the Coalition for Green Capital, and does
not represent a specific position of DOEE or the District Government.
2
Contents Chapter 1 – The Green Bank Model ....................................................................................................5
Introduction to Green Banks..................................................................................................................... 5
Green Bank Benefits ................................................................................................................................. 6
Barriers to Private Financing ..................................................................................................................... 8
Green Bank Organization .......................................................................................................................... 9
Target Markets ........................................................................................................................................ 10
Green Bank Financing Techniques .......................................................................................................... 12
Credit Enhancements .......................................................................................................................... 12
Co-Investment ..................................................................................................................................... 12
Warehousing & Securitization ............................................................................................................ 13
Other Green Bank Financing Methods ................................................................................................... 13
Generating Demand for Clean Energy Products ..................................................................................... 15
Green Bank Examples ............................................................................................................................. 16
Connecticut Green Bank ..................................................................................................................... 17
New York Green Bank ......................................................................................................................... 22
Hawaii Green Infrastructure Authority ............................................................................................... 23
California CLEEN Center ...................................................................................................................... 24
Rhode Island Infrastructure Bank ....................................................................................................... 24
Montgomery County Green Bank ....................................................................................................... 25
Chapter 2 – Current District Market Conditions, Activity & Needs...................................................... 27
Serviceable Addressable Market for Clean Energy ................................................................................. 27
Past District Financing Assessment ......................................................................................................... 28
2009 District PSC Report on Clean Energy Financing .......................................................................... 28
DC OCFO Infrastructure Bank White Paper ........................................................................................ 29
Current District Programs & Finance Activity ......................................................................................... 30
DC PACE Current Status ...................................................................................................................... 30
District Financing Gaps and Needs ......................................................................................................... 32
Chapter 3 – District Green Bank Recommendations .......................................................................... 34
Summary of Recommendations .............................................................................................................. 34
District Green Bank Legal Structure ........................................................................................................ 35
New Division of DOEE ......................................................................................................................... 36
3
External Entity Administered by Private Third-Party Under Contract ................................................ 36
Quasi-Public Instrumentality, Wholly-Owned Public Corporation ..................................................... 38
Funding Level & Market Impact .............................................................................................................. 41
District Green Bank Capitalization Methods & Sources.......................................................................... 43
Green Bank Funding Methods ............................................................................................................ 43
Green Bank Funding Sources .............................................................................................................. 46
Standing Up the Green Bank ................................................................................................................... 54
Legal Formation & Capitalization ........................................................................................................ 54
Green Bank Operations ....................................................................................................................... 55
Green Bank Activities .............................................................................................................................. 59
Target Market Segments for the District’s Green Bank ...................................................................... 59
Financing Strategies for District’s Green Bank .................................................................................... 61
Financing Products for District Green Bank ........................................................................................ 62
Market Development Activities .......................................................................................................... 74
Coordination with SEU ........................................................................................................................ 76
Conclusion ....................................................................................................................................... 78
Green Bank Recommendations .............................................................................................................. 78
Integration with Existing Programs ......................................................................................................... 79
Appendix – District of Columbia Energy Profile, Policies and Programs .............................................. 82
Current Energy Market Profile ................................................................................................................ 82
Total Energy Mix ................................................................................................................................. 82
Electricity ............................................................................................................................................. 83
Thermal Energy ................................................................................................................................... 87
Emissions ............................................................................................................................................. 88
Looking Ahead ..................................................................................................................................... 90
Institutions .............................................................................................................................................. 90
Department of Energy & Environment ............................................................................................... 90
DC Sustainable Energy Utility .............................................................................................................. 91
Laws and Policies .................................................................................................................................... 91
Renewable Energy............................................................................................................................... 91
Efficiency ............................................................................................................................................. 92
District Goals ........................................................................................................................................... 95
50% Reduction in CO2 Emissions by 2032 .......................................................................................... 95
4
50% Reduction in Energy Use and 50% Power from Renewables by 2032 ........................................ 95
Programs ................................................................................................................................................. 95
Rebates ............................................................................................................................................... 95
Financing ............................................................................................................................................. 97
List of Figures
Figure 1: Current District Solar Capacity (MW) and Capacity Necessary to Meet Goals .............................. 6
Figure 2: Reduced Energy Costs Through Green Bank Financing ................................................................. 7
Figure 3: Hypothetical Green Bank Capital Recycling Model........................................................................ 7
Figure 4: Green Bank Basic Flow Chart ......................................................................................................... 9
Figure 5: Challenges of Financing Distributed Energy Projects .................................................................. 11
Figure 6: Green Bank Financing Techniques ............................................................................................... 12
Figure 7: Simplified PACE Structure with Green Bank Lending................................................................... 14
Figure 8: CT Residential Solar Market Installation Costs, Rebates, and Capacity ....................................... 19
Figure 9: CT Solar Lease 2 Financing Structure ........................................................................................... 20
Figure 10: Connecticut Green Bank v. Connecticut Grant-Making Authority............................................. 22
Figure 11: Hawaii GEMS Financing Structure.............................................................................................. 23
Figure 12: Relationship Between Green Bank & PACE ............................................................................... 37
Figure 16: Bond Issuance Capital Expansion Model ................................................................................... 45
Figure 20: Leveraged Infrastructure Bank Model From DC OCFO White Paper ......................................... 66
Figure 21: Whole-Home Upgrade Reserve Based on CT Smart-E Loan ...................................................... 68
Figure 23: Total Source Energy Consumption in the District of Columbia ................................................. 82
Figure 24: Source Energy Consumption in the District of Columbia by Sector ........................................... 83
Figure 26: District Heating Fuel Consumption by Type .............................................................................. 87
Figure 27: District Residential Natural Gas Prices ($/Mcf) ......................................................................... 88
Figure 30: Changes in Emissions, Population and Workforce 2006-2011 .................................................. 89
List of Tables
Table 1: Summary of Green Bank Institutions ............................................................................................ 17
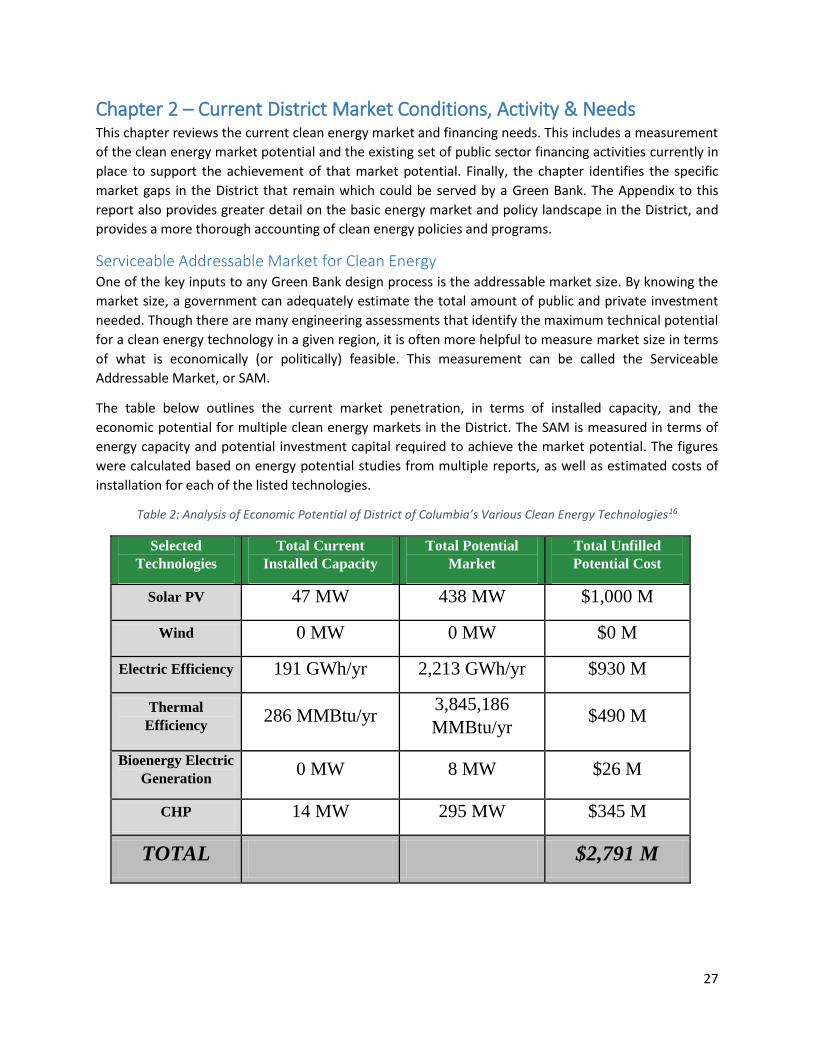
Table 2: Analysis of Economic Potential of District of Columbia’s Various Clean Energy Technologies .... 27
Table 3: DC PACE Deals Competed To Date ................................................................................................ 32
Table 4: Proposed Green Bank Capitalization Schedule ............................................................................. 41
Table 5: Use & Size of Merger Customer Investment Fund ........................................................................ 48
Table 6: Comparison of State EE Program Funding Levels ......................................................................... 51
Table 7: Green Bank Staffing Plan By Entity Structure ............................................................................... 57
Table 8: Green Bank Cost Estimates for Year 1 of Operations ................................................................... 58
Table 9: Pepco Energy Source (Fuel Mix) January 1 – June 30 2014 .......................................................... 85
Table 10: District Electricity Prices by Sector, in cents per kWh ................................................................. 86
Table 11: Energy Expenditures by State ..................................................................................................... 87
Table 12: Covered Properties under the Green Building Act ...................................................................... 93

5
Chapter 1 – The Green Bank Model
Introduction to Green Banks A Green Bank is a public or quasi-public institution that finances the deployment of renewable energy,
energy efficiency, and other clean energy and green infrastructure projects in partnership with private
lenders. They are an institutional platform for public-private partnerships (“PPP” or “P3”). Green Banks
are capitalized with public funds, which are then used to offer loans, leases, credit enhancements and
other financing services to close gaps in the private capital markets for clean energy projects. Green
Banks typically invest in the project deployment of mature, commercially viable technologies – not in
early stage tech or in clean energy companies. The goal of a Green Bank is to accelerate the deployment
of clean energy by removing the upfront cost of adoption, leveraging greater private investment in clean
energy, and increasing the efficiency of public dollars.
Through Green Banks, consumers and businesses can install clean energy technologies with little to no
upfront cost while reducing energy costs and jurisdictions can meet their public policy objectives to
increase energy efficiency and the amount of renewable energy generated. And because public dollars
are used for financing, rather than grants, all funds are preserved through loan repayment. For a
number of reasons discussed below, economically viable, low-risk clean energy projects are often unable
to access affordable private financing. Green Bank financing methods enable private capital to fill
financing gaps by reducing real and perceived risk, and allowing private investors the chance to learn
about a new market opportunity with the security of government partnership. As private lenders gain
experience and information about the processes, risks and addressable market size in clean energy, they
can become increasingly comfortable and confident lending into these markets. Green Banks have
shown that with experience and data, private investors are more eager to enter clean energy markets at
scale, ultimately without any Green Bank support.
Green Banks and public clean energy financing programs are increasingly common across the U.S., as
governments recognize the importance of financing in addition to traditional grant models. Green
Banks, by their nature, are flexible institutions that can be shaped and implemented to address the
needs of the government/market that is creating it. Historically, many governments have supported the
adoption of mature clean energy technologies by offering incentives, rebates, tax credits and other
forms of subsidies. These programs have been somewhat effective in improving the economics of clean
energy installation (primarily for renewables) and stimulating demand among consumers.
However, rebate programs have two primary weaknesses that financing can address. The first is that
rebates traditionally only cover a small portion of a project’s cost. If a rebate covers $2,000 of a $15,000
efficiency project, for example, then the customer still must find $13,000 in cash. This requirement for
upfront, out-of-pocket cash stands as a significant barrier to adoption. The second problem with grants
is that they are expensive, as they are permanent expenditures of taxpayer dollars. To bring clean
energy markets to meaningful scale using grants would require more public expenditure than is
available or politically viable. Therefore, new program solutions are needed that address upfront costs
for consumers and the expense of public capital.

6
Figure 1: Current District Solar Capacity (MW) and Capacity Necessary to Meet Goals
Transitioning to a clean power platform, as outlined in the Sustainable DC Plan, will require enormous
amounts of investment capital. For instance, achieving the 2.5% solar energy requirement for 2023
under the RPS will require approximately 219 MW of in-District capacity at a cost of approximately $657
million in capital investment in only the next eight years.i If even a fraction of the 50% renewable goal
for 2032 is to come from distributed solar systems in the District, it will require potentially more than
one billion dollars in capital investment during the next 17 years.ii
It is implausible that this investment will come entirely from public grants, yet the private investment
needed is not coming quickly enough. Green Banks, which use limited public dollars to leverage private
investment, can build a bridge from today’s market conditions to one where private investment flows.
Green Bank Benefits Green Banks present numerous possible benefits to the District, and could help the District meet its
ambitious clean energy goals without the expense of grants. These benefits include:
Elimination of Upfront Cost – By offering 100% financing, in partnership with private lenders,
Green Banks can eliminate the greatest barrier to consumer and business adoption of clean
energy technologies.
i As of the latest analysis, it is estimated that an additional 219 MW of new solar capacity still needs to be installed in the District by 2023. At an installed cost of $3 per watt, that means a total investment of $657 million. ii Assuming 5% of the renewable electricity necessary to meet the 50% Renewable Portfolio Standard will come from local solar PV, it is estimated 438 MW of new solar capacity needs to be installed in the District by 2032, with a potential investment need of more than one billion dollars.
47
219
438
0
100
200
300
400
500
Installed 2023 RPS Requirement 2032 SustainabilityGoal
MW
of
Cap
acit
yDistrict Solar PV Market Size
7
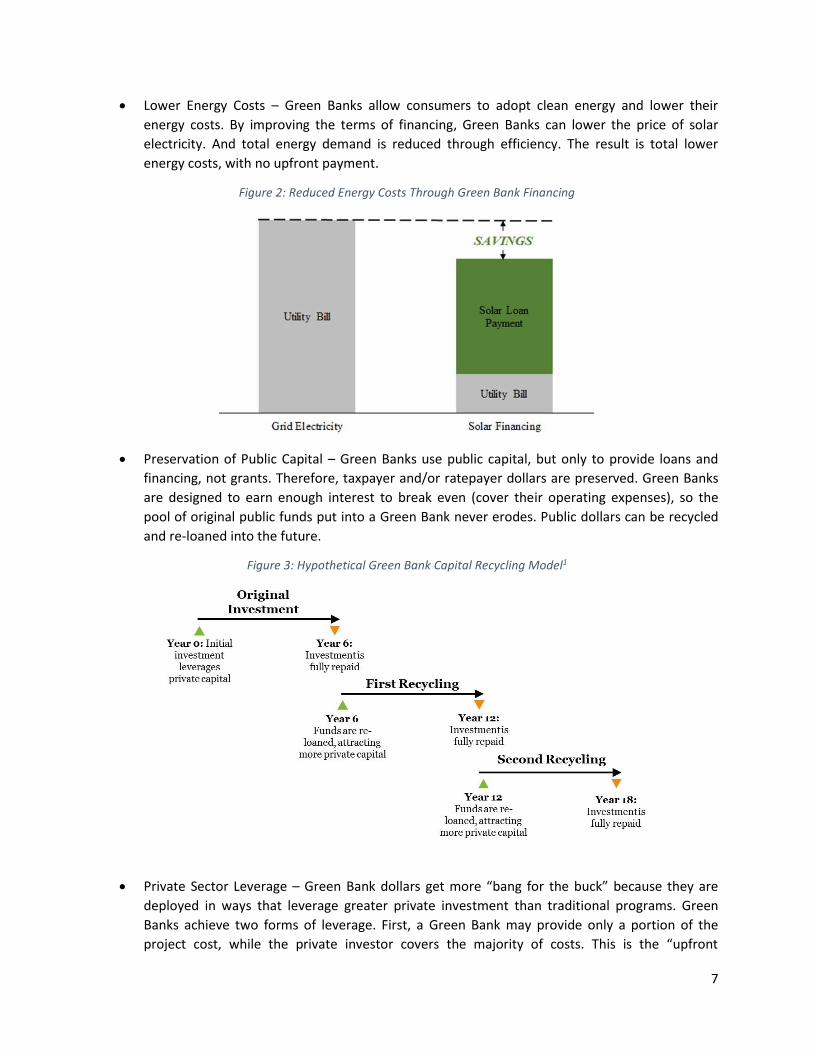
Lower Energy Costs – Green Banks allow consumers to adopt clean energy and lower their
energy costs. By improving the terms of financing, Green Banks can lower the price of solar
electricity. And total energy demand is reduced through efficiency. The result is total lower
energy costs, with no upfront payment.
Figure 2: Reduced Energy Costs Through Green Bank Financing
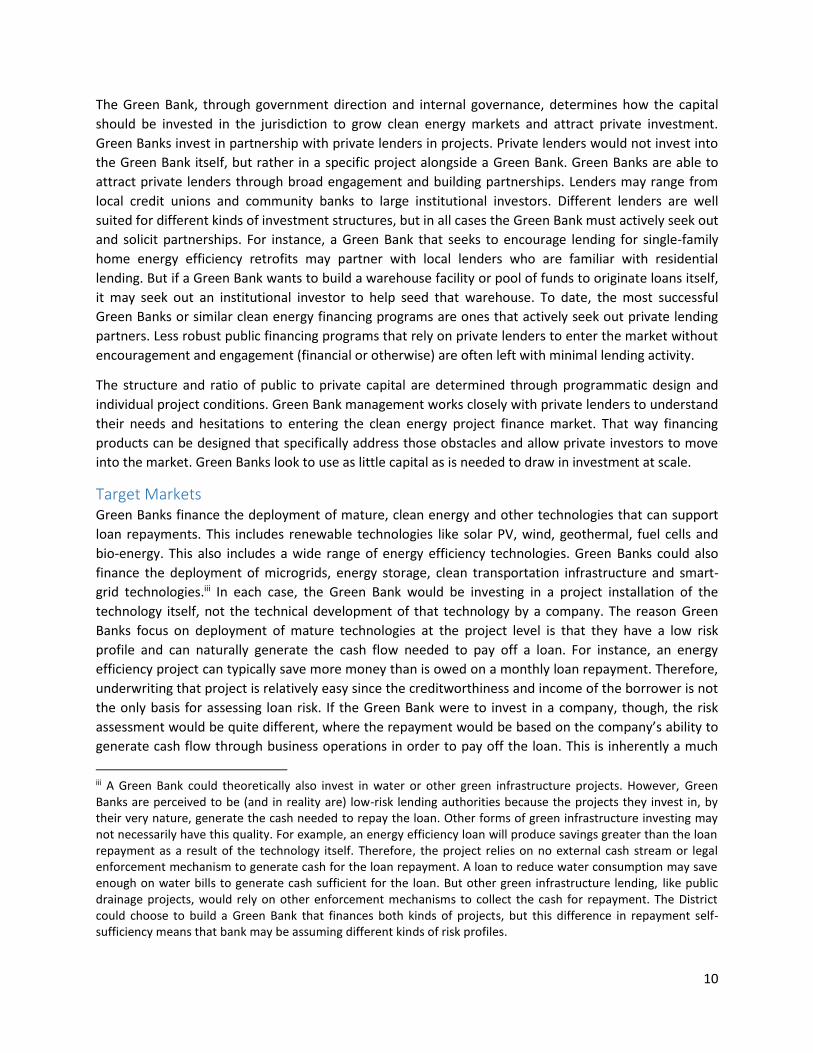
Preservation of Public Capital – Green Banks use public capital, but only to provide loans and
financing, not grants. Therefore, taxpayer and/or ratepayer dollars are preserved. Green Banks
are designed to earn enough interest to break even (cover their operating expenses), so the
pool of original public funds put into a Green Bank never erodes. Public dollars can be recycled
and re-loaned into the future.
Figure 3: Hypothetical Green Bank Capital Recycling Model1
Private Sector Leverage – Green Bank dollars get more “bang for the buck” because they are
deployed in ways that leverage greater private investment than traditional programs. Green
Banks achieve two forms of leverage. First, a Green Bank may provide only a portion of the
project cost, while the private investor covers the majority of costs. This is the “upfront

8
leverage,” and can be as great as 10 private dollars per single public dollar. But, because Green
Bank dollars are recycled, that same public dollar will be repeatedly recycled and leverage more
private capital.
Economic & Job Growth – The increased investment sparked by a Green Bank increases GDP and
creates jobs. More clean energy adoption means more installers and contractors need to be
hired to install the renewable or energy efficiency technology. These are jobs that cannot be
exported and therefore present an immense opportunity for local employment. The renewable
energy sector is already proving to be an enormous driver of employment across the country,
with solar employment growing at a rate 20 times faster than the national rate of job growth.2
Market Standardization – Green Banks can help introduce standardized financing practices and
documentation into the clean energy market. Increased standardization is critical for bringing
markets to scale and increasing private investment. Standardized financing means less
expensive underwriting and an easier access to secondary markets. Green Banks can play a
central role in introducing standards.
Market Transparency – In addition to financing functions, Green Banks can be a centralized
source of market information that increases consumer and business understanding of clean
energy opportunities. A Green Bank website can be a hub of information on market basics, help
consumers understand different programs, learn about installers, and receive estimates of their
own potential savings
Program Coordination – Green Banks can also play an important role of coordinating public
clean energy programs that operate across different agencies. Often, as is the case in the
District, public programs to support clean energy deployment are operated within different
public or quasi-public bodies. To ensure those programs operate at maximum efficiency and
create a single point of contact for customers, it can be beneficial if one agency is tasked with
coordinating and aligning programs across agencies.
Barriers to Private Financing Ideally, private lenders would step in to this market today and cover the remaining upfront costs of
clean energy adoption beyond what is covered by rebates. However, there are capital market
inefficiencies and inherent challenges to financing clean energy that have resulted in inadequate
investment by private lenders. And those private lenders that do offer capital typically charge interest
rates that are relatively high and terms that are short. This erodes the economics of a clean energy
project, which ideally will be cash flow positive from day one. In this context, “cash flow positive” means
that the energy cost savings achieved on a monthly basis as a result of the clean energy installation
exceed the monthly financing charge. Under a cash flow positive project, the borrower is able to, on a
net basis, save money every month without paying any upfront costs, making the project highly
attractive. This kind of cash flow structure is only possible with loan terms that match the expected
lifetime of the project’s savings, and with rates that are commensurate with the risk. Private capital
offered at unfavorable terms (if it is available at all) undercuts the economic attractiveness of the
project for the customer.

9
Private financing gaps exist for several reasons:
The first is that there is a relatively short track record for clean energy financing, and therefore
there is little data for lenders to rely on. Without data, banks are left with high amounts of
uncertainty over how well different types of projects perform and how often borrowers repay
their loans. This uncertainty leads to either hesitation to enter the market or unfavorable
lending terms.
The second cause of financing gaps is that many clean energy projects, especially those suitable
for the District, are small and fragmented. Efficiency upgrades and rooftop solar projects are
inherently small investments and geographically dispersed, with varying credit among project
off-takers. These types of investments are relatively expensive to underwrite for a private
lender, making the loan potentially uneconomical to offer.
A third cause of financing gaps is the lack of capital market liquidity and maturity. If a
commercial bank provides a loan for an energy efficiency project, it is unknown to the bank if it
will be able to sell that loan to another lender or if it will have to hold that loan on its balance
sheet, tying up capital. Mortgage and auto lenders don’t have this difficulty, because there are
highly liquid secondary markets for home and car loans. These kinds of secondary markets are
just now forming for clean energy technologies.
And the final cause of private underinvestment relates to human and organizational behavior. In
order to begin lending into a new market, a bank has to hire new staff, learn about the risks and
processes of a new market, and determine a precise “box” of what kind of project and credit to
which they are willing to lend. This process takes time, commitment and money, all of which will
only come with a greater understanding of market potential and risks.
Green Bank Organization A Green Bank is effectively a public fund used to offer financing and support the growth of clean energy
capital markets. The Green Bank institution that manages the fund is typically directly part of
government, contracted by government, or a quasi-public entity. The Green Bank fund is traditionally
capitalized with public dollars (though other alternative capital sources can be considered).
Figure 4: Green Bank Basic Flow Chart
10
The Green Bank, through government direction and internal governance, determines how the capital
should be invested in the jurisdiction to grow clean energy markets and attract private investment.
Green Banks invest in partnership with private lenders in projects. Private lenders would not invest into
the Green Bank itself, but rather in a specific project alongside a Green Bank. Green Banks are able to
attract private lenders through broad engagement and building partnerships. Lenders may range from
local credit unions and community banks to large institutional investors. Different lenders are well
suited for different kinds of investment structures, but in all cases the Green Bank must actively seek out
and solicit partnerships. For instance, a Green Bank that seeks to encourage lending for single-family
home energy efficiency retrofits may partner with local lenders who are familiar with residential
lending. But if a Green Bank wants to build a warehouse facility or pool of funds to originate loans itself,
it may seek out an institutional investor to help seed that warehouse. To date, the most successful
Green Banks or similar clean energy financing programs are ones that actively seek out private lending
partners. Less robust public financing programs that rely on private lenders to enter the market without
encouragement and engagement (financial or otherwise) are often left with minimal lending activity.
The structure and ratio of public to private capital are determined through programmatic design and
individual project conditions. Green Bank management works closely with private lenders to understand
their needs and hesitations to entering the clean energy project finance market. That way financing
products can be designed that specifically address those obstacles and allow private investors to move
into the market. Green Banks look to use as little capital as is needed to draw in investment at scale.
Target Markets Green Banks finance the deployment of mature, clean energy and other technologies that can support
loan repayments. This includes renewable technologies like solar PV, wind, geothermal, fuel cells and
bio-energy. This also includes a wide range of energy efficiency technologies. Green Banks could also
finance the deployment of microgrids, energy storage, clean transportation infrastructure and smart-
grid technologies.iii In each case, the Green Bank would be investing in a project installation of the
technology itself, not the technical development of that technology by a company. The reason Green
Banks focus on deployment of mature technologies at the project level is that they have a low risk
profile and can naturally generate the cash flow needed to pay off a loan. For instance, an energy
efficiency project can typically save more money than is owed on a monthly loan repayment. Therefore,
underwriting that project is relatively easy since the creditworthiness and income of the borrower is not
the only basis for assessing loan risk. If the Green Bank were to invest in a company, though, the risk
assessment would be quite different, where the repayment would be based on the company’s ability to
generate cash flow through business operations in order to pay off the loan. This is inherently a much
iii A Green Bank could theoretically also invest in water or other green infrastructure projects. However, Green Banks are perceived to be (and in reality are) low-risk lending authorities because the projects they invest in, by their very nature, generate the cash needed to repay the loan. Other forms of green infrastructure investing may not necessarily have this quality. For example, an energy efficiency loan will produce savings greater than the loan repayment as a result of the technology itself. Therefore, the project relies on no external cash stream or legal enforcement mechanism to generate cash for the loan repayment. A loan to reduce water consumption may save enough on water bills to generate cash sufficient for the loan. But other green infrastructure lending, like public drainage projects, would rely on other enforcement mechanisms to collect the cash for repayment. The District could choose to build a Green Bank that finances both kinds of projects, but this difference in repayment self-sufficiency means that bank may be assuming different kinds of risk profiles.

11
riskier loan. Even a typical home mortgage or car loan is riskier, because the ability to repay these loans
is dependent on employment income or other sources of cash. By focusing on low-risk deployment
projects, Green Banks can ensure that public capital is preserved, enabling revolving lending practices.
This also eliminates any debate about “picking winners” or other political arguments that may come
with offering high risk loans to businesses for technology development.
Among the list of mature renewable energy and energy efficiency technologies identified, it is up to
each Green Bank to determine the technologies that are most suitable for its market and that struggle
to find private capital. For instance, a Green Bank may determine that there is a significant wind
resource in its geography, but find that wind projects are able to find ample capital at reasonable rates
through traditional private capital markets. Therefore, wind would not need Green Bank support. Or a
Green Bank may decide that its topography and conditions are not well suited for a given technology
(like large-scale wind in the District).
Typically, the technology applications that are well capitalized by private investors are large, utility-scale
renewable energy projects like wind and solar. These rarely require Green Bank support. Instead, Green
Banks have focused on two categories of projects. One area of focus is on distributed energy projects.
This includes roof-top solar and other on-site generation, as well as energy efficiency. The second focus
of Green Banks has been on utility-fed, medium-scale renewables projects with less common
technologies like anaerobic digesters, bio-energy projects, and fuel cell parks.
Figure 5: Challenges of Financing Distributed Energy Projects
Distributed energy and energy efficiency projects have become a primary focus of Green Banks because
these projects tend to have the greatest difficulty finding reasonably priced private capital. As described
above, the relatively small and dispersed nature of building upgrades and small renewable energy
installations is unappealing for private lenders. Therefore, Green Banks can play a big role stimulating
investments in these projects and creating more robust markets. There are a few distributed clean
energy markets that have access to reasonably priced private capital. Homeowners with high-credit
scores can get financing for roof-top solar through a third-party installer like SolarCity. And large
industrial companies with high credit ratings from major rating agencies can finance a building upgrade

12
through an energy service company (ESCO). Otherwise, projects in nearly all distributed energy markets,
across technologies and sectors, struggle to find capital through private markets.
Green Bank Financing Techniques Green Banks can offer a wide range of types of financing to leverage private capital, but they can
generally be put into three categories.
Credit Enhancements The first category is credit enhancements. A credit enhancement is a tool offered by a Green Bank with
the goal of increasing private lending activity and/or improving the terms of private financing. Green
Banks accomplish this through multiple means, but loan loss reserves and loan guarantees are the most
common. These techniques are suitable for a market where private lenders may be interested in
providing capital but are hesitant due to perceived risks. A credit enhancement can either pull that
lender into the market, and/or encourage that lender to offer more favorable lending terms. Under a
loan loss reserve structure, a Green Bank will put aside capital to cover a certain portion of a lender’s
losses, up to a capped amount of dollars. A reserve can be in the first loss or second loss position in
relation to the lender. This structure provides a lender assurance that some portion of potential losses
would be covered, while also giving the lender incentive to assess risk appropriately because most losses
are still borne by the lender. These kinds of investments can achieve high leverage ratios, stimulating
many dollars of private investment per public dollar of investment.
Figure 6: Green Bank Financing Techniques
Co-Investment A second type of Green Bank investment is direct co-investment in a project. Co-investment involves
direct Green Bank investment in a clean energy project alongside a private investor. Unlike credit
enhancements, where public dollars are not actually invested in the project technology, co-investment
can take multiple forms and structures of actual project investment. A Green Bank may provide senior
debt, subordinated debt, or equity in a project, which is then paired with multiple potential forms of
private investment. For instance, a Green Bank and private bank may each make a 50% debt investment
in a project. Or, a private investor may offer 80% of the debt needed for a project, and the Green Bank
13
makes a 20% subordinated debt investment. This structure both fills financing gaps and acts as a credit
enhancement for the senior debt. The leverage achieved on these co-investments depends on the
precise product structure, and by its nature requires the presence of a private lender willing to take
some risk by making a direct investment in a project.
Warehousing & Securitization A third category of Green Bank financing is warehousing and securitization. In the event no private
lender is willing to underwrite loans, even with a credit enhancement, it may be suitable for a Green
Bank to underwrite 100% of a loan itself. This situation may arise if the technology itself is perceived as
too risky or new, if the market segment is viewed as having insufficient credit, or if the investments
themselves are not cost-effective to underwrite. This final challenge is a significant barrier to private
investment in small and geographically disperse projects like residential or small business energy
efficiency projects. By their nature, these types of projects are relatively low cost and may differ in
terms of credit, technology and location. This makes the projects relatively expensive to underwrite for a
bank and not cost effective. However, if a pool of these kinds of loans were bundled together to
diversify risk and achieve scale, the projects then become far more attractive to lenders. A Green Bank
can accomplish this by underwriting loans directly and warehousing them until scale is reached. At this
point the Green Bank can sell the loans to private investors. This can be done either through a private
placement of all of the loans, a private securitization, or a public securitization. If the Green Bank is able
to sell its entire stake in the portfolio of loans, then 100% of public dollars are replaced with private
capital, effectively achieving infinite leverage. This technique is critical to allowing small clean energy
projects to access the low-cost capital that can be found in publicly traded debt markets which are
accessed through securitization.
Together, these forms of investment enable more private investment, giving private lenders comfort
and experience in the market while preserving public capital. Over time, these partnerships will give
private lenders the information and familiarity needed to provide financing with reduced or no Green
Bank support, while still offering terms that are reasonable and attractive to borrowers.
Other Green Bank Financing Methods In addition to using Green Bank capital to finance projects, Green Banks can also help implement the use
of innovative new financing structures. These include Property Assessed Clean Energy Financing (PACE)
or on-bill repayment (OBR). In both cases, Green Banks can play the role of program administrator, deal
originator, program marketer, or capital provider. The precise role played by a Green Bank in each
market depends on the existing laws, statutes and programs in place. A District Green Bank could work
closely with or take over administrative functions of the existing DC PACE program.
PACE financing allows building owners to repay an efficiency upgrade loan through special property
taxes assessments. PACE assessment payments typically sit senior to all other non-tax liens on a
building, including the mortgage, which significantly reduces the risk of non-payment. Typically, states
or municipalities that have passed PACE allow for financing by any capital provider. Repayment is often
handled by the taxing agency of the jurisdiction and remitted to the lender.
A Green Bank can step in to provide the loan capital in order to kick-start a PACE market (as has been
done in Connecticut). A Green Bank could also offer a credit enhancement to entice private lenders into
the PACE market. A District Green Bank could provide capital to the District program, or offer credit

14
enhancements to the lenders already working with PACE who may not be able to offer capital at long
enough terms.
Figure 7: Simplified PACE Structure with Green Bank Lending
On-bill financing or repayment (OBF/OBR), like PACE, is a financing structure designed to increase the
likelihood of loan repayment.iv It is a structure through which an energy upgrade loan is repaid through
the customer’s utility bill. Similar to PACE, this structure offers greater security for the lender because
historically utility bills have a very high rate of repayment. On-bill financing has additional benefits, too,
because it addresses the split incentive between building owners and tenants. By attaching a loan to a
utility meter, rather than the customer, a tenant can reap the benefits of efficiency, repay only the
portion of the loan that is due while still a tenant, and then hand the remaining payments to the next
tenant who will continue to benefit from the efficiency improvements. This structure can open up new
markets for efficiency financing that otherwise would be unsuitable. Like PACE, a Green Bank could act
as a program administrator and/or lender for on-bill programs.
A District Green Bank could enhance or create either of these structures to enable more financing for
clean energy. A Green Bank could be paired with the District’s PACE program to inject badly needed
capital into the market. In addition, a Green Bank could create, administer and finance an OBR program
that is well suited to rental properties in the District. Both of these programs have the benefit of low
transaction costs because they utilize existing collection systems, and have increased security because of
the payment enforcement mechanism. The District needs to address key questions regarding the
expansion or implementation of both programs. For example, if the District were to expand PACE to
include residential properties, would the lien be senior or subordinate to the mortgage? Recent federal
guidance may push the District to reconsider the lien position of PACE assessments. Currently, PACE
financing is non-accelerating in the District, and only the delinquent special assessment payments are
considered to hold senior lien status. For on-bill repayment, the District will have to address concerns
over whether or not a utility can shut off electricity for those borrowers who may pay their electric bills,
but don’t make the full loan repayment that is attached to those bills.
iv On-bill financing (OBF) typically refers to programs where the utility itself uses its own capital to issue the loans. On-bill repayment (OBR) refers to the programs that allow non-utility lenders to issue loans, where the utility merely acts as a collection platform.
15
Generating Demand for Clean Energy Products In addition to animating investment in clean energy, Green Banks can also help stimulate demand for
clean energy products. Adoption of clean energy technology like efficiency and rooftop solar has been
slow, despite the fact that these investments pay for themselves through savings. The lack of financing
to pay for upfront cost plays a major role in the slow uptake. But demand is also low because clean
energy technologies lack a robust, transparent and efficient market.
When compared to the ease of purchasing consumer goods, as one would on Amazon for instance, the
clean energy purchase process is immensely complex with little information available to consumers. In
addition, clean energy technologies are yet to be intrinsically desired in the same way as other
consumer purchases such as homes and cars. For those products, a consumer decides that s/he wants to
make the purchase, and the financing is what makes the purchase possible. In clean energy markets, the
availability of financing, in and of itself, does not necessarily create the desire for the good. Therefore,
any Green Bank financing would have to be offered in a way that stimulates demand and facilitates the
creation of efficient market structures.
Challenges in deploying capital have resulted in the common refrain that, “capital isn’t the problem – it’s
the demand.” This is a reference to the notion that plenty of capital is available and ready to enter the
market, but the lack of consumer demand is the reason that markets are not growing quickly enough.
The reality, though, is more complex, as offering capital for clean energy financing is not a binary
condition. A bank or a government program may ostensibly make capital available, but because there is
no robust market for clean energy technologies, the multitude of activities and parties needed to bridge
the distance between supply of capital and demand for technologies does not exist. Capital made
available in a vacuum, or at unusable terms, is ultimately not very useful.
The series of activities needed to connect capital supply to customer demand includes: marketing;
dedicated origination channels; partnerships with contractors; contractor training on how to sell their
services with financing; coordination of financing and services with other subsidies; coordination of
multiple contractors on multi-measure projects; and many others. In addition to this list of activities,
often the capital made available for financing is not well-suited for the purposes of clean energy
investing. For instance, a loan may be offered:
with a short-term that prevents deep retrofits;
at an interest rate that prevents a project from being cash flow positive;
with a loan size that prevents deep retrofit projects;
that doesn’t cover 100% of the cost, and offers no assistance to find other lenders;
with credit restrictions that shut-out a majority of the market.
Together these types of financing and program design failures leave customers with an unappealing
choice, where they must either cover the costs themselves, or where their total monthly energy costs
increase. The long list of market and financing deficiencies results in low demand for clean energy
technology. Consumers do not have the time, knowledge, or interest to navigate a complex purchase
process, learn about different technologies and program options, and seek out possibly inadequate
financing entirely on their own. Green Banks can play a critical role in stimulating demand by both
offering suitable financing and delivering products to customers through turn-key program design. A
Green Bank cannot be built on the flawed clean energy financing premise that, “if you build it, they will
16
come.” Rather a Green Bank can design financing programs in coordination with delivery mechanisms,
access to information, and consumer marketing techniques to overcome past demand shortages.
Whether the Green Bank itself is directly engaging in this market creation activity or doing so in
partnership with multiple private partners will depend on precise product and organizational design. But
no matter the design, a Green Bank should strive to ensure customers are presented with simple offers
that are cash flow positive.
Green Bank Examples To date, five states operate Green Banks in the United States. Nearly a dozen other states are also at
some stage of Green Bank exploration or development. There is also one official county Green Bank, and
at least four countries outside the U.S. have national Green Banks. Each of these Green Banks has a
slightly different model and approach, tailored to suit the institutional landscape, legal requirements
and market objectives of that jurisdiction. Some Green Banks are directly part of government, while
others are quasi-public. They draw on a range of public capital sources, and have varying legal
authorities. Some Green Banks are established with a specific list of financing programs already defined
that they must implement, while other Green Banks are less structured, offering capital in response to
requests from market actors. Similarly, a District Green Bank would have to be designed and structured
to fit the specific local needs and conditions. However, all Green Banks are tied by a common set of
principles, which include:
Offering financing, rather than grants
Leveraging public capital to increase private investment
Recycling and recapitalizing funds to redeploy dollars and maximize investment

17
Table 1: Summary of Green Bank Institutions
In addition to these domestic Green Banks, the United Kingdom, Australia, Japan and Malaysia all
operate national Green Banks. The UK Green Investment Bank and the Australian Clean Energy Finance
Corporation (CEFC) are particularly noteworthy for their scale. They have each already invested billions
of dollars, leveraging many multiples of that in private investment.
Connecticut Green Bank The Connecticut Green Bank was created in 2011 as the first state Green Bank in the U.S. Originally
named the Connecticut Clean Energy Finance & Investment Authority, it was created through bi-partisan
legislation that was initiated by newly elected Governor Dannel Malloy.v The new Green Bank institution
was born out of the existing grant-making institution, the Connecticut Clean Energy Fund. The Fund was
repurposed and turned into a deployment financing entity. The Green Bank was created as a quasi-
public agency, with a board of directors that are a mix of government officials and independent
directors. The government officials include the state Treasurer, the Commissioner of the Department of
Energy and Environmental Protection, and the Commissioner of the Department of Economic and
Community Development. The board is charged with setting Green Bank Strategy, approving Green Bank
products and initiatives, and approving loans.
v PA 11-80, the public act creating the Connecticut Green Bank, passed the House by a vote of 139-8 and the Senate 36-0.
18
The Connecticut Green Bank is capitalized by two sources, both of which were identified in the
legislation. The first is a systems benefit charge that collects roughly $20 to $25 million dollars per year.
This was an existing system benefits charge, already in place in the state prior to the creation of the
Green Bank. Previously the entire ratepayer collection went towards state-managed grant programs.
The re-allocation of those funds to the Green Bank represents only a portion of the total collection, with
the remaining funds still going toward grants. The new split in funding between grants and financing was
based on a desire to build market-based mechanisms for clean energy growth. This re-allocation of
funds was also driven by a desire to maximize private leverage from public funds and get the greatest
“bang for the buck” for each public dollar. The second source of Green Bank funds are the state’s
proceeds from the sale of emission allowances through the Regional Greenhouse Gas Initiative (RGGI)
Program. The Green Bank receives 100% of the states RGGI proceeds. In total, this adds to a total annual
infusion in the Green Bank of approximately $30 million. This repeated and perpetual capitalization
means that the Connecticut Green Bank’s balance sheet, and capacity to issue loans, continuously
increases.
In addition to these public capital sources, the Connecticut Green Bank is authorized to issue its own
bonds based on its own balance sheet. The Bank also has limited ability to issue bonds that are
supported by a state bond reserve fund. This is not equivalent to full faith and credit, but does enable
borrowing at lower rates based on the state’s credit rating.
In addition to its broad financing authorities and capital sources, the Connecticut Green Bank was given
two key statutory requirements in its enabling legislation. The first is that the Bank must manage the
execution and ultimate wind down of the state’s residential rooftop solar rebate program. Though this
grant-making role is distinct from the Bank’s broad financing mission, the ability to manage the ramp
down of grant levels and then increase financing under a single coordinated strategy has proven highly
effective for market growth. As seen in the chart below, as the Bank lowered grants consistently through
multiple steps, the increased availability of financing drove unprecedented market growth.vi
vi In fact, the chart shows that the net cost of solar faced by the consumer, after the rebate, has actually remained fairly constant in CT over the last decade. This is because the decline in the gross cost of installation was absorbed by the state in the form of reduced rebates. Therefore, the spike in market adoption is attributable to new financing tools that allowed consumers to adopt solar without paying that remaining net cost of installation upfront.

19
Figure 8: CT Residential Solar Market Installation Costs, Rebates, and Capacity3
Connecticut offered three different financing solutions for the residential market to support solar
installation. The first was a unique, state-sponsored solar tax-equity lease fund that could be used by
any installer in the state. Similar to financing products offered by companies like SolarCity the CT Solar
Lease 2 was a public-private partnership structure that brought $50 million of lease financing to the
market, with a 5-to-1 private:public leverage ratio. The Green Bank itself created and owned a special-
purpose vehicle through an equity investment. The Green Bank also provided subordinated debt, as well
as a loan loss reserve credit enhancement with remaining ARRA stimulus funds. The senior debt was
provided by a syndicate of private banks, and the tax equity was provided by U.S. Bank. This kind of tax-
equity fund enables homeowners to put solar on their roof at no money down, and pay a low monthly
price by taking advantage of federal tax benefits for solar.vii This financing tool was deployed through
local installers, who otherwise would have been unable to offer financing to consumers. This tool
enabled local installers to compete with national companies that had their own financing, and opened
up the market for consumers who did not have the $20,000 or more of cash on hand to buy solar.
vii A tax equity investor effectively invests cash in exchange for the federal Investment Tax Credit and the accelerated depreciation tax benefits enjoyed by solar. This tax value only comes through a tax-equity based structure, and allows consumers to pay a lower price for the solar power than they would if they owned the solar themselves.
20
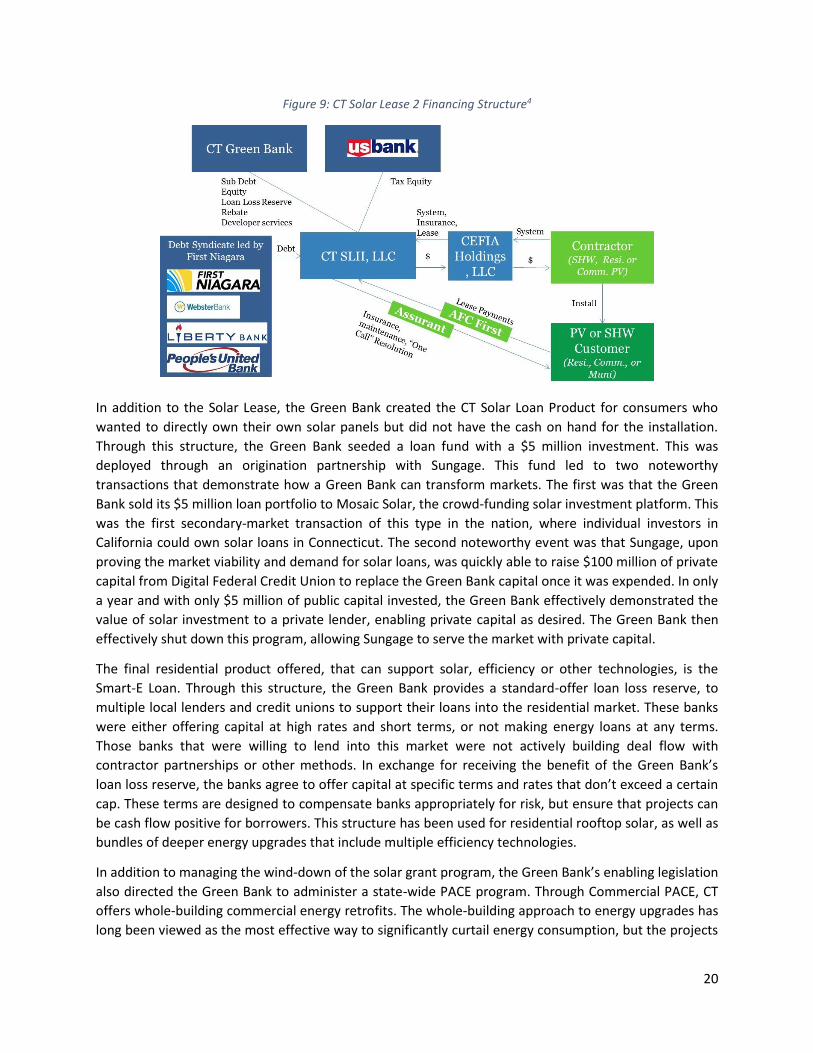
Figure 9: CT Solar Lease 2 Financing Structure4
In addition to the Solar Lease, the Green Bank created the CT Solar Loan Product for consumers who
wanted to directly own their own solar panels but did not have the cash on hand for the installation.
Through this structure, the Green Bank seeded a loan fund with a $5 million investment. This was
deployed through an origination partnership with Sungage. This fund led to two noteworthy
transactions that demonstrate how a Green Bank can transform markets. The first was that the Green
Bank sold its $5 million loan portfolio to Mosaic Solar, the crowd-funding solar investment platform. This
was the first secondary-market transaction of this type in the nation, where individual investors in
California could own solar loans in Connecticut. The second noteworthy event was that Sungage, upon
proving the market viability and demand for solar loans, was quickly able to raise $100 million of private
capital from Digital Federal Credit Union to replace the Green Bank capital once it was expended. In only
a year and with only $5 million of public capital invested, the Green Bank effectively demonstrated the
value of solar investment to a private lender, enabling private capital as desired. The Green Bank then
effectively shut down this program, allowing Sungage to serve the market with private capital.
The final residential product offered, that can support solar, efficiency or other technologies, is the
Smart-E Loan. Through this structure, the Green Bank provides a standard-offer loan loss reserve, to
multiple local lenders and credit unions to support their loans into the residential market. These banks
were either offering capital at high rates and short terms, or not making energy loans at any terms.
Those banks that were willing to lend into this market were not actively building deal flow with
contractor partnerships or other methods. In exchange for receiving the benefit of the Green Bank’s
loan loss reserve, the banks agree to offer capital at specific terms and rates that don’t exceed a certain
cap. These terms are designed to compensate banks appropriately for risk, but ensure that projects can
be cash flow positive for borrowers. This structure has been used for residential rooftop solar, as well as
bundles of deeper energy upgrades that include multiple efficiency technologies.
In addition to managing the wind-down of the solar grant program, the Green Bank’s enabling legislation
also directed the Green Bank to administer a state-wide PACE program. Through Commercial PACE, CT
offers whole-building commercial energy retrofits. The whole-building approach to energy upgrades has
long been viewed as the most effective way to significantly curtail energy consumption, but the projects

21
are hard to execute and finance. They include multiple energy efficiency technologies and can also
include rooftop solar when appropriate.viii The Connecticut Green Bank is able to finance these projects
through its commercial PACE (C-PACE) program.
PACE is legally authorized in over 30 states, but Connecticut is one of only two states to achieve
significant scale with a commercial PACE model. Unlike most states where each local government is
charged with creating their own program, the Connecticut Green Bank (CGB) is tasked with
administering the program across the entire state. Through central administration, the CGB provides
programmatic consistency and standardization--critical elements for private investment. The CBG also
ensures that every loan offered can be paid back entirely through the savings generated by the project,
as stipulated in the state’s legislation. The CBG uses a standardized and rigorous technical underwriting
method to ensure that every project has a savings-to-investment ratio greater than 1 (as required by
legislation).
Many PACE programs have struggled to attract private capital because of program complexity and small
investment scale. Connecticut initially struggled with this same problem, having designed a robust
administrative platform, but was unable to draw in private capital to fund the PACE loans in a
meaningful way. However, the Connecticut Green Bank was able to kick-start the market by originating
and underwriting PACE loans using its own public dollars. By taking the first step where private lenders
would not, the Green Bank was able to build scale by aggregating projects. Loans were offered with an
interest rate of approximately 6%, which is low enough to expand the addressable market and make
projects cash flow positive, but high enough to attract private investors who want to buy the loans from
the CGB. After building a portfolio large enough to attract private investment, the CGB sold 80% of the
PACE loan portfolio through an auction, drawing in $24 million of private investment.5 This was the first
commercial efficiency securitization in the country, attracting specialized and institutional investors to
participate in the market. Without investment and coordination by the CBG, the market would have
remained dormant.
Now that the CGB has demonstrated the mechanics and potential of PACE, private investors are
preparing to enter the market at far greater scale. To satisfy the growing pipeline of projects, the CGB is
raising an external warehouse of at least $50 million in private capital that will be used to originate
loans. Those private dollars will be paired with public debt and/or credit enhancements, and the loans
will then be securitized in public markets. After only one portfolio sale, the CGB has demonstrated
market opportunity to draw institutional investors eager to originate the loans, reducing the need for
public investment. Recent securitizations of residential PACE loans in California suggest that this new
private capital will come with ever lower interest rates.6
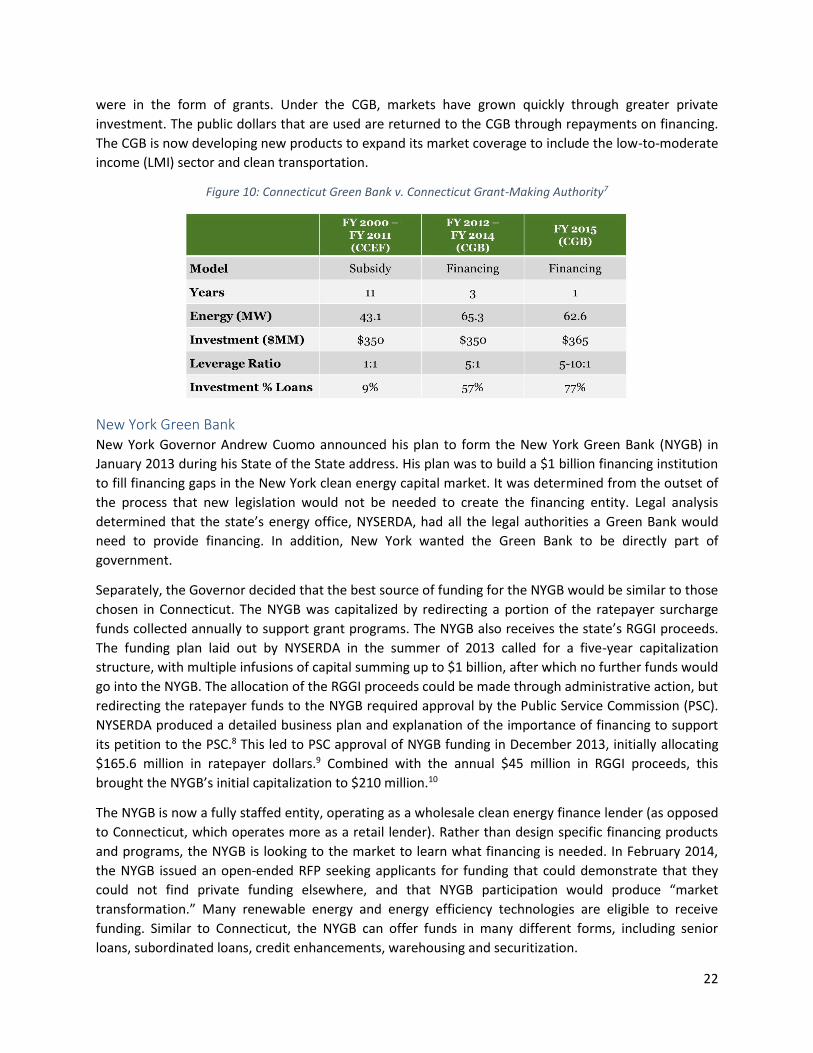
After four years of operation, the Connecticut Green Bank is now a mature financial institution that has
sparked remarkable growth in the state’s clean energy markets. In FY2015, the CGB sparked $365
million in total clean energy investment in the state, while achieving a private to public leverage ratio
exceeding 5-to-1. This stands in sharp contrast to the market condition prior the CBG’s creation. In the
eleven years of operation of the prior Clean Energy Fund, a total of $350 million was invested during
that whole time period. Of that total, approximately half of the funds were public dollars, and nearly all
viii To date, roughly 50% of projects are PV only, 25% are EE only, and 25% are both PV and EE.
22
were in the form of grants. Under the CGB, markets have grown quickly through greater private
investment. The public dollars that are used are returned to the CGB through repayments on financing.
The CGB is now developing new products to expand its market coverage to include the low-to-moderate
income (LMI) sector and clean transportation.
Figure 10: Connecticut Green Bank v. Connecticut Grant-Making Authority7
New York Green Bank New York Governor Andrew Cuomo announced his plan to form the New York Green Bank (NYGB) in
January 2013 during his State of the State address. His plan was to build a $1 billion financing institution
to fill financing gaps in the New York clean energy capital market. It was determined from the outset of
the process that new legislation would not be needed to create the financing entity. Legal analysis
determined that the state’s energy office, NYSERDA, had all the legal authorities a Green Bank would
need to provide financing. In addition, New York wanted the Green Bank to be directly part of
government.
Separately, the Governor decided that the best source of funding for the NYGB would be similar to those
chosen in Connecticut. The NYGB was capitalized by redirecting a portion of the ratepayer surcharge
funds collected annually to support grant programs. The NYGB also receives the state’s RGGI proceeds.
The funding plan laid out by NYSERDA in the summer of 2013 called for a five-year capitalization
structure, with multiple infusions of capital summing up to $1 billion, after which no further funds would
go into the NYGB. The allocation of the RGGI proceeds could be made through administrative action, but
redirecting the ratepayer funds to the NYGB required approval by the Public Service Commission (PSC).
NYSERDA produced a detailed business plan and explanation of the importance of financing to support
its petition to the PSC.8 This led to PSC approval of NYGB funding in December 2013, initially allocating
$165.6 million in ratepayer dollars.9 Combined with the annual $45 million in RGGI proceeds, this
brought the NYGB’s initial capitalization to $210 million.10
The NYGB is now a fully staffed entity, operating as a wholesale clean energy finance lender (as opposed
to Connecticut, which operates more as a retail lender). Rather than design specific financing products
and programs, the NYGB is looking to the market to learn what financing is needed. In February 2014,
the NYGB issued an open-ended RFP seeking applicants for funding that could demonstrate that they
could not find private funding elsewhere, and that NYGB participation would produce “market
transformation.” Many renewable energy and energy efficiency technologies are eligible to receive
funding. Similar to Connecticut, the NYGB can offer funds in many different forms, including senior
loans, subordinated loans, credit enhancements, warehousing and securitization.

23
To date, the NYGB has received $734 million in proposals and has an active project pipeline of $338
million.11 The first set of NYGB investments were announced in the fall of 2015.12 $49 million of public
capital was used to leverage $178 million in private capital. Three deals were announced addressing
different market segments. $25 million in debt was provided to a NY-based solar installer to support a
solar leasing warehouse. $4 million in construction financing was provided to a distributed wind installer
to support over 160 distributed wind installations in rural New York through a lease structure. And $20
million in credit enhancing capital was provided to enroll the state in the multi-state Warehouse for
Energy Efficiency Loans (WHEEL) program, which provides home energy upgrade financing.
Hawaii Green Infrastructure Authority Hawaii’s Green Bank institution is called the Green Infrastructure Authority (GIA), which was created
through legislation. The GIA was placed within the state’s Department of Businesses, Economic
Development and Tourism (DBEDT), which operates the state’s energy office. The GIA is minimally
staffed, relying on third-party contractors to administer its financing program. The GIA’s first program,
approved by the public utility commission in 2014, is the Green Energy Market Securitization (GEMS)
program. GEMS provides solar lease financing to underserved market segments, particularly LMI
households.
Hawaii has experienced a residential solar boom as the cost of solar has fallen and is highly competitive
with expensive grid electricity in the state. However, solar adoption and the associated economic
benefits were concentrated among high-income households. 27% of households earning $90,000 or
more had solar, but only 6% of households with less than $60,000 in income had solar. This was a clear
gap in private financing markets that had serious economic welfare consequences. GEMS is designed to
fill that gap, leveraging public capital in an innovative way.
Figure 11: Hawaii GEMS Financing Structure13
24
The GEMS program is funded with an existing and redirected ratepayer surcharge. Ratepayer dollars are
collected by GIA through the utility. Rather than wait for the collections to reach scale, the GIA issued a
$150 million bond that will be paid off with the future ratepayer collections. Because bond repayment is
linked to utility collections, and not individual lease repayments, the bond received a AA-rating and a
2.99% taxable-rate. These funds are then combined with private tax-equity capital to create a solar lease
fund. To further reduce the rate lessees will be charged, the solar leases will be repaid through on-bill
repayment mechanisms that were established in parallel to the GIA’s creation. The lease repayments
will go back into the GIA fund, and can be revolved. By combining multiple elements of strong clean
energy financing policy (public-private leases, leveraging ratepayer funds, and on-bill repayment),
Hawaii was able to build a program that is low-risk and open to a broad segment of the population.
California CLEEN Center In the fall of 2014, the California Infrastructure and Economic Development Bank (IBank) announced the
creation of the new California Lending for Energy and Environmental Needs (CLEEN) Center. The CLEEN
Center will act as a Green Bank to initially support municipal and commercial building efficiency
upgrades, before expanding to finance broader clean energy markets. For much of 2014, a bill to create
a new stand-alone California Green Bank advanced through the state legislature. As a result of
negotiations between Governor Brown and the bill’s lead sponsor, it was decided that the existing state
IBank would house the new Green Bank entity.
As described in the business plan, the objective of the CLEEN Center’s programs is to “drive down the
cost of energy efficiency projects, leverage existing public programs, encourage private investment, earn
investment returns for the IBank, and partner with market intermediaries.”14 This statement
encompasses the broad set of objectives typically held by a Green Bank. The CLEEN Center’s first two
programs will be the Statewide Energy Efficiency Program (SWEEP) and the Commercial & Industrial
Energy Efficiency Programs (CEEP). The programs will fill market gaps where viable efficiency projects
are unable to access reasonable financing, specifically targeting the municipal, university, school and
hospital (MUSH) market, as well as the Commercial & Industrial (C&I) market. The CLEEN Center is also
designing a specialized LED street lighting program that will enable municipalities to swap out old street
lights for LEDs while remaining cash flow positive throughout the term of the loan. Through each of
these programs, the CLEEN Center will offer senior or subordinated debt, or credit enhancements to
support private investment.
The funding source for the CLEEN Center is the IBank’s existing pool of cash raised by issuing bonds. The
CLEEN Center sits under the existing Infrastructure State Revolving Loan Fund (ISRF). This is the IBank’s
largest program and is entirely funded through IBank bond issuances. Bonds are issued to recapitalize
this program nearly every year, and at a very large scale. For instance, in May 2015 the IBank closed on a
ISRF 2015A Series bond in the amount of $125 million, at 3% interest rate (rated AAA). Presently, the
IBank has roughly $200 million in cash assets available for lending, most of it for the ISRF program that
includes the CLEEN Center. Finally, the IBank does have equity on hand (cash that does not have to be
used to repay bond holders). The IBank will use those equity dollars to create loan loss reserves and
other credit enhancements to enable more private investment.
Rhode Island Infrastructure Bank When Rhode Island Governor Gina Raimondo assumed office in January 2015, she very quickly followed
through on her campaign promise to create a Rhode Island Green Bank. Rhode Island had an existing set
25
of state and utility-run rebate programs, and had attempted to build a residential PACE program. But
the Green Bank was intended to increase financing across new clean energy markets, and importantly
drive investment in infrastructure and job growth.
Rhode Island determined that the best path to create its Green Bank required legislation. And rather
than build an entirely new institution, the Green Bank would be built upon an existing entity with a track
record of success. The state’s Clean Water Financing Authority (CWFA), which had financed water
projects in the state for many decades, was tapped to become the Green Bank. The CWFA would be
given expanded authorities to address clean energy markets, and be renamed as the new Rhode Island
Infrastructure Bank (RIIB). This new organizational structure was passed into law in June 2015 as part
the Governor’s fiscal year budget legislation.
The RIIB was assigned responsibility for two specific financing programs in the legislation. RIIB has
responsibility for designing, administering and possibly financing both commercial and residential PACE
in the state. RIIB chose to follow the Connecticut model with a single, state-wide PACE administrative
authority. Though the RIIB hopes that private investors will originate and underwrite PACE loans, the
RIIB is able to provide credit enhancements to those lenders should it be necessary. The RIIB is also
authorized to make PACE loans itself should private investors not step in, though new capital sources
would need to be identified to serve that function.
The RIIB was also tasked with designing and implementing an Efficient Buildings Fund (EBF), which will
finance energy upgrades for municipal buildings in the state. RIIB was given general authority to design
the optimal financing structure to serve this market, which has been broadly underserved. This program
was given priority because reducing energy bills in public buildings will reduce government budgets at a
time when the state needs to maximize the value of all public dollars. The state’s Office of Energy
Resources (OER) is tasked with developing criteria for viable projects and building a list of priority
projects, which will be used to guide EBF financing decisions.
RIIB activities are funded through a combination of RGGI proceeds, system benefit charges, remaining
federal ARRA funds, and a small amount of re-directed operating funds. The RIIB also has the authority
to issue state qualified clean energy bonds (QECBs). In sum, these funds are intended to both serve as
an equity portion of a broader bond issuance, as well as support a larger agency operation. The bond
issuance, the proceeds of which will finance the EBF program, is estimated to raise $20 million. RIIB, like
the CWFA before it, is a quasi-public agency with a board of directors, where the chairman is appointed
by the Governor. The legislation that created the RIIB also directs the formation of a green infrastructure
strategic advisory council, which will advise RIIB’s board on industry advances and potential program
opportunities/improvements. Council members include RIIB’s executive director, RIIB’s chairman, and
heads of the offices of energy, transportation, health, housing, commerce and environmental
management.15
Montgomery County Green Bank In June 2015, Montgomery County, MD became the first county in the U.S. to create an official green
bank. The Montgomery County Green Bank (MCGB) was created through County Council legislation,
which was passed unanimously. The MCGB has been given a broad mandate and a set of tools to fill
financing gaps and accelerate the growth of the county’s clean energy markets. The county, which had
already begun to create its own PACE program, saw a green bank as critical to meeting its own clean

26
energy goals and opening access to all customers. The county is currently administering a public working
group process that will more precisely inform the operations and focus of the MCGB.
The MCGB was created using a fairly unique structure. The county did not want to directly operate the
green bank within the government, but was also unable to establish a separate quasi-public entity
without state-level legislation. Instead of directly creating the MCGB, the legislation precisely defines a
mission and set of functions to be performed by a purpose-built 501(c)(3) non-profit. The County Council
would designate the non-profit entity as the MCGB for a specified term, during which time it would
operate under the governance and legal definitions of the MCGB as written in the legislation. This
structure has similarities to both a quasi-public structure and an external, third-party administered
structure. The primary initial source for the capitalizing the bank is expected to be approximately $20
million of funds the county was to receive from Exelon as a result of their merger with the local electric
utility, Pepco.
27
Chapter 2 – Current District Market Conditions, Activity & Needs This chapter reviews the current clean energy market and financing needs. This includes a measurement
of the clean energy market potential and the existing set of public sector financing activities currently in
place to support the achievement of that market potential. Finally, the chapter identifies the specific
market gaps in the District that remain which could be served by a Green Bank. The Appendix to this
report also provides greater detail on the basic energy market and policy landscape in the District, and
provides a more thorough accounting of clean energy policies and programs.
Serviceable Addressable Market for Clean Energy One of the key inputs to any Green Bank design process is the addressable market size. By knowing the
market size, a government can adequately estimate the total amount of public and private investment
needed. Though there are many engineering assessments that identify the maximum technical potential
for a clean energy technology in a given region, it is often more helpful to measure market size in terms
of what is economically (or politically) feasible. This measurement can be called the Serviceable
Addressable Market, or SAM.
The table below outlines the current market penetration, in terms of installed capacity, and the
economic potential for multiple clean energy markets in the District. The SAM is measured in terms of
energy capacity and potential investment capital required to achieve the market potential. The figures
were calculated based on energy potential studies from multiple reports, as well as estimated costs of
installation for each of the listed technologies.
Table 2: Analysis of Economic Potential of District of Columbia’s Various Clean Energy Technologies16
Selected
Technologies
Total Current
Installed Capacity
Total Potential
Market
Total Unfilled
Potential Cost
Solar PV 47 MW 438 MW $1,000 M
Wind 0 MW 0 MW $0 M
Electric Efficiency 191 GWh/yr 2,213 GWh/yr $930 M
Thermal
Efficiency 286 MMBtu/yr
3,845,186
MMBtu/yr $490 M
Bioenergy Electric
Generation 0 MW 8 MW $26 M
CHP 14 MW 295 MW $345 M
TOTAL $2,791 M

28
The market potential of for solar PV and building efficiency upgrades represent the biggest
opportunities for investment in the District. The solar and efficiency projects that have already been
implemented are a small fraction of the total economic potential for each class of technologies—the
economic potential of solar and efficiency are orders of magnitude above their current uptake.
Combined heat and power in the commercial and industrial sectors also represents a significant
opportunity for investment. And taken together, the combined economic potential across all the
evaluated technologies is nearly $3.5 billion.
Past District Financing Assessment This Green Bank report is not the first time the District government has investigated the need and
potential value of additional financing programs to support clean energy markets. The 2008 Clean and
Affordable Energy Act called for an official report to be produced by the Public Service Commission
(PSC). More recently, the District Office of the Chief Financial Officer (OCFO) produced a white paper on
the topic of a District Infrastructure Bank, investigating potential models and applicability in the District.
2009 District PSC Report on Clean Energy Financing The District recognized the importance of long-term financing for clean energy in 2008 when it passed
the Clean and Affordable Energy Act. This broad legislation established, among other things, the SEU,
and expressed the desire to understand more about the financing structures that could be implemented
in the District. The legislation directed the PSC to “open an investigation into mechanisms to make long-
term affordable financing available to energy consumers.”17 This directive led to the Commission Report
on Solar, Renewable and Home Improvement Financing, completed on September 23, 2009.
In the report, key stakeholders were asked to submit comments and feedback on several potential
financing structures, funding sources, and administrative approaches. Stakeholders included
Washington Gas, Pepco, the Office of People’s Counsel (OPC), and DOEE. In its comments for the report,
OPC stated that “the single most daunting barrier to the creation of a sustainable energy infrastructure,
both in the District and the world at large, is the up-front cost.”18 OPC also noted federal Green Bank
legislation that had been introduced by Representative Chris Van Hollen that was under consideration
by Congress and provided an indicator of both federal interest in clean energy financing and a potential
funding source for a financing mechanism.
The stakeholders also provided specific programmatic recommendations. Washington Gas and Pepco
submitted comments in opposition to on-bill repayment systems, where the utilities would collect loan
payments through their billing system. They cited both technical difficulties and a desire to underwrite
loans with bank financing, rather than utility capital. Despite this pushback, Pepco acknowledged the
need for financing, suggesting that loans with rates between 2 and 4% and terms from 3 to 15 years
were appropriate and necessary. Comments across parties pointed to either DOEE or the newly formed
SEU as the most logical administrators for financing programs. Potential funding sources included the
Sustainable Energy Trust Fund (SETF) ratepayer surcharge or the alternative compliance payments
collected as part of the District’s Renewable Portfolio Standard (RPS).
The PSC report concludes with recommendations of two possible financing structures. The first is a
program relying on private lenders, with public funds used as interest rate buy-downs to ensure the
capital is offered at favorable terms. The second recommendation is a public revolving loan fund, where
29
repayment is secured by a special assessment on the owner’s property bill. (This was an early
incarnation of PACE, though the name was not yet applied.) Due to the utility push back, no form of on-
bill financing was recommended. However, the report did establish that financing is a critical element to
market growth in the District, and began discussions of possible program structures. Not long after the
report was submitted, the Energy Efficiency Financing Act of 2010 was passed, officially creating PACE
financing in the District.
DC OCFO Infrastructure Bank White Paper In September 2014, the OCFO published a white paper on the topic of a District Infrastructure Bank. The
analysis is highly relevant to this Green Bank Report, as the creation, capitalization and activities of a
Green Bank are effectively equivalent to an infrastructure bank, with a focus on green projects.
The white paper identifies two potential organizational structures--a bank that is directly part of
government or one that is a separate legal entity. It also provides a detailed analysis of the possible
capitalization methods of an infrastructure bank, including an initial public capitalization, an ongoing
capitalization from a dedicated revenue stream like a tax, and the issuance of bonds. This concept of
funding an infrastructure bank is equivalent to a Green Bank (which is discussed in detail later in the
report).
The paper identifies three possible bonding structures:
bonds repaid by the full balance sheet of loans held by the bank;
bonds repaid by a tax dedicated to the bank; and
bonds repaid by revenue generated by specific projects financed by the bank.
The white paper points out that, in the District, the second type of bond, where a dedicated revenue
stream is used to repay the bondholders, would cause legal challenges. Since the bonds would have
recourse to taxes, it would effectively be backed by the District’s credit and ability to collect the tax.
Therefore, this kind of bond would count towards the District’s debt limit. The first type of bonding,
backed by the general balance sheet of the bank, would be feasible, although it would require the bank
to have an initial capitalization from a non-bonding source from which it could make the loans that form
the repayment pool. As the white paper states: “before it could leverage additional funding from loan
repayment…the bank would need to have a diversified pool of high-performing loans.”19
The white paper also states that project-specific bonds are also feasible, assuming that projects don’t
require a guarantee from the city to be financed by private capital. “Project-specific financing…is a
feasible option for the District to consider. The feasibility of this model assumes there are projects that
attract lenders without requiring a specific guarantee from the District or other covenant that may cause
the loan to be counted as District debt.”20 This statement is valuable because it confirms that a bond
issued by a dedicated infrastructure bank, backed by a specific project that was originally financed by
public dollars, does not trigger any District-specific legal issues. The bond doesn’t have recourse to the
District; it doesn’t count towards the debt cap, and it doesn’t violate the Home Rule Act prohibition on
lending the public credit for private projects. This is highly instructive for how a Green Bank could be
established and capitalized in the District.
A final constructive piece of guidance from the paper pertains to the value proposition and funding
needs of an infrastructure bank. As noted in the analysis, some of the forms of investment could
30
conceivably be executed under existing authorities and agencies. Therefore, the OCFO argues that if a
bank is created, it ought to be based on the notion that a dedicated institution can execute the financing
and achieve the objectives more effectively.
The rationale for setting up a bank for such transactions should therefore rest upon an
argument for increased expertise or efficiency as compared to current District
processes. However, the expertise and efficiency goals may require that the bank be set
up with a level of autonomy that may contradict policy makers’ desire for sufficient
input. Any proposal for a District infrastructure bank will have to carefully balance such
competing considerations. Additionally, policy makers should plan on the bank receiving
at least interim funding until it can generate fees to cover its operations.21
This critical insight about organization governance, autonomy, and funding needs directly
informs the Green Bank creation, as well.
Current District Programs & Finance Activity Today, the District has a fairly streamlined policy and program apparatus for clean energy market
development. DOEE is the sole and central authority, designing energy strategy, guiding policy decision-
making, and implementing various programs. This includes direct program implementation at DOEE, as
well as outsourced program administration through the SEU and DC PACE. DOEE is primarily funded with
District general funds, federal grants, the Renewable Energy Development Fund (REDF) and the SETF.
Most of the DOEE’s direct funding programs are focused on low-income assistance, relying on federal
funds. SETF dollars are directly passed to the SEU, which is administered, by contract, by a consortium of
entities led by the Vermont Energy Investment Corporation (VEIC). Of SEU funds, 85% go to rebate and
market development programs across sectors, and 15% of funds go to overhead. The only direct
financing that DOEE currently offers is through the DC PACE program.22
DC PACE Current Status The District’s only direct clean energy and efficiency financing program is the DC PACE program,
currently administered by Urban Ingenuity (UI), a private third-party under contract with DOEE. DC PACE
provides loans to commercial and multifamily properties for clean energy and efficiency upgrades.ix
Eligible measures include all savings-related measures that achieve a savings-to-investment ratio greater
than one (including energy and water efficiency, renewable energy, and stormwater measures). This
ensures that only projects that produce savings greater than the cost of the project are eligible for PACE.
Loans are paid back via a special assessment on the property. The assessment constitutes a lien on the
property—and PACE participants must acquire lender consent from existing lenders. The lien and the
responsibility to pay back the loan are attached to the property, and stay with the property if it is sold,
unless the PACE capital provider has provided an avenue for pre-payment of the financing. This
increases the security of the loan and can attract capital at better terms. Therefore, PACE is an effective
tool for the long-term financing of deep, multi-measure retrofits.
ix Clean energy includes both energy efficiency and renewables. In the Energy Efficiency Financing Act of 2010, “renewable energy systems” are a qualified form of “energy efficiency improvement.” Also, residential buildings are legally eligible for PACE by statute, though the District has not yet implemented a program to allow residential PACE.
31
The District’s PACE program provides financing for projects with a minimum project size of $100,000
that are located in the District. UI has established eligibility and underwriting guidelines for PACE. This
includes a maximum combined PACE and mortgage loan-to-value ratio of 80%; a minimum debt-service
coverage ratio of 1.2; and a cap on the PACE lien of no more than 20% of property value.
The District directly issues a PACE note to the lender, and the lender provides the capital to the project.
The District collects the special assessment and remits that payment to the lender/note holder. Each
note issued counts against the $250 million bonding capacity authorized by the city. To date, this is the
only financing construct used for PACE in the District.
The District’s PACE program administration, through UI, was initially supported by $823,000 in public
funds for start-up and program design. No other funds have been allocated either for program
administration or for financing support. UI covers its operating expenses through closing fees, and
capital is derived from private lenders. UI is contractually responsible for building the program structure,
guiding building owners through the technical review process, and identifying suitable capital sources
for each project.
Using the direct private financing construct, DC PACE has operated with an “open-platform” financing
structure. The District itself does not provide loan capital, and there is no designated private capital
provider. Rather, UI enables any capital provider to participate and make a PACE loan. A project could be
developed with a lender already attached, or UI will help the project find a lender through a solicitation
process. UI effectively acts as an “honest broker” by putting a given project out to bid to a set of banks
and boutique PACE investors, and then collects term sheets to present to the building owner.
Over time, UI has built a pool of capital providers who are regularly given the opportunity to fund
projects. Capital providers range from small and medium local commercial banks to larger institutional
investors specifically focused on PACE markets. Generally, local commercial banks offer lower interest
rates but may not be able to offer terms longer than 10 years. The larger PACE-specific lenders tend to
offer higher interest rates, with longer terms.
To date, six PACE projects have received financing in the District, totaling $5.25 million in financing. The
most recent deals were completed in the second half of 2016 to provide for a renovation of a non-profit
and a retrofit on a District charter school. Previous projects included the installation of a solar system on
a District gas station, and efficiency upgrades and rooftop solar for the Phyllis Wheatley YWCA. The
YWCA project attracted national attention because it was the first use of PACE on a public housing
property that included financing from the U.S. Department of Housing and Urban Development (HUD) in
the capital stack. HUD’s approval of the project set a critical precedent for the applicability of PACE for
the low-income multi-family space.23 UI has more than $50 million in potential projects in the pipeline.24

32
Table 3: DC PACE Deals Competed To Date
Building Date Amount Financed Description
400 M Street May, 2013 $340,000 Energy and water efficiency, 37kW rooftop solar installation on affordable multifamily building25
Georgia Ave BP Station August, 2015 $150,000 37 kW rooftop solar
Phyllis Wheatley YWCA September, 2015 $728,000 Efficiency & solar installation for low-income public housing
Annie’s Ace Hardware April, 2016 $396,000 Lighting upgrades, envelope improvements, VRF system, low-flow water measures
Elsie Stokes Charter School
July, 2016 $1,428,135 50 kW rooftop solar, boiler replacement, domestic hot water controls, chiller replacement, central controls, lighting upgrade, roof replacement, low-flow water measures
Far Southeast Family Strengthening Collaborative (FSFSC)
September, 2016 $2,200,000 Mechanical upgrades, controls, LED lighting, envelope improvements, green roof, low-flow water measures
PACE has grown slowly since legislation was passed in 2010. In its initial RFP to find an administrator, the
DOEE targeted nearly 1,000 deals completed through three years.26 Lessons from other PACE programs
show that dedicated operating capital for program administration, and loan or credit enhancement
capital to finance deals can be critical for achieving program growth. Possible solutions for program
improvement and expansion are discussed later in Chapter 3.
District Financing Gaps and Needs At present, DC PACE is the only publicly-supported financing activity that is holistically designed to meet
market needs and produce economically attractive project outcomes. Though private capital is
“available” from other lenders, there are few, if any, other purpose-built financing solutions that are
reaching the market in a way that has led to meaningful clean energy adoption. The resulting gaps can
and must be filled by the District in a way that supports more private investment that is usable,
attractive, and accessible. Without programmatic support and public capital, it will be difficult for the
District to drive the level of adoption needed to meet its clean energy and climate goals.

33
For example, rooftop solar financing is technically available in the District from private investors.
However, the solar PV market will require approximately $657 million in capital investment in the next 7
years alone to meet the RPS requirements.x The District is in no way on pace to meet this requirement.
Despite the shortfall in investment, presently 100% of public dollars used to support clean energy
market growth go towards incentives (such as rebates and grants) and related programs. There is no
direct financing or credit enhancements offered, showing a mismatch between the District’s energy
objectives and the tools offered to meet those objectives. The current programs leave most of the
critical market segments in the District unable to readily access capital to finance energy improvements.
This includes the residential market and the municipal-university-school-hospital (MUSH) segment for
efficiency and solar.
In addition to deploying and attracting more financing, there is an opportunity for increased
coordination and integration of efforts undertaken by DOEE, SEU and DC PACE.xi If more financing
programs are created in the District through a Green Bank, mechanisms and structures that increase
coordination will ensure that each public dollar is used most efficiently. This includes coordination of
market growth policies, programmatic design, and project level implementation.
x As of March 1, 2016, the reported capacity of solar used to meet the District’s RPS requirements is 39.3 MW with only 19.0 MW of that actually installed within the District. The solar carve-out in the District’s RPS requires 2.5% of electricity to come from local solar by 2023, which is estimated to equal 272 MW of installed capacity. This leaves 223.7 MW of capacity yet to be installed in 7 years. At a favorable expected price of $3.00/watt, this sums to around $814 million. See Public Service Commission’s “Monthly Update of Solar Generator Certification” on the DCPSC.org website. xi For instance, the SEU and DC PACE can work together on a project, ensuring that grant dollars are used to
support projects with the deepest retrofits possible. Grants going to shallow retrofits not only make minimal
progress toward the District’s energy goals, but actually undercut the ability of financing programs to offer deep
energy retrofits that produce cash flow positive savings. Energy conservation measures that can achieve
significant reductions in energy usage typically have a long payback period. Pairing deep retrofit conservation
measures with more shallow measures that produce quick paybacks helps reduce the overall payback period of the
project. This allows the project to be financed at terms of reasonable length (10-15 years) and still produce more
savings per year than the financing repayments. If those shallow retrofits have already been performed as a result
of grant funding, deep retrofit projects are unable to benefit from their quick payback, thus eroding the economics
and attractiveness of a deeper project. Therefore, any financing tools will have to be designed in coordination with
existing grant programs and initiatives related to driving deep retrofits.
34
Chapter 3 – District Green Bank Recommendations Based on the findings of this study, this Chapter provides specific recommendations for how the District
could establish and operate a Green Bank. It addresses the following questions:
What is the best legal structure for a District Green Bank?
How much money does it need, and what would the impact be?
Where could that money come from?
How would it actually be created and funded?
Once created, how could the District operate and staff the Green Bank?
What should the District Green Bank do?
How should it coordinate with other existing District initiatives?
This Chapter answers each of these questions to provide a detailed guide that District policymakers can
follow for Green Bank creation and implementation.
Summary of Recommendations CGC recommends that the District create a Green Bank as an institution solely dedicated to driving more
total investment in clean energy and green infrastructure. This study finds that the level of clean energy
investment needed to meet the District’s ambitious sustainability goals cannot be met by public capital
alone. And private capital is not flowing into the District as quickly as necessary. Therefore, cost-
effective public-private financing is needed to stimulate more overall investment.
The District should create a new quasi-public instrumentality, a wholly-owned corporation of the
government to operate as the District’s Green Bank. With a Board of Directors appointed by the Mayor
and Council, this structure ensures the Green Bank is aligned with the policy objectives of the District,
while operating with flexibility, more like a private entity that can move quickly with markets. CGC
suggests that the initial capitalization for a District Green Bank be $100 million, spread over 7 years. This
includes $40 million in initial capital and $60 million spread over the following 6 years. This level of
funding can drive more than half a billion dollars of total investment in clean energy during the funding
period, making significant progress toward filling the Serviceable Addressable Market (SAM) for clean
energy (which is more than $3 billion) and helping to meet the District’s sustainability goals. If it is not
possible to reach $100 million in initial capitalization, CGC recommends that the District aim for $50
million capitalization as it is likely that this would be the minimal amount needed to create a viable
green bank and interest investors.
If possible, the initial funding should come from multiple potential sources, identified in this chapter.
The Green Bank should also have a reliable, recurring funding stream, which is why CGC recommends
that the SETF be increased to generate an additional $10 million per year, with the new funds directed
to the Green Bank. This stream of funding could be terminated after 6 years, when another $60 million
of capital has flowed into the Green Bank. The Green Bank should also have the ability to issue bonds of
various types so that it can recycle capital and raise additional funds. Creating the Green Bank will
require legislation that enumerates the powers and authorities of the institution and identifies its
funding sources. The legislation should also outline accountability and transparency requirements.
The Green Bank will need to hire dedicated staff, drawing on investment and banking professionals from
the private sector. At start up, the Green Bank should borrow certain administrative functions from
35
existing entities, like DOEE. The Green Bank will need a CEO/Executive Director, a Chief Investment
Officer, and other program staff. The overall operating expense at start-up should be less than $1 million
per year. The Green Bank should be a breakeven entity, where the revenues earned from financing
activity cover all the costs of operating the Bank. However, as it will take time for the Green Bank to
develop and launch products, and begin earning a return, the first few years of activity will result in
operating deficits. The funds to cover this operating deficit should come from the initial capitalization of
the Green Bank. The board and staff together should develop a formal business plan, identify their
priority markets and roll out products to serve those markets.
CGC recommends that the priority market of the Green Bank be distributed solar (rooftop and
community-scale) and building efficiency upgrades. Efficiency upgrades should focus on residential
customers, offering whole-home solutions that includes solar, and commercial properties that may not
be suited for ESCO-type financing. Within the residential space, it is critical that the Green Bank develop
solutions to specifically serve the low-to-moderate income residents. The best financing structure
available to serve this market is on-bill financing, as it enables financing for renters and allows for
underwriting based on utility bill payment history. And finally, the Green Bank must engage in a range of
coordinated market development activities that aim to stimulate demand. The Green Bank must do this
in concert with the SEU, as rebates, financing and market development should be seamlessly aligned to
lower barriers and ease customer adoption of clean energy. DOEE should act as the bridge between the
SEU and Green Bank, to ensure close communication around responsibilities and program design.
District Green Bank Legal Structure CGC finds that the best legal structure for a District Green Bank is a new, wholly-owned non-profit
corporation that operates as a quasi-public instrumentality of the District. This model is well suited for
the institutional landscape and legal structures of the District, and is also the model used by the most
effective Green Bank in the U.S found in Connecticut.
This section examines and compares three possible legal structures, including the quasi-public option, in
order to highlight the benefits and costs of various options. These Green Bank structural options are:
A direct part of government, as a division of DOEE;
An external entity, administered by a third party under contract with DOEE, similar to the SEU
A new wholly-owned non-profit public corporation, that operates as a quasi-public
instrumentality of the District
A District Green Bank could be established under multiple potential structures, each possessing certain
advantages and drawbacks from the perspective of government and the market. In addition to
organization structure, governance and market orientation, the District must consider legal powers and
potential restrictions that come from implementing certain structures. The District will also have to
make political calculations to assess the benefits and risks of creating a Green Bank through various
actions, such as legislation or regulatory action. In some cases, the structure and associated legal
process for creating that organization are linked to specific Green Bank funding sources. However, in
most cases the nature of the organization’s legal structure is distinct from the question of how the
Green Bank would be funded.
36
No matter the structure chosen, the District should ensure that the Green Bank is well aligned and
coordinated with existing District clean energy structures and has the flexibility to offer financing
needed to meet identified gaps in the District’s energy products.
The current clean energy program structure in the District is streamlined through DOEE, something the
District should aim to preserve if it creates a Green Bank. Currently, DOEE manages its own energy and
green infrastructure programs, and also manages the SEU and DC PACE through contracts. This ensures
that program design and the interaction between DOEE, SEU and DC PACE are centrally managed, which
is critical to building a policy environment conducive to market growth and public efficiency. Therefore,
it is essential for DOEE to help coordinate the SEU and DC PACE with the Green Bank activities.
New Division of DOEE The simplest Green Bank structure for the District would be for DOEE to create a new Green Bank
division to operate within government. In this structure, DOEE would hire new specialized leadership
and staff to specifically operate the Green Bank. This is similar to the route taken to establish the New
York Green Bank (NYGB). The NYGB is an internal division of NYSERDA, New York’s state energy office.
The advantage of this structure is that it would give government total control over the Green Bank’s
operations. It would be easy to create alignment between DOEE’s other activities and Green Bank
activities. And it would minimize potential confusion that may exist over the role of different
institutions.
There are disadvantages to this structure, though. As a direct part of government, the Green Bank may
be limited in its use of debt, both in relation to the District’s debt limit and related to Home Rule Act
restrictions on the use of public debt for private activity. The Green Bank may also be limited in its
financing flexibility which is critical to a Green Bank’s success, and would likely have to comply with
many regulations and rules related to doing business with the private sector. Rather than acting in close
coordination with the market and private sector, the Green Bank would likely be viewed as a traditional
government office. This may inhibit the kind of collaboration and innovation that the Green Bank seeks
to foster. It may also be hard to attract the necessary talent and human capital to work for a
government agency, as opposed to an external private entity. This model may actually be more costly to
operate as well, as overheads due to public sector benefits may be higher.
External Entity Administered by Private Third-Party Under Contract Another option for a Green Bank structure could be contracting with a private entity to serve as a Green
Bank. This would align with District precedent, most notably the SEU and DC PACE.
Rather than hire its own staff directly to design, manage and operate the SEU, DOEE chose to contract
out those administrative services to a team that is purpose-built for the task. Legislation was passed that
gave DOEE the job of designing an RFP, selecting a winner, and managing a private administrator for the
SEU. A similar structure could be implemented to create and operate the District’s Green Bank.
The potential benefit of this structure is that the Government, in the form of DOEE, still maintains direct
control over the Green Bank operations without having to take on additional staff, overhead and daily
management. The chosen contracted administrator would have the flexibility to hire necessary staff, set
salaries and design the internal organization structure without being encumbered by potential public
sector limitations. Through the contract design, DOEE could establish performance metrics and

37
objectives that the administrator would be required to follow, ensuring alignment between Green Bank
activity and the District’s priorities.
This structure would also allow DOEE to maintain centralized and coordinated control across all of its
energy programs, including the SEU, DC PACE and the Green Bank. The SEU could continue to focus on
rebate programs, while the Green Bank would provide financing. Even if PACE and the Green Bank
would remain separately contracted activities, they would necessarily need to be highly coordinated.
This could take the form explained in the table below.
Figure 12: Relationship Between Green Bank & PACE
There are drawbacks to this structure, though. Depending on the length of contract, the Green Bank
may not have the appearance of permanence and stability the market would need from a financial
institution. For instance, if the contract for administration is year-to-year, the Green Bank would be
unable to make long-term investments, as presumably any performance incentives would be measured
annually. And the operations of the entity and the staff might change drastically from year to year if the
contract changes. Even if the contract was for five years, as the new SEU contract is expected to be, that
likely would not achieve the organizational stability necessary to build market trust. As a financial
institution, the Green Bank needs to be able to operate flexibly with a long-term investment horizon.
One of the sources of value of a Green Bank is that its capital is very patient and flexible. The contract
Green Banks and PACE are sometimes mistakenly viewed as alternatives, where one must choose to implement
one or the other. However, Green Banks and PACE are entirely symbiotic and operate effectively together. One is
an institution, and one is a product potentially offered by that institution.
A Green Bank is a financing entity that can offer multiple finance programs or products. Operating a program
typically includes administrative services, as well as providing capital for financing. PACE is a kind of financing
mechanism used to finance building upgrades. The PACE mechanism requires both program administration and
capital for making loans. Therefore, a Green Bank could be well suited to offer PACE financing as one of its
products, in the same way that a Green Bank could, for example, offer a residential solar lease financing product.
Illustrative Example
For example, the Connecticut Green Bank performs both of these functions. The state’s commercial PACE
program, C-PACE, is administered state-wide by the Green Bank, and the Green Bank also makes the PACE loans.
C-PACE is the Connecticut Green Bank’s most successful product, and has led to what is by far the most successful
commercial PACE program in the nation. Rhode Island’s Green Bank, the RIIB, only performs one of these
functions. RIIB provides state-wide administration, but, like in DC, loan capital comes from private lenders. The
potential operational relationship between DC PACE and a District Green Bank is explored in more detail in
Chapter 3.
38
structure could force the Green Bank administrator to take a short-term view of activity. The
administrator might also feel restricted in its activity by narrowly defined metric categories, which might
force the entity to sacrifice long-term objectives to meet short term benchmarks.
Much like the SEU, this Green Bank model, implemented through a contracted administrator, could be
legally created through legislation. The Clean and Affordable Energy Act of 2008 specifically called for
the creation of the SEU, described its general purpose and function, and tasked DOEE with designing and
implementing the contract for outside administration. Similar legislation could be drafted for the
express purpose of creating a Green Bank. However, this structure would likely face restrictions due to
the Home Rule Act, which would limit public financing for private activity.
Quasi-Public Instrumentality, Wholly-Owned Public Corporation The final potential structure would be for the Green Bank to be a non-profit, wholly-owned public
corporation established specifically for the purpose of housing a Green Bank. This is the structure CGC
recommends. Also known as a quasi-public instrumentality of government, the Green Bank would sit
between government and the private sector. Enabling legislation would be required, and would
establish the structure, including issues such as bonding and lending authority, internal governance and
the structure of a Board of Directors. This instrumentality structure is most common across other state
Green Banks in the U.S., and offers many benefits for both the government and the market participants.
Like the third-party model described above, legislation would likely be required to create the quasi-
public entity.
Under this approach, the Green Bank would be created as a new stand-alone entity governed by a Board
of Directors. This is similar to the Connecticut Green Bank, the Hawaii Green Infrastructure Authority,
the California CLEEN Center, and the Rhode Island Infrastructure Bank. In each case, the Green Bank is a
stand-alone entity that has the benefits of sitting close to the market, while also having strong
government oversight to ensure alignment with policies and priorities. A quasi-public structure gives the
Green Bank the flexibility to: react quickly to market needs; create a broad set of financing and market
development tools, and enable the institutional permanence and long-term view needed for a financing
institution.
A Board of Directors would provide governance and oversight, and should be composed of relevant
industry experts and representatives of key stakeholder groups in the District. Board members could be
appointed directly by the Mayor and the Council, and would likely include ex-officio members. The
Connecticut Green Bank structure provides a good example of the kind of Board the District may want
for its Green Bank under this structure.
The Connecticut Green Bank board has 11 voting members. 3 are ex-officio, including the state
Treasurer, the head of the state energy and environment office, and the head of the state economic
development agency. Four voting members are appointed to defined terms by the majority and minority
leaders in both houses of the state general assembly. Those appointees must represent specific sectors
or have relevant expertise. The governor then appoints the final 4 voting members, also to defined
terms and with specific representation and experience requirements. The Governor selects the Chair of
the Board, a position presently held by the director of the state economic development agency.
With this board composition, the executive controls 7 seats, with 3 ex-officio seats that can be changed
at any time by the executive. Four seats are controlled by the legislative body. A similar structure in the

39
District could give the Mayor’s office confidence that the Green Bank would not stray from its mission of
serving the District’s energy and climate priorities, while also ensuring that all citizens that can be
affected and benefit from the Green Bank are represented on the board. If the Director of DOEE was
given an ex-officio position and appointed chairperson, this would also allow DOEE to maintain its
crucial role as the central coordinator of all relevant District clean energy programs.
A quasi-public entity could be given specific metrics and targets for performance, similar to the
contracted structure. However, because the Green Bank’s compensation and budget would not be
directly linked a defined contract, these kinds of specific targets may not be necessary. Instead, the
Board could charge the bank’s leadership with achieving certain objectives. The quasi-public
instrumentality would be capitalized, either upfront or over time with public capital, and it would be the
responsibility of Green Bank executive leadership (appointed by the Board) to effectively manage the
organization and cover its costs. Legislation to create this structure could include specific requirements
for products that must be offered or markets that must be served. Rhode Island took this approach,
specifically identifying commercial and residential PACE, and public buildings upgrade financing as initial
products the Infrastructure Bank must offer. The District should take a similar approach to give the bank
definition and focus from the start.
Quasi-Public Examples
There are several precedents for this kind of quasi-public instrumentality in the District. For example,
the District of Columbia Housing Authority (DCHA) is an independent public agency with an 11-member
Board of Commissioners. The Board is a mix of elected representatives, ex-officio members, and
Mayoral appointees that are approved by the Council.
Another example is the D.C. Housing Finance Agency (DCHFA), which was created by Council legislation
but is a “corporate body which has a legal existence separate from the government of the District” and
was established to “stimulate and expand the homeownership and rental housing opportunities” in D.C.
by “issuing housing mortgage revenue bonds that lower the homebuyers’ costs of purchasing homes
and the developers’ costs of acquiring, constructing and rehabilitating rental housing.”27 DCHFA has the
authority to issue bonds, notes and other obligations to execute the programs and responsibilities
authorized by its statute. DCHFA is also permitted to receive gifts, grants, appropriations, loans and
other funds from public (District and Federal) and private sources. DCHFA is governed by a five-member
Board of Directors, with directors nominated by the Mayor and confirmed by the Council. The method
of creation and institutional authorities for DCHFA provides a good model for Green Bank creation. The
only difference between the DCHFA model and the ideal Green Bank model is that DCHFA is solely a
conduit issuer, connecting private capital to projects. It does not have its own balance sheet and capital
to invest.
Perhaps the strongest precedent is the District’s Housing Production Trust Fund (HPTF). The HPTF was
created by legislation in 1988 to provide various forms of financing to support low-income housing in
the District.28 It was not a fully functioning fund until an initial, one-time $25 million payment was
invested in the fund in FY 2001. A permanent funding source was secured through the Housing Act of
2002, which dedicated 15% of the District’s real estate recordation and transfer taxes to the HPTF
annually. Now, the HPTF gets approximately $50 million a year from the recordation and transfer taxes.
It also receives revenue from loan repayments, and occasional direct budget appropriations and

40
donations. Recently, the Mayor and Council have increased the annual funding level to $100 million,
with funding above the tax collection coming through budget appropriation.
The HPTF operates in a way that is very similar to a Green Bank, as it is a revolving loan fund, used for a
specific mission-driven purpose, which lends alongside private investors. The public dollars put into the
HPTF are used to make loans to housing developments that are unable to find sufficient capital in the
market. The HPTF effectively operates as a gap financier, lending capital into projects in partnership with
private investors, grant funding and other public lending sources. Through the fall of 2014, the HPTF had
invested $320 million in public dollars and leveraged an additional $794 million from private sources.29
In an average year, the HPTF lends capital to 20-30 projects, and has recently surpassed $100 million of
lending activity per year. At present, the cash on hand is approximately $200 million, though a
significant portion of that amount is already allocated for projects.30
The HPTF has a fair amount of flexibility in the kind of financing it can provide. There are specific rules
on distributing funding across certain income brackets, defined by Area Median Income (AMI). But the
nature of the financing itself is undefined, and up to the discretion of program administrators. Loans
have varying interest rates, generally from 0% to 3%, and the term and rules of repayment vary based
on project economics. In some cases, loans payments vary and are made from for residual cash flow,
where only cash flow available after covering operating expenses and must-pay debt is used to pay back
the loan. Other older loans have balloon structures, where loans are not expected to be paid back for
many decades or only upon refinancing. Projects can seek funding from the HPTF through multiple
avenues, including a standard annual RFP process. Other kinds of projects can seek funding on a rolling,
as-needed basis. Though the exact terms of the financing offered differs from what a District Green Bank
would likely provide, the overall purpose, flexibility and revolving nature of the HPTF is very similar to a
Green Bank. And the perpetual funding stream, which is used to increase the overall capital base, is the
same type of funding structure used by the Connecticut Green Bank.
The legal structure of the HPTF is instructive for the Green Bank, though may not be the exact structure
a District Green Bank would follow. The HPTF is a “paper agency” that is administered by the
Department of Housing and Community Development (DHCD). The HPTF was statutorily established as a
“permanent revolving special revenue fund within the Governmental Funds of the District apart from
the General Fund consisting of identifiable, renewable, and segregated capital.”31 This means it does not
have its own staff, and relies on DHCD employees to operate HPTF programs. HPTF dollars are
technically transferred to the DHCD for this purpose. The legislation setting up the HPTF called for the
creation of a board of advisors, but they do not have decision-making authority.
Though the administrative structure of the HPTF is not quasi-public, the actual fund itself resembles a
quasi-public entity because the funds are segregated and are primarily used for private-sector oriented
activity. It also shows an example of how a purpose-built quasi-public institution could be funded. For
instance, the District could establish the Green Bank entity as a quasi-public, and then establish a “Green
Bank Fund” which is to be operated exclusively by the Green Bank entity. The most instructive takeaway
from the HPTF, though, is the dedicated funding stream, its flexibility and the revolving loan structure. It
also establishes a precedent that public dollars can be used to provide loans to support private projects.

41
Funding Level & Market Impact CGC finds that the minimal level of public capitalization of the District Green Bank would be $50 million
but the ideal level would be $100 million. Based on the initial leverage ratio achieved by other Green
Banks in their financing products, the District Green Bank should be able to achieve a leverage ratio of
approximately 5 private dollars per 1 public dollar. At this presumed leverage ratio, $100 million in
public capital would drive an additional $500 million in private investment. And, because Green Bank
capital is recycled, those same public dollars can leverage private capital multiple times. Therefore, the
lifetime financial impact of the $100 million investment would ultimately exceed $500 million.
For example, though the Connecticut Green Bank’s (CGB) capital base on its balance sheet is
approximately $120 million, it has now animated nearly $1 billion in total clean energy investment in the
state (including both public and private investment). With similar results in the District, a Green Bank
could help achieve meaningful clean energy market penetration, with an estimated SAM greater than $3
billion, and help achieve the District’s sustainability goals.
To spread the cost of this $100 million investment over time, CGC proposes that the capitalization come
to the bank during a 7-year time period. The Green Bank could receive an initial upfront capitalization of
$40 million, with an additional $10 million then invested annually during the next 6 years. When the
total capitalization of $100 million is achieved, the District can assess if any further capitalization is
needed.
Table 4: Proposed Green Bank Capitalization Schedule
This model would follow the capitalization plans of both New York and Australia, which invested pre-
determined amounts of capital annually into their green banks, with a finite end point. In Australia, their
AUD 10 billion capitalization was spread over 5 years. And in New York, the $1 billion capitalization will
ultimately be spread over 12 years, from 2013 to 2025. It is worth noting that the CGB also receives
funds annually (as opposed to a single upfront capitalization), but the amount of money going to the
bank every year is not fixed, and the stream is indefinite.xii The following section will provide a deeper
analysis of the best sources of funding, upfront and over time, for the District Green Bank.
The Green Bank can be expected to animate over half a billion dollars of local clean energy investment.
This calculation relies on two key assumptions. The first is the leverage ratio the Green Bank achieves on
its investments. There are two critical elements that drive the overall institutional leverage ratio. The
first is the product mix, and the second is time. The overall institutional leverage ratio is, by definition,
xii The amount of annual capitalization is not fixed because the portion of capital collected from ratepayers depends on electricity sales, and the portion of capital that comes from RGGI depends on the auction clearing prices for carbon emissions allowances.
42
the weighted average ratio of the underlying financing products. And product design is what actually
drives leverage. For example, a Green Bank that has one product that is designed to leverage $10
private dollars per public dollar will have an institutional leverage ratio of 10-to-1. But a Green Bank that
has two products, where each has equal capital and achieves a 10-to-1 and 2-to-1 leverage ratio
respectively, will have an overall institutional leverage ratio of 6-to-1. As demonstrated by this simplified
analysis, the overall leverage ratio, and therefore private investment driven by the Green Bank, depends
on the makeup of the underlying products of the Green Bank.
It will be the responsibility of the Green Bank’s directors and leadership staff to ultimately define the
exact parameters, and therefore leverage, the Green Bank achieves through its products. However, the
overall institutional leverage ratios of other Green Banks are instructive. The most experienced Green
Banks around the world are in Connecticut, New York, the United Kingdom, and Australia. Their overall
leverage ratios range from approximately 6-to-1 to 2.5-to-1. Again, these figures do not necessarily
reflect a strategic decision to increase or decrease leverage, but are the summation of underlying
financing activity. Based on these figures, it is reasonable to predict the District Green Bank could
achieve a leverage ratio of 5 to 1, thereby driving over half a billion in total clean energy investment.
As stated above, the other element that drives leverage, and therefore market impact is time.
Specifically, how long does it take the Green Bank to deploy all of its capital, and how quickly can it be
recycled. For example, imagine the Green Bank received $100 million on day 1 and deployed it all in a
single year. Therefore, in one year it would have driven $500 million in total investment. Then, at the
end of that year, it was able to fully recapitalize, and begin the second year of operation with $100 in
cash back on its balance sheet. If this same activity was repeated annually, it could effectively stimulate
$5 billion over a 10-year span using the same $100 million (ignoring discounting for the time value of
money). In this entirely illustrative and exaggerated example, one can see how the pace of deployment
and timing of recapitalization greatly affects the overall impact of the Green Bank.
In reality in the District, the Green Bank (in the recommended scenario) would be capitalized over a
number of years, and it is unlikely that each dollar of capital allocated to the Green Bank would be
deployed immediately. This is especially true in its early years in the start-up phase, as products are
designed and rolled-out. Therefore, the precise impact and timing of investment will depend on the
operations, market uptake, and product design of the Green Bank.
Given this variability, and based on other Green Bank precedents, it is reasonable to assume that the
Green Bank can drive half a billion of private investment over its first phase of operation while it is still
receiving funding.
In addition to making a meaningful market impact, $100 million in capital is sufficient to make the
market take notice. It is important that the Green Bank is seen as a relevant and sizable tool of the
District that is not just another program, but a dedicated institution given the authority and purpose to
bring scale to the market. A figure less than $100 million may make the Green Bank appear to be less
significant in the eyes of private investors, and therefore not draw attention and interest. A figure less
than $100 million will surely still lead to good outcomes, but the speed of activity and institutional
gravitas will be lessened. As stated above, it is likely that $50 million would be the minimal size needed.

43
District Green Bank Capitalization Methods & Sources CGC recommends that the Green Bank use a combination of capitalization methods and sources. The
Green Bank should be given a significant upfront capitalization to build its capital base and cover initial
operating expenses. It should also be given a stream of revenue over time to expand its capital base.
And it should be given the legal authority to issue bonds in order to recycle and recapitalize the
institution. By using all funding methods, the District Green Bank would draw upon the best practices of
all existing Green Banks. The Green Bank should draw upon any and all funding sources available,
several of which are specifically identified below. This includes a potential direct budget appropriation,
use of settlement funds from the Exelon-Pepco merger, and the Renewable Energy Development Fund
(REDF) resources. As an on-going funding stream, CGC recommends an increase in the Sustainable
Energy Trust Fund (SETF) to collect and dedicate funds to the Green Bank on an annual basis.
Green Bank Funding Methods Independent of funding source, there are several methods the District could use to capitalize the Green
Bank. It is important that the Green Bank have a strong capital base to ensure market impact, have
certainty over its funding levels, and have the ability to recapitalize itself once it has loaned out all of its
capital. CGC recommends that the Green Bank use all three methods of funding. The methods described
in this section include:
Upfront initial capitalization or “grant”
Recurring revenue stream
Bond Issuance
Upfront Initial Capitalization
The Green Bank could be capitalized with an upfront infusion of public money at its inception. If no
other funds were authorized, or no bonding authority were granted, then the Green Bank would
effectively operate as a revolving loan fund, relying exclusively on the repayment, over time, of the loans
it made in order to recapitalize and make new loans. This structure is simple, but limits the capacity and
velocity of lending. It is the responsibility of Green Bank leadership to manage the funds appropriately
to always maintain capital necessary to cover operating expenses. The Hawaii Green Infrastructure
Authority was funded in a similar fashion, with an initial infusion of $150 million with no plans for
increased capitalization. The NYGB was funded with an initial capitalization of more than $200 million,
though this was part of a long-term capitalization plan with money pledged over time.
Figure 14: Single Initial Capitalization Model32

44
Recurring or Time Specific Revenue Stream
Another structure would be for the Green Bank to receive capital over time from a dedicated stream of
revenue. This could be a perpetual stream of revenue, where the capital raised from a tax, for instance,
is indefinitely committed to the Green Bank. Or the stream could be directed to the Green Bank only for
a set amount of time or until a specific amount of funds are invested in the Bank. This method of
funding would allow the Green Bank to build up a significant capital base for lending, but without a large
upfront cost to the government. The cost of capitalizing the Green Bank would be spread out over time.
There are also operating benefits to this kind of funding stream, as the Green Bank gains flexibility and a
willingness to take on investments and market development activities with a long time horizon.
For example, the Connecticut Green Bank is funded through a dedicated revenue stream, which by
statute flows to the Green Bank indefinitely. The Green Bank receives roughly $30 million in funding
every year through on-going receipts from a system benefit charge. This structure ensures the Green
Bank has liquid assets, and provides flexibility for the Green Bank to take on activity that may not
generate returns for a long period of time. This funding structure also has given the CT Green Bank
tremendous institutional stability and the ability to do long-term planning.
The NYGB receives funds over time from a dedicated revenue stream in the form of a system benefits
charge, but only for a set period of time. The NYGB is meant to be fully capitalized to a level of $1 billion
in public funds, but not all of that money is sent to the NYGB at once. Instead it is allocated to the NYGB
over a period of time. Since its inception in December 2013, the NYGB has received $368.5 million in
public capital. The remaining $631.5 million will be given to the NYGB through scheduled annual
transfers from a system benefit charge, with the last investment coming in 2025.
And internationally, the Australian Clean Energy Finance Center is capitalized in a similar manner. It is to
have a total capitalization of AUD 10 billion, but spread out over 5 years with fixed AUD2 billion annual
installment payments.
Figure15: Recurring Capitalization with Dedicated Revenue Model
Bond Issuance
The final method for funding a Green Bank would be through bonds. Issuing bonds would allow the
Green Bank to draw in private capital from institutional investors beyond the initial or on-going public
capitalization. There are many potential permutations of Green Bank bonding in the District (explained
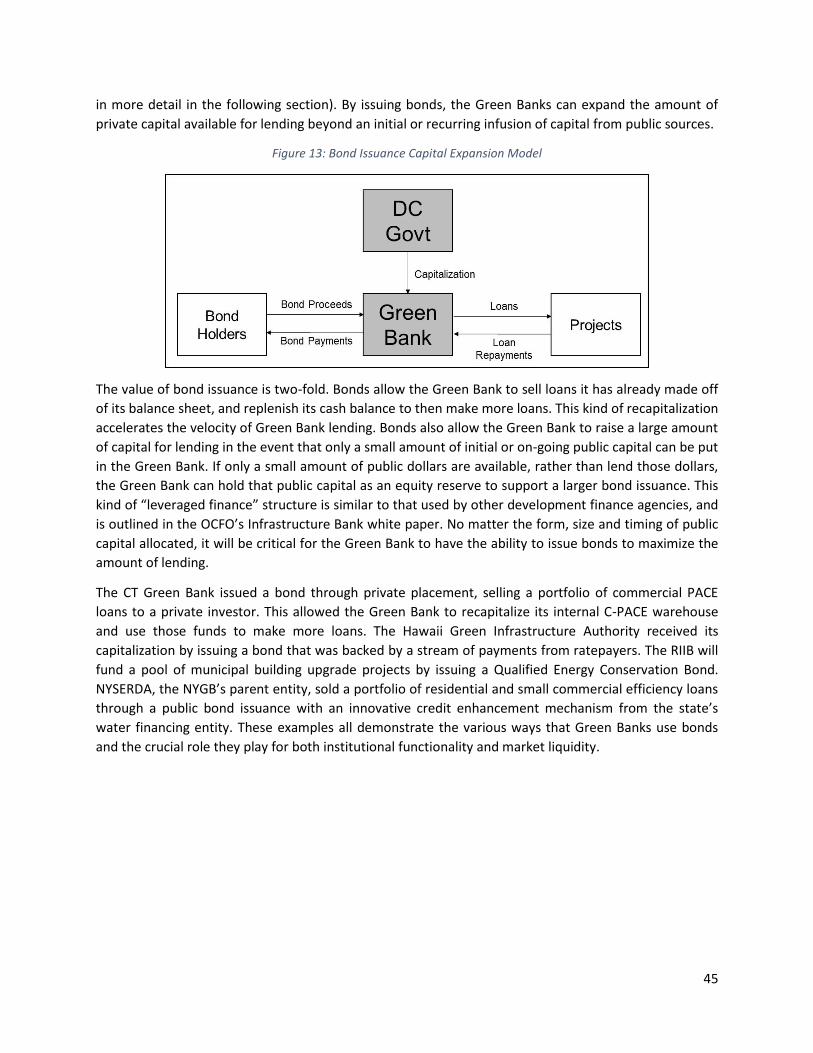
45
in more detail in the following section). By issuing bonds, the Green Banks can expand the amount of
private capital available for lending beyond an initial or recurring infusion of capital from public sources.
Figure 13: Bond Issuance Capital Expansion Model
The value of bond issuance is two-fold. Bonds allow the Green Bank to sell loans it has already made off
of its balance sheet, and replenish its cash balance to then make more loans. This kind of recapitalization
accelerates the velocity of Green Bank lending. Bonds also allow the Green Bank to raise a large amount
of capital for lending in the event that only a small amount of initial or on-going public capital can be put
in the Green Bank. If only a small amount of public dollars are available, rather than lend those dollars,
the Green Bank can hold that public capital as an equity reserve to support a larger bond issuance. This
kind of “leveraged finance” structure is similar to that used by other development finance agencies, and
is outlined in the OCFO’s Infrastructure Bank white paper. No matter the form, size and timing of public
capital allocated, it will be critical for the Green Bank to have the ability to issue bonds to maximize the
amount of lending.
The CT Green Bank issued a bond through private placement, selling a portfolio of commercial PACE
loans to a private investor. This allowed the Green Bank to recapitalize its internal C-PACE warehouse
and use those funds to make more loans. The Hawaii Green Infrastructure Authority received its
capitalization by issuing a bond that was backed by a stream of payments from ratepayers. The RIIB will
fund a pool of municipal building upgrade projects by issuing a Qualified Energy Conservation Bond.
NYSERDA, the NYGB’s parent entity, sold a portfolio of residential and small commercial efficiency loans
through a public bond issuance with an innovative credit enhancement mechanism from the state’s
water financing entity. These examples all demonstrate the various ways that Green Banks use bonds
and the crucial role they play for both institutional functionality and market liquidity.
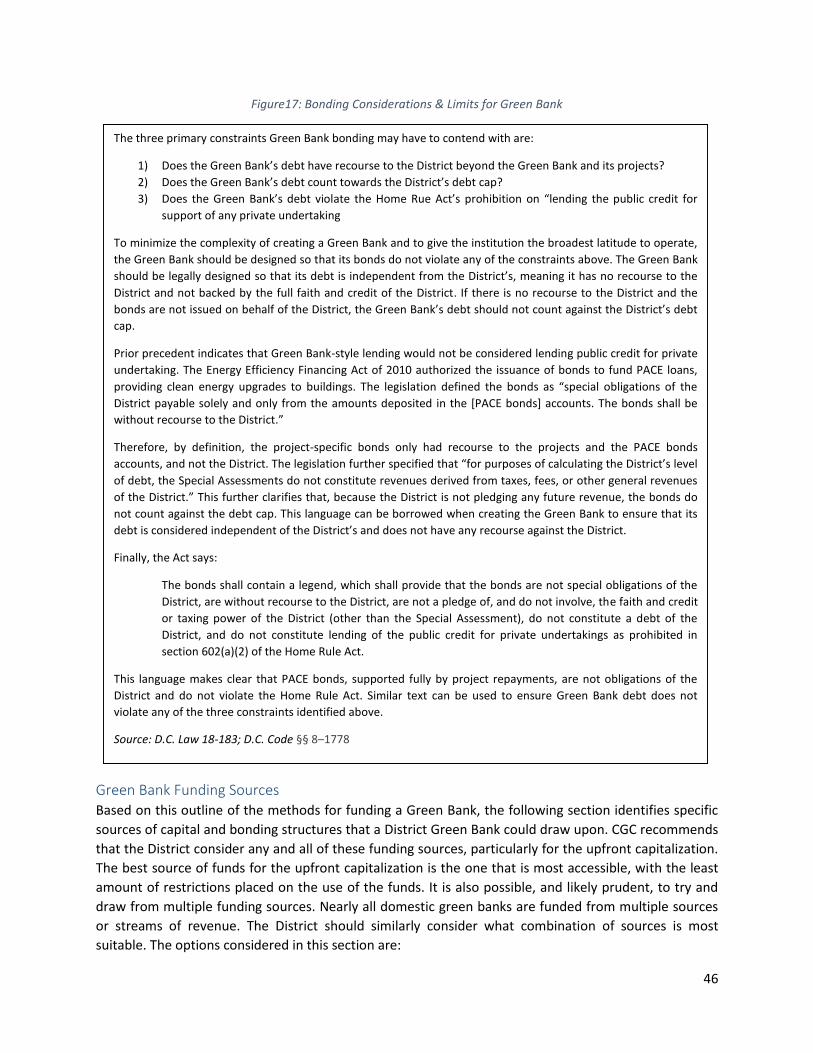
46
Figure17: Bonding Considerations & Limits for Green Bank
Green Bank Funding Sources Based on this outline of the methods for funding a Green Bank, the following section identifies specific
sources of capital and bonding structures that a District Green Bank could draw upon. CGC recommends
that the District consider any and all of these funding sources, particularly for the upfront capitalization.
The best source of funds for the upfront capitalization is the one that is most accessible, with the least
amount of restrictions placed on the use of the funds. It is also possible, and likely prudent, to try and
draw from multiple funding sources. Nearly all domestic green banks are funded from multiple sources
or streams of revenue. The District should similarly consider what combination of sources is most
suitable. The options considered in this section are:
The three primary constraints Green Bank bonding may have to contend with are:
1) Does the Green Bank’s debt have recourse to the District beyond the Green Bank and its projects?
2) Does the Green Bank’s debt count towards the District’s debt cap?
3) Does the Green Bank’s debt violate the Home Rue Act’s prohibition on “lending the public credit for
support of any private undertaking
To minimize the complexity of creating a Green Bank and to give the institution the broadest latitude to operate,
the Green Bank should be designed so that its bonds do not violate any of the constraints above. The Green Bank
should be legally designed so that its debt is independent from the District’s, meaning it has no recourse to the
District and not backed by the full faith and credit of the District. If there is no recourse to the District and the
bonds are not issued on behalf of the District, the Green Bank’s debt should not count against the District’s debt
cap.
Prior precedent indicates that Green Bank-style lending would not be considered lending public credit for private
undertaking. The Energy Efficiency Financing Act of 2010 authorized the issuance of bonds to fund PACE loans,
providing clean energy upgrades to buildings. The legislation defined the bonds as “special obligations of the
District payable solely and only from the amounts deposited in the [PACE bonds] accounts. The bonds shall be
without recourse to the District.”
Therefore, by definition, the project-specific bonds only had recourse to the projects and the PACE bonds
accounts, and not the District. The legislation further specified that “for purposes of calculating the District’s level
of debt, the Special Assessments do not constitute revenues derived from taxes, fees, or other general revenues
of the District.” This further clarifies that, because the District is not pledging any future revenue, the bonds do
not count against the debt cap. This language can be borrowed when creating the Green Bank to ensure that its
debt is considered independent of the District’s and does not have any recourse against the District.
Finally, the Act says:
The bonds shall contain a legend, which shall provide that the bonds are not special obligations of the
District, are without recourse to the District, are not a pledge of, and do not involve, the faith and credit
or taxing power of the District (other than the Special Assessment), do not constitute a debt of the
District, and do not constitute lending of the public credit for private undertakings as prohibited in
section 602(a)(2) of the Home Rule Act.
This language makes clear that PACE bonds, supported fully by project repayments, are not obligations of the
District and do not violate the Home Rule Act. Similar text can be used to ensure Green Bank debt does not
violate any of the three constraints identified above.
Source: D.C. Law 18-183; D.C. Code §§ 8–1778
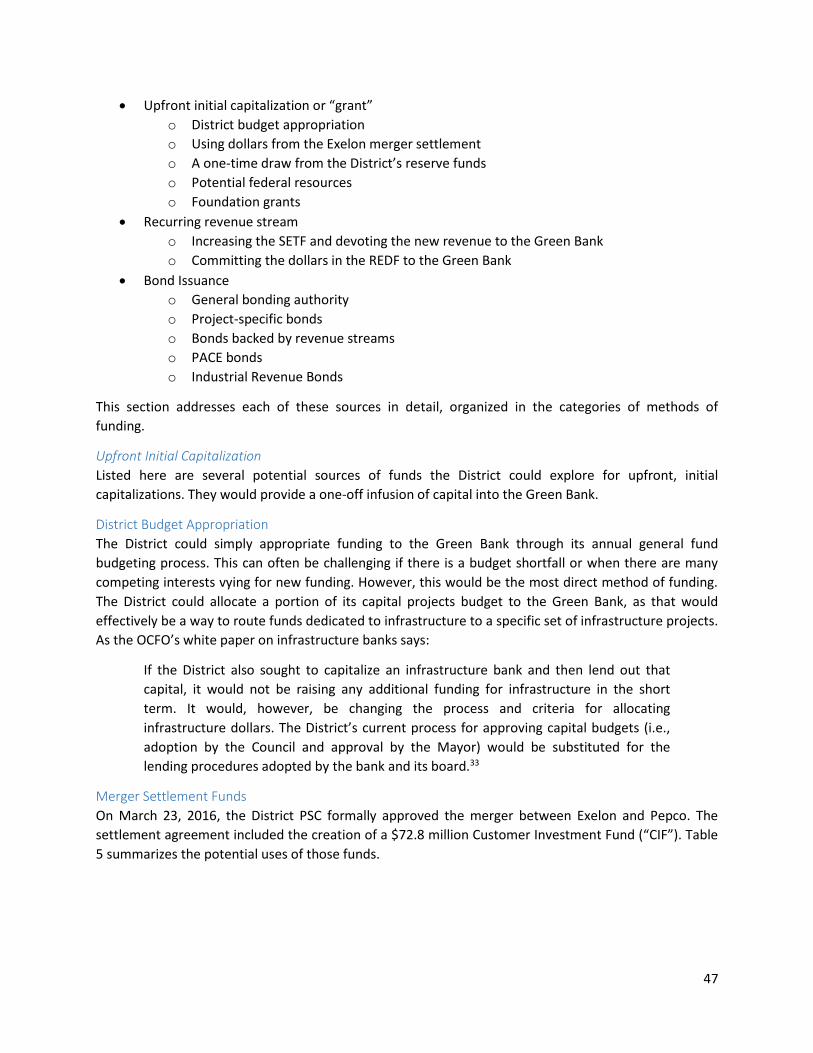
47
Upfront initial capitalization or “grant”
o District budget appropriation
o Using dollars from the Exelon merger settlement
o A one-time draw from the District’s reserve funds
o Potential federal resources
o Foundation grants
Recurring revenue stream
o Increasing the SETF and devoting the new revenue to the Green Bank
o Committing the dollars in the REDF to the Green Bank
Bond Issuance
o General bonding authority
o Project-specific bonds
o Bonds backed by revenue streams
o PACE bonds
o Industrial Revenue Bonds
This section addresses each of these sources in detail, organized in the categories of methods of
funding.
Upfront Initial Capitalization
Listed here are several potential sources of funds the District could explore for upfront, initial
capitalizations. They would provide a one-off infusion of capital into the Green Bank.
District Budget Appropriation
The District could simply appropriate funding to the Green Bank through its annual general fund
budgeting process. This can often be challenging if there is a budget shortfall or when there are many
competing interests vying for new funding. However, this would be the most direct method of funding.
The District could allocate a portion of its capital projects budget to the Green Bank, as that would
effectively be a way to route funds dedicated to infrastructure to a specific set of infrastructure projects.
As the OCFO’s white paper on infrastructure banks says:
If the District also sought to capitalize an infrastructure bank and then lend out that
capital, it would not be raising any additional funding for infrastructure in the short
term. It would, however, be changing the process and criteria for allocating
infrastructure dollars. The District’s current process for approving capital budgets (i.e.,
adoption by the Council and approval by the Mayor) would be substituted for the
lending procedures adopted by the bank and its board.33
Merger Settlement Funds
On March 23, 2016, the District PSC formally approved the merger between Exelon and Pepco. The
settlement agreement included the creation of a $72.8 million Customer Investment Fund (“CIF”). Table
5 summarizes the potential uses of those funds.

48
Table 5: Use & Size of Merger Customer Investment Fund34
Use of Funds CIF Allocation
(millions)
Customer Base Rate Credit, as a credit to offset rate increases for Pepco customers approved by the Commission, until the credit fund is used up
$25.60
One time direct bill credit $14.00
MEDSIS Pilot Project Fund for grid modernization pilot projects $21.55
Energy Efficiency and Energy Conservation Initiatives Fund for use with energy efficiency programs and projects targeted at affordable housing
$11.25
Forgive residential customer accounts receivables more than 2 years old ~$0.40
Total $72.8
The PSC has control and discretion over the precise use of funds within each of these categories. Both
the grid modernization pilot project category and the efficiency for affordable housing categories should
be market needs that the Green Bank addresses in its financing activities. Therefore, the Green Bank
would be well placed, with PSC approval, to receive funding from these CIF categories.
The original settlement agreement submitted by the Joint Applicants to the PSC on October 6, 2015,
specifically included a $10.05 million allocation from the CIF to the Green Building Fund (GBF).xiii The GBF
is jointly managed by DOEE and the Department of Consumer and Regulatory Affairs (DCRA), and
therefore is under the Mayor’s control. Though the specific use of the funds was not identified in the
submitted settlement agreement, DOEE did go on record during the proceedings to specify that the
intended use of the $10.05 million was to capitalize a District Green Bank.35
PSC Order No. 18109 of February 2016, rejected and amended the settlement agreement of October
2015, eliminating this GBF allocation from the CIF. However, this removal of funding was not based on
opposition to the concept of a Green Bank. Rather, the order cited a history of the Mayor and District
Council transferring dollars from funds dedicated for sustainability purposes into the general funds for
the District. That led to the $10.05 million allocation for a Green Bank via the GBF being stripped out,
and the allocation of all CIF funds was brought under the direction of the PSC, rather than the Mayor
and Council.36
The final order of March 23 specified that $21.55 million of the CIF be placed in an account to fund pilots
to modernize the grid, and that $11.25 million of the CIF be placed in an account to “support innovative
energy conservation or energy efficiency programs targeted primarily towards both affordable single
family units and master metered multifamily buildings that include low and limited income residents
that are supported or operated by the District or by qualified non-profit entities that support and enable
xiii Joint Applicants includes the Office of People’s Counsel, the District of Columbia Government, the District of Columbia Water and Sewer Authority, the National Consumer Law Center, National Housing Trust, the National Housing Trust-Enterprise Preservation Corporation and the Apartment and Office Building Association of Metropolitan Washington. See Motion of Joint Applicants to Reopen the Record in Formal Case No. 1119 to Allow for Consideration of Nonunanimous Full Settlement Agreement and Stipulation, or for Other Alternative Relief (“Motion to Reopen”).

49
targeted energy-efficiency programs.”37 A District Green Bank would likely address both of these needs,
and therefore still be able to receive CIF merger dollars under PSC oversight.
District Reserve Funds
Like many governments, the District maintains reserve funds or “rainy day funds” to protect the budget
from major economic downturns or unforeseen events that might negatively impact the District’s ability
to collect revenue and cover its expenses. The District’s “rainy day funds” are actually made up of
multiple individual funds, which together hold more than half a billion dollars.xiv
As of the end of FY 2015, the Emergency Reserve Fund held $122.1 million and the Contingency Cash
Reserve Fund held $244.2 million.38 These two funds were mandated by Congress as part of the Home
Rule Act. By rule, the Emergency Reserve Fund must equal 2% of general local expenditures minus debt
services costs, and the Contingency Case Reserve Fund must equal 4%.39
The third Fiscal Stabilization Reserve Fund was created by Council in 2010 to provide added fiscal
protection. At full funding it must equal 2.34% of local expenditures minus debt service.40 At the end of
FY 2015, the fund contained $174.9 million.41 In the case of all three funds, there are specific rules in
place that govern the events and needs that can trigger a draw down from the funds, and matching
rules to ensure that any shortfall in the fund as a result of a drawdown is filled with new funds. The
Contingency Cash Reserve Fund and Fiscal Stabilization Reserve “may be drawn down by the Mayor to
provide for nonrecurring or unforeseen needs that arise during the fiscal year. They also may be used to
cover unexpected revenue shortfalls.” And the Emergency Cash Reserve “may only be drawn down to
provide for unanticipated and nonrecurring extraordinary needs of an emergency nature.”42
It would be difficult to argue that a Green Bank fits the within the allowed set of reasons to draw down
from these funds. Therefore, allocating dollars from any of the reserve funds would require a specific
legislative exception. This might be particularly challenging for the Emergency and Contingency Cash
Reserve Funds, as they are mandated by Congress.
But the Fiscal Stabilization Reserve is under District control. And, as of the end of FY 2014, the District
Auditor found that the Fiscal Stabilization Reserve was overfunded by approximately $24 million.43 The
DOEE could specifically seek an exception to the rules to draw on these funds to capitalize a Green Bank.
And by only seeking excess funds above the required level, this draw would not trigger any new need to
replenish the fund.
Not only is the funding concept plausible because of the excess funding, it is also attractive because
investment in the Green Bank could produce a higher return on investment. Unlike using the reserve
funds to pay for other one-off expenses, putting these dollars into the Green Bank would be an
alternative investment for the funds. In FY 2015, the Emergency Cash Reserve Fund earned $176,812 on
an investment of $116 million. This represents annual return of 0.15%.44 By investing a small portion of
these funds in the Green Bank, the District would instead be supporting the local economy, reducing
GHG emission and increasing their return on investment. Depending on the institution, Green Bank
loans are often made at interest rates well above even 2%. Rather than considered a one-off draw down
xiv This analysis only examines the Emergency, Contingency and Fiscal Stabilization Reserves. The Cash Flow Reserve is not addressed, as it is presently underfunded and not suitable for consideration. See District of Columbia General Credit Update March 10, 2016.
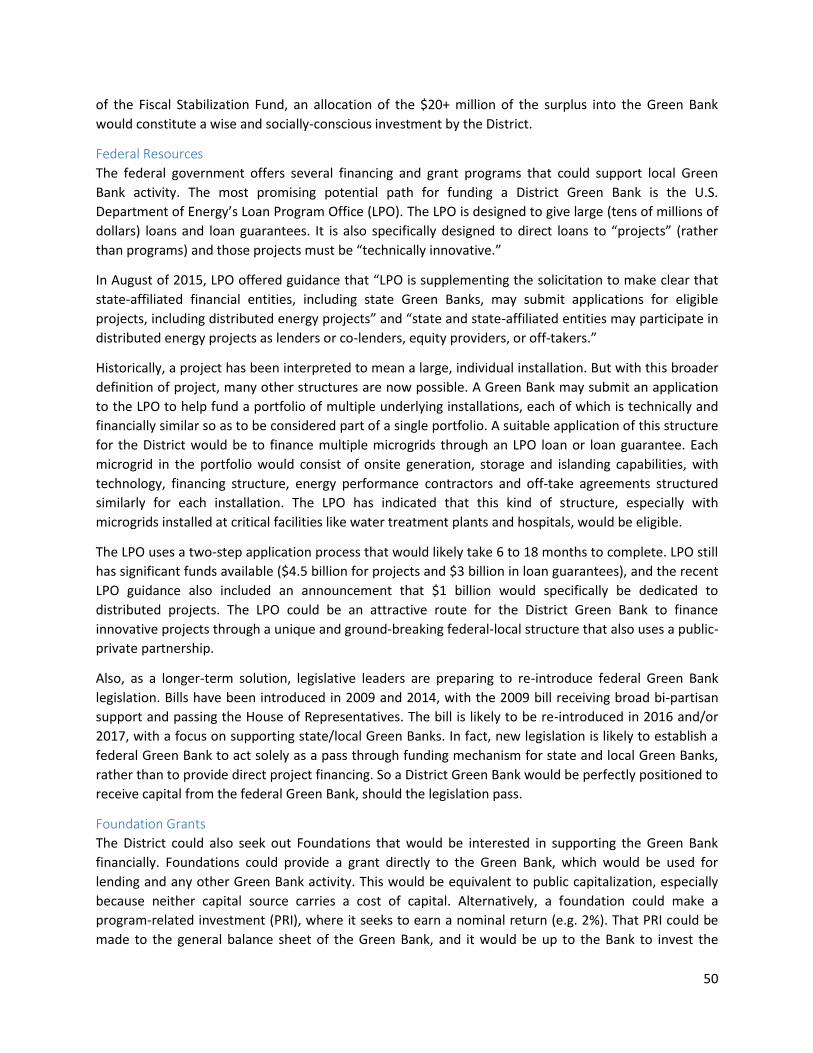
50
of the Fiscal Stabilization Fund, an allocation of the $20+ million of the surplus into the Green Bank
would constitute a wise and socially-conscious investment by the District.
Federal Resources
The federal government offers several financing and grant programs that could support local Green
Bank activity. The most promising potential path for funding a District Green Bank is the U.S.
Department of Energy’s Loan Program Office (LPO). The LPO is designed to give large (tens of millions of
dollars) loans and loan guarantees. It is also specifically designed to direct loans to “projects” (rather
than programs) and those projects must be “technically innovative.”
In August of 2015, LPO offered guidance that “LPO is supplementing the solicitation to make clear that
state-affiliated financial entities, including state Green Banks, may submit applications for eligible
projects, including distributed energy projects” and “state and state-affiliated entities may participate in
distributed energy projects as lenders or co-lenders, equity providers, or off-takers.”
Historically, a project has been interpreted to mean a large, individual installation. But with this broader
definition of project, many other structures are now possible. A Green Bank may submit an application
to the LPO to help fund a portfolio of multiple underlying installations, each of which is technically and
financially similar so as to be considered part of a single portfolio. A suitable application of this structure
for the District would be to finance multiple microgrids through an LPO loan or loan guarantee. Each
microgrid in the portfolio would consist of onsite generation, storage and islanding capabilities, with
technology, financing structure, energy performance contractors and off-take agreements structured
similarly for each installation. The LPO has indicated that this kind of structure, especially with
microgrids installed at critical facilities like water treatment plants and hospitals, would be eligible.
The LPO uses a two-step application process that would likely take 6 to 18 months to complete. LPO still
has significant funds available ($4.5 billion for projects and $3 billion in loan guarantees), and the recent
LPO guidance also included an announcement that $1 billion would specifically be dedicated to
distributed projects. The LPO could be an attractive route for the District Green Bank to finance
innovative projects through a unique and ground-breaking federal-local structure that also uses a public-
private partnership.
Also, as a longer-term solution, legislative leaders are preparing to re-introduce federal Green Bank
legislation. Bills have been introduced in 2009 and 2014, with the 2009 bill receiving broad bi-partisan
support and passing the House of Representatives. The bill is likely to be re-introduced in 2016 and/or
2017, with a focus on supporting state/local Green Banks. In fact, new legislation is likely to establish a
federal Green Bank to act solely as a pass through funding mechanism for state and local Green Banks,
rather than to provide direct project financing. So a District Green Bank would be perfectly positioned to
receive capital from the federal Green Bank, should the legislation pass.
Foundation Grants
The District could also seek out Foundations that would be interested in supporting the Green Bank
financially. Foundations could provide a grant directly to the Green Bank, which would be used for
lending and any other Green Bank activity. This would be equivalent to public capitalization, especially
because neither capital source carries a cost of capital. Alternatively, a foundation could make a
program-related investment (PRI), where it seeks to earn a nominal return (e.g. 2%). That PRI could be
made to the general balance sheet of the Green Bank, and it would be up to the Bank to invest the
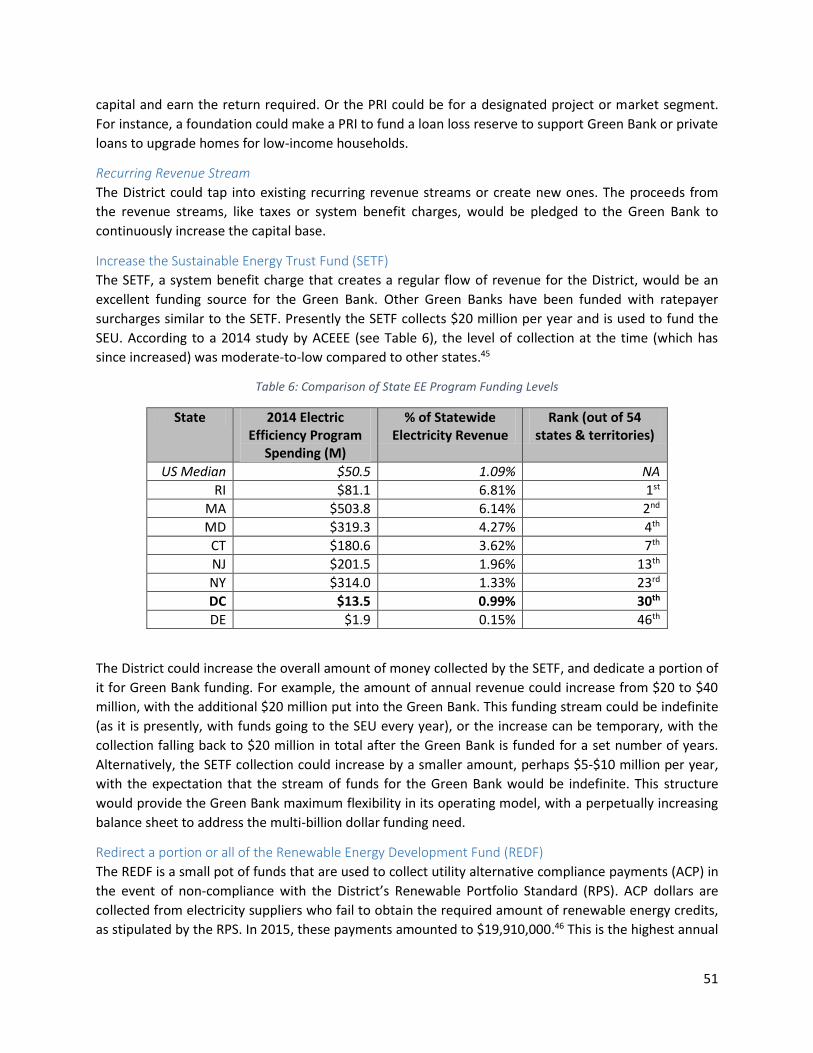
51
capital and earn the return required. Or the PRI could be for a designated project or market segment.
For instance, a foundation could make a PRI to fund a loan loss reserve to support Green Bank or private
loans to upgrade homes for low-income households.
Recurring Revenue Stream
The District could tap into existing recurring revenue streams or create new ones. The proceeds from
the revenue streams, like taxes or system benefit charges, would be pledged to the Green Bank to
continuously increase the capital base.
Increase the Sustainable Energy Trust Fund (SETF)
The SETF, a system benefit charge that creates a regular flow of revenue for the District, would be an
excellent funding source for the Green Bank. Other Green Banks have been funded with ratepayer
surcharges similar to the SETF. Presently the SETF collects $20 million per year and is used to fund the
SEU. According to a 2014 study by ACEEE (see Table 6), the level of collection at the time (which has
since increased) was moderate-to-low compared to other states.45
Table 6: Comparison of State EE Program Funding Levels
State 2014 Electric Efficiency Program
Spending (M)
% of Statewide Electricity Revenue
Rank (out of 54 states & territories)
US Median $50.5 1.09% NA
RI $81.1 6.81% 1st
MA $503.8 6.14% 2nd
MD $319.3 4.27% 4th
CT $180.6 3.62% 7th
NJ $201.5 1.96% 13th
NY $314.0 1.33% 23rd
DC $13.5 0.99% 30th
DE $1.9 0.15% 46th
The District could increase the overall amount of money collected by the SETF, and dedicate a portion of
it for Green Bank funding. For example, the amount of annual revenue could increase from $20 to $40
million, with the additional $20 million put into the Green Bank. This funding stream could be indefinite
(as it is presently, with funds going to the SEU every year), or the increase can be temporary, with the
collection falling back to $20 million in total after the Green Bank is funded for a set number of years.
Alternatively, the SETF collection could increase by a smaller amount, perhaps $5-$10 million per year,
with the expectation that the stream of funds for the Green Bank would be indefinite. This structure
would provide the Green Bank maximum flexibility in its operating model, with a perpetually increasing
balance sheet to address the multi-billion dollar funding need.
Redirect a portion or all of the Renewable Energy Development Fund (REDF)
The REDF is a small pot of funds that are used to collect utility alternative compliance payments (ACP) in
the event of non-compliance with the District’s Renewable Portfolio Standard (RPS). ACP dollars are
collected from electricity suppliers who fail to obtain the required amount of renewable energy credits,
as stipulated by the RPS. In 2015, these payments amounted to $19,910,000.46 This is the highest annual

52
payment into the REDF, with prior years’ payments ranging from $4,900 to $6,308,710. Historically these
dollars have been used to fund solar grant programs. The amount of funds in the REDF is expected to
increase dramatically in future years and could be a helpful addition to the Green Bank, though the use
of the funds is limited to local solar installations, battery storage and roof replacements.
Bond Issuance
In addition to directly appropriating funds to the Green Bank to be used as lending and operating
capital, a Green Bank could supplement and expand its capital base by issuing bonds. With the ability to
issue bonds, the Green Bank could more efficiently recycle its capital, draw in new private investors, and
expand its ability to address market needs.
General Institutional Bonding Authority
If the Green Bank were created as a quasi-public instrumentality of the District, the Bank could be given
independent bonding authority. Legislation could be written so that the Green Bank’s bonds have no
recourse to the District, do not come with the District’s full faith and credit, and would not impact the
District’s debt limit. (This is an advantage to the quasi-public structure, as this kind of independent
bonding authority would be harder to implement through the internal, contracted structured.) If the
District so chose, the Green Bank could also be provided limited reserve from the District to sit behind
and strengthen a bond issuance. The Connecticut Green Bank, for instance, has its own bonding
authority that is not backed by the state, however it was granted up to $50 million of bonding authority
supported by the state’s Special Capital Reserve Funds.
Tactically, bonding authority is critical for a number of reasons. If the Green Bank is able to lend out all
of its initial capital, it will no longer have cash to continue lending. If the Green Bank can issue bonds, it
would be able to sell those loans to private investors, and recapitalize its balance sheet to continue
making more loans. The sale could be done through a private placement or a public securitization.
Through either structure, the Green Bank is able to increase the rate of lending because of its bonding
capacity. If the Green Bank has a sufficient balance sheet and equity reserve, it could also issue revenue
bonds where recourse isn’t limited to a specific set of projects. This would allow the Green Bank to
expand its overall lending capacity in a fashion similar to that used by traditional development finance
authorities. Under either bonding structure, the bonds could be labeled as “green bonds” potentially
giving the Green Bank a slight pricing advantage in the market. (As all Green Bank activity is necessarily
focused on clean energy activity, there would be no question that the use of the bond proceeds would
allow the issuances to qualify as green bonds.)
Project Specific Bonds
The Green Bank could issue revenue bonds that are solely repaid by the repayments of loans to specific
projects financed by the Green Bank. This would allow the bank to sell loans off the balance sheet,
replace the original loans with cash, and make more loans. The bonds would have no recourse to the
District and would not count toward the debt cap. These kinds of bonds are akin to the PACE bonds that
are repaid exclusively by the special energy assessments collected by the District as loan repayment.
This kind of project-specific bond is viable for the Green Bank, because the Green Bank typically only
invests in projects that can be repaid through savings, assuring a strong repayment stream.
Bonds Backed by Revenue Stream
Under certain constructs, it might be viable for the Green Bank to issue bonds that repaid exclusively by
a revenue stream dedicated to the bank. Ordinarily, this kind of bond would be supported by a
53
dedicated tax stream, collected by the government. However, that kind of construct would count
toward the District debt cap, because repayment relies on the District’s ability to collect the tax.47 The
Green Bank should avoid any negative impact on the District’s debt capacity. So rather than exploring a
tax-based revenue stream, the Green Bank could bond against a utility surcharge-based revenue stream.
Specifically, if the Green Bank is capitalized with an on-going stream of revenue from the SETF, the
Green Bank could bond against that stream. That would allow the Green Bank to realize upfront the
cash that it would take years to accumulate through the stream of SETF collections. The Green Bank
could issue a bond to get the cash up front, giving it greater flexibility and potential impact, with the
bonds repaid through the SETF collected over time. This is the construct used in Hawaii to capitalize the
Green Infrastructure Authority’s GEMS program (discussed in a prior chapter). The Green Infrastructure
Fee collected on all ratepayer bills was pledged to support the bond issuance, allowing Hawaii to raise
$150 million upfront to finance projects.
PACE NCEF Bonds
As described in the earlier section on the current status of DC PACE, the program was originally
established under the Energy Efficiency Financing Act of 2010 with an original intent for the government
to sell the PACE loans to private investors through bond issuances, thus capitalizing and recapitalizing
the National Capital Energy Fund (NCEF) over time. This construct has never been utilized, and a Green
Bank could be the ideal institutional framework to take advantage of the NCEF bonding tool.
As of the writing of this report, six PACE deals have closed in the District with $5.25 million in financing.
There is broad evidence that commercial PACE works and is an effective tool for financing energy
upgrades for a certain class and size of commercial buildings. The Connecticut Green Bank (CGB), which
has financed over $100 million in commercial PACE in 3 years, has done so by using public capital to
make the project loans. Capital is available on demand for borrowers, interest rates and terms are
known, and there is a high level of certainty for applicants that they can get their deal financed. The CGB
then aggregates those loans in a portfolio and sells them through bonds.
Green Bank capital could be used to make initial loans that build into a portfolio. The Green Bank (or the
District) could issue bonds and recapitalize the NCEF to recycle and re-lend the initial capitalization. And
this structure need not compete with private lenders who want to make PACE loans directly, as has
been done in the six deals completed to date. Just like in Connecticut, borrowers are not required to
take the Green Bank loan. Based on strong evidence from other markets that this structure works, it
could grow PACE in the District.
Industrial Revenue Bonds
The Green Bank could be authorized, likely through legislation, to use the District’s Industrial Revenue
Bond program to finance energy upgrades for commercial and non-profit buildings. The program
provides access to tax-exempt financing, which can secure interest rates for borrowers up to 4% cheaper
than other commercial loans. Any non-profit or manufacturer located in the District is eligible, and other
commercial buildings may also be eligible. This could be an easy way for the Green Bank to begin
channeling private capital, at low cost, to projects in the District using an existing and well-practiced
finance tool.48

54
Standing Up the Green Bank Once the District has identified the legal structure and funding methods and sources for the Green Bank,
it must then create and stand up the organization. Much like starting-up a new business, the Green Bank
will need an operating plan that includes hiring staff, managing expenses, and establishing objectives
and priorities. This section outlines some of the key steps the District government must take to create
and operationalize the Green Bank.
Legal Formation & Capitalization The first step the District must take are the legal actions required to create, authorize and fund the
Green Bank. Creating the legal entity, assuming it is a quasi-public entity, will require legislation. The
legislation should address the follow topic areas:
Organization Creation & Structure – this section would define the legal nature of the Green
Bank (in this case, a quasi-public instrumentality that is wholly-owned by the District).
Organization Governance – this would address the exact Board composition of the Green Bank,
how Directors are appointed, how long their terms are and if there are any required
committees. This could also enumerate the specific responsibilities of the Board.
Capitalization – this section would identify the exact source and amount of capital that would
be given to the Green Bank.
Bond Authority – this section would outline the bonding powers (and limits) the Green Bank
would have. The section should specifically address how the Green Bank will comply with the
Home Rule Act and Anti-Deficiency Act.
Types of Investment – this section would enumerate the specific financing powers and
authorities that the Green Bank would have. The legislation could explain different financing
mechanisms, or it could give a broad authority to use public capital to drive private investment
in clean energy. (It is often wise to explicitly state that the Green Bank is authorized to co-invest
in projects with the private sector.)
Eligible Technologies & Projects – this section would define what technologies are eligible for
Green Bank financing, and what constitutes an eligible project that can receive funds. For
instance, the District may decide that EV charging stations are eligible for Green Bank financing,
but not EV’s.
Related Mechanisms & Powers – this section would explicitly define the Green Bank’s
relationship to DC PACE and the SEU. It could also give the Green Bank a role or authority to
create an on-bill financing program.
Legislation that covers these basic topic areas will ensure the Green Bank is well defined and will
minimize the potential need to return in following sessions to amend the statute.
Depending on the source of funds used to capitalize the Green Bank, it may also be necessary for the
District to pursue regulatory action. For instance, an increase in the level of ratepayer funds collected
55
through the SETF would likely require regulatory action by the PSC, in addition to legislation. And if the
Green Bank were to receive funding from the Exelon-Pepco merger settlement funds, regulatory
approval from the PSC would almost certainly be required. Those funds appear to be under the exclusive
jurisdiction of the regulator, meaning that legislation passed by Council would likely not cause the PSC to
allocate these funds to the Green Bank.
Green Bank Operations Green Banks are fiscally-sustainable, purpose-built entities of government focused on clean energy
finance. As such, the organization must be staffed with specific skill sets and experience, and needs to
be financially managed to cover its costs. A Green Bank will likely go through multiple phases of
development, resembling a start-up organization at first and adding staff and functionality over time.
Also, a Green Bank, like any other start-up, will likely incur greater expenses than revenue when first
founded. Green Bank operation, staffing and fiscal management are tied to the funding level and loan
volume. Little upfront capital restricts hiring. Longer loan terms result in longer repayment periods for
the Green Bank, lowering the amount of cash available for operating expenses. The more quickly the
Green Bank can sell its loans, the more cash is available on a regular basis to pay staff. The following
sections explore these topics in greater detail.
Self-Sustainability
Recommendations:
Dedicate a pool of funds for startup costs and staff salaries
Expect high costs for the first few years of operations
Create lending terms that factor in some expected losses
Balance market development activities, which do not directly produce returns, with return-
producing financing activities
Create goals and performance metrics that encourage the Green Bank to achieve a level of
operations and returns that allow the organization to break-even
Funding a Green Bank is different from funding other typical government programs because Green
Banks can ultimately pay most, if not all, of their own operating expenses. A typical clean energy
program organization like the SEU must receive annual infusions of cash, in perpetuity, to cover both
operating expenses and program expenses. A Green Bank does not require this form of funding because
it offers financing, which can generate returns that cover operating expenses.
A Green Bank can reach a point of fiscal self-sustainability over time. At creation, the Green Bank does
not yet have loan volume to create return and cover operating expenses. Therefore at the start, a Green
Bank needs a dedicated pool of funds to hire staff and cover other upfront costs. For example, when the
NYGB was created, the NY PSC specifically ordered that $13.3 million of the $165.6 million of initial
public capitalization could be used for start-up operating expenses.49 Over time, as loan volume
increases, the NYGB can generate more returns, reducing the need for this kind of set aside of public
funds. But it demonstrates how a Green Bank, at its founding, needs to identify either an upfront source
of funds or an on-going stream of funds that can support start-up costs in the Green Bank’s infancy.
Any returns will be off-set by losses experienced on Green Bank loans and financing. Losses are to be
expected, like in any financing activity, which means rates and terms offered must account for those
expected losses. Across nearly 1,500 loans, the Connecticut Green Bank has experienced zero defaults,

56
and six late payments.50 This low rate of loss means a Green Bank can recover operating expenses
through its financing activity, while still offering rates that enable market growth.
Market development programs like Solarize do not directly generate returns, though they may improve
market conditions and increase loan volume. If the Green Bank takes on multiple market development
programs that do not directly generate a return, the bank will have higher operating expenses and will
draw down its capital. Returns from other financing programs may be able to cover the costs of the
lending programs and some of the costs of other market development programs. However, if a
significant number of market development activities are pursued, Green Bank managers will need to
cover the costs with the public capitalization funds. This is why having an on-going annual revenue
stream is extremely beneficial for market development purposes.
No matter the funding source, the Green Bank should aim to be a break-even operation in the long-run.
It should cover its operating expenses through repayment of loans with interest rates. As a start-up
operation, significant upfront investment is typically needed to hire staff, and program development
and roll-out will not occur on day 1 of operation. Therefore, it may take some period of time for the
Green Bank to reach sustainability. This will ultimately depend on the volume and velocity of lending,
how long it takes the banks loans to be fully repaid, and the Bank’s ability to sell loans off of its balance
sheet to get new capital for lending.
Staffing
Recommendations:
Hire people into vital roles first: CEO, CIO, legal
Outsource vital administrative responsibilities: accounting, communications, human resources
Stagger additional hiring according to growth of Green Bank
A Green Bank is ultimately defined by its executives and staff. The people that make up the Green Bank
define its culture, interpretation of Green Bank purpose, and form(s) of market engagement. Therefore,
staffing models and hiring criteria must be considered from the outset. Filling the Green Bank CEO
position with an experienced commercial banker with deep finance experience versus a clean energy
market expert familiar with the barriers to growth can produce vastly different institutions.
The NYGB Business Development Report, which was the basis of the NYGB creation, pointed to four
general capability sets needed by a Green Bank: energy capabilities, finance capabilities, business
development capabilities, and operational capabilities.51 Some of these capabilities can be developed
over time, and some can be borrowed or out-sourced.
The legal structure of a Green Bank and its relationship to the District government impacts staffing
decisions. Below is a table that outlines several potential structures of a Green Bank, and how hiring
decisions can be made in each case.

57
Table 7: Green Bank Staffing Plan By Entity Structure
For an entirely new Green Bank, the positions and functions necessary for the first year of Green Bank
operation are chief executive officer (or president), chief investment officer (CIO), legal, accounting,
communications, and human resources. This requires a staff of at least six. The roles of communications,
accounting, and human resources could be outsourced or shared with other organizations, at least for
start-up phase of the Green Bank. The Green Bank can look to other related government entities to
manage certain back-office functions. For instance, DOEE could manage some of those functions on
behalf of the Green Bank, at least in its start-up phase.
The CEO provides the leadership and vision for the organization, manages the operation of the
organization, and makes strategic decisions about where to allocate capital across the Green Bank’s
activities. The CIO provides the financial expertise necessary to build the financial products, allocate
capital across products, interface with private capital providers, and build partnerships with external
organizations. Legal counsel ensures compliance with bylaws, adherence to District and federal law,
authors and checks term sheets and contracts, and structures specific terms of Green Bank partnerships.
Other supporting functions are necessary but may be less integral to day-to-day strategic decision-
making. It may be more cost-effective for the Green Bank to utilize services from other parts of
government, rather than establish new back-office functionality within the Green Bank. For instance, the
Green Bank could take advantage of the existing accounting, human resources or information
technology staff within DOEE or other arms of the District government. It will also be necessary for the
Green Bank to have communications staff, which could be within the Green Bank or outsourced at the
outset, depending on the needs of the organization. A communications employee manages activities
related to market development and consumer awareness. This includes partnership development,
customer education, website creation, public document creation, branding, logos, and general
marketing. As the Green Bank grows, some or all of these functions may be brought into the Green
Bank, as organizational economies of scale can be realized.
Depending on the initial capitalization, the Green Bank may add additional supporting roles from the
outset. This includes other finance and business development staff to support product design and
demand generation. Ultimately the exact staffing model and level is highly dependent on the amount of
capital available to the Green Bank, and the degree to which the Green Bank is fiscally self-sufficient.
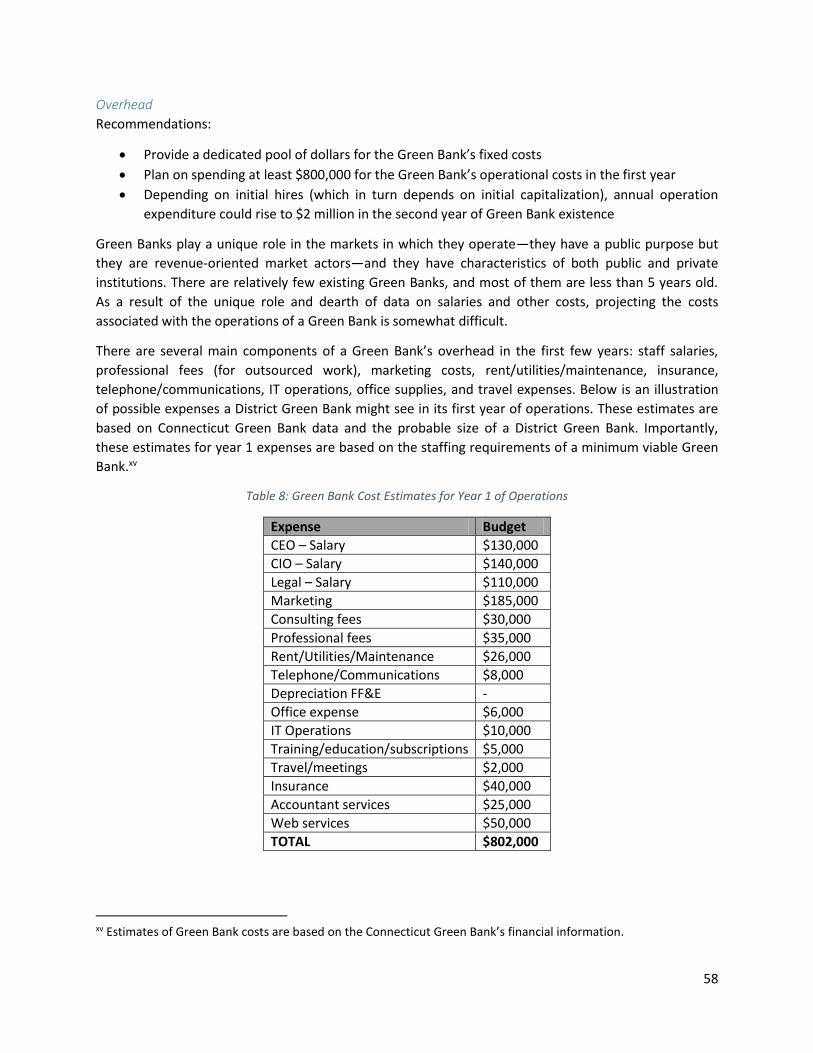
58
Overhead
Recommendations:
Provide a dedicated pool of dollars for the Green Bank’s fixed costs
Plan on spending at least $800,000 for the Green Bank’s operational costs in the first year
Depending on initial hires (which in turn depends on initial capitalization), annual operation
expenditure could rise to $2 million in the second year of Green Bank existence
Green Banks play a unique role in the markets in which they operate—they have a public purpose but
they are revenue-oriented market actors—and they have characteristics of both public and private
institutions. There are relatively few existing Green Banks, and most of them are less than 5 years old.
As a result of the unique role and dearth of data on salaries and other costs, projecting the costs
associated with the operations of a Green Bank is somewhat difficult.
There are several main components of a Green Bank’s overhead in the first few years: staff salaries,
professional fees (for outsourced work), marketing costs, rent/utilities/maintenance, insurance,
telephone/communications, IT operations, office supplies, and travel expenses. Below is an illustration
of possible expenses a District Green Bank might see in its first year of operations. These estimates are
based on Connecticut Green Bank data and the probable size of a District Green Bank. Importantly,
these estimates for year 1 expenses are based on the staffing requirements of a minimum viable Green
Bank.xv
Table 8: Green Bank Cost Estimates for Year 1 of Operations
Expense Budget
CEO – Salary $130,000
CIO – Salary $140,000
Legal – Salary $110,000
Marketing $185,000
Consulting fees $30,000
Professional fees $35,000
Rent/Utilities/Maintenance $26,000
Telephone/Communications $8,000
Depreciation FF&E -
Office expense $6,000
IT Operations $10,000
Training/education/subscriptions $5,000
Travel/meetings $2,000
Insurance $40,000
Accountant services $25,000
Web services $50,000
TOTAL $802,000
xv Estimates of Green Bank costs are based on the Connecticut Green Bank’s financial information.
59
Green Bank operational costs are fixed, for the most part. In other words, a District Green Bank will
require approximately $800,000 to run the bank in the first year, regardless of how much financing
activity the Green Bank produces. If the Green Bank receives an initial capitalization of $40 million with
annual payments of $10 million for the next six years, as is recommended, it may be prudent to hire
additional staff earlier in the start-up phase of the Green Bank. Hiring a Finance Manager, Operations
Manager, Marketing Manager, Business Development Manager, Receptionist, and an in-house
Communications Manager would speed up the Green Bank’s path to fully operational status. Doing so,
however, would likely increase the Green Bank’s annual operational expenditures to $1.5 or $2 million.
It is conceivable that non-salary operational costs will be slightly higher in year 1 than years 2 and 3, as a
result of one-time start-up costs such as office supplies and website design. Some of these costs could
be defrayed to the extent that the Green Bank is able to leverage DOEE’s existing resources and
capabilities.
Business Plan
Creating a business plan should be one of the first tasks the Board and executives should accomplish
after the creation and staffing of the Green Bank. The purpose of a business plan, or comprehensive
plan, is to guide the operations of the Green Bank and provide a framework for decision-making for the
organization’s leaders. The business plan also provides and important reference for Board members,
Green Bank partners, and outside stakeholders about the scope of activities in which the Green Bank
will engage, and its manner of engagement.
The business plan should map out many of the details of the mission and goals, product strategies,
positioning, capital and pricing strategies, risk management approach, performance metrics,
organization, resource requirements, and implementation plans. The CGB publishes a new
“Comprehensive Plan” every two years, and the NYGB updates its Business Plan on annual basis.52 The
CGB and NYGB’s business plans provide excellent models for the District’s Green Bank.
Green Bank Activities Once the Green Bank is established and operational, it has to make strategic decisions about what
markets to focus on, what financing support to offer, and how to build the markets to generate demand.
This section addresses each of those issues, and outlines strategies the District’s Green Bank could
consider to prioritize activities for early success.
Target Market Segments for the District’s Green Bank CGC recommends the Green Bank primarily focus its activities on distributed generation solar PV and
building energy and water efficiency. The District’s distributed solar and building efficiency markets
together represent more than $3 billion in investment need. Solutions should be developed for both the
residential and commercial sector. Distributed solar solutions should include both traditional rooftop
and community solar projects. In the residential space, the Green Bank should serve both homeowners
and renters. It is also crucial that the Green Bank support low-to-moderate income households, whether
they own or rent their homes.
In addition, the secondary focus of a District Green Bank should be medium-scale renewable projects
with less common technologies like anaerobic digesters, microgrid projects, and fuel cells that provide
on-site generation and feed into the grid. This category can also include community solar, a market
where financing and deployment structures have not yet become standardized.
60
Distributed energy projects tend to have the greatest difficulty finding reasonably priced private capital.
The relatively small and dispersed nature of building upgrades and small renewable energy installations
makes underwriting expensive for private lenders. Small projects that can be standardized and bundled
are appealing and financeable. But projects that vary from site to site and have varying credits, like
residential energy efficiency, tend to have the most underserved markets. Green Banks can play a key
role stimulating investments in these projects and creating more robust markets.
There are a few distributed clean energy markets in the District that have access to reasonably priced
private capital without public support. Homeowners with high credit scores and well-directed roofs can
get financing for rooftop solar through a third-party installer. And large industrial companies with high
credit-ratings from major rating agencies can finance a building upgrade through an energy service
company (ESCO).
But accomplishing these projects alone will not allow the District to meet its ambitious energy goals.
Only a small minority of energy customers and buildings in the District meet the criteria to access the
private capital that is currently available. Nearly all distributed energy markets across technologies and
sectors still struggle to connect supply of capital and demand for that capital. A Green Bank can expand
the number of building owners that can finance clean energy projects.
Figure18: Other Green Infrastructure Markets
In addition to clean energy, a District Green Bank could also invest in non-energy related green infrastructure, like
stormwater projects. This is up to the discretion of policymakers, who can ultimately choose to have a Green
Bank finance whatever kinds of projects are necessary in the District. Certain kinds of green infrastructure are
underinvested in, just like clean energy. However, there are important structural differences between clean
energy investing and other kinds of green infrastructure investing. These differences don’t preclude non-energy
investments, but can inform how an organization would need to be structured and marketed to the public.
Part of the value proposition of Green Bank investments in clean energy is that the technologies are low-risk and
are naturally cash flow positive. If financing is structured correctly, an efficiency or renewable project will save
more money than is owed on the loan. This cash flow positive nature is not only appealing to the borrower, it also
greatly decreases the risk of the loan, because no external funding sources or collection mechanism are needed
to give borrowers a clear and easy path toward repayment. (A mortgage, for example, does not share this quality.
A mortgage lender must rely on a source of funds external to the loan, like income from employment, to ensure
the borrower has enough money to pay back the loan.) The fact that clean energy loans pay for themselves
makes Green Banks fairly low-risk investment structures for government.
This condition is not always true with other forms of green infrastructure investment. Some loans to install
technology to reduce water consumption may have this same benefit, where the loan allows the borrower to
accrue savings on water bills that exceed the loan payment. But many other forms of green infrastructure
projects may not have this quality. This means that loan repayment requires the reliance on another funding
source to be able to pay back the loan. And repayment also often involves an external enforcement mechanism
created through law or regulation that forces repayment collection. Or repayment of a loan may rely on usage,
like a road toll, for instance.
There is a natural marriage between clean energy investment and other green investment. The District should
think about sustainable investment in a holistic fashion. But if it is to combine energy and non-energy related
investment in a single institution, it will have to carefully consider how that will impact the organization structure,
the capitalization structure and the financing activities of the Green Bank.
61
Financing Strategies for District’s Green Bank CGC recommends that the District Green Bank employ the following operating and financing strategies
in order to effectively serve the target markets:
Create standard-offer products for contractors to minimize origination and underwriting costs
Create a diverse portfolio of products to serve different segments and sectors of the market
Use small-scale pilot projects to try out innovative financing structures
Build product portfolio slowly, focus on a few at the beginning, collect data, learn from activity
Build products that serve underserved segments of the market, including segments that have
limited access to capital
Products Designed for Early Success
Limited resources and a need for high-profile “wins” early in the life of the Green Bank constrain the
number of products that can be offered at the outset. Yet resource limitations and the need for product
diversity must be balanced. Starting with two or three products targeting different segments and
sectors, with at least one of the products targeting “low-hanging fruit” is necessary for the Green Bank
to build up a balance sheet and earn cache among other market actors. Collecting data on every project
and every product from the outset will provide a good basis for the Green Bank to learn from its own
activities and develop new products accordingly.
Standard-offer products
In distributed energy markets, the primary sales force for clean energy technology and the associated
financing are contractors. For contractors to use and offer financing, it must be simple to understand,
and it cannot complicate their sales process. Standard-offer products allow contractors to originate
multiple deals that meet pre-set criteria, allowing the Green Bank to use contractors to build its deal
pipeline and avoid using its own limited resources. Standard-offer products have fewer transaction and
administration costs. Standard-offer products also allow private capital providers to understand and
agree to uniform underwriting criteria that meet their own internal standards. Capital providers are
more likely to provide capital at scale to fund portfolios of projects when they are secure in the
knowledge that a portfolio of projects funded by the Green Bank will all meet a given set of uniform
underwriting criteria. This kind of consistency is what enabled the CT Green Bank to sell its portfolio of
commercial PACE loans, which were all underwritten using the same criteria.
Portfolio Diversity
Diversity in the product offering is important. Any given product has many factors that could contribute
to high or low uptake. If unforeseen factors or circumstances result in low uptake in one product, it is
good to have other products with high uptake. This would ensure a steady flow of revenue from loan
payments, good press, and continued authority in the market.
Product Pilots
Pilots are a good way to increase diversity and test out successful financing strategies. Pilot projects are
a good means of avoiding committing resources to products that do not perform well in the market.
Pilots allow the Green Bank to try out a new or unique financing product in the District context. A pilot
can give the Green Bank useful information about what works in the market without overcommitting
resources or taking on too much risk.
62
The Connecticut Green Bank, for example, has deployed a pilot product for financing solar and efficiency
upgrades in low and moderate income households using alternative underwriting criteria instead of a
FICO score.xvi To qualify for the product, a customer’s credit quality is measured by utility-bill repayment
history, as that is a better corollary to whether or not an energy loan will be repaid. The success of this
pilot will give the CGB important market data on demand, the efficacy of alternative underwriting
criteria, default rates, and the size of the underserved segment.
Another CGB pilot was created to provide forgivable pre-development loans for energy upgrades in
multifamily properties to help get projects off the ground. Financing clean energy projects in multifamily
buildings is notoriously complicated, and with this pilot, the CGB will be able to test out an innovative
solution to solving the puzzle of multifamily. The data and lessons provided by these pilots will help the
CGB decide which products should be further developed, and what level of resources they need to
maximize their efficacy.
Initial Product Offerings
It is important for the Green Bank to have some early successes. Therefore, it will be prudent for the
Green Bank to initially roll out a product where demand and uptake is more easily assured. Certain
markets can be much harder to penetrate, like low-to-moderate income households. Products serving
these markets have a better chance of success if they are offered after the Green Bank has moved
beyond its startup phase and into its long-term operational phase.
Experience and data, a stronger balance sheet, a portfolio of loans, a diverse product offering, steady
sources of capital, and a good reputation can improve the chances of success for risky or non-traditional
financing products. To illustrate this point, the CGB first offered a residential solar lease product (at a
time when none was available in CT) and a whole-home upgrade loan product. It did not offer its first
financing product for the low to moderate income community until its fourth year of operation.
Connecticut’s low-income product uses innovative alternative underwriting criteria which consider
homeowner utility bill payment history, not FICO score. It may have been more difficult for Connecticut
to offer such a non-traditional product if it didn’t already have such a strong track record, dependable
sources of capital, strong relationships with various partners, and a reputation for excellence.
Financing Products for District Green Bank Based on the financing strategies referenced above, we recommend that the District’s Green Bank
consider establishing the following products:
Enhance commercial PACE with public capital for financing and more administrative support
Develop a flexible whole-home residential EE and solar upgrade product
Implement on-bill financing to address low-to-moderate income and split-incentive for renters
Develop a whole-home upgrade solution for low-to-moderate income homeowners
Support community solar development with financing and rooftop aggregation
Purchase residential solar RECs upfront and sell to utilities
Launch residential PACE
xvi This product is offered in partnership with PosiGen.

63
Commercial PACE Financing
Green Bank & DC PACE
As stated previously, it is critical that DOEE maintain a streamlined operating model and consistency
across its clean energy programs. Presently, DC PACE, the only clean energy financing product currently
offered by the District, is administered by a private third party, Urban Ingenuity (UI), under contract with
DOEE. If a Green Bank is created, no matter the structure, there is a potential for market confusion.
Therefore, the creation of a Green Bank will require careful consideration of how the Green Bank and
DC PACE will relate to one another, both structurally and financially. This section outlines several
options and recommendations for that relationship.
Structural Options
Branded-Only
If DOEE does not want to adjust the current administrative structure of PACE in order to create more
internal coordination between DC PACE and a new Green Bank, DOEE could continue to directly
administer a contract with an external party. However, it will still be critical that from the market’s
perspective the PACE program is viewed as a part of the Green Bank, not an alternative to it. As
described earlier in the report, PACE is a type of financing mechanism, and is one of many kinds of
financing products that can be offered by a Green Bank institution. As such, it will be confusing to the
market if there is a new institution purpose built to offer clean energy financing products, while a single,
one-off product remains entirely separate and apart from that new institution. As such, even if PACE is
separately administered, DOEE should provide uniform branding, a single website, and fully integrated
marketing for the Green Bank and DC PACE. For instance, the Green Bank website should provide info
on a number of programs, including DC PACE. DC PACE branding, logos and descriptions should be
consistent with that of the Green Bank, so that market participants understand that PACE is part of the
DC Green Bank, even if it is not technically administered by the Green Bank.
Internal
The DOEE could choose to fully integrate DC PACE administration into the Green Bank organization. DC
PACE would be administered directly by Green Bank employees. This would ensure the greatest amount
of coordination and alignment between PACE and the rest of the Green Bank’s activities. The
Connecticut Green Bank (CGB) is a good model for this structure. All aspects of PACE under the CBG,
including marketing, deal origination, underwriting, lending, and lien administration, are executed by
CGB staff. Success has come partly because the CGB has reduced the complexity of PACE structures by
having full program control. CGB has been able to tweak aspects of the program as necessary, train
contractors, adjust financing terms, and deploy internal resources in response to market needs. This
structure has led to the most successful commercial PACE program structure in the nation, but it can
also be expensive.
Contracted
The District could continue to have PACE administered by a third-party contractor as it is today, but have
the contract executed between the third-party and the Green Bank, rather than DOEE. If the contract
structure remained as it is today, coordination between the Green Bank and DC PACE would require
DOEE to act as a go-between. If the contract with the PACE administrator was directly managed by the
Green Bank, DC PACE would be structured directly under the Green Bank umbrella, but still rely on the
external expertise that currently manages the program. One of the benefits of this structure is that,

64
from the market perspective, DC PACE would be a product of the Green Bank, rather than an alternative
to that Green Bank. But it would achieve this market simplicity without losing the market know-how and
talent held in the current DC PACE administrator, UI. This would most closely resemble the PACE
structure used by the RIIB, which is responsible for Rhode Island’s PACE program, but has contracted
administration to a private entity.
Financial Relationship
Presently, there is no direct financial support from the District Government to the DC PACE program. All
DC PACE projects depend on the District’s ability to issue special assessment revenue notes tied to each
project and purchased by the DC PACE lender. But this is more of a legal mechanism, not direct
financing. There is no public capital provided to support program administration, to directly lend to
projects, or to mitigate risk for lenders. With the creation of a Green Bank, the District could consider
new forms of financial support to boost market adoption and attract more private investment.
Operating Capital
The District could boost the reach and capability of the DC PACE administration by directly funding its
operations. District funds could pay for more marketing, which includes advertising across multiple
media outlets, deeper development of channel partners, relationship building with capital providers,
and other activities to create more awareness and access to information. Increased funding could also
support more staff to enable DC PACE deals to be processed more quickly, or it could support a more
robust technical assessment process to give greater assurance of savings to the capital providers and the
borrowers. Examples from other jurisdictions show that building a successful PACE program requires a
significant investment in direct, personal market development and creation of highly-capable systems
for quickly processing deals. District funding of DC PACE administration could support implementation of
these activities.
Credit Enhancement
The District could use public capital as a credit enhancement to mitigate risk and attract more private
investment into DC PACE. This could both improve the terms of financing to make more projects
economically viable, and create a new incentive for private capital providers to make loans. The credit
enhancement could be offered in the form of a loan loss reserve, or loan guarantee. In this structure,
public capital would be set aside in a fund, available to pay lenders under certain conditions in the event
of a default. The reserve would likely have limits on taking the first or second dollar of loss, the share of
each dollar of loss absorbed by the reserve, and the total amount of loss for which the fund would pay.
In exchange for the benefit of this risk mitigation, a private capital provider would agree to offer capital
at terms that are attractive to borrowers and increase the market size. Lower rates/longer terms lower
the total amount of investment required for each project, lowering the denominator in the savings to
investment ratio, and, therefore, directly increasing the number of projects that are economically viable.
A credit enhancement could also theoretically be used as a direct subsidy to lenders in the form of an
interest-rate buy-down. However, this method of credit enhancement is not self-sustaining–it is more
akin to a grant. The loan loss reserve has the benefit of preserving capital, as capital is only spent when
there is a loss, and earning interest on that capital when it is unused. Under this structure, if there are
no losses, no public capital is used, as opposed to the interest rate buy-down, in which the public capital
is spent no matter the loan performance.

65
The District could also look to a foundation or an impact investor to fund a loan loss reserve. An
increasing number of foundations and mission driven investors are looking to make program related
investments to support clean energy finance. A Green Bank could work with foundations to develop and
secure this kind of program related investment to leverage more direct private lending.
Project Loan Capital
The District could use public capital to directly offer PACE loans. Presently, the DC PACE program is
designed to allow any private lender to make a loan, but no public capital is made available for PACE
financing. By making capital available itself, the government could inject more capital into the program,
make it more accessible than current sources, and potentially lower the cost of capital.
Under the present DC PACE structure, private lenders are sought to fund deals. Projects that come into
the pipeline that don’t already have finance attached are put out to bid to a group of private lenders
who have stated their interest in PACE. UI then collects the terms offered by each lender and provides
the term sheets to the property owner or project developer. In cases with a large market of capital
providers, and with many participants, like in Lending Tree for mortgages, this creates competition and
can push down the cost of capital. However, the DC PACE program still has a fairly small set of private
lenders participating. In addition, the current structure can be administratively complex and time
consuming.
If the District made its own capital available for loans, that capital could be offered at standardized
terms, under standardized conditions, and made available on demand. Any project that met certain
technical and/or underwriting conditions would always qualify for a loan from the public fund, at the
same terms, with no uncertainty. That could greatly reduce the speed of closing deals, and make the
program far more attractive to participants. It also creates far more certainty for project developers who
would know without a doubt that they could find capital for their project.
This structure has been used successfully in Connecticut, where a lack of private origination led to the
Connecticut Green Bank’s decision to make its own capital available. What began as a $20 million
allocation for the loan fund quickly grew to $40 million, and has now led to more than a $100 million in
projects. The CGB originates loans, collects the debt on its balance sheet, and then sells the debt on the
back end to private investors. In this way, private capital is leveraged at the end of the transaction,
rather than the beginning. The standardized and streamlined process for delivering capital on demand
could speed up and grow the market in the District.
A slight alternative to this structure would be a co-lending model, where the District’s capital is blended
in with the private capital. If the District capital is offered at a lower cost than the private capital, the
blended interest rate and term that reaches the end borrower would be lowered. The advantage of this
structure is that if a Green Bank only provided capital for 50% of the project cost, for example, the public
funding would go twice as far. And it would still provide private lenders the experience and market
access needed for them to gain comfort in the market, and ideally increase participation.
Pre-Development Loan Fund
In addition to directly lending to PACE projects, a Green Bank could establish a pre-development
revolving loan fund to cover some of the upfront costs that must be taken on by project developers.
Under the current model, these costs, including investment grade audits, engineering assessments and
customer acquisition, must be borne entirely by the project developers off of their own balance sheets.

66
If the business is not well capitalized, a shortage of funds may prevent developers from pursuing viable
project opportunities. The Green Bank could establish a low-rate revolving loan fund to cover these
costs and provide the necessary runway for projects to move from initial interest to underwriting. The
fund could be designed with an interest rate high enough to ensure the level of the fund never declines,
or the Green Bank could accept that the fund balance would likely decline over time because not all
projects will be completed. In this case, the fund could eventually be phased out, or the Green Bank
could regularly replenish the fund to maintain a stable balance.
PACE Bonding
A Green Bank could run DC PACE through a leveraged bonding model to create an efficient mechanism
for attracting and deploying institutional private capital for loans. Under this structure, just like the
lending model described above, the Green Bank would receive “initial public funding” to seed a loan
fund. The Green Bank would then make those loans, collect the PACE notes, and then sell the bundle of
notes through a bonding process. The bonds would then be purchased by private institutional investors,
recapitalizing the loan fund for the Green Bank to continue to support PACE projects. For example, in
simplified terms, an initial $20 million of public capitalization of the loan fund could turn into $100
million of PACE lending after 5 cycles of loans and securitization.
The District appears to have envisioned this kind of structure. The National Capital Energy Fund, created
through the Energy Efficiency Financing Act of 2010, was built to receive “the proceeds from the sale of
a bond,” and the funds may be used “to make energy efficiency loans to property owners for the initial
costs of the installation of energy efficiency improvements,” which “shall be repaid by the revenues
generated by the Special Assessment.”53 The Mayor may, “accept grant funds from a public or private
source,” “deposit the grant funds into…the National Capital Energy Fund,” and “use grant funds for a
purpose for which monies in the National Capital Energy Fund may be spent.”54 Under this language, the
District (or any other source) could provide the initial capitalization for a PACE loan fund as a “grant”
into the National Capital Energy Fund. Those dollars would then be used to make energy upgrades,
repaid through PACE. Those PACE obligations could then be sold through a bond issuance to recapitalize
the National Capital Energy Fund.
The OCFO infrastructure bank white paper also imagines such a structure. The concept described above
is identified as a “leveraged infrastructure bank” structure, where “initial capital provided by the
government,” is “leveraged through a public bond offering.” In this case, as described in the white
paper, the debt would be “supported by a diversified stream of loan repayments due to the bank.”55
Figure 140: Leveraged Infrastructure Bank Model From DC OCFO White Paper
67
It is important to note that this leveraged infrastructure bank model, outlined in the OCFO’s white
paper, is an excellent characterization of a Green Bank as a whole. It captures the difference and
importance of both the public capitalization, used to make loans, and the bonding authority, which
allows the Green Bank to be recapitalized with private funds. Also, in this context, the word “leverage” is
used to describe the construct of using initial public capital to raise private funds through a bond
issuance. This is different, though related, to the notion of leverage used in other parts of this report,
where public capital was being used to finance a specific project in a way that “leveraged” private
investment into that project. A Green Bank would be wise to use both forms.
Residential Whole-Home Upgrade Financing Product
The District Green Bank should offer a whole-home upgrade residential financing product. By bundling
multiple efficiency technologies and distributed solar into one financing product, technology adoption is
greatly simplified for consumers, and the District can achieve deeper savings per project. A simple, yet
flexible product for financing whole-home measures would allow homeowners to implement deeper
efficiency measures than possible without financing. And contractors would have a useful sales tool that
would allow them to increase project sizes, without translating to a bigger upfront cost for a customer.
An efficient way to support whole-home upgrades is by using public dollars to leverage private lending,
specifically by using a loan loss reserve. This could be modeled on the Connecticut Green Bank’s Smart-E
Loan program. In this model, the CGB offers a standard loan loss reserve to any and all commercial
banks that want to get the benefit of this risk mitigation. In exchange, the lenders market and make
capital available for deep, multi-measure projects. And they agree to do so at terms that are more
favorable than would otherwise be available. This ensures that the benefit of the credit enhancement is
shared between the lender and the borrower. Implementing this program would require several steps:
Identify commercial lenders;
Provide standard minimum guidelines for them to underwrite projects;
Select a set of measures eligible for financing;
Establish a loan-loss reserve with Green Bank capital to de-risk the lending from the commercial
lenders;
Train contractors to understand how the product works and how to use it as a sales tool; and
Produce standardized technical assessment materials in advance to allow lenders to quickly
determine if projects are viable.

68
Figure 151: Whole-Home Upgrade Reserve Based on CT Smart-E Loan
To have access to the project pipeline and the Green Bank credit enhancement, the commercial lenders
would have to use the Green Bank’s minimum underwriting requirements, as well as offer a range of
terms and rates determined by the Green Bank. For example, the Green Bank could designate a
minimum FICO score necessary for a homeowner to be eligible and require that the lenders offer terms
of 5, 7, 9, and 11 years (and vary their interest rates accordingly). The lenders would underwrite the
loans, and they would be protected from default risk by the Green Bank’s loan loss reserve. The Green
Bank would stipulate that contractors should take advantage of all available efficiency and solar
incentives (such as those provided by the SEU and those being contemplated in other parts of this
report), and would only finance the after-incentive project cost. The Green Bank would train contractors
to use this product.
This product is attractive from several perspectives. Evidence from Connecticut and other states suggest
that leverage ratios of 5-10:1 are possible with this structure. And because public capital is not lent, and
only drawn from in the event of default, this product structure preserves the capital. The product gives
contractors an important sales tool, allows homeowners to save money with energy efficiency and solar
without paying upfront costs, and allows local lenders to gain experience lending in the clean energy
space. The product’s flexibility allows contractors to adapt it to different projects, and allows
homeowners to choose terms to suit their preferred repayment schedule. And the product’s structure
allows the Green Bank to use limited public dollars to leverage private capital.
On-Bill Financing
The Green Bank could help implement, administer and/or finance an on-bill repayment/financing
program in the District. The idea of on-bill financing in the District was first raised by the PSC in 2009, as
discussed earlier in this report. The utilities expressed hesitation around entering into financing, and
concern that their bill collection systems would have to undergo potentially costly upgrades to collect
loan repayments in this way. But on-bill financing and/or repayment has been established in many other

69
locales as an effective tool to not only increase lending security for building upgrades, but also as a way
to expand market access to renters, low-income households and others who otherwise cannot secure
financing to lower their energy bills.
The Green Bank could play multiple roles in the creation of an on-bill program. Creating an on-bill
program often requires heavy coordination efforts among regulators, utilities, potential third-party
lenders and policymakers. The Green Bank could play this central role, helping to design the program
with an eye toward marketability. Design parameters should include borrower eligibility, underwriting
guidelines, technology eligibility and repayment terms.
If the program is designed for the loan funds to come directly from the utility, the Green Bank could still
provide market development and contractor training services to ensure adoption. If the program is
designed to be open platform, with loans coming from multiple private investors, then the Green Bank
could facilitate engagement with those lenders to bring them into the program. The Green Bank could
also provide a credit enhancement, if necessary, to support private lending. Finally, the Green Bank
could also directly provide loan capital into the program if private capital is unavailable, or if the utility
objects to using their capital in this way.
The on-bill loan should be treated as a direct tariff on the meter, which would allow the loan to stay with
the meter and transfer between tenants/owners when people move. This overcomes the problem that
typically prevents renters from adopting efficiency and gaining access to financing. A special category of
the on-bill program could be specifically designed for lending to low-income households, with
underwriting criteria based on utility bill repayment history rather than FICO score.
The on-bill solution, though often resisted by utilities, is an ideal tool for expanding market access to
those typically excluded from the clean energy market. Utilities should be justly compensated for the
additional cost incurred for implementing this program.
It would be wise for the District to consider creating specific consumer protection rules if it does help
implement on-bill financing. This can be done to ensure that consumers are only taking on projects that
save them money, and also do not greatly increase debt burdens. For instance, the Green Bank could
implement a bill neutrality rule, which would require all projects financed to reduce electricity bills or
keep them the same. Bills could never increase. This is equivalent to the CT Green Bank’s requirement
that savings-to-investment ratios on commercial PACE projects exceed 1.
The Green Bank could also provide assurances or mitigate the risk of power shut-off, in the case of tariff-
based financing. In some jurisdictions, if a customer does not pay the on-bill financing portion of the
utility bill, the power to the customer could be shut off. The Green Bank should consider rules or
mechanisms to ensure this either cannot happen, or can only happen in extreme circumstances.
Low-to-Moderate Income Home Upgrade
Low-to-moderate income homeowners are often being left behind in the clean energy transition. Private
financing providers and contractors do not target this market segment because they can be harder to
reach and may not qualify for financing. Though this free market behavior by private actors is
understandable, it leaves it up to government and Green Banks to ensure that all citizens can access
cheap and clean energy. This need is particularly acute in the District.
70
Serving low-to-moderate income (LMI) homeowners typically requires focused programs and products.
Expanding program eligibility or lowering financial underwriting requirements is often insufficient, as
program participants and contractors will still target and market to high income households. Tailor-
made solutions are needed. This includes financing and market development mechanisms specifically
suited to the needs of this targeted market segment. For instance, rather than underwrite based on
FICO score, loan qualification should be based on utility bill repayment history (as is done through the
Connecticut Green Bank’s low-income product). Because LMI households typically have a higher energy
burden than high income homes, programs should target maximized energy savings. To achieve this,
programs could include a minimum bundle of efficiency measures to produce deeper savings. And
homes adopting solar should first have an efficiency retrofit to ensure the minimum size solar system is
installed. The need for maximized energy cost savings means that LMI households may be suitable for
lower interest rates.
In addition to these product attributes, the Green Bank should design a contractor engagement program
to increase buy-in and commitment from market participants to serve LMI households. For instance,
contractors might be given financial incentive to serve this community. And the Green Bank could work
with contractors to ensure that program application and participation is entirely seamless. LMI
households typically have less disposal time available to address energy needs. Therefore, the Green
Bank and its partners have to take the burden of program complexity and administration off of the
customers’ shoulders. By combining these product and program attributes, the District can create a
solution that is comprehensive, turn-key and economically attractive for LMI households. It would be
wise, too, for a LMI product to be paired with on-bill financing, to ensure rental LMI households can also
be served.
Community Solar Financing Product
The Green Bank should focus on expanding access to clean energy, and community solar is perfectly
suited for that objective. Community solar allows for direct ownership or purchase of solar power for
those that either do not own their own homes or whose roofs are not suitable for solar. A community
solar project can either be a larger, ground-mounted project or, as allowed in the District, one roof or a
collection of rooftops that are aggregated to form a single project. As long as the sites are within the
District, any customer can subscribe, purchase, or lease solar power through a community solar project.
The Green Bank could play several roles to support the development of community solar projects in the
District. Group or virtual net-metered projects are typically difficult to develop and finance. The Green
Bank could play a central coordinating role to both ensure projects can be built and financed, as well as
help potential customers understand and enjoy the benefits of participation.
To ensure projects can be built and are economically viable for subscribers, the Green Bank can offer
various forms of project financing. For instance, if there is a gap in financing for a project, the Green
Bank could fill that gap with subordinated or senior debt. Or the Green Bank could offer a loan loss
reserve to draw in cheaper financing. Community solar projects are only viable if they end up saving
money for the subscribers on their energy bills. If the cost of financing is too high, then the benefits may
be eroded.
The Green Bank may also play a more direct role in financing projects if the value of the credit that
subscribers receive for the virtual net-metering of their share of the project is particularly low. The lower
the value of the credit, the lower the cost of capital on the project must be to produce economically
71
viable solar. A Green Bank could take a flexible approach and rather than have a defined product, it
could be guided by a targeted effective price of solar delivered to customers. The Green Bank could then
adjust its financing offering in order to hit that target price of solar.
The Green Bank could also provide targeted financial support to low-FICO customers that meet certain
alternative criteria (such as utility bill payment history) to buy shares in a community solar project. The
Green Bank could provide a backstop for these customers by keeping various municipal buildings on the
sideline of the project as “reserve buyers” for the shares in the community solar project. If a low-FICO
customer defaulted on their payments, the Green Bank could transfer their solar share to a reserve
buyer.
The Green Bank could also act as an aggregator of rooftops, which can collectively be grouped to form a
“virtual” community solar project. The Green Bank could lease the roof space on buildings with access to
good solar resources and make it available for individuals that do not own a roof suitable for solar
panels to take advantage of the solar benefits. Alternatively, the Green Bank may find that building
owners would be willing to donate their roof space, at no cost, and claim a tax deduction. This would
further reduce the cost of the project and lower the energy price to the end customer. This is also a
function that is inherently labor intensive and is unlikely to be undertaken by a for-profit developer.
That would leave many suitable roofs unused.
SREC Aggregation & Utility Sale
The District’s Renewable Portfolio Standard (RPS) has a solar carve out, where 5 percent of retail sales
must come from solar located within the District’s local electricity network by 2032. To support this
ambitious goal, the RPS statute allows for solar specific renewable energy credits, or SRECs, to be
created as a compliance tool. By rule, electricity suppliers in the District must comply with the RPS and
must either acquire the necessary amount of SRECs each year or pay the Solar Alternative Compliance
Payment (ACP). At the time of the writing of this report, the ACP is set at $500 per REC, or $500/MWh,
and the current spot market price for an SREC is just below $500.56 This suggests that, despite a very
high SREC value (nearly double any other market), there remains a tremendous shortage of solar
generation (i.e. an undersupply of SRECs).
The unbelievably positive economics of solar at an SREC price of $500/MWhxvii indicates a tremendous
market inefficiency, where potential solar owners either do not believe that the SREC prices will be
stable, or that they have no way of actually realizing the value of those SRECs. This kind of SREC price
usually draws in a flood of developers who see a ripe market. But the SREC price has been above $450
for more than three years, which indicates hesitancy from new market entrants.
This inefficiency could in part be solved if the Green Bank played the role of SREC aggregator by offering
long-term purchase contracts for SRECs. Any solar owner (either the end customer or the third-party
owner) could sell their SRECs for a fixed price long-term contract, with full payment made upfront. The
xvii If a customer was actually able to secure an SREC price of $500/SREC on an annual basis, at an installation cost of $4.00/watt, the solar owner would literally be making a profit on consuming electricity. The levelized cost of electricity from this system would be approximately negative 30 cents. The SREC price would not only offset the cost of solar electricity to make it cost competitive, it would turn solar adoption into a profitable business. The fact that the market isn’t growing quickly and the SREC spot price stays high, even in this incredible market condition, indicates a lack of faith by all market participants in realizing this SREC value or overcoming other barriers to solar.
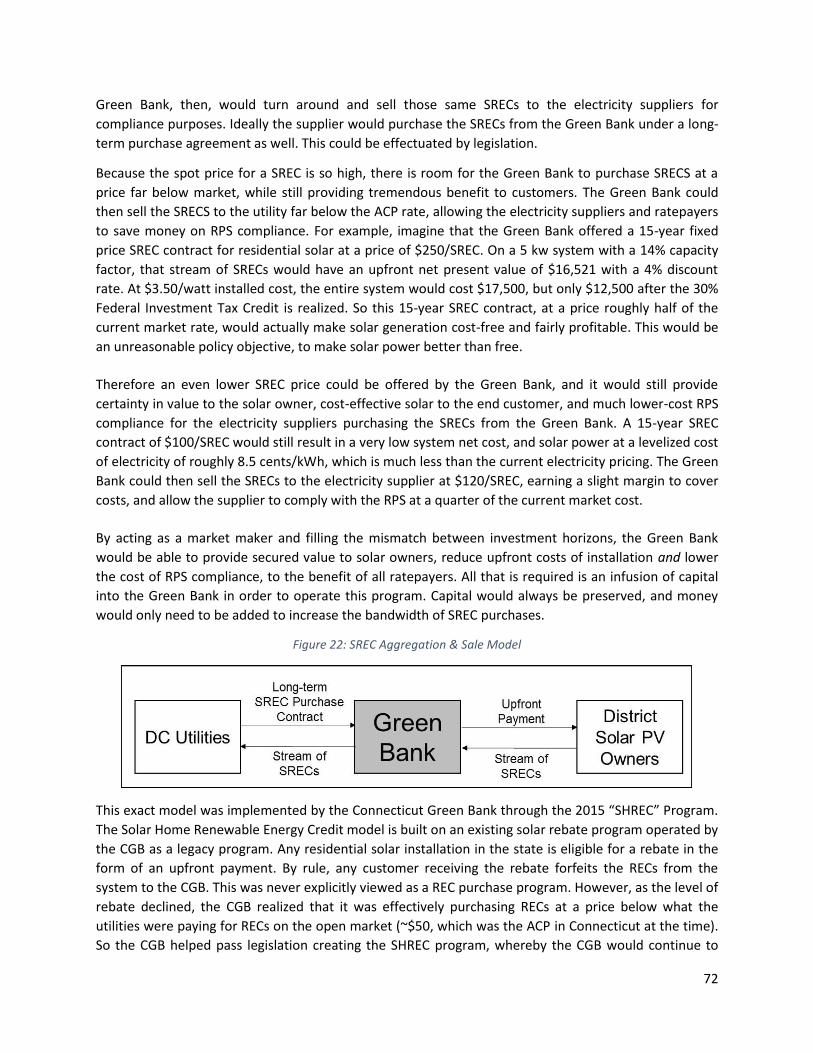
72
Green Bank, then, would turn around and sell those same SRECs to the electricity suppliers for
compliance purposes. Ideally the supplier would purchase the SRECs from the Green Bank under a long-
term purchase agreement as well. This could be effectuated by legislation.
Because the spot price for a SREC is so high, there is room for the Green Bank to purchase SRECS at a
price far below market, while still providing tremendous benefit to customers. The Green Bank could
then sell the SRECS to the utility far below the ACP rate, allowing the electricity suppliers and ratepayers
to save money on RPS compliance. For example, imagine that the Green Bank offered a 15-year fixed
price SREC contract for residential solar at a price of $250/SREC. On a 5 kw system with a 14% capacity
factor, that stream of SRECs would have an upfront net present value of $16,521 with a 4% discount
rate. At $3.50/watt installed cost, the entire system would cost $17,500, but only $12,500 after the 30%
Federal Investment Tax Credit is realized. So this 15-year SREC contract, at a price roughly half of the
current market rate, would actually make solar generation cost-free and fairly profitable. This would be
an unreasonable policy objective, to make solar power better than free.
Therefore an even lower SREC price could be offered by the Green Bank, and it would still provide
certainty in value to the solar owner, cost-effective solar to the end customer, and much lower-cost RPS
compliance for the electricity suppliers purchasing the SRECs from the Green Bank. A 15-year SREC
contract of $100/SREC would still result in a very low system net cost, and solar power at a levelized cost
of electricity of roughly 8.5 cents/kWh, which is much less than the current electricity pricing. The Green
Bank could then sell the SRECs to the electricity supplier at $120/SREC, earning a slight margin to cover
costs, and allow the supplier to comply with the RPS at a quarter of the current market cost.
By acting as a market maker and filling the mismatch between investment horizons, the Green Bank
would be able to provide secured value to solar owners, reduce upfront costs of installation and lower
the cost of RPS compliance, to the benefit of all ratepayers. All that is required is an infusion of capital
into the Green Bank in order to operate this program. Capital would always be preserved, and money
would only need to be added to increase the bandwidth of SREC purchases.
Figure 22: SREC Aggregation & Sale Model
This exact model was implemented by the Connecticut Green Bank through the 2015 “SHREC” Program.
The Solar Home Renewable Energy Credit model is built on an existing solar rebate program operated by
the CGB as a legacy program. Any residential solar installation in the state is eligible for a rebate in the
form of an upfront payment. By rule, any customer receiving the rebate forfeits the RECs from the
system to the CGB. This was never explicitly viewed as a REC purchase program. However, as the level of
rebate declined, the CGB realized that it was effectively purchasing RECs at a price below what the
utilities were paying for RECs on the open market (~$50, which was the ACP in Connecticut at the time).
So the CGB helped pass legislation creating the SHREC program, whereby the CGB would continue to

73
receive residential RECs at increasingly lower costs as the rebate declined. And the utility would enter
into 15-year REC purchase agreements with the CGB to acquire the RECs at a price below market.
Customers realize immediate and upfront value for their RECs, the utilities comply with the RPS at lower
cost saving all ratepayers money, and the CGB is made whole with no loss of capital.
Residential PACE Financing
Presently, the District does not have PACE financing for some residential buildings. In many states,
residential PACE is on hold while commercial PACE moves forward, because of opposition from federal
regulators. Specifically, the Federal Housing Finance Agency (FHFA) has stated that government-
sponsored entities, like Fannie Mae, would not purchase residential mortgages from lenders if those
mortgages had a PACE lien senior to the mortgage. This prohibition effectively shut down the residential
PACE market in the country, though some states like California have moved ahead anyway.
In 2015, the Obama Administration moved to create greater clarity among federal regulators for
residential PACE programs. On July 19, 2016, the Federal Housing Administration (FHA) issued guidance
for potential ways that states could move forward with residential PACE programs.
Following this federal guidance, the District should consider establishing residential PACE in earnest to
open a new and effective financing tool for District residents. California, even under uncertain
regulatory conditions, has built a residential PACE market with loans worth hundreds of millions of
dollars. Residential PACE can provide on-demand financing for homeowners seeking to improve their
homes or deal with equipment replacement needs that are typically financed at expensive credit card
rates. Residential PACE could be administered under a number of potential structures, similar to those
outlined for the current commercial PACE structure. The most common structures in the U.S. involve
vertically integrated residential PACE providers, who operate with networks of contractors, using a
uniform platform and single financial offering. It is less common to have an open platform for loan
competition in the residential PACE space.
If the District creates a residential PACE program, it may find value or necessity in creating a credit
enhancement mechanism to support homeowners and/or mortgage lenders. Typically mortgage lender
consent is not required for a residential PACE loan because identifying the actual mortgage holder can
be difficult due to the issuance of mortgage-backed securities. Therefore, even if delinquent payments
from residential PACE liens would likely be junior to the mortgage,xviii mortgage lenders may still require
extra assurance that they will not be impaired by the PACE loan. One possible solution is a loan loss
reserve, similar to the one created by the California Alternative Energy and Advanced Transportation
Financing Authority (CAEATFA). Through this structure, in the event that a PACE home goes into
foreclosure, if the sale price is not sufficient to cover both the PACE payments and the mortgage, the
reserve will cover, “any losses to the first mortgage lender up to the amount of outstanding PACE
assessments.”57
xviii The federal guidance from July 2016 calls for the PACE lien to be junior to the primary mortgage. This is different from most commercial PACE programs, like in DC, where the lien is senior to the mortgage. For commercial PACE, DC and some other states require that the mortgage holder legally consent to having the PACE lien come in senior to their mortgage.

74
It might also be prudent for the District to protect homeowners who receive PACE loans and then fall
into financial distress due to an unforeseen downturn in home values. During the housing crisis of the
last decade, the fall in home values led to a nationwide surge in home foreclosures, causing economic
ruin for many households. It would be very bad, for many reasons, if the District government would be
viewed as having a hand in accelerating foreclosures due to an increased debt burden from PACE.
Therefore, it might be wise for the District to create the equivalent of a catastrophe insurance product.
This kind of event is certainly unlikely, but now that a significant drop in home values has actually been
observed nationally, it would be prudent for the District to anticipate and provide assurance to
homeowners that the District’s own lending programs would not contribute to any kind of housing crisis.
Market Development Activities CGC recommends that the District’s Green Bank engage in a number of market development activities in
order to generate demand for clean energy technology, ease the process of customer adoption, and
increase overall market efficiency. This activity should be carefully coordinated with the SEU, as it is also
tasked with supporting clean energy market growth. Specific recommended actions include:
Run “Solarize” campaigns to build demand with neighborhood engagement
Offer contractor training to build channel partnerships
Provide technical assessments to calculate savings for owners/lenders
Create a unified website for all programs to eliminate market confusion
Actively market the Green Bank products, brand, and role in the District
The best financing product is only successful if customers actually use it. Therefore, it is incumbent on
the Green Bank to foster the mature market needed to build demand for clean energy and its financing
products. Capital made available in a vacuum, or at unusable terms, is no more useful than capital that is
never made available in the first place.
Presently the Green Bank must bridge a large gap between clean energy capital and demand for that
capital. Only through fully integrated, turn-key solutions will financing and clean energy technologies
penetrate the market. This series of activities needed to connect capital supply to customer demand
includes: marketing; dedicated origination channels; partnerships with contractors; contractor training
on how to sell their services with financing; coordination of financing and services with other subsidies
and incentives; coordination of multiple contractors on multi-measure projects; and many others.
In addition to this list of activities, often the capital made available for financing is not well-suited for the
purposes of clean energy investing. For instance, a loan may be offered with: a short-term that prevents
deep retrofits; at an interest rate that prevents a project from being cash flow positive; with a loan size
that prevents deep retrofit projects; with the inability to cover 100% of the cost, but with no assistance
to find lenders to cover remaining costs; and with credit restrictions that shut-out portions of the
market.
This long list of market and financing deficiencies, not surprisingly, results in low demand for clean
energy technology. Consumers do not have the time, knowledge or interest to navigate a complex
purchase process, learn about different technologies and program options, and seek out possibly
inadequate financing entirely on their own. Therefore, the Green Bank can play a critical role in
stimulating demand by both offering suitable financing and delivering that financing to customers
through turn-key program design. A Green Bank cannot be built on the flawed clean energy financing

75
premise that, “if you build it, they will come.” Rather a Green Bank must design financing programs in
coordination with delivery mechanisms, access to information, and consumer marketing techniques to
overcome past demand shortage problems. Whether the Green Bank itself is directly engaging in this
market creation activity or doing so in partnership with private partners will depend on precise product
and organizational design. But no matter the design, a Green Bank should strive to ensure customers are
presented with simple offers that are cash flow positive with minimum customer effort required.
Limited resources, particularly in the startup phase of the Green Bank, may constrain the range of
market development activities possible. Many market development activities, unlike financing activities,
do not provide a direct financial return to the Green Bank – they are more akin to a marketing expense.
So Green Bank spending in these areas should be strategic and targeted to maximize the effectiveness of
the measure without depleting the bank’s resources. Focusing on activities that are vital for the success
of the products being offered would be a good way to begin.
Solarize Campaigns for Demand Aggregation
One example of a targeted marketing program is the Solarize program in Connecticut. The Connecticut
Green Bank partners with SmartPower to administer the Solarize program, which targets the residential
solar market. Solarize is based on neighborhood and city level peer-to-peer marketing. With support
from the CGB, neighbors put on events (open houses, barbeques) at the homes of community members
that typically already have solar installed. Then, solar installers on CGB’s list of approved contractors can
submit bids (in the form dollars per installed watt of solar) to the community, and the community then
selects a contractor. The Solarize model is successful because people are able to learn about solar in a
face-to-face setting (how it works, the effect on utility bills) from their friends and neighbors, rather
than a third-party salesman, and they have the assurance that any contractor working with the program
has been vetted by the state Green Bank.
Solarize also encourages contractors to offer a Groupon-type model of progressively lower pricing tiers
in their pricing bids. Essentially, contractors agree to set price tiers based on progressive number of
installs per neighborhood or town. Local community members therefore have an incentive to encourage
more of their friends and neighbors to sign up together to get to a lower tier of pricing. For example, if
50 people sign up for solar, the price is set at $3.50 per watt installed, and it 75 people sign up, the price
drops to $3.00 per watt. Contractors and installers benefit from the Solarize program because they can
target neighborhood and cities for installation, lowering the costs associated with sending in work
crews. Solarize connects contractors directly to customers that learn about energy upgrades from their
neighbors, and are taking advantage of turn-key financing products from the CGB. A harmonized
marketing program backed by the District’s Green Bank can help lower marketing costs of installers,
allowing further savings to be passed on to consumers through the tiered pricing model.
Contractor Training
Contractors are effectively the sales force for any Green Bank financing product. Therefore, it is critical
for the District’s Green Bank to have close and positive working relationships with contractors, installers,
and project developers that are bringing a pipeline of deals to the Green Bank. The Green Bank should
not only foster a close relationship, but provide extensive training so that they understand the full
capability, applicability, and benefits of the financing programs. This should not be a one-time upfront
training, but an on-going set of meetings and exercises to constantly update partners on financing
products. This ensures contractors have the latest know-how, are updated with new market

76
information, and are given new marketing collateral. The Green Bank should also work with contractors
to develop tools and information technology systems that might allow for a seamless and fast customer
approval process for financing.
Unified Website
The Green Bank should make all of its information available through a clear and usable website. The
website should be designed to be market facing. It should not replicate other typical government
websites. Rather it should be user-friendly, dynamic and clear, where the user can explore different
solutions and offerings based on their position in the market. For instance, a residential customer should
be quickly channeled to only look at residential products. This website should also contain models and
tools that give customers and contractors the ability to determine the energy and economic value of a
potential product. This kind of interactive platform can enable market participants to engage with clean
energy options, understand financing, and identify projects for the Green Bank that are certain to be
accepted. For instance, the Green Bank could put on its website a model for building a community solar
project. The model would ask for several inputs and would tell the user that if the model produces a
positive result then that project is assured financing. A platform like this would empower market
participants and greatly reduce the overhead costs of the Green Bank to vet projects.
The Green Bank’s website should also be part of a unified, single-point-of-access site that is used for all
DOEE programs. This integrated approach is discussed in greater detail in the Conclusion.
Technical Assessments
The Green Bank should provide technical assessments of energy projects to demonstrate to customers
and lenders that projects are cash flow positive and save more than they cost. For larger projects, like
large commercial building upgrades, this assessment should be tailored based on the specific energy
conservation measures used in the specific project. Each project should receive an extensive energy and
financial analysis that shows the expected cash flows, savings, and returns under various positive and
negative scenarios. For smaller projects like residential efficiency, the Green Bank should produce a
model for standardized assumptions that is more flexible and easier to calculate to reduce overhead. No
matter the size of the customer, though, s/he should be presented with third-party evidence that the
project will actually result in savings for the end-user.
Active Marketing
The Green Bank must actively market and advertise its products and services. Like any other new
business looking to generate demand, the Green Bank must dedicate a portion of its budget to
marketing. In this regard, the Green Bank must operate more like a private operation than a traditional
government entity. The Green Bank should advertise on radio, in local newspapers, in District mass
transit locations. It should also co-market with other non-profits and government agencies that already
have direct relationships with key segments of the market. The Green Bank should develop a strong and
identifiable logo that is consistent across media. Green Bank financing is not merely meant to be
available should customers want it. It is the mission of the Green Bank to reach out and bring in new
demand. Marketing is an essential component of this mission.
Coordination with SEU The Green Bank will have to work in close coordination with the SEU, as they are both designed to
support clean energy market growth. The SEU is fundamentally oriented to providing grants and

77
rebates, while a Green Bank is a financing entity. Therefore, the SEU and Green Bank are principally
complementary entities that provide different, though related services to support market growth. CGC
recommends that the DOEE serve as the coordinating entity that links the operation of the SEU and the
Green Bank.
Specifically in the areas of market development, demand generation and information transparency, the
SEU and Green Bank will need to be highly coordinated to ensure they are aligned and not duplicative.
Today, the SEU engages in certain activities that would also be beneficial for the Green Bank. For
instance, the SEU website provides a detailed and well-designed guide on LED light bulbs. This kind of
information is important to provide to the market and does not need to be provided in two different
places. A Green Bank website with similar, but different, information would be useful, but there are
efficiencies to be gained by coordinating and sharing certain functions. This information-based website
is just one example.
In addition to information, the SEU and Green Bank must coordinate engagement with other market
participants, especially contractors. The two entities should work together to streamline contractor
training, ensuring they have the best information on both rebates and financing to serve customers. And
products themselves should be designed to work together. There should be no requirements or
restrictions that might prevent a customer from accessing both rebates and financing for a project.
DOEE is best-positioned to facilitate this kind of coordination. DOEE should designate an employee, or
potentially assemble a very small committee, tasked with managing clean energy market development.
The role would be to coordinate and align the activities of the SEU and the Green Bank (which
presumably would include DC PACE). This kind of coordination is difficult to execute unless it is explicitly
made a person’s responsibility to do so. And that person must be empowered to scrutinize, re-design
and share activities across the two entities.
In Connecticut, this coordination is achieved through the Joint Committee of the Energy Efficiency Board
and the Connecticut Green Bank. The Energy Efficiency Board is the advisory group established to guide
the design and implementation of ratepayer-funded energy efficiency rebate programs administered by
the utilities. As stated in the Connecticut Green Bank’s Comprehensive Plan, “The Green
Bank…interplays with the…Energy Efficiency Board through coordination of our staff as well as a Joint
Committee to continue to work to harmonize programs and initiatives to support the implementation of
public policy goals.”58 The Joint Committee to coordinate rebates and financing was actually written
directly into the Connecticut statute through legislation.59
The NYGB also recognized the importance of coordination in its business plan submitted to the public
utility regulator. It wrote:
NYGB will also strive to coordinate and work opportunistically with key entities relevant
to pursuing [state] objectives and policy goals including NYSERDA, the New York Power
Authority (“NYPA”), the New York State Economic Development Corporation
(“NYSEDC”), other State and local agencies as well as utilities and other similar market
actors to maximize clean energy outcomes in New York. Through agency coordination
and inherent synergies with these key players, NYGB’s ability to play a role in crafting
far-reaching and multiparty solutions to address clean energy market barriers and gaps
may be heightened in certain circumstances. The ideal outcome is for dollars put to
78
work by the State through its various energy and financing initiatives to be coordinated
in pursuit of the optimal result: breaking down all barriers as necessary to achieve a
synergistic outcome with more expansive impact.60
The District Green Bank can play a similar role, maximizing the impact of public funds. But this can only
be achieved through a well-designed and executed plan for coordination with the SEU and any other
relevant District entities.
Conclusion The District has a clear and pressing need to stimulate more private investment in its clean energy
economy in order to reach its climate and energy goals. The vast building stock, commercial and
residential, must become far more efficient. And hundreds of megawatts of distributed solar must be
installed in short order to meet the District’s RPS solar carve out. The current set of programs and
policies are insufficient to meet these goals, which will require more than $3 billion of investment.
Though private capital is not flowing rapidly enough, the public sector cannot bear the burden alone.
Therefore, the District should establish a Green Bank, capitalized with public dollars, to leverage private
investment, drive demand and increase access to clean energy. In combination with existing programs,
the Green Bank can help District residents and businesses enjoy cleaner and cheaper energy.
Green Bank Recommendations This report finds that the optimal structure for a District Green Bank is an independent, quasi-public,
non-profit instrumentality that is wholly-owned by the District government. It should be governed by a
Board of Directors that includes ex-officio Directors, like the Director of DOEE, as well as Mayoral and
City Council appointees. The DCHFA provides a similar model of a quasi-public entity designed to
support market development with public-private finance.
The report finds that a public capitalization of $100 million can drive more than half a billion dollars of
total investment in clean energy. The $100 million should be invested in the bank by the District over
time to lessen the immediate upfront cash requirement. A potential funding schedule could $40 million
of upfront capital in year one followed by a stream of $10 million annual infusions during the following 6
years. The exact use and allocation of this capital, across markets and products, should be determined
by the Board and leadership.
The District should pull from a number of possible funding sources to capitalize the Green Bank. The
District should prioritize funding sources that are accessible, reliable and have few restrictions on their
use. Potential funding sources include general budget appropriation, merger settlement dollars, and
federal resources. For on-going funding streams, the District should consider increasing the SETF
collection from ratepayers to raise dedicated funding.
A Green Bank entity under this structure would require the passage of legislation. The legislation should
grant the Green Bank the authority to provide financing in a wide range of forms to ensure operational
flexibility. The legislation should also grant the Green Bank the authority to issue bonds. The bonds
could be issued as general obligation bonds of the Green Bank, revenue bonds supported by revenue
streams due to the Green Bank, or project bonds backed by specific assets financed by the Green Bank.
The bonds should have no recourse to the District and not impact the District’s debt cap.

79
As is the case with other existing financing entities in the District, the Green Bank should be legally
created in a manner such that its long-term financing and borrowing comply with anti-deficiency rules.
Finally, it should be made explicitly clear in legislation that the Green Bank’s activity does not constitute
providing public credit for private activity. The DCHFA and HPTF are strong precedents for these kinds of
institutional and financing structures. And the NCEF, created to finance PACE projects, provides a good
example of a bonding structure designed to be independent of the District, and which does not violate
Home Rule prohibitions on usage of public credit.
And finally, the Green Bank should have the ability to issue bonds to recycle capital and increase lending
capacity. This could be done through several potential bond structures, all of which should have no
recourse to the District. This includes the use of industrial revenue bonds, project and asset-backed
bonds, and the use of NCEF bonds for portfolios of PACE projects.
The Green Bank should deploy a portfolio of financing and market development solutions, focused on
the residential and commercial energy efficiency and solar. Different products will likely be needed to
meet different sub-segments of the market. For instance, renters and homeowners need different
financing structures. And the low-to-moderate income sector also needs tailored solutions that can
address their specific needs and barriers to adoption. Some of the financing products discussed in this
report include PACE financing, on-bill financing, whole-home solutions that include both solar and
efficiency, and the creation of new community solar financing tools. Green Bank leadership should
prioritize products, focusing on the greatest market opportunities and easiest wins. The Green Bank
should use pilots and other methods of experimentation to quickly test what does and does not work.
The Green Bank cannot be afraid to fail, learn from its mistakes, and improve.
It is also essential that the Green Bank seek to build demand for clean energy in addition to providing
financing solutions. This means working closely with private lenders and investors, as well as the
contractor community that is the true go-to-market channel for customers. This also means designing
financing products with a holistic lens of the full set of steps and barriers involved that might prevent a
customer from saying “yes” to clean energy. The Green Bank, therefore, cannot be afraid to devote
resources to demand generation and market development.
Integration with Existing Programs Given the adjacent activities of the Green Bank and the SEU, deep coordination between the two
entities is crucial. DOEE should provide direct coordination for a growing set of clean energy programs
and market development services. This means the SEU, the Green Bank, and DC PACE should all operate
under a unified strategy, where each piece is aligned with the others to maximize the effectiveness of
each dollar. DOEE should also maintain administrative control over each aspect of what should
increasingly become a single brand and entity from the market perspective. By presenting the program
set to the market with a single name, website, and interface, it will force internal coordination across
program areas and customer engagement with programs will become simpler.
The first layer of integration to address is between DC PACE and the Green Bank. As PACE is a single type
of financing structure serving a single market segment, whereas the Green Bank is a financing institution
that houses multiple products for many market segments, DC PACE should be integrated into the Green
Bank. It should be presented as a product of the Green Bank. Having multiple entities offering different
financing products for different segments of the market will only create more market confusion.

80
From the market’s perspective, consistent branding will be beneficial. However, this does not
necessarily mean that the administration of the DC PACE program should change structurally. Rather,
the current construct, with a contracted administrator (currently UI), can remain in place. The Green
Bank, via DOEE, can be given responsibility for managing DC PACE, but then assumes the contracted
relationship with UI, or another, that would administer the program. It is not necessary that the task of
administering DC PACE come in-house at the Green Bank. Internal coordination between the DC PACE
administrator and the Green Bank, though, would also be beneficial to DC PACE.
To facilitate simple, easy to understand financing with fewer barriers to entry and transaction costs, DC
PACE and the Green Bank should have shared branding and marketing. As the Green Bank will, in effect,
be marketing DC PACE as a product of the Green Bank, the costs associated with marketing and
consumer education would become shared. There are also natural financing synergies associated with
integrating the two programs. As the Green Bank would provide various financial products across
market segments and engage with many capital providers, the Green Bank could help DC PACE projects
source capital. Or one can imagine a scenario where the Green Bank could supplement DC PACE
financing with another form of financing to expand a project or ensure a project is closed.
Beyond the marriage of DC PACE and non-PACE financing within the Green Bank, the clean energy
incentives offered by the SEU should also be closely integrated with the financing resources and needs
of the District. A consumer interested in clean energy improvements to their property may not know, in
advance, whether they merely want incentives or financing or both. In the case of most consumers, they
may not have any idea what is available to them in terms of financing or incentives. Contractors
interested in qualifying for incentives may also be interested in learning about finance options, and vice
versa. Spreading this information and application processes across two or more institutions or websites
creates a more complicated process that will reduce uptake and fragment the market.
To minimize complexity and increase the uptake of all clean energy resources offered by the District,
there should be a single online platform of all information, resources, and data relevant to clean energy
upgrades. A customer or business looking for all of information, tools, financing, and incentives needed
to explore clean energy adoption should go directly to a single source of information. Connecticut
provides an excellent model for this kind of integrated platform—all incentives, financing options, and
other resources are available on a single website, energizeCT.com, and conveniently arranged by
building type and user type. Having a single brand, website, and depository for all clean energy
resources dramatically reduces the barriers and challenges associated with increasing program uptake.
It is conceivable that existing brands and websites are not suitable for hosting the resources associated
with the SEU, UI, and the Green Bank. Fully integrating the customer- and contractor-facing sides of
these three organizations may require the creation of an entirely new brand and website.
In addition to streamlined branding and market engagement, internal coordination “behind the scenes”
is critical. Contractors must be fully trained to understand the financing and incentive options available
to customers. And they should know how to explain and sell clean energy solutions using both tools.
Customers for larger projects should also be able to see a financial and/or energy assessment of the
project that accounts for the impact of both incentives and financing. It is also essential that the District
or its partners bear the responsibility of coordinating applications and access to financing and
incentives. It cannot be left to customers to seek out these benefits on their own. Solutions must be
offered in a turn-key fashion. This close coordination would have to be written into the contracts for DC

81
PACE and SEU as requirements for successful fulfillment. Presently the SEU administrator is required to
coordinate with DC PACE. Similar language would need to be added to support Green Bank integration.
Finally, over time, the District may find it prudent to adjust the budgets and levels of program allocation
across financing and incentives in reaction to market conditions. As technology costs fall, for instance,
incentives can fall, as well. Or incentive dollars can shift to programs that support “low-hanging fruit” to
those that support deep energy retrofits. This way, when paired with financing, all public dollars are
being used to maximum efficiency.
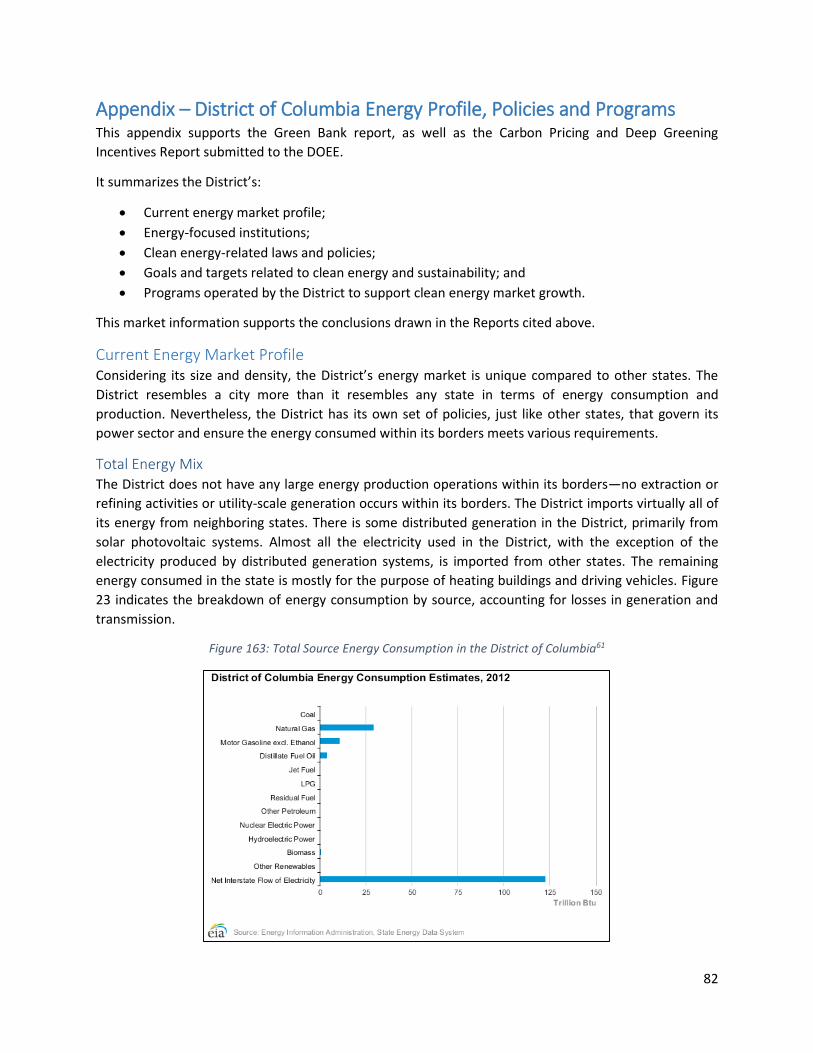
82
Appendix – District of Columbia Energy Profile, Policies and Programs This appendix supports the Green Bank report, as well as the Carbon Pricing and Deep Greening
Incentives Report submitted to the DOEE.
It summarizes the District’s:
Current energy market profile;
Energy-focused institutions;
Clean energy-related laws and policies;
Goals and targets related to clean energy and sustainability; and
Programs operated by the District to support clean energy market growth.
This market information supports the conclusions drawn in the Reports cited above.
Current Energy Market Profile Considering its size and density, the District’s energy market is unique compared to other states. The
District resembles a city more than it resembles any state in terms of energy consumption and
production. Nevertheless, the District has its own set of policies, just like other states, that govern its
power sector and ensure the energy consumed within its borders meets various requirements.
Total Energy Mix The District does not have any large energy production operations within its borders—no extraction or
refining activities or utility-scale generation occurs within its borders. The District imports virtually all of
its energy from neighboring states. There is some distributed generation in the District, primarily from
solar photovoltaic systems. Almost all the electricity used in the District, with the exception of the
electricity produced by distributed generation systems, is imported from other states. The remaining
energy consumed in the state is mostly for the purpose of heating buildings and driving vehicles. Figure
23 indicates the breakdown of energy consumption by source, accounting for losses in generation and
transmission.
Figure 163: Total Source Energy Consumption in the District of Columbia61

83
The commercial sector consumes roughly two thirds of the energy in the District, with all the other
sectors combined consuming one third of the energy in the city. (The commercial sector for these
purposes includes commercial, government, and institutional buildings, along with those multifamily
buildings where residents do not pay their own energy costs.) This is a result of the District’s job base
and commuter dynamics – there is no significant industry or manufacturing in the District, and many
employees who work in the city live in neighboring states. So the District’s built landscape, and
relatedly, its energy consumption, is dominated by the commercial sector.
Figure 174: Source Energy Consumption in the District of Columbia by Sector62
Electricity
Utility Structure
The Potomac Electric Power Company (Pepco) remains the sole provider of distribution services in the
District.63 All District residential and commercial customers can choose their electricity supplier among a
group of competing retail electricity suppliers.xix Customers who choose not to enter into an
arrangement with an alternative supplier remain with Pepco and are supplied under its Standard Offer
Service (SOS).64
Pepco does not own any generation assets inside the District. District electricity suppliers acquire their
electricity either by long-term power-purchase agreements (PPAs) with power generators or by
purchases on the wholesale market of the PJM interconnection—an independent regional transmission
organization. Pepco, as the distribution utility, delivers the electricity from the suppliers to their
customers.
As of June 2015, the District was served by 30 electric suppliers.65 As of mid-2015, 32.6% of non-
residential customers (representing 84.5% of electricity usage) in the District have chosen a competitive
xix The Retail Electric Competition and Consumer Protection Act of 1999 established customer choice with respect to choosing the supplier of electricity.

84
electricity supplier other than Pepco’s SOS. This indicates that the District’s retail deregulation has
created an active market for commercial customers. On the other hand, only 13.4% of residential
customers (representing 14.5% of electricity usage) have chosen an alternative electricity supplier,
though a growing number of residential customers are opting to get electricity from an alternative
supplier.66
Import v. In-state generation
The District is geographically small and densely populated, and does not produce energy or generate
electricity within its borders save for a small amount of distributed renewable generation. The District
imports almost all of its electricity, which is generated and supplied by a variety of power plants located
outside of the District. Imported electricity supplied to the District comes from a mix of coal, natural gas,
nuclear, and renewable generation sources (see next section for more detailed electricity fuel data).
All of these electricity generation sources operate and sell electricity through the PJM Interconnection.
PJM coordinates and manages the wholesale electricity market for all or part of 13 states and the
District, or nearly 61 million customers.xx To meet demand across the grid, the PJM operator sources
electricity from a variety of generation sources based on merit order, which is set by price and capacity
characteristics and requirements to maintain grid reliability. When available, renewable energy is
utilized by the grid and reduces the demand for electricity from baseload sources.
All electricity suppliers must comply with the District’s Renewable Portfolio Standard (RPS), which
requires suppliers to obtain a minimum amount of electricity from clean generation sources (see section
on the District’s energy policies for more detail on the RPS). All of the 30 electricity suppliers importing
energy operate in compliance with the RPS, though five suppliers offer specifically-designed renewable
energy supply options. Through these supply plans, customers can choose to receive from 50 percent to
100 percent of their electricity from renewable sources. 67
Electricity Fuel Mix
In 2014 in its District service territory, Pepco’s electricity fuel mix was 43.5% coal, 34.7% nuclear, and
17.5% natural gas. Renewable sources (including hydroelectric) comprise 4% of electricity generated.
xx These states include Delaware, Illinois, Indiana, Kentucky, Maryland, Michigan, New Jersey, North Carolina, Ohio, Pennsylvania, Tennessee, Virginia, West Virginia.
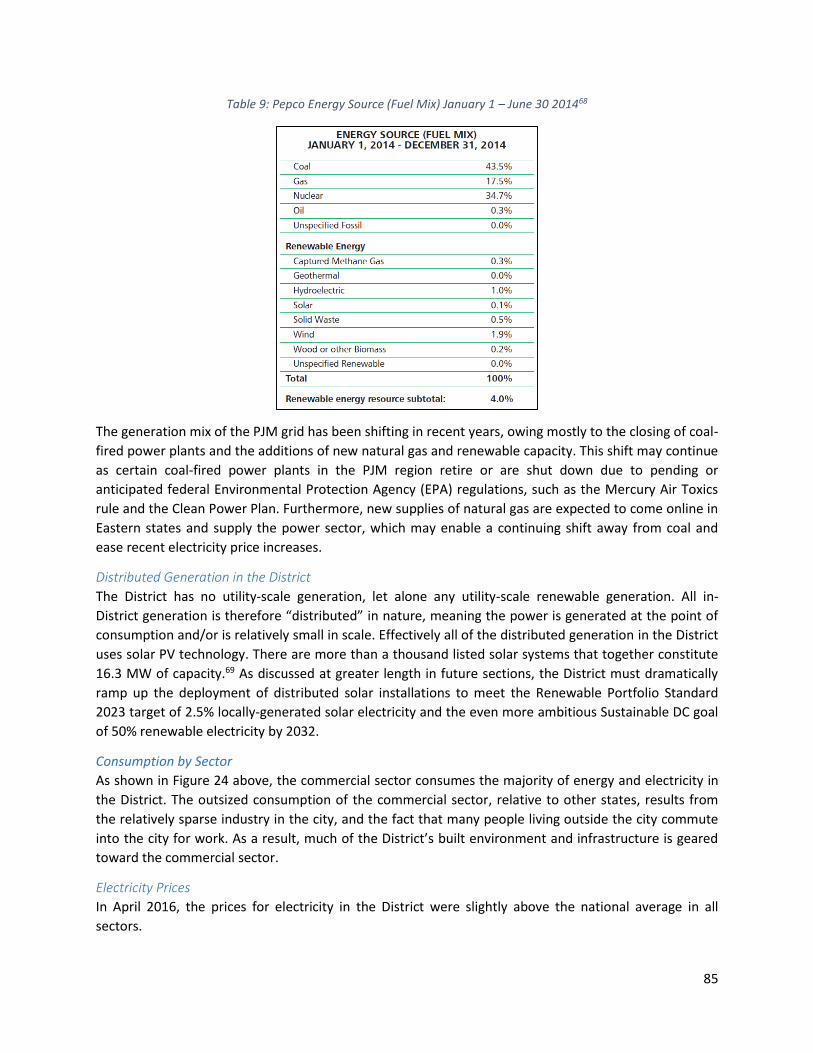
85
Table 9: Pepco Energy Source (Fuel Mix) January 1 – June 30 201468
The generation mix of the PJM grid has been shifting in recent years, owing mostly to the closing of coal-
fired power plants and the additions of new natural gas and renewable capacity. This shift may continue
as certain coal-fired power plants in the PJM region retire or are shut down due to pending or
anticipated federal Environmental Protection Agency (EPA) regulations, such as the Mercury Air Toxics
rule and the Clean Power Plan. Furthermore, new supplies of natural gas are expected to come online in
Eastern states and supply the power sector, which may enable a continuing shift away from coal and
ease recent electricity price increases.
Distributed Generation in the District
The District has no utility-scale generation, let alone any utility-scale renewable generation. All in-
District generation is therefore “distributed” in nature, meaning the power is generated at the point of
consumption and/or is relatively small in scale. Effectively all of the distributed generation in the District
uses solar PV technology. There are more than a thousand listed solar systems that together constitute
16.3 MW of capacity.69 As discussed at greater length in future sections, the District must dramatically
ramp up the deployment of distributed solar installations to meet the Renewable Portfolio Standard
2023 target of 2.5% locally-generated solar electricity and the even more ambitious Sustainable DC goal
of 50% renewable electricity by 2032.
Consumption by Sector
As shown in Figure 24 above, the commercial sector consumes the majority of energy and electricity in
the District. The outsized consumption of the commercial sector, relative to other states, results from
the relatively sparse industry in the city, and the fact that many people living outside the city commute
into the city for work. As a result, much of the District’s built environment and infrastructure is geared
toward the commercial sector.
Electricity Prices
In April 2016, the prices for electricity in the District were slightly above the national average in all
sectors.

86
Table 10: District Electricity Prices by Sector, in cents per kWh70
Residential Commercial Industrial All Sectors
DC 13.48 11.88 9.09 12.08
U.S. Avg. 12.43 10.09 6.39 9.81
Figure 25: District Historical Electricity Prices by Sector71
Electricity prices in the District reflect three separate charges for generation, transmission, and
distribution and are set under the direction of the District of Columbia’s Public Service Commission
(PSC).
Generation charges represent the cost of physically producing electricity at a generation source. Given
that the District’s consumers can choose their electricity generator, there is competitive pressure for
generators and suppliers to make their electricity more attractive to consumers, potentially by providing
it at lower-cost or by highlighting its low carbon attributes. Transmission charges are set by the Federal
Energy Regulatory Commission, while distribution charges are set through PSC ratemaking cases with
Pepco. Provided that it meets the PSC’s eligibility requirements, an electricity generator located outside
of the District can supply electricity through a procurement process overseen by the PSC and Pepco. For
example, through the procurement process, an eligible wind farm in Pennsylvania can enter into a PPA
that guarantees a certain electricity price for generated electricity for a purchaser in the District.
The District of Columbia has also established a Municipal Aggregation Program (DC MAP) that allows for
District agencies and certain other consumers to aggregate demand to negotiate lower electricity
rates.72
0
2
4
6
8
10
12
14
16
Ce
nts
/kw
h
Electricity Prices in the District
Residential Commercial Industrial

87
Electricity Expenditure
The District’s total expenditure on retail electricity in 2012 was $1.33 billion. The total expenditure on
energy was $2.15 billion or $3,400 per capita. The District ranks 50th among the states in energy spend
per capita, meaning the per capita expenditures by District residents on energy is nearly the lowest in
the country among all states.
Table 11: Energy Expenditures by State73
State Retail Electricity
(millions) Total Energy
(millions) Energy Spending
per Capita
State
Rank
DC $1,334 $2,152 $3,398 50
DE $1,267 $4,014 $4,377 26
MD $6,975 $22,595 $3,840 39
VA $9,780 $35,135 $4,292 28
RI $982 $3,748 $3,568 47
Thermal Energy
Heating fuel source for buildings
There are several heating fuels widely used in the District. Of the heating fuel consumed, 56% is natural
gas, 39% is electricity, 2% is fuel oil, 1% is LPG, and 2% is none/other (such as wood).
Figure 186: District Heating Fuel Consumption by Type74
Natural gas utility structure
The natural gas market in the District is deregulated. Washington Gas Light Company (“Washington
Gas”) is a regulated utility that delivers natural gas to District customers. As they do for electricity,
District customers can choose to buy their gas from competing retail energy companies. All consumers
not electing to choose a new fuel services provider will remain a customer of Washington Gas’s supply,
Natural Gas56%
Electricity39%
Fuel Oil2%
Other/None2%LPG
1%
Heating Source by Fuel Type
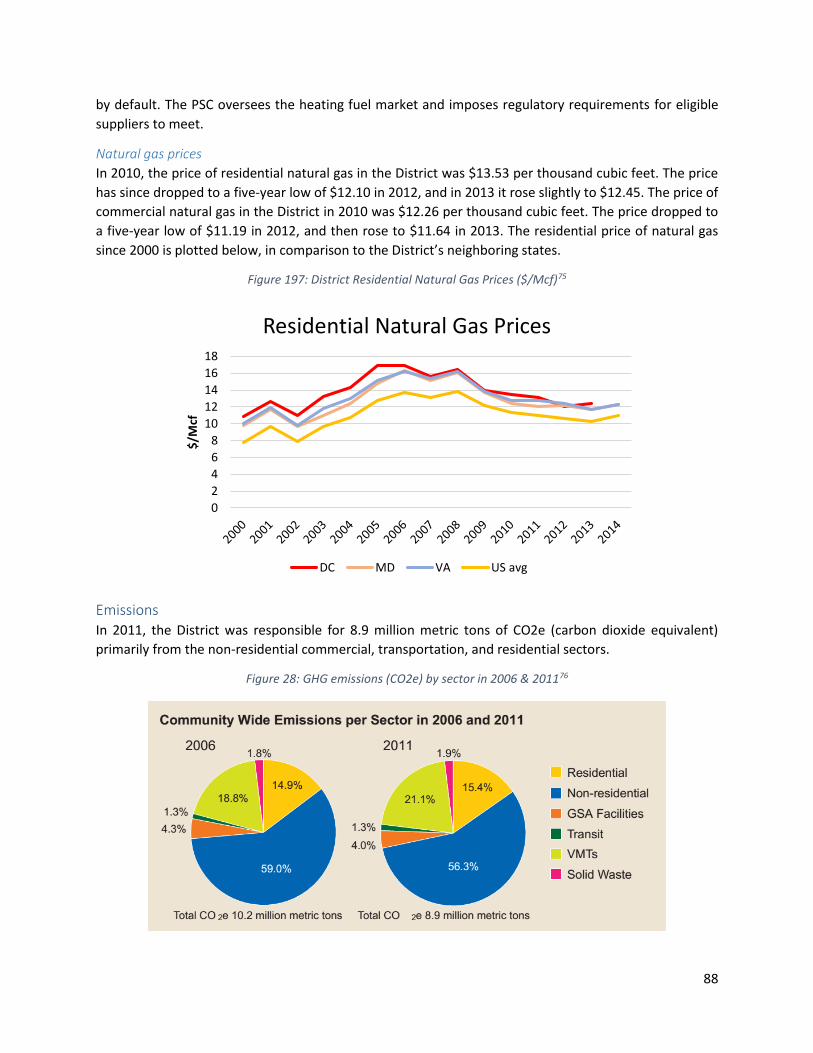
88
by default. The PSC oversees the heating fuel market and imposes regulatory requirements for eligible
suppliers to meet.
Natural gas prices
In 2010, the price of residential natural gas in the District was $13.53 per thousand cubic feet. The price
has since dropped to a five-year low of $12.10 in 2012, and in 2013 it rose slightly to $12.45. The price of
commercial natural gas in the District in 2010 was $12.26 per thousand cubic feet. The price dropped to
a five-year low of $11.19 in 2012, and then rose to $11.64 in 2013. The residential price of natural gas
since 2000 is plotted below, in comparison to the District’s neighboring states.
Figure 197: District Residential Natural Gas Prices ($/Mcf)75
Emissions In 2011, the District was responsible for 8.9 million metric tons of CO2e (carbon dioxide equivalent)
primarily from the non-residential commercial, transportation, and residential sectors.
Figure 28: GHG emissions (CO2e) by sector in 2006 & 201176
0
2
4
6
8
10
12
14
16
18
$/M
cf
Residential Natural Gas Prices
DC MD VA US avg
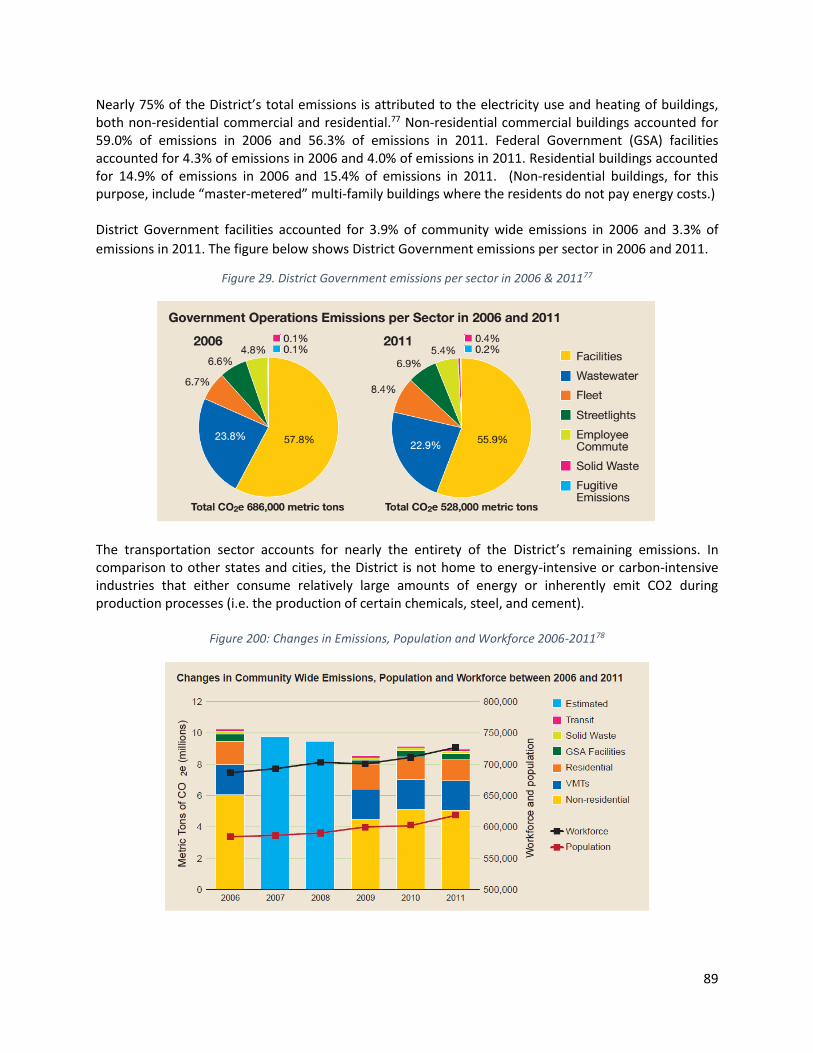
89
Nearly 75% of the District’s total emissions is attributed to the electricity use and heating of buildings, both non-residential commercial and residential.77 Non-residential commercial buildings accounted for 59.0% of emissions in 2006 and 56.3% of emissions in 2011. Federal Government (GSA) facilities accounted for 4.3% of emissions in 2006 and 4.0% of emissions in 2011. Residential buildings accounted for 14.9% of emissions in 2006 and 15.4% of emissions in 2011. (Non-residential buildings, for this purpose, include “master-metered” multi-family buildings where the residents do not pay energy costs.) District Government facilities accounted for 3.9% of community wide emissions in 2006 and 3.3% of
emissions in 2011. The figure below shows District Government emissions per sector in 2006 and 2011.
Figure 29. District Government emissions per sector in 2006 & 201177
The transportation sector accounts for nearly the entirety of the District’s remaining emissions. In comparison to other states and cities, the District is not home to energy-intensive or carbon-intensive industries that either consume relatively large amounts of energy or inherently emit CO2 during production processes (i.e. the production of certain chemicals, steel, and cement).
Figure 200: Changes in Emissions, Population and Workforce 2006-201178
90
It should be noted that the District’s overall CO2 emissions fell between 2006 and 2011 despite a population increase. According to the District’s 2011 GHG Inventory, the city’s emissions fell from 10.21 million tons of CO2e in 2006 to 8.93 million tons in 2011, even as the city’s population grew from 583,978 to 617,996 and as the city’s labor force grew and housing construction increased. The decrease in CO2 emissions is attributed to several factors, but energy efficiency upgrades to District government buildings, including a major renovation to the city’s wastewater treatment plan, achieved a reduction of approximately 150,000 metric tons of CO2. The Inventory also credits CO2 reductions to a shift toward cleaner electricity generation, primarily from coal to natural gas, among the suppliers of the District’s electricity for 16.8% of the overall decrease. A continued regional trend toward cleaner electricity generation may occur owing to the recent growth in regional natural gas production and adopted/pending federal policies. Expected population growth between now and 2032 could undermine the District’s efforts to reduce its
overall energy consumption. The Sustainability Plan notes that the District’s population might grow by
250,000 people over the next 20 years, which creates a challenge of reducing energy use in the face of a
potentially significant growth in electricity demand. A carbon price applied to the District’s building
sector has the potential to deliver significant reductions in current energy consumption, while also
establishing a market price signal that encourages entities to consider current and future energy use
when making planning and investment decisions.
Looking Ahead Two specific policy changes for the District’s electricity market may be adopted in the very near future.
The Building Energy Performance Task Force’s 2014 report encouraged policymakers to consider the
adoption of an energy efficiency resource standard (EERS) that would require utilities to achieve annual
efficiency gains. The report cited an ACEEE study that found that “every state that reported statewide
electricity savings over 1 percent in 2011 had an EERS in place.”
In June 2015, the PSC opened a proceeding to identify technologies and policies to modernize the
energy delivery system in the District of Columbia to make it more reliable, cost-effective, and
interactive.79 This effort has been commonly referred to in other jurisdictions as designing utility 2.0
and creating a new business model that would reward utilities for not just energy sales. The PSC will
receive citizen and stakeholder feedback on these issues.
Institutions
Department of Energy & Environment The Department of Energy & Environment (DOEE) is the regulatory agency with authority to oversee
energy and environmental issues affecting the District. Their mission includes: “issuing permits,
monitoring environmental conditions, providing funding and technical assistance, assessing
environmental risks, developing policies, inspecting facilities, enforcing environmental regulations,
working with other entities to solve every day environmental issues, and informing and educating the
public on local environmental trends and their benefits.”80 The DOEE guides energy planning and policy
creation for the District, directly administers several clean energy programs, and manages contracts for
clean energy rebate and financing programs operated by third-party administrators.

91
DC Sustainable Energy Utility The DC Sustainable Energy Utility (DC SEU) was established in 2008 under the Clean and Affordable
Energy Act (CAEA). 81 The CAEA established the Sustainable Energy Trust Fund (SETF) to fund the
creation of a Sustainable Energy Utility, to be operated by a private company on a contractual basis
under the supervision of the DOEE. The Vermont Energy Investment Corporation (VEIC) and eight other
local partners formed the Sustainable Energy Partnership and won the contract to operate the DC SEU
beginning in March 2011.82 The DC SEU provides various incentives and information for District residents
and business to use less energy and save money and has an annual budget of about $18 million.
Laws and Policies The District has implemented a number of laws and policies that guide clean energy market growth. This
includes mandates for the usage of certain kinds of energy, as well as construction guidelines that
ensure more efficiency buildings.
Renewable Energy
Renewable Portfolio Standard
Electricity suppliers with retail sales in the District must meet a gradually increasing mandate to provide
renewable electricity. The District initially adopted a RPS in 2005 and made three significant revisions to
the RPS in 2008, 2011, and 2014. As of 2015, electricity suppliers have to obtain at least 9.5% of retail
electricity sales from Tier I renewable resources, (such as wind, solar, and biomass), and 2.5% of
electricity from Tier II energy resources (either hydroelectric or waste-to-heat). After 2015, the
requirement for Tier I compliance increases by 2% annually until 2020 when 20% of all electricity sales
must be covered by Tier I generation. In addition, by 2023, 20% of electricity must be generated by
renewable sources with 2.5% derived by solar installations located within the District or a feeder system
connected to the District.83
In 2016, the District amended the RPS requirement to rise incrementally by year until 2032, at
which point 50% of all electricity must be generated by renewable sources, with 5% derived
from solar installations located within the District or a feeder system connected to the District.84 In 2011, for the purposes of meeting the solar requirement of the RPS, the District adopted legislation that required all solar PV or thermal systems certified by the PSC to be located within the District. The number of certified solar projects fell dramatically, but in recent years the PSC has received an increased number of applications for certification. As of the end of 2014, 33.2 MW of solar capacity was certified, with only 13.3 MW was located within the District. The PSC estimates that while the amount of solar capacity is increasing, it will still likely fall short of what is necessary to meet the RPS. For example, there is an estimated need of 54.7 MW of solar capacity in 2014 and 64.3 MW in 2015. The PSC notes that this potential shortfall might be mitigated by the elimination of the cap on qualifying solar capacity for installations owned by District agencies and the adoption of the Community Renewable Energy Act, which allows for community net metering projects of up to 5 MW. The PSC’s most recent RPS status report summarizes the compliance steps taken by the 28 electricity suppliers reporting retail sales to customers in the District as of 2013. The report indicates that most suppliers acquired Renewable Energy Credits (RECs) and Solar Renewable Energy Credits (SRECs) to comply with the RPS, while seven suppliers opted to pay the alternative compliance fee of $500 per
92
MWh.xxi The sum of compliance fees jumped from nearly $5,000 in 2012 to nearly $700,000 in 2013, an increase which the PSC attributes to the difficulty of acquiring SRECs that must now come from in-District generation. The compliance fees are placed into the Renewable Energy Development Fund (REDF) that supports renewable energy market development in the District. SRECs are generated by District-located solar hot water heaters and solar photovoltaic systems smaller
than 5 MW. SRECs are valid for 3 years after the date of generation and provide a potentially significant
source of revenue for owners of solar systems.85 By statute, the fee that an electricity supplier must pay
as a penalty in lieu of owning an SREC is $500/MWh or $0.50/kWh. As a corollary to this fee level, as of
March 2015, the open market price of SRECs in the District was $480/MWh or $0.48/kWh. This is to be
expected, as SREC purchasers (suppliers that must comply with RPS) would be unwilling to buy an SREC
at a price equal to or greater than the fee that must be paid to the PSC in place of owning the SREC. It is
worth noting that this SREC price is nearly double the next highest SREC price of any other state in the
nation. In most states, SRECs trade at a price below $100/MWh.86 This should indicate that there is a
strong market signal to develop solar in the District. Also, with SREC prices at this high level, distributed
solar is highly cost effective and can be sold at a price far below the price of grid-based electricity.
Net-Metering
Net metering is a regulatory structure that allows distributed generation systems to sell any unused
power back into the grid, with the utility paying a set rate per kwh. Net metering has been in effect in
the District since March 2000 for residential and commercial customer-generators with systems
powered by renewable energy sources, combined heat and power (CHP), fuel cells, and microturbines.
Systems up to 1 MW in size are eligible, and for community renewable energy facilities, systems up to 5
MW are eligible. Systems that are 100 kW or less get credits for their net excess generation which are
carried over to the customer’s next electricity bill indefinitely at a retail rate. Systems that are between
100 kW and 1 MW get their net excess generation credits carried over to the customer’s next electricity
bill indefinitely at a generation rate.87 In 2014, the Council of the District adopted legislation authorizing
community net metering, and the PSC is accepting comments on how to establish rates for community
net metering.
Efficiency
Green Building Act
The Green Building Act of 2006 (GBA) is an integral part of the District’s green building strategy. It
requires that all non-residential District public buildings with at least 10,000 square feet of floor area be
certified at LEED Silver or higher (schools must be LEED Certified or higher).88 Furthermore, these non-
residential buildings must be designed to achieve an ENERGY STAR score of 75 or greater. District owned
or financed residential projects with at least 10,000 square feet of floor area must exceed Enterprise
Green Communities certification standard. Since January 2012, all new non-residential private
development projects 50,000 square feet or larger are required to be LEED Certified or higher under the
GBA.
xxi RECs are the unit of compliance for the general RPS, and SRECs are the unit of compliance for the solar requirement of the RPS. Alternative compliance payments are made by suppliers that fail to acquire the requisite number of RECs, and those fee payments are deposited in the Renewable Energy Development Fund.
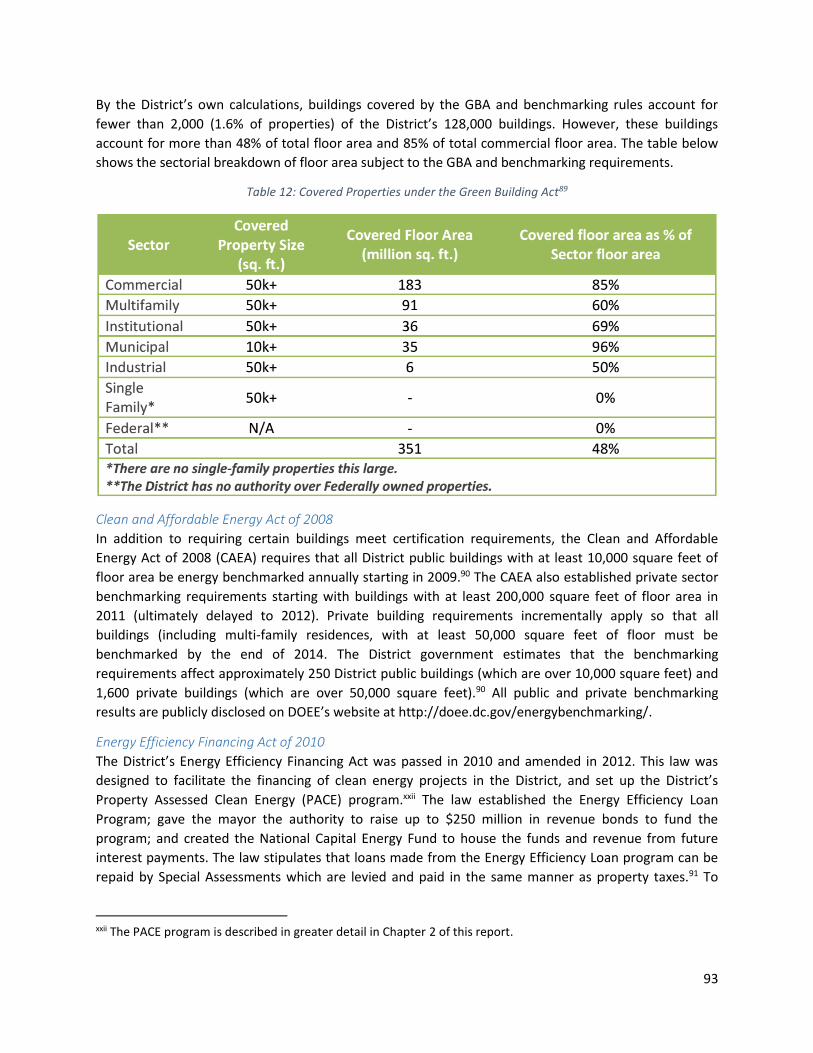
93
By the District’s own calculations, buildings covered by the GBA and benchmarking rules account for
fewer than 2,000 (1.6% of properties) of the District’s 128,000 buildings. However, these buildings
account for more than 48% of total floor area and 85% of total commercial floor area. The table below
shows the sectorial breakdown of floor area subject to the GBA and benchmarking requirements.
Table 12: Covered Properties under the Green Building Act89
Clean and Affordable Energy Act of 2008
In addition to requiring certain buildings meet certification requirements, the Clean and Affordable
Energy Act of 2008 (CAEA) requires that all District public buildings with at least 10,000 square feet of
floor area be energy benchmarked annually starting in 2009.90 The CAEA also established private sector
benchmarking requirements starting with buildings with at least 200,000 square feet of floor area in
2011 (ultimately delayed to 2012). Private building requirements incrementally apply so that all
buildings (including multi-family residences, with at least 50,000 square feet of floor must be
benchmarked by the end of 2014. The District government estimates that the benchmarking
requirements affect approximately 250 District public buildings (which are over 10,000 square feet) and
1,600 private buildings (which are over 50,000 square feet).90 All public and private benchmarking
results are publicly disclosed on DOEE’s website at http://doee.dc.gov/energybenchmarking/.
Energy Efficiency Financing Act of 2010
The District’s Energy Efficiency Financing Act was passed in 2010 and amended in 2012. This law was
designed to facilitate the financing of clean energy projects in the District, and set up the District’s
Property Assessed Clean Energy (PACE) program.xxii The law established the Energy Efficiency Loan
Program; gave the mayor the authority to raise up to $250 million in revenue bonds to fund the
program; and created the National Capital Energy Fund to house the funds and revenue from future
interest payments. The law stipulates that loans made from the Energy Efficiency Loan program can be
repaid by Special Assessments which are levied and paid in the same manner as property taxes.91 To
xxii The PACE program is described in greater detail in Chapter 2 of this report.
94
date, this $250 million bonding authority and loan fund has never been tapped or used. Instead, the
PACE program is currently operating on purely private funding.
Sustainable DC Act of 2012
The District’s Sustainable DC Act 2012 amended the Energy Efficiency Financing Act. The Sustainable DC
Act authorizes the issuance of bonds from private financing institutions, to allow the DC PACE program
more operational flexibility. This law also amended the CAEA so the energy benchmarking program now
requires disclosure of ENERGY STAR Portfolio Manager scores for all private buildings over 50,000 sq ft.92
Energy Conservation Code
In 2014, the District adopted new construction codes that, among other things, strengthen the energy
and green building requirements that new construction projects must meet. The Energy Conservation
Code of 2013 (ECC) applies to all commercial and residential buildings.93 It is based on 2012 edition of
the International Energy Conservation Code (IECC)94 with amendments specific to the District95. The
2013 code produces a building that is about 30% more energy efficient than the building required by the
2008 code.
Green Construction Code
The Green Construction Code of 2013 (GCC) extends the practices mandated by the GBA. It is based on
the 2012 edition of the International Green Construction Code (IGCC)96 with District specific
amendments97 and covers site development, land use, material conservation and efficiency, energy
conservation, water conservation, and indoor air quality. The Green Construction Code (GCC) applies to
all commercial projects with at least 10,000 square feet of floor area and all multifamily residential
projects with at least 10,000 square feet of floor area and at least 4 stories tall. There are several
alternative compliance paths to the GCC: (1) ASHRAE 189.1-2011; (2) LEED Certified or higher; (3)
Enterprise Green Communities Certified or higher; and (4) National Green Building Standard (ICC-700)
Bronze or higher, and ENERGY STAR New Homes or Multifamily High-Rise Certification.98
Other Policies
Building height restrictions and historic districts and building policies also influence the building market
and energy use in the District.
The Height of Buildings Act of 189999 sets maximum building heights, increasing demand for maximizing
Floor Area Ratio (FAR)100 and potentially limiting the size of renewable energy systems that can be
installed on building rooftops, especially in the dense downtown core. Both of these consequences
make it challenging to install rooftop renewable energy systems that are capable of meeting the energy
needs of the building on which they are installed.
Under the Historic Landmark and Historic District Protection Act (1978)101 and the National Historic
Preservation Act,102 there are approximately 50 historic districts and over 800 individually designated
buildings. These regulations can limit the depth of energy retrofits because retrofits may not impact the
visual appearance of the building such that it is incompatible with its historic designation. Furthermore,
historic district regulations generally prohibit alterations that are visible from the public right of way—
limiting renewable energy system installation. As pointed out by the District’s Net Zero building report,
the issues to energy efficiency and renewable energy deployment will increase as more buildings cross
the 50-year age threshold after which buildings can be considered historic.100

95
District Goals Sustainable DC is a sustainability planning effort led by the DOEE and the Office of Planning first initiated
in late summer 2011. Through Sustainable DC, various stakeholder groups and volunteers met regularly
to draft a vision and develop recommendations for goals and actions within the topics of built
environment, climate, energy, food, nature, transportation, waste, water, and the green economy. The
work of Sustainable DC culminated in the Sustainable DC Plan.103 The following goals from the
Sustainable DC Plan deal with climate and energy targets.
50% Reduction in CO2 Emissions by 2032 The Sustainable DC Plan includes a goal to reduce citywide greenhouse gas emissions by 50%, and 80%
by 2050, relative to a 2006 baseline, while adapting to the hazards of climate change. The Sustainable
DC Plan identified the following as potential means of achieving that goal: emissions reduction targets
for each emission source or sector of the economy; interactive online tools such as calculators, online
portals or forums that provide better emission data, and allow people to make more informed decisions;
and financial tools, such as a carbon tax or a carbon benefit program.
50% Reduction in Energy Use and 50% Power from Renewables by 2032 The Sustainable DC Plan includes a goal to reduce energy consumption by 50% by 2032, relative to a
2012 baseline, and to increase the use of renewable energy to 50% of all energy consumption by 2032.
The Sustainable DC Plan identified the following as potential means of achieving these goals: mandatory
energy audits and disclosure for all buildings periodically and at the point of sale; the replacement of
public street lighting and related infrastructure with efficient, energy-efficient models; shifting reliance
from coal-generated power sources to more renewable sources.
Each of these goals would be incredibly ambitious on their own. As mentioned above, the District has
little industry and no power generation, so strategies for accomplishing these goals must heavily rely on
the choices of building owners within the district to reduce and decarbonize their energy consumption.
Programs In the District, the DOEE and the DC SEU oversee various clean energy rebate and incentive programs.
DC PACE (discussed below) is the only loan program in the District.
Rebates
Offered by DOEE
DIY Home Energy Audit Program
This program encourages District homeowners to conduct a Do-It-Yourself Audit to identify and correct
most energy efficiency problem areas.104 The DIY Home Energy Audit website provides guidance on
performing a DIY audit and recommends the use of a certified contractor to make major home energy
efficiency improvements.105
Discounts on Utility Bills
This program provides low-income District residents with discounts of on utility bills to help reduce their
utility costs while educating them on energy efficiency practices that further reduce their energy
spending. Program participants must demonstrate financial need to qualify and must complete a short
program that teaches them how to save energy in their home. This program is funded through a Low

96
Income Home Energy Assistance Program (LIHEAP) block grant, which amounts to about $10.3 million
for fiscal year 2015.106
Weatherization Assistance Program (WAP)
This program helps low-income residents reduce their energy bills by providing technical and financial
assistance to make their homes more energy efficient. WAP performs energy audits for qualifying
families and installs audit-recommended energy efficiency measures to help families maintain energy-
efficient, safe and healthy homes. In the District, WAP is administered through selected Community
Based Organizations that hire local contractors to install the efficiency measures recommended by the
audit. WAP is funded by the U.S. DOE, which allocated about $538,000 to the District for fiscal year
2015.107
Solar Advantage Plus Program
This program, also called the Affordable Solar program, was offered in 2014-2016, and provided rebates
to help low-income District residents install solar panels on their homes. Authorized solar installers
design and install solar PV systems free of charge for homeowners and receive a rebate of $2.50/Watt,
with a maximum rebate of $10,000 per system. The program operated on a first-come, first-served
basis.
Offered by DC SEU
Appliance Rebates
The DC SEU offers appliance rebates on select ENERGY STAR appliances. Rebates range from a few
dollars to hundreds of dollars depending on the appliance.108
Income Based Incentives
The DC SEU offers no-cost Compact Fluorescent Lights (CFLs) to patrons of local food banks meeting
certain income requirements, distributed directly through the food banks. The DC SEU also offers
incentives to homeowners and housing groups that meet certain income requirements to install solar
photovoltaic systems or solar arrays on single or multifamily homes.
Home Performance with ENERGY STAR
The DC SEU’s Home Performance with ENERGY STAR Program is a national program sponsored by the
U.S. DOE that incentivizes homeowners to identify and install energy efficiency improvements in their
homes. The DC SEU is the local DC implementer of this program, and offers financial incentives of up to
$1,800 for qualifying home energy upgrades, such as air sealing and insulating your home.109
Low-Income Comprehensive Multifamily Program (LIMF)
The DC SEU offers financial incentives and technical assistance to affordable housing developers and
property owners who incorporate energy-efficient systems and measures in the new development,
redevelopment, or substantial rehabilitation of affordable housing in the District. To qualify for
incentives, developers must demonstrate that at least 66% of their residential units per building are
designated for or inhabited by households with incomes at or below 60% Area Median Income.110
Low-Income Multifamily Implementation Contractor Direct Installation Program (ICDI)
The DC SEU offers a variety of energy- and water-saving devices and upgrades at no cost to owners and
property managers of qualified affordable housing units. The DC SEU provides resident education on the

97
equipment being installed and hires contractors to install the equipment at no cost to building owners
or residents. The same income restrictions as the LIMF program apply.111
Business Energy Rebates Program
This program provides District businesses, institutions, and owners of multi-family residences with
rebates for installing energy-efficient equipment. Qualifying measures include lighting, HVAC, boiler and
gas fired water heater upgrades, steam trap upgrades, compressed air, refrigeration, VFDs and food
service/vending. Rebates are available up to a maximum of $80,000, per location, per fiscal year.112
Commercial and Institutional Custom Program
This program targets owners of large buildings in the District who are replacing old equipment,
renovating an existing building, or beginning a new construction project with an incentive amount up to
$80,000 per location, per fiscal year. The DC SEU offers average rebates of $60 per MWh ($0.06 per
kWh) and $12 per MMBTU ($1.20 per therm) of project savings. Measures or operational improvements
leading to cost-effective energy savings are eligible for consideration to receive incentivized services
from the program. Program services may include financial incentives, technical and design assistance,
and coordinating services to assist consumers, design professionals, vendors, and contractors in
overcoming the barriers to installing energy-efficient equipment.113
Solar Incentives Programs
In addition to offering incentives for energy efficiency, the DC SEU is tasked with increasing the amount
of installed solar renewable energy capacity in the District of Columbia. DC SEU programs to install solar
on homes and businesses have been run in cooperation with DOEE, as discussed above.114
Financing
Property Assessed Clean Energy
The District has a Property Assessed Clean Energy (DC PACE) Program for commercial and multifamily
properties. The PACE program provides loans to building owners for clean energy upgrades which are
paid back via an assessment on the building’s property taxes. The assessment constitutes a lien on the
property—loan applicants must certify that the assessment does not violate any existing lender
agreements. The lien and the responsibility to pay back the loan through the property tax bill are
attached to the property, and stay with the property if it is sold. The District’s PACE program provides
financing for projects between $250,000 and $10,000,000 located in the city. The combined debt on the
property (including the PACE loan) cannot exceed 90% of the property value. The Mayor can issue up to
$250 million in bonds to fund this program. These funds, as well as any funds from the Energy Efficiency
Conservation Block Grants, will be held in the National Capital Energy Fund.
On-bill Financing
Currently, on-bill financing is not permitted within the District. In other jurisdictions, this tool has been
authorized to allow customers to repay loans for investments in renewables or energy efficiency via
their electricity bill. The on-bill financing concept is discussed in more detail in the Green Bank chapter.
98
1 “New York State Green Bank Business Development Plan,” Booz & Co., September 3, 2013. 2 “National Solar Jobs Census 2014 | The Solar Foundation.” Accessed May 10, 2016.
http://www.thesolarfoundation.org/national-solar-jobs-census-2014/. 3 Connecticut Green Bank, 2015. 4 “CEFIA’s Residential Solar Financing Products,” Bert Hunter, Green Bank Academy, February 6, 2014,
http://greenbankacademy.com/agenda-materials/. 5 Lombardi, Nick. “In a ‘Watershed’ Deal, Securitization Comes to Commercial Efficiency,” May 19, 2014.
http://www.greentechmedia.com/articles/read/the-first-known-commercial-efficiency-securitization. 6 Roselund, Christian. “Renovate America and 400 Capital Complete $129 Million PACE Securitization: PV-
Magazine.” Accessed May 10, 2016. http://www.pv-magazine.com/archive/articles/beitrag/renovate-america-and-400-capital-complete-129-million-pace-securitization_100017222/#axzz48I3cnBuc.
7 Connecticut Green Bank, 2015. 8 “New York State Green Bank Business Development Plan,” Booz & Co., September 3, 2013. 9 “Order Establishing New York Green Bank and Providing Initial Capitalization,” Case 13-M-0412, New York Public
Service Commission, December 19, 2013. 10 “Governor Andrew Cuomo Announces NY Green Bank Open for Business,” Press Release, New York Green Bank,
February 11 2014. 11 “Clean Energy Fund Information Supplement,” Case 14-M-0094, NYSERDA, June 25, 2015, p. 159. 12 “Governor Cuomo Announces Three New York Green Bank Transactions to Improve Access to Clean Energy and
Reduce Greenhouse Gas Emissions,” Press Release, October 21, 2015. 13 “GEMS Financing Program | Learn More.” Hawaii Green Infrastructure Authority, Accessed May 10, 2016.
http://gems.hawaii.gov/learn-more/. 14 “Business Plan,” California Infrastructure and Economic Development Bank, Clean Energy Finance Center,
February 17, 2015, p. 5. 15 2015- H 5900, State of Rhode Island Appropriations, Article 14. 16 “U.S. DOE Combined Heat and Power Installation Database | Facilities in DC.” Accessed May 10, 2016.
https://doe.icfwebservices.com/chpdb/state/DC; “2016 Report on the Renewable Energy Portfolio Standard,”
District of Columbia Public Service Commission, May 2, 2016; “2015 Annual Report.” DC Sustainable Energy Utility,
available at https://www.dcseu.com/about-dcseu; “2014 Annual Report.” DC Sustainable Energy Utility, available
at https://www.dcseu.com/about-dcseu; “2013 Annual Report.” DC Sustainable Energy Utility, available at
https://www.dcseu.com/about-dcseu; “2012 Annual Report.” DC Sustainable Energy Utility, available at
https://www.dcseu.com/about-dcseu. 17 “Clean and Affordable Energy Act of 2008” DC Code, 2008. 18 “Report on Solar, Renewable and Home Improvement Financing,” District of Columbia Public Service
Commission, September 23, 2009. 19 “Infrastructure Banks,” Office of Economic Development Finance, Office of Chief Financial Officer, District of
Columbia, 2014. 20 Ibid. 21 Ibid. 22 “DC Commercial PACE,” DOEE. Accessed June 14, 2016. http://doee.dc.gov/service/dc-pace-commercial. 23 “DC Government Announces Historic PACE Financing of Public Housing,” The Solar Foundation, November 11,
2015. 24 Conversations with UI staff. 25 “District First in the U.S. to use Property Assessed Clean Energy Financing for Energy Efficiency Project in
Affordable Housing,” District of Columbia Press Release, June 20, 2013. 26 National Capitol Energy Finance Administration, Requests for Proposals, June 30, 2010, at 11. 27 “District of Columbia Housing Finance Agency 1996 Single Family Mortgage Revenue Bonds.” DCHFA. Accessed
May 10, 2016. http://www.dchfa.org/DCHFAHome/AboutUs/MissionStatement/tabid/107/Default.aspx. 28 DC Code § 42–2802(b); DC Fiscal Policy Institute, “Housing Production Trust Fund,” at http://www.dcfpi.org/wp-
content/uploads/2009/03/8-20-12-HPTF-brief.pdf.
99
29 “A Decade of Progress: Investing in Lives and Neighborhoods through the Housing Production Trust Fund,”
Coalition for Nonprofit Housing and Economic Development. 30 Interview with HPTF and DHCD staff. 31 DC Code § 42–2802(a). 32 “Infrastructure Banks,” Office of Economic Development Finance, Office of Chief Financial Officer, District of
Columbia, 2014. 33 “Infrastructure Banks,” Office of Economic Development Finance, Office of Chief Financial Officer, District of
Columbia, 2014. 34 PSC Order No. 18148, March 23, 2016; Joint Applicants’ Request for Other Relief, Case No. 1119, March 7, 2016;
DOEE. 35 DC PSC Order No. 18109, at paragraph 52. 36 DC PSC Order No. 18109, at paragraph 53. 37 DC PSC Order No. 18109, at Exhibit D, Page Nos. 4-5. 38 Fourth Quarter FY 2015 Status Report on the Emergency and Contingency Cash Reserve Funds as of September
30, 2015, Office of District Chief Financial Officer, District of Columbia, February 2, 2016. 39 “Examination of the District’s Reserve Fund Policies,” Office of the District of Columbia Auditor, April 29, 2015. 40 “Examination of the District’s Reserve Fund Policies,” Office of the District of Columbia Auditor, April 29, 2015. 41 2015 Comprehensive Annual Financial Report, Year ended September 30, 2015, District of Columbia. 42 “Examination of the District’s Reserve Fund Policies,” Office of the District of Columbia Auditor, April 29, 2015. 43 “Examination of the District’s Reserve Fund Policies,” Office of the District of Columbia Auditor, April 29, 2015. 44 Fourth Quarter FY 2015 Status Report on the Emergency and Contingency Cash Reserve Funds as of September
30, 2015, Office of District Chief Financial Officer, District of Columbia, February 2, 2016. 45 “State Energy Efficiency Scorecard,” ACEEE, 2014. 46 “2016 Report on the Renewable Energy Portfolio Standard,” District of Columbia Public Service Commission, May
2, 2016, p. 17. 47 “Infrastructure Banks,” Office of Economic Development Finance, Office of Chief Financial Officer, District of
Columbia, 2014. 48 Tax Exempt Bond Financing- Industrial Revenue Bond Program, office of the Deputy Mayor for Planning and
Economic Development, available at http://dmped.dc.gov/publication/tax-exempt-bond-financing-industrial-revenue-bond-program.
49 “Order Establishing New York Green Bank and Providing Initial Capitalization,” Case 13-M-0412, New York Public Service Commission, December 19, 2013.
50 Connecticut Green Bank. 51 New York State Green Bank Business Development Plan, Final Report, September 3rd, 2013. 52 “New York Green Bank Business Plan,” Case 13-M-0412, New York Public Service Commission, June, 2015; “Comprehensive Plan: Fiscal Years 2015 and 2016,” Connecticut Green Bank, October 16, 2015. 53 DC Code § 8–1778.41(a)-(c). 54 DC Code § 8–1778.41(g). 55 “Infrastructure Banks,” Office of Economic Development Finance, Office of Chief Financial Officer, District of
Columbia, 2014. 56 “Renewable Energy Certificates (RECs): REC Prices.” US Department of Energy. Accessed May 10, 2016.
http://apps3.eere.energy.gov/greenpower/markets/certificates.shtml?page=5. 57 “CAEATFA PACE Summary.” Accessed May 10, 2016. http://www.treasurer.ca.gov/caeatfa/pace/summary.asp. 58 Connecticut Green Bank Comprehensive Plan, Fiscal Years 2015 and 2016, Updated October 16, 2015, at 13. 59 Connecticut Green Bank Comprehensive Plan, Fiscal Years 2015 and 2016, Updated October 16, 2015, footnote 18. 60 NY Green Bank Business Plan, Case 13-M-0412, June 2015. 61 “District of Columbia State Profile and Energy Estimates,” EIA, Last modified July 16, 2015, http://www.eia.gov/state/?sid=DC. 62 Ibid.
100
63 “Implementation of Consumer Choice,” DC Code §34-1502, http://dccode.org/simple/sections/34-1502.html. 64 “Pepco – Frequently Asked Questions,” http://www.pepco.com/my-home/choices-and-rates/district-of-columbia/sos/frequently-asked-questions/. 65 “Electric Customer Choice Overview” Public Service Commission of the District of Columbia, http://www.dcpsc.org/hottopics/electric.pdf. 66 Ibid. 67 “Can I Buy Green Power In My State? - District of Columbia,” last modified August 21, 2015, http://apps3.eere.energy.gov/greenpower/buying/buying_power.shtml?state=DC#3rd_party. 68 “Environmental Information for Standard Offer Service Provided by Pepco,” Pepco Fuel Mix DC Insert 2014. 69 “Monthly Update of Solar Generator Certification,” District of Columbia Public Service Commission, as of September 1, 2015. 70 District of Columbia State Profile and Energy Estimates,” EIA, Last modified July 16, 2015, http://www.eia.gov/state/?sid=DC.. 71 “District of Columbia Electricity Profile 2013,” EIA, Last modified July 8, 2015, http://www.eia.gov/electricity/state/districtofcolumbia/. 72 “District of Columbia Municipal Aggregation Program,” DOEE, http://green.dc.gov/dcmap. 73 “District of Columbia State Profile and Energy Estimates,” EIA, Last modified July 16, 2015, http://www.eia.gov/state/?sid=DC. 74 Ibid. 75 “Natural Gas Prices,” EIA, Last modified August 31, 2015, http://www.eia.gov/dnav/ng/ng_pri_sum_dcu_SDC_a.htm 76 “Greenhouse Gas Emissions Inventory - 2006 to 2011 Fact Sheet,” DOEE, Last modified December 4, 2012, http://green.dc.gov/node/384852. 77 Ibid. 78 Ibid. 79 “Formal Case No.1130, in the Matter of the Investigation into Modernizing the Energy Delivery System for Increased Sustainability,” District of Columbia Public Service Commission, August 10, 2015, http://dcpsc.org/edocket/docketsheets_pdf_FS.asp?caseno=FC1130&docketno=2&flag=D&show_result=Y. 80 “About DOEE,” DOEE, http://green.dc.gov/page/about-doee. 81 “Clean and Affordable Energy Act of 2008,” Last modified October 11, 2011, http://doee.dc.gov/node/7862. 82 “About the DC SEU,” DC SEU, https://www.DC SEU.com/about-DC SEU. 83 “Sustainable DC Plan,” Sustainable DC, 2012, http://sustainable.dc.gov/sites/default/files/dc/sites/sustainable/page_content/attachments/DCS-008%20Report%20508.3j.pdf 84 Renewable Portfolio Standard Expansion Amendment Act of 2016. , DC Act Number A21-0466, signed July 25, 2016. 85 “Solar Renewable Energy Credits,” DSIRE, Last modified April 27, 2015, http://programs.dsireusa.org/system/program/detail/5686. 86 Green Power Markets, Renewable Energy Credits, Department of Energy, http://apps3.eere.energy.gov/greenpower/markets/certificates.shtml?page=5. 87 “Net Metering,” DSIRE, Last modified April 6, 2015, http://programs.dsireusa.org/system/program/detail/105. 88 “Green Building Act of 2006,” October 11, 2011, http://doee.dc.gov/publication/green-building-act-2006 89 “Sustainable DC Mayor’s Order - Building Energy Performance Standards Task Force,” DGS, December 10, 2014, http://www.sustainabledc.org/wp-content/uploads/2014/12/10-Building-Energy-Performance-Standards.pdf. 90 “Green Building Report 2007-2011,” DOEE, http://doee.dc.gov/sites/default/files/dc/sites/ddoe/publication/attachments/20120501_Green%20Building%20Report_FINAL.pdf. 91 “Energy Efficiency Financing,” DOEE, Last modified October 11, 2011, http://green.dc.gov/publication/energy-efficiency-financing. 92 “Sustainable DC Act,” Sustainable DC, http://sustainable.dc.gov/page/sustainable-dc-act.

101
93 “Green Building - 2013 DC Energy Conservation Code (ECC),” Department of Consumer and Regulatory Affairs, http://dcra.dc.gov/page/green-building-2013-dc-energy-conservation-code-ecc. 94 “International Energy Conservation Code,” Last accessed August 19, 2015, http://publicecodes.cyberregs.com/icod/iecc/2012/index.htm?bu=IC-P-2012-000014&bu2=IC-P-2012-000019. 95 “12-I Energy Conservation Code Supplement,” Last modified, March 28, 2014, http://www.dcregs.dc.gov/Gateway/NoticeHome.aspx?noticeid=4810150. 96 “International Green Construction Code,” Last accessed August 19, 2015, http://publicecodes.cyberregs.com/icod/igcc/2012/index.htm?bu=IC-P-2012-000023&bu2=IC-P-2012-000019. 97 “12-K Green Construction Code Supplement,” Last modified, March 28, 2014, http://dcra.dc.gov/page/green-construction-code. 98 Ibid. 99 “Street width to control building height; business streets; residence streets; specified properties; structures above top story of building.” DC Code §6-601.05, http://dccode.org/simple/sections/6-601.05.html. 100 “Net Zero and Living Building Challenge Financial Study,” DOEE, September 30, 2013, http://doee.dc.gov/sites/default/files/dc/sites/ddoe/publication/attachments/20140411_Net%20%20Zero%20and%20Living%20Building%20Challenge%20Study_FINAL.pdf. 101 “Declaration and purposes,” DC Code §6-1101 http://dccode.org/simple/sections/6-1101.html. 102 “The National Historic Preservation Act of 1966, As Amended,” Last modified April 19, 2015, http://www.achp.gov/nhpa.html. 103 “Sustainable DC Plan,” Sustainable DC, 2012. http://sustainable.dc.gov/sites/default/files/dc/sites/sustainable/page_content/attachments/DCS-008%20Report%20508.3j.pdf 104 “DIY Home Energy Audit,” DOEE, http://ddoe.dc.gov/node/9472. 105 Ibid. 106 “Discounts on Your Utility Bills,” DOEE, http://doee.dc.gov/udp. 107 “Weatherization Assistance Program,” DOEE, http://ddoe.dc.gov/service/weatherization-assistance-program. 108 “For my home – Appliances” DC SEU, https://www.DC SEU.com/for-my-home/appliances. 109 “Home energy audits” DC SEU, https://www.DC SEU.com/for-my-home/audits-air-sealing-insulation/audits. 110 “New Construction and Major Rehabilitation” DC SEU, https://www.DC SEU.com/for-my-business/multifamily-housing/new-construction-and-major-rehabilitation. 111 “Energy Efficiency Product Installation,” DC SEU, https://www.DCSEU.com/for-my-business/multifamily-housing/product-installation. 112 “Terms and Conditions,” DC SEU, https://www.DC SEU.com/for-my-business/standard-rebates/terms-and-conditions; “Efficient Equipment,” DC SEU, https://www.DCSEU.com/for-my-business/multifamily-housing/efficient-equipment. 113 “Custom Rebates,” DC SEU, https://www.DC SEU.com/for-my-business/custom-rebates/how-to-apply 114 “Affordable Solar,” DCSEU, https://www.dcseu.com/for-my-home/affordable-solar