district irrigation plan kangra himachal pradesh 2015 … · 1 | p a g e district irrigation plan...
TRANSCRIPT

0 | P a g e
DISTRICT IRRIGATION PLAN KANGRA
HIMACHAL PRADESH 2015-2020
NABARD CONSULTANCY SERVICES PVT. LTD

1 | P a g e
District Irrigation Plan
Kangra
Himachal Pradesh
2015-2020
NABARD CONSULTANCY SERVICES PVT. LTD.
Corporate Office : 24, Rajendra Place, NABARD Building, New Delhi – 110125
Reg. Office : Plot No. C24, G Block, 3rd Floor, NABARD Building
Bandra Kurla Complex, Bandra East, Mumbai-400051

1 | P a g e
Foreword
Water is of vital importance for human & animal life, for maintaining ecological balance and for
developmental efforts. With the ever increasing demand for water due to population growth, urbanization and
industrialization, making water available for multiple uses, planning and management of water resources and
utilization of water economically, optimally and equitably assume greater significance. Government of India
formulated PMKSY with the vision of extending the coverage of irrigation (Har Khet ko Pani) and improving
water use efficiency (More Crop per Drop) in a focused manner with end to end solution on water resource
creation, distribution, management, field application and extension activities. Under PMKSY an integrated
planning and management of water resources, through estimation of water budget for each of the district and
sub district and preparation of strategic action plan to address the water gap through District Irrigation Plan
(DIP) was envisaged.
PMKSY will be implemented in area development mode only by adopting a ‘decentralized State level
planning and projectised execution’ structure that will allow States to draw up their own irrigation
development plans based on DIPs and SIPs with a horizon of 5-7 years. A three tier structure at national, state
and district level will oversee implementation and coordination of the PMKSY. The DLIC will be chaired by
the Deputy Commissioner, Kangra and will comprise of the Departments of Agriculture, Horticulture, District
Rural Development Agency (DRDA), Irrigation and public Health Department, Forest Department, Lead bank
of the district and any other line Departments in the District. The DLIC will oversee the implementation and
inter- departmental coordination at district level.
District Irrigation Plan is prepared based on an assessment of water resource availability and demand for water
resource from multiple uses. Water Balance at district and sub district level is obtained by estimating
availability of surface and ground water resource using hydro geological and meteorological information and
estimating demand for water resource from domestic use, animal husbandry, Irrigation purpose, industrial
purpose and power generation purpose. Based on the above information, present and future water balance at
block and district level is estimated along with multiple strategic Action Plan under PMKSY in Kangra
District.
District Irrigation Plan (DIP) preparation required coordinated efforts by multiple stakeholder and department.
The efforts made by the Departments of Agriculture, which is the Nodal Department for implementation of
PMKSY, Irrigation and public Health Department, Horticulture Department, District Rural Development
Agency (DRDA), other line department in the district and support received from NABARD Consultancy
Services (NABCONS) in preparation of the district Irrigation Plan of Kangra is acknowledged. I am not only
Hopeful but also confident that the District Irrigation Plan (DIP) of Kangra, 2016-20 helps District Level
Implementation Committee (DLIC) and nodal department in addressing the multiple challenges of water
resource planning and management in the district.

2 | P a g e
Table of Contents
Introduction ................................................................................................................................................................ 16
1. Background .................................................................................................................................................... 16
2. Vision ............................................................................................................................................................. 22
3. Objective ........................................................................................................................................................ 22
4. Strategy/approach .......................................................................................................................................... 22
5. Programme Components................................................................................................................................ 23
6. Rationale/ Justification .................................................................................................................................. 25
7. Methodology .................................................................................................................................................. 26
Chapter I ..................................................................................................................................................................... 27
General Information of the District ............................................................................................................................ 27
1.1 District Profile ........................................................................................................................................... 27
1.1.1 Administrative set up of Kangra ............................................................................................................ 28
1.1.2 Towns and Villages ................................................................................................................................... 30
1.2 Demography .............................................................................................................................................. 31
1.3 Biomass and Livestock .............................................................................................................................. 34
1.4 Agro-Ecology, Climate, Hydrology and Topography ............................................................................... 37
1.5 Soil Profile: Major Soil Classes and Land Slope Classification ................................................................ 44
1.6 Soil Erosion and Runoff Status.................................................................................................................. 47
1.7 Land Use Pattern ....................................................................................................................................... 48
Chapter II ................................................................................................................................................................... 55
District Water Profile ................................................................................................................................................. 55
2.1 Crop water Requirement ............................................................................................................................ 55
2.2 Production and Productivity of Major Crops ............................................................................................. 58
2.3 Irrigation based classification .................................................................................................................... 60
Chapter III .................................................................................................................................................................. 63
District Water Availability ......................................................................................................................................... 63
3.1 Status of Water Availability ...................................................................................................................... 63
3.2 Ground Water Resources ........................................................................................................................... 65
3.3 Status of Command Area ........................................................................................................................... 70
3.4 Existing Type of Irrigation ........................................................................................................................ 72
Chapter IV .................................................................................................................................................................. 75
Water Demand............................................................................................................................................................ 75
4.1 Domestic Water demand ........................................................................................................................... 75
4.2 Crop Water Requirement ........................................................................................................................... 77

3 | P a g e
4.3 Water demand for Livestock ..................................................................................................................... 79
4.4 Industrial Water Requirement.................................................................................................................... 82
4.5 Water Demand for Power Generation ....................................................................................................... 83
4.6 Total Water Demand of the district for various sectors .................................................................................... 84
4.7 Water Budget ............................................................................................................................................. 86
Chapter V ................................................................................................................................................................... 89
Strategic Action Plan for Irrigation in District under PMKSY .................................................................................. 89
5.1 Block wise total Plan of the district ........................................................................................................... 89
5.2 Component wise Plan ................................................................................................................................ 93
5.3 Year Wise Plan .......................................................................................................................................... 95
5.3 Action plan based on Member of Parliament Local Area Development Schemes (MPLAD) .................. 96
5.4 Expected Outcome ..................................................................................................................................... 97
5.5 Suggestions ................................................................................................................................................ 99
5.6 Strategic Action Plan for irrigation in respect of District Kangra, HP under Pradhan Mantri Krishi Sinchayee
Yojna (PMKSY) ................................................................................................................................................... 100
Annexure .................................................................................................................................................................. 160

4 | P a g e
List of Tables
Table 1. 1: District Profile of Kangra ........................................................................................................... 28
Table 1.2. 1: Demography of Kangra district ............................................................................................... 31
Table 1.2. 2: Block-wise SC, ST and General Household population ......................................................... 32
Table 1.3. 1: Biomass and livestock in Kangra district (Small Animals) ..................................................... 34
Table 1.3. 2: Biomass and livestock in Kangra district (Large Animals) ..................................................... 36
Table 1.4. 1: Agro-Ecology, Climate, Hydrology and Topography ............................................................. 40
Table 1.4. 2: Rainfall Pattern with different observatory situated in Kangra district ................................... 41
Table 1.4. 3: Temperature Pattern for different observatory stations in the state......................................... 42
Table 1.5. 1: Major Soil Classification in the Kangra district ...................................................................... 44
Table 1.5. 2: Tehsil-wise area under different land slope category .............................................................. 47
Table 1.7. 1: Land Use Pattern with area under cultivation ......................................................................... 48
Table 1.7. 2: Land Use Pattern with area under non-cultivation .................................................................. 49
Table 2.1. 1: Block-wise crop area ............................................................................................................... 56
Table 2.1. 2: Area under Horticulture .......................................................................................................... 57
Table 2.2. 1: Production (Qtl./annum) and Productivity (Kg./ha.) ............................................................... 59
Table 2.3. 1: Irrigation based Classification ................................................................................................. 60
Table 3.2. 1: Indora valley ground water status ........................................................................................... 65
Table 3.2. 2: Nurpur valley ground water status .......................................................................................... 66
Table 3.2. 3: Block-wise Ground Water Status ............................................................................................ 66
Table 3.2. 4: Block-wise data on Annual Draft, Recharge and Gap of ground water .................................. 67
Table 3.3. 1: Developed and Undeveloped area under Canal Command and other services command....... 71
Table 4.1. 1: Domestic Water requirement .................................................................................................. 75
Table 4.2. 1: Water requirement of crops (Assumption table) ..................................................................... 77
Table 4.2. 2: Crop Water Requirement ........................................................................................................ 77
Table 4.3. 1: Livestock Growth assumption table ........................................................................................ 79
Table 4.3. 2: Water requirement assumption table for livestock in litre/day................................................ 80
Table 4.3. 3: Water requirement for livestock .............................................................................................. 80
Table 4.4. 1: Industrial Water demand ......................................................................................................... 83
Table 4.6. 1: Sector wise water demand for the year 2015 .......................................................................... 84
Table 4.6. 2: Sector wise water demand for the Projected Year 2020 (MCM) ............................................ 85
Table 4.7. 1: Water Budget (MCM) ............................................................................................................. 87
Table 5.1. 1: Year wise Plan of different departments (Rs. Lakhs).............................................................. 89
Table 5.2. 1: Component wise Plan .............................................................................................................. 94
Table 5.3. 1: Year wise distribution of total outlay ...................................................................................... 96
5 | P a g e
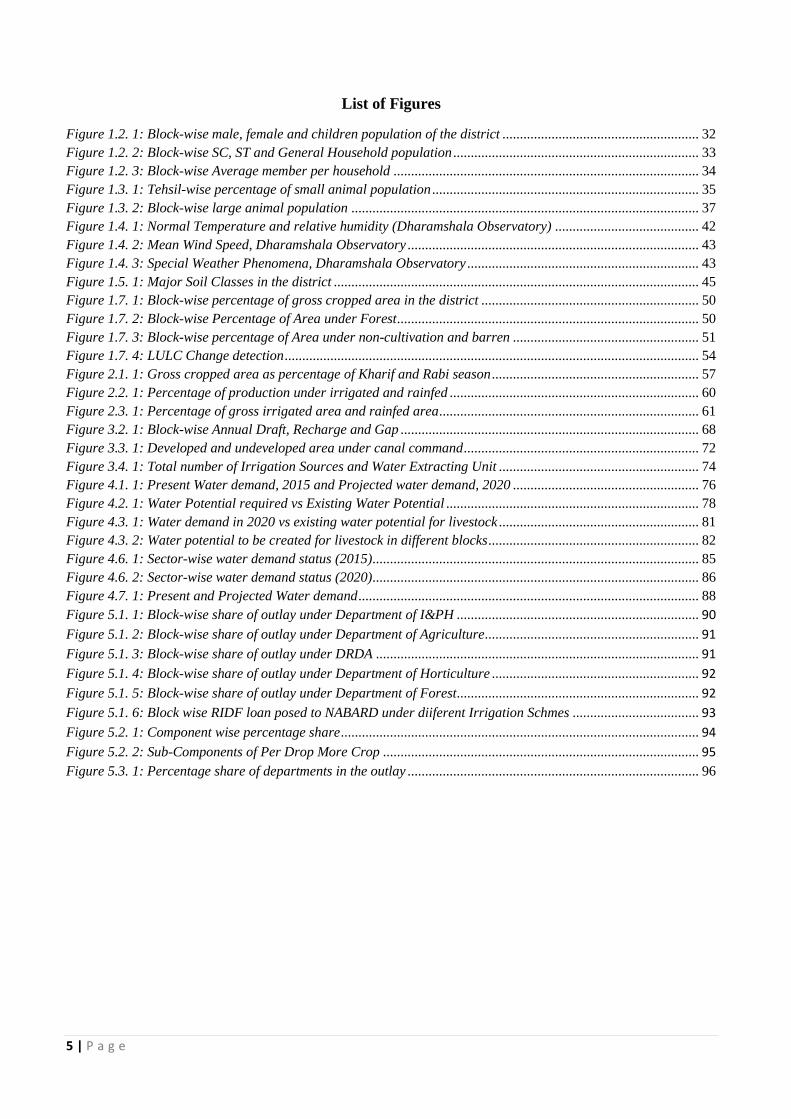
List of Figures
Figure 1.2. 1: Block-wise male, female and children population of the district ........................................................ 32
Figure 1.2. 2: Block-wise SC, ST and General Household population ...................................................................... 33
Figure 1.2. 3: Block-wise Average member per household ....................................................................................... 34
Figure 1.3. 1: Tehsil-wise percentage of small animal population ............................................................................ 35
Figure 1.3. 2: Block-wise large animal population ................................................................................................... 37
Figure 1.4. 1: Normal Temperature and relative humidity (Dharamshala Observatory) ......................................... 42
Figure 1.4. 2: Mean Wind Speed, Dharamshala Observatory ................................................................................... 43
Figure 1.4. 3: Special Weather Phenomena, Dharamshala Observatory .................................................................. 43
Figure 1.5. 1: Major Soil Classes in the district ........................................................................................................ 45
Figure 1.7. 1: Block-wise percentage of gross cropped area in the district .............................................................. 50
Figure 1.7. 2: Block-wise Percentage of Area under Forest ...................................................................................... 50
Figure 1.7. 3: Block-wise percentage of Area under non-cultivation and barren ..................................................... 51
Figure 1.7. 4: LULC Change detection ...................................................................................................................... 54
Figure 2.1. 1: Gross cropped area as percentage of Kharif and Rabi season ........................................................... 57
Figure 2.2. 1: Percentage of production under irrigated and rainfed ....................................................................... 60
Figure 2.3. 1: Percentage of gross irrigated area and rainfed area .......................................................................... 61
Figure 3.2. 1: Block-wise Annual Draft, Recharge and Gap ..................................................................................... 68
Figure 3.3. 1: Developed and undeveloped area under canal command ................................................................... 72
Figure 3.4. 1: Total number of Irrigation Sources and Water Extracting Unit ......................................................... 74
Figure 4.1. 1: Present Water demand, 2015 and Projected water demand, 2020 ..................................................... 76
Figure 4.2. 1: Water Potential required vs Existing Water Potential ........................................................................ 78
Figure 4.3. 1: Water demand in 2020 vs existing water potential for livestock ......................................................... 81
Figure 4.3. 2: Water potential to be created for livestock in different blocks ............................................................ 82
Figure 4.6. 1: Sector-wise water demand status (2015) ............................................................................................. 85
Figure 4.6. 2: Sector-wise water demand status (2020) ............................................................................................. 86
Figure 4.7. 1: Present and Projected Water demand ................................................................................................. 88
Figure 5.1. 1: Block-wise share of outlay under Department of I&PH ..................................................................... 90
Figure 5.1. 2: Block-wise share of outlay under Department of Agriculture ............................................................. 91
Figure 5.1. 3: Block-wise share of outlay under DRDA ............................................................................................ 91
Figure 5.1. 4: Block-wise share of outlay under Department of Horticulture ........................................................... 92
Figure 5.1. 5: Block-wise share of outlay under Department of Forest ..................................................................... 92
Figure 5.1. 6: Block wise RIDF loan posed to NABARD under diiferent Irrigation Schmes .................................... 93
Figure 5.2. 1: Component wise percentage share ...................................................................................................... 94
Figure 5.2. 2: Sub-Components of Per Drop More Crop .......................................................................................... 95
Figure 5.3. 1: Percentage share of departments in the outlay ................................................................................... 96

6 | P a g e
List of Maps
Map 1: Kangra District Map ........................................................................................................................ 27
Map 2: Major Soil Classes ........................................................................................................................... 46
Map 3: LULC Map Kangra district, 2002 .................................................................................................... 52
Map 4: LULC Map of Kangra district, 2015 ................................................................................................ 53
Map 5: Ground Water Level, 2012 .............................................................................................................. 65
Map 6: Artificial recharge scheme for Kangra ............................................................................................. 69
Map 7: Pre-Monsoon drainage in Kangra district ........................................................................................ 70
Map 8: Post Monsoon drainage map, Kangra district .................................................................................. 71

7 | P a g e
Abbreviations
NDC : National Development Council
GoI : Government of India
C-DAP : Comprehensive District Agriculture Plan
ICT : information and communications technology
BCM : Billion Cubic Metres
GDP : Gross Domestic Product
AIBP : Accelerated Irrigation Benefits Programme
CADWM : Command Area Development and Water Management
MI : Micro Irrigation
SWMA : Supplementary Water Management Activities
NITI Aayog : National Institution for Transforming India Aayog
NRM : Natural resource Management
IWMP : Integrated Watershed Management Programme
PRI : Panchayati Raj Institutions
DRDA : District Rural Development Agencies
NRLM : National Rural Livelihoods Mission
C.D. Blocks : Community development block
BPL : Below Poverty Line
SC/ST : Scheduled Caste/ Scheduled Tribe
Nos. : Number
ATMA : Agriculture Technology Management Agency
MSL : Mean Sea Level
mm : Millimeter
ha : Hectare
TGA : Total Geographical Area
GCA : Gross Cropped Area
GIA : Gross Irrigated Area
NSA : Net Sown Area

8 | P a g e
AIBP : Accelerated Irrigation Benefits Programme
MGNREGA : Mahatma Gandhi National Rural Employment Gurantee Act
CI : Cropping Intensity
LULC : Land Use/Land Cover
kg/ha : Kilogram per hectare
Qtl/yr : Quintal per year
GIA : Gross Irrigated Area
MCM : million cubic metres
Bgl : Below ground Level
μS/cm : micro-Siemens per centimeter
mg/l : milligrams/liter
ha.m : hectare meter
I&PH : Irrigation and Public Health Department
CCA : Culturable Command Area
LPD : Liter Per Day
SSI : Small Scale Industries
CAD : Command Area Development
NABARD : National Bank for Agriculture and Rural Development
RIDF : Rural Infrastructure Development Fund
GoHP : Government of Himachal Pradesh
DIP : District Irrigation Plan
SIP : State Irrigation Plan
DLIC : District Level Implementation Committee
STP : Sewage Treatment Plant
MCM : Million Cubic Metres
GIS : Geographic Information System
MIS : Management Information System
NHH : Number of Household
NM : Number of Member

9 | P a g e
Executive Summary
Out of about 141 million ha of net area sown of the country, only 65 million hectare (46%) is
currently covered under irrigation. Substantial dependence on rainfall makes cultivation in remaining
areas a high risk and less productive profession. Empirical evidences suggest that assured/protective
irrigation/in-situ moisture conservation encourages farmers to invest more in farming technology and
inputs leading to productivity enhancement and increased farm income. Government has conceived
the Pradhan Mantri Krishi Sinchayee Yojana (PMKSY) with the objective of extending the coverage
of irrigation in a focused manner, with end-to-end solution on source creation, distribution,
management, field application and extension activities.
Further, Pradhan Mantri Krishi Sinchayee Yojana incentivizes states to enhance expenditures
on irrigation and water resources management by making the access to PMKSY funds to states
conditional i.e., state will have access only if the expenditure in water resource development for
agriculture sector in the year under consideration is not less than the baseline expenditure, which is
defined as the average of the expenditure in irrigation sector irrespective of the department in the
state plan in three years prior to the year under consideration.
PMKSY will be implemented in area development mode only by adopting a ‘decentralized
state level planning and projectised execution’ structure that will allow states to draw up their own
irrigation development plans based on DIPs and SIPs with a horizon of 5-7 years. A three tier
structure at national, state and district level will oversee implementation and coordination of the
program. The District Level Implementation Committee will form the third tier of the PMKSY. The
DLIC will be chaired by the Deputy Commissioner, Kangra and comprises of the Department of
Agriculture, Horticulture, District Rural Development Agency (DRDA), Irrigation and Public Health
Department, Forest Department, Lead bank of the District and any other line Departments in the
District. The DLIC will oversee the implementation and inter-departmental coordination at district
level.
District Water Profile
The population of Kangra district is predominantly dependent on agriculture and allied
activities for their livelihood. The gross cropped area in the district is 2,45,579 ha (2,07,140 ha is
under agricultural crops and 38,439 ha is under horticultural crops). About 1,06,850 ha of the area
under crop is grown under kharif season while 1,00,290 ha. of crop area is under rabi season. Cereals
are the major agricultural crops grown in the district with an area covering of about 64.11 percent of

10 | P a g e
the total area under various agricultural crops. Wheat and paddy are the major cereals in the district.
Under coarse cereal, maize and barley are grown in almost every part of the district. It covers an area
of 28.24 percent of the total area under various agricultural crops. Whereas, maize is majorily grown
as kharif crop, barley is grown as rabi crops. Thus, 92 percent of the total area under various crops is
majorily shared under cereals and coarse cereals crops. The rest 7 percent of the total area under
agricultural crops is shared among oilseeds, pulses and other vegetable crops. Mash, moong, lentil
and gram are major pulses grown in the district. Sesamum and Mustard are the major oilseeds of the
district. Under vegetables, potato is grown all the year round along with other vegetables like tomato,
capsicum, cabbage and cauliflower. Some exotic varities of vegetables like Capsicum (Red and
Green), Asparagus, Broccoli, etc. Nearly 50 per cent of the area under Kharif is irrigated while it is
45 per cent under Rabi. Considering the topography of Kangra, where land is a inelastic resource
increasing the irrigation potential further is the key to increasing the production and productivity of
crops.
Crop Diversification
In Kangra there are four major objectives of agricultural diversification. First to increase the
income of the small households, second to attain the fuller employment in the farm household, third
to stabilize the farm income over the seasons, and fourth conservation and enhancement of natural
resources specially irrigation sources. Irrigation plays a decisive role in cropping pattern, cropping
intensity, crop combinations, the extent of yield and to a certain extent the season of sowing. This
process ensures that farmer receive decent income while the existing food grain production takes care
of the food security needs of the households. In Kangra district, about 55 percent of the area lies
under rainfed cultivation while only 45 percent of the total gross cropped area has irrigation facilities.
The majority of the farmers in the district are engaged in traditional cultivation of food grains (92%
of the area under agricultural crops is grown under cereals and millets), not being able to divert to
more profitable commodities such as vegetables and fruits. In order to boost the agricultural
development and enhance the farm income in the rural areas, it is therefore important to increase the
productivity of the existing cultivated area, through shifting from self-subsistence crop cultivation to
diversified agriculture, by adopting cash crops such as vegetables cultivation suitable in hilly and
highland areas and the same can be achieved by providing assured irrigation sources all the year
round to different parts of the district.

11 | P a g e
Yield per Hectare of Major Crops
The yield levels of major crops in the district are higher in irrigated conditions than under
rainfed conditions. The average yield of the agricultural crops in rainfed condition was found to be
2166 kg/ha. while under irrigated condition it was found to be 2814 kg/ha. Further, the absolute
levels of yields reported in the district are slightly lesser than the state average yields or potential
yields as per the package of practices recommended by the state agricultural university. By enhancing
the water resources availability for irrigation purpose through rainwater harvesting, soil & water
conservation measures, the productivity of crops can be enhanced further and the more areas can be
brought under assured irrigation, thus enhancing the overall farm production and hence the farm
income for various crops.
Availability of water sources
The district falls under sub-mountain and low hills, sub-tropical zone. The district receives
rainfall in four pattern i.e., from the month of June till September with an annual rainfall of 1216 mm
received as South West monsoon and from the month of October till December received as North
East Monsoon with an annual rainfall of 54.4 mm, from the month of January to February received as
winter rain with an average rainfall of 127 mm and from the month of March to May as summer rain
with an average rainfall of 143 mm. The average annual rainfall in the district is 1852 mm. The Beas
River forms the major drainage system in the district. The river Beas and its tributaries drain almost
the entire district, except the north eastern part which is drained by the river Ravi. The stage of
ground water development in Indora and Nurpur valley in Kangra district is 50.0 percent and 39.55
percent respectively, and falls under “Safe” category. There is thus a scope for further ground water
development. In the district, all the major irrigation and drinking water supplies depend on the tube
wells.
Existing Type of Irrigation
The major sources of irrigation are small water channels or the Kuhls in the district. A part of
the cultivated area of the district is not having any assured irrigation facilities and the agriculturists
have to depend on the vagaries of weather. Rainfall is the major source of groundwater recharge,
apart from the influent seepage from the rivers, irrigated fields and inflow from upland areas,
whereas discharge from ground water mainly takes place from wells and tube wells. The district
being hilly and mountainous with few valleys, the need, however is to support shallow depth bore
wells, fitted with hand pumps. The entire hilly area of the district is feasible for only drilling shallow
to medium depth bore wells. The estimation of annual draft and recharge in the district shows that
about 0.04947 MCM of gap exists in the district. The annual draft of ground water takes place in
12 | P a g e
terms of extraction through dug wells, hand pumps, tube-wells, bowries. The springs are the major
sources of water supply to both rural and urban areas, but the availability of water during summer is
limited, particularly in drought years and requires immediate attention to augment this resource.
Based upon the climatic conditions, topography, hydro-geology of the area, suitable structures for
rain water harvesting and artificial recharge to ground water are required. Roof top rainwater
harvesting need to be adopted in urban areas and proper scientific intervention for spring
development and revival is required in water scarce areas.
Kuhl system is the major irrigation system in the district, and the water users associations can
be developed at various places. In order to, ensure predictable, equitable and reliable distribution of
water, their needs to be sensitisation amidst users about people participation in ensuring predictable
supply of water in the Kuhl and technological interventions like ensuring sufficient storage capacity
to the Kuhl and making head-works of two or three contiguous networks common to reduce
maintenance cost for users.
Demand for water sources
The present water demand of the district has been assessed to be 338.54 MCM annually. Out
of the total water demand, 284.42 MCM (84.02 per cent) is the required for crop production. Nearly
42.87 MCM is required for domestic and drinking purposes (12.66 per cent) and another 9.32 MCM
(2.75 per cent) is required for livestock water requirement purpose. The water requirement for
industries is 1.92 MCM (0.57 per cent). Among the blocks, Indora has highest water requirement
with 36.48 MCM (10.77 per cent), followed by Nurpur with 29.98 MCM (8.86 per cent).
Water budget in the district
The water budget shows wide gaps between water availability and water demand in the
district. While the availability at present is 280.18 MCM, the present water demand is 338.54 MCM,
thus exceeding the given water availability in the district. It is also projected that with growth in
urbanisation and subsequent growth in food grain requirement the water demand is likely to increase
to 341.83 MCM by the year 2020 leaving an unmet demand of 61.64 MCM which needs to be further
addressed. The water budget analysis suggest that urgent efforts are required to meet the water
requirements of the district as the gap is likely to increase in future. Utilizing the surface & ground
water potential in the district, activities that promote ground water re-charge and soil moisture and
water conservation etc. are proposed in the Strategic Action plan, 2016-20 that will address the
challenge. The scope to tap ground water in the district is feasible as the district falls in safe category.

13 | P a g e
Component wise planned coverage of area
The strategic action plan envisages providing assured irrigation in a command area of
1,70,474.70 ha. Under AIBP about 11920 ha will be covered under the ongoing schemes. The Har
Khet Ko Pani will develop a command area of 57754 ha. with irrigation potential.The watershed
component is projected to achieve a culturable command area of 94,299 ha by creation of 9337 new
water harvesting structures, renovation of 555 water harvesting structures. Under, the component Per
Drop More Crop, 6501 ha of area with efficient water conveyance and precision water application by
drip irrigation system for wide spaced crop for developing an area of 194.5 ha, and drip irrigation
system for narrow spaced crop for developing an area 33 ha has been proposed. Micro and Mini
Sprinklers, to develop an area of 50 ha and 313 ha has also been on the list. Secondary storage
structures like water storage tanks and bore-wells for the development of 364 ha and 218 ha has been
proposed. A training programme will also be scheduled under PMKSY to enhance the better
knowledge of efficient use of water through drip and other micro irrigation structures.
Department wise planned coverage of area
Rural Development Department will provide irrigation infrastructure for a command area of
94,299 ha (55.32 per cent), followed by Irrigation and Public Health Department which will cover
64,726.23 ha or 37.97 per cent of planned coverage of area followed by intervention of Agriculture
Department under Soil Conservation Department having a coverage area of 9096.30 ha or 5.34 per
cent. Under Agriculture Department, 9096.30ha. and 5184.70 ha. has been proposed to be developed
under Har Khet Ko Pani and Per Drop More Crop component, respectively. The Horticulture and
Forestry Department will ensure precision water application in an area of 1367.5 ha and 506.07 ha
respectively. The command area to be developed under Forest Department does not create any
irrigation potential but the various activities proposed under it will ensure ground water recharge.
Block wise planned financial outlay
The block wise distribution of budget is given in table 5.1.1 for the year 2016-2020. Out of
total outlay for the district Dehra Gopipur block has the maximum allocation of Rs.47558.65 lakhs or
21.95 per cent, followed by Indora with allocation of Rs.45360.61 lakhs (20.94 per cent) and Nurpur
with Rs.28246.69 lakhs (13.04 per cent).
Component wise planned financial outlay
The component wise plan for four years, starting from 2016-17 to 2019-20 is indicated in the
table 5.2.1. The schemes under AIBP component is to be executed mainly by Irrigation and Public
14 | P a g e
Health Department. Similarly, the schemes under Har Khet Ko Pani component is to be executed by
both Irrigation and Public Health Department, Department of Agriculture and Department of Forest.
Further, the schemes under Per Drop More Crop component is to be executed by Horticulture
Department. Watershed component will be taken care of by Rural Development Department and
extension & training component will be executed by ATMA under the aegis of Agriculture
Department. The loan posed to NABARD for consideration under RIDF by GoHP is to be considered
under Har Khet Ko Pani. An amount of Rs.5,884.13 lakhs for consideration under RIDF by GoHP
and an amount of Rs.9,050.11 lakhs are to considered for sanctioning under various tranches of RIDF
with phasing between 2016-17 to 2019-20 under outlay proposed under NABARD. However, all the
stakeholders need to have coordination among them to achieve maximum irrigation efficiency and to
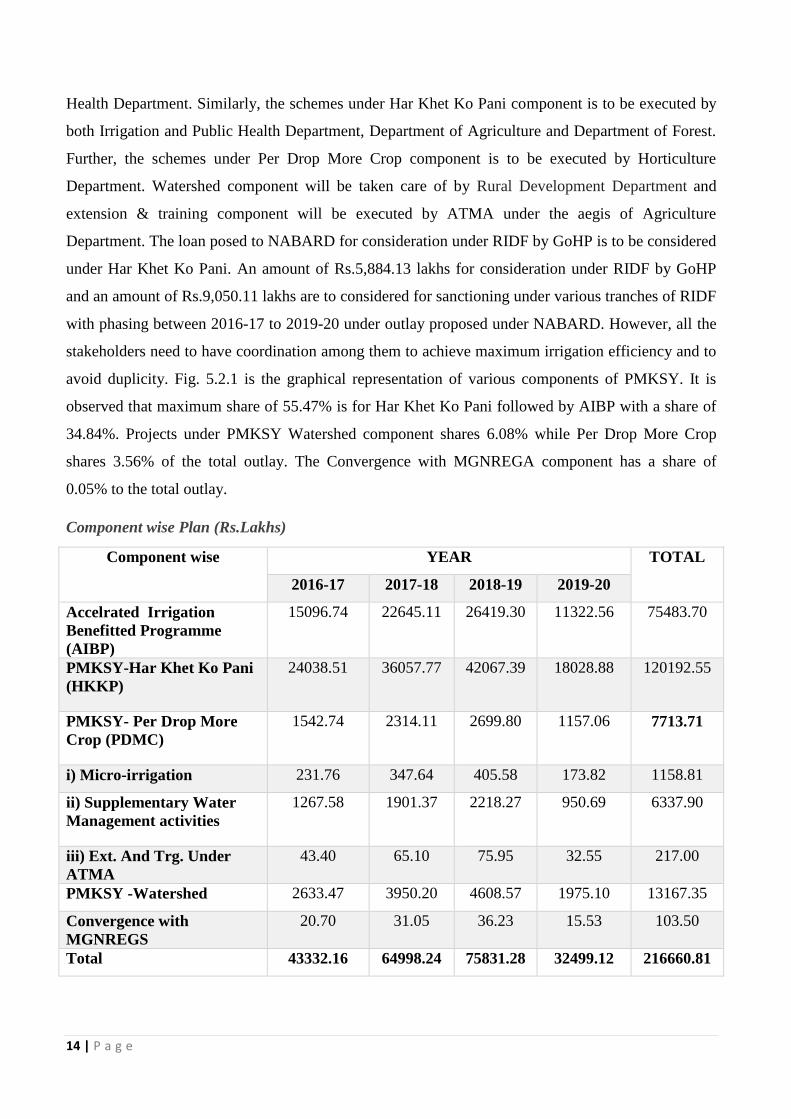
avoid duplicity. Fig. 5.2.1 is the graphical representation of various components of PMKSY. It is
observed that maximum share of 55.47% is for Har Khet Ko Pani followed by AIBP with a share of
34.84%. Projects under PMKSY Watershed component shares 6.08% while Per Drop More Crop
shares 3.56% of the total outlay. The Convergence with MGNREGA component has a share of
0.05% to the total outlay.
Component wise Plan (Rs.Lakhs)
Component wise YEAR TOTAL
2016-17 2017-18 2018-19 2019-20
Accelrated Irrigation
Benefitted Programme
(AIBP)
15096.74 22645.11 26419.30 11322.56 75483.70
PMKSY-Har Khet Ko Pani
(HKKP)
24038.51 36057.77 42067.39 18028.88 120192.55
PMKSY- Per Drop More
Crop (PDMC)
1542.74 2314.11 2699.80 1157.06 7713.71
i) Micro-irrigation 231.76 347.64 405.58 173.82 1158.81
ii) Supplementary Water
Management activities
1267.58 1901.37 2218.27 950.69 6337.90
iii) Ext. And Trg. Under
ATMA
43.40 65.10 75.95 32.55 217.00
PMKSY -Watershed 2633.47 3950.20 4608.57 1975.10 13167.35
Convergence with
MGNREGS
20.70 31.05 36.23 15.53 103.50
Total 43332.16 64998.24 75831.28 32499.12 216660.81

15 | P a g e
Further Per Drop More Crop has been divevided into three sub components which are:
Micro-Irrigation Schemes (15.00%)
Supplementary Water Management Activities (82.20%)
Extension and Training under ATMA (2.80%)
Implementation Time Period
The planned activities and outlay will be spent between 2016-17 and 2019-20 period. Some of
the activities may require 5 to 7 years and some other activities relating to extension, small irrigation
works etc., are recurring and hence will have a period of implementation less than a year.
Monitoring and evaluation
The Strategic Action Plan of PMKSY will be monitored by the respective departments
through the regular reporting system and component wise progress will be monitored by the District
Level Irrigation Committee. Further, the activities, outputs and outcomes will be reported in web
based MIS of PMKSY for review at state and national level.
Expected Outcome
The strategic action plan envisages providing assured irrigation in a command area of
1,70,474.70 ha. Under AIBP about 11920 ha will be covered under the ongoing schemes. The Har
Khet Ko Pani will develop a command area of 57754 ha. with irrigation potential.The watershed
component is projected to achieve a culturable command area of 94,299 ha by creation of 9337 new
water harvesting structures, renovation of 555 water harvesting structures. Under, the component Per
Drop More Crop, 6501 ha of area with efficient water conveyance and precision water application by
drip irrigation system for wide spaced crop for developing an area of 194.5 ha, and drip irrigation
system for narrow spaced crop for developing an area 33 ha has been proposed. Micro and Mini
Sprinklers, to develop an area of 50 ha and 313 ha has also been on the list. Secondary storage
structures like water storage tanks and bore-wells for the development of 364 ha and 218 ha has been
proposed. The various interventions proposed under Per Drop More Crop will result in creation of
water potential to the tune of 3653165 cum in the district in the period of five years. On completion
of these projects, it is expected that an additional irrigation potential of approximately 314 ha will be
created due to saving of water. This is likely to generate an additional income of Rs.40,913.93 lakh to
the farmers of the district. This is based on the assumption of atleast 60% of potential utilised and Rs.
40,000 per ha incremental income from rainfed to irrigated farming. This is also likely to create
152.58 lakh mandays of non-recurring employment and 85,237 jobs annually on recurring basis.

16 | P a g e
Introduction
1. Background Preparation of decentralized area specific district planning process visualized in
various plans took concrete shape through the years and initiatives like specific guidelines on
methodologies and processes for preparation of district plans; framework for preparation of
perspective plan, medium term and annual plans by then planning commission in 1969 and
the 73rd and 74th constitutional amendments conferring constitutional status to panchayats at
district and sub district level; local self-government in urban areas; constitution of district
planning committee to consolidate the plans prepared at panchayats and municipalities and
prepare a draft development plan for the whole district.
The decentralized planning process was further strengthened through emphasis by
planning commission on preparation of district level plans and making it an integral part of
the process of preparation of the states 11th five year plan. The Planning Commission issued
guidelines in August, 2006 for preparation of the district plans. The guidelines define the
District Planning as ‘the process of preparing an integrated plan for the local government
sector in a district taking into account the resources (natural, human and financial) available
and covering the sectoral activities and schemes assigned to the district level and below and
those implemented through local governments in a state. The document that embodies this
statement of resources and their allocation for various purposes is known as the “District
Plan”.
Government of India through a resolution in National Development Council (NDC)
on 29th May 2007 conceived a special Additional Central Assistance Scheme (ACAS) to
address the slow growth of agriculture and allied sectors by incentivizing states to draw up
plans for their agriculture sectors more comprehensively. The NDC resolution states "GoI
will introduce a new additional Central Assistance Scheme to incentivize states to draw up
plans for their agriculture sector more comprehensively, taking agro-climatic conditions,
natural resource issues and technology into account, and integrating livestock, poultry and
fisheries, etc. This will involve a new scheme for Additional Central Assistance (ACA) to
State Plans, administered by the Union Ministry of Agriculture over and above its existing
Centrally Sponsored Schemes, to supplement the state-specific strategies including special
schemes for beneficiaries of land reforms. The newly created National Rainfed Area
Authority will, on request, assist States in planning for rainfed areas".

17 | P a g e
The NDC in its resolution advised the states to prepare a Comprehensive District
Agriculture Plans (C-DAP) that will fully utilize available resources and will include allied
agriculture sectors. Further, GOI issued a manual on preparation of comprehensive district
agriculture plans to help the states prepare C-DAP. As per these guidelines, the objective of
district planning is ‘to design an integrated and participatory action plan for the development
of local area in general and agriculture and allied sectors in particular’. The objectives of
Comprehensive District Agriculture Plan (C-DAP) are:
To prepare a Comprehensive District Agriculture Plan (C-DAP) through participatory
process involving various organisations and stakeholders.
To enable optimum utilisation of scarce natural, physical & financial resources.
To assess and plan for the infrastructure required to support the agriculture
development.
To establish linkages with the required institutional support services, like credit,
technology transfer, ICT, research etc.
To evolve an action plan for achieving sustainable agricultural growth with food
security and cropping system that will improve farmers’ income.
The guidelines required the state/district authorities to (i) ensure that the agricultural
plans are prepared for the district and then integrated into the agricultural plans of the state
based on the agro-climatic conditions, availability of technology, trained manpower and
natural resources; (ii) local needs/ crops/ feed and fodder/ animal husbandry/ dairying/
fisheries/ priorities are reflected in the plan; (iii) productivity gaps for important crops and
livestock and fisheries are reduced; and (iv) the returns to the farmers from these are
maximized.
The latest move in the process of strengthening of decentralized planning process was
the Government of India guidelines issued in 2015 in the form of a template for the
preparation of District Irrigation Plan (DIP) and State Irrigation Plan (SIP) as part of the
Pradhan Mantri Krishi Sinchayee Yojana (PMKSY) program and made the preparation of
DIP and SIP mandatory for the states to receive funds from the program. The present report is
a product of these long drawn efforts of Government of India to strengthen the decentralized
planning process in the country focusing on the vital resource i.e., water.
Water is of vital importance for human & animal life, maintenance of ecological
balance and promotion of developmental activities. Considering its vital importance and ever

18 | P a g e
increasing demand for water, in the face of population growth, urbanization &
industrialization and considerations of climatic change, making water, an increasingly a
scarce resource, available to multiple uses, planning and management of this vital resources,
utilization of water economically, optimally and equitably assumes greater importance.
According to the 12th Five Year Plan the water budget estimates of India by Ministry
of Water Resources suggests an availability of 1123 billion cubic meters (BCM) against a
current estimated demand of 710 BCM. The Standing Committee of the Ministry of Water
Resources estimates that this water demand will rise to 1093 BCM by 2025. Though the
existing water availability in the immediate future seems to be adequate, with the near
constant supply of water resources in the face of increasing demand on account of population
growth, urbanisation and industrialization will strain the water supply-demand balance.
The per capita water availability which stood at 5,177 cubic meters in 1951 was
reduced to 1820 cubic meters in 2001 while the international prescribed limit is 1800 cubic
meters. The projected per capita availability of water is 1341 cubic meters in 2025 and 1140
cubic meters in 2050 suggesting shortage of water in the medium term1. Further, the all India
water balance estimates does not reflect the variations in water balance across time and
space- certain areas having a positive water balance and the others facing acute shortage. The
problem is further accentuated by water quality related issues.
With the abundant surface and ground water supply in the first five decades since
independence, more than 80 percent of the total available water resources were allocated for
irrigation purposes and the rest meeting the domestic and industrial demands. In a recent
study2 on the demand for water from agriculture, domestic and industrial uses in 2000, 2025
and 2050 seems to suggest that domestic demand (34 BCM in 2000, 66 BCM in 2025 and
101 BCM in 2050) and industrial demand (42 BCM in 2000, 92 BCM in 2025 and 161 BCM
in 2050) for water will utilize the total balance water available while agriculture demand for
water will be (605 BCM in 2000, 675 BCM in 2025 and 637 BCM in 2050). This change is
partly because of the changing sectoral contributions of India’s GDP and also partly because
of dynamics of irrigation development in the country where the initial expansion in area
under irrigation is propelled by the availability of abundant water resources and availability
1 Ministry of Water Resources (2011), Strategic Plan for Ministry of Water Resources, Government of India,
New Delhi.
2 Amarasinghe, U.A., Shah T., Turral, H. and Anand, B.K. 2007. India’s water future to 2025-2050:
Business-as-usual scenario and deviations. Research Report 123, International Water Management
Institute, Colombo.

19 | P a g e
of good quality land. This is no longer the case in many of the states where the availability of
land and water are serious constraints for further expansion of irrigation. Further, as per the
erstwhile planning commission up to March 2012 out of 141 million hectares of net sown
area in the country 114 (81 per cent) million hectares is Irrigation Potential Created (IPC) and
88 (62 per cent) million hectares is Irrigation Potential Utilised (IPU) leaving almost 20 per
cent of irrigated potential unutilized. This leaves 40 per cent of the net sown area in the
country dependent on rainfall which makes farming a high risk and less productive.
The competing demands for water resources and the emerging issues and concerns
were to be addressed through certain basic principles and commonality in approaches in
dealing with planning, development and management of water resources3 under an Integrated
Water Resource Management framework. The main objectives of water resource
management as delineated in National Water Policy 2012 are:
(a) Planning, development and management of water resources need to be governed
by common integrated perspective considering local, regional, State and national
context, having an environmentally sound basis, keeping in view the human, social
and economic needs.
(b) Principle of equity and social justice must inform use and allocation of water.
(c) Good governance through transparent informed decision making is crucial to the
objectives of equity, social justice and sustainability. Meaningful intensive
participation, transparency and accountability should guide decision making and
regulation of water resources.
(d) Water needs to be managed as a common pool community resource held, by the
state, under public trust doctrine to achieve food security, support livelihood, and
ensure equitable and sustainable development for all.
(e) Water is essential for sustenance of eco-system, and therefore, minimum
ecological needs should be given due consideration.
(f) Safe water for drinking and sanitation should be considered as pre-emptive needs,
followed by high priority allocation for other basic domestic needs (including needs
of animals), achieving food security, supporting sustenance agriculture and minimum
eco-system needs. Available water, after meeting the above needs, should be allocated
in a manner to promote its conservation and efficient use.
3 Ministry of Water Resources, National Water Policy, 2012, Government of India, New Delhi.

20 | P a g e
(g) All the elements of the water cycle, i.e., evapo-transpiration, precipitation, runoff,
river, lakes, soil moisture, and ground water, sea, etc., are interdependent and the
basic hydrological unit is the river basin, which should be considered as the basic
hydrological unit for planning.
(h) Given the limits on enhancing the availability of utilizable water resources and
increased variability in supplies due to climate change, meeting the future needs will
depend more on demand management, and hence, this needs to be given priority,
especially through (i) evolving an agricultural system which economizes on water use
and maximizes value from water, and (ii) bringing in maximum efficiency in use of
water and avoiding wastages.
(i) Water quality and quantity are interlinked and need to be managed in an integrated
manner, consistent with broader environmental management approaches inter-alia
including the use of economic incentives and penalties to reduce pollution and
wastage.
(j) The impact of climate change on water resources availability must be factored into
water management related decisions. Water using activities need to be regulated
keeping in mind the local geo climatic and hydrological situation.
Government of India launched Pradhan Mantri Krishi Sinchayee Yojana (PMKSY) to
address the constraints in providing assured irrigation as well as increasing efficiency and
productivity of current water use to bring more prosperity to the rural areas. Priorities of
Government of India were reflected in the Hon’ble President’s address to the joint Session of
the Parliament of 16th Lok Sabha where he indicated that “Each drop of water is precious.
Government is committed to giving high priority to water security. It will complete the long
pending irrigation projects on priority and launch the ‘Pradhan Mantri Krishi Sinchayee
Yojana’ with the motto of ‘Har Khet Ko Pani’. There is a need for seriously considering all
options including linking of rivers, where feasible; for ensuring optimal use of our water
resources to prevent the recurrence of floods and drought. By harnessing rain water
through ‘Jal Sanchay’ and ‘Jal Sinchan’, we will nurture water conservation and ground
water recharge. Micro irrigation will be popularised to ensure ‘‘Per Drop More Crop” .
PMKSY has been approved with an indicative outlay of Rs.50,000 crore over a period
of five years from 2015-16 to 2019-20. The programme is an amalgamation of on-going
schemes of Ministry of Water Resources, River Development and Ganga Rejuvenation,
Ministry of Agriculture & Cooperation and Ministry of Rural Development. The existing

21 | P a g e
schemes AIBP, CADWM, MI, SWMA, Watershed & Convergence with MGNREGA were
brought together under the umbrella program of PMKSY. Further the scheme seeks
convergence with scheme like Mahatma Gandhi National Rural Employment Guarantee
Scheme (MGNRES), Rashtriya Krishi Vikas Yojana (RKVY), Jawaharlal Nehru National
Solar Mission and Rural Electrification programmes (JLNNSM&REP), Rural Infrastructure
Development Fund (RIDF), Members of Parliament Local Area Development Scheme
(MPLAD), Members of Legislative Assembly Local Area Development Fund (MLALAD),
Local Body Funds (LBF), Working Plan of State Forest Department (WPSFD) etc. The
PMKSY will be implemented in an area development mode only by adopting a decentralized
state level planning and projectised execution structure that will allow the state to draw up
their own irrigation development plans based on DIP and SIP with a horizon of 5-7 years.
The program will be implemented as part of Rashtriya Krishi Vikas Yojana (RKVY) with
state agriculture department acting as the State Nodal Agency. However, the implementing
departments for the four components like AIBP, PMKSY (Har Khet Ko Pani), PMKSY (Per
Drop More Crop) and PMKSY (Watershed Development) will be decided by the respective
program ministry/department.
The funds under this program would be provided to the states as per the pattern of
assistance of Centrally Sponsored Schemes (CSS) decided by the Ministry of Finance and
NITI Aayog. During 2015-16 the existing pattern of assistance of ongoing scheme was
continued. An outlay of Rs. 50,000 crore has been approved for 2015-20. The financial
assistance provided to the state governments from this centrally sponsored scheme is subject
to fulfillment of certain conditions. Firstly, a state will become eligible to access PMKSY
fund only if it has prepared the District Irrigation Plans (DIP) and State Irrigation Plan (SIP),
excepting for the initial year, and the expenditure in water resource development for
agriculture sector in the year under consideration is not less than the baseline expenditure,
which is defined as the average of the expenditure in irrigation sector irrespective of the
department in the state plan in three years prior to the year under consideration. Secondly,
States will be given additional weightage for levying charges on water and electricity for
irrigation purposes, so as to ensure sustainability of the programme. Thirdly, inter state
allocation of PMKSY fund will be decided based on
Share of percentage of unirrigated area in the state vis-à-vis national average
including prominence of areas classified under Desert Development Programme
(DDP) and Drought Prone Area Development Programme (DPAP)

22 | P a g e
Increase in percentage share of expenditure on water resource development for
agriculture sector in state plan expenditure in the previous year over three years prior
to it, and
Improvement in irrigation efficiency in the state.
2. Vision
The overreaching vision of Pradhan Mantri Krishi Sinchayee Yojana (PMKSY) will
be to ensure access to some means of protective irrigation to all agricultural farms in the
country, to produce ‘Per Drop More Crop’, thus bringing much desired rural prosperity.
3. Objective
The objectives of the PMKSY are to:
a) Achieve convergence of investments in irrigation at the field level (preparation of
district level and, if required, sub district level water use plans).
b) Enhance the physical access of water on the farm and expand cultivable area under
assured irrigation (Har Khet Ko Pani),
c) Integration of water source, distribution and its efficient use, to make best use of
water through appropriate technologies and practices.
d) Improve on-farm water use efficiency to reduce wastage and increase availability
both in duration and extent,
e) Enhance the adoption of precision-irrigation and other water saving technologies
(Per Drop More Crop).
f) Enhance recharge of aquifers and introduce sustainable water conservation
practices
g) Ensure the integrated development of rainfed areas using the watershed approach
towards soil and water conservation, regeneration of ground water, arresting runoff,
providing livelihood options and other NRM activities.
h) Promote extension activities relating to water harvesting, water management and
crop alignment for farmers and grass root level field functionaries.
i) Explore the feasibility of reusing treated municipal waste water for peri-urban
agriculture, and
j) Attract greater private investments in irrigation.
4. Strategy/approach
To achieve these objectives PMKSY adopted strategies that include:

23 | P a g e
a) Creation of new water sources; repair, restoration and renovation of defunct water
sources; construction of water harvesting structures, secondary & micro storage,
groundwater development, enhancing potentials of traditional water bodies at village
level like Jal Mandir (Gujarat); Khatri, Kuhl (H.P.); Zabo (Nagaland); Eri, Ooranis
(T.N.); Dongs (Assam); Katas, Bandhas (Odisha and M.P.) etc.
b) Developing/augmenting distribution network where irrigation sources (both
assured and protective) are available or created;
c) Promotion of scientific moisture conservation and run off control measures to
improve ground water recharge so as to create opportunities for farmers to access
recharged water through shallow tube/dug wells;
d) Promoting efficient water conveyance and field application devices within the farm
viz, underground piping system, drip & sprinklers, pivots, rain-guns and other
application devices etc.;
e) Encouraging community irrigation through registered user groups/farmer
producers’ organisations/Non Government Organnisations (NGO); and
f) Farmer oriented activities like capacity building, training and exposure visits,
demonstrations, farm schools, skill development in efficient water and crop
management practices (crop alignment) including large scale awareness on Per Drop
More Crop of water through mass media campaign, exhibitions, field days, and
extension activities through short animation films etc.
5. Programme Components
PMKSY has following four components:
1. Accelerated Irrigation Benefit Programme (AIBP)
a) To focus on faster completion of ongoing major and medium irrigation including
national projects.
2. PMKSY (Har Khet Ko Pani)
a) Creation of new water sources through Minor Irrigation (both surface and ground
water);
b) Repair, restoration and renovation of water bodies; strengthening carrying capacity
of traditional water sources, construction rain water harvesting structures (Jal
Sanchay);

24 | P a g e
c) Command area development, strengthening and creation of distribution network
from source to the farm;
d) Ground water development in the areas where it is abundant, so that sink is created
to store runoff/ flood water during peak rainy season;
e) Improvement in water management and distribution system for water bodies to take
advantage of the available source which is not tapped to its fullest capacity (deriving
benefits from low hanging fruits). At least 10% of the command area to be covered
under micro/ precision irrigation;
f) Diversion of water from source of different location where it is plenty to nearby
water scarce areas, lift irrigation from water bodies/rivers at lower elevation to
supplement requirements beyond IWMP and MGNREGS irrespective of irrigation
command;
g) Creating and rejuvenating traditional water storage systems like Khatri, Kuhl etc. at
feasible locations.
3. PMKSY (Per Drop More Crop)
a) Programme management, preparation of State/District Irrigation Plan, approval of
annual action plan, monitoring etc.
b) Promoting efficient water conveyance and precision water application devices like
drips, sprinklers, pivots, rain-guns in the farm (Jal Sinchan);
c) Topping up of input cost particularly under civil construction beyond permissible
limit (40%), under MGNREGA for activities like lining inlet, outlet, silt traps,
distribution system etc.;
d) Construction of micro irrigation structures to supplement source creation activities
including tube wells and dug wells (in areas where ground water is available and not
under semi critical /critical /over exploited category of development) which are not
supported under AIBP, PMKSY (Har Khet ko Pani), PMKSY (Watershed) and
MGNREGA as per block/district irrigation plan;
e) Secondary storage structures at tail end of canal system to store water when
available in abundance (rainy season) or from perennial sources like streams for use
during dry periods through effective on-farm water management;
f) Water lifting devices like diesel/ electric/ solar pumpsets including water carriage
pipes, underground piping system;

25 | P a g e
g) Extension activities for promotion of scientific moisture conservation and
agronomic measures including cropping alignment to maximise use of available water
including rainfall and minimise irrigation requirement (Jal Sarankchan);
h) Capacity building, training and awareness campaign including low cost
publications, use of pico projectors and low cost films for encouraging potential use
water source through technological, agronomic and management practices including
community irrigation;
i) The extension workers will be empowered to disseminate relevant technologies
under PMKSY only after requisite training is provided to them especially, in the area
of promotion of scientific moisture conservation and agronomic measures, improved/
innovative distribution system like pipe and box outlet system, etc. Appropriate
Domain Experts will act as master trainers;
j) Information Communication Technology (ICT) interventions through National e-
Governance Plan-Agriculture (NeGP-A) to be made use in the field of water use
efficiency, precision irrigation technologies, on farm water management, crop
alignment etc. and also to do intensive monitoring of the Scheme.
4. PMKSY (Watershed Development)
a) Effective management of runoff water and improved soil & moisture conservation
activities such as ridge area treatment, drainage line treatment, rain water harvesting,
in-situ moisture conservation and other allied activities on watershed basis;
b) Converging with MGNREGS for creation of water source to full potential in
identified backward rainfed blocks including renovation of traditional water bodies.
6. Rationale/ Justification
In reference to the status and need of irrigation, the water resource management
including irrigation related priorities was identified for Kangra district by the peoples’
representatives of district with support from administration and technical experts. For
instance the reports of Strategic Research and Extension Plan (SREP) prepared under ATMA
program, Comprehensive District Agriculture Plan (C-DAP) prepared as part of Rashtriya
Krishi Vikas Yojana (RKVY), Potential Linked Credit Plans (PLP) of NABARD and the
Integrated District Development Plan etc identified number of irrigation related issues for
Kangra district including the (i) protection of crops from abiotic stress factors including
flashfloods; (i) promoting water use efficiency through sprinkler and drip irrigation; (iii)
promoting protected poly house cultivation to minimize risk factors and enhance quality and

26 | P a g e
productivity; (iv) Improvement of on-farm water delivery and efficiency of existing irrigation
systems; (v) promotion of soil conservation of arable & non-arable land through engineering
measures; (vi) creation of new water harvesting structures, check dams, ponds, tanks, etc and
(vii) land improvement measures.
7. Methodology
During the course of preparation of District Irrigation Plan (DIP) the team visited
Kangra district to collect data and have interaction with all the stakeholders. Methodology
adopted to prepare DIP is outlined in brief as under:
Collection of primary and secondary data from field from various sources including
published documents and websites.
Various meetings were held to obtain ground level realities and data from key
personnel/stakeholders through structured, unstructured interviews, focused group
discussions etc.
Meetings with various state government departments and related institutions were
held
Meeting through Video Conference (VC) was also held with State Level
authorities.
GIS maps of the area’s/clusters were studied to understand the land morphology,
topography of the district.
Focused group discussions and interaction with agriculture officers, horticulture
officers, forest officers, rural development department, animal husbandry
department, irrigation officers, both at blocks and district level for identifying the
key issues and focus areas of the region.
Discussion with NABARD officers of Kangra district was also held during the
visit.
Team members of NABCONS also participated in the State Level workshop and
held active discussions with GoI officers, state level officers and scientists of
various institutions
On the basis of detailed discussion and analysis of data, the team arrived at the
projections of various components of PMKSY and department wise plan for four years from
2016-17 to 2019-20.
27 | P a g e
Chapter I
General Information of the District
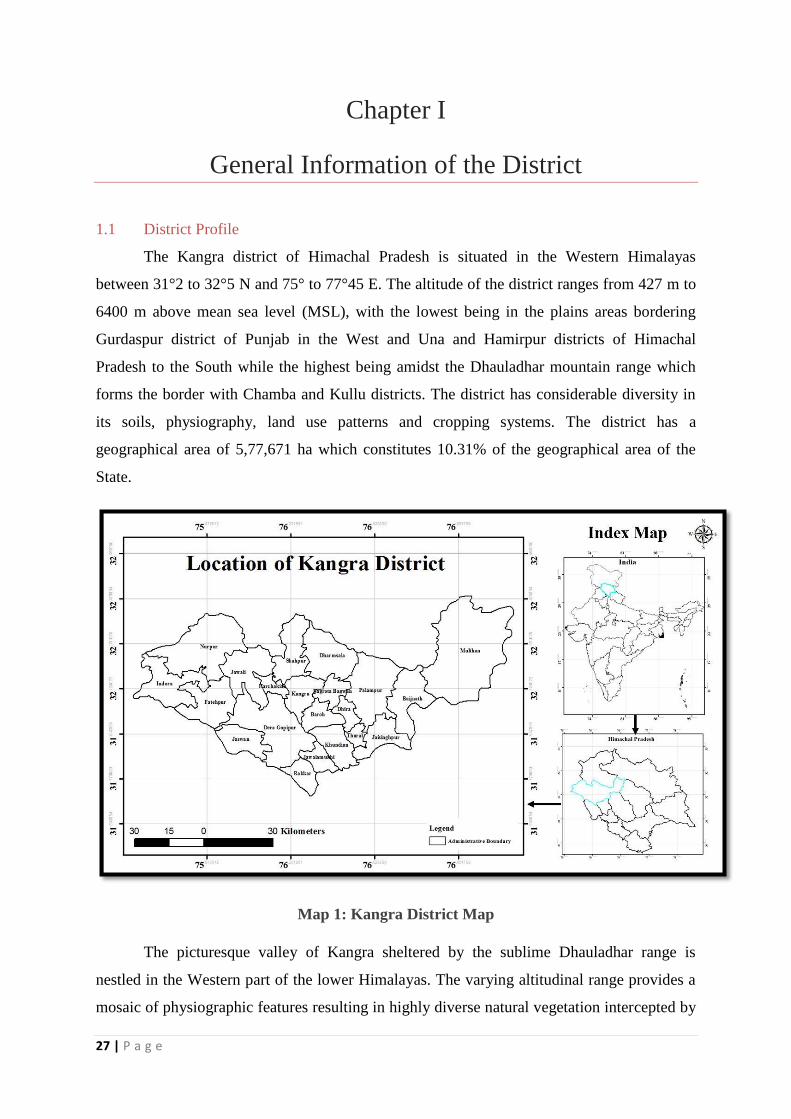
1.1 District Profile
The Kangra district of Himachal Pradesh is situated in the Western Himalayas
between 31°2 to 32°5 N and 75° to 77°45 E. The altitude of the district ranges from 427 m to
6400 m above mean sea level (MSL), with the lowest being in the plains areas bordering
Gurdaspur district of Punjab in the West and Una and Hamirpur districts of Himachal
Pradesh to the South while the highest being amidst the Dhauladhar mountain range which
forms the border with Chamba and Kullu districts. The district has considerable diversity in
its soils, physiography, land use patterns and cropping systems. The district has a
geographical area of 5,77,671 ha which constitutes 10.31% of the geographical area of the
State.
Map 1: Kangra District Map
The picturesque valley of Kangra sheltered by the sublime Dhauladhar range is
nestled in the Western part of the lower Himalayas. The varying altitudinal range provides a
mosaic of physiographic features resulting in highly diverse natural vegetation intercepted by

28 | P a g e
serpentine perennial streams at times. The Kangra town is at the confluence of the Bener
River and Majhi River. The headquarter of the district is in Dharamshala which is also a
tourist spot and is now home-in-exile to the Dalai Lama. Another important town is Palampur
which is 40 km away from Dharamshala and famous for its picturesque tea gardens. Tea
cultivation plays a vital role in the economy of the district. "Kangra Tea" is famous
worldwide for its rich aroma, colour and taste. Many ancient temples like the Jawalaji temple,
Brijeshwari temple, Chamunda temple, Baba Baroh and Baijnath temple are located here.
Table 1. 1: District Profile of Kangra
S.
No.
Name of the District District
Code
Latitude Longitude
1
Kangra
24
31°2 to 32°5 N 75° to 77°45 E
Source: Census of India, Kangra district, 2011
1.1.1 Administrative set up of Kangra
Administratively, the district has been divided into nine sub-divisions (Table 1.1.1). It
has 21 tehsils besides 11 sub-tehsils. For the purpose of development, the district has been
divided into 15 development blocks, of which two blocks of Fatehpur and Bhedu Mahadev
have been carved out recently (2001). There are 748 Panchayats and 15 Panchayat Samiti,
one each at blocks with Zila Parishad in the Kangra town. There are six local urban bodies
mainly, Municipal Council of Dharamshala and Kangra, and Nagar Panchayats (NP) in
Jawalamukhi, Dehra, Nagrota Bagwan, and Nurpur. Kangra district has 17 assembly
constituency and one parliamentary constituency.
Table1.1. 1: Administrative Set up
Administrative Setup
No. of Sub-Divisions 9 (Kangra, Palampur, Dharamshala, Nurpur, Dehra
Gopipur, Baijnath, Jawali and Jaisinghpur.)
No. of Tehsils 21 (Nurpur, Nagrota Bagwan, Indora, Jawali, Kangra,
Palampur, Baroh, Harchakian, Jaswan, Dehra
Gopipur, Khundian, Jaisinghpur, Baijnath, Fatehpur,
Dharamshala, Multhan, Dhira, Jawalamukhi, Rakkad,
Thural and Shahpur)

29 | P a g e
No. of Sub-Tehsils 9 (Harchakkian, Dhira, Rakkad, Thural, Nagrota
Surian, Kotla, Gangath and Multhan)
Development Blocks 15 (Baijnath, Bhawarna, Dehra, Dharamshala,
Fatehpur, Indora, Kangra, Lambagaon, Nagrota
Bagwan, Nagrota Surian, Nurpur, Panchrukhi,
Pragpur, Rait, Bhedu Mahadev)
Panchayats 748
Villages 3869
Panchayat Samiti 15
Zila Parishad 1
Local Urban Bodies 6 (Municipal Committee; Dharamshala, Kangra;
Nagar Panchayat(NP); Jawalamukhi, Dehra, Nagrota
Bagwan, and Nurpur
Assembly Segments 17 (Churah, Chamba, Dalhousie, Bhattiyat, Nurpur,
Indora, Fatehpur, Jawali, Jawalamukhi, Jaisinghpur,
Sullah, Nagrota, Kangra, Shahpur, Dharamshala,
Palampur, Baijnath)
Parliamentary Constituency 1 (Kangra)
Source: hpkangra.nic.in
The Deputy Commissioner along with the Additional Deputy Commissioner,
Assistant Commissioner, District Judge, Superintendent of Police, Chief Executive Officer of
Zila Parishad and other senior officers of the State Government, look after the development
and regulatory functions in the district. At the tehsil level, the Tehsildar, Naib-tehsildar,
Block Development Officer, and other officers look after their respective departments for
development and regulatory functions.
30 | P a g e
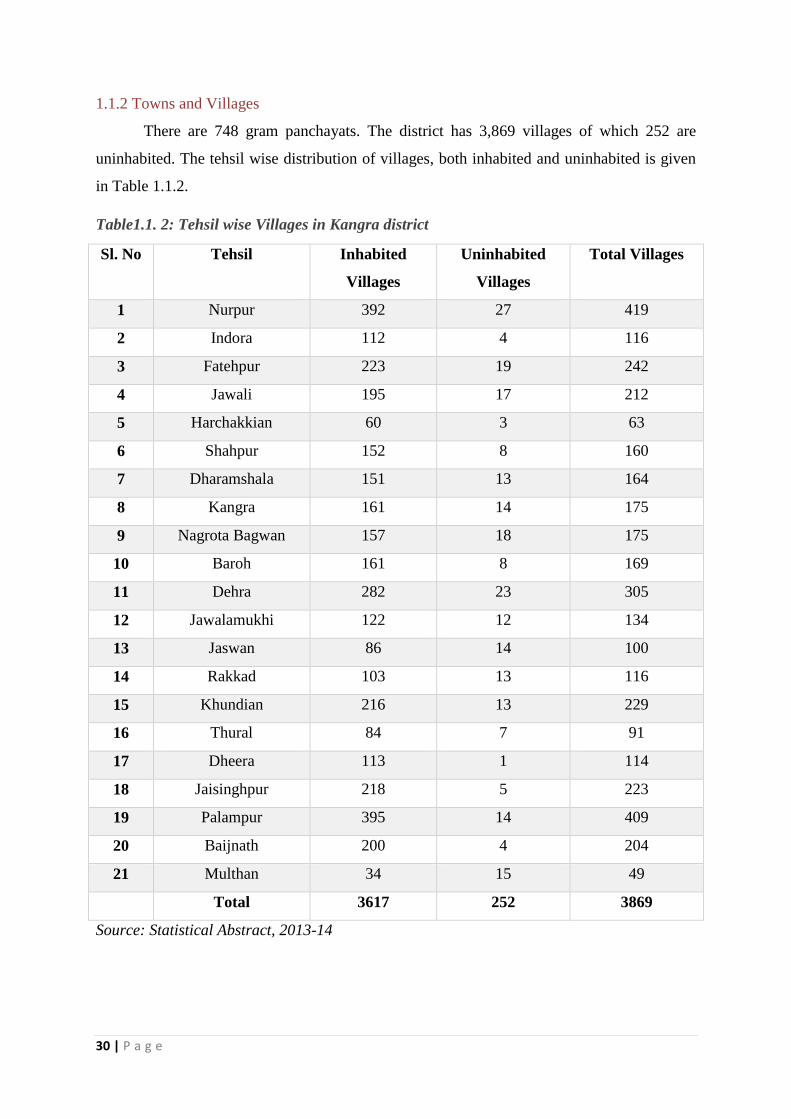
1.1.2 Towns and Villages
There are 748 gram panchayats. The district has 3,869 villages of which 252 are
uninhabited. The tehsil wise distribution of villages, both inhabited and uninhabited is given
in Table 1.1.2.
Table1.1. 2: Tehsil wise Villages in Kangra district
Sl. No Tehsil Inhabited
Villages
Uninhabited
Villages
Total Villages
1 Nurpur 392 27 419
2 Indora 112 4 116
3 Fatehpur 223 19 242
4 Jawali 195 17 212
5 Harchakkian 60 3 63
6 Shahpur 152 8 160
7 Dharamshala 151 13 164
8 Kangra 161 14 175
9 Nagrota Bagwan 157 18 175
10 Baroh 161 8 169
11 Dehra 282 23 305
12 Jawalamukhi 122 12 134
13 Jaswan 86 14 100
14 Rakkad 103 13 116
15 Khundian 216 13 229
16 Thural 84 7 91
17 Dheera 113 1 114
18 Jaisinghpur 218 5 223
19 Palampur 395 14 409
20 Baijnath 200 4 204
21 Multhan 34 15 49
Total 3617 252 3869
Source: Statistical Abstract, 2013-14

31 | P a g e
1.2 Demography
As per census 2011, district has a population of 15,10,075 with male and female
population being 7,50,591 and 7,59,484 respectively, which constitute almost 50% each to
the total population of the district. The density of population in the district is 263 person/
sq.km. The female/male sex ratio is 1012. The population of rural area is 14,23,794 which
constitute about 94.29% and the population in urban area is about 86,281 which constitutes
5.71%, of the total population of the district, indicating thereby, that the district has an
agricultural economy. Scheduled caste and scheduled Tribe population constitutes about
21.15% and 5.60%, respectively, of the total population of the district. The demography of
the district has been further detailed in the table 1.2.1.
Table 1.2. 1: Demography of Kangra district
Block Population Total
Population Male Female Children (0-6
years)
Baijnath 47996 47575 9846 95571
Bhawarna 47532 48070 9678 95602
Dehra Gopipur 64446 67358 14394 131804
Fatehpur 57400 56548 15655 113948
Indora 58989 54896 12317 113885
Kangra 54283 54171 10951 108454
Lambagaon 38054 42218 8474 80272
Nagrota Bagwan 43333 45121 10679 88454
Nagrota Surian 50550 52551 10993 103101
Nurpur 64307 60361 13526 124668
Panchrukhi 34,883 36261 6810 71144
Pragpur 57,093 60322 12335 117415
Rait 53,242 53379 13403 106621
Bhedu Mahadev 37,094 39379 7407 76473
Dharamshala 41,389 41274 8139 82663
Total 750591 759484 164607 1510075
Source: Census of India, 2011

32 | P a g e
Figure 1.2. 1: Block-wise male, female and children population of the district
The figure 1.2.1 shows the block-wise population of male, female and children (0 to 6
years). The number of female per thousand male being high in blocks like Dehra,
Lambagaon, Baijnath, Pragpur, etc. while in other blocks the number of female is almost
equal to male population.
Table 1.2. 2: Block-wise SC, ST and General Household population
Block SC ST General Total
NHH NM NHH NM NHH NM NHH NM
Baijnath 5048 22785 3155 12486 14119 60300 22322 95571
Bhawarna 4139 20371 3457 15110 16336 60121 23932 95602
Dehra
Gopipur
6397 27040 333 1750 21435 103014 28165 131804
Fatehpur 4110 19681 272 1546 18994 92721 23376 113948
Indora 5815 29148 722 4251 18449 80486 24986 113885
Kangra 2478 14502 295 1421 23472 92531 26245 108454
Lambagaon 6003 22887 90 510 15037 56875 21130 80272
Nagrota
Bagwan
1839 10266 444 2126 16195 76062 18478 88454
Nagrota 3904 18284 1520 8291 16524 76526 21948 103101
0
10000
20000
30000
40000
50000
60000
70000
80000
Male
Female
Children (0-6 years)

33 | P a g e
Surian
Nurpur 5819 25641 1233 8208 18186 90819 25238 124668
Panchrukhi 5673 24181 769 3469 8794 43494 15236 71144
Pragpur 6872 30828 178 857 20882 85730 27932 117415
Rait 4791 26435 2056 10229 15594 69957 22441 106621
Bhedu
Mahadev
3539 13444 355 1693 15538 61336 19432 76473
Dharamshala 3066 13892 2672 12617 12288 56154 18026 82663
Total 69493 319385 17551 84564 251843 1106126 338887 1510075
Source: Census of India, 2011
Figure 1.2. 2: Block-wise SC, ST and General Household population
0
5000
10000
15000
20000
25000
SC_NHH
ST_NHH
General_HH

34 | P a g e
Figure 1.2. 3: Block-wise Average member per household
The average member per household in the district is 4.46. The average member in SC
household is 4.59 while it is 4.82 for ST households. The general category has an average
member of 4.39 per household.
1.3 Biomass and Livestock
Livestock rearing is an age-old component of rural economy of Kangra. People of
Himachal Pradesh, particularly of Kangra supplement their income from livestock sector.
Table 1.3.1 and 1.3.2 indicate the figures for total numbers of cows, buffaloes, sheep & goats
along with total number of livestock. Over the period, bovine rearing is the most important
activity in the livestock sector in Kangra district. Sheep & goat rearing activity is next in
importance. The district has 3,59,129 cattle with indigenous cattle population being 1,36,882
and hybrid cattle population being 2,22,247. The total number of buffaloes is 1,49,719. The
small animals include sheep, goats and pigs with a population of 84,808, 2,02,694 and 635
respectively. The population of the poultry in the district is 58,419 during the year 2012.
Table 1.3. 1: Biomass and livestock (Small Animals)
Tehsil Poultry
(No.)
Ducks
(No.)
Pigs (No.) Goats
(No.)
Sheep
(No.)
Total (No.)
Baijnath 6180 22 50 24316 17928 48496
Baroh 705 0 10 7303 130 8148
Dehra
Gopipur
1119 3 43 6286 263 7714
Dharamshala 6497 17 83 20250 8420 35267
0.00
1.00
2.00
3.00
4.00
5.00
6.00
7.00
Average HHM_SC
Average HHM_ST
Average HHM_General

35 | P a g e
Dheera 749 0 0 3011 380 4140
Fatehpur 695 0 0 7265 94 8054
Harchakkian 926 8 0 3299 138 4371
Indora 1175 0 0 4637 414 6226
Jaisinghpur 2433 0 1 6007 2748 11189
Jaswan 215 0 0 845 5 1065
Jawalamukhi 503 14 41 1876 245 2679
Jawali 2089 0 2 15093 947 18131
Kangra 3839 2 208 11072 267 15388
Khundian 2101 0 2 8944 449 11496
Multhan 924 0 0 7979 18775 27678
Nagrota
Bagwan
5898 0 0 8997 2979 17874
Nurpur 3314 4 0 21264 1858 26440
Palampur 10545 4 71 26835 24452 61907
Rakkad 223 0 14 776 13 1026
Shahpur 7373 0 93 14931 4120 26517
Thural 916 24 17 1708 183 2848
Total 58419 98 635 202694 84808 346654
Source: 19th Livestock Census, 2012
Figure 1.3. 1: Tehsil-wise percentage of small animal population
0.00%
5.00%
10.00%
15.00%
20.00%
25.00%
30.00%
35.00%
Bai
jnat
h
Bar
oh
De
hra
Go
pip
ur
Dh
aram
shal
a
Dh
eer
a
Fate
hp
ur
Har
chak
kian
Ind
ora
Jais
ingh
pu
r
Jasw
an
Jaw
alam
ukh
i
Jaw
ali
Kan
gra
Kh
un
dia
n
Mu
lth
an
Nag
rota
Bag
wan
Nu
rpu
r
Pal
amp
ur
Rak
kad
Shah
pu
r
Thu
ral
Pigs (%)
Goats (%)
Sheep (%)

36 | P a g e
Figure 1.3.1 indicates the percentage wise distribution of pigs, goats and sheep in each
tehsil compared to their total population in the district. The pig population stands maximum
in Kangra tehsil with 33% followed by Dharamshala with 13%. Goat has maximum
population in Palampur, Baijnath and Nurpur tehsil with 13.24%, 12% and 10.5%
respectively as compared to the total goat population of the district. Palampur, Multhan and
Baijnath showed maximum population in sheep rearing with a contribution of 28.83%,
22.14% and 21.14% respectively as compared to the total sheep population of the district.
Table 1.3. 2: Biomass and livestock (Large Animals)
Tehsil Indigenous
Cow (No.)
Hybrid
Cow
(No.)
Buffalo
(No.)
Draft Animal
(Buffalo/ yak/
bulls/ any other
(No.)
Total (No.)
Baijnath 1981 22814 1404 443 26642
Baroh 3994 1815 5427 16 11252
Dera Gopipur 11605 11015 23432 199 46251
Dharamshala 12162 12379 2678 932 28151
Dheera 1596 3040 2541 152 7329
Fatehpur 9393 8902 10725 169 29189
Harchakkian 2790 2213 1666 50 6719
Indora 2365 19546 13839 387 36137
Jaisinghpur 1045 6927 6953 249 15174
Jaswan 3458 5151 6573 15 15197
Jawalamukhi 2871 3187 9824 58 15940
Jawali 14612 15272 14216 298 44398
Kangra 11419 7363 6479 800 26061
Khundian 7123 1580 10655 198 19556
Multhan 1404 2220 0 356 3980
Nagrota Bagwan 9155 8290 4376 645 22466
Nurpur 16762 37464 12420 524 67170
Palampur 8951 36655 4574 928 51108
Rakkad 1140 2229 7052 48 10469
Shahpur 12585 11677 2399 991 27652

37 | P a g e
Thural 471 2406 2478 144 5499
Total 136882 222145 149719 7602 516340
Source: 19th Livestock Census, 2012
Figure 1.3. 2: Block-wise large animal population
Figure 1.3.2 shows the percentage wise distribution of indigenous cows, hybrid cows,
buffaloes and other draft animals in each tehsil as compared to the total number of these
animals in the district. Nurpur and Jawali show the maximum percentage of indigenous cows
with 12.25% and 10.67% respectively as compared to the total number of indigenous cows in
the district. In case of hybrid cows Nurpur and Palampur shares almost equal percentage of
about 16.5% and 17% respectively, followed by Baijnath with 10% of population as
compared to the total number of hybrid cows in the district. The Dehra Gopipur tehsil has the
maximum share of buffalo population which stands at 15.65% while in case of draft animals,
Shahpur, Palampur and Dharamshala share about 13%, 12% and 12% respectively.
1.4 Agro-Ecology, Climate, Hydrology and Topography
Kangra district comprises of four distinct regions viz. High hills Wet Sub-Temperate
region, Valley region, Chaintal region and Shivalik foot hill region, based on the topography,
precipitation, irrigation facilities, soil and temperature etc. Kangra lies in Western Himalayas,
0.00%
5.00%
10.00%
15.00%
20.00%
25.00%
30.00%
35.00%
40.00%
45.00%
50.00%
Bai
jnat
h
Bar
oh
De
hra
Go
pip
ur
Dh
aram
shal
a
Dh
eer
a
Fate
hp
ur
Har
chak
kian
Ind
ora
Jais
ingh
pu
r
Jasw
an
Jaw
alam
ukh
i
Jaw
ali
Kan
gra
Kh
un
dia
n
Mu
lth
an
Nag
rota
Bag
wan
Nu
rpu
r
Pal
amp
ur
Rak
kad
Shah
pu
r
Thu
ral
Draft Animal (%)
Buffalo (%)
Hybrid Cow (%)
Indigenous Cow (%)

38 | P a g e
Warm Sub Humid (to humid with inclusion of per-humid) Agro-Ecological Zone. The
climate of different parts of the district depends mainly on its elevation. The terrain is
mountainous with deep valleys and high ridges and peaks. The elevation generally ranges
from about 2000 m to about 6000 m. In some of the valleys the elevation at few places is as
low as about 500 m. The climate of the lower parts of the district near the south-western
border is somewhat like that of the adjoining plains of the Punjab, except for a milder hot
season and higher rainfall. The cold season is very severe. The year may be divided into four
seasons. The period from November to March is the winter season. The period from April to
June forms the summer season. The following period lasts up to about middle of September
and it is Southwest monsoon season. The latter half of September and October forms the post
monsoon season or transition period.
Kangra district has been divided mainly into three Agro-Ecological Zones which are:
1. Sub-Mountain and Low Hills Sub-Tropical Zone
The area in this zone lies below 650 m altitudes above MSL. The soils of this
region are shallow, light textured and low in fertility. The average rainfall is 1110
mm, of which 80% is received during the rainy season i.e., July to September.
Rainfed cropping is mostly practised in this zone. This zone is characterised by three
types of vegetation, viz., (i) Northern Dry Mixed Deciduous Forests, (ii) Dry
Deciduous Shrubs and (iii) Shivalik Chir Pine Forests. The area of Kangra district
falling under this zone includes:
a. AES-1: The zone is characterised by moderate rainfall in the plain zone and
relatively less warm than the AES-2. This AES comprises of 28.5% of area of the
district and 67.5% of the area falls under the Zone-1 in the district Kangra.
b. AES-2: The zone has high temperature, low rainfall areas. This AES comprises of
13.7% of area of the district, which comes to 32.5% area of the Zone-1 in the
district. This AES includes the river bed of areas of river Beas and Chakki.
2. Mid Hills Sub-Humid Zone
The elevation of this zone varies from 650 m to 1800 m above MSL. The soil
texture of this zone varies from loam to clay loam soils which are deficient in nitrogen
and phosphorus. The rainfall pattern in this zone is highly fluctuating with 3000 mm
in the Palampur areas while in the remaining areas it is 1500 mm. This zone is
characterised by generally two types of vegetation, (i) Lower West Himalayan
Temperate forests and (ii) Himalayan Chir Pine forests. The zone has following agro-
ecological situations:
39 | P a g e
a. AES-3: This zone has Rainfed and Sub-tropical Changar area. It represents
19.3% of area of the district and 41.2% of area of the Zone-II of the
district.
b. AES-4: It has moderate rainfall and irrigated area between National
Highway and Changer Area. This AES comprises of 13.9% of area of the
district and 29.7% of the area of the Zone-II of the district.
c. AES-5: This zone has high rainfall, acidic soils, and hailstorms prone
areas. This AES constitutes 13.6% of area of the district and 29.1% of the
area of the under Zone-II.
3. High hills Wet Sub-Temperate Zone
The elevation of this zone lies above 1800 m above MSL. The soils are shallow in
depth, acidic in nature, silt loam to loam in texture and deficient in nitrogen and
phosphorus. The average rainfall is about 1000 mm, which is mainly received during
monsoon season. This zone has upper Western Himalayan temperate forest, grassland
and pastures, cold water fisheries particularly trout fish culture is an important
livelihood activity of this zone. This zone is characterised by grassland, meadows and
comprising of snow blessed areas. It constitutes 11% area of the district and 100% of
Zone-III.
Climate
Kangra district is having topography that some parts like Milawan at 400 m altitude,
while area of Bara Bhangal is at the altitude of 5500 m. Indora block of the district falls in
sub-humid sub-tropical zone where annual precipitation is about 1000mm and mean
temperature is 240C, Dehra Gopipur and Nurpur blocks falls under humid sub-tropical zone
where the annual rainfall is between 900-2350 mm and mean temperature fall under 200C to
240C. Palampur and Dharamshala falls under wet temperate zone where the temperature
ranges from150C to 190C and annual rainfall is about 2500 mm. Other parts of the Kangra
district fall under hill area where the mean annual temperature varies from 130C to 200C and
annual rainfall is about 1800-3000 mm.
Hydrology
Larger parts of Kangra district fall within the drainage basins of Beas and Chakki
rivers with little area under Ravi. Rainfall is the major source of groundwater recharge, apart
from the influent seepage from the rivers, irrigated fields and inflow from upland areas,
whereas discharge from ground water mainly takes place from wells and tube wells; effluent
seepages of ground water takes place in the form of springs and base flow in streams etc.

40 | P a g e
Topography
Kangra district has a mountainous terrain with highly undulating landforms. The
altitude ranges from about 550 m to 5,500 m above MSL. The rise being gradual to about
1,500 m above MSL and after, it becomes abrupt. The district has a maximum length of about
150 km from Baijnath block to Indora block in east-west direction. It extends to a distance of
about 100 km from Rait to Pragpur block in the north-south direction. The entire territory is
mountainous with the exception of the erstwhile Nurpur tehsil (covering the blocks of
Nurpur, Indora, Fatehpur and parts of Nagrota Surian), which accounts for roughly 15 per
cent of the area in total area of the district. Deep valleys lying between ranges of varying
elevations characterize the mountainous portion, which comprises the bulk of the territory.
Attitudinally, the district has three distinct zones. These are:
1. Low hills and Valley Areas up to an elevation of about 900 m above MSL. This
portion accounts for about 49% of the total area in the district.
2. Mid hills extending from 900 m to 1,500 m above MSL. This is nearly 16% of the
district area.
3. High hills rising from about 1,500 m to 5500 m above MSL account for the remaining
35% of area of the district.
Table 1.4. 1: Agro-Ecology, Climate, Hydrology and Topography
S. No Agro Ecological Zone Type Type of Terrain
1 AES-1 Moderately
Undulating
2 AES-2 Flat
3 AES-3 Moderate to Steep
4 AES-4 Flat
5 AES-5 Moderately
Undulating to flat
6 AES-6 Mild to Steep
Source: District Agriculture Plan, 2010
Rainfall
Table 1.4.2 shows the rainfall pattern of the district taken from the observatory
stations located in different parts of the district. The Palampur observatory covers Palampur,
Panchrukhi, Lambagaon, Bhawarna and Bhedu Mahadev. Malan covers Nagrota Bagwan
while Kangra, Dehra, Fatehpur, Indora, Rait, Baijnath and Nagrota Surian falls under Kangra
observatory. The precipitation in the district increases from the southwest to the northeast in
the Kangra region and thereafter in the Saraj region decreases rapidly towards the north and

41 | P a g e
northwest. The annual normal precipitation in the district varies from 1387.0 mm at Dehra
Gopipur to 3722.5 mm at Dharamsala (lower). Southwest monsoon season i.e. period from
June to September is the main rainy season and August being the wettest month. There is
some precipitation all the year round, though in November the precipitation is not much
generally. The average annual rainfall in the district is 1852.3 mm. Rainfall during the
monsoon season constitutes about 78% of the annual rainfall normal. The rainfall in the
summer season is mostly in the form of thundershowers. The precipitation during cold season
is in association with the passage of western disturbances and often in the form of snowfall at
elevations above 1800 m. Occasional snowfall continues to occur at elevations above 4500 m
even during June and July. But at elevations below 2400 m the snowfall becomes less after
April. Considering the district as a whole, during 49 years period from 1951-1999, the
highest annual rainfall occurred in the year 1976 when it amounted to 126 percent of the
normal rainfall. 1963 was the year with the lowest annual rainfall, which was 56 percent of
the normal. During the same period, there are 12 years when annual rainfall was less than 80
percent of the annual normal rainfall.
Table 1.4. 2: Rainfall Pattern with different observatory situated in Kangra district
Stations Normal Annual
Rainfall (mm)
Average Monthly
Rainfall (mm)
No of Rainy
Day (No.)
Dehra-Gopipur 1387.0 139.5 73
Dharamshala 3722.5 130 92
Kangra 1963.8 136 74
Nurpur 1659.6 207 61
Palampur 2896.1 220 90
Malan 1838.2 153.2 77
Source: Report on Climate of Kangra, Himachal Pradesh 2013
Temperature
There is one meteorological observatory in the district at Dharamsala, situated at an
elevation of about 1211 m above sea level. The temperature conditions in the different parts
of the district are influenced to a great extent by their topography and hence the records of the
observatory at Dharamsala give some idea of the meteorological conditions prevalent in the
district. The period from March to about the end of June is one of continuous increase in
temperature. At Dharamsala, June is the hottest month, with the mean daily maximum
temperature of about 310C and the mean daily minimum temperature of about 21.30C. The
maximum temperature on individual days in May and June may go up-to about 330C to 380C.

42 | P a g e
At lower elevation in Kangra region temperatures may be higher. At places at higher
elevations, however the temperatures are lower and the weather is pleasant.
Table 1.4. 3: Temperature Pattern for different observatory stations in the state
Meteorological
Observatory
Average Weekly Temperature (0C)
Period
Summer Winter Rainy
(April-May) (Oct-Mar) (June-Sept)
Min Max Mean Min Max Mean Min Max Mean
Dharamshala 16.5 32.5 24.5 9.4 23.2 16.3 22.2 31.3 26.7
Source: Report on Climate of Kangra, Himachal Pradesh 2013
With the onset of the southwest monsoon in July, there is an appreciable drop in day
temperatures; however, nights are as warm as in summer months. After the withdrawal of the
monsoon by about the middle of September, both day and night temperatures decrease, the
drop in night temperatures being more rapid. January is the coldest month of the year with the
mean daily maximum temperature even at places below 1200 m drop down to about a degree
below the freezing point of water and frosts occur. Snowfall occurs in the Kangra district
mainly during December to April.
Humidity
The values of relative humidity are generally above 75% during the monsoon months.
In the rest of the year humidity is moderate, its value generally being between 50% to 65%
except during April and May (the driest months), when its values are about 40%.
Figure 1.4. 1: Normal Temperature and relative humidity (Dharamshala Observatory)
Source: Report on Climate of Kangra, Himachal Pradesh 2013

43 | P a g e
Cloudiness
The sky is generally clear or lightly clouded in the post monsoon season. On few days
in the winter season sky is heavily clouded when the district is affected by passing western
disturbances. The sky is heavily clouded during the southwest monsoon season.
Winds
Due to mountainous terrain of the district the wind is highly local. Winds are
generally light and mostly calm in the morning. In the afternoon winds are from southwest or
west throughout the year, with its highest frequency in southwest monsoon season.
Figure 1.4. 2: Mean Wind Speed, Dharamshala Observatory
Source: Report on Climate of Kangra, Himachal Pradesh 2013
Special Weather Phenomena
During the cold season, western disturbances affect the weather over the district.
Thunderstorms occur throughout the year; its frequency is more in latter part of summer and
southwest monsoon season. Thunderstorms in the cold season are occasionally associated
with hail. Occasional dust storms occur in the latter part of summer. Fog generally occurs
during the cold season, particularly in the valleys.
Figure 1.4. 3: Special Weather Phenomena, Dharamshala Observatory
Source: Report on Climate of Kangra, Himachal Pradesh 2013

44 | P a g e
1.5 Soil Profile: Major Soil Classes and Land Slope Classification
The soils in the district are mainly Ochrepts, which are shallow, black, brown and
alluvial. Only in northeastern extreme of the region, Udalf Soils are found which high base
status soils of humid region are. Geographical structures of the district are formed mainly by
alluvial, Shivalik, Muree series, Julogh group and Granites. Scattered patches of thye forests
are seen on the slopes of hills lying mostly in the central part of the district. Population of the
district is mainly confined to the plain areas and river banks. The drainage pattern of the
district is mainly formed by the Beas river. The total area under different major soil classes in
the state stands at 577.12 ha (‘000).
Table 1.5. 1: Major Soil Classification in the Kangra district
Soil Type
Major Soil Classes Area ha. (‘000) (%)
Medium deep to deep, loamy-skeletal soils 134.60 23.32%
Deep, loamy soils 121.89 21.12%
Shallow, loamy-skeletal soils 72.21 12.51%
Medium deep to deep loamy soils 58.35 10.11%
Shallow, loamy soils 57.77 10.01%
Shallow to medium deep, loamy soils 36.97 6.41%
Rock outcrops with shallow, sandy-
skeletal soils
20.22 3.50%
Rock outcrops with shallow, loamy-
skeletal soils
19.64 3.40%
Rock outcrops with deep, loamy-skeletal
soils
15.02 2.60%
Shallow, sandy soils 12.71 2.20%
Deep, loamy-skeletal soils 10.40 1.80%
Rock outcrops with medium deep, loamy-
skeletal, calcareous soils
6.93 1.20%
Deep, sandy soils with 4.04 0.70%
Shallow to medium shallow, loamy soils 3.47 0.60%
Medium to deep, loamy, calcareous soils 2.89 0.50%
Total 577.12 100%
Source: District Agriculture Plan, 2014
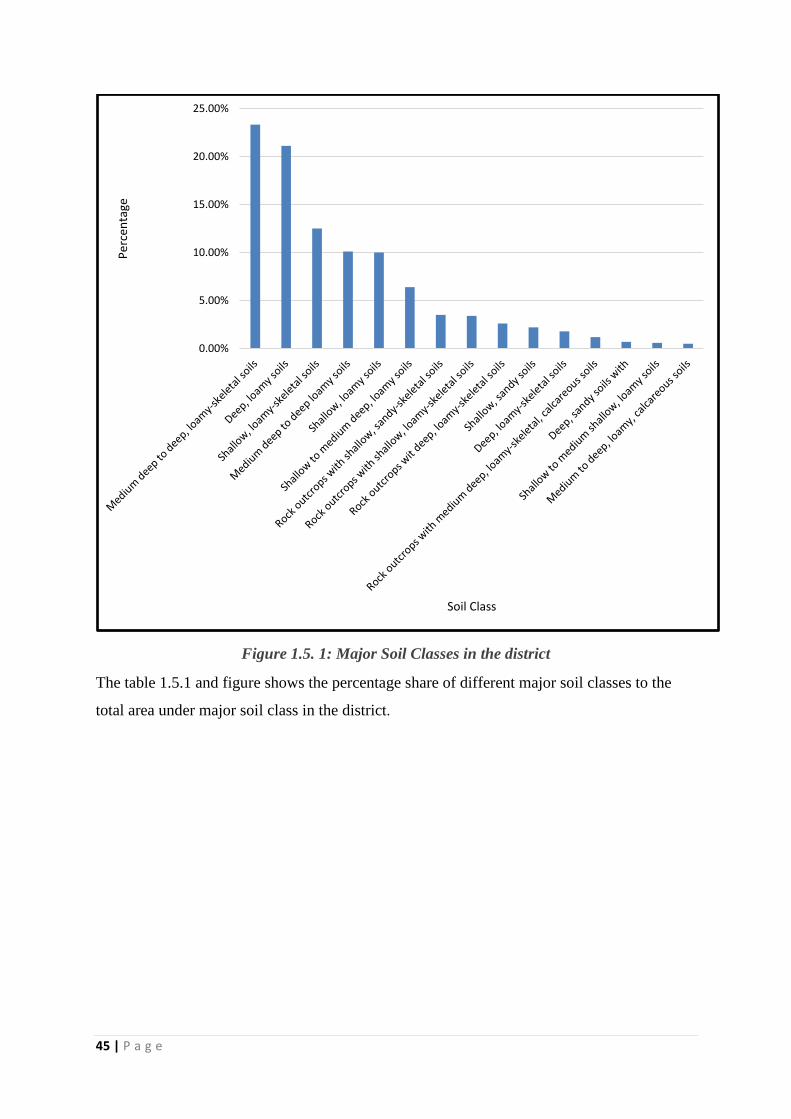
45 | P a g e
Figure 1.5. 1: Major Soil Classes in the district
The table 1.5.1 and figure shows the percentage share of different major soil classes to the
total area under major soil class in the district.
0.00%
5.00%
10.00%
15.00%
20.00%
25.00%P
erce
nta
ge
Soil Class

46 | P a g e
Map 2: Major Soil Classes

47 | P a g e
The table below shows the land slope area of the district under various categories.
Table 1.5. 2: Tehsil-wise area under different land slope category
Tehsil Land Slope
0-3% (Ha) 3-8% (ha) 8-25% (ha) >25% (ha)
Dehra Gopipur 22150.50 9773.32 14531.50 9271.98
Indora 11826.40 6889.64 9426.89 3787.69
Nurpur 10438.90 11934.40 19613.00 14698.20
Shahpur 1286.65 2491.83 4299.85 17669.30
Jawali 4168.24 5464.98 11312.10 10253.40
Fatehpur 7342.29 5382.88 11193.90 6116.76
Harchakian 310.95 947.58 2729.89 2568.49
Dharamshala 373.67 2078.68 5021.79 25398.30
Nagrota
Bagwan
1610.01 2940.95 3259.83 3244.13
Multhan 351.16 1509.08 11944.30 86557.70
Baijnath 1014.55 2739.74 5139.70 19442.00
Palampur 2010.67 5994.04 10081.10 24348.00
Dheera 412.03 724.67 2366.47 4384.83
Jaisighpur 1171.62 1633.48 5379.58 11220.60
Khundian 199.77 791.31 8296.92 9770.04
Baroh 345.95 1311.64 5549.09 5936.37
Kangra 1933.85 3411.70 5953.35 6307.63
Jawalamukhi 1544.81 2823.61 311.25 2348.29
Jaswan 4102.80 2336.12 7182.89 5048.94
Rakkar 991.64 1960.85 4593.25 4057.15
Thural 480.52 693.35 2072.91 2259.46
Total 74066.98 73833.84 150259.56 274689.26
Source: Catsat 1 (Digital Elevation Model)
About 47.55% of the area falls under the category of slope of more than 25%,
followed by 8-25% category which shares 26% of the total geographical area of the district.
The area falling under land slope of 0-3% and 0-8% category shares about 12.82% and
12.77% respectively to the total geographical area of the district.
1.6 Soil Erosion and Runoff Status
A major portion of the district falls within the drainage basin of Beas and Chakki with
little areas under river Ravi. The steep slopes of river and the forest fires which increase the
ash content in the soil which leads to acidic nature of soil are two major reasons of soil

48 | P a g e
erosions. The soil texture of deep loamy soil type with an area of 117,000 ha. is characterised
by moderate erosion. The soils of the Changar region are coarse textured pebble embedded
shallow soils with low water holding capacity and having deep to moderate level of soil
erosion status.
1.7 Land Use Pattern
The total geographical area of the Kangra district is 5,77,671 ha. out of which the area
under cultivation constitutes about 38%. The area under forest is 39.51% of the total
geographical area whereas 38.29% of the total geographical area is under wasteland or other
uses. Under the land use pattern in Kangra district, the gross irrigated area of the district is
1,10,231 ha. which is 44.89% of the gross cropped area whereas the rainfed area constitutes
about 55.11% of the gross cropped area.
Table 1.7. 1: Land Use Pattern with area under cultivation
Block
Total
Geographical
Area (ha)
Area under Agriculture (ha)
Gross
Cropped Area
(1)
Net Sown
Area (2)
Area sown
more than
once (1-2)
Cropping
intensity
(%)
Baijnath 130268 11856 6368 5488 186.18%
Bhawarna 43419 21079 11866 9213 177.64%
Dehra Gopipur 91369 30943 15690 15253 197.21%
Fatehpur 28401 14897 7884 7013 188.95%
Indora 30163 22715 12447 10268 182.49%
Kangra 41906 21591 10966 10625 196.89%
Lambagaon 19117 8570 4404 4166 194.60%
Nagrota Bagwan 30386 17298 8941 8357 193.47%
Nagrota Surian 7252 2533 1288 1245 196.66%
Nurpur 53859 34033 17494 16539 194.54%
Panchrukhi 8022 3212 1663 1549 193.14%
Pragpur 28601 10000 5225 4775 191.39%
Rait 23842 9237 4857 4380 190.18%
Bhedu Mahadev 5823 2447 1245 1202 196.55%
Dharamshala 35243 9276 4970 4306 186.64%
Total 577671 219687 115308 104379
Source: Department of Agriculture 2012-13
* The Gross cropped area in the above table is for the year 2012-13 whereas the gross
cropped area discussed in the subsequent Chapter 2, is arrived after calculating the total

49 | P a g e
area under crop for the year 2014-15. The difference of 25892 ha. is due to the difference
in the period of data captured.
Table 1.7. 2: Land Use Pattern with area under non-cultivation
Block Total
Geographical
Area (ha)
Area under
forest (ha)
Area under
wasteland (ha)
Area under
other uses
(ha)
Baijnath 130268 81654 5196 35126
Bhawarna 43419 18493 4558 7967
Dehra Gopipur 91369 12118 39411 22058
Fatehpur 28401 4847 4384 9772
Indora 30163 4852 7555 4604
Kangra 41906 15668 5328 9185
Lambagaon 19117 2776 2911 8484
Nagrota Bagwan 30386 13736 4035 3172
Nagrota Surian 7252 4151 520 1181
Nurpur 53859 18451 7052 8657
Panchrukhi 8022 2617 2327 1039
Pragpur 28601 8321 7000 7295
Rait 23842 14635 2119 2096
Bhedu Mahadev 5823 1681 795 1888
Dharamshala 35243 24244 3261 2216
Total 577671 228244 96452 124740
Source: Department of Agriculture, 2012-13

50 | P a g e
Figure 1.7. 1: Block-wise percentage of gross cropped area in the district
Figure 1.7.1 shows the percentage wise distribution of gross cropped area in the
district. Nurpur and Dehra blocks constitute about 15.5% and 14%, respectively to the total
gross cropped area in the district.
Figure 1.7. 2: Block-wise Percentage of Area under Forest
5.40%
9.60%
14.09%
6.78%
10.34%9.83%
3.90%
7.87%
1.15%
15.49%
1.46%
4.55%4.20%
1.11%
4.22%
0.00%
2.00%
4.00%
6.00%
8.00%
10.00%
12.00%
14.00%
16.00%
18.00%
Gross Cropped Area (%)
Gross Cropped Area (1)
35.77%
8.10%5.31%
2.12%2.13%
6.86%
1.22%
6.02%
1.82%
8.08%
1.15%3.65%
6.41%
0.74%
10.62%
0.00%
5.00%
10.00%
15.00%
20.00%
25.00%
30.00%
35.00%
40.00%
Area under forest (%)
Area under forest
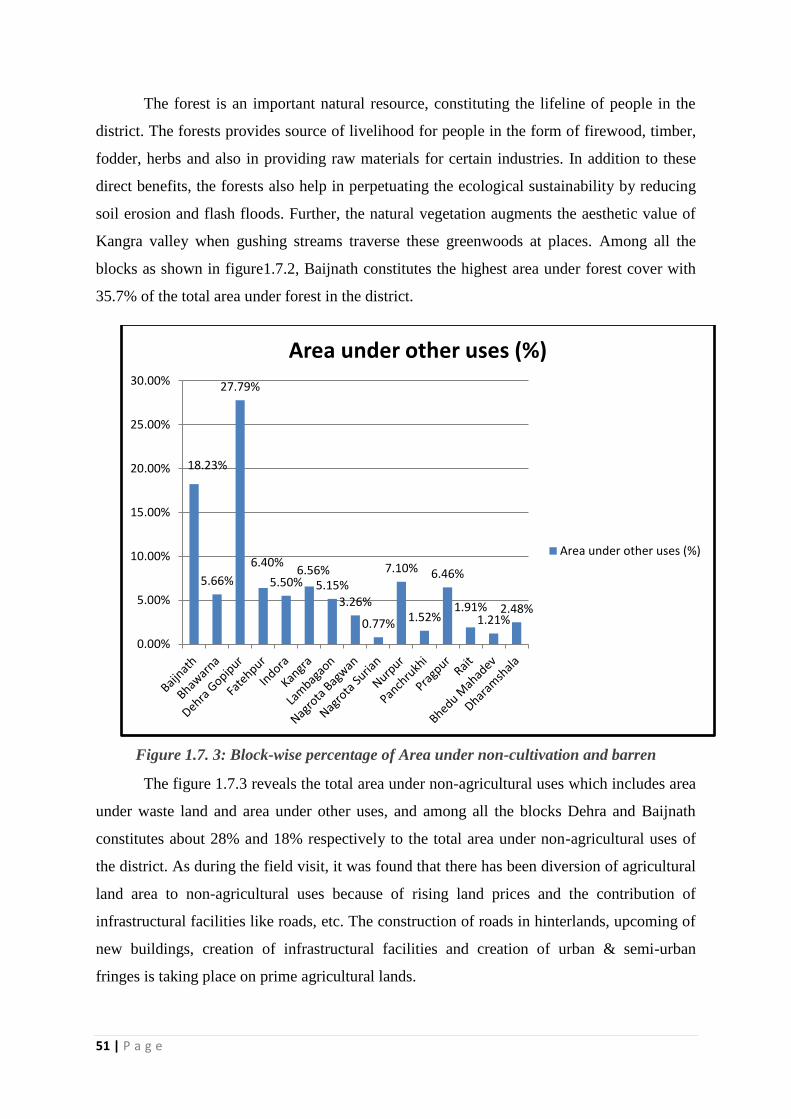
51 | P a g e
The forest is an important natural resource, constituting the lifeline of people in the
district. The forests provides source of livelihood for people in the form of firewood, timber,
fodder, herbs and also in providing raw materials for certain industries. In addition to these
direct benefits, the forests also help in perpetuating the ecological sustainability by reducing
soil erosion and flash floods. Further, the natural vegetation augments the aesthetic value of
Kangra valley when gushing streams traverse these greenwoods at places. Among all the
blocks as shown in figure1.7.2, Baijnath constitutes the highest area under forest cover with
35.7% of the total area under forest in the district.
Figure 1.7. 3: Block-wise percentage of Area under non-cultivation and barren
The figure 1.7.3 reveals the total area under non-agricultural uses which includes area
under waste land and area under other uses, and among all the blocks Dehra and Baijnath
constitutes about 28% and 18% respectively to the total area under non-agricultural uses of
the district. As during the field visit, it was found that there has been diversion of agricultural
land area to non-agricultural uses because of rising land prices and the contribution of
infrastructural facilities like roads, etc. The construction of roads in hinterlands, upcoming of
new buildings, creation of infrastructural facilities and creation of urban & semi-urban
fringes is taking place on prime agricultural lands.
18.23%
5.66%
27.79%
6.40%
5.50%6.56%
5.15%
3.26%
0.77%
7.10%
1.52%
6.46%
1.91%1.21%
2.48%
0.00%
5.00%
10.00%
15.00%
20.00%
25.00%
30.00%
Area under other uses (%)
Area under other uses (%)

52 | P a g e
The LULC map of the district for the year 2002 and 2015 (Map-3 and Map-4) given below
also shows the decrease in the area of agricultural land.
Map 3: LULC Map Kangra district, 2002

53 | P a g e
Map 4: LULC Map of Kangra district, 2015

54 | P a g e
Figure 1.7. 4: LULC Change detection
From the figure above, it can be shown that from 2002 to 2015 the area under forest
has increased by 19.7% while area under grassland showed a negative trend of 23.7% during
the same period. The build-up land and the water bodies also have negative growth rate from
2002 to 2015 decreasing by 2.3% and 0.3% respectively. The agriculture growth in the
district showed a negative trend of 1.6%. The area under non-cultivation or barren land also
decreased by 4%.

55 | P a g e
Chapter II
District Water Profile
Irrigation is the artificial application of water to the land or soil which is used to assist
in the production of agricultural crops, maintenance of landscapes, and revegetation of
disturbed soil in dry areas and during periods of inadequate rainfall. India has a great
diversity and variety of climate and weather conditions which range from extreme heat to
extreme cold and from extreme dryness to excessive rainfall. Due to the reasons as cited
below, irrigation is imperative in Indian agriculture.
a) Uncertainty of Monsoon rainfall both in time and place.
b) Irregularity in distribution of rainfall throughout the year.
c) Excessive rainfall causing flood.
d) Draught is an annual event in some areas.
e) India is a land of rabi crops with negligible or scanty rainfall in winter months.
f) Requirement of excess water depending on nature of soil.
g) Introduction of H.Y.V seeds and multiple cropping need water throughout the year
The main modes through which irrigation is practiced in Kangra are:
1. Tanks
2. Well
(a)Dug Well
(b) Tube Well
(i) Shallow Tube Well
(ii) Deep Tube Well
3. Canal
(a) Perennial
(b) Non-Perennial
2.1 Crop water Requirement
Crop water requirement is the water required by the plants for its survival, growth,
development and to produce components thereby generating economic value. This
requirement is applied either naturally by precipitation or artificially by irrigation. Broadly,
the water requirement for any crop includes water lossess in the form as listed below:

56 | P a g e
a) Transpiration loss through leaves
b) Evaporation loss through soil surface in cropped area
c) Amount of water used by plants for its metabolic activities which is estimated as
less than 1% of the total water absorption.
d) The water required for special purposes (WSP) like puddling operation, ploughing
operation, land preparation, leaching, etc.
Table 2.1. 1: Block-wise crop area
Blocks Kharif (ha) Rabi (ha) Total (ha) Gross
Cropped
area (ha)
Irrigated Rainfed Irrigated Rainfed Irrigated Rainfed
Baijnath 3850.5 3749.5 2884.5 3525.5 6735 7275 14010
Bhawarna 3375 3125 2668.5 3261.5 6043.5 6386.5 12430
Dehra
Gopipur
3982.5 4137.5 3534 4326 7516.5 8463.5 15980
Fatehpur 4332 4218 3567 4363 7899 8581 16480
Indora 3876 3894 3522 4308 7398 8202 15600
Kangra 3031.5 3028.5 2996.5 3663.5 6028 6692 12720
Lambagaon 3394.5 3555.5 2842.5 3477.5 6237 7033 13270
Nagrota
Bagwan
4002 3898 2991 3659 6993 7557 14550
Nagrota
Surian
3844.5 3935.5 3256.5 3983.5 7101 7919 15020
Nurpur 4363.5 4256.5 3477 4253 7840.5 8509.5 16350
Panchrukhi 3147 3013 2704.5 3305.5 5851.5 6318.5 12170
Pragpur 3853.5 4046.5 3571.5 4368.5 7425 8415 15840
Rait 3013.5 3006.5 2561.5 3138.5 5575 6145 11720
Bhedu
Mahadev
2728.5 2651.5 2644.5 3235.5 5373 5887 11260
Dharamshala 2793 2747 1889 2311 4682 5058 9740
Total 53587.5 53262.5 45110.5 55179.5 98698 108442 207140
Source: Department of Agriculture, 2014-15

57 | P a g e
The total area under crop production or the gross cropped area of the district is
2,07,140 ha. for both kharif and rabi season crops. About 51.58% of the gross cropped area is
under kharif whereas 48.42% of the area is under rabi season crops. 25.87% of the gross
cropped area is under irrigated condition in the kharif season while 25.71% of the area is
grown under rainfed condition. Whereas, 21.77% of the gross cropped area, is grown under
irrigated condition in rabi season and 26.64% is grown under rainfed condition. The pictorial
representation of gross cropped area as percentage of Kharif and Rabi season is depicted in
the figure 2.1.1 below.
Figure 2.1. 1: Gross cropped area as percentage of Kharif and Rabi season
Paddy being the most cultivated crop under kharif season and it is grown in every
block of the district. The total area under irrigated cultivation stands at 98,698 ha and under
rainfed condition it is 1,08,442 ha which constitute about 47.65% and 52.35% respectively of
the gross cropped area of the district. Further, it is evident from the above figure that
approximately 52.35% of the gross cropped area may be considered as potential chunk of
land to be brought under irrigation facilities.
The area under horticulture cultivation is given in table 2.1.2
Table 2.1. 2: Area under Horticulture
Blocks Area (ha) Irrigated (ha) Rainfed (ha.)
Baijnath 1499 450 1049
Bhawarna 1526 458 1068
25.87%
25.71%21.78%
26.64%
Percentage Share to total gross cropped area
Kharif Irrigated
Kharif Rainfed
Rabi Irrigated
Rabi Rainfed
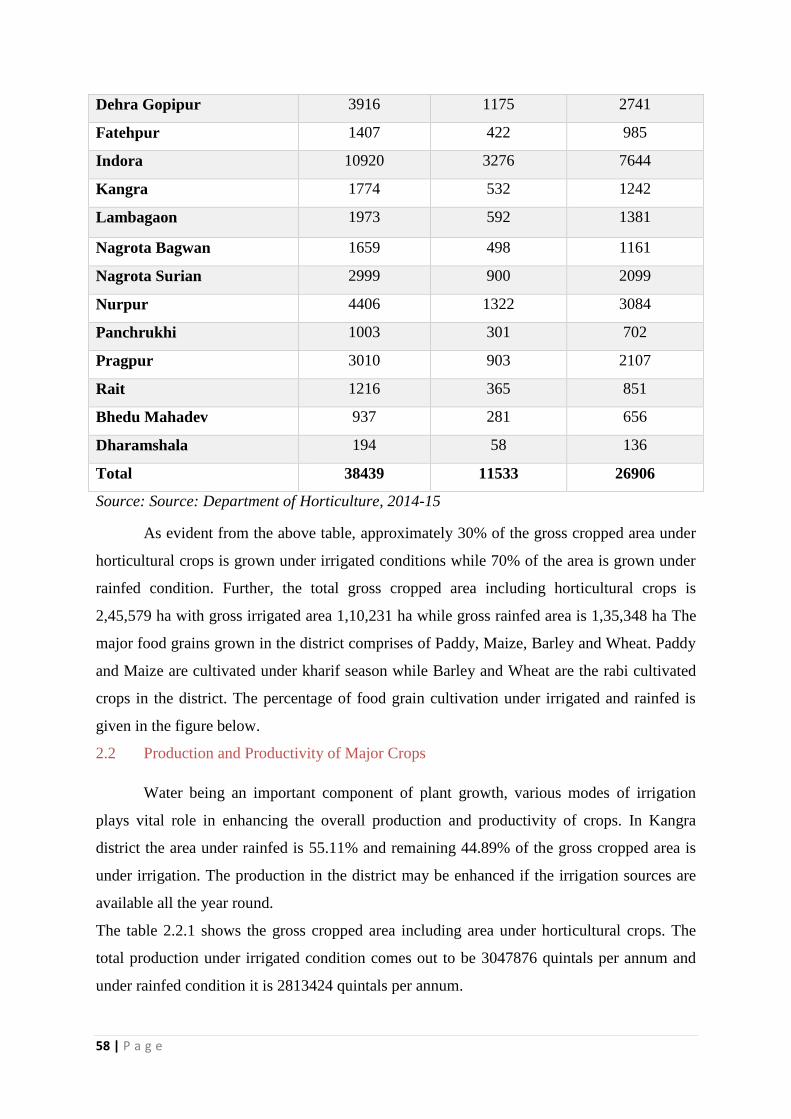
58 | P a g e
Dehra Gopipur 3916 1175 2741
Fatehpur 1407 422 985
Indora 10920 3276 7644
Kangra 1774 532 1242
Lambagaon 1973 592 1381
Nagrota Bagwan 1659 498 1161
Nagrota Surian 2999 900 2099
Nurpur 4406 1322 3084
Panchrukhi 1003 301 702
Pragpur 3010 903 2107
Rait 1216 365 851
Bhedu Mahadev 937 281 656
Dharamshala 194 58 136
Total 38439 11533 26906
Source: Source: Department of Horticulture, 2014-15
As evident from the above table, approximately 30% of the gross cropped area under
horticultural crops is grown under irrigated conditions while 70% of the area is grown under
rainfed condition. Further, the total gross cropped area including horticultural crops is
2,45,579 ha with gross irrigated area 1,10,231 ha while gross rainfed area is 1,35,348 ha The
major food grains grown in the district comprises of Paddy, Maize, Barley and Wheat. Paddy
and Maize are cultivated under kharif season while Barley and Wheat are the rabi cultivated
crops in the district. The percentage of food grain cultivation under irrigated and rainfed is
given in the figure below.
2.2 Production and Productivity of Major Crops
Water being an important component of plant growth, various modes of irrigation
plays vital role in enhancing the overall production and productivity of crops. In Kangra
district the area under rainfed is 55.11% and remaining 44.89% of the gross cropped area is
under irrigation. The production in the district may be enhanced if the irrigation sources are
available all the year round.
The table 2.2.1 shows the gross cropped area including area under horticultural crops. The
total production under irrigated condition comes out to be 3047876 quintals per annum and
under rainfed condition it is 2813424 quintals per annum.

59 | P a g e
Table 2.2. 1: Production (Qtl/annum) and Productivity (Kg/ha)
Blocks Gross cropped
area (ha)
Irrigated Rainfed
Production Productivity Production Productivity
Baijnath 15509 221988 3090 204912 2462
Bhawarna 13956 190268 2927 175632 2356
Dehra
Gopipur
19896 223808 2575 206592 1844
Fatehpur 17887 240760 2893 222240 2323
Indora 26520 235716 2208 217584 1373
Kangra 14494 198380 3024 183120 2308
Lambagaon 15243 193804 2838 178896 2126
Nagrota
Bagwan
16209 220428 2943 203472 2334
Nagrota
Surian
18019 195832 2448 180768 1804
Nurpur 20756 226356 2470 208944 1802
Panchrukhi 13173 188864 3070 174336 2483
Pragpur 18850 213460 2563 197040 1873
Rait 12936 178568 3006 164832 2356
Bhedu
Mahadev
12197 173368 3066 160032 2446
Dharamshala 9934 146276 3086 135024 2600
Total 245579 3047876 2813424
Source: Department of Agriculture, 2014-15
From table 2.2.1 and figure 2.2.1, it can be inferred that the total production under irrigated is
more than the rainfed by 8.33% even though the area cultivated under rainfed is 22.8% higher
as compared to the total area under irrigated in the district.
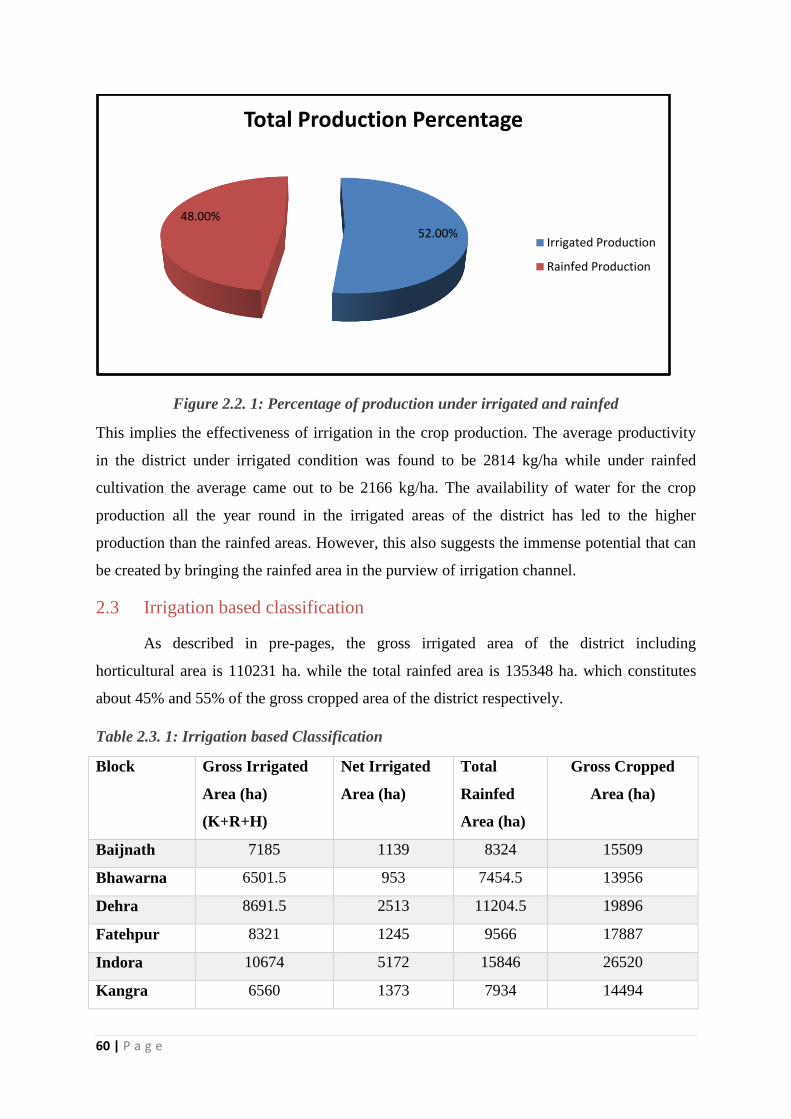
60 | P a g e
Figure 2.2. 1: Percentage of production under irrigated and rainfed
This implies the effectiveness of irrigation in the crop production. The average productivity
in the district under irrigated condition was found to be 2814 kg/ha while under rainfed
cultivation the average came out to be 2166 kg/ha. The availability of water for the crop
production all the year round in the irrigated areas of the district has led to the higher
production than the rainfed areas. However, this also suggests the immense potential that can
be created by bringing the rainfed area in the purview of irrigation channel.
2.3 Irrigation based classification
As described in pre-pages, the gross irrigated area of the district including
horticultural area is 110231 ha. while the total rainfed area is 135348 ha. which constitutes
about 45% and 55% of the gross cropped area of the district respectively.
Table 2.3. 1: Irrigation based Classification
Block Gross Irrigated
Area (ha)
(K+R+H)
Net Irrigated
Area (ha)
Total
Rainfed
Area (ha)
Gross Cropped
Area (ha)
Baijnath 7185 1139 8324 15509
Bhawarna 6501.5 953 7454.5 13956
Dehra 8691.5 2513 11204.5 19896
Fatehpur 8321 1245 9566 17887
Indora 10674 5172 15846 26520
Kangra 6560 1373 7934 14494
52.00%
48.00%
Total Production Percentage
Irrigated Production
Rainfed Production
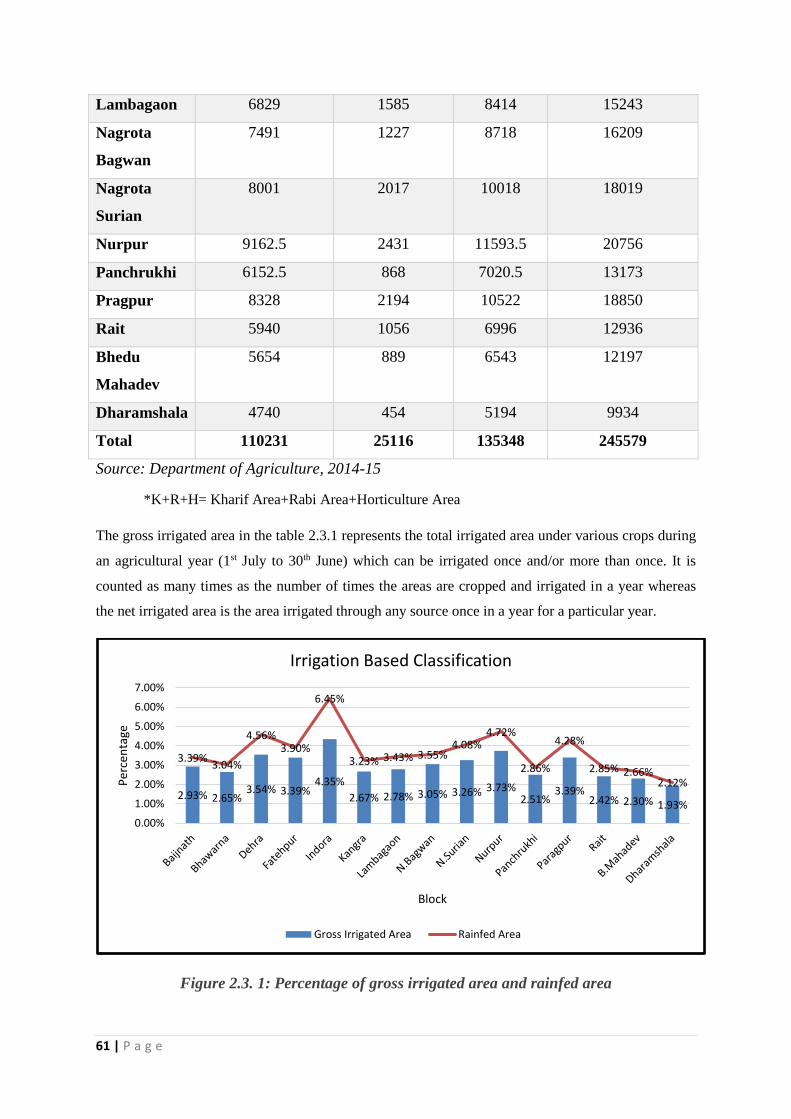
61 | P a g e
Lambagaon 6829 1585 8414 15243
Nagrota
Bagwan
7491 1227 8718 16209
Nagrota
Surian
8001 2017 10018 18019
Nurpur 9162.5 2431 11593.5 20756
Panchrukhi 6152.5 868 7020.5 13173
Pragpur 8328 2194 10522 18850
Rait 5940 1056 6996 12936
Bhedu
Mahadev
5654 889 6543 12197
Dharamshala 4740 454 5194 9934
Total 110231 25116 135348 245579
Source: Department of Agriculture, 2014-15
*K+R+H= Kharif Area+Rabi Area+Horticulture Area
The gross irrigated area in the table 2.3.1 represents the total irrigated area under various crops during
an agricultural year (1st July to 30th June) which can be irrigated once and/or more than once. It is
counted as many times as the number of times the areas are cropped and irrigated in a year whereas
the net irrigated area is the area irrigated through any source once in a year for a particular year.
Figure 2.3. 1: Percentage of gross irrigated area and rainfed area
2.93% 2.65%3.54% 3.39%
4.35%
2.67% 2.78% 3.05% 3.26% 3.73%2.51%
3.39%2.42% 2.30% 1.93%
3.39%3.04%
4.56%3.90%
6.45%
3.23% 3.43% 3.55%4.08%
4.72%
2.86%
4.28%
2.85% 2.66%2.12%
0.00%
1.00%
2.00%
3.00%
4.00%
5.00%
6.00%
7.00%
Per
cen
tage
Block
Irrigation Based Classification
Gross Irrigated Area Rainfed Area
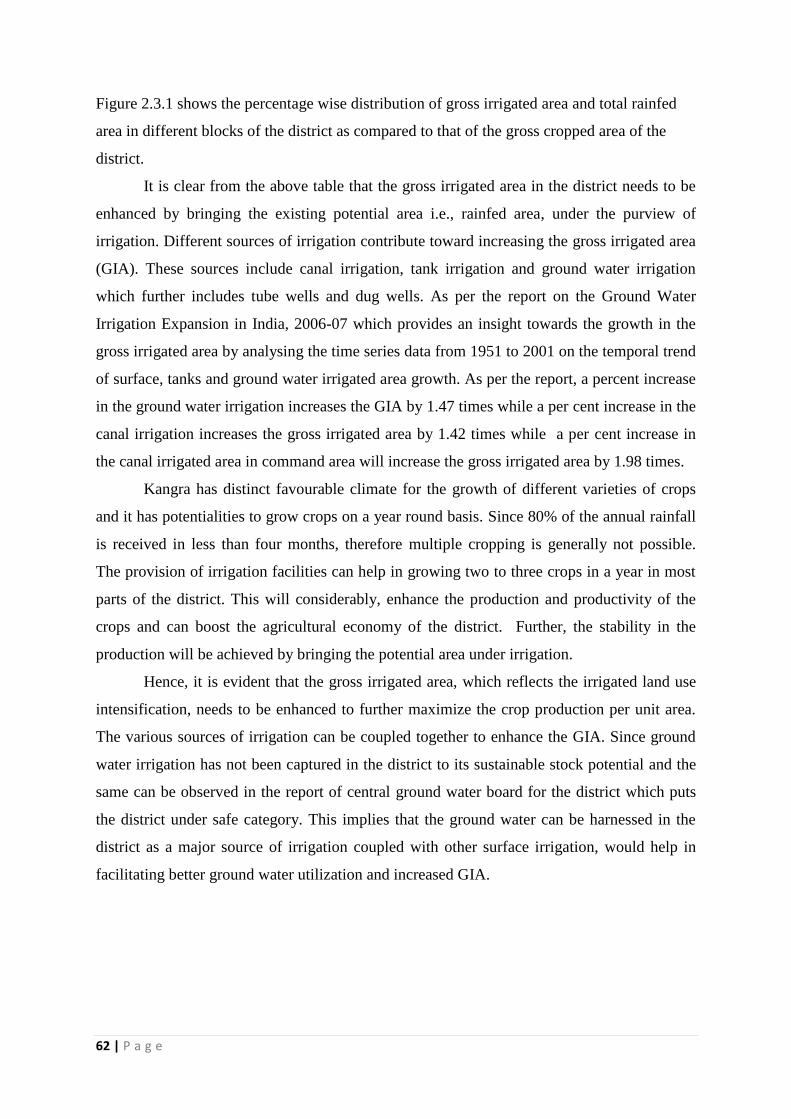
62 | P a g e
Figure 2.3.1 shows the percentage wise distribution of gross irrigated area and total rainfed
area in different blocks of the district as compared to that of the gross cropped area of the
district.
It is clear from the above table that the gross irrigated area in the district needs to be
enhanced by bringing the existing potential area i.e., rainfed area, under the purview of
irrigation. Different sources of irrigation contribute toward increasing the gross irrigated area
(GIA). These sources include canal irrigation, tank irrigation and ground water irrigation
which further includes tube wells and dug wells. As per the report on the Ground Water
Irrigation Expansion in India, 2006-07 which provides an insight towards the growth in the
gross irrigated area by analysing the time series data from 1951 to 2001 on the temporal trend
of surface, tanks and ground water irrigated area growth. As per the report, a percent increase
in the ground water irrigation increases the GIA by 1.47 times while a per cent increase in the
canal irrigation increases the gross irrigated area by 1.42 times while a per cent increase in
the canal irrigated area in command area will increase the gross irrigated area by 1.98 times.
Kangra has distinct favourable climate for the growth of different varieties of crops
and it has potentialities to grow crops on a year round basis. Since 80% of the annual rainfall
is received in less than four months, therefore multiple cropping is generally not possible.
The provision of irrigation facilities can help in growing two to three crops in a year in most
parts of the district. This will considerably, enhance the production and productivity of the
crops and can boost the agricultural economy of the district. Further, the stability in the
production will be achieved by bringing the potential area under irrigation.
Hence, it is evident that the gross irrigated area, which reflects the irrigated land use
intensification, needs to be enhanced to further maximize the crop production per unit area.
The various sources of irrigation can be coupled together to enhance the GIA. Since ground
water irrigation has not been captured in the district to its sustainable stock potential and the
same can be observed in the report of central ground water board for the district which puts
the district under safe category. This implies that the ground water can be harnessed in the
district as a major source of irrigation coupled with other surface irrigation, would help in
facilitating better ground water utilization and increased GIA.

63 | P a g e
Chapter III
District Water Availability
The Beas River forms the major drainage system in the district. The river Beas and its
tributaries drain almost the entire district, except the north eastern part which is drained by
the river Ravi. There are two important lakes in the district, namely Dal Lake and Kareri
Lake. The major sources of irrigation are small water channels or the Kuhls in the district. An
area of 36,444 hectare has been brought under irrigation by various sources like canals, tanks,
wells and others. A part of the cultivated area of the district is not having any assured
irrigation facilities and the agriculturists have to depend on the vagaries of weather. The
hydrogeological frame work of the district is essentially controlled by the geological setting,
distribution of rainfall, snow fall, which facilitates circulation and movement of water
through inter-connected primary and secondary porosity of the rocks constituting the
aquifers.
3.1 Status of Water Availability
Based on the geological diversities and relative ground water potentialities of
different geological formations, the district can broadly be divided into two hydrogeological
units
a. Fissured formations
b. Porous formations
Fissured formation
Fissured formations comprises of hard rocks and in this hard rock terrain ground
water occurs either, along structurally week zones, viz. fracture zones, faults, joints or along
the contacts of different formations. The ground water in such areas is discharged through the
springs in the topographically favourable areas. The thrust faults (Main boundary
Fault/Palampur Thrust) and other faults at lower topography are the important areas for
ground water development. Springs located along the thrust zone in Dharamsala and
Palampur areas are having a discharge of more than 40 lps, indicative of their high
potentialities.
Compact conglomeratic formations are generally devoid of water, but hand pumps
have been successfully installed in areas having low topography and along fractured zones.
The boreholes drilled for installing hand-pumps have yield of about 20 lps. Discharge is

64 | P a g e
generally higher in Jawalamukhi area along the thrust zone. Depth to water varies from free
flowing condition at Darshanpur (Trilokpur) to about 30 m in the bored wells. Depth to water
in shallow zones (dug wells-NHS), generally varies from less than 1 m to 15.44 m. Water
level is shallower in topographic lows.
Porous formation
Quaternary sediments as fluvio-glacial and fluvitile deposits occur as valley fill
deposits, overlying the older rocks. Morainic and fluvio-glacial deposits are distributed in
Kangra Palampur valley and in the higher altitude areas, while fluvitile deposits occur either
along Beas River or its tributaries in low altitude areas. The sources of irrigation in the
district mainly comprises of tanks and lift irrigation.
Table 3.1. 1: Sources of Irrigation
Sl. No. Sources Kharif
(MCM)
Rabi
(MCM)
Summer
(MCM)
Total
(MCM)
1 Surface Irrigation
(i) Canal (Major & medium irrigation)
(ii) Minor Irrigation tanks 0.00007 0.00052 0.00059
(iii) Lift Irrigation/ Diversion 0.00007 0.00052 0.00059
(iv) Various water bodies including Rain
Water Harvesting
0 0 0 0
(v) Treated Effluent Received from STP 0.014 0.014 0.014 0.042
(vi) Untreated Effluent 0 0 0 0
(vii) Perennial sources of water 0 0 0 0
2 Ground Water 30 27 24 81
(i) Open Well 0 0 0 0
(ii) Deep Tube Well 0 0 0 0
(iii) Medium Tube Well 0 0 0 0
(iv) Shallow Tube Wells 0 0 0 0
Source: I&PH Department, Dharamshala
As per the table 3.1.1 it can be inferred that minor irrigation tank and lift irrigation are the
major sources of surface irrigation. However, treated effluent received from STP also formed
a source of irrigation in the district as gathered during discussion with field level
functionaries. The ground water availability stands at 81 MCM in the district.

65 | P a g e
3.2 Ground Water Resources
Rainfall is the major source of groundwater recharge, apart from the influent seepage
from the rivers, irrigated fields and inflow from upland areas, whereas discharge from ground
water mainly takes place from wells and tube wells; effluent seepages of ground water in the
form of springs and base flow in streams etc. The ground water level in different parts of the
district can be observed from the Map 5 given below.
Map 5: Ground Water Level, 2012
Besides the ground water level in various parts of the district, the ground water resources and
irrigation potential have been computed for Indora and Nurpur valley in Kangra district, as
per the GEC-97 methodology the details of which is given in the table 3.2.1 below.
Table 3.2. 1: Indora valley ground water status
Indora Valley (26,545 ha.)
Annual Ground Water Availability 10520.18 ha m
Annual Ground Water Draft 5263.72 ha m
Stage of Ground Water Development 50.03%
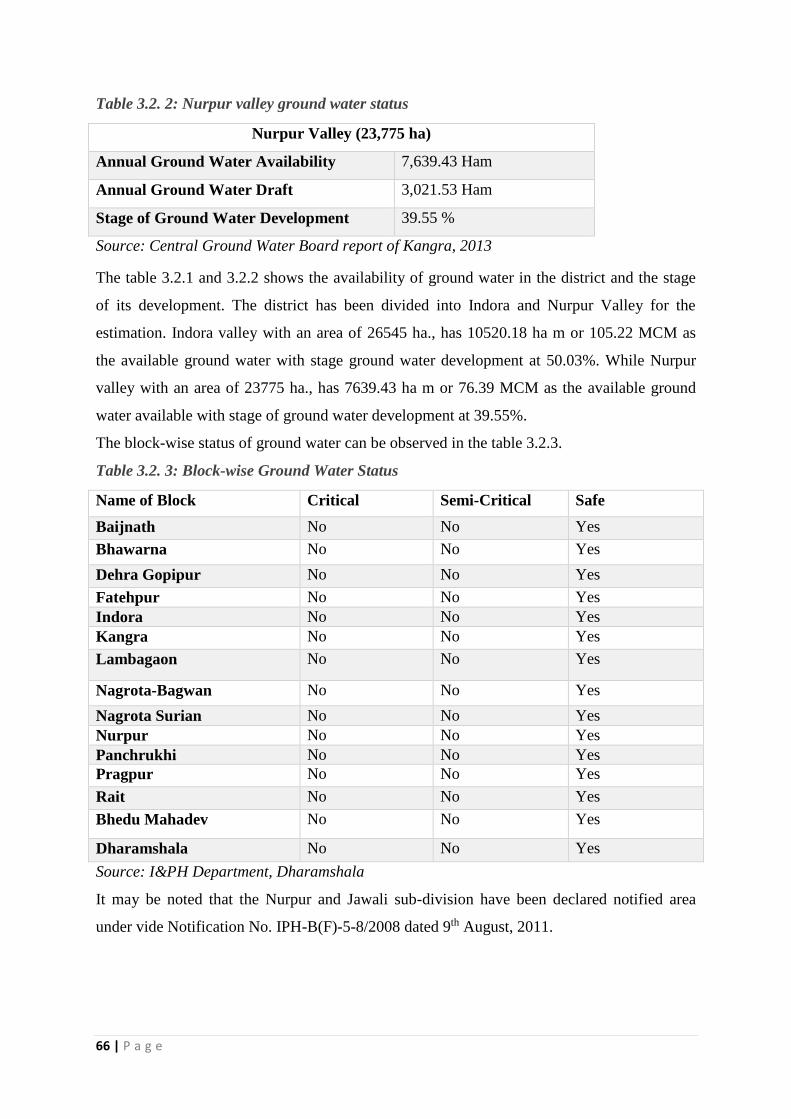
66 | P a g e
Table 3.2. 2: Nurpur valley ground water status
Nurpur Valley (23,775 ha)
Annual Ground Water Availability 7,639.43 Ham
Annual Ground Water Draft 3,021.53 Ham
Stage of Ground Water Development 39.55 %
Source: Central Ground Water Board report of Kangra, 2013
The table 3.2.1 and 3.2.2 shows the availability of ground water in the district and the stage
of its development. The district has been divided into Indora and Nurpur Valley for the
estimation. Indora valley with an area of 26545 ha., has 10520.18 ha m or 105.22 MCM as
the available ground water with stage ground water development at 50.03%. While Nurpur
valley with an area of 23775 ha., has 7639.43 ha m or 76.39 MCM as the available ground
water available with stage of ground water development at 39.55%.
The block-wise status of ground water can be observed in the table 3.2.3.
Table 3.2. 3: Block-wise Ground Water Status
Name of Block Critical Semi-Critical Safe
Baijnath No No Yes
Bhawarna No No Yes
Dehra Gopipur No No Yes
Fatehpur No No Yes
Indora No No Yes
Kangra No No Yes
Lambagaon No No Yes
Nagrota-Bagwan No No Yes
Nagrota Surian No No Yes
Nurpur No No Yes
Panchrukhi No No Yes
Pragpur No No Yes
Rait No No Yes
Bhedu Mahadev No No Yes
Dharamshala No No Yes
Source: I&PH Department, Dharamshala
It may be noted that the Nurpur and Jawali sub-division have been declared notified area
under vide Notification No. IPH-B(F)-5-8/2008 dated 9th August, 2011.

67 | P a g e
Table 3.2.4 shows the block-wise annual draft and recharge in the district.
Precipitation is the principal source of Ground water recharge to aquifer systems in the
district. The return flow from the irrigation systems like tube well irrigation, surface water lift
irrigation, kuhl irrigation are the main sources of ground water recharge. Inflow seepage from
khads, rivers, and water reservoirs (pong dam) also contribute to the ground water reserves.
Table 3.2. 4: Block-wise data on Annual Draft, Recharge and Gap of ground water
Name of Block Draft (MCM) Recharge (MCM) Gap (MCM)
Baijnath 0.005472 0.001094 0.004378
Bhawarna 0.004752 0.00095 0.003802
Dehra Gopipur 0.014616 0.002922 0.011693
Fatehpur N/A N/A N/A
Indora N/A N/A N/A
Kangra 0.004248 0.00085 0.003398
Lambagaon 0.004248 0.00085 0.003398
Nagrota-Bagwan 0.004968 0.000994 0.003974
Nagrota Surian N/A N/A N/A
Nurpur N/A N/A N/A
Panchrukhi 0.004104 0.000821 0.003283
Pragpur 0.005162 0.001032 0.00413
Rait 0.005544 0.001109 0.004435
Bhedu Mahadev 0.004471 0.000894 0.003577
Dharamshala 0.004262 0.000852 0.00341
Total 0.061847 0.012368 0.049478
Source: I&PH Department, Dharamshala
The estimation of annual draft and recharge in the district shows that about 0.04947
MCM of gap exists in the district. The annual draft of ground water takes place in terms of
extraction through dug wells, hand pumps, tube-wells, bowries. The springs are the major
sources of water supply to both rural and urban areas, but the availability of water during
summer is limited, particularly in drought years and requires immediate attention to augment
this resource. Based upon the climatic conditions, topography, hydro-geology of the area,
suitable structures for rain water harvesting and artificial recharge to ground water are
required. Roof top rainwater harvesting need to be adopted in urban areas and proper
scientific intervention for spring development and revival is required in water scarce areas.

68 | P a g e
Figure 3.2. 1: Block-wise Annual Draft, Recharge and Gap
In hilly areas, structures like nalla bunds, gabbion structures, check dams, check dam
cum ground water dams, subsurface dykes, and revival of ponds are recommended, while in
low hill ranges, check dam and roof top rain water harvesting structures can be adopted. So
far, 5 projects were taken up under XIth plan, which are under implementation by I&PH
Department of the district i.e. at Mandirnala (Jawalamukhi temple), Thera nala at Toru, Kona
nala at Duhuk, Jajhar nala at Duhuk and Piyungal nala.
0
0.002
0.004
0.006
0.008
0.01
0.012
0.014
0.016
Draft (MCM) Recharge (MCM) Gap (MCM)

69 | P a g e
Map 6: Artificial recharge scheme for Kangra

70 | P a g e
3.3 Status of Command Area
In the district, all the major irrigation and drinking water supplies depend on the tube
wells and dug wells in addition to various water supply schemes based on rivers / nallas.
Irrigation & Public Health Department being a nodal agency in the district, dealing with
water, taps number of springs with a yield of discharge less than 1 lps to more than 40 lps, are
perennial and water supply based on these springs. Generally, these springs are tapped at the
source, so that the water can be supplied under gravity. These springs are generally contact or
depression types.
Large scale development for ground water is seen in the valley areas, particularly in the
Indora, Nurpur, Kangra and Palampur Valleys. There exists a wide scope to explore the
potentialities of rest of the areas for ground water. The drainage maps, Map 7 and Map 8, given
below shows the area of land where monsoon drains downhill into water bodies. The comparison
of both the maps, can help in determining where the rainfall naturally flows over the land and
downstream to a particular watercourse. It can be used in identifying the command area for a
point along a river, stream, reservoir, lake or pond.
Map 7: Pre-Monsoon drainage in Kangra district

71 | P a g e
Map 8: Post Monsoon drainage map, Kangra district
Table 3.3.1 shows the status of developed and undeveloped area in the district under
canal command. The area under canal command is 90135.69 ha, of which 22.37% has been
developed under various schemes of canal command by the I&PH department of the district
whereas, 77.63% of the area still lies under undeveloped category.
Table 3.3. 1: Developed and Undeveloped area under Canal Command and other services
command
Sl.
No.
Name of the
village/Blocks
Information of canal command
Total Area
(ha.)
Developed Area
(ha.)
Undeveloped Area
(ha.)
1 Baijnath 5664 1416 4248
2 Bhawarna 13412 3353 10059
3 Dehra Gopipur 7032 1758 5274
4 Fatehpur 8061.64 1612.33 6449.31
5 Indora 8960 1792 7168
6 Kangra 2908 727 2181
7 Lambagaon 6228 1557 4671
8 Nagrota-Bagwan 8296 2074 6222
9 Nagrota Surian 3803 325 3478

72 | P a g e
10 Nurpur 4234.05 130 4104.05
11 Panchrukhi 3798 987 2811
12 Pragpur 4135 1035 3100
13 Rait 4084 1021 3063
14 Bhedu Mahadev 6400 1600 4800
15 Dharamshala 3120 780 2340
Total 90135.69 20167.33 69968.36
Source: I&PH Department, Dharamshala
The undeveloped area as shown in the table above reflects another aspect of existing
gap for the On Farm Development which seems to be one of the contributing factors for the
gap between irrigation potential created and utilised.
Figure 3.3. 1: Developed and undeveloped area under canal command
The longer gestation period of major irrigation projects under canal command is the major
reason for the larger undeveloped area. Besides the factor sighted, limitations such as
envisaging of cropping pattern and crop water requirement has also led to the existing gap.
3.4 Existing Type of Irrigation
In total, there are 151 sources of irrigation in the Kangra district under different
blocks. The major source of irrigation is surface irrigation while in some areas like Indora
0
2000
4000
6000
8000
10000
12000
Developed Area (ha.) Undeveloped Area (ha.)

73 | P a g e
and Nurpur Valley, ground water forms the major source of irrigation. The water extracting
unit given in the table below is used for lift irrigation source.
Table 3.4. 1: Existing type of Irrigation
Block Surface Irrigation
Sources (No.)
Canal Based
irrigation (Ha.)
Water
extracting Unit
under Lift
Irrigation (No.)
Baijnath 13 1416 10
Bhawarna 12 3353 8
Dehra Gopipur 17 1758 42
Fatehpur 10 4947 70
Indora 6 7835 105
Kangra 13 727 26
Lambagaon 19 1557 28
Nagrota-Bagwan 25 2074 16
Nagrota Surian 9 3150 45
Nurpur 11 - 56
Panchrukhi 5 987 18
Pragpur 14 1035 20
Rait 8 1021 12
Bhedu Mahadev 13 1600 20
Dharamshala 12 780 0
Total 187 32240 476
Source: I&PH Department, Dharamshala & Nurpur
Table 3.4.1 shows the existing type of irrigation prevailing in different blocks of the
district. The surface irrigation sources mainly consists of the canal based and river based
irrigation channel and about 32240 ha of the area has been developed under it. Besides this,
there are 476 water extracting units in the district which are major source of lift irrigation. It
mainly uses a pumping machinery for distribution which may be electricity based or diesel
based. Since, per unit power cost in Himachal and so in Kangra is less, people generally use
electricity based lift irrigation. The traditional water sources like kuhls, bowries, ponds,
khatties and ditches are also main sources of irrigation in the district.

74 | P a g e
Figure 3.4. 1: Total number of Irrigation Sources and Water Extracting Unit
From the figure 3.4.1 it can be inferred that lift irrigation is the main source of
irrigation in the district. The traditional water holding systems like kuhls and bowries, and
water flowing through glaciers uses this system as a channel for irrigation.
The expansion of ground water irrigation is driven mainly by the demand condition
i.e., population pressure. The population of the district in 2011 has increased by 12.77% as
compared to 2001 census which indicates further exploitation of ground water resources.
However, it is reported that the ground water irrigation expansion has not taken place on a
much larger scale as compared to other sources of irrigation. Besides this, the other sources
of irrigation are limited in their reach and potential. The longer gestation period, limitation of
envisaging cropping pattern and crop water demand, and the distribution problem has led to
75% of total command area still under undeveloped. These factors needs to be addressed by
combining of schemes with scientific on farm development and scientific water management
on the field. In addition to it, the increased rate of irrigation water charges followed by proper
collection mechanism and accounting should be one of the major objective of the irrigation
schemes.
0
20
40
60
80
100
120
Surface Irrigation Sources (No.) Water extracting Unit under Lift Irrigation (No.)

75 | P a g e
Chapter IV
Water Demand
The water demand for domestic, industry, various crops, livestock and power
generation in the district has been worked out for the present and projected water demand for
the 2020 in this chapter.
Approach for working out the water demand for various uses has been worked on
assumption adopted after having discussions with respective line departments.
4.1 Domestic Water demand
Data of Census 2001 and 2011 has been considered to arrive at the growth rate of
population of the district which is 12.77%. As per Census 2011, the district has shown an
annual growth rate of 1.277%. Table 4.1.1 below indicates the block-wise population of the
district. Current population (in 2015) has been calculated by assuming a growth rate of 5.11%
(1.277% × 4 years) over a period of four years (from 2011-2015). Projected population has
been calculated in similar way by assuming a growth rate of 6.39% (1.277% × 5 years) over
the period of five years (from 2015-2020).
It has been assumed that per capita daily water requirement of people residing in
urban areas of the district is 150 litre and for population in rural areas, the daily per capita
daily water requirement is 70 litre. On an average 74 litre per capita daily water requirement
has been assumed for the total population. Using the same norms domestic water supply
demand has been worked out and given in table 4.1.1 below.
Table 4.1. 1: Domestic Water requirement
Block Population
in 2011
(No.)
Population
in 2015
(No.)
Existing
water
requirement
(MCM)
Projected
Population
in 2020
(No.)
Projected
Water
requirement
(MCM)
Baijnath 95571 100455 2.71 106874 2.89
Bhawarna 95602 100487 2.71 106908 2.89
Dehra Gopipur 131804 138539 3.74 147392 3.98
Fatehpur 113948 119771 3.24 127424 3.44

76 | P a g e
Indora 113885 119705 3.23 127354 3.44
Kangra 108454 113996 3.08 121280 3.28
Lambagaon 80272 84374 2.28 89765 2.42
Nagrota
Bagwan
88454 92974 2.51 98915 2.67
Nagrota Surian 103101 108369 2.93 115294 3.11
Nurpur 124668 131039 3.54 139412 3.77
Panchrukhi 71144 74779 2.02 79558 2.15
Pragpur 117415 123415 3.33 131301 3.55
Rait 106621 112069 3.03 119231 3.22
Bhedu
Mahadev
76473 80381 2.17 85517 2.31
Dharamshala 82663 86887 2.35 92439 2.50
Total 1510075 1587240 42.87 1688664 45.61
The figure 4.1.1 shows the present and projected water requirement in the district. The
total present water requirement for the year 2015 stands at 42.87 MCM while the projected
water requirement for the year 2020 is 45.61 MCM which shows 6.39% increase in the water
requirement as compared to 2015 due to increased population.
Figure 4.1. 1: Present Water demand, 2015 and Projected water demand, 2020
0
0.5
1
1.5
2
2.5
3
3.5
4
4.5
Water Demand (MCM)
Present water requirement 2015 (MCM) Projected Water requirement 2020 (MCM)

77 | P a g e
4.2 Crop Water Requirement
It is essential to know the water requirement of a crop which is the total quantity of
water required from its sowing time up to harvest. Naturally different crops may have
different water requirements at different places of the same country, depending upon the
climate, type of soil, method of cultivation, effective rain etc. The total water required for
crop growth is not uniformly distributed over its entire life span which is also called crop
period. The whole period of irrigation, from first, watering for preparation of the ground for
planting crops to its last watering is called base period.
The assumptions taken for the water requirement calculations for different crops and
accordingly block-wise crop water requirement are given in Table 4.2.1 and 4.2.2
respectively:
Table 4.2. 1: Water requirement of crops
Crop Depth of each
irrigation (mm)
No. of watering
required
Total water
requirement (mm)
Paddy 50 12 600
Wheat 30 5 150
Maize 30 2 60
Vegetable Crops 30 6 180
Horticultural
Crops
- - 60
Table 4.2. 2: Crop Water Requirement
Block Gross
Cropped
Area (ha)
Gross
Irrigated
Area
(ha)
Crop
Water
Demand
(MCM)
Water
Potential
Required
(MCM)
Existing
Water
Potential
(MCM)
Water
Potential
to be
created
(MCM)
Baijnath 15509 7185 18.97 18.97 14.70 4.27
Bhawarna 13956 6501.5 18.37 18.37 14.20 4.17
Dehra Gopipur 19896 8691.5 21.29 21.29 15.28 6.01
Fatehpur 17887 8321 21.21 21.21 16.58 4.62
Indora 26520 10674 32.12 32.12 20.33 11.80
Kangra 14494 6560 16.26 16.26 12.34 3.92

78 | P a g e
Lambagaon 15243 6829 15.80 15.80 11.85 3.95
Nagrota Bagwan 16209 7491 19.60 19.60 15.13 4.47
Nagrota Surian 18019 8001 19.60 19.60 14.40 5.20
Nurpur 20756 9162.5 25.23 25.23 18.24 6.99
Panchrukhi 13173 6152.5 16.08 16.08 12.61 3.47
Pragpur 18850 8328 19.37 19.37 14.20 5.16
Rait 12936 5940 14.64 14.64 11.32 3.33
Bhedu Mahadev 12197 5654 14.24 14.24 11.14 3.10
Dharamshala 9934 4740 11.64 11.64 9.42 2.22
Total 245579 110231 284.42 284.42 211.74 72.68
From the above table, it may be noted that the water potential required implies the
requirement of water if the area under rainfed is converted into irrigated area while the
existing potential denotes the area under irrigation. The water potential to be created is same
as the water potential required due to the fact that the area under rainfed cultivation needs to
be brought under irrigation potential.
Figure 4.2. 1: Water Potential required vs Existing Water Potential
0
5
10
15
20
25
30
35
Crop Water Demand (MCM)
Water Potential Required (MCM) Existing Water Potential (MCM)
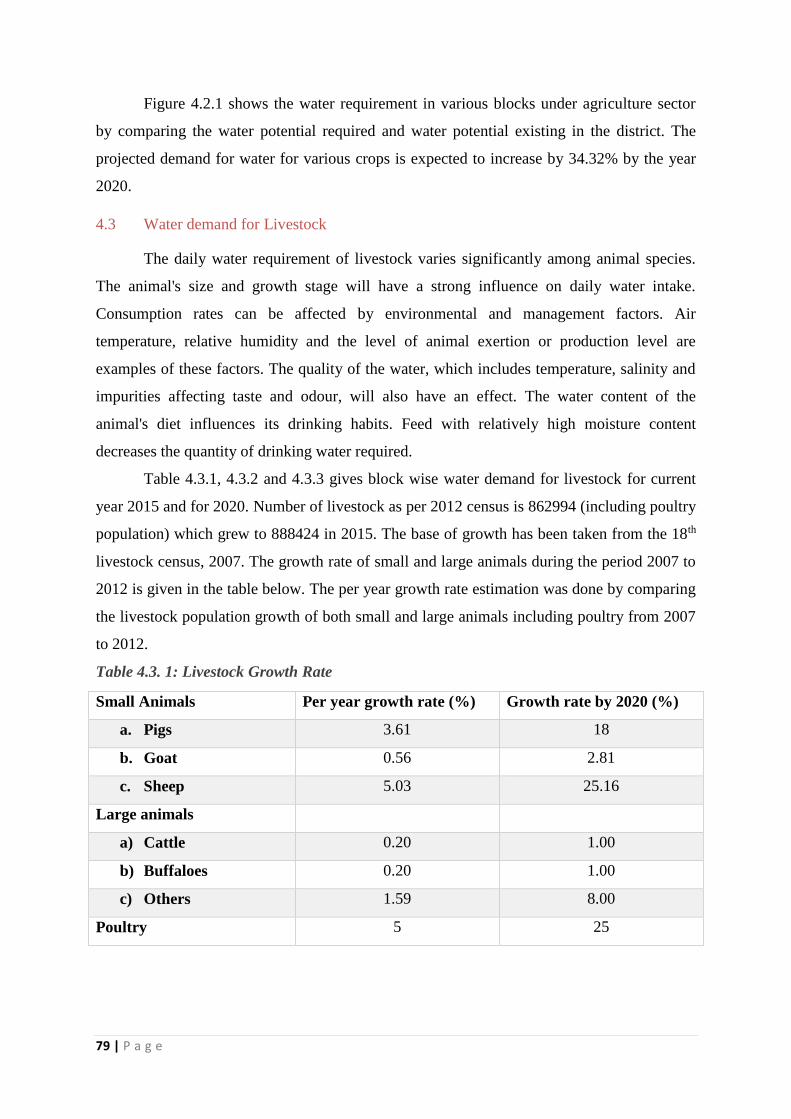
79 | P a g e
Figure 4.2.1 shows the water requirement in various blocks under agriculture sector
by comparing the water potential required and water potential existing in the district. The
projected demand for water for various crops is expected to increase by 34.32% by the year
2020.
4.3 Water demand for Livestock
The daily water requirement of livestock varies significantly among animal species.
The animal's size and growth stage will have a strong influence on daily water intake.
Consumption rates can be affected by environmental and management factors. Air
temperature, relative humidity and the level of animal exertion or production level are
examples of these factors. The quality of the water, which includes temperature, salinity and
impurities affecting taste and odour, will also have an effect. The water content of the
animal's diet influences its drinking habits. Feed with relatively high moisture content
decreases the quantity of drinking water required.
Table 4.3.1, 4.3.2 and 4.3.3 gives block wise water demand for livestock for current
year 2015 and for 2020. Number of livestock as per 2012 census is 862994 (including poultry
population) which grew to 888424 in 2015. The base of growth has been taken from the 18th
livestock census, 2007. The growth rate of small and large animals during the period 2007 to
2012 is given in the table below. The per year growth rate estimation was done by comparing
the livestock population growth of both small and large animals including poultry from 2007
to 2012.
Table 4.3. 1: Livestock Growth Rate
Small Animals Per year growth rate (%) Growth rate by 2020 (%)
a. Pigs 3.61 18
b. Goat 0.56 2.81
c. Sheep 5.03 25.16
Large animals
a) Cattle 0.20 1.00
b) Buffaloes 0.20 1.00
c) Others 1.59 8.00
Poultry 5 25

80 | P a g e
Table 4.3. 2: Water requirement assumption table for livestock in litre/day
Animals Water requirement (litre/day)
Small Animals
a. Pigs 4.5
b. Goat 6
c. Sheep 6
Large animals
d. Cattle 40
e. Buffaloes 60
Others 30
Poultry 0.25
Table 4.3. 3: Water requirement for livestock
Block Total No.
Livestock
2015
Present
water
demand
2015
(MCM)
Projected
Livestock
2020 (No.)
Water
demand in
2020
(MCM)
Existing
water
potential
(MCM)
Water
potential
to be
created
(MCM)
Baijnath 113987 0.63 127664 0.65 0.63 0.028
Bhawarna 118793 0.91 129766 0.93 0.91 0.020
Dehra
Gopipur
104669 1.56 106565 1.56 1.56 0.003
Fatehpur 37492 0.52 37941 0.52 0.52 0.001
Indora 42698 0.64 43321 0.64 0.64 0.001
Kangra 61963 0.68 64022 0.68 0.68 0.003
Lambagaon 27256 0.29 28944 0.30 0.29 0.003
Nagrota
Bagwan
41857 0.39 44726 0.39 0.39 0.004
Nagrota
Surian
74563 0.91 76302 0.91 0.91 0.003
Nurpur 94772 1.12 96915 1.13 1.12 0.004
Panchrukhi 11697 0.13 12121 0.13 0.13 0.001

81 | P a g e
Pragpur 27857 0.48 28043 0.48 0.48 0.000
Rait 56206 0.47 60047 0.47 0.47 0.006
Bhedu
Mahadev
8553 0.10 8941 0.10 0.10 0.001
Dharamshala 66061 0.50 71045 0.51 0.50 0.009
Total 888424 9.32 936361 9.41 9.32 0.086
The total water demand for the year 2020 will be 9.41 MCM indicating additional
requirement of 0.09 MCM water as compared to 2015.
Figure 4.3. 1: Water demand in 2020 vs existing water potential for livestock
0
0.2
0.4
0.6
0.8
1
1.2
1.4
1.6
1.8
Livestock Water Demand
Present water demand 2015 (MCM) Water demand in 2020 (MCM)

82 | P a g e
Figure 4.3. 2: Water potential to be created for livestock in different blocks
The figure 4.3.2 shows the water potential to be created in each blocks for livestock.
The maximum requirement of water for livestock is for Baijnath, Bhawarna, Rait and
Dharamshala blocks.
4.4 Industrial Water Requirement
The requirement of water for industries has been calculated on the basis of details
obtained from District Industries Centre, Kangra. The district has seven industrial areas
namely, Sansarpur Terrace, Nagrota Bagwan, Bain Attarian, Nagri, Dhaliara, Raja Ka Bag
and Jawali. The industrial department has their own water supply system. Also, it was
observed that most of the industries have their own water supply arrangements. The
Sansarpur Terrace Industrial area has no industrial unit currently operating whereas, Nagrota
Bagwan has 48 unit, Bain Attarian has 21, Nagri has 6 Dhaliara has 5 and Raja ka Bagh has
4. The growth rate of industries in the district is assumed based on the growth rate from 1980
to 2010 as per the report released by District Industries Centre which indicates a growth of
4.2 times during 1980 to 2010. Beyond the year 2010, considering the manufacturing growth
rate and other macro economic indicators, it is assumed that per year growth will be
approximately 5%. Thus, the growth rate from 2010 to 2020 is taken as 50%. The water
consumption per day is taken as 50,000 KL per industrial area for the estimation of present
water requirement by the industries.
0
0.005
0.01
0.015
0.02
0.025
0.03
Water potential to be created (MCM)
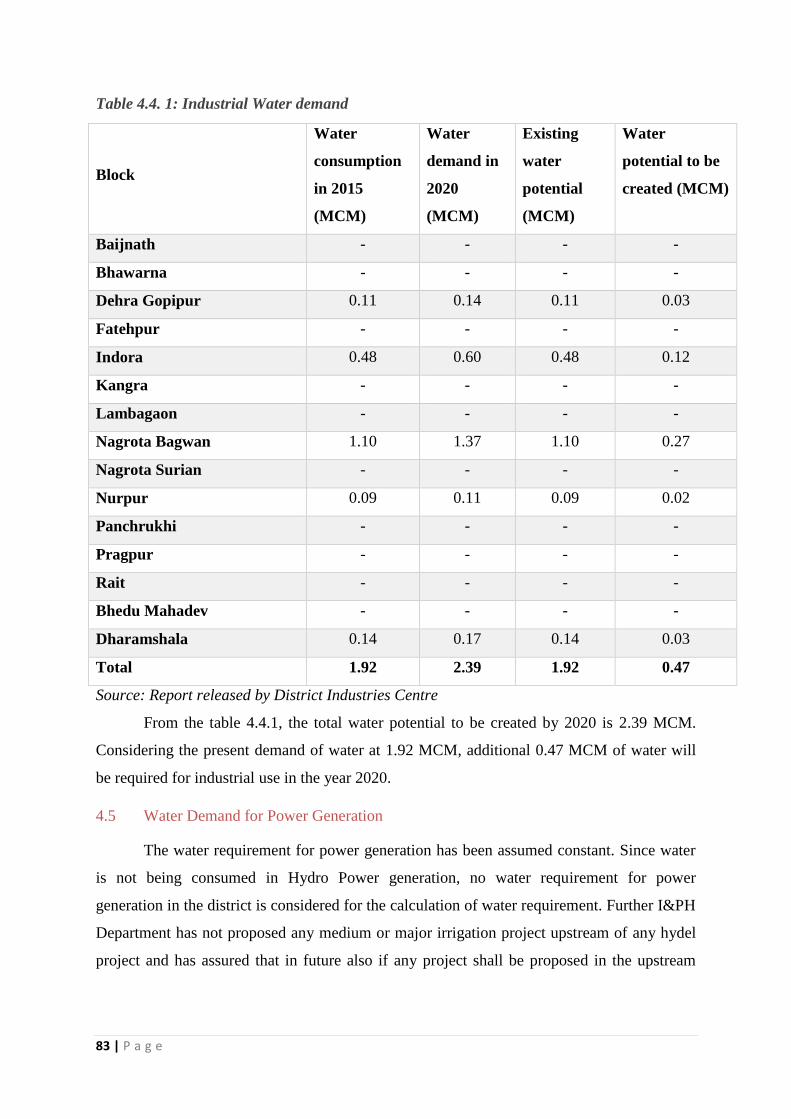
83 | P a g e
Table 4.4. 1: Industrial Water demand
Block
Water
consumption
in 2015
(MCM)
Water
demand in
2020
(MCM)
Existing
water
potential
(MCM)
Water
potential to be
created (MCM)
Baijnath - - - -
Bhawarna - - - -
Dehra Gopipur 0.11 0.14 0.11 0.03
Fatehpur - - - -
Indora 0.48 0.60 0.48 0.12
Kangra - - - -
Lambagaon - - - -
Nagrota Bagwan 1.10 1.37 1.10 0.27
Nagrota Surian - - - -
Nurpur 0.09 0.11 0.09 0.02
Panchrukhi - - - -
Pragpur - - - -
Rait - - - -
Bhedu Mahadev - - - -
Dharamshala 0.14 0.17 0.14 0.03
Total 1.92 2.39 1.92 0.47
Source: Report released by District Industries Centre
From the table 4.4.1, the total water potential to be created by 2020 is 2.39 MCM.
Considering the present demand of water at 1.92 MCM, additional 0.47 MCM of water will
be required for industrial use in the year 2020.
4.5 Water Demand for Power Generation
The water requirement for power generation has been assumed constant. Since water
is not being consumed in Hydro Power generation, no water requirement for power
generation in the district is considered for the calculation of water requirement. Further I&PH
Department has not proposed any medium or major irrigation project upstream of any hydel
project and has assured that in future also if any project shall be proposed in the upstream

84 | P a g e
side, committed discharge to meet the water requirement of the hydel power plant shall be
taken into account.
Table 4.5. 1: Water requirement for Power generation
Block/District Power
Requirement
(MW)
Water
Demand
Water
Demand in
2020
Existing
Water
Potential
Water
Potential to
be created
Kangra Nil Nil Nil Nil Nil
4.6 Total Water Demand of the district for various sectors
This section presents the total water demand of the district and has been calculated by
adding all the major sectors consuming water.
Table 4.6. 1: Sector wise water demand for the year 2015
Block
Sector (MCM) Total (MCM)
Domestic Crop Livestock Industries
Baijnath 2.71 18.97 0.63 - 22.30
Bhawarna 2.71 18.37 0.91 - 21.99
Dehra Gopipur 3.74 21.29 1.56 0.11 26.70
Fatehpur 3.24 21.21 0.52 - 24.96
Indora 3.23 32.12 0.64 0.48 36.48
Kangra 3.08 16.26 0.68 - 20.02
Lambagaon 2.28 15.80 0.29 - 18.38
Nagrota Bagwan 2.51 19.60 0.39 1.10 23.60
Nagrota Surian 2.93 19.60 0.91 - 23.43
Nurpur 3.54 25.23 1.12 0.09 29.98
Panchrukhi 2.02 16.08 0.13 - 18.24
Pragpur 3.33 19.37 0.48 - 23.18
Rait 3.03 14.64 0.47 - 18.14
Bhedu Mahadev 2.17 14.24 0.10 - 16.52
Dharamshala 2.35 11.64 0.50 0.14 14.63
Total 42.87 284.42 9.32 1.92 338.54

85 | P a g e
Figure 4.6. 1: Sector-wise water demand status (Present)
The present water demand of the district has been assessed at 338.54 MCM annually. Further,
table 4.6.2 shows the projected demand for the year 2020 under various sectors in the district.
Table 4.6. 2: Sector wise water demand for the Projected Year 2020 (MCM)
Block Domestic Crop Livestock Industries Total
Baijnath 2.89 18.97 0.65 - 22.51
Bhawarna 2.89 18.37 0.93 - 22.19
Dehra Gopipur 3.98 21.29 1.56 0.14 26.97
Fatehpur 3.44 21.21 0.52 - 25.17
Indora 3.44 32.12 0.64 0.60 36.8
Kangra 3.28 16.26 0.68 - 20.22
Lambagaon 2.42 15.80 0.30 - 18.52
Nagrota Bagwan 2.67 19.60 0.39 1.37 24.03
Nagrota Surian 3.11 19.60 0.91 - 23.62
Nurpur 3.77 25.23 1.13 0.11 30.24
Panchrukhi 2.15 16.08 0.13 - 18.36
Pragpur 3.55 19.37 0.48 - 23.4
Rait 3.22 14.64 0.47 - 18.33
Bhedu Mahadev 2.31 14.24 0.10 - 16.65
12.66%
84.02%
2.75%0.57%
Sector Wise Percentage Share (Present)
Domestic
Crop
Livestock
Industries

86 | P a g e
Dharamshala 2.50 11.64 0.51 0.17 14.82
Total 45.61 284.42 9.41 2.39 341.83
Figure 4.6. 2: Sector-wise water demand status (2020)
During 2020, total water requirement of the district has been assessed at 341.83
MCM. As from the figure 4.6.2, it can be observed that the projected water requirement for
the agricultural and horticultural sector is the highest (83.21%) followed by domestic sector
(13.35%).
4.7 Water Budget
From the above estimation of water requirement and the present water demand, a
water budget has been prepared. A water budget reflects the relationship between input and
output of water through a region. Thus, we have a direct comparison of supply of water and
the natural demand for water. The following data provides current water gap and projected
water gap for the year 2015 and 2020 respectively. The water budget has been estimated
based on the assumption and figures arrived from the tables listed above under various uses.
13.35%
83.21%
2.75% 0.70%
Sector wise Percentage
Domestic
Crop
Livestock
Industries

87 | P a g e
Table 4.7. 1: Water Budget (MCM)
Blocks Existing water
availability (MCM)
Total
(MCM)
Water Demand
(MCM)
Water
Gap
(MCM)
Surface
water
Ground
water
Present
(2015)
Projected
(2020)
Projected
(2020)
Baijnath 11.20 0 11.20 22.30 22.51 11.31
Bhawarna 16.80 0 16.80 21.99 22.19 5.39
Dehra Gopipur 19.60 0 19.60 26.70 26.97 7.37
Fatehpur 25.20 0 25.20 24.96 25.17 (0.03)
Indora 33.60 0.1052 33.71 36.48 36.8 3.09
Kangra 12.60 0 12.60 20.02 20.22 7.62
Lambagaon 15.68 0 15.68 18.38 18.52 2.84
Nagrota
Bagwan
19.60 0 19.60 23.60 24.03 4.43
Nagrota
Surian
14.00 0 14.00 23.43 23.62 9.62
Nurpur 19.60 0.0764 19.68 29.98 30.24 10.56
Panchrukhi 22.40 0 22.40 18.24 18.36 (4.04)
Pragpur 8.40 0 8.40 23.18 23.4 15
Rait 15.68 0 15.68 18.14 18.33 2.65
Bhedu
Mahadev
30.80 0 30.80 16.52 16.65 (14.15)
Dharamshala 14.84 0 14.84 14.63 14.82 (0.02)
Total 280.00 0.18 280.18 338.54 341.83 61.64

88 | P a g e
The total projected water demand for the year 2020 is 341.83 MCM as compared to
the present water demand which is 338.54 MCM. Thus, additional water requirement of
61.64 MCM is envisaged for the 2020 in comparison to 2015 with the available water supply.
Figure 4.7. 1: Present and Projected Water demand
It can be inferred that with existing water availability and with the development of
various sources under different schemes for irrigation the estimated water gap can be met.
0
5
10
15
20
25
30
35
40
Water Demand
Present (2015) Projected (2020)

89 | P a g e
Chapter V
Strategic Action Plan for Irrigation in District under
PMKSY
Water is essential for sustaining life and at the same time, it is an important
component for almost all developmental plans. Obviously the schemes for development of
water resources for beneficial use of the society have been taken up since the time
immemorial. Considerable progress has been made in respect of water resources development
in India after independence through various plans and such developments have helped in
almost five-fold increase in creation of irrigation potential. Total created irrigation potential
at pre-plan period was about 22.6 million hectares (Mha) which at present is about 108.2
Mha. There has also been appreciable development in the areas of drinking water supply and
other uses. However, growing population, urbanization and industrialization has led to
considerable increase in demand of water for various purposes e.g., irrigation, domestic
requirement, industrial requirements etc. In this regard, it may be mentioned that the water
sector has very strong linkages with all other developmental activities. In view of fast
changing development scenario, it is emphasized that the key priorities and identified
strategies cannot be considered as static and firm. These need to be reviewed and improved
upon from time to time. In this regard, a comprehensive “Strategic Plan for District
Irrigation” has been prepared.
5.1 Block wise total Plan of the district
Total block-wise plan for four years works out to be Rs.2,16,660.81 lakhs
(Table5.1.1). The outlay of Irrigation and Public Health Department stands at Rs.1,75,966.30
lakhs i.e. 81.22% of the total outlay followed by Rural Development Department with a share
of Rs.12,699.05 lakhs (5.86%), Agriculture Department with a share of Rs.10,968.20 lakhs
(5.06%), Horticulture Department with a share of Rs.1494.21 lakhs which is 0.69%, and
Forest Department with a share of Rs.598.80 lakhs (0.28%), of the total outlay. Besides the
plan outlay by concerned departments, the loan posed to NABARD under RIDF has also
been considered under the current plan. The total outlay under the aegis of NABARD for
consideration under RIDF for the district stands at Rs.14,934.24 lakhs which consists of two
components i.e., DPR posed to NABARD for consideration under RIDF by GoHP which is

90 | P a g e
Rs.5,884.13 lakhs and Projects sanctioned under various tranches of RIDF which still have
phasing between the years 2016-17 to 2019-20, stands at Rs.9,050.11 lakhs. The loan projects
under NABARD constitutes about 6.89% of the total outlay.
Table 5.1. 1: Block-wise plan of different departments (Rs. lakhs)
Sl.
No.
Blocks I & PH Department
of
Agriculture
Department
of Forestry
DRDA Horticulture NABARD Total
1 Baijnath 4417.79 1814.92 52.80 1526.60 31.88 101.47 7945.46
2 Bhawarna 2147.20 1831.33 30.10 679.05 15.99 0.00 4703.67
3 Dehra Gopipur 41049.33 729.34 2837.07 184.01 2758.90 47558.65
4 Fatehpur 13989.00 600.94 61.80 767.93 188.68 1577.57 17185.92
5 Indora 41790.00 195.88 40.60 1398.38 551.29 1384.47 45360.61
6 Kangra 3222.23 191.49 120.90 0.00 45.47 204.68 3784.76
7 Lambagaon 4435.48 843.14 56.70 580.90 25.99 1435.11 7377.32
8 Nagrota bagwan 4170.33 309.17 29.25 0.00 25.18 0.00 4533.93
9 Nagrota Surian 18080.00 537.75 81.20 1025.29 91.80 3039.70 22855.74
10 Nurpur 25206.03 655.74 41.40 0.00 107.51 2236.01 28246.69
11 Panchrukhi 2899.47 1188.54 0.00 23.38 0.00 4111.40
12 Pragpur 3040.15 170.79 2419.46 137.52 0.00 5767.92
13 Rait 4101.11 184.96 717.34 29.04 478.87 5511.32
14 Sullah 3686.87 1236.79 52.50 747.04 25.26 809.51 6557.96
15 Dharamshala 3731.31 477.43 31.55 0.00 11.19 907.96 5159.44
Grand Total 175966.30 10968.20 598.80 12699.05 1494.21 14934.25 216660.81
Figure 5.1. 1: Block-wise share of outlay under Department of I&PH
3% 1%
23%
8%
24%
2%3%
2%
10%
14%
2% 2% 2%
2%2%
Irrigation and Public Health Department
Baijnath Bhawarna Dehra Gopipur Fatehpur Indora
Kangra Lambagaon Nagrota bagwan Nagrota Surian Nurpur
Panchrukhi Pragpur Rait Bhedu Mahadev Dharamshala

91 | P a g e
Figure 5.1. 2: Block-wise share of outlay under Department of Agriculture
Figure 5.1. 3: Block-wise share of outlay under DRDA
16%
17%
7%
5%2%2%8%
3%
5%
6%
11%
1%2%
11%4%
Agriculture Department
Baijnath Bhawarna Dehra Gopipur Fatehpur Indora
Kangra Lambagaon Nagrota bagwan Nagrota Surian Nurpur
Panchrukhi Pragpur Rait Bhedu Mahadev Dharamshala
12%
5%
22%
6%11%
0%5%
0%
8%
0%0%
19%
6%6% 0%
Rural Development Department
Baijnath Bhawarna Dehra Gopipur Fatehpur Indora
Kangra Lambagaon Nagrota bagwan Nagrota Surian Nurpur
Panchrukhi Pragpur Rait Bhedu Mahadev Dharamshala

92 | P a g e
Figure 5.1. 4: Block-wise share of outlay under Department of Horticulture
Figure 5.1. 5: Block-wise share of outlay under Department of Forest
2% 1%12%
13%
37%
3%2%
2%
6%
7%
1%
9%2% 2% 1%
Horticulture Department
Baijnath Bhawarna Dehra Gopipur Fatehpur Indora
Kangra Lambagaon Nagrota bagwan Nagrota Surian Nurpur
Panchrukhi Pragpur Rait Bhedu Mahadev Dharamshala
9%
5%0%
10%
7%
20%9%
5%
14%
7%0%0%0%
9%5%
Forest Department
Baijnath Bhawarna Dehra Gopipur Fatehpur Indora
Kangra Lambagaon Nagrota bagwan Nagrota Surian Nurpur
Panchrukhi Pragpur Rait Bhedu Mahadev Dharamshala

93 | P a g e
Figure 5.1. 6: Block wise RIDF loan posed to NABARD under diiferent Irrigation Schmes
5.2 Component wise Plan
The component wise plan for four years, starting from 2016-17 to 2019-20 is
indicated in the table 5.2.1. The schemes under AIBP component is to be executed mainly by
Irrigation and Public Health Department. Similarly, the schemes under Har Khet Ko Pani
component is to be executed by both Irrigation and Public Health Department, Department of
Agriculture and Department of Forest. Further, the schemes under Per Drop More Crop
component is to be executed by Horticulture Department. Watershed component will be
taken care of by Rural Development Department and extension & training component will be
executed by ATMA under the aegis of Agriculture Department. The loan posed to NABARD
for consideration under RIDF by GoHP is to be considered under Har Khet Ko Pani. An
amount of Rs.5,884.13 lakhs for consideration under RIDF by GoHP and an amount of
Rs.9,050.11 lakhs are to considered for sanctioning under various tranches of RIDF with
phasing between 2016-17 to 2019-20 under outlay proposed under NABARD. However, all
the stakeholders need to have coordination among them to achieve maximum irrigation
efficiency and to avoid duplicity. Fig. 5.2.1 is the graphical representation of various
components of PMKSY. It is observed that maximum share of 55.47% is for Har Khet Ko
Pani followed by AIBP with a share of 34.84%. Projects under PMKSY Watershed
1%0%19%
11%
9%
1%
10%0%
20%
15%
0%0%3%5%
6%
RIDF Loan Posed to NABARD
Baijnath Bhawarna Dehra Gopipur Fatehpur Indora
Kangra Lambagaon Nagrota bagwan Nagrota Surian Nurpur
Panchrukhi Pragpur Rait Bhedu Mahadev Dharamshala

94 | P a g e
component shares 6.08% while Per Drop More Crop shares 3.56% of the total outlay. The
Convergence with MGNREGA component has a share of 0.05% to the total outlay.
Table 5.2. 1: Component wise Plan (Rs.Lakhs)
Component wise YEAR TOTAL
2016-17 2017-18 2018-19 2019-20
Accelrated Irrigation
Benefitted Programme
(AIBP)
15096.74 22645.11 26419.30 11322.56 75483.70
PMKSY-Har Khet Ko
Pani (HKKP)
24038.51 36057.77 42067.39 18028.88 120192.55
PMKSY- Per Drop More
Crop (PDMC)
1542.74 2314.11 2699.80 1157.06 7713.71
i) Micro-irrigation 231.76 347.64 405.58 173.82 1158.81
ii) Supplementary Water
Management activities
1267.58 1901.37 2218.27 950.69 6337.90
iii) Ext. And Trg. Under
ATMA
43.40 65.10 75.95 32.55 217.00
PMKSY -Watershed 2633.47 3950.20 4608.57 1975.10 13167.35
Convergence with
MGNREGS
20.70 31.05 36.23 15.53 103.50
Total 43332.16 64998.24 75831.28 32499.12 216660.81
Figure 5.2. 1: Component wise percentage share
34.84%
55.47%
3.56%
6.08%
0.05%
Accelrated Irrigation BenefittedProgramme (AIBP)
PMKSY-Har Khet Ko Pani (HKKP)
PMKSY- Per Drop More Crop (PDMC)
PMKSY -Watershed
Convergence with MGNREGS

95 | P a g e
Further Per Drop More Crop has been divevided into three sub components which are:
Micro-Irrigation Schemes (15.00%)
Supplementary Water Management Activities (82.20%)
Extension and Training under ATMA (2.80%)
Figure 5.2. 2: Sub-Components of Per Drop More Crop
5.3 Year Wise Plan
Table 5.3.1 shows the year wise distribution of outlay under different departments.
Of the total outlay of Rs.2,16,660.81 lakhs, I&PH Department has the maximum share of
87.54% followed by DRDA which has a share of 5.86%, Department of Agriculture with a
share of 5.63%. Department of Horticulture has a share of 0.69% followed by Department of
Forestry which constitutes about 0.28% to the total outlay as envisaged in the plan. The loan
projects under NABARD for DTW, LIS and RWH cum LIS has been proposed under I&PH
Department which amounts to Rs.13694.94 lakhs and loan projects for RWH schemes has
been proposed under Agriculture Department which amounts to Rs. 1239.30 lakhs. Hence the
total outlay under I&PH Department is Rs.1,89,661.24 lakhs and for Agriculture Department
is Rs.12,207.51 lakhs.
15.0%
82.2%
2.8%
Micro-irrigation
Supplementary Water ManagementActivities
Extension and Training under ATMA

96 | P a g e
Table 5.3. 1: Year wise distribution of total outlay (Rs. Lakhs)
Department YEAR TOTAL
2016-17 2017-18 2018-19 2019-20
Irrigation&Public
Health
Department
37932.25 56898.37 66381.43 28449.19 189661.24
Agriculture
Department
2441.50 3662.25 4272.63 1831.13 12207.51
Horticulture
Department
298.84 448.26 522.97 224.13 1494.21
Forest
Department
119.76 179.64 209.58 89.82 598.80
Rural
Development
Department
2539.81 3809.71 4444.67 1904.86 12699.05
Total 43332.16 64998.24 75831.28 32499.12 216660.80
Figure 5.3. 1: Percentage share of departments in the outlay
5.3 Action plan based on Member of Parliament Local Area Development Schemes
(MPLAD)
The PMKSY guidelines clearly specify that while preparing District Irrigation Plans (DIP),
suggestions of Hon’ble Members of Parliament and Members of Legislative Assembly are to
be invited and included after due technical consideration. The Planning Department of Govt.
87.54%
5.63%
0.69%0.28% 5.86%
Irrigation&Public Health Department Agriculture Department
Horticulture Department Forest Department
Rural Development Department

97 | P a g e
of Himachal Pradesh has an ongoing programme wherein the Hon’ble MLA’s indicate their
priorities for irrigation schemes every year for inclusion in the Annual Plan. Out of the
proposals indicated in the above tables, the details of MLA’s priority schemes along with the
priority year are given in Annexure.
5.4 Expected Outcome
The strategic action plan envisages providing assured irrigation in a command area of
1,70,474.70 ha. Under AIBP about 11920 ha will be covered under the ongoing schemes. The
Har Khet Ko Pani will develop a command area of 57754 ha. with irrigation potential.The
watershed component is projected to achieve a culturable command area of 94,299 ha by
creation of 9337 new water harvesting structures, renovation of 555 water harvesting
structures. Under, the component Per Drop More Crop, 6501 ha of area with efficient water
conveyance and precision water application by drip irrigation system for wide spaced crop
for developing an area of 194.5 ha, and drip irrigation system for narrow spaced crop for
developing an area 33 ha has been proposed. Micro and Mini Sprinklers, to develop an area
of 50 ha and 313 ha has also been on the list. Secondary storage structures like water storage
tanks and bore-wells for the development of 364 ha and 218 ha has been proposed. A training
programme will also be scheduled under PMKSY to enhance the better knowledge of
efficient use of water through drip and other micro irrigation structures. The various
interventions proposed under Per Drop More Crop will result in creation of water potential to
the tune of 3653165 cum in the district in the period of five years.
Rural Development Department will provide irrigation infrastructure for a command
area of 94,299 ha (55.32 per cent), followed by Irrigation and Public Health Department
which will cover 64,726.23 ha or 37.97 per cent of planned coverage of area followed by
intervention of Agriculture Department under Soil Conservation Department having a
coverage area of 9096.30 ha or 5.34 per cent. Under Agriculture Department, 9096.30ha. and
5184.70 ha. has been proposed to be developed under Har Khet Ko Pani and Per Drop More
Crop component, respectively. The Horticulture and Forestry Department will ensure
precision water application in an area of 1367.5 ha and 506.07 ha respectively. The command
area to be developed under Forest Department does not create any irrigation potential but the
various activities proposed under it will ensure ground water recharge.
It is proposed to create an irrigation potential by installing new lift irrigation ad Flow
irrigation schemes tapping surface water and installation of tubewells and borewells where

98 | P a g e
ground water is available. Besides water Harvesting structures have also been proposed to
create irrigation potential by harvesting rainwater as also spring water.
As stated in pre-pages, the gross cropped area of the district which is 2,45,579 ha, out
of which gross irrigated area is 1,10,231 ha., leaving a gap of 1,35,348 ha. which is the
potential to be converted or brought under the purview of irrigation.
Potential of 1044.50 ha is proposed to be created under PMKSY ‘Per Drop More
Crop component’ under micro irrigation activity and 8051.80 ha under supplementary water
management activities. Sprinkler and drip irrigation schemes have been proposed under this
programme. It is proposed to cover about 807 ha and 237.5 ha under sprinkler and drip
irrigation schemes respectively. On completion of these projects, it is expected that an
additional irrigation potential of approximately 314 ha will be created due to saving of water.
This is likely to generate an additional income of Rs.40,913.93 lakh to the farmers of the
district. This is based on the assumption of atleast 60% of potential utilised and Rs. 40,000
per ha incremental income from rainfed to irrigated farming. This is also likely to create
152.58 lakh mandays of non-recurring employment and 85,237 jobs annually on recurring
basis.
There are major interventions proposed by different department in the district to
enhance the irrigation potential and coverage. Agriculture Department has introduced 82
number of secondary storage structures to promote the water management activities while
Horticulture Department has proposed 520 number of drip and sprinkler irrigation system to
promote the water use efficiency in the district. The I&PH department with its 36 number of
LIS and FIS schemes has majorily focussed on major and medium projects. The RD
department has however proposed 555 number of farm ponds and renovation of water
harvesting structures and 9337 new water harvesting structures. The ATMA through its
extension and capacity building approach has considered to provide 12 number of training to
5000 farmers and 100 officials to make PMKSY outcome to reach to its major stakeholder
i.e., farmers.
Under PMKSY, there will be 12520 total number of structures for developing water
and irrigation potential in the district. The total water potential to be created is proposed to be
253097 cum in the district with all the interventions proposed under PMKSY.
This intervention may result into increased acreage under crops thereby contributing
to both agricultural and horticultural production. At the same time, it will create livelihood
opportunities for the local population and contribute in generating direct and indirect
employment.

99 | P a g e
5.5 Suggestions
For successful implementation of PMKSY plan it is suggested that:
All the stakeholders should convene meeting of Panchayat Samitis and then finalise the
village plan and prepare DPR.
There should not be any duplicity of project.
The departments should supplement each other so that the maximum irrigation
efficiency is achieved.
Agriculture and Horticulture Department should take micro irrigation projects in the
command of minor irrigation projects which are either completed or likely to be
completed in near future.
All the irrigation projects should have a component of water conveyance so that the
each drop of water is judiciously utilized.
Where ever feasible, solar pump sets should be installed.
All the structures planned should be geo tagged and marked on map, so that social
monitoring of the projects can be conducted. This will also avoid the duplicity.

100 | P a g e
5.6 Strategic Action Plan for irrigation in respect of District Kangra, HP under Pradhan Mantri Krishi Sinchayee Yojna (PMKSY)
Sl.
No.
Name of
the
Blocks/Su
b Districts
Concerned
Ministry/Depar
tmanet
Component Activity Total
Number/
Capacity
(cum)
Command
Area/Irrigation
Potential (Ha)
Period of
Implemnt
ation (4
yrs) from
2016-17 to
2019-20
Estimate
d cost
(Rs. in
lacs)
1
AIBP
Major Irrigation - - - -
2
i Indora MoWR/I&PH
Department
Nurpur Medium Irrigation
1 5500 4 Year 39500.00
ii Nagrota
Surian 1 2186 4 Year 15306.0
0
iii Nurpur
1 4025 4 Year 20451.00
1 56.61 4 Year 130.94
1 66 4 Year 40.75
1 86.44 4 Year 55.01
Sub Total IPH Nurpur 6 11920.05 75483.70
Total AIBP 6 11920.05 0 75483.70
3
i Baijnath
MoWR/I&PH
Department
Dharamshala
Har Khet Ko Pani
Surface Minor Irrigation
2 3800.03 4 Year 2806.21
ii Bhawarna 6 815.55 4 Year 1981.41
iii Dehra
Gopipur 2 1000 4 Year
2000.00
vi Kangra 5 869.55 4 Year 1972.23
v Lambagaon 3 586.44 4 Year 1258.56
vi Nagrota
Bagwan 7 1159.34 4 Year
2493.66
vii Panchrukhi 3 754.29 4 Year 1649.47
viii Pragpur 1 500 4 Year 1000.00

101 | P a g e
Sl.
No.
Name of
the
Blocks/Su
b Districts
Concerned
Ministry/Depar
tmanet
Component Activity Total
Number/
Capacity
(cum)
Command
Area/Irrigation
Potential (Ha)
Period of
Implemnt
ation (4
yrs) from
2016-17 to
2019-20
Estimate
d cost
(Rs. in
lacs)
ix Rait 8 1447.74 4 Year 2514.17
x Bhedu
Mahadev 1 500 4 Year
1000.00
xi Dharamshal
a 12 1341.12 4 Year
2480.31
Sub Total IPH Dharamshala 50 12774.06 21156.02
xii Fatehpur
MoWR/I&PH
Department
Nurpur
1 25 4 Year 95.00
xiii Indora 4 145 4 Year 315.00
xiv Nagrota
Surian - - -
0.00
x Nurpur 3 295 4 Year 325.00
Sub Total IPH Nurpur 8 465 735
Sub Total 58 13239.06 21891.02
i Indora MoWR/Depart
ment of
Agriculture
Har Khet Ko Pani Surface minor Irrigation
- 25 4 Year 25.00
ii Nurpur
- 21 4 Year 21.00
Sub total 0 46 46.00
i Panchrukhi
MoWR/Depart
ment of
Agriculture
89 535 4 Year 568.70
ii Baijnath 80 863 4 Year 876.00
iii Bhawarna 70 892 4 Year 893.50
iv BheduMah
adev
0 454.6 4 Year 587.00
Lambagaon 58 265 4 Year 397.50
Sub total 297 3009.6 3322.70
Total 355 16294.66 0 25259.72

102 | P a g e
Sl.
No.
Name of
the
Blocks/Su
b Districts
Concerned
Ministry/Depar
tmanet
Component Activity Total
Number/
Capacity
(cum)
Command
Area/Irrigation
Potential (Ha)
Period of
Implemnt
ation (4
yrs) from
2016-17 to
2019-20
Estimate
d cost
(Rs. in
lacs)
4
i Baijnath
MoWR/I&PH
Department
Dharamshala
Har Khet Ko Pani Lift Irrigation
4 642.66 4 Year 1573.30
ii Bhawarna 1 71 4 Year 130.02
iii Dehra
Gopipur 8 4116.07 4 Year
23467.94
iv Kangra 1 500 4 Year 1250.00
v Lambagaon 10 1178.41 4 Year 3101.03
vi Nagrota
Bagwan 2 561.16 4 Year
1370.82
vii Panchrukhi 1 500 4 Year 1250.00
viii Pragpur 4 649.77 4 Year 1615.10
ix Rait 1 500 4 Year 1250.00
x BheduMah
adev 6 1064.23
4 Year
2686.87
xi Dharamshal
a 1 500 4 Year
1250.00
Sub Total IPH Dharamshala 39 10283.3 38945.08
xii Fatehpur
MoWR/I&PH
Department
Nurpur
0 0 0 0.00
xiii Indora 0 0 0 0.00
xiv Nagrota
Surian 0 0 0
0.00
xv Nurpur 1 209.05 4 Year 30.33
Sub Total IPH Nurpur 1 209.05 30.33
Sub Total
40 10492.35 0 38975.41

103 | P a g e
Sl.
No.
Name of
the
Blocks/Su
b Districts
Concerned
Ministry/Depar
tmanet
Component Activity Total
Number/
Capacity
(cum)
Command
Area/Irrigation
Potential (Ha)
Period of
Implemnt
ation (4
yrs) from
2016-17 to
2019-20
Estimate
d cost
(Rs. in
lacs)
i Fatehpur MoWR/Depart
ment of
Agriculture Har Khet Ko Pani Lift Irrigation
8 40 4 Year 140.00
ii Nagrota
Surian
8 40 4 Year 140.00
Sub Total 16 80 280
Total 56 10572.35 0 39255.41
5
i Baijnath
MoWR/I&PH
Department
Dharamshala
Har Khet Ko Pani Ground water Development
- - - 0.00
ii Bhawarna - - - 0.00
iii Dehra
Gopipur - - - 0.00
iv Kangra - - - 0.00
v Lambagaon - - - 0.00
vi Nagrota
Bagwan - - - 0.00
vii Panchrukhi - - - 0.00
viii Pragpur - - - 0.00
ix Rait - - - 0.00
x BheduMaha
dev - - - 0.00
xi Dharamshal
a - - - 0.00
Sub Total IPH Dharamshala 0 0 0 0
xii Fatehpur MoWR/I&PH
Department
Nurpur
3 742 4 Year 2551.00
xiii Indora 2 475 4 Year 1700.00
xiv Nagrota
Surian - - - 0.00
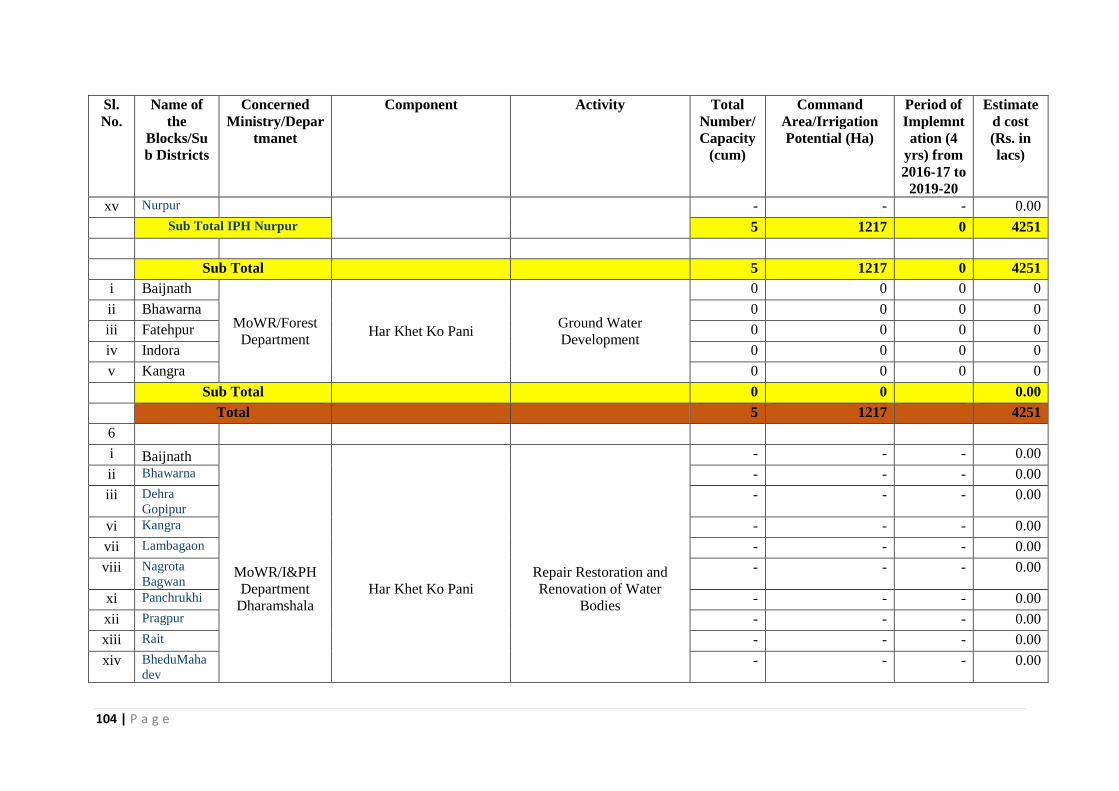
104 | P a g e
Sl.
No.
Name of
the
Blocks/Su
b Districts
Concerned
Ministry/Depar
tmanet
Component Activity Total
Number/
Capacity
(cum)
Command
Area/Irrigation
Potential (Ha)
Period of
Implemnt
ation (4
yrs) from
2016-17 to
2019-20
Estimate
d cost
(Rs. in
lacs)
xv Nurpur - - - 0.00
Sub Total IPH Nurpur 5 1217 0 4251
Sub Total 5 1217 0 4251
i Baijnath
MoWR/Forest
Department Har Khet Ko Pani
Ground Water
Development
0 0 0 0
ii Bhawarna 0 0 0 0
iii Fatehpur 0 0 0 0
iv Indora 0 0 0 0
v Kangra 0 0 0 0
Sub Total 0 0 0.00
Total 5 1217 4251
6
i Baijnath
MoWR/I&PH
Department
Dharamshala
Har Khet Ko Pani
Repair Restoration and
Renovation of Water
Bodies
- - - 0.00
ii Bhawarna - - - 0.00
iii Dehra
Gopipur - - - 0.00
vi Kangra - - - 0.00
vii Lambagaon - - - 0.00
viii Nagrota
Bagwan - - - 0.00
xi Panchrukhi - - - 0.00
xii Pragpur - - - 0.00
xiii Rait - - - 0.00
xiv BheduMaha
dev - - - 0.00

105 | P a g e
Sl.
No.
Name of
the
Blocks/Su
b Districts
Concerned
Ministry/Depar
tmanet
Component Activity Total
Number/
Capacity
(cum)
Command
Area/Irrigation
Potential (Ha)
Period of
Implemnt
ation (4
yrs) from
2016-17 to
2019-20
Estimate
d cost
(Rs. in
lacs)
xv Dharamshal
a - - - 0.00
Sub Total IPH Dharamshala 0 0 0 0
iv Fatehpur
MoWR/I&PH
Department
Nurpur
1 201.64 4 Year 388.00
v Indora - - - 0.00
ix Nagrota
Surian - - - 0.00
x Nurpur - - - 0.00
Sub Total IPH Nurpur 1 201.64 0 388
Sub Total 1 201.64 388
i Dharamsha
la
MoWR/Depart
ment of
Agriculture
Har Khet Ko Pani
Repair Restoration and
Renovation of Water
Bodies
16 22 4 Year 55.00
ii Nagrota
Bagwan
8 11 4 Year 25.00
iii Rait 6 7 4 Year 20.00
iv Fatehpur 18 9 4 Year 34.00
v Nagrota
Surian
14 7 4 Year 26.00
Sub Total 62 56 160.00
Total 63 257.64 548.00
7
7.1 Construction of field Channels
i Baijnath
1 61.52 4 Year 22.24
ii Bhawarna 1 57.46 4 Year 20.82

106 | P a g e
Sl.
No.
Name of
the
Blocks/Su
b Districts
Concerned
Ministry/Depar
tmanet
Component Activity Total
Number/
Capacity
(cum)
Command
Area/Irrigation
Potential (Ha)
Period of
Implemnt
ation (4
yrs) from
2016-17 to
2019-20
Estimate
d cost
(Rs. in
lacs)
iii Dehra
Gopipur MoWR/I&PH
Department
Dharamshala
Har Khet Ko Pani
Lined Field Channel
6 1558.03 4 Year
7790.53
vi Kangra - - - 0.00
vii Lambagaon 1 122.4 4 Year 44.15
viii Nagrota
Bagwan 1 30.58 4 Year
152.90
xi Panchrukhi - - - 0.00
xii Pragpur 2 42.5 4 Year 212.50
xiii Rait 3 546.53 4 Year 196.21
xiv BheduMaha
dev - - - 0.00
xv Dharamshal
a - - - 0.00
Sub Total IPH Dharamshala 15 2419.02 8439.35
iv Fatehpur
MoWR/I&PH
Department
Nurpur
1 15287 4 Year 10955.00
v Indora 1 600 4 Year 275.00
ix Nagrota
Surian 1 3150 4 Year
2774.00
x Nurpur 1 4025 4 Year 4173.00
Sub Total IPH Nurpur 4 23062 18177
Sub Total 19 25481.02 26616.35
i
Dharamsha
la
MoWR/Depart
ment of
Agriculture
Har Khet Ko Pani
Lined Field Channels
12 280 4 Year 350.00
ii
Nagrota
Bagwan
8 180 4 Year 230.00
iii Rait 5 100 4 Year 130.00

107 | P a g e
Sl.
No.
Name of
the
Blocks/Su
b Districts
Concerned
Ministry/Depar
tmanet
Component Activity Total
Number/
Capacity
(cum)
Command
Area/Irrigation
Potential (Ha)
Period of
Implemnt
ation (4
yrs) from
2016-17 to
2019-20
Estimate
d cost
(Rs. in
lacs)
iv Fatehpur 9 90 4 Year 80.00
v Nagrota
Surian
7 70 4 Year 60.00
Sub Total 41 720 850.00
Total 60 26201.02 27466.35
7.2
i Baijnath
MoWR/I&PH
Department
Dharamshala
Har Khet Ko Pani Unlined Field Channel
1 68.36 4 Year 11.03
ii Bhawarna 1 63.85 4 Year 10.26
iii Dehra
Gopipur 6 1246.42 4 Year
6232.46
vi Kangra - - - 0.00
vii Lambagaon 1 136 4 Year 21.85
viii Nagrota
bagwan 1 24.47 4 Year
122.35
xi Panchrukhi - - - 0.00
xii Pragpur 2 34.01 4 Year 170.05
xiii Rait 3 607.25 4 Year 96.85
xiv BheduMaha
dev - - - 0.00
xv Dharamshal
a - - - 0.00
Sub Total IPH Dharamshala 15 2180.36 6664.85
iv Fatehpur MoWR/I&PH
Department
Nurpur
- - - 0.00
v Indora - - - 0.00
ix Nagrota
Surian - - - 0.00

108 | P a g e
Sl.
No.
Name of
the
Blocks/Su
b Districts
Concerned
Ministry/Depar
tmanet
Component Activity Total
Number/
Capacity
(cum)
Command
Area/Irrigation
Potential (Ha)
Period of
Implemnt
ation (4
yrs) from
2016-17 to
2019-20
Estimate
d cost
(Rs. in
lacs)
x Nurpur - - - 0.00
Sub Total IPH Nurpur 0 0 0
Sub Total 15 2180.36 6664.85
7.3
i Dharamsha
la
MoWR/Depart
ment of
Agriculture
(SDSCO
Dharamshala)
Har Khet Ko Pani Land Protection work
20 - 4 Year 35.00
ii Nagrota
Bagwan
20 - 4 Year 35.00
iii Rait 10 - 4 Year 20.00
Sub Total 50 0 90.00
8
i Baijnath
MoWR/I&PH
Department
Dharamshala
Har Khet Ko Pani
Micro irrigation
1 6.84 4 Year 5.01
ii Bhawarna 1 6.39 4 Year 4.69
iii Dehra
Gopipur 6 311.61 4 Year
1558.40
vi Kangra - - - 0.00
vii Lambagaon 1 13.6 4 Year 9.89
viii Nagrota
bagwan 1 6.12 4 Year
30.60
xi Panchrukhi - - - 0.00
xii Pragpur 2 8.5 4 Year 42.50
xiii Rait 3 60.43 4 Year 43.88
xiv BheduMaha
dev - - - 0.00
xv Dharamshal - - - 1.00

109 | P a g e
Sl.
No.
Name of
the
Blocks/Su
b Districts
Concerned
Ministry/Depar
tmanet
Component Activity Total
Number/
Capacity
(cum)
Command
Area/Irrigation
Potential (Ha)
Period of
Implemnt
ation (4
yrs) from
2016-17 to
2019-20
Estimate
d cost
(Rs. in
lacs)
a
Sub Total IPH Dharamshala 15 413.49 1695.97
iv Fatehpur
MoWR/I&PH
Department
Nurpur
- - - 0.00
v Indora - - - 0.00
ix Nagrota
Surian - - - 0.00
x Nurpur - - - 0.00
Sub Total IPH Nurpur 0 0 0
Sub Total 15 413.49 1695.97
Total 80 2593.85 8450.82
Total Har Khet Ko Pani 619 57136.52 105231.3
9
i Nurpur
Department of
Horticulture,
District Kangra,
H.P.
Per drop more crop (Micro
Irrigation)
DPAP Drip
- 26.5 4 Year 10.99
ii Indora - 59 4 Year 35.06
iii Nagrota
Surian - 43 4 Year
15.88
iv Fatehpur - 19 4 Year 8.14
v Pragpur - 21.5 4 Year 16.48
vi Dehra - 22 4 Year 16.85
vii Kangra - 9 4 Year 4.43
viii Rait - 4 4 Year 1.70
ix Dharamsha
la - 1
4 Year
0.42
x Nagrota - 1.5 4 Year 0.57

110 | P a g e
Sl.
No.
Name of
the
Blocks/Su
b Districts
Concerned
Ministry/Depar
tmanet
Component Activity Total
Number/
Capacity
(cum)
Command
Area/Irrigation
Potential (Ha)
Period of
Implemnt
ation (4
yrs) from
2016-17 to
2019-20
Estimate
d cost
(Rs. in
lacs)
Bagwan
xi Bhawarna - 4 4 Year 1.70
xii Panchrukhi - 1.5 4 Year 0.57
xiii Baijnath - 1.5 4 Year 0.57
xiv BheduMah
adev - 7
4 Year
2.97
xv Lambagaon - 7 4 Year 2.97
Sub Total 0 227.5 119.28
10
i Nurpur
Department of
Horticulture,
District Kangra,
H.P.
Per drop more crop (Micro
Irrigation) DPAP Sprinkler
- 48 4 Year 46.52
ii Indora - 191 4 Year 139.74
iii Nagrota
Surian - 41 4 Year
31.92
iv Fatehpur - 46 4 Year 41.04
v Pragpur - 18 4 Year 18.84
vi Dehra - 46 4 Year 48.66
vii Kangra - 34 4 Year 26.44
viii Rait - 17 4 Year 17.45
ix Dharamsha
la - 6
4 Year
4.57
x Nagrota
Bagwan - 12 4 Year
9.31
xi Bhawarna - 3 4 Year 3.20
xii Panchrukhi - 10 4 Year 7.51
xiii Baijnath - 16 4 Year 16.71

111 | P a g e
Sl.
No.
Name of
the
Blocks/Su
b Districts
Concerned
Ministry/Depar
tmanet
Component Activity Total
Number/
Capacity
(cum)
Command
Area/Irrigation
Potential (Ha)
Period of
Implemnt
ation (4
yrs) from
2016-17 to
2019-20
Estimate
d cost
(Rs. in
lacs)
xiv BheduMah
adev - 8
4 Year
8.19
xv Lambagaon - 11 4 Year 8.93
Sub Total 0 507 429.03
11
Dehra
MOA &FW-
DAC&FW/Depart
ment of
Agriculture
Per drop more crop (Micro
Irrigation)
Non -DPAP Drip 20 10 4 Year 20.00
12
Non -DPAP Sprinkler
500 300 5 Year 150.00
Sub Total 520 310 170.00
Total
520 1044.5 718.3062
5
13 Dehra
MOA &FW-
DAC&FW/Depart
ment of
Agriculture
(SDSCO Dehra)
Per drop more crop
(Supplementar y water
management activities)
Topping up of MGNREGA
10 10 5 Year 30.00
Fatehpur 18 10 5 Year 30.00
Nagrota
Surian 19 0 5 Year 20.00
Nurpur
10 10 5 Year 30.00
Sub Total 57 30 110.00
14
Fatehpur
MOA &FW-
DAC&FW/
Department of
Agriculture
Per drop more crop
(Supplementar y water
management activities)
Drought
Proofing
through
check
Dams/Water
Harvesting
Structures
20 400 5 Year 200.00
Nagrota
Surian
18 400 5 Year 200.00
Dehra 50 400 5 Year 500.00
Dharamsha
la
3 9 5 Year 13.50
Rait 1 2 5 Year 4.50
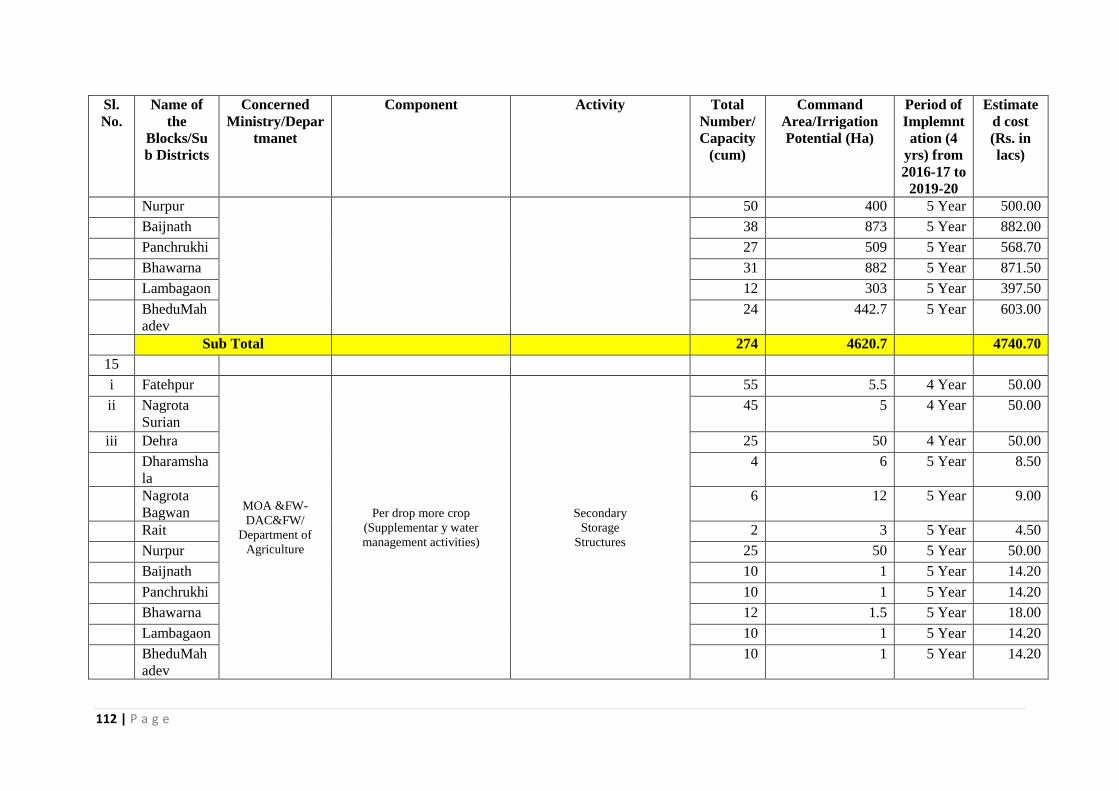
112 | P a g e
Sl.
No.
Name of
the
Blocks/Su
b Districts
Concerned
Ministry/Depar
tmanet
Component Activity Total
Number/
Capacity
(cum)
Command
Area/Irrigation
Potential (Ha)
Period of
Implemnt
ation (4
yrs) from
2016-17 to
2019-20
Estimate
d cost
(Rs. in
lacs)
Nurpur
50 400 5 Year 500.00
Baijnath 38 873 5 Year 882.00
Panchrukhi 27 509 5 Year 568.70
Bhawarna 31 882 5 Year 871.50
Lambagaon 12 303 5 Year 397.50
BheduMah
adev
24 442.7 5 Year 603.00
Sub Total 274 4620.7 4740.70
15
i Fatehpur
MOA &FW-
DAC&FW/
Department of
Agriculture
Per drop more crop
(Supplementar y water
management activities)
Secondary
Storage
Structures
55 5.5 4 Year 50.00
ii Nagrota
Surian
45 5 4 Year 50.00
iii Dehra 25 50 4 Year 50.00
Dharamsha
la
4 6 5 Year 8.50
Nagrota
Bagwan
6 12 5 Year 9.00
Rait 2 3 5 Year 4.50
Nurpur 25 50 5 Year 50.00
Baijnath 10 1 5 Year 14.20
Panchrukhi 10 1 5 Year 14.20
Bhawarna 12 1.5 5 Year 18.00
Lambagaon 10 1 5 Year 14.20
BheduMah
adev
10 1 5 Year 14.20

113 | P a g e
Sl.
No.
Name of
the
Blocks/Su
b Districts
Concerned
Ministry/Depar
tmanet
Component Activity Total
Number/
Capacity
(cum)
Command
Area/Irrigation
Potential (Ha)
Period of
Implemnt
ation (4
yrs) from
2016-17 to
2019-20
Estimate
d cost
(Rs. in
lacs)
Sub Total 214 137 296.8
i Nurpur
Department of
Horticulture,
District Kangra,
H.P.
Per drop more crop
(Supplementary water
management activities)
Secondary Storage
structure/ Water tanks
- 15 4 Year 21.00
ii Indora - 75 4 Year 105.00
iii Nagrota
Surian - 30
4 Year
42.00
iv Fatehpur - 60 4 Year 84.00
v Pragpur - 33 4 Year 46.20
vi Dehra - 45 4 Year 63.00
vii Kangra - 9 4 Year 12.60
viii Rait - 6 4 Year 8.40
ix Dharamsha
la - 3
4 Year
4.20
x Nagrota
Bagwan - 6 4 Year
8.40
xi Bhawarna - 3 4 Year 4.20
xii Panchrukhi - 6 4 Year 8.40
xiii Baijnath - 9 4 Year 12.60
xiv BheduMah
adev - 9
4 Year
12.60
xv Lambagaon - 9 4 Year 12.60
Sub Total 0 318 445.20
16
Dehra
30 4 5 Year 54.00
Fatehpur 30 4 5 Year 54.00
Nagrota 4 7 5 Year 30.00

114 | P a g e
Sl.
No.
Name of
the
Blocks/Su
b Districts
Concerned
Ministry/Depar
tmanet
Component Activity Total
Number/
Capacity
(cum)
Command
Area/Irrigation
Potential (Ha)
Period of
Implemnt
ation (4
yrs) from
2016-17 to
2019-20
Estimate
d cost
(Rs. in
lacs)
Surian MOA &FW-
DAC&FW/Dep
artment of
Agriculture
Per drop more crop
(Supplementar y water
management activities)
On Farm Development
(distribution pipe / raised bed
and furrow system etc.)
Nurpur 30 4 5 Year 54.00
Baijnath 6 10 5 Year 12.00
Panchrukhi 10 15 5 Year 17.00
Bhawarna 10 15 5 Year 17.00
Lambagaon 12 18 5 Year 20.00
Bhedu
Mahadev
8 10 5 Year 12.00
Sub Total 140.00 87.00 270.00
i Nurpur
Department of
Horticulture,
District Kangra,
H.P.
Per drop more crop
(Supplementar y water
management activities)
On Farm Development/
Borewell/ dugwell
- 15 4 Year 27.00
ii Indora - 150 4 Year 270.00
iii Nagrota
Surian - 0
4 Year
0.00
iv Fatehpur - 30 4 Year 54.00
v Pragpur - 30 4 Year 54.00
vi Dehra - 30 4 Year 54.00
vii Kangra - 0 4 Year 0.00
viii Rait - 0 4 Year 0.00
ix Dharamsha
la - 0
4 Year
0.00
x Nagrota
Bagwan - 3 4 Year
5.40
xi Bhawarna - 3 4 Year 5.40
xii Panchrukhi - 3 4 Year 5.40
xiii Baijnath - 0 4 Year 0.00

115 | P a g e
Sl.
No.
Name of
the
Blocks/Su
b Districts
Concerned
Ministry/Depar
tmanet
Component Activity Total
Number/
Capacity
(cum)
Command
Area/Irrigation
Potential (Ha)
Period of
Implemnt
ation (4
yrs) from
2016-17 to
2019-20
Estimate
d cost
(Rs. in
lacs)
xiv BheduMah
adev - 0
4 Year
0.00
xv Lambagaon - 0 4 Year 0.00
Sub Total 0 264 475.20
16.a. Tranning program
i Nurpur
Department of
Horticulture,
District Kangra,
H.P.
- - 4 Year 2.00
ii Indora - - 4 Year 1.50
iii Nagrota
Surian - -
4 Year
2.00
iv Fatehpur - - 4 Year 1.50
v Pragpur - - 4 Year 2.00
vi Dehra - - 4 Year 1.50
vii Kangra - - 4 Year 2.00
viii Rait - - 4 Year 1.50
ix Dharamsha
la - -
4 Year
2.00
x Nagrota
Bagwan - - 4 Year
1.50
xi Bhawarna - - 4 Year 1.50
xii Panchrukhi - - 4 Year 1.50
xiii Baijnath - - 4 Year 2.00
xiv BheduMah
adev - -
4 Year
1.50
xv Lambagaon - - 4 Year 1.50
Sub Total 0 0 25.50

116 | P a g e
Sl.
No.
Name of
the
Blocks/Su
b Districts
Concerned
Ministry/Depar
tmanet
Component Activity Total
Number/
Capacity
(cum)
Command
Area/Irrigation
Potential (Ha)
Period of
Implemnt
ation (4
yrs) from
2016-17 to
2019-20
Estimate
d cost
(Rs. in
lacs)
Total 685.00 5456.70 6363.40
Total Per Drop More Crop 1205 6501.2 7081.71
17 Water Harvesting Structures (Newly to be created)
17.1
Baijnath
Department of
Rural
Development
Agency, Kangra
at Dharamshala
(MoRD)
PMKSY Watershed
Farm Ponds 63 146 4 Year 10.52
17.2 Check Dams 123 1655 4 Year 129.60
17.3 Nalla Bandhs 27 169 4 Year 14.20
17.4 Percolation Tanks 0 0 4 Year 0.00 17.5
Other ground water
recharge structure 0 0 4 Year 0.00 17.6 Fishry Pond/Cattel Ponds
0 0
4 Year
0.00
Others 1191 5861 4 Year 388.22
Sub Total 1404 7831 542.54
18 Water Harvesting Structures ( to be Renovated)
18.1
PMKSY Watershed
Farm Ponds 2 0 4 Year 0.19
18.2 Check Dams 0 0 0 0.00
18.3 Nalla Bandhs 0 0 0 0.00
18.4 Percolation Tanks 0 0 0 0.00 18.5
Other ground water
recharge structure 0 0 0 0.00 18.6 Fishry Pond/Cattel Ponds
0 0 0 0.00

117 | P a g e
Sl.
No.
Name of
the
Blocks/Su
b Districts
Concerned
Ministry/Depar
tmanet
Component Activity Total
Number/
Capacity
(cum)
Command
Area/Irrigation
Potential (Ha)
Period of
Implemnt
ation (4
yrs) from
2016-17 to
2019-20
Estimate
d cost
(Rs. in
lacs)
Others 20 0 4 Year 6.70
Sub Total 22 0 6.89
18.7(
A) Land Development
i)
PMKSY Watershed
Afforestation 0 7 4 Year 9.00 ii) Horticulture 0 288 4 Year 20.99 iii) Agriculture 0 134 4 Year 29.34 iv) Pasture 0 274 4 Year 20.57
Sub Total 0 703 79.90
18.7(
B) Soil & Moisture
Conservation
i)
PMKSY Watershed
Staggered Trenching 94 7 4 Year 3.50 ii) Contour Bunding 44 12 4 Year 6.00 iii) Graded Bunding 42 3 4 Year 3.00 iv) Bench terrracing 97 4 4 Year 5.00 v) Others 50 30 4 Year 10.00 vi) Crate Wire 4 4 4 Year 4.00 vii) Land leveling 2 2 4 Year 2.00
Sub Total 333 62 33.50
18.7(
B)
Baijnath
Department of
Rural
Development
Agency, Kangra
at Dharamshala
(MoRD)
Vegetative & Engg.
Structure
viii)
PMKSY Watershed
Earthen Checks 39 28 4 Year 4.50 ix) Brush Wood Checks 90 42 4 Year 10.00 x) Gully plugs 250 50 4 Year 8.00 xi) Loose boulders 457 89 4 Year 23.00

118 | P a g e
Sl.
No.
Name of
the
Blocks/Su
b Districts
Concerned
Ministry/Depar
tmanet
Component Activity Total
Number/
Capacity
(cum)
Command
Area/Irrigation
Potential (Ha)
Period of
Implemnt
ation (4
yrs) from
2016-17 to
2019-20
Estimate
d cost
(Rs. in
lacs)
xii) Gabion structures 497 838 4 Year 83.83 xiii) Others 16 60 4 Year 5.00 xiv) Dry check dam 31 127 4 Year 10.00 xv) Drainage 27 97 4 Year 8.00 xvi) Bunds repair 38 52 4 Year 23.00
Sub Total 1445 1382 175.33
Total 3204 9978 838.15
18.7
© Entry Point Activities 0 0 0 59.87 18.7(
D) DPR 0 0 0 14.97 18.7(
E) I & CB 95 0 4 Year
74.84 18.7(F
) Livelihood 201 0 4 Year
134.70 18.7(
G)
Prod. Sys. & Mirco Enter.
Activities-wise No. -
Sericulutre 0 0 0 0.00 Bee Keeping 0 0 0 0.00 Poultry 0 0 0 0.00 Fishry 0 0 0 0.00 Bio fuel Plantation 0 0 0 0.00 Others 24 0 4 Year 149.67 Sub Total 24 0 0 149.67
18.7(
H) Monitoring 0 0
14.97 18.7(I
) Evaluation 0 0
14.97

119 | P a g e
Sl.
No.
Name of
the
Blocks/Su
b Districts
Concerned
Ministry/Depar
tmanet
Component Activity Total
Number/
Capacity
(cum)
Command
Area/Irrigation
Potential (Ha)
Period of
Implemnt
ation (4
yrs) from
2016-17 to
2019-20
Estimate
d cost
(Rs. in
lacs)
18.7(J
) Consolidation 0 0
44.90 18.7(
K) Administration 0 0
149.67
Grand Total 3524 9978 1496.70
17
Bhawarna
Department of
Rural
Development
Agency, Kangra
at Dharamshala
(MoRD)
Water Harvesting Structures (Newly to be created)
17.1
PMKSY Watershed
Farm Ponds 3 23 4 Year 1.90
17.2 Check Dams 4 132 4 Year 11.07
17.3 Nalla Bandhs 7 146 4 Year 12.25
17.4 Percolation Tanks 0 0 0 0.00
17.5
Other ground water
recharge structure 0 0 0 0.00
17.6 Fishry Pond/Cattel Ponds 0 0 0 0.00
Others 444 1968 4 Year 165.28
Sub Total 458 2268 0 190.49
18
Water Harvesting
Structures ( to be
Renovated)
18.1
PMKSY Watershed
Farm Ponds 0 0 0 0.00
18.2 Check Dams 0 0 0 0.00
18.3 Nalla Bandhs 0 0 0 0.00
18.4 Percolation Tanks 0 0 0 0.00
18.5
Other ground water
recharge structure 0 0 0 0.00
18.6 Fishry Pond/Cattel Ponds 0 0 0 0.00

120 | P a g e
Sl.
No.
Name of
the
Blocks/Su
b Districts
Concerned
Ministry/Depar
tmanet
Component Activity Total
Number/
Capacity
(cum)
Command
Area/Irrigation
Potential (Ha)
Period of
Implemnt
ation (4
yrs) from
2016-17 to
2019-20
Estimate
d cost
(Rs. in
lacs)
Others 67 174 4 Year 14.58
Sub Total 67 174 14.58 18.7(
A) Land Development
i)
PMKSY Watershed
Afforestation 0 27 4 Year 2.30
ii) Horticulture 0 144 4 Year 12.11
iii) Agriculture 0 13 4 Year 1.13
iv) Pasture 0 150 4 Year 12.57
Sub Total 0 335 28.11
18.7(
B)
Soil & Moisture
Conservation
i)
PMKSY Watershed
Staggered Trenching 0 0 0 0.00
ii) Contour Bunding 0 0 0 0.00
iii) Graded Bunding 0 0 0 0.00
iv) Bench terrracing 0 0 0 0.00
v) Others 89 422 4 Year 35.49
vi) Crate Wire 177 876 4 Year 73.57
vii) Land leveling 73 356 4 Year 29.93
Sub Total 339 1655 138.99
18.7(
B)
Bhawarna
Department of
Rural
Development
Agency, Kangra
at Dharamshala
(MoRD)
Vegetative & Engg.
Structure
viii)
PMKSY Watershed
Earthen Checks 0 0 0 0.00
ix) Brush Wood Checks 3 6 0 0.46
x) Gully plugs 0 0 0 0.00
xi) Loose boulders 37 32 4 Year 2.70

121 | P a g e
Sl.
No.
Name of
the
Blocks/Su
b Districts
Concerned
Ministry/Depar
tmanet
Component Activity Total
Number/
Capacity
(cum)
Command
Area/Irrigation
Potential (Ha)
Period of
Implemnt
ation (4
yrs) from
2016-17 to
2019-20
Estimate
d cost
(Rs. in
lacs)
xii) Gabion structures 0 0 0 0.00
xiii) Others 0 0 0 0.00
xiv) Dry check dam 0 0 0 0.00
xv) Drainage 40 327 4 Year 27.45
xvi) Bunds repair 0 0 0 0.00
Sub Total 80 364 30.62
Total 945 4795 402.79 18.7
© Entry Point Activities 0 0 0 0.00 18.7(
D) DPR 0 0 0 0.00 18.7(
E) I & CB 60 0 4 Year
31.86 18.7(F
) Livelihood 180 0 4 Year
64.46 18.7(
G)
Prod. Sys. & Mirco Enter.
Activities-wise No.
Sericulutre 0 0 0 0.00
Bee Keeping 4 0 4 Year 2.10
Poultry 4 0 4 Year 12.25
Fishry 3 0 4 Year 3.30
Bio fuel Plantation 0 0 0 0.00
Others 17 0 4 Year 54.40
Sub Total 27 0 72.05 18.7(
H) Monitoring 0 0 0 6.07 18.7(I
) Evaluation 0 0 0 5.31

122 | P a g e
Sl.
No.
Name of
the
Blocks/Su
b Districts
Concerned
Ministry/Depar
tmanet
Component Activity Total
Number/
Capacity
(cum)
Command
Area/Irrigation
Potential (Ha)
Period of
Implemnt
ation (4
yrs) from
2016-17 to
2019-20
Estimate
d cost
(Rs. in
lacs)
18.7(J
) Consolidation 0 0 0 22.75 18.7(
K) Administration 0 0 0 64.46
Grand Total 1212 4795 669.75
17
Dehra
Department of
Rural
Development
Agency, Kangra
at Dharamshala
(MoRD)
Water Harvesting
Structures (Newly to be
created)
17.1
PMKSY Watershed
Farm Ponds 267 956 4 Year 70.76
17.2 Check Dams 264 3324 4 Year 211.48
17.3 Nalla Bandhs 0 0 0 0.00
17.4 Percolation Tanks 0 0 0 0.00
17.5
Other ground water
recharge structure 0 0 0 0.00
17.6 Fishry Pond/Cattel Ponds 0 0 0 0.00
Others 2089 14508 4 Year 707.73
Sub Total 2620 18788 0 989.97
18
Water Harvesting
Structures ( to be
Renovated)
18.1
PMKSY Watershed
Farm Ponds 2 0 0 0.19
18.2 Check Dams 0 0 0 0.00
18.3 Nalla Bandhs 0 0 0 0.00
18.4 Percolation Tanks 0 0 0 0.00
18.5
Other ground water
recharge structure 0 0 0 0.00

123 | P a g e
Sl.
No.
Name of
the
Blocks/Su
b Districts
Concerned
Ministry/Depar
tmanet
Component Activity Total
Number/
Capacity
(cum)
Command
Area/Irrigation
Potential (Ha)
Period of
Implemnt
ation (4
yrs) from
2016-17 to
2019-20
Estimate
d cost
(Rs. in
lacs)
18.6 Fishry Pond/Cattel Ponds 0 0 0 0.00
Others 0 0 0 0.96
Sub Total 2 0 1.15
18.7(
A) Land Development
i)
PMKSY Watershed
Afforestation 0 0 0 0.00
ii) Horticulture 0 1557 4 Year 109.21
iii) Agriculture 0 346 4 Year 28.52
iv) Pasture 0 517 4 Year 38.74
Sub Total 0 2420 176.46
18.7(
B)
Soil & Moisture
Conservation
i)
PMKSY Watershed
Staggered Trenching 0 0 0 0.00
ii) Contour Bunding 0 0 0 0.00
iii) Graded Bunding 0 0 0 0.00
iv) Bench terrracing 0 0 0 0.00
v) Others 0 0 0 0.00
vi) Crate Wire
1345.785
7 2591
4 Year
162.05
vii) Land leveling 110 124 4 Year 9.27
Sub Total 1455.79 2715 171.31
18.7(
B) Dehra
Department of
Rural
Development
Agency, Kangra
Vegetative & Engg.
Structure
viii) PMKSY Watershed
Earthen Checks 0 0 0 0.00
ix) Brush Wood Checks 0 0 0 0.00

124 | P a g e
Sl.
No.
Name of
the
Blocks/Su
b Districts
Concerned
Ministry/Depar
tmanet
Component Activity Total
Number/
Capacity
(cum)
Command
Area/Irrigation
Potential (Ha)
Period of
Implemnt
ation (4
yrs) from
2016-17 to
2019-20
Estimate
d cost
(Rs. in
lacs)
x) at Dharamshala
(MoRD) Gully plugs 0 0 0 0.00
xi) Loose boulders 0 0 0 0.00
xii) Gabion structures 475 928 4 Year 66.66
xiii) Others 0 0 0 0.00
xiv) Dry check dam 473 503 4 Year 37.71
xv) Drainage 125 128 4 Year 9.61
xvi) Bunds repair 30 64 4 Year 4.81
Sub Total 1103 1623 118.79
Total 5181 25546 1457.68
18.7
© Entry Point Activities 0 0 0 0.00
18.7(
D) DPR 0 0 0 0.00
18.7(
E) I & CB 96 0
4 Year
88.63
18.7(
F) Livelihood 900 0
4 Year
326.31
18.7(
G)
Prod. Sys. & Mirco Enter.
Activities-wise No.
Sericulutre 1 0 4 Year 0.10
Bee Keeping 3 0 4 Year 2.30
Poultry 3 0 4 Year 35.73
Fishry 2 0 4 Year 27.98
Bio fuel Plantation 0 0 4 Year 0.00
Others 73 0 4 Year 381.06

125 | P a g e
Sl.
No.
Name of
the
Blocks/Su
b Districts
Concerned
Ministry/Depar
tmanet
Component Activity Total
Number/
Capacity
(cum)
Command
Area/Irrigation
Potential (Ha)
Period of
Implemnt
ation (4
yrs) from
2016-17 to
2019-20
Estimate
d cost
(Rs. in
lacs)
Sub Total 82 0 447.17
18.7(
H) Monitoring 0 0 0 32.23
18.7(
I) Evaluation 0 0 0 28.20
18.7(
J) Consolidation 0 0 0 201.43
18.7(
K) Administration 0 0 0 246.43
Grand Total 6259 25546 2828.07
17
Pragpur
Department of
Rural
Development
Agency, Kangra
at Dharamshala
(MoRD)
Water Harvesting
Structures (Newly to be
created)
17.1
PMKSY Watershed
Farm Ponds 134 686 4 Year 57.66
17.2 Check Dams 67 693 4 Year 58.22
17.3 Nalla Bandhs 39 194 4 Year 16.32
17.4 Percolation Tanks 3 39 4 Year 3.24 17.5 Other ground water
recharge structure 40 490
4 Year
41.19 17.6 Fishry Pond/Cattel Ponds 0 0 0 0.00
Others 1301 9970 4 Year 837.44
Sub Total 1584 12072 1014.06
18
Water Harvesting
Structures ( to be
Renovated)

126 | P a g e
Sl.
No.
Name of
the
Blocks/Su
b Districts
Concerned
Ministry/Depar
tmanet
Component Activity Total
Number/
Capacity
(cum)
Command
Area/Irrigation
Potential (Ha)
Period of
Implemnt
ation (4
yrs) from
2016-17 to
2019-20
Estimate
d cost
(Rs. in
lacs)
18.1
PMKSY Watershed
Farm Ponds 84 296 4 Year 24.90
18.2 Check Dams 0 0 0.00
18.3 Nalla Bandhs 0 0 0.00
18.4 Percolation Tanks 0 0 0.00 18.5 Other ground water
recharge structure 10 99
4 Year
8.31 18.6 Fishry Pond/Cattel Ponds 0 0 0.00
Others 257 1796 4 Year 150.91
Sub Total 351 2192 184.11 18.7(
A) Land Development i)
PMKSY Watershed
Afforestation 0 120 4 Year 10.10 ii) Horticulture 0 0 0.00 iii) Agriculture 0 0 0.00 iv) Pasture 0 54 4 Year 4.57
Sub Total 0 175 14.67 18.7(
B) Soil & Moisture
Conservation i)
PMKSY Watershed
Staggered Trenching 0 37 4 Year 3.11 ii) Contour Bunding 0 0 0.00 iii) Graded Bunding 0 84 4 Year 7.02 iv) Bench terrracing 0 0 0.00 v) Others 0 0 0.00 vi) Crate Wire 0 0 0.00 vii) Land leveling 0 0 0.00

127 | P a g e
Sl.
No.
Name of
the
Blocks/Su
b Districts
Concerned
Ministry/Depar
tmanet
Component Activity Total
Number/
Capacity
(cum)
Command
Area/Irrigation
Potential (Ha)
Period of
Implemnt
ation (4
yrs) from
2016-17 to
2019-20
Estimate
d cost
(Rs. in
lacs)
Sub Total 0 121 10.13 18.7(
B)
Pragpur
Department of
Rural
Development
Agency, Kangra
at Dharamshala
(MoRD)
Vegetative & Engg.
Structure
viii)
PMKSY Watershed
Earthen Checks 0 0 0.00 ix) Brush Wood Checks 0 131 4 Year 10.99 x) Gully plugs 0 35 4 Year 2.98 xi) Loose boulders 0 2294 4 Year 192.57 xii) Gabion structures 1 274 4 Year 23.10 xiii) Others 302 12 4 Year 0.99 xiv) Dry check dam 0 0 0.00 xv) Drainage 0 0 0.00 xvi) Bunds repair 0 0 0.00
Sub Total 303 2746 230.62
Total 2238 17305 1453.59 18.7
© Entry Point Activities 0 0 0.00 18.7(
D) DPR 0 0 0.00 18.7(
E) I & CB 147 0 4 Year
84.71 18.7(F
) Livelihood 400 0 4 Year
237.58 18.7(
G)
Prod. Sys. & Mirco Enter.
Activities-wise No. Sericulutre 0 0 0.00 Bee Keeping 1 0 4 Year 0.13 Poultry 3 0 4 Year 10.75

128 | P a g e
Sl.
No.
Name of
the
Blocks/Su
b Districts
Concerned
Ministry/Depar
tmanet
Component Activity Total
Number/
Capacity
(cum)
Command
Area/Irrigation
Potential (Ha)
Period of
Implemnt
ation (4
yrs) from
2016-17 to
2019-20
Estimate
d cost
(Rs. in
lacs)
Fishry 0 0 0.00 Bio fuel Plantation 0 0 0.00 Others 72 0 4 Year 257.95 Sub Total 76 0 268.84 18.7(
H) Monitoring 0 0 25.01 18.7(I
) Evaluation 0 0 21.88 18.7(J
) Consolidation 0 0 93.78 18.7(
K) Administration 0 0 225.07
Grand Total 2861 17305 2410.46
17
Lambagaon
Department of
Rural
Development
Agency, Kangra
at Dharamshala
(MoRD)
Water Harvesting
Structures (Newly to be
created)
17.1
PMKSY Watershed
Farm Ponds 18 93 4 Year 7.85
17.2 Check Dams 34 615 4 Year 51.67
17.3 Nalla Bandhs 0 0 0 0.00
17.4 Percolation Tanks 0 0 0 0.00
17.5
Other ground water
recharge structure 0 0 0 0.00
17.6 Fishry Pond/Cattel Ponds 0 0 0 0.00
Others 238 1787 4 Year 150.11
Sub Total 290 2496 209.63
18 Water Harvesting

129 | P a g e
Sl.
No.
Name of
the
Blocks/Su
b Districts
Concerned
Ministry/Depar
tmanet
Component Activity Total
Number/
Capacity
(cum)
Command
Area/Irrigation
Potential (Ha)
Period of
Implemnt
ation (4
yrs) from
2016-17 to
2019-20
Estimate
d cost
(Rs. in
lacs)
Structures ( to be
Renovated)
18.1
PMKSY Watershed
Farm Ponds 20 0 0 4.96
18.2 Check Dams 0 0 0 0.00
18.3 Nalla Bandhs 0 0 0 0.00
18.4 Percolation Tanks 0 0 0 0.00
18.5
Other ground water
recharge structure 0 0 0 0.00
18.6 Fishry Pond/Cattel Ponds 0 0 0 0.00
Others 60 0 0 31.06
Sub Total 80 0 36.02
18.7(
A) Land Development
i)
PMKSY Watershed
Afforestation 0 67 4 Year 5.67
ii) Horticulture 0 0 0 0.00
iii) Agriculture 0 0 0 0.00
iv) Pasture 0 62 4 Year 5.25
Sub Total 0 129 10.92
18.7(
B)
Soil & Moisture
Conservation
i)
PMKSY Watershed
Staggered Trenching 0 0 0 0.00
ii) Contour Bunding 0 0 0 0.00
iii) Graded Bunding 0 0 0 0.00
iv) Bench terrracing 0 0 0 0.00
v) Others 0 0 0 0.00

130 | P a g e
Sl.
No.
Name of
the
Blocks/Su
b Districts
Concerned
Ministry/Depar
tmanet
Component Activity Total
Number/
Capacity
(cum)
Command
Area/Irrigation
Potential (Ha)
Period of
Implemnt
ation (4
yrs) from
2016-17 to
2019-20
Estimate
d cost
(Rs. in
lacs)
vi) Crate Wire 0 0 0 0.00
vii) Land leveling 0 0 0 0.00
Sub Total 0 0 0.00
18.7(
B)
Lamba-
gaon
Department of
Rural
Development
Agency, Kangra
at Dharamshala
(MoRD)
Vegetative & Engg.
Structure
viii)
PMKSY Watershed
Earthen Checks 0 0 0 0.00
ix) Brush Wood Checks 0 0 0 0.00
x) Gully plugs 0 0 0 0.00
xi) Loose boulders 0 1077 4 Year 90.43
xii) Gabion structures 0 0 0 0.00
xiii) Others 0 0 0 0.00
xiv) Dry check dam 0 0 0 0.00
xv) Drainage 0 0 0 0.00
xvi) Bunds repair 0 0 0 0.00
Sub Total 0 1077 90.43
Total 370 3701 347.01
18.7
© Entry Point Activities 0 0 0 0.00
18.7(
D) DPR 0 0 0 0.00
18.7(
E) I & CB 16 0
4 Year
20.22
18.7(
F) Livelihood 158 0
4 Year
56.72
18.7(
G) Prod. Sys. & Mirco Enter.
Activities-wise No. 0.00

131 | P a g e
Sl.
No.
Name of
the
Blocks/Su
b Districts
Concerned
Ministry/Depar
tmanet
Component Activity Total
Number/
Capacity
(cum)
Command
Area/Irrigation
Potential (Ha)
Period of
Implemnt
ation (4
yrs) from
2016-17 to
2019-20
Estimate
d cost
(Rs. in
lacs)
Sericulutre 0 0 0 0.00
Bee Keeping 1 0 4 Year 0.55
Poultry 0 0 0 0.00
Fishry 0 0 0 0.20
Bio fuel Plantation 0 0 0 0.00
Others 13 0 4 Year 63.43
Sub Total 14 0 64.18
18.7(
H) Monitoring 0 0 0 5.97
18.7(
I) Evaluation 0 0 0 5.22
18.7(
J) Consolidation 0 0 0 22.39
18.7(
K) Administration 0 0 0 53.73
Grand Total 558 3701 575.43
17
Indora
Department of
Rural
Development
Agency, Kangra
at Dharamshala
(MoRD)
Water Harvesting
Structures (Newly to be
created)
17.1
PMKSY Watershed
Farm Ponds 21 476 4 Year 40.02
17.2 Check Dams 37 1554 4 Year 130.52
17.3 Nalla Bandhs 0 0 0.00
17.4 Percolation Tanks 0 0 0.00
17.5
Other ground water
recharge structure 0 0 0.00

132 | P a g e
Sl.
No.
Name of
the
Blocks/Su
b Districts
Concerned
Ministry/Depar
tmanet
Component Activity Total
Number/
Capacity
(cum)
Command
Area/Irrigation
Potential (Ha)
Period of
Implemnt
ation (4
yrs) from
2016-17 to
2019-20
Estimate
d cost
(Rs. in
lacs)
17.6 Fishry Pond/Cattel Ponds 0 0 0.00
Others 2141 3772 4 Year 316.85
Sub Total 2199 5802 487.38
18
Water Harvesting
Structures ( to be
Renovated)
18.1
PMKSY Watershed
Farm Ponds 5 152 4 Year 12.75
18.2 Check Dams 0 0 0.00
18.3 Nalla Bandhs 0 0 0.00
18.4 Percolation Tanks 0 0 0.00
18.5
Other ground water
recharge structure 0 0 0.00
18.6 Fishry Pond/Cattel Ponds 0 0 0.00
Others 6 54 4 Year 4.50
Sub Total 11 205 17.25 18.7(
A) Land Development
i)
PMKSY Watershed
Afforestation 0 280 4 Year 23.55
ii) Horticulture 0 754 4 Year 63.35
iii) Agriculture 0 110 4 Year 9.20
iv) Pasture 0 48 4 Year 4.00
Sub Total 0 1192 100.10
18.7(
B)
Soil & Moisture
Conservation
i) PMKSY Watershed Staggered Trenching 2 4 4 Year 0.30

133 | P a g e
Sl.
No.
Name of
the
Blocks/Su
b Districts
Concerned
Ministry/Depar
tmanet
Component Activity Total
Number/
Capacity
(cum)
Command
Area/Irrigation
Potential (Ha)
Period of
Implemnt
ation (4
yrs) from
2016-17 to
2019-20
Estimate
d cost
(Rs. in
lacs)
ii) Contour Bunding 0 0 0.00
iii) Graded Bunding 0 0 0.00
iv) Bench terrracing 0 0 0.00
v) Others 0 911 4 Year 76.55
vi) Crate Wire 0 0 0.00
vii) Land leveling 0 0 0.00
Sub Total 2 915 76.85
18.7(
B)
Indora
Department of
Rural
Development
Agency, Kangra
at Dharamshala
(MoRD)
Vegetative & Engg.
Structure
viii)
PMKSY Watershed
Earthen Checks 0 0 0.00
ix) Brush Wood Checks 12 13 4 Year 1.10
x) Gully plugs 5008 1125 4 Year 94.48
xi) Loose boulders 12 38 4 Year 3.20
xii) Gabion structures 62 620 4 Year 52.05
xiii) Others 4 5 4 Year 0.40
xiv) Dry check dam 0 0 0.00
xv) Drainage 0 0 0.00
xvi) Bunds repair 0 0 0.00
Sub Total 5098 1800 151.23
Total 7310 9914 832.82 18.7
© Entry Point Activities 0 0 0.00 18.7(
D) DPR 0 0 0.00 18.7(
E) I & CB 106 0 4 Year
57.70
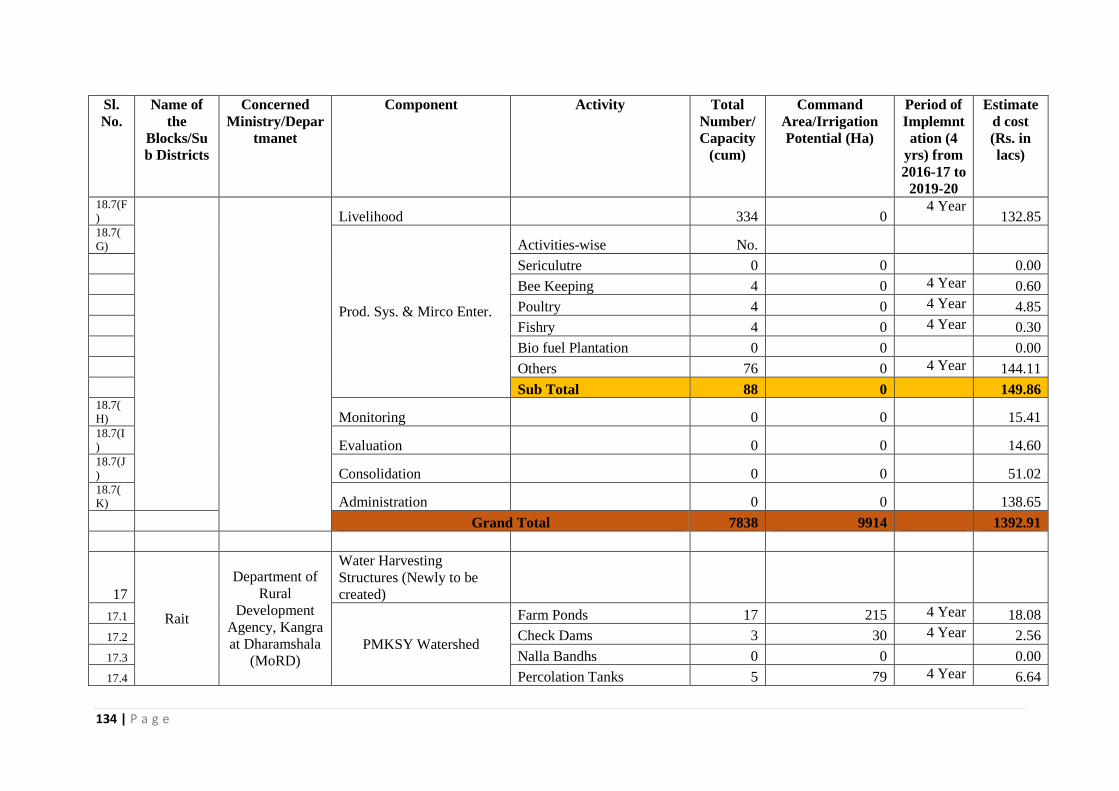
134 | P a g e
Sl.
No.
Name of
the
Blocks/Su
b Districts
Concerned
Ministry/Depar
tmanet
Component Activity Total
Number/
Capacity
(cum)
Command
Area/Irrigation
Potential (Ha)
Period of
Implemnt
ation (4
yrs) from
2016-17 to
2019-20
Estimate
d cost
(Rs. in
lacs)
18.7(F
) Livelihood 334 0 4 Year
132.85 18.7(
G)
Prod. Sys. & Mirco Enter.
Activities-wise No.
Sericulutre 0 0 0.00
Bee Keeping 4 0 4 Year 0.60
Poultry 4 0 4 Year 4.85
Fishry 4 0 4 Year 0.30
Bio fuel Plantation 0 0 0.00
Others 76 0 4 Year 144.11
Sub Total 88 0 149.86 18.7(
H) Monitoring 0 0 15.41 18.7(I
) Evaluation 0 0 14.60 18.7(J
) Consolidation 0 0 51.02 18.7(
K) Administration 0 0 138.65
Grand Total 7838 9914 1392.91
17
Rait
Department of
Rural
Development
Agency, Kangra
at Dharamshala
(MoRD)
Water Harvesting
Structures (Newly to be
created)
17.1
PMKSY Watershed
Farm Ponds 17 215 4 Year 18.08
17.2 Check Dams 3 30 4 Year 2.56
17.3 Nalla Bandhs 0 0 0.00
17.4 Percolation Tanks 5 79 4 Year 6.64
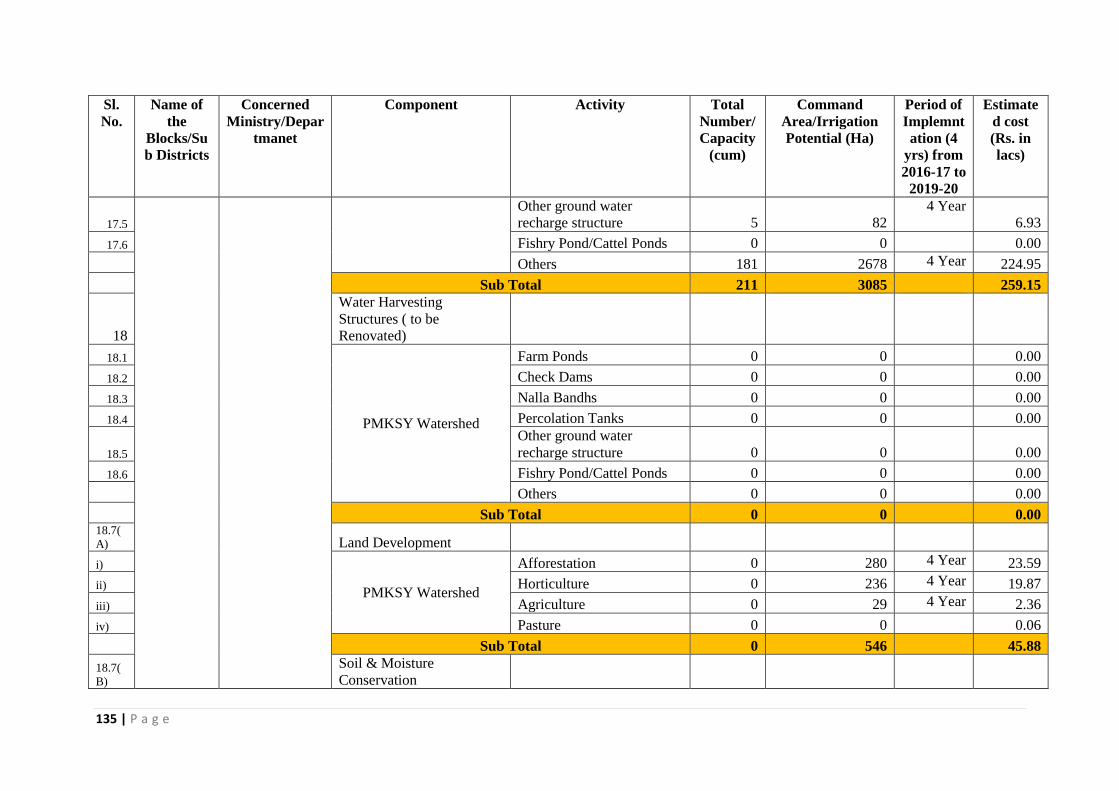
135 | P a g e
Sl.
No.
Name of
the
Blocks/Su
b Districts
Concerned
Ministry/Depar
tmanet
Component Activity Total
Number/
Capacity
(cum)
Command
Area/Irrigation
Potential (Ha)
Period of
Implemnt
ation (4
yrs) from
2016-17 to
2019-20
Estimate
d cost
(Rs. in
lacs)
17.5
Other ground water
recharge structure 5 82
4 Year
6.93
17.6 Fishry Pond/Cattel Ponds 0 0 0.00
Others 181 2678 4 Year 224.95
Sub Total 211 3085 259.15
18
Water Harvesting
Structures ( to be
Renovated)
18.1
PMKSY Watershed
Farm Ponds 0 0 0.00
18.2 Check Dams 0 0 0.00
18.3 Nalla Bandhs 0 0 0.00
18.4 Percolation Tanks 0 0 0.00
18.5
Other ground water
recharge structure 0 0 0.00
18.6 Fishry Pond/Cattel Ponds 0 0 0.00
Others 0 0 0.00
Sub Total 0 0 0.00 18.7(
A) Land Development
i)
PMKSY Watershed
Afforestation 0 280 4 Year 23.59
ii) Horticulture 0 236 4 Year 19.87
iii) Agriculture 0 29 4 Year 2.36
iv) Pasture 0 0 0.06
Sub Total 0 546 45.88
18.7(
B)
Soil & Moisture
Conservation

136 | P a g e
Sl.
No.
Name of
the
Blocks/Su
b Districts
Concerned
Ministry/Depar
tmanet
Component Activity Total
Number/
Capacity
(cum)
Command
Area/Irrigation
Potential (Ha)
Period of
Implemnt
ation (4
yrs) from
2016-17 to
2019-20
Estimate
d cost
(Rs. in
lacs)
i)
PMKSY Watershed
Staggered Trenching 0 0 0.00
ii) Contour Bunding 0 0 0.00
iii) Graded Bunding 0 0 0.00
iv) Bench terrracing 0 0 0.00
v) Others 0 0 0.00
vi) Crate Wire 0 0 0.00
vii) Land leveling 0 0 0.00
Sub Total 0 0 0.00
18.7(
B)
Rait
Department of
Rural
Development
Agency, Kangra
at Dharamshala
(MoRD)
Vegetative & Engg.
Structure
viii)
PMKSY Watershed
Earthen Checks 0 0 0.00
ix) Brush Wood Checks 0 0 0.00
x) Gully plugs 0 0 0.00
xi) Loose boulders 1457 1452 4 Year 122.08
xii) Gabion structures 0 0 0.00
xiii) Others 2 7 4 Year 1.00
xiv) Dry check dam 0 0 0.00
xv) Drainage 0 0 0.00
xvi) Bunds repair 0 0 0.00
Sub Total 1459 1459 123.08
Total 1670 5090 428.12 18.7
© Entry Point Activities 0 0 0.00 18.7(
D) DPR 0 0 0.00
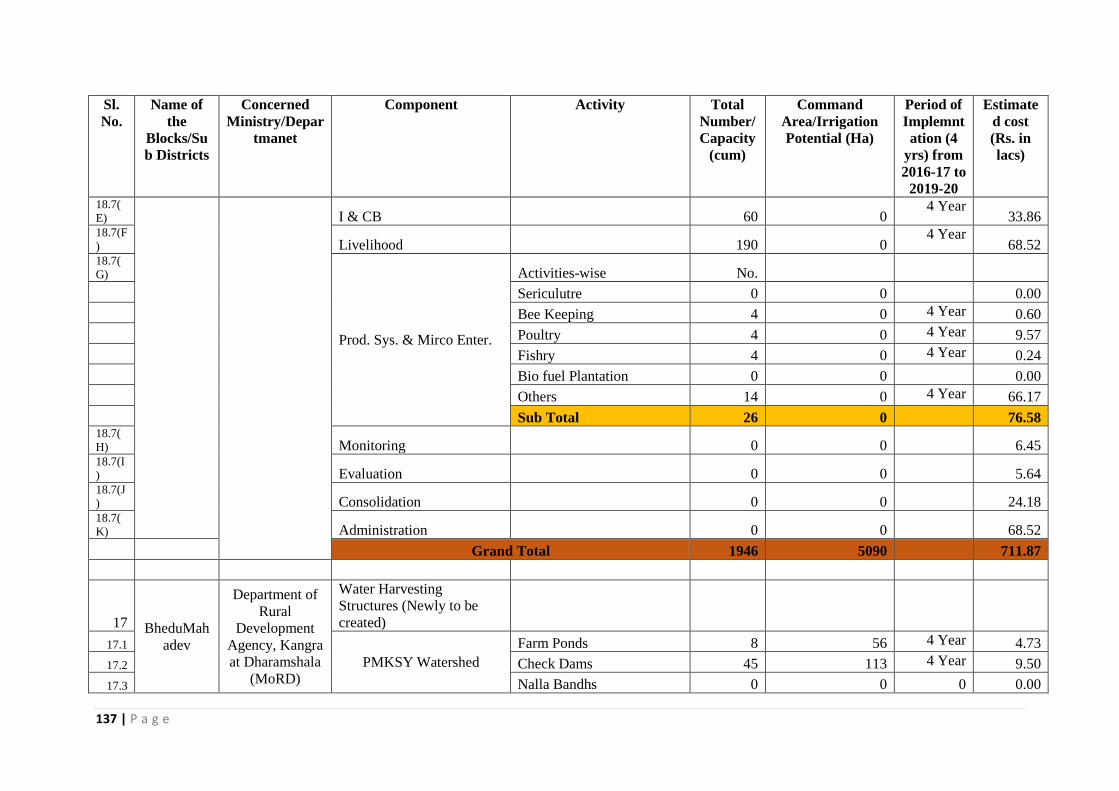
137 | P a g e
Sl.
No.
Name of
the
Blocks/Su
b Districts
Concerned
Ministry/Depar
tmanet
Component Activity Total
Number/
Capacity
(cum)
Command
Area/Irrigation
Potential (Ha)
Period of
Implemnt
ation (4
yrs) from
2016-17 to
2019-20
Estimate
d cost
(Rs. in
lacs)
18.7(
E) I & CB 60 0 4 Year
33.86 18.7(F
) Livelihood 190 0 4 Year
68.52 18.7(
G)
Prod. Sys. & Mirco Enter.
Activities-wise No.
Sericulutre 0 0 0.00
Bee Keeping 4 0 4 Year 0.60
Poultry 4 0 4 Year 9.57
Fishry 4 0 4 Year 0.24
Bio fuel Plantation 0 0 0.00
Others 14 0 4 Year 66.17
Sub Total 26 0 76.58 18.7(
H) Monitoring 0 0 6.45 18.7(I
) Evaluation 0 0 5.64 18.7(J
) Consolidation 0 0 24.18 18.7(
K) Administration 0 0 68.52
Grand Total 1946 5090 711.87
17 BheduMah
adev
Department of
Rural
Development
Agency, Kangra
at Dharamshala
(MoRD)
Water Harvesting
Structures (Newly to be
created)
17.1
PMKSY Watershed
Farm Ponds 8 56 4 Year 4.73
17.2 Check Dams 45 113 4 Year 9.50
17.3 Nalla Bandhs 0 0 0 0.00

138 | P a g e
Sl.
No.
Name of
the
Blocks/Su
b Districts
Concerned
Ministry/Depar
tmanet
Component Activity Total
Number/
Capacity
(cum)
Command
Area/Irrigation
Potential (Ha)
Period of
Implemnt
ation (4
yrs) from
2016-17 to
2019-20
Estimate
d cost
(Rs. in
lacs)
17.4 Percolation Tanks 0 0 0 0.00
17.5
Other ground water
recharge structure 0 0 0 0.00
17.6 Fishry Pond/Cattel Ponds 9 205 4 Year 17.21
Others 1 0 0 0.00
Sub Total 63 374 0 31.44
18
Water Harvesting
Structures ( to be
Renovated)
18.1
PMKSY Watershed
Farm Ponds 0 0 0 0.00
18.2 Check Dams 0 0 0 0.00
18.3 Nalla Bandhs 0 0 0 0.00
18.4 Percolation Tanks 0 0 0 0.00
18.5
Other ground water
recharge structure 0 0 0 0.00
18.6 Fishry Pond/Cattel Ponds 0 0 0 0.00
Others 0 0 0 0.00
Sub Total 0 0 0 0.00 18.7(
A) Land Development
i)
PMKSY Watershed
Afforestation 0 517 4 Year 43.47
ii) Horticulture 0 628 4 Year 52.78
iii) Agriculture 0 2621 4 Year 220.20
iv) Pasture 0 0 0 0.00
Sub Total 0 3767 316.44
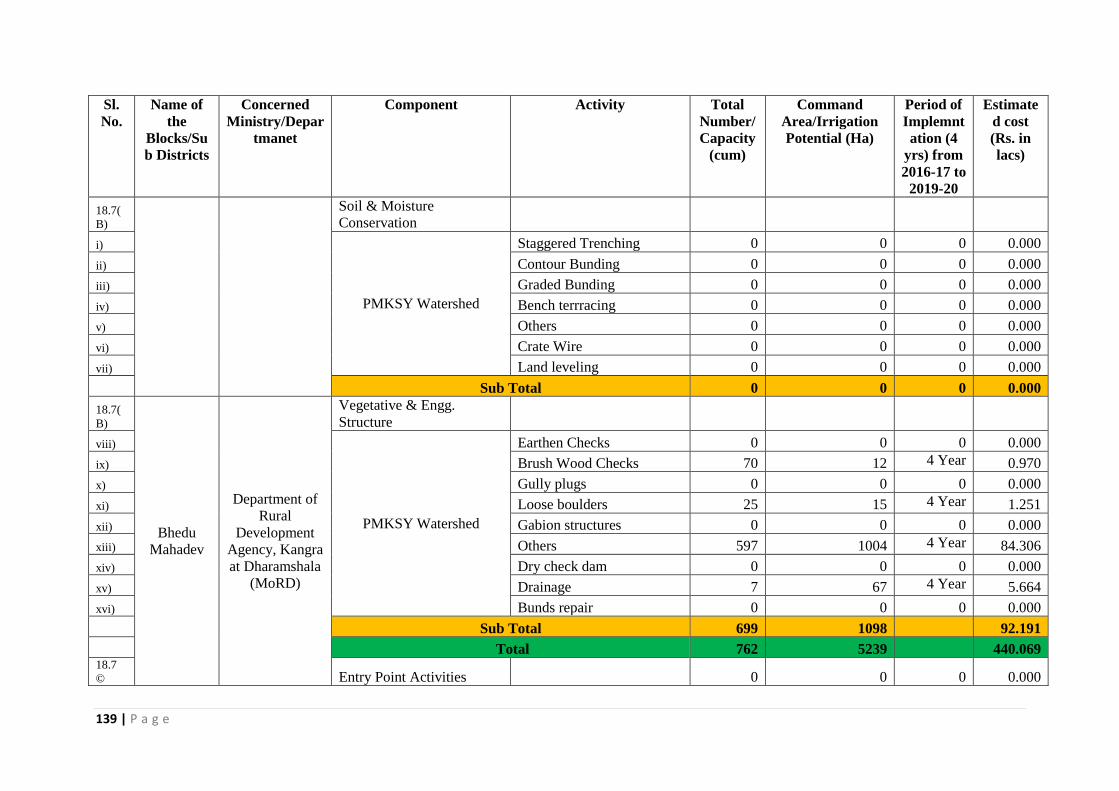
139 | P a g e
Sl.
No.
Name of
the
Blocks/Su
b Districts
Concerned
Ministry/Depar
tmanet
Component Activity Total
Number/
Capacity
(cum)
Command
Area/Irrigation
Potential (Ha)
Period of
Implemnt
ation (4
yrs) from
2016-17 to
2019-20
Estimate
d cost
(Rs. in
lacs)
18.7(
B)
Soil & Moisture
Conservation
i)
PMKSY Watershed
Staggered Trenching 0 0 0 0.000
ii) Contour Bunding 0 0 0 0.000
iii) Graded Bunding 0 0 0 0.000
iv) Bench terrracing 0 0 0 0.000
v) Others 0 0 0 0.000
vi) Crate Wire 0 0 0 0.000
vii) Land leveling 0 0 0 0.000
Sub Total 0 0 0 0.000
18.7(
B)
Bhedu
Mahadev
Department of
Rural
Development
Agency, Kangra
at Dharamshala
(MoRD)
Vegetative & Engg.
Structure
viii)
PMKSY Watershed
Earthen Checks 0 0 0 0.000
ix) Brush Wood Checks 70 12 4 Year 0.970
x) Gully plugs 0 0 0 0.000
xi) Loose boulders 25 15 4 Year 1.251
xii) Gabion structures 0 0 0 0.000
xiii) Others 597 1004 4 Year 84.306
xiv) Dry check dam 0 0 0 0.000
xv) Drainage 7 67 4 Year 5.664
xvi) Bunds repair 0 0 0 0.000
Sub Total 699 1098 92.191
Total 762 5239 440.069 18.7
© Entry Point Activities 0 0 0 0.000

140 | P a g e
Sl.
No.
Name of
the
Blocks/Su
b Districts
Concerned
Ministry/Depar
tmanet
Component Activity Total
Number/
Capacity
(cum)
Command
Area/Irrigation
Potential (Ha)
Period of
Implemnt
ation (4
yrs) from
2016-17 to
2019-20
Estimate
d cost
(Rs. in
lacs)
18.7(
D) DPR 0 0 0 0.000 18.7(
E) I & CB 62 0 4 Year
34.805 18.7(F
) Livelihood 196 0 4 Year
70.431 18.7(
G)
Prod. Sys. & Mirco Enter.
Activities-wise No.
Sericulutre 0 0 0 0.000
Bee Keeping 0 0 0 0.000
Poultry 0 0 0 0.000
Fishry 0 0 0 0.000
Bio fuel Plantation 0 0 0 0.000
Others 36 0 4 Year 78.717
Sub Total 36 0 78.717 18.7(
H) Monitoring 0 0 0 6.629 18.7(I
) Evaluation 0 0 0 5.800 18.7(J
) Consolidation 0 0 0 24.858 18.7(
K) Administration 0 0 0 70.431
Grand Total 1056 5239 731.740
17 Nagrota
Surian
Department of
Rural
Development
Agency, Kangra
Water Harvesting
Structures (Newly to be
created)
17.1 PMKSY Watershed Farm Ponds 0 0 0 0.000

141 | P a g e
Sl.
No.
Name of
the
Blocks/Su
b Districts
Concerned
Ministry/Depar
tmanet
Component Activity Total
Number/
Capacity
(cum)
Command
Area/Irrigation
Potential (Ha)
Period of
Implemnt
ation (4
yrs) from
2016-17 to
2019-20
Estimate
d cost
(Rs. in
lacs)
17.2 at Dharamshala
(MoRD) Check Dams 21 799 4 Year 67.074
17.3 Nalla Bandhs 0 0 0 0.000
17.4 Percolation Tanks 0 0 0 0.000
17.5
Other ground water
recharge structure 0 0 0 0.000
17.6 Fishry Pond/Cattel Ponds 0 0 0 0.000
Others 409 3072 4 Year 258.085
Sub Total 430 3871 325.159
18
Water Harvesting
Structures ( to be
Renovated)
18.1
PMKSY Watershed
Farm Ponds 0 0 0 0.000
18.2 Check Dams 0 0 0 0.000
18.3 Nalla Bandhs 0 0 0 0.000
18.4 Percolation Tanks 0 0 0 0.000
18.5
Other ground water
recharge structure 0 0 0 0.000
18.6 Fishry Pond/Cattel Ponds 0 0 0 0.000
Others 6 10 4 Year 0.827
Sub Total 6 10 0 0.827 18.7(
A) Land Development
i)
PMKSY Watershed
Afforestation 0 404 4 Year 33.931
ii) Horticulture 0 88 4 Year 7.407
iii) Agriculture 0 117 4 Year 9.816

142 | P a g e
Sl.
No.
Name of
the
Blocks/Su
b Districts
Concerned
Ministry/Depar
tmanet
Component Activity Total
Number/
Capacity
(cum)
Command
Area/Irrigation
Potential (Ha)
Period of
Implemnt
ation (4
yrs) from
2016-17 to
2019-20
Estimate
d cost
(Rs. in
lacs)
iv) Pasture 0 75 4 Year 6.293
Sub Total 0 684 57.447
18.7(
B)
Soil & Moisture
Conservation
i)
PMKSY Watershed
Staggered Trenching 50 31 4 Year 2.564
ii) Contour Bunding 0 0 0 0.000
iii) Graded Bunding 0 0 0 0.000
iv) Bench terrracing 0 0 0 0.000
v) Others 0 0 0 0.000
vi) Crate Wire 483 1283 4 Year 107.770
vii) Land leveling 0 0 0 0.000
Sub Total 533 1314 110.334
18.7(
B)
Nagrota
Surian
Department of
Rural
Development
Agency, Kangra
at Dharamshala
(MoRD)
Vegetative & Engg.
Structure
viii)
PMKSY Watershed
Earthen Checks 0 0 0 0.000
ix) Brush Wood Checks 207 141 4 Year 11.816
x) Gully plugs 0 0 0 0.000
xi) Loose boulders 137 246 4 Year 20.655
xii) Gabion structures 280 896 4 Year 75.269
xiii) Others 0 0 0 0.000
xiv) Dry check dam 0 0 0 0.000
xv) Drainage 40 142 4 Year 11.914
xvi) Bunds repair 0 0 0 0.000
Sub Total 664 1424 119.654

143 | P a g e
Sl.
No.
Name of
the
Blocks/Su
b Districts
Concerned
Ministry/Depar
tmanet
Component Activity Total
Number/
Capacity
(cum)
Command
Area/Irrigation
Potential (Ha)
Period of
Implemnt
ation (4
yrs) from
2016-17 to
2019-20
Estimate
d cost
(Rs. in
lacs)
Total 1633 7303 613.421 18.7
© Entry Point Activities 0 0 0 0.000 18.7(
D) DPR 0 0 0 0.000 18.7(
E) I & CB 86 0 4 Year
48.515 18.7(F
) Livelihood 272 0 4 Year
98.175 18.7(
G)
Prod. Sys. & Mirco Enter.
Activities-wise No.
Sericulutre 0 0 0 0.000
Bee Keeping 0 0 0 0.000
Poultry 0 0 0 0.000
Fishry 0 0 0 0.000
Bio fuel Plantation 0 0 0 0.000
Others 34 0 4 Year 109.725
Sub Total 34 0 109.725 18.7(
H) Monitoring 0 0 0 9.240 18.7(I
) Evaluation 0 0 0 8.085 18.7(J
) Consolidation 0 0 0 34.650 18.7(
K) Administration 0 0 0 98.175
Grand Total 2025 7303 1019.986
17 Fatehpur
Department of
Rural
Water Harvesting
Structures (Newly to be

144 | P a g e
Sl.
No.
Name of
the
Blocks/Su
b Districts
Concerned
Ministry/Depar
tmanet
Component Activity Total
Number/
Capacity
(cum)
Command
Area/Irrigation
Potential (Ha)
Period of
Implemnt
ation (4
yrs) from
2016-17 to
2019-20
Estimate
d cost
(Rs. in
lacs)
Development
Agency, Kangra
at Dharamshala
(MoRD)
created)
17.1
PMKSY Watershed
Farm Ponds 16 428 4 Year 35.924
17.2 Check Dams 11 288 4 Year 24.165
17.3 Nalla Bandhs 7 144 4 Year 12.090
17.4 Percolation Tanks 0 0 0 0.000
17.5
Other ground water
recharge structure 0 0 0 0.000
17.6 Fishry Pond/Cattel Ponds 0 0 0 0.000
Others 44 351 4 Year 29.510
Sub Total 78 1211 101.690
18
Water Harvesting
Structures ( to be
Renovated)
18.1
PMKSY Watershed
Farm Ponds 8 211 4 Year 17.759
18.2 Check Dams 4 17 4 Year 1.679
18.3 Nalla Bandhs 0 0 0 0.000
18.4 Percolation Tanks 0 0 0 0.000
18.5
Other ground water
recharge structure 0 0 0 0.000
18.6 Fishry Pond/Cattel Ponds 0 0 0 0.000
Others 3 4 4 Year 0.370
Sub Total 15 233 19.809 18.7(
A) Land Development
i) PMKSY Watershed Afforestation 0 43 4 Year 3.622

145 | P a g e
Sl.
No.
Name of
the
Blocks/Su
b Districts
Concerned
Ministry/Depar
tmanet
Component Activity Total
Number/
Capacity
(cum)
Command
Area/Irrigation
Potential (Ha)
Period of
Implemnt
ation (4
yrs) from
2016-17 to
2019-20
Estimate
d cost
(Rs. in
lacs)
ii) Horticulture 0 452 4 Year 37.964
iii) Agriculture 0 692 4 Year 58.092
iv) Pasture 0 101 4 Year 8.494
Sub Total 0 1288 108.172
18.7(
B)
Soil & Moisture
Conservation
i)
PMKSY Watershed
Staggered Trenching 0 0 0 0.000
ii) Contour Bunding 0 0 0 0.000
iii) Graded Bunding 138 103 4 Year 8.638
iv) Bench terrracing 129 51 4 Year 4.315
v) Others 0 0 0 0.000
vi) Crate Wire 0 0 0 0.000
vii) Land leveling 0 0 0 0.000
Sub Total 267 154 12.953
18.7(
B)
Fatehpur
Department of
Rural
Development
Agency, Kangra
at Dharamshala
(MoRD)
Vegetative & Engg.
Structure
viii)
PMKSY Watershed
Earthen Checks 0 0 0 0.000
ix) Brush Wood Checks 0 0 0 0.000
x) Gully plugs 4120 1052 4 Year 88.336
xi) Loose boulders 5 19 4 Year 1.585
xii) Gabion structures 65 1473 4 Year 123.697
xiii) Others 0 0 0 0.000
xiv) Dry check dam 0 0 0 0.000
xv) Drainage 0 0 0 0.000

146 | P a g e
Sl.
No.
Name of
the
Blocks/Su
b Districts
Concerned
Ministry/Depar
tmanet
Component Activity Total
Number/
Capacity
(cum)
Command
Area/Irrigation
Potential (Ha)
Period of
Implemnt
ation (4
yrs) from
2016-17 to
2019-20
Estimate
d cost
(Rs. in
lacs)
xvi) Bunds repair 0 0 0 0.000
Sub Total 4190 2543 213.618
Total 4550 5428 456.241 18.7
© Entry Point Activities 0 0 0 0.000 18.7(
D) DPR 0 0 0 0.000 18.7(
E) I & CB 76 0 4 Year
36.084 18.7(F
) Livelihood 202 0 4 Year
73.019 18.7(
G)
Prod. Sys. & Mirco Enter.
Activities-wise No.
Sericulutre 0 0 0 0.000
Bee Keeping 0 0 0 0.000
Poultry 0 0 0 0.000
Fishry 0 0 0 0.000
Bio fuel Plantation 0 0 0 0.000
Others 33 0 4 Year 81.610
Sub Total 33 0 0 81.610 18.7(
H) Monitoring 0 0 4 Year
6.872 18.7(I
) Evaluation 0 0 4 Year
6.013 18.7(J
) Consolidation 0 0 4 Year
25.772 18.7(
K) Administration 0 0 4 Year
73.019
Grand Total 4861 5428 758.631

147 | P a g e
Sl.
No.
Name of
the
Blocks/Su
b Districts
Concerned
Ministry/Depar
tmanet
Component Activity Total
Number/
Capacity
(cum)
Command
Area/Irrigation
Potential (Ha)
Period of
Implemnt
ation (4
yrs) from
2016-17 to
2019-20
Estimate
d cost
(Rs. in
lacs)
Grand Total DRDA 32139.49 94299.24 12595.55
19
Convergence with MGNREGA
Newly Created
19.1 Dehra
Department of Rural
Development Agency, Kangra at
Dharamshala (MoRD)
Water Conservation 182/8 403 4 Year 18 Pragpur
19.2 Indora
Water Harvesting 96/11 153 4 Year 16.4 Lambagaon
Rait
19.3 Bhedu
Mahadev
Creation of Irrigation canals & Drains 39/19km 234 4 Year 27.9 Bhawarna
Fatehpur
19.4 Nagrota Surian Providing Infrastructure for Irrigation 38 10 4 Year 5.3
19.5 Baijnath Land Development 0 43 4 Year 26.1
Sub Total 355/38 843 93.7
20
Department of Rural
Development Agency,
Kangra at Dharamshala (MoRD)
Renovation
20.1 Baijnath Renovation of water bodies including
desilting: 1 3 4 Year 3.8
20.2 Bhedu
Mahadev
Renovation & Maintenance of
Irrigation Canals & Drains 1 200 4 Year 6
Sub Total 2 203 9.8
Total 355/40 1046 103.5
21 State Planned Scheme of Irrigation
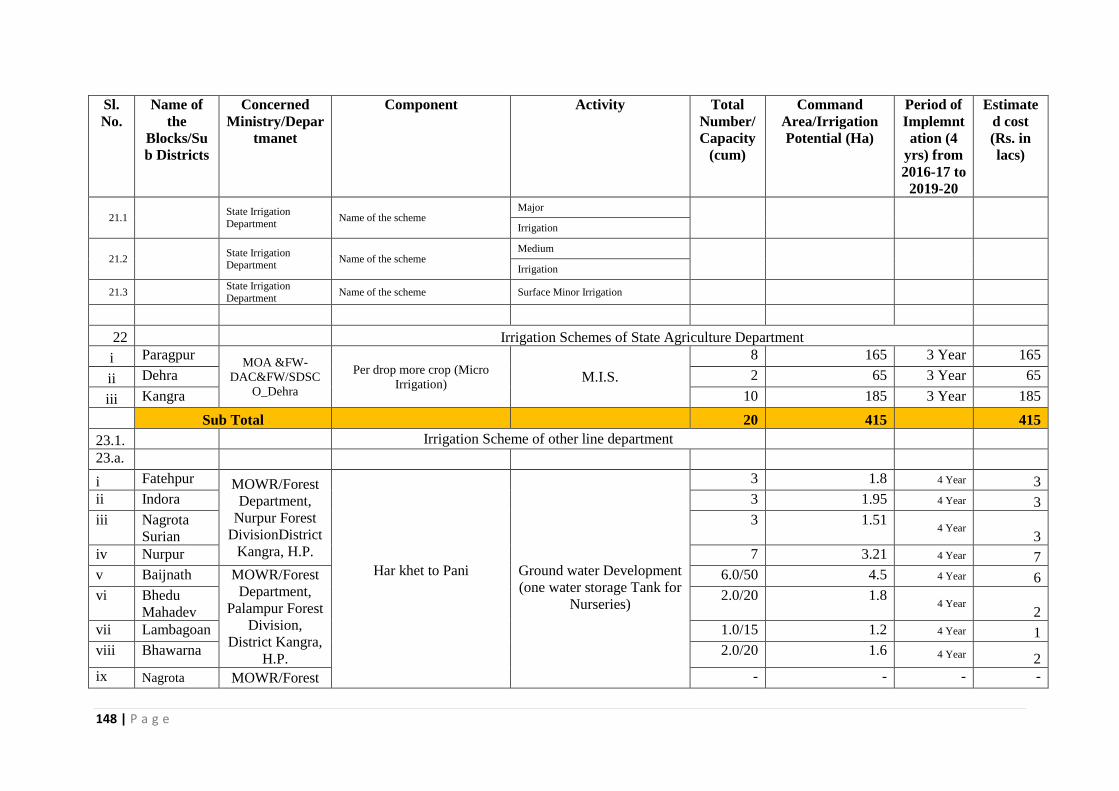
148 | P a g e
Sl.
No.
Name of
the
Blocks/Su
b Districts
Concerned
Ministry/Depar
tmanet
Component Activity Total
Number/
Capacity
(cum)
Command
Area/Irrigation
Potential (Ha)
Period of
Implemnt
ation (4
yrs) from
2016-17 to
2019-20
Estimate
d cost
(Rs. in
lacs)
21.1 State Irrigation
Department Name of the scheme
Major
Irrigation
21.2 State Irrigation Department
Name of the scheme Medium
Irrigation
21.3 State Irrigation
Department Name of the scheme Surface Minor Irrigation
22 Irrigation Schemes of State Agriculture Department
i Paragpur MOA &FW-
DAC&FW/SDSC
O_Dehra
Per drop more crop (Micro
Irrigation) M.I.S.
8 165 3 Year 165
ii Dehra 2 65 3 Year 65
iii Kangra 10 185 3 Year 185
Sub Total 20 415 415
23.1. Irrigation Scheme of other line department
23.a.
i Fatehpur MOWR/Forest
Department,
Nurpur Forest
DivisionDistrict
Kangra, H.P.
Har khet to Pani
Ground water Development
(one water storage Tank for
Nurseries)
3 1.8 4 Year 3
ii Indora 3 1.95 4 Year 3
iii Nagrota
Surian
3 1.51 4 Year
3
iv Nurpur 7 3.21 4 Year 7
v Baijnath MOWR/Forest
Department,
Palampur Forest
Division,
District Kangra,
H.P.
6.0/50 4.5 4 Year 6
vi Bhedu
Mahadev
2.0/20 1.8 4 Year
2
vii Lambagoan 1.0/15 1.2 4 Year 1
viii Bhawarna 2.0/20 1.6 4 Year 2
ix Nagrota MOWR/Forest - - - -

149 | P a g e
Sl.
No.
Name of
the
Blocks/Su
b Districts
Concerned
Ministry/Depar
tmanet
Component Activity Total
Number/
Capacity
(cum)
Command
Area/Irrigation
Potential (Ha)
Period of
Implemnt
ation (4
yrs) from
2016-17 to
2019-20
Estimate
d cost
(Rs. in
lacs)
Bagwan Department,
Dharamshala
Forest Division,
District Kangra,
H.P.
x Dharamshal
a - - - -
xi Kangra
- - - -
Sub Total 105 17.57 27
23.b. Newly created WHS 0
i Fatehpur DoLR-
MORD/Forest
Department,
Nurpur Forest
Division,
District Kangra,
H.P.
PMKSY Watershed Farm Pond
3 3 4 Year 4.5
ii Indora 3 3 4 Year 4.5
iii Nagrota
Surian
6 6 4 Year
9
iv Nurpur 3 3 4 Year
4.5
v Baijnath DoLR-
MORD/Forest
Department,
Palampur Forest
Division,
District Kangra,
H.P.
3./60 3 4 Year 4.5
vi Bhedu
Mahadev
6./120 3 4 Year
9
vii Lambagoan 3./60 6 4 Year 4.5
viii Bhawarna 3./60 3 4 Year
4.5
ix Nagrota
Bagwan DoLR-
MORD/Forest
Department,
Dharamshala
Forest Division,
District Kangra,
2 2 4 Year 2.25
x Dharamshal
a 2 2 4 Year
1.5
xi Kangra 6 7.5 4 Year
6.75

150 | P a g e
Sl.
No.
Name of
the
Blocks/Su
b Districts
Concerned
Ministry/Depar
tmanet
Component Activity Total
Number/
Capacity
(cum)
Command
Area/Irrigation
Potential (Ha)
Period of
Implemnt
ation (4
yrs) from
2016-17 to
2019-20
Estimate
d cost
(Rs. in
lacs)
H.P.
Sub Total: 25 41.5 55.5
23.c.
i Fatehpur DoLR-
MORD/Forest
Department,
Nurpur Forest
Division,
District Kangra,
H.P.
PMKSY Watershed Check Dams
80 4 4 Year 12
ii Indora 50 3 4 Year 7.5
iii Nagrota
Surian
120 6 4 Year
18
iv Nurpur 50 3 4 Year
2.5
v Baijnath DoLR-
MORD/Forest
Department,
Palampur Forest
Division,
District Kangra,
H.P.
80 4 4 Year 12
vi Bhedu
Mahadev
120 6 4 Year
18
vii Lambagoan 80 4 4 Year 12
viii Bhawarna 50 3 4 Year
2.5
ix Nagrota
Surian DoLR-
MORD/Forest
Department,
Dharamshala
Forest Division,
District Kangra,
H.P.
50 14 4 Year 12.5
x Dharamshal
a 45 14 4 Year
11.25
xi
Kangra 165 45 4 Year
41.25
Sub Total: 890 106 149.5
23.d.
i Fatehpur DoLR- 90 4 4 Year 13.5
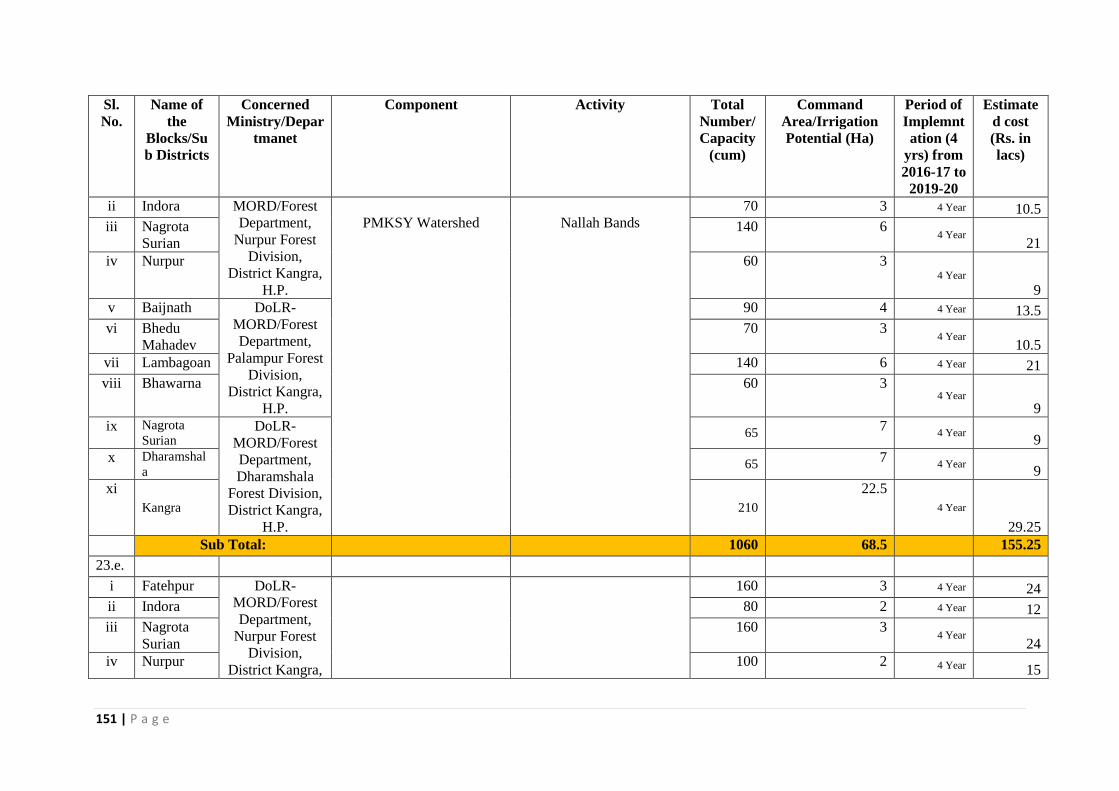
151 | P a g e
Sl.
No.
Name of
the
Blocks/Su
b Districts
Concerned
Ministry/Depar
tmanet
Component Activity Total
Number/
Capacity
(cum)
Command
Area/Irrigation
Potential (Ha)
Period of
Implemnt
ation (4
yrs) from
2016-17 to
2019-20
Estimate
d cost
(Rs. in
lacs)
ii Indora MORD/Forest
Department,
Nurpur Forest
Division,
District Kangra,
H.P.
PMKSY Watershed
Nallah Bands
70 3 4 Year 10.5
iii Nagrota
Surian
140 6 4 Year
21
iv Nurpur 60 3 4 Year
9
v Baijnath DoLR-
MORD/Forest
Department,
Palampur Forest
Division,
District Kangra,
H.P.
90 4 4 Year 13.5
vi Bhedu
Mahadev
70 3 4 Year
10.5
vii Lambagoan 140 6 4 Year 21
viii Bhawarna 60 3 4 Year
9
ix Nagrota
Surian DoLR-
MORD/Forest
Department,
Dharamshala
Forest Division,
District Kangra,
H.P.
65 7
4 Year 9
x Dharamshal
a 65
7 4 Year
9
xi
Kangra 210
22.5
4 Year
29.25
Sub Total: 1060 68.5 155.25
23.e.
i Fatehpur DoLR-
MORD/Forest
Department,
Nurpur Forest
Division,
District Kangra,
160 3 4 Year 24
ii Indora 80 2 4 Year 12
iii Nagrota
Surian
160 3 4 Year
24
iv Nurpur 100 2 4 Year 15

152 | P a g e
Sl.
No.
Name of
the
Blocks/Su
b Districts
Concerned
Ministry/Depar
tmanet
Component Activity Total
Number/
Capacity
(cum)
Command
Area/Irrigation
Potential (Ha)
Period of
Implemnt
ation (4
yrs) from
2016-17 to
2019-20
Estimate
d cost
(Rs. in
lacs)
H.P.
PMKSY Watershed
Percolation tanks/trenches v Baijnath DoLR-
MORD/Forest
Department,
Palampur Forest
Division,
District Kangra,
H.P.
80 3 4 Year 12
vi Bhedu
Mahadev
60 2 4 Year
9
vii Lambagoan 80 3 4 Year 12
viii Bhawarna 60 2 4 Year
9
ix Nagrota
Surian DoLR-
MORD/Forest
Department,
Dharamshala
Forest Division,
District Kangra,
H.P.
4 Year
0
x Dharamshal
a 100
5 4 Year
5
xi
Kangra 400
20
4 Year
20
Sub Total: 1280 45 142
23.f.
i Fatehpur DoLR-
MORD/Forest
Department,
Nurpur Forest
Division,
District Kangra,
H.P.
PMKSY Watershed
Other ground water
recharge
1 2 4 Year 1
ii Indora 1 2 4 Year 1
iii Nagrota
Surian
2 4 4 Year
2
iv Nurpur 1 2 4 Year
1
v Baijnath DoLR-
MORD/Forest
Department,
Palampur Forest
1 2 4 Year 1
vi Bhedu
Mahadev
1 2 4 Year
1
vii Lambagoan 2 4 4 Year 2

153 | P a g e
Sl.
No.
Name of
the
Blocks/Su
b Districts
Concerned
Ministry/Depar
tmanet
Component Activity Total
Number/
Capacity
(cum)
Command
Area/Irrigation
Potential (Ha)
Period of
Implemnt
ation (4
yrs) from
2016-17 to
2019-20
Estimate
d cost
(Rs. in
lacs)
viii Bhawarna Division,
District Kangra,
H.P.
1 2 4 Year
1
ix Nagrota
Surian DoLR-
MORD/Forest
Department,
Dharamshala
Forest Division,
District Kangra,
H.P.
2 7
4 Year 2
x Dharamshal
a 0
0 4 Year
0
xi
Kangra 3
9
4 Year
3
Sub Total: 15 36 15
23.g.
i Fatehpur DoLR-
MORD/Forest
Department,
Nurpur Forest
Division,
District Kangra,
H.P.
PMKSY Watershed Fishery ponds / water ponds
2 2 4 Year 1.6
ii Indora 1 1 4 Year 0.8
iii Nagrota
Surian
2 2 4 Year
1.6
iv Nurpur 1 1 4 Year
0.8
v Baijnath DoLR-
MORD/Forest
Department,
Palampur Forest
Division,
District Kangra,
H.P.
2 2 4 Year 1.6
vi Bhedu
Mahadev
1 1 4 Year
0.8
vii Lambagoan 2 2 4 Year 1.6
viii Bhawarna 1 1 4 Year
0.8
ix Nagrota
Surian DoLR- 0
0 4 Year
0

154 | P a g e
Sl.
No.
Name of
the
Blocks/Su
b Districts
Concerned
Ministry/Depar
tmanet
Component Activity Total
Number/
Capacity
(cum)
Command
Area/Irrigation
Potential (Ha)
Period of
Implemnt
ation (4
yrs) from
2016-17 to
2019-20
Estimate
d cost
(Rs. in
lacs)
x Dharamshal
a MORD/Forest
Department,
Dharamshala
Forest Division,
District Kangra,
H.P.
1 2
4 Year 3.3
xi
Kangra 4
8
4 Year
13
Sub Total: 17 22 25.9
23.h. Renovated WHS
i Fatehpur DoLR-
MORD/Forest
Department,
Nurpur Forest
Division,
District Kangra,
H.P.
PMKSY Watershed Check Dams
8 8 4 Year 0.8
ii Indora 4 4 4 Year 0.4
iii Nagrota
Surian
8 8 4 Year
0.8
iv Nurpur 4 4 4 Year
0.4
v Baijnath DoLR-
MORD/Forest
Department,
Palampur Forest
Division,
District Kangra,
H.P.
8 8 4 Year 0.8
vi Bhedu
Mahadev
4 4 4 Year
0.4
vii Lambagoan 8 8 4 Year 0.8
viii Bhawarna 4 4 4 Year
0.4
ix Nagrota
Surian DoLR-
MORD/Forest
Department,
Dharamshala
Forest Division,
District Kangra,
3 12
4 Year 3
x Dharamshal
a 1
4 4 Year
1
xi Kangra 6
18 4 Year
5

155 | P a g e
Sl.
No.
Name of
the
Blocks/Su
b Districts
Concerned
Ministry/Depar
tmanet
Component Activity Total
Number/
Capacity
(cum)
Command
Area/Irrigation
Potential (Ha)
Period of
Implemnt
ation (4
yrs) from
2016-17 to
2019-20
Estimate
d cost
(Rs. in
lacs)
H.P.
Sub Total: 58 82 13.8
23.i.
i Fatehpur DoLR-
MORD/Forest
Department,
Nurpur Forest
Division,
District Kangra,
H.P.
PMKSY Watershed Percolation tanks/trenches
10 5 4 Year 1
ii Indora 5 3 4 Year 0.5
iii Nagrota
Surian
10 5 4 Year
1
iv Nurpur 5 3 4 Year
0.5
v Baijnath DoLR-
MORD/Forest
Department,
Palampur Forest
Division,
District Kangra,
H.P.
10 5 4 Year 1
vi Bhedu
Mahadev
10 5 4 Year
1
vii Lambagoan 10 5 4 Year 1
viii Bhawarna 5 3 4 Year
0.5
ix Nagrota
Surian DoLR-
MORD/Forest
Department,
Dharamshala
Forest Division,
District Kangra,
H.P.
3 3
4 Year 0.15
x Dharamshal
a 5
2 4 Year
0.15
xi
Kangra 17
9
4 Year
0.95
Sub Total: 90 48 7.75

156 | P a g e
Sl.
No.
Name of
the
Blocks/Su
b Districts
Concerned
Ministry/Depar
tmanet
Component Activity Total
Number/
Capacity
(cum)
Command
Area/Irrigation
Potential (Ha)
Period of
Implemnt
ation (4
yrs) from
2016-17 to
2019-20
Estimate
d cost
(Rs. in
lacs)
23.j.
i Fatehpur DoLR-
MORD/Forest
Department,
Nurpur Forest
Division,
District Kangra,
H.P.
PMKSY Watershed Other ground water
recharge
1 2 4 Year 0.4
ii Indora 1 2 4 Year 0.4
iii Nagrota
Surian
2 4 4 Year
0.8
iv Nurpur 1 2 4 Year
0.4
v Baijnath DoLR-
MORD/Forest
Department,
Palampur Forest
Division,
District Kangra,
H.P.
1 2 4 Year 0.4
vi Bhedu
Mahadev
2 4 4 Year
0.8
vii Lambagoan 2 4 4 Year 0.8
viii Bhawarna 1 2 4 Year
0.4
ix Nagrota
Surian DoLR-
MORD/Forest
Department,
Dharamshala
Forest Division,
District Kangra,
H.P.
1 2
4 Year 0.35
x Dharamshal
a 2
3 4 Year
0.65
xi
Kangra 5
8.5
4 Year
1.7
Sub Total: 19 35.5 7.1
Total (Department of Forest) 3559 502.07 598.80
23.2. Extension Activity
i Baijnath
4 Year 30.72
ii Bhawarna 4 Year 31.33

157 | P a g e
Sl.
No.
Name of
the
Blocks/Su
b Districts
Concerned
Ministry/Depar
tmanet
Component Activity Total
Number/
Capacity
(cum)
Command
Area/Irrigation
Potential (Ha)
Period of
Implemnt
ation (4
yrs) from
2016-17 to
2019-20
Estimate
d cost
(Rs. in
lacs)
iii Dehra
Gopipur
Department of
Agriculture
(ATMA)
PMKSY Extension Activity
4 Year
30.34
iv Fatehpur 4 Year 12.94
v Indora 4 Year 0.88
vi Kangra 4 Year 6.49
vii Lambagao
n 4 Year
13.94
viii Nagrota
bagwan 4 Year
10.17
ix Nagrota
Surian 4 Year
11.75
x Nurpur 4 Year 0.74
xi Panchrukh
i 4 Year
19.94
xii Pragpur 4 Year 5.79
xiii Rait 4 Year 5.96
xiv
BheduMa
hadev 4 Year
20.59
xiv
Dharamsh
ala 4 Year
15.43
Sub Total: 217.00
24 Externally aided projects
Name of the scheme
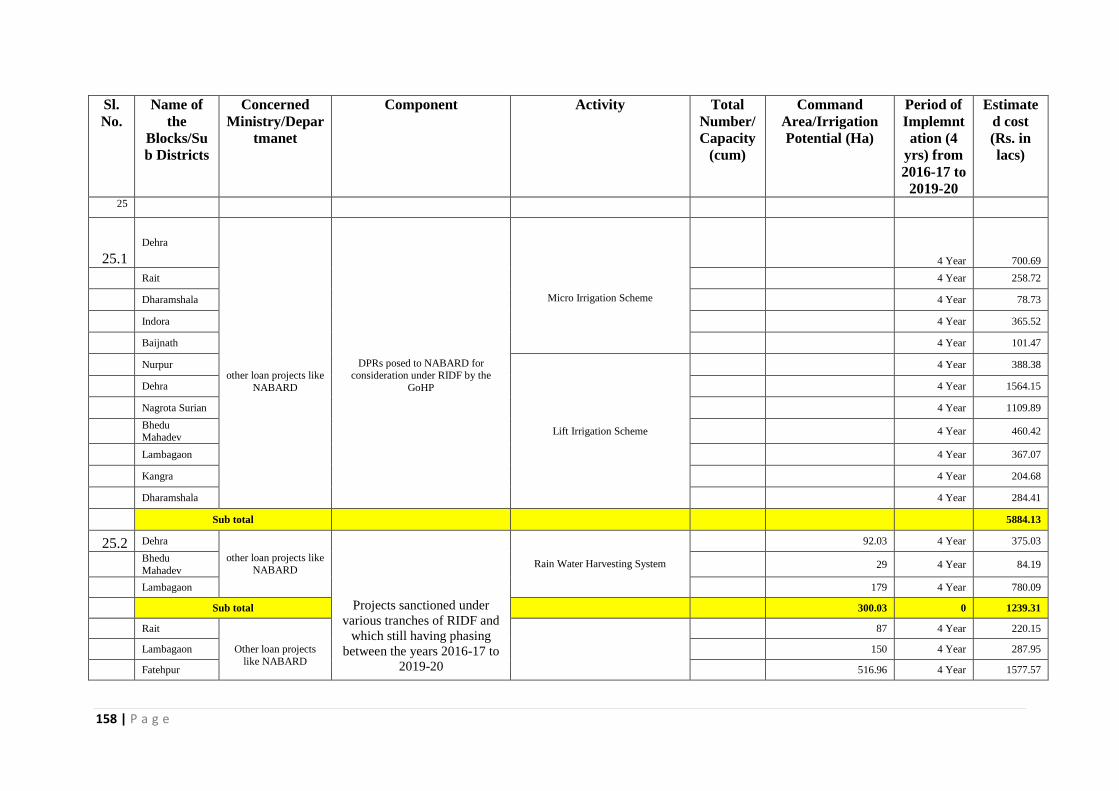
158 | P a g e
Sl.
No.
Name of
the
Blocks/Su
b Districts
Concerned
Ministry/Depar
tmanet
Component Activity Total
Number/
Capacity
(cum)
Command
Area/Irrigation
Potential (Ha)
Period of
Implemnt
ation (4
yrs) from
2016-17 to
2019-20
Estimate
d cost
(Rs. in
lacs)
25
25.1
Dehra
other loan projects like
NABARD
DPRs posed to NABARD for consideration under RIDF by the
GoHP
Micro Irrigation Scheme
4 Year
700.69
Rait 4 Year 258.72
Dharamshala 4 Year 78.73
Indora 4 Year 365.52
Baijnath 4 Year 101.47
Nurpur
Lift Irrigation Scheme
4 Year 388.38
Dehra 4 Year 1564.15
Nagrota Surian 4 Year 1109.89
Bhedu Mahadev
4 Year 460.42
Lambagaon 4 Year 367.07
Kangra 4 Year 204.68
Dharamshala 4 Year 284.41
Sub total 5884.13
25.2 Dehra
other loan projects like
NABARD
Projects sanctioned under
various tranches of RIDF and
which still having phasing
between the years 2016-17 to
2019-20
Rain Water Harvesting System
92.03 4 Year 375.03
Bhedu
Mahadev 29 4 Year 84.19
Lambagaon 179 4 Year 780.09
Sub total 300.03 0 1239.31
Rait
Other loan projects
like NABARD
87 4 Year 220.15
Lambagaon 150 4 Year 287.95
Fatehpur 516.96 4 Year 1577.57

159 | P a g e
Sl.
No.
Name of
the
Blocks/Su
b Districts
Concerned
Ministry/Depar
tmanet
Component Activity Total
Number/
Capacity
(cum)
Command
Area/Irrigation
Potential (Ha)
Period of
Implemnt
ation (4
yrs) from
2016-17 to
2019-20
Estimate
d cost
(Rs. in
lacs)
Indora
Lift Irrigation Scheme
347.25 4 Year 1018.95
Nagrota Surian 1383.54 4 Year 1929.81
Dharamshala 482 4 Year 544.82
Dehra 30.62 4 Year 119.03
Bhedu
Mahadev 385.4 4 Year 264.9
Nurpur 615.02 4 Year 1847.63
Sub total 3997.79 7810.81
Total 4297.82 14934.25

160 | P a g e
Annexure
MLA Priority Schemes, Department of I&PH, Dharamshala
Sr No Block/ Constituency Name of Scheme Estimated
Cost ( Rs in
Lacs)
CCA (Ha) Year of
Priority
1 Dehra C/O LIS from River Beas in G.P.Silh, Dareen, Luthan,
Gurkal, Jakhota, Adhwani, Dhanot, Ghalloura & Sehorpain
under Tehsil Jawalamukhi.
19700 2590 2014-15
2 Nagrota Construction of FIS Rod Kuhal in GP Rajiana in Tehsil &
District Kangra (HP)
155.48 88.34 2011-12
3 Nagrota Construction of FIS Machhan Di Kuhal to village Rasth
Machhan Tikkari , Usthagran & village Tangoriti in GP Tang
in Tehsil Dharamshala District Kangra (HP)
210.53 170 2013-14
4 Nagrota Construction of FIS Pathiar Ambari Kuhal in Tehsil
Dharamshala District Kangra (HP)
179.9 174 2013-14
5 Dharamshala Construction of Machhul Kuhl in Tehsil Dharamshala
District Kangra (HP)
95.74 142 2013-14
6 Dharamshala C/O FIS Charan Ki Kuhl from Charan Khad in Tehsil
Dharamshala District Kangra (HP)
37.26 15 2015-16
7 Dharamshala C/O FIS Dudhli from Majhi Khad in Tehsil Dharamshala
District Kangra (HP)
59.88 25 2015-16
8 Dharamshala C/O FIS Lower Sukkar Kuhl from Manooni Khad in Tehsil
Dharamshala District Kangra (HP)
53.62 30.36 2014-15

161 | P a g e
9 Dharamshala C/O FIS Jheol Rashwala Kuhl from Noud khad in G. P.
Jheol in Tehsil Dharamshala
73.9 30 2014-15
10 Dharamshala C/O FIS Sudher Kuhl from Banoi khad in Tehsil
Dharamshala
71.82 42 2014-15
11 Nagrota C/O Flow Irrigation Scheme Rainki Kuhl in G.P. Pathiar 545.08 257 2011-12
12 D/Shala C/O FIS Fatt and Dhani Di Kuhl in GP Pathar in Tehsil
Dharamshala
108.45 43.78 2012-13
13 Rait C/O FIS Dhamul Kuhal in Tehsil Shahpur District Kangra 225.29 138.46 2014-15
14 Nagrota C/O FIS Badul Kuhl in GP Chahri, Ambari and Chamba in
Tehsil Bagwan Nagorta
233.4 198 2014-15
15 Nagrota C/O FIS Kohla in GP Mundla Tehsil Bagwan Nagorta 37.46 15 2014-15
16 Baijnath/Panchrukhi C/O FIS Chadruhl Kuhl for Irrigation Facility to village
Rajot, Rakkar, Jandpur Nagra Saggoor etc. in Tehsil Bainath
District Kangra (HP)
789.29 776 2013-14
17 Panchrukhi C/O FIS Neuhal in GP Bhagrwana , Biara and Agojar in
Tehsil Palampur District Kangra (HP).
251.11 162.1 2010-11
18 Panchrukhi C/O FIS Garuhal GP Banuri Holta Banuri Khas and
Vandbihar in Tehsil Palampur District Kangra (HP).
227.2 92.19 2012-13
19 Bhawarna C/O FIS Rani Di Kuhl in Tehsil Palampur District Kangra
(HP).
289.93 220 2011-12
20 Bhawarna C/O FIS Mang Kuhl in Tehsil Palampur District Kangra
(HP).
287.3 210 2011-12
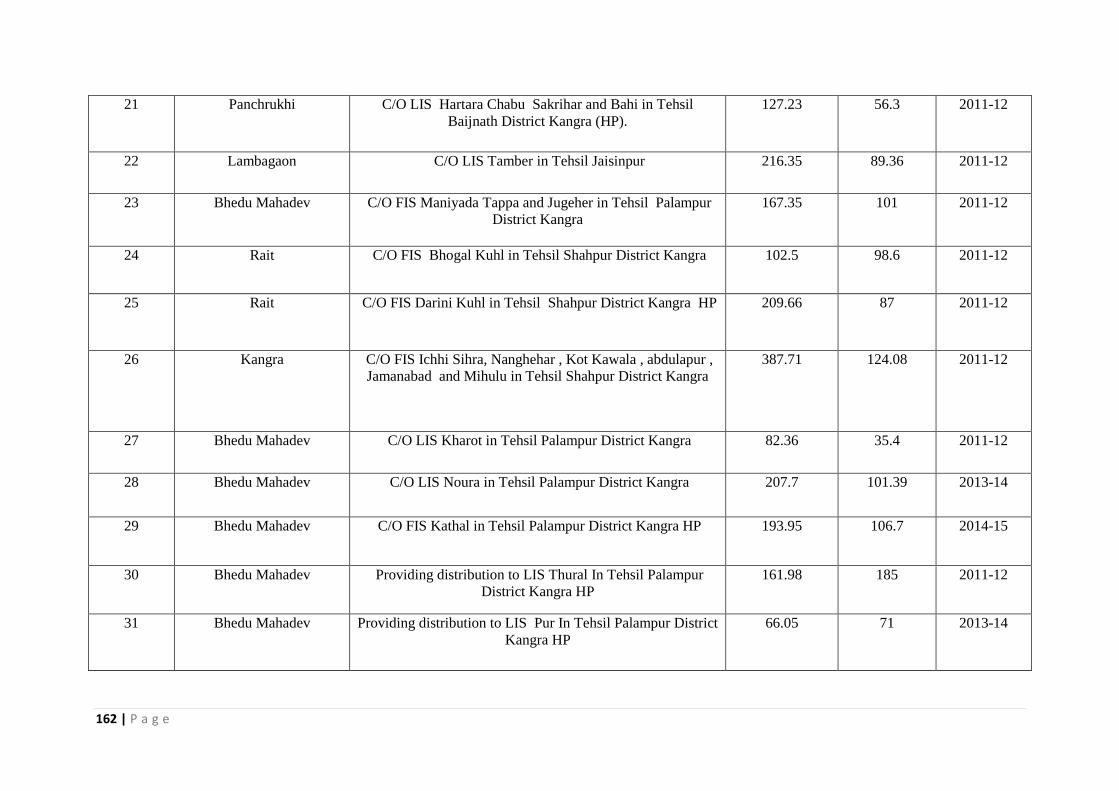
162 | P a g e
21 Panchrukhi C/O LIS Hartara Chabu Sakrihar and Bahi in Tehsil
Baijnath District Kangra (HP).
127.23 56.3 2011-12
22 Lambagaon C/O LIS Tamber in Tehsil Jaisinpur 216.35 89.36 2011-12
23 Bhedu Mahadev C/O FIS Maniyada Tappa and Jugeher in Tehsil Palampur
District Kangra
167.35 101 2011-12
24 Rait C/O FIS Bhogal Kuhl in Tehsil Shahpur District Kangra 102.5 98.6 2011-12
25 Rait C/O FIS Darini Kuhl in Tehsil Shahpur District Kangra HP 209.66 87 2011-12
26 Kangra C/O FIS Ichhi Sihra, Nanghehar , Kot Kawala , abdulapur ,
Jamanabad and Mihulu in Tehsil Shahpur District Kangra
387.71 124.08 2011-12
27 Bhedu Mahadev C/O LIS Kharot in Tehsil Palampur District Kangra 82.36 35.4 2011-12
28 Bhedu Mahadev C/O LIS Noura in Tehsil Palampur District Kangra 207.7 101.39 2013-14
29 Bhedu Mahadev C/O FIS Kathal in Tehsil Palampur District Kangra HP 193.95 106.7 2014-15
30 Bhedu Mahadev Providing distribution to LIS Thural In Tehsil Palampur
District Kangra HP
161.98 185 2011-12
31 Bhedu Mahadev Providing distribution to LIS Pur In Tehsil Palampur District
Kangra HP
66.05 71 2013-14

163 | P a g e
32 Lambagaon C/O LIS Jagroop Nagar in Tehsil Jaisinpur District Kangra 241.68 103 2013-14
33 Bhedu Mahadev C/O LIS Sakoh Lieunda in Tehsil Jaisinpur District Kangra 208.42 92.78 2013-14
34 Bhedu Mahadev C/O FIS Book Kuhl in Tehsil alampur District Kangra 147.11 62 2013-14
35 Bhedu Mahadev C/O FIS Har liunhni from Dhamkhal in Tehsil Palampur
District Kangra
56.75 24.44 2013-14
36 Bhedu Mahadev C/O LIS Ghur Malehar Bathan in Tehsil Palampur District
Kangra
210.14 77.09 2013-14
37 Lambagaon C/O LIS Sugre Da bag in Tehsil Jaisinpur District Kangra
HP
73.32 30 2013-14
38 Nagrota C/O FIS Lahad and Balla Kuhl in GP Serathana Tehsil
Bagwana Nagorta District Kangra (HP)
111.36 45 2013-14
39 Bhedu Mahadev C/O Lis Garh from Moul Khad in Tehsil palampur District
Kangra (HP)
511.75 220.35 2013-14
40 Lambagaon C/O LIS Khalta in Tehsil Jaisinpur District Kangra 76.94 35.25 2013-14
41 Bhedu Mahadev C/O LIS Ghrthoon in Tehsil palampur District Kangra HP 51.93 22.09 2013-14
42 Sullah C/O FIS Makdul Kuhal in Tehsil Palampur District Kangra
HP
193.68 114 2013-14

164 | P a g e
43 Pragpur C/O LIS Jole Patola and Sakuhi in Tehsil Jaswan District
Kangra (H.P)
118.01 60.4 2015-16
44 Pragpur C/O LIS to village Jatoli & Kurial Khera in Tehsil Rakkar
District Kangra (H.P)
267 250.62 2014-15
45 Dehra Imp.of LIS Gathutar in Tehsil Dehra District Kangra (H.P) 115 264.23 2013-14
46 Pragpur Imp.of LIS Naleti in G.P.Naleti Tehsil Dehra District
Kangra.
64.76 54.08 2014-15
47 Dehra Imp. of LIS Silh in Tehsil Jawalamukhi District Kangra. 113.31 244.44 2015-16
48 Dehra Aug. and Extn. of LIS Kuru Dehra in Tehsil Dehra District
Kangra.
100 429.11 2010-11
49 Dehra LIS Kundli Har. 133 276.08 2013-14
50 Rait C/o FIS Raj Kuhl in Tehsil Shahpur District Kangra (HP). 98.70 58.94 2010-11
51 Rait C/o FIS Baddi Kuhl in Tehsil Shahpur District Kangra
(HP).
135.18 77.40 2013-14
52 Kangra C/o FIS Dehrian Kohala Sanouran and Mandal &
Masherer in Tehsil & District Kangra (HP).
373.37 187.81 2013-14
53 Bhawarna C/o FIS Dharam Dei to Dharda and its adjoining village
from Dharam Dei Khad in Tehsil Palampur District Kangra
(HP).
63.85 41.31 2014-15
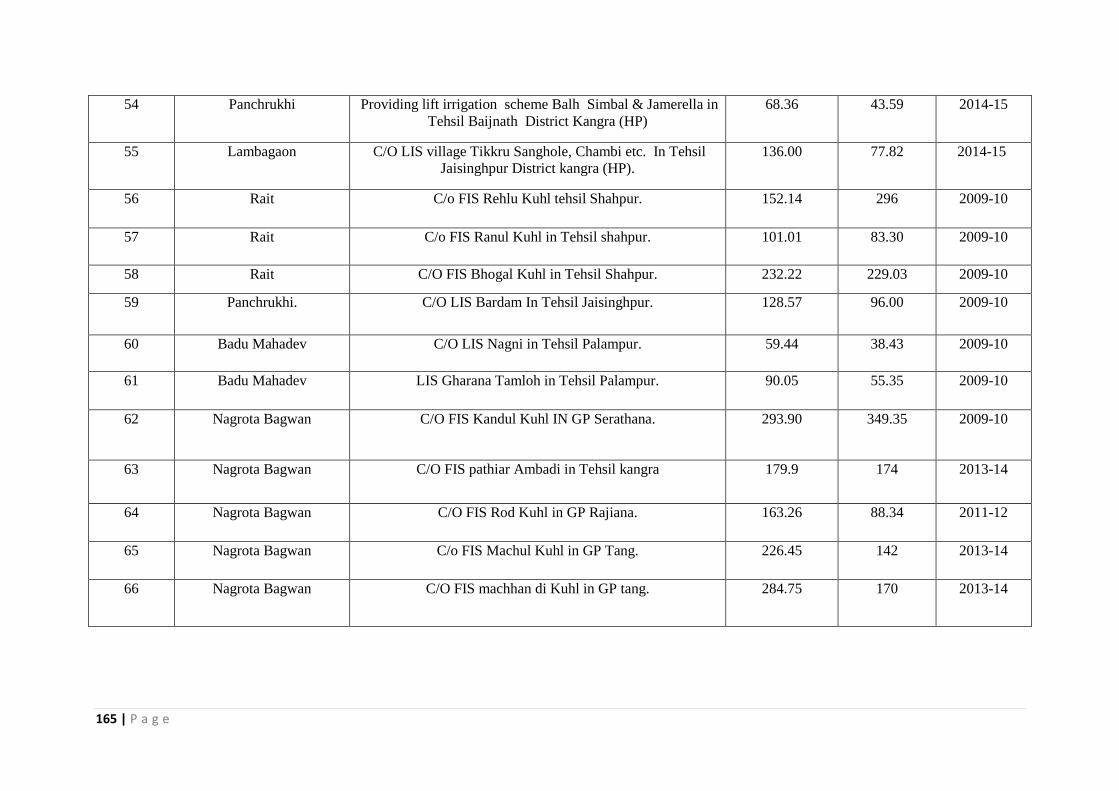
165 | P a g e
54 Panchrukhi Providing lift irrigation scheme Balh Simbal & Jamerella in
Tehsil Baijnath District Kangra (HP)
68.36 43.59 2014-15
55 Lambagaon C/O LIS village Tikkru Sanghole, Chambi etc. In Tehsil
Jaisinghpur District kangra (HP).
136.00 77.82 2014-15
56 Rait C/o FIS Rehlu Kuhl tehsil Shahpur. 152.14 296 2009-10
57 Rait C/o FIS Ranul Kuhl in Tehsil shahpur. 101.01 83.30 2009-10
58 Rait C/O FIS Bhogal Kuhl in Tehsil Shahpur. 232.22 229.03 2009-10
59 Panchrukhi. C/O LIS Bardam In Tehsil Jaisinghpur. 128.57 96.00 2009-10
60 Badu Mahadev C/O LIS Nagni in Tehsil Palampur. 59.44 38.43 2009-10
61 Badu Mahadev LIS Gharana Tamloh in Tehsil Palampur. 90.05 55.35 2009-10
62 Nagrota Bagwan C/O FIS Kandul Kuhl IN GP Serathana. 293.90 349.35 2009-10
63 Nagrota Bagwan C/O FIS pathiar Ambadi in Tehsil kangra 179.9 174 2013-14
64 Nagrota Bagwan C/O FIS Rod Kuhl in GP Rajiana. 163.26 88.34 2011-12
65 Nagrota Bagwan C/o FIS Machul Kuhl in GP Tang. 226.45 142 2013-14
66 Nagrota Bagwan C/O FIS machhan di Kuhl in GP tang. 284.75 170 2013-14
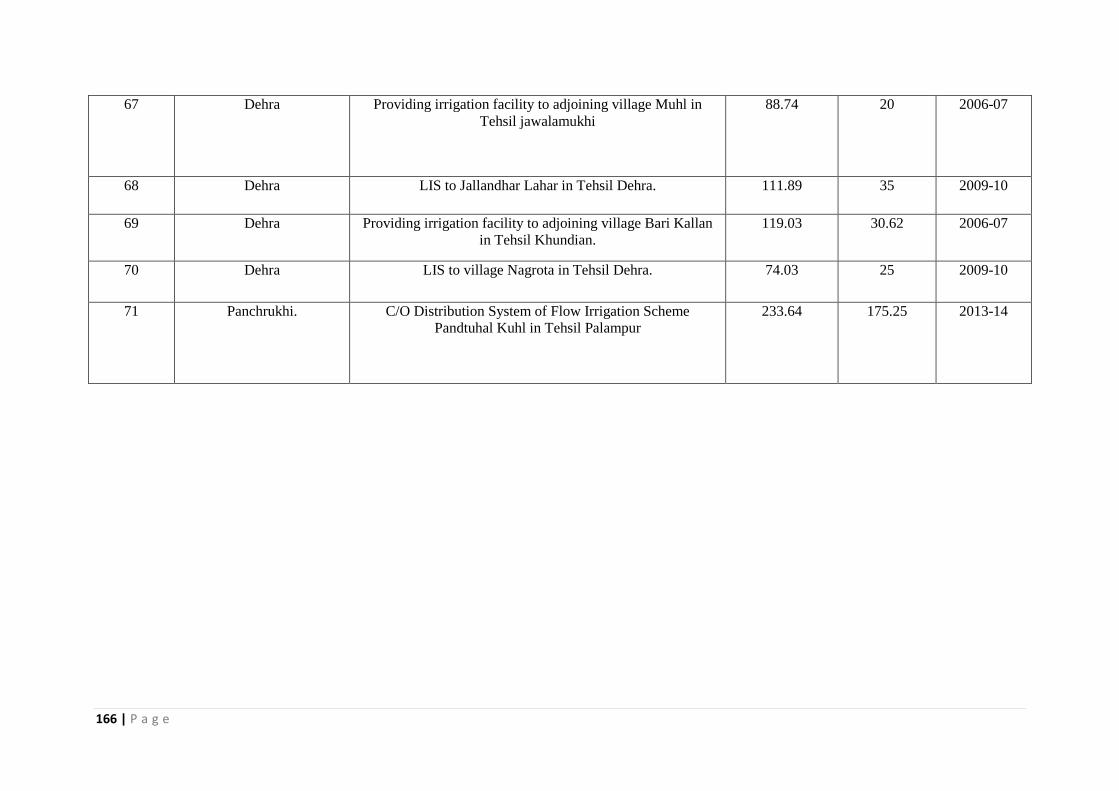
166 | P a g e
67 Dehra Providing irrigation facility to adjoining village Muhl in
Tehsil jawalamukhi
88.74 20 2006-07
68 Dehra LIS to Jallandhar Lahar in Tehsil Dehra. 111.89 35 2009-10
69 Dehra Providing irrigation facility to adjoining village Bari Kallan
in Tehsil Khundian.
119.03 30.62 2006-07
70 Dehra LIS to village Nagrota in Tehsil Dehra. 74.03 25 2009-10
71 Panchrukhi. C/O Distribution System of Flow Irrigation Scheme
Pandtuhal Kuhl in Tehsil Palampur
233.64 175.25 2013-14

167 | P a g e
MLA Priority Schemes, Department of I&PH, Nurpur
Sr.
No.
Name of
block
Name of scheme CCA Cost of scheme Year of
priority
Name of
Constituency
Irrigation schemes & FPW
1 Indora C/O 5 Nos. leftout T/well in Gangath constituency. i.e. T/well Lakhanpur, Lodhwan-IV, Bari
Khad, Bhadroya and Gagwal.
28.27 299.90 2007-08 Indora
2 Indora Model Study of Chhounchh khad in Tehsil Indora - - 2007-08 Indora
3 Indora Installation of new T/well No. 11,12,27,44 & 69 187.50 69.42 2008-09 Indora
4 Indora Re-Drilling of Tube well No. 23, 37 & 39 in Tehsil Indora. 81.40 68.77 2008-09 Indora
5 Indora FPW to save village Milwan in Tehsil Indora. 100.00 115.81 2008-09 Indora
6 Indora C/O 11 Nos. T/wells in Gangath area. 248.73 617.73 2009-10 Indora
7 Indora C/O T/well at Naya Charor Dagla, Balkhor Mangwal, Tajwan Bharlard, Behalpur Tappa - - 2009-10 Indora
8 Indora Re-construction of T/well No. 16, 64, 89, 66 and 18 173.6 222.99 2009-10 Indora
9 Indora C/O LIS Pantjiya, Bhapoo-II, Naswal, Chochar Baleer, Majra-II and Kharad in Tehsil Indora
Distt. Kangra HP
87.07 333.68 2010-11 Indora
10 Indora C/O LIS Balkhore Stage-II - - 2010-11 Indora
11 Indora Renovation of LIS Chuharpur and Kursan in Tehsil Indora Distt. Kangra HP. 105.29 365.52 2011-12 Indora
12 Indora C/O LIS Bain Indorian (GP Kathgarh) in Tehsil Indora Distt. Kangra HP. - - 2011-12 Indora
13 Indora Construction of 15 Nos. Tube well in Gangath area in Tehsil Indora Distt. Kangra 348.22 1018.95 2012-13 Indora
14 Indora Channelization of Chhounchh khad in Tehsil Indora Distt. Kangra HP. 1740.30 17959.00 2012-13 Indora

168 | P a g e
15 Indora Re-Construction of LIS Chuharpur Kursain in Tehsil Indora Distt. Kangra HP. 105.29 48.07 2013-14 Indora
16 Indora Re-Construction of LIS Balkhore in Tehsil Indora Distt. Kangra HP. - - 2013-14 Indora
17 Indora Remodeling of LIS Gadwal in Tehsil Nurpur Distt. Kangra HP 21.81 45.00 2014-15 Indora
18 Indora Remodeling of Tube well No. 11, 13, 14, 28, 38, 49, 53, 54, 58 and T/well Jindrai in Tehsil
Indora Distt. Kangra HP
- - 2014-15 Indora
19 Indora Providing Irrigation facility to Anoh area of Indora Consty., in Tehsil Indora Distt. Kangra - - 2015-16 Indora
20 Indora Remodeling of old Tube well No. 11, 13, 14, 28, 38, 49, 53, 54, 58 and T/well Jindrai in Tehsil
Indora Distt. Kangra HP
388.95 687.81 2015-16 Indora
21 Fatehpur Extension and Replacement of old Pumping machinery of LIS Sathana 85.00 53.75 2011-12 Fatehpur
22 Fatehpur C/O Flood protection measures of Beas River from Pong Dam Head works in Tehsil Fatehpur
Distt. Kangra HP.
- - 2013-14 Fatehpur
23 Fatehpur C/O 45 Nos. T/well in Fatehpur area 648.73 2470.51 2008-09 Fatehpur
24 Fatehpur Improvement/extention of various T/wells in Jawali (Fatehpur) constituency. 383.30 391.62 2009-10 Fatehpur
25
Fatehpur
Re-Drlling/ imp. of 9 No T/well(Fatehpur area)
245.03 578.50 2010-11 Fatehpur
26 Fatehpur C/O 12 Nos T/Well in Fatehpur area in Distt. Kandra (HP). 271.93 971.16 2013-14 Fatehpur
27 Fatehpur Aug., /Improvement of LIS Beli in Tehsil Fatehpur Distt. Kangra HP. 48.07 102.69 2015-16 Fatehpur

169 | P a g e
28
Fatehpur
C/O T/Well Nerna, Golwan & Mangdial
44.52 220.00 2015-16 Fatehpur
29 Nurpur
C/O 8 Nos. T/Well in Nurpur area 168.00 407.77
2006-07
Priority 1st Nurpur
30 Nurpur
Imp. of source and distribution system Suliali 210.33 94.39
2007-08
Priority 2nd Nurpur
31 Nurpur/
Fatehpur
C/O 10 Nos. T/Wells in Nurpur Area. 281.00 550.54 2008-09
Nurpur/
Fatehpur
32 Nurpur
C/O LIS Hadal Kapahri from Chakki Khad 56.61 130.94
2008-09
Priority 2nd Nurpur
33 Nurpur C/O Medium Irrigation Scheme Phina Singh 4025 2004.51 2008-09 Nurpur
34 Nurpur
Prov. LIS Rit Upperli & Rit Jhikli in Nurpur tehsil. 134.12 200.32
2009-10
Priority 2nd Nurpur
35 Nurpur
Improvement & augmentation of LIS Khanni in tehsil Nurpur. 73.43 99.77 2011-12 Nurpur
36 Nurpur LIS Bassa Waziran 52.20 156.60 2012-13 Nurpur
37 Nurpur
Re- drilling T/W Bassa Baziran 15.50 59.07
2012-13 2nd
Priority Nurpur
38 Nurpur C/O 21 Nos. T/Well in Nurpur area. 384.91 1614.13 2013-14 Nurpur
39 Nurpur Aug. of LIS Bhadwar inTehsil Nurpur. 180 388.38 2014-15 Nurpur
40 Nurpur
C/O LIS Kamnala Bhaleta and Panjahra from Greli Khad 55.00 165.00
2014-15
Priority 2nd Nurpur
41 Nurpur C/o LIS Aund, Surali and karsan in Tehsil Nurpur 134.55 643.97 2015-16 Nurpur
42 Nurpur
Re- Construction of different LIS in Nurpur Constituency 333.25 999.75
2015-16
Priority 2nd Nurpur
43 N/Surian Remodeling & Ext. of LIS Kuther 40.95 37.73 2009-10 Jawali
44 Jawali
Imp. of source LIS Jangal 163.53 31.09
2009-10
Priority 2nd Jawali
45 Nagrota
Surian
C/O 15 Nos. T/wells in Guler area. (Now Jawali area)(C/O 11 No T/Well as feasible site)
(Priority repeated for the year 2013-14)
172.24 731.21 2009-10 Jawali
46 Nagrota
Surian
Remodelling of LIS Ghar Jarot under IPH Sub Division Nagrota Surian 173.00 279.14 2010-11 Jawali
47 Fatehpur C/O 10 Nos T/Well in Bharmar Gurial area in Jawali Consty. -- -- 2010-11 Jawali

170 | P a g e
48 Nagrota
Surian
Survey and Investigation Medium Irrigation Project Sukha Har (From Gaj and Baner Khad) 2186.00 153.06 2012-13 Jawali
49 Fatehpur/
Jawali
Imp. & Ext. of T/Wells Bhaloon, Jaiser -73, Jaiser - 1st, Banara, Chalwara (Khilroo), Butt,
Kardial (59), Maira, Bhol-II, Souhra, Samkehar, Papahan, Kharota, Paloura, Nargala, Thanger -
II, Chalwara - II, Bhanai, Tihal, Sugal, Bhagwal, Dhasoli, Bharmar-2nd & Kala Nal under Jawali
Consty.
645.50 685.66 2013-14 Jawali
50 Fatehpur C/O 15 Nos Tubewell in Bharmar and its adjoing area. 244.00 1013.52 2014-15 Jawali
51 N/Surian
LIS Bari Bhaniari 50.35 169.78
2013-14
Priority 2nd Jawali
52 N/Surian LIS Bagga 84.00 214.00 2014-15 Jawali
53 Jawali C/O LIS Phalian Rajol Upper Anuhi & salan 48.91 161.41 2015-16 Jawali
Note: The Detailed Project Report (DPR) for the schemes under Sl.No. 2, 7, 10, 12, 16, 18, 19, 22 and 47 has not been prepared yet but
since the schemes has been prioritize under MLA Priority Schmes in the given constituency, hence included under DIP for
consideration.

171 | P a g e
List of Projects
Pradhan Mantri Krishi Sinchayee Yojana (PMKSY)
Sr. No. Project /Schemes AIBP Har Khet ko Pani (CAD)
Amount (Rs. In lac)
CCA (hact.) Amount (Rs. In lac) CCA (ha)
1 2 3 4 5 6 1 Phina Singh Medium Irrigation Project in Tehsil Nurpur
(Kangra) (H.P.) 20451.00 4025 4173.00 4025
2 Sidatha Medium Irrigation Project in Tehsil Jawali Distt. Kangra
- - 2774.00 3150
3 Shah Nehar Major Irrigation Project Fatehpur Distt. Kangra (H.P.)
- - 10955.00 15287
4 Sukhar Medium Irrigation Project Tehsil Jawali Distt. Kangra
15306.00 2186 - -
5 Providing lift Irrigation facility to village sunet- Doda Moch Takoli-II, Kukhnara , Lohara , Chakwari Bhanai & Thangal In Distt. Kangra
- - 388.00 201.64
6 Construction of Lift Irrigation scheme Hadal Kapahri Tehsil Nurpur Distt. Kangra H.P.
130.94 56.61 8.21 56.61
7 Construction of Lift Irrigation scheme suliali from Nagni source Tehsil Nurpur Distt. Kangra H.P.
40.75 66.00 9.57 66.00
8 Construction of Lift Irrigation scheme Nera Balera from Chakki Khad Tehsil Nurpur Distt. Kangra H.P.
55.01 86.44 12.55 86.44
9 Ground water Development (3 Nos.) in Tehsil Fatehpur Distt. Kangra H.P.
- - 2551.00 742.00
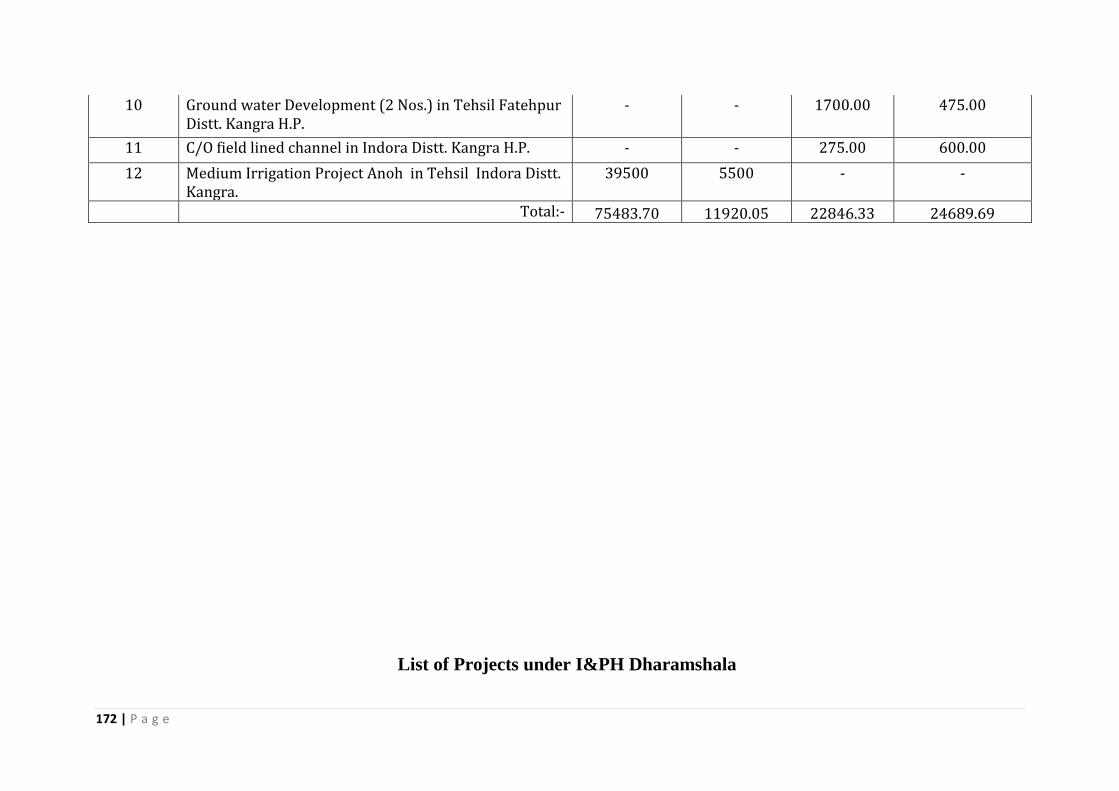
172 | P a g e
10 Ground water Development (2 Nos.) in Tehsil Fatehpur Distt. Kangra H.P.
- - 1700.00 475.00
11 C/O field lined channel in Indora Distt. Kangra H.P. - - 275.00 600.00
12 Medium Irrigation Project Anoh in Tehsil Indora Distt. Kangra.
39500 5500 - -
Total:- 75483.70 11920.05 22846.33 24689.69
List of Projects under I&PH Dharamshala

173 | P a g e
Chapter V: Strategic Action Plan for Irrigation in District under PMKSY
S.
No. Name of
Block/Sub
District
Concerned
Ministry/Departmen
t
Componen
t
Activit
y
Total
Number/Capacit
y (cum)
Command
Area/Irrigatio
n Potential
(Ha)
Period of
Implementatio
n (5/7 years)
Estimate
d cost
(Rs in
Lakh .)
IPH Dharamshala FIS
1. Nagrota
Bagwan
1 Construction of FIS
Rod Kuhal in GP
Rajiana in Tehsil &
District Kangra (HP)
88.34 344.44
Dharamshala 2 Construction of FIS
Machhan Di Kuhal to
village Rasth
Machhan Tikkari ,
Usthagran & village
Tangoriti in GP Tang
in Tehsil
Dharamshala District
Kangra (HP)
170 544.25
Dharamshala 3 Construction of FIS
Pathiar Ambari Kuhal
in Tehsil
Dharamshala District
Kangra (HP)
174 398.46
Dharamshala 4 Construction of FIS
Machhul Kuhl in
Tehsil Dharamshala
District Kangra (HP)
142 214.2

174 | P a g e
Dharamshala 5 C/O FIS Charan Ki
Kuhl from Charan
Khad in Tehsil
Dharamshala District
Kangra (HP)
15 54.76
Dharamshala 6 C/O FIS Dudhli from
Majhi Khad in Tehsil
Dharamshala District
Kangra (HP)
25 84.32
Dharamshala 7 C/O FIS Lower
Sukkar Kuhl from
Manooni Khad in
Tehsil Dharamshala
District Kangra (HP)
30.35 53.62
Dharamshala 8 C/O FIS Jheol
Rashwala Kuhl from
Noud khad in G. P.
Jheol in Tehsil
Dharamshala
30 83.9
Dharamshala 9 C/O FIS Sudher Kuhl
from Banoi khad in
Tehsil Dharamshala
42 71.82
Nagrota
Bagwan
1
0
C/O Flow Irrigation
Scheme Rainki Kuhl
in G.P. Pathiar
257 672.34
Dharamshala 1
1
C/O FIS Fatt and
Dhani Di Kuhl in GP
Pathar in Tehsil
Dharamshala
43.78 152.41
Rait 1
2
C/O FIS Dhamul
Kuhal in Tehsil
138.46 554.44

175 | P a g e
Shahpur District
Kangra
Nagrota
Bagwan
1
3
C/O FIS Badul Kuhl
in GP Chahri, Ambari
and Chamba in Tehsil
Bagwan Nagorta
198 388.7
Nagrota
Bagwan
1
4
C/O FIS Kohla in GP
Mundla Tehsil
Bagwan Nagorta
15 39.33
Baijnath 1
5
C/O FIS Chadruhl
Kuhl for Irrigation
Facility to village
Rajot, Rakkar,
Jandpur Nagra
Saggoor etc. in Tehsil
Bainath District
Kangra (HP)
776 996.21
Panchrukhi 1
6
C/O FIS Neuhal in
GP Bhagrwana ,
Biara and Agojar in
Tehsil Palampur
District Kangra (HP).
162.1 449.58
Panchrukhi 1
7
C/O FIS Garuhal GP
Banuri Holta Banuri
Khas and Vandbihar
in Tehsil Palampur
District Kangra (HP).
92.19 299.89
Bhawarna 1
8
C/O FIS Rani Di
Kuhl in Tehsil
Palampur District
Kangra (HP).
220 539.98

176 | P a g e
Bhawarna 1
9
C/O FIS Mang Kuhl
in Tehsil Palampur
District Kangra (HP).
210 542.06
Bhawarna 2
0
C/O FIS Maniyada
Tappa and Jugeher in
Tehsil Palampur
District Kangra
101 313.88
Rait 2
1
C/O FIS Bhogal
Kuhl in Tehsil
Shahpur District
Kangra
98.6 285.6
Rait 2
2
C/O FIS Darini Kuhl
in Tehsil Shahpur
District Kangra HP
87 194.44
Kangra 2
3
C/O FIS Ichhi Sihra,
Nanghehar , Kot
Kawala , abdulapur ,
Jamanabad and
Mihulu in Tehsil
Shahpur District
Kangra
124.08 551.23
Bhawarna 2
4
C/O FIS Kathal in
Tehsil Palampur
District Kangra HP
106.7 483.88
Lambagaon 2
5
C/O FIS Book Kuhl
in Tehsil alampur
District Kangra
62 201.81
Lambagaon 2
6
C/O FIS Har liunhni
from Dhamkhal in
Tehsil Palampur
District Kangra
24.44 76.75

177 | P a g e
Naagrota
Bagwan
2
7
C/O FIS Lahad and
Balla Kuhl in GP
Serathana Tehsil
Bagwana Nagorta
District Kangra (HP)
45 111.36
Bhawarna 2
8
C/O FIS Makdul
Kuhal in Tehsil
Palampur District
Kangra HP
114 393.68
Total 9097.34
IPH Circle,Dharamshala LIS
Baijnatah 1 C/O LIS Hartara
Chabu Sakrihar and
Bahi in Tehsil Baijnath
District Kangra (HP).
56.3 179.46
Lambagaon 2 C/O LIS Tamber in
Tehsil Jaisinpur 89.36 367.58
Bhedu
Mahadev
3 C/O LIS Kharot in
Tehsil Palampur
District Kangra
35.4 82.36
Bhedu
Mahadev
4 C/O LIS Noura in
Tehsil Palampur
District Kangra
101.39 293.8
Bhedu
Mahadev
5 Providing distribution
to LIS Thural In Tehsil
Palampur District
Kangra HP
185 428.36
Bhawarna 6 Providing distribution 71 130.02
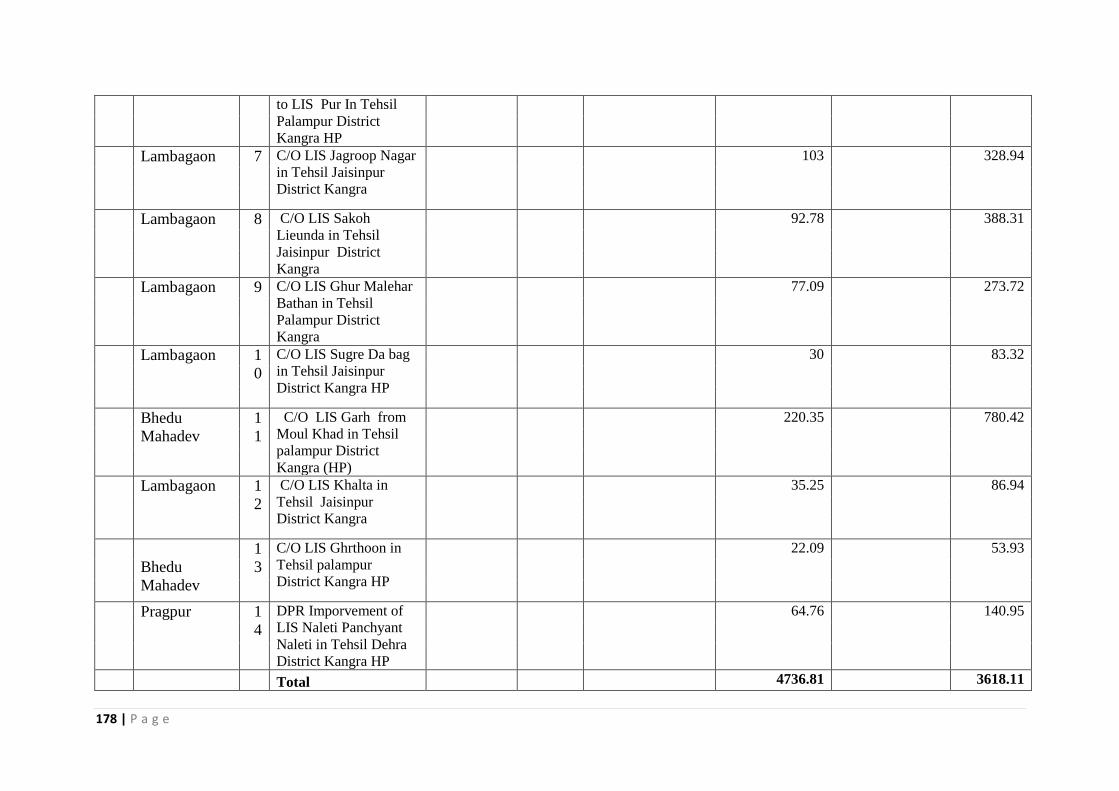
178 | P a g e
to LIS Pur In Tehsil
Palampur District
Kangra HP
Lambagaon 7 C/O LIS Jagroop Nagar
in Tehsil Jaisinpur
District Kangra
103 328.94
Lambagaon 8 C/O LIS Sakoh
Lieunda in Tehsil
Jaisinpur District
Kangra
92.78 388.31
Lambagaon 9 C/O LIS Ghur Malehar
Bathan in Tehsil
Palampur District
Kangra
77.09 273.72
Lambagaon 1
0
C/O LIS Sugre Da bag
in Tehsil Jaisinpur
District Kangra HP
30 83.32
Bhedu
Mahadev
1
1
C/O LIS Garh from
Moul Khad in Tehsil
palampur District
Kangra (HP)
220.35 780.42
Lambagaon 1
2
C/O LIS Khalta in
Tehsil Jaisinpur
District Kangra
35.25 86.94
Bhedu
Mahadev
1
3
C/O LIS Ghrthoon in
Tehsil palampur
District Kangra HP
22.09 53.93
Pragpur 1
4
DPR Imporvement of
LIS Naleti Panchyant
Naleti in Tehsil Dehra
District Kangra HP
64.76 140.95
Total
4736.81 3618.11

179 | P a g e
Grand Total
12715.45
MIS 39 irrigation Schemes in respect of IPH Circle Dharamshala
S.No
. Name of
Block/Sub
District
Concerned
Ministry/Departmen
t
Componen
t
Activit
y
Total
Number/Capacit
y (cum)
Command
Area/Irrigatio
n Potential
(Ha)
Period of
Implementatio
n (5/7 years)
Estimate
d cost (Rs
in Lakh .)
IPH Dharamshala FIS
Rait
1
C/o FIS Raj Kuhl in
Tehsil Shahpur District
Kangra (HP).
98.70
237.91
Rait
2
C/o FIS Baddi Kuhl in
Tehsil Shahpur District
Kangra (HP).
135.18
372.26
Rait
3
C/o FIS Dehrian
Kohala Sanouran and
Mandal & Masherer in
Tehsil & District
Kangra (HP).
373.37
419.52
Bhawarna
4
C/o FIS Dharam Dei
to Dharda and its
adjoining village from
Dharam Dei Khad in
Tehsil Palampur
District Kangra (HP).
63.85
207.93
IPH Circle,Dharamshala LIS

180 | P a g e
Baijnath 1
Providing lift irrigation
scheme Kanarthu in GP
Phatahar in Tehsil
Baijnath District
Kangra (HP)
18.00
44.74
Baijnath 2
Providing lift irrigation
scheme Balh Simbal &
Jamerella in Tehsil
Baijnath District
Kangra (HP)
68.36
99.10
Lambagaon 3
LIS Mangal Ropa
Gadyara
30.55
61.23
Lambagaon 4
C/O LIS village Tikkru
Sanghole, Chambi etc.
In Tehsil Jaisinghpur
District kangra (HP).
136.00
437.85
Lamba
gaon 5
C/O LIS Dagrea in GP
Gharana in Tehsil
Palampur District
Kangra (HP).
84.38
43.14
Total 1008.39 1923.68
Various Irrigation schemes in Various constituencies

181 | P a g e
S.No
. Name of
Block/Sub
District
Concerned
Ministry/Departmen
t
Componen
t
Activit
y
Total
Number/Capacit
y (cum)
Command
Area/Irrigatio
n Potential
(Ha)
Period of
Implementatio
n (5/7 years)
Estimate
d cost (Rs
in Lakh .)
IPH Dharamshala FIS
Dharamshal
a 1
C/O Various FIS in
Dharamshala
Constituency
500.00
1000.00
Nagrota
Bagwan 2
C/O Various FIS in
Nagrota Constituency
500.00
1000.00
Dehra 3
C/O Various FIS in
Jawalamukhi
Constituency
500.00
1000.00
Baijnath 4
C/O Various FIS in
Baijnath Constituency
500.00
1000.00
Panchrukhi 5
C/O Various FIS in
Palampur Constituency
500.00
1000.00
Sullah 6
C/O Various FIS in
Sullah Constituency
500.00
1000.00
Rait 7
C/O Various FIS in
Shahpur Constituency
500.00
1000.00
Kangra 8
C/O Various FIS in
Kangra Constituency
500.00
1000.00
Lambagaon 9
C/O Various FIS in
Jaisinghpur
Constituency
500.00
1000.00
Dehra
1
0
C/O Various FIS in
Dehra Constituency
500.00
1000.00

182 | P a g e
Rragpur
1
1
C/O Various FIS in
Jaswan Pragpur
Constituency
500.00
1000.00
Total 5500.00 11000.00
IPH Dharamshala LIS
Dharamshal
a 1
C/O Various LIS in
Dharamshala
Constituency
500.00
1250.00
Nagrota
Bagwan 2
C/O Various LIS in
Nagrota Constituency
500.00
1250.00
Dehra 3
C/O Various LIS in
Jawalamukhi
Constituency
500.00
1250.00
Baijnath 4
C/O Various LIS in
Baijnath Constituency
500.00
1250.00
Panchrukhi 5
C/O Various LIS in
Palampur Constituency
500.00
1250.00
Sullah 6
C/O Various LIS in
Sullah Constituency
500.00
1250.00
Rait 7
C/O Various FIS in
Shahpur Constituency
500.00
1250.00
Kangra 8
C/O Various LIS in
Kangra Constituency
500.00
1250.00
Lambagaon 9
C/O Various LIS in
Jaisinghpur
Constituency
500.00
1250.00
Dehra
1
0
C/O Various LIS in
Dehra Constituency
500.00
1250.00
Rragpur
1
1
C/O Various LIS in
Jaswan Pragpur
500.00
1250.00

183 | P a g e
Constituency
Total 5500.00 13750.00
G.Total 11000.00 24750.00
LINED FIELD CHANNEL
CAD works under MIS 39 (AIBP) irrigation Schemesin respect of IPH Circle Dharamshala
IPH Dharamshala CAD
Rait
1
C/o FIS Raj Kuhl in Tehsil Shahpur District Kangra (HP). 88.83
32.05
Rait
2
C/o FIS Baddi Kuhl in Tehsil Shahpur District Kangra (HP). 121.66
43.90
Rait
3
C/o FIS Dehrian Kohala Sanouran and Mandal & Masherer in Tehsil &
District Kangra (HP).
336.03
121.25
Bhawarna
4
C/o FIS Dharam Dei to Dharda and its adjoining village from Dharam
Dei Khad in Tehsil Palampur District Kangra (HP).
57.47
20.74
Baijnath 5
Providing lift irrigation scheme Balh Simbal & Jamerella in Tehsil
Baijnath District Kangra (HP)
61.52
22.20

184 | P a g e
Lambagaon 6
C/O LIS village Tikkru Sanghole, Chambi etc. In Tehsil Jaisinghpur
District kangra (HP).
122.40
44.17
787.91 284.31
Rait
1
C/o FIS Raj Kuhl in Tehsil Shahpur District Kangra (HP). 98.70
15.72
Rait
2
C/o FIS Baddi Kuhl in Tehsil Shahpur District Kangra (HP). 135.18
21.54
Rait
3
C/o FIS Dehrian Kohala Sanouran and Mandal & Masherer in Tehsil &
District Kangra (HP).
373.37
59.48
Bhawarna
4
C/o FIS Dharam Dei to Dharda and its adjoining village from Dharam
Dei Khad in Tehsil Palampur District Kangra (HP).
63.85
10.17
Baijnath 5
Providing lift irrigation scheme Balh Simbal & Jamerella in Tehsil
Baijnath District Kangra (HP)
68.36
10.89
Lambagaon 6
C/O LIS village Tikkru Sanghole, Chambi etc. In Tehsil Jaisinghpur
District kangra (HP).
136.00
21.67
Micro Irrigation
Rait
1
C/o FIS Raj Kuhl in Tehsil Shahpur District Kangra (HP). 9.87
7.11

185 | P a g e
Rait
2
C/o FIS Baddi Kuhl in Tehsil Shahpur District Kangra (HP). 13.51
9.74
Rait
3
C/o FIS Dehrian Kohala Sanouran and Mandal & Masherer in Tehsil &
District Kangra (HP).
37.34
26.91
Bhawarna
4
C/o FIS Dharam Dei to Dharda and its adjoining village from Dharam
Dei Khad in Tehsil Palampur District Kangra (HP).
6.38
4.60
Baijnath 5
Providing lift irrigation scheme Balh Simbal & Jamerella in Tehsil
Baijnath District Kangra (HP)
6.84
4.93
Lambagaon 6
C/O LIS village Tikkru Sanghole, Chambi etc. In Tehsil Jaisinghpur
District kangra (HP).
13.60
9.80
87.54 63.09

186 | P a g e
Department of I&PH, Dharamshala
Sl.
No. Blocks
AIBP Har Khet Ko Pani
Major
Mediu
m
Surface
Minor Lift Irrigation Ground Water Development RRR of Water Bodies
Total
No./
Capac
ity
(cum)
Comma
nd Area
(ha)
Estimat
ed Cost
(Rs.
Lakhs)
Total
No./
Capac
ity
(cum)
Comma
nd Area
(ha)
Estima
ted
Cost
(Rs.
Lakhs)
Total
No./
Capacity
(cum)
Comm
and
Area
(ha)
Estimated
Cost (Rs.
Lakhs)
Total
No./
Capacity
(cum)
Comman
d Area
(ha)
Estimate
d Cost
(Rs.
Lakhs)
Total
No./
Capaci
ty
(cum)
Comman
d Area
(ha)
Estimated
Cost (Rs.
Lakhs)
Total
No./
Capacity
(cum)
Comm
and
Area
(ha)
Estima
ted
Cost
(Rs.
Lakhs)
1 Baijnath - - - - - - 2 3800 2806.21 4 642.66 1573.3 - - - - - -
2 Bhawarna
- - - - - - 6 815.55 1981.41 1 71 130.02 - - - - - -
3 Dehra Gopipur - - - - - - 2 1000 2000 8 4116.07 23467.94 - - - - - -
4 Fatehpur
- - - - - - - - - - - -
5 Indora
- - - - - - - - - - - -
6 Kangra
- - - - - - 5 869.55 1972.23 1 500 1250 - - - - - -
7 Lambagaon
- - - - - - 3 586.44 1258.56 10 1178.41 3101.03 - - - - - -
8
Nagrota bagwan
- - - - - - 7 1159.3 2493.66 2 561.16 1370.82 - - - - - -
9
Nagrota
Surian - - - - - - - - - - - -
10 Nurpur
- - - - - - - - - - - -
11 Panchrukhi
- - - - - - 3 754.29 1649.47 1 500 1250 - - - - - -
12 Pragpur
- - - - - - 1 500 1000 4 649.77 1615.1 - - - - - -
13 Rait
- - - - - - 8 1447.7 2514.17 1 500 1250 - - - - - -
14 Sullah
- - - - - - 1 500 1000 6 1064.23 2686.87 - - - - - -
15
Dharamshal
a - - - - - - 12 1341.1 2480.31 1 500 1250 - - - - - -
Grand Total
50 12774 21156 39 10283.30 38945.08 0 0 0 0 0 0

187 | P a g e
Department of I&PH, Dharamshala
Sl. No. Blocks
Har Khet Ko Pani
Lined Field Channel Unlined Channel Micro Irrigation
Total No./
Capacity
(cum)
Command
Area (ha)
Estimated
Cost (Rs.
Lakhs)
Total No./
Capacity
(cum)
Command
Area (ha)
Estimated
Cost (Rs.
Lakhs)
Total No./
Capacity
(cum)
Command
Area (ha)
Estimated
Cost (Rs.
Lakhs)
1 Baijnath 1 61.52 22.24 1 68.36 11.03 1 6.84 5.01
2 Bhawarna 1 57.46 20.82 1 63.85 10.26 1 6.39 4.69
3 Dehra Gopipur 6 1558.03 7791 6 1246.4 6232.5 6 311.61 1558.4
4 Fatehpur
5 Indora
6 Kangra
7 Lambagaon 1 122.4 44.15 1 136 21.85 1 13.6 9.89
8
Nagrota bagwan
1 30.58 152.9 1 24.47 122.35 1 6.12 30.6
9
Nagrota Surian
10 Nurpur
11 Panchrukhi
12 Pragpur 2 42.5 212.5 2 34.01 170.05 2 8.5 42.5
13 Rait 3 546.53 196.2 3 607.25 96.85 3 60.43 43.88
14 Sullah
15 Dharamshala
Grand Total 15 2419.02 8439 15 2180.4 6664.9 15 413.49 1694.97

188 | P a g e
Salient Features of Minor Irrigation Schemes sent for perparation Approved of ( DIP) ( FIS)
S/No. Name of
Scheme
Division
Dist
rict
Source Estimated Cost (
Rs in Lacs
Total
CCA
(in
Hect.
UIP
(in
Hect.
Cost per
Hectare
B.C
Ratio
Pum
ping
Mac
hine
ry
Legh
t of
R/
Mai
n or
Kuhl
or
Mai
n
Line
( in
Rmt.
Dia
R/
main
(mm
)
Distrubution
System (in
Rmt.)
St
at
ic
he
ad
(i
n
M
tr
s)
Rem
arks
Main
Works
CAD
Works
Main
Works
CAD
Wor
ks
G.I
Pipe
HDPE
Pipe
1 2 3 4 5 6 7 8 9 10 11 12 13 14 15 16 17 18 19
1 C/O FIS Ghurkari
Birta in Tehsil
and Distt.Kangra.
Shahpur
Kan
gra
Manooni
Khad.
195 32.40 122.67 122.67 1.59 0.26 1.75:1 - 4260 - - - - -
2 C/O FIS under
G.P.Kholi(Chotti
& Baddi Kuhl in
Tehsil and Distt.
Kangra.
Shahpur
Kan
gra
Dharoon
Khad
188.96 21.3 106.08 106.08 1.78 0.2 1.89:1 - 4880 - - - - -
3 C/O FIS Khola
Kuhl in G.P.
Upper Lunj in
Tehsil and
Distt.Kangra.
Shahpur
Kan
gra
Gaj Khad 37.04 5.62 16.72 16.72 2.22 0.34 3.61:1 - 3082 - - - - -

189 | P a g e
4 C/O FIS Tatwani
Kuhl in Tehsil
Shahpur
Distt.Kangra.
Shahpur Kan
gra
Khouli
Khad
50 13.69 16.43 16.43 3.04 0.83 2.53:1 - 1560 - - - - -
5 Construction of
FIS Gabli &
Rin Kuhal in GP
Kalaid &
Dhaloon in
Tehsil & District
Kangra (HP)
D/ Sala
Kan
gra
Dhroon
Khad
137.49 - 56.00 - 2.45 - 2.93:1 - - - - - - -
6 Construction of
FIS Khajari
from Manooni
Khad in Tehsil
Dharamshala
District Kangra
(HP)
D/ Sala
Kan
gra
Manooni
Khad
58.72 - 135.00 - 0.435 - 2.60:1 - - - - - - -
7 Construction of
FIS Kaned
Huhl from
Katharah in
Tehsil
Dharamshala
District Kangra
(HP)
D/ Sala
Kan
gra
Katharah
Nallah
73.85 33.99 2.172 2.25:1 - - - - - - -
Total 741.06 73.01 486.89 261.9 13.687 1.63
Executive Engineer,
(D)
IPH Circle
Dharamshala

190 | P a g e
Salient Features of Minor Irrigation Schemes sent for perparation Approved of ( DIP) ( LIS)
Sr
N
o.
Name of
Scheme
Divis
ion
Distr
ict
Sour
ce
Estimated
Cost ( Rs
in Lacs
Total
CCA (in
Hect.
Cos
t
per
Hec
tare
B.C
Ratio
Pumping
Machinery
Leght of
R/ Main or
Kuhl or
Main Line
( in Rmt.
Dia R/
main
(mm)
Distrubu
tion
System
(in Rmt.)
Static
head (in
Mtrs)
Rema
rks
Main
Works
CA
D
Wor
ks
Mai
n
Wo
rks
C
A
D
W
or
ks
G.I Pipe
HDP
E
Pipe
1 Construct
ion of
LIS
Ustehar/
FiS
Samloti
Ustehar
in Tehsil
Nagorta
Bagwan
District
Kangra
(HP)
D/
Sala
Kan
gra
Jogg
al
Khad
Dibb
er
Khad
120.82 - 61.16 - - 1.61:1 50HP 140 200 - - - -
2 C/O LIS
Jole
Patola
and
Sakuhi in
Tehsil
Jaswan
District
Kangra
(H.P)
Dehr
a
Kan
gra
Weir
.
60.4 -- 18.01 3.3
6
-- 3.5:1 Main Stage
2 Nos.
Centrifugal
pump set of
15 HP each.
590 Rmt. 150mm
dia G.I.
pipe
(M/H)
150mm
dia G.I.
pipe
(L/C)
475 Rmt.
63m
m to
200m
m dia
1830
Rmt.
52.90
Mtrs.
--

191 | P a g e
3 C/O LIS
to village
Jatoli &
Kurial
Khera in
Tehsil
Rakkar
District
Kangra
(H.P)
Dehr
a
Kan
gra
P/W
ell.
250.62 -- 67 1.7
2
-- 1.96:1 4x40 HP
each
submersible
pump set
1350 Rmt. 250mm
dia
MSER
W pipe
-- 110m
m to
200m
m dia
=
5265
Rmt.
111.44
Mtrs.
--
4 Imp.of
LIS
Gathutar
in Tehsil
Dehra
District
Kangra
(H.P)
Dehr
a
Kan
gra
Bane
r
Khad
.
264.23 -- 115 2.3 -- 1.97:1 Booster
Stage=2x25
HP=50 HP,
Stage-Ist=
3x110=330
HP
Booster
Stage=75
Rmt.,
Stage-Ist
=1095
Rmt.
Booster
Stage
300mm
dia
MSER
W pipe.
Stage-
Ist=300
mm dia
MSER
W pipe
-- 75m
m to
225m
m dia
=
5325
Rmt.
Booster
Stage=
17.30
Mtr.
Stage-
Ist=
146.29
Mtrs
--
5 Imp.of
LIS
Naleti in
G.P.Nalet
i Tehsil
Dehra
District
Kangra.
Dehr
a
Kan
gra
Rive
r
Beas
.
54.08 -- 64.76 0.8
4
-- 1.27:1 Stage-Ist=
2x35=70HP
Centrifugal,
2nd Stage =
2x80=160H
P
Centrifugal
Stage-Ist
=220Rmt.
& stage-
2nd=1725
Rmt.
Stage-
Ist
=350m
m. &
stage-
2nd
=350m
m dia
MSER
W pipe
-- -- Stage-Ist
=39.47
Mtrs.
Stage-
2nd=
100.58
Mtrs..
--
6 C/O LIS
from
River
Beas in
G.P.Silh,
Dareen,
Luthan,
Gurkal,
Dehr
a
Kan
gra
Beas
Rive
r.
19700 -- 2590 3.3 -- 1.50:1 2x75 HP
each
Centrifugal,
6x350 HP
each
Submersibl
e & 10x370
HP each
1465 Rmt. 400mm
dia
MSER
W pipe.
-- 630m
m to
1000
mm
dia
=492
85
Rmt.
95.00
Mtrs.
--
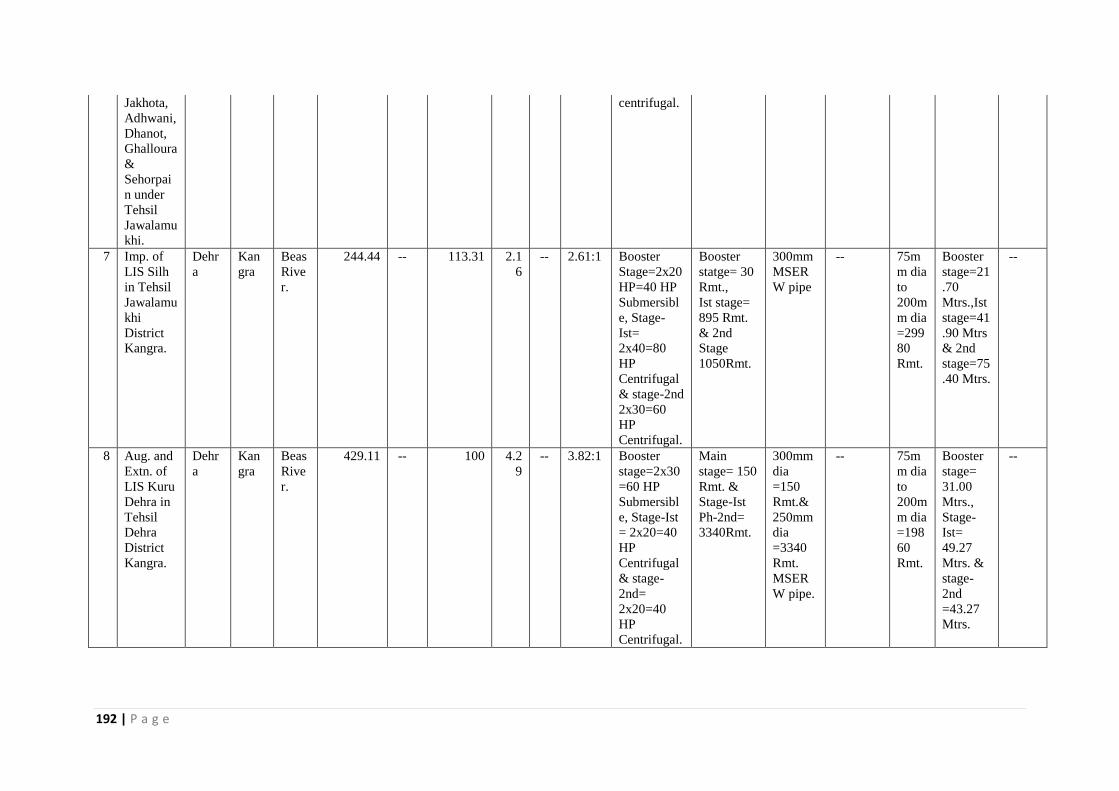
192 | P a g e
Jakhota,
Adhwani,
Dhanot,
Ghalloura
&
Sehorpai
n under
Tehsil
Jawalamu
khi.
centrifugal.
7 Imp. of
LIS Silh
in Tehsil
Jawalamu
khi
District
Kangra.
Dehr
a
Kan
gra
Beas
Rive
r.
244.44 -- 113.31 2.1
6
-- 2.61:1 Booster
Stage=2x20
HP=40 HP
Submersibl
e, Stage-
Ist=
2x40=80
HP
Centrifugal
& stage-2nd
2x30=60
HP
Centrifugal.
Booster
statge= 30
Rmt.,
Ist stage=
895 Rmt.
& 2nd
Stage
1050Rmt.
300mm
MSER
W pipe
-- 75m
m dia
to
200m
m dia
=299
80
Rmt.
Booster
stage=21
.70
Mtrs.,Ist
stage=41
.90 Mtrs
& 2nd
stage=75
.40 Mtrs.
--
8 Aug. and
Extn. of
LIS Kuru
Dehra in
Tehsil
Dehra
District
Kangra.
Dehr
a
Kan
gra
Beas
Rive
r.
429.11 -- 100 4.2
9
-- 3.82:1 Booster
stage=2x30
=60 HP
Submersibl
e, Stage-Ist
= 2x20=40
HP
Centrifugal
& stage-
2nd=
2x20=40
HP
Centrifugal.
Main
stage= 150
Rmt. &
Stage-Ist
Ph-2nd=
3340Rmt.
300mm
dia
=150
Rmt.&
250mm
dia
=3340
Rmt.
MSER
W pipe.
-- 75m
m dia
to
200m
m dia
=198
60
Rmt.
Booster
stage=
31.00
Mtrs.,
Stage-
Ist=
49.27
Mtrs. &
stage-
2nd
=43.27
Mtrs.
--

193 | P a g e
9 LIS
Kundli
Har.
Dehr
a
Kan
gra
Beas
Rive
r.
276.08 -- 133 2.0
8
-- 3.21:1 Booster
stage=2x25
=50 HP,
Main
stage=2x90
=180HP
Booster
Stage=40
Rmt. &
Main stage
=
1830Rmt.
250mm
dia &
300mm
dia
MSER
W pipe.
-- 75m
m dia
to
225m
m dia
=140
70
Rmt.
Booster
stage=
21.21
Mtrs. &
Main
Stage=
82.23
Mtrs.
Total
:
21399.78 - 3262.24 20.
05
-
Salient Features of Minor Irrigation Schemes sent for perparation Approved of ( DIP) ( FIS)
Sr
N
o.
Name
of
Scheme
Divisi
on
Dist
rict
Source Estimated Cost (
Rs in Lacs
Total
CCA (in
Hect.
UIP (in
Hect.
Cost per
Hectare
B.C
Ratio
Pu
m
pi
ng
M
ac
hi
ne
ry
Leght
of R/
Main
or
Kuhl
or
Main
Line (
in
Rmt.
Dia
R/
mai
n
(m
m)
Distrubution
System (in
Rmt.)
Sta
tic
hea
d
(in
Mt
rs)
Rem
arks
Main
Works
CAD
Works
Main
Wor
ks
CAD
Wor
ks
G.
I
Pi
pe
HDPE
Pipe
1
Construc
tion of
FIS Rod
Kuhal in
GP
Rajiana
in Tehsil
&
District
Kangra
(HP)
D/
Sala
Kan
gra
Daroon
Khad
169.19 75.25 88.34 141.34 1.76 0.85 2.77:1 6450

194 | P a g e
2 Construc
tion of
FIS
Machhan
Di Kuhal
to village
Rasth
Machhan
Tikkari ,
Usthagra
n &
village
Tangoriti
in GP
Tang in
Tehsil
Dharams
hala
District
Kangra
(HP)
D/
Sala
Kan
gra
Eco
Khad
210.53 133.72 170 272 1.24 0.79 9.01:1 4217
3 Construc
tion of
FIS
Pathiar
Ambari
Kuhal in
Tehsil
Dharams
hala
District
Kangra
(HP)
D/
Sala
Kan
gra
Baner
Khad
163.96 134.5 174 278.4 1.03 0.77 4.82:1 4313
4 Construc
tion of
FIS
Machhul
Kuhl in
Tehsil
D/
Sala
Kan
gra
Eco
Khad
100.53 113.67 142 227.2 0.67 0.80 9.68:1 3480
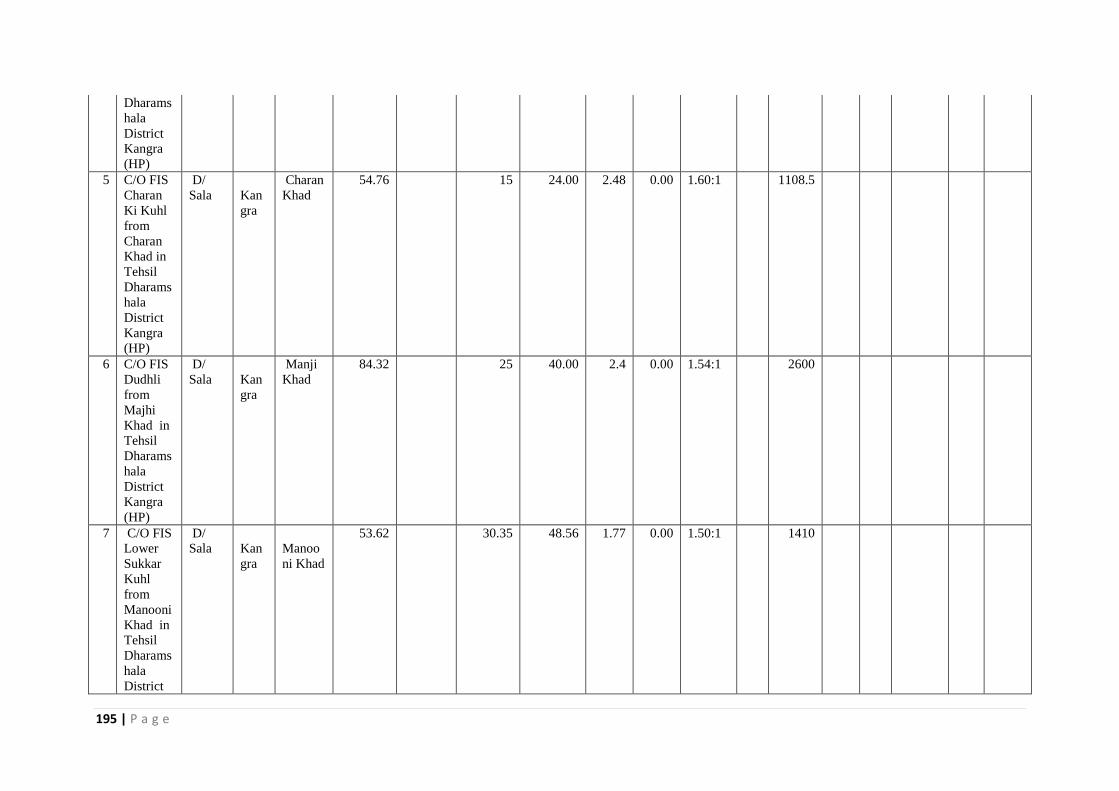
195 | P a g e
Dharams
hala
District
Kangra
(HP)
5 C/O FIS
Charan
Ki Kuhl
from
Charan
Khad in
Tehsil
Dharams
hala
District
Kangra
(HP)
D/
Sala
Kan
gra
Charan
Khad
54.76 15 24.00 2.48 0.00 1.60:1 1108.5
6 C/O FIS
Dudhli
from
Majhi
Khad in
Tehsil
Dharams
hala
District
Kangra
(HP)
D/
Sala
Kan
gra
Manji
Khad
84.32 25 40.00 2.4 0.00 1.54:1 2600
7 C/O FIS
Lower
Sukkar
Kuhl
from
Manooni
Khad in
Tehsil
Dharams
hala
District
D/
Sala
Kan
gra
Manoo
ni Khad
53.62 30.35 48.56 1.77 0.00 1.50:1 1410

196 | P a g e
Kangra
(HP)
8 C/O FIS
Jheol
Rashwal
a Kuhl
from
Noud
khad in
G. P.
Jheol in
Tehsil
Dharams
hala
D/
Sala
Kan
gra
Noud
Khad
73.90 30 48.00 2.46 0.00 1.55:1 1940.5
9 C/O FIS
Sudher
Kuhl
from
Banoi
khad in
Tehsil
Dharams
hala
D/
Sala
Kan
gra
Banoie
Khad
71.82 42 67.2 1.71 0.00 1.51:1 1538.5
10 C/O
Flow
Irrigation
Scheme
Rainki
Kuhl in
G.P.
Pathiar
D/
Sala
Kan
gra
Baner
Khad
572.34 257 411.20 2.12 0.00 1.85:1 13060
MLA
Prirot
y -II
RNS
2014-
15
11 C/O FIS
Fatt and
Dhani Di
Kuhl in
GP
Pathar in
D/
Sala
Kan
gra
Baner
Khad
lckoo
152.41 43.78 70.05 2.48 0.00 1.69:1 2786 P-1
2012-
13

197 | P a g e
Tehsil
Dharams
hala
12 C/O
FIS
Dhamul
Kuhal in
Tehsil
Shahpur
District
Kangra
D/
Sala
Kan
gra
Gaj
Khad
243.3 111.14 138.46 221.54 1.63 0.80 5.81:1 4900 P-1
2014-
15
13 C/O
FIS
Badul
Kuhl in
GP
Chahri,
Ambari
and
Chamba
in Tehsil
Bagwan
Nagorta
D/
Sala
Kan
gra
Baner
Khad
245.07 143.63 198 316.8 1.18 0.73 1.40:1 5328
14 C/O FIS
Kohla in
GP
Mundla
Tehsil
Bagwan
Nagorta
D/
Sala
Kan
gra
Jogal
Khad
39.33 0.00 15 24.00 2.50 0.00 1.62:1 1250
15 C/O FIS
Chadruhl
Kuhl for
Irrigation
Facility
to village
Rajot,
Rakkar,
Jandpur
Palam
pur
Kan
gra
Awa
Khad
796.21 0.00 776 1241.6 1.02 0.00 4.79:1 14600

198 | P a g e
Nagra
Saggoor
etc. in
Tehsil
Bainath
District
Kangra
(HP)
16 C/O FIS
Neuhal
in GP
Bhagrwa
na ,
Biara
and
Agojar in
Tehsil
Palampu
r District
Kangra
(HP).
Palam
pur
Kan
gra
Awa
Khad
224.93 124.65 162.1 259.36 1.55 0.77 3.81:1 6400
17 C/O FIS
Garuhal
GP
Banuri
Holta
Banuri
Khas and
Vandbih
ar in
Tehsil
Palampu
r District
Kangra
(HP).
Palam
pur
Kan
gra
Awa
Khad
223.71 76.18 92.19 147.5 2.46 0.83 2.64:1 6755
18 C/O FIS
Rani Di
Kuhl in
Tehsil
Palam
pur
Kan
gra
Neugal
Khad
374.76 165.22 220 352 1.32 0.75 1.91:1 8630

199 | P a g e
Palampu
r District
Kangra
(HP).
19 C/O FIS
Mang
Kuhl in
Tehsil
Palampu
r District
Kangra
(HP).
Palam
pur
Kan
gra
Neugal
Khad
368.8 173.26 210 336 1.37 0.83 2.36:1 6320
20 C/O FIS
Maniyad
a Tappa
and
Jugeher
in Tehsil
Palampu
r District
Kangra
Palam
pur
Kan
gra
Mand
Khad
241.83 72.05 101 161.6 1.66 0.71 1.62:1 5690
21 C/O FIS
Bhogal
Kuhl in
Tehsil
Shahpur
District
Kangra
Shahp
ur
Kan
gra
Gaj
Khad
103.00 82.6 98.6 157.76 1.04 0.84 2.44:1 2937
Shah
pur
Const
. Ist
Priori
ty
2014-
15
22 C/O FIS
Darini
Kuhl in
Tehsil
Shahpur
District
Kangra
HP
Shahp
ur
Kan
gra
Kholi
Khad
220.15 74.29 87 139.2 2.41 0.85 7.12:1 4346
Priori
ty -II
Shah
pur
Const
.

200 | P a g e
23 C/O FIS
Ichhi
Sihra,
Nangheh
ar , Kot
Kawala ,
abdulapu
r ,
Jamanab
ad and
Mihulu
in Tehsil
Shahpur
District
Kangra
Shahp
ur
Kan
gra
Manjhi
Khad
387.71 163.52 124.08 198.53 3.12 1.32 1.61:1 6280
Kang
ra
Const
.
24 C/O FIS
Kathal in
Tehsil
Palampu
r District
Kangra
HP
Thural
Kan
gra
Neugal
Khad
193.95 89.93 106.7 170.72 1.82 0.84 6030
Sulla
h
Const
.
25 C/O
FIS
Book
Kuhl in
Tehsil
alampur
District
Kangra
Thural
Kan
gra
Krini
Khad
147.11 54.7 62 99.2 2.37 8.88 2.25:1 4250
26 C/O FIS
Har
liunhni
from
Dhamkh
al in
Tehsil
Palampu
r District
Thural
Kan
gra
Dhama
khal
Khad
56.75 0 24.44 39.1 2.32 0 4.24:1 1620
Sulla
h
Const
.

201 | P a g e
Kangra
27 C/O FIS
Lahad
and Balla
Kuhl in
GP
Serathan
a Tehsil
Bagwana
Nagorta
District
Kangra
(HP)
Thural
Kan
gra
Daroon
Khad
111.36 0 45 72.00 2.47 0 2.19:1 2995
28 C/O FIS
Makdul
Kuhal in
Tehsil
Palampu
r District
Kangra
HP
Thural
Kan
gra
Neugal
Khad
193.68 0 114 182.40 1.7 0 2.71.:1 5645
Sulla
h
Const
.
5879.03 1788.31 3592.04 5747.26 52.06 21.36

202 | P a g e
Salient Features of Minor Irrigation Schemes sent for perparation Approved of ( DIP) ( LIS)
S
r
N
o.
Name
of
Schem
e
Divis
ion
Dist
rict
Sou
rce
Estimated Cost (
Rs in Lacs
Tot
al
CC
A
(in
Hec
t.
Cost per Hectare
B.
C
Ra
tio
Pumpi
ng
Machi
nery
Leght
of R/
Main or
Kuhl or
Main
Line ( in
Rmt.
Dia
R/
main
(mm)
Distrubution
System (in
Rmt.)
Static
head
(in
Mtrs)
Remar
ks
Main
Works
CAD
Works
Main
Works
CAD
Works
G.I
Pipe
HDPE
Pipe
1 C/O
LIS
Hartara
Chabu
Sakriha
r and
Bahi in
Tehsil
Baijnat
h
District
Kangra
(HP).
Pala
mpur
Kan
gra
Bin
wa
Kha
d
127.43 52.03 56.3 2.26 0.92 1.9
6:1
2X115
HP
MSERW
= 1590
Mtr
300 415 MPL
Priorit
y -I
2013-
14
2 C/O
LIS
Tamber
in
Tehsil
Jaisinp
ur
Pala
mpur
Kan
gra
Dag
oh
Kha
d
286.32 81.26 89.3
6
2.42 0.91 1.9
4:1
3X135
HP
Singal
Stage
MSERW
=
1530Mtr
250 9050 270.52

203 | P a g e
3 C/O
LIS
Kharot
in
Tehsil
Palamp
ur
District
Kangra
Thur
al
Kan
gra
Neu
gal
Kha
d
82.36 0 35.4 2.33 0 3.7
4:1
Ist
stage =
2X5=1
0 HP
2nd
stage
=2x30=
60 HP
1st
stage
=45 Rmt
2nd
Stage
615 MT
200 Ist
Stage
= 6.98
mtr
2nd
stage
67.50
mtr
Sullah
Const.
4 C/O
LIS
Noura
in
Tehsil
Palamp
ur
District
Kangra
Thur
al
Kan
gra
Neu
gal
Kha
d
207.70 86.1 101.
39
2.05 0.85 3.8
2:1
Stage
=2x20=
40 HP
2nd
Stage
Phase
Ist =2x
50=100
HP
Ist stage
45 Rmt
2nd
stage
phase Ist
615 Mt
2nd
Ist
Stage
=300
mm
2nd
stage
=PH-
I-
200
mm
2955 Ist
Stage
=11.75
mtr
2nd
stage
PH-I
102.84
Mtr
Ph-II
5
Providi
ng
distribu
tion to
LIS
Thural
In
Tehsil
Palamp
ur
District
Kangra
HP
Thur
al
Kan
gra
Neu
gal
Kha
d
181.98 146.38 185 0.98 0.79 2.9
0:1
14430 Sullah
Const.
6 Providi
ng
Thur
Kan
Neu
66.01 64.01 71 0.93 0.9 2.8
7:1
125 14679

204 | P a g e
distribu
tion to
LIS
Pur In
Tehsil
Palamp
ur
District
Kangra
HP
al gra gal
Kha
d
7 C/O
LIS
Jagroo
p
Nagar
in
Tehsil
Jaisinp
ur
District
Kangra
Thur
al
Kan
gra
Riv
er
Bea
s
241.68 87.26 103 2.35 0.85
3.4
7:1
Ist
Stage
=4x10.
5=450
HP 2nd
Stage
=2x
100=20
0 HP
Ist
Stage
=90 and
450 Rmt
2nd
1950
myr
200
and
350
5145 Ist
Stage
=11.20
Mtr
and 12
Mtr
Jaisinp
ur
Const.
8 C/O
LIS
Sakoh
Lieund
a in
Tehsil
Jaisinp
ur
District
Kangra
Thur
al
Kan
gra
Riv
er
Bea
s
208.42 79.89 92.7
8
2.25 0.86 3.5
2:1
Ist
Stage
=4x20=
40 HP
2nd
Stage
Ph-I
=2x
110=22
0 HP
Ist
Stage
=300
mm2nd
stage
=PH
1=850
Ph-II
=510mm
Ist
Stage
=300
mm2
nd
stage
=PH
1=25
0mm
Ph-
II=20
0
MM
9790 Ist
Stage
=
13.20
Mtr
2nd
Stage
PHIst
=146.7
4 Mtr
Ph-II=
68.19
mt
Distru
bution
in
RCC
Pipe

205 | P a g e
9 C/O
LIS
Ghur
Maleha
r
Bathan
in
Tehsil
Palamp
ur
District
Kangra
Thur
al
Kan
gra
Neu
gal
Kha
d
210.14 63.58 77.0
9
2.73 0.82 3.5
5:1
Booster
Stage =
2x25=5
0 Hp
stage
1=2X5
5 HP
MSERW
= 30 Mt,
720
respectiv
ely
300 5450
Booste
r Stage
=
23.50
mt
Stage
Sullah
Const.
1
0
C/O
LIS
Sugre
Da bag
in
Tehsil
Jaisinp
ur
District
Kangra
HP
Thur
al
Kan
gra
Bea
s
Riv
er
73.32 0 30 2.44 0 1.5
4:1
Booster
Stage =
2x10=2
0 Hp
stage
1=2X1
5 HP
MSERW
=
150Mt,
425respe
ctively
200 1995
Booste
r Stage
=
20.70
mt
Jaisinp
ur
Const.
1
1
C/O
LIS
Garh
from
Moul
Khad
in
Tehsil
palamp
ur
District
Kangra
Thur
al
Kan
gra
Mo
ul
Kha
d
511.75 168.67 220.
35
2.32 0.77 2.3
2:1
Booster
Stage =
2x45=2
0 Hp
stage
1=32X
240 HP
MSERW
= 60
mt,1860
respectiv
ely
400
Booste
r Stage
=
13.60
mt,
stage
=174
mtr mt
Suulah
Const.

206 | P a g e
(HP)
1
2
C/O
LIS
Khalta
in
Tehsil
Jaisinp
ur
District
Kangra
Thur
al
Kan
gra
Bea
s
Riv
er
76.94 0 35.2
5
2.18 0 1.7
3:1
Booster
Stage =
2x7.50
Hp
stage
1=2X1
5 HP
MSERW
= 60
mt,1810
respectiv
ely
200 1995
Booste
r Stage
=
18.30
Mt &
31.33
mtr
respect
ively
Jaisinp
ur
Const.
1
3
C/O
LIS
Ghrtho
on in
Tehsil
palamp
ur
District
Kangra
HP
Thur
al
Kan
gra
Neu
gal
Kha
d
51.93 0 22.0
9
2.35 0 3.1
:1
Booster
Stage =
2x7.50
Hp
stage
1=2X2
5 HP
b G.I
=70
Stage
630 Rmt
respectiv
ely
150 860
Booste
r Stage
=
26.50
Mt &
92.12
respect
ively
Suuah
Const.
1
4
DPR
Imporv
ement
of LIS
Naleti
Panchy
ant
Naleti
Dehr
a
Kan
gra
Nal
eti
Kha
d
54.08 0 64.7
6
0.835 0 1.2
7:1
Ist
Stage
2X35
HP 2nd
Stage
2 X80
HP
Ist
Stage
220 Rmt
2nd
Stage
1725
Rmt
0 0 Ist
Stage
19.80
2nd
stage
85.52
0 Dehra
Const.

207 | P a g e
in
Tehsil
Dehra
District
Kangra
HP
2380.06 829.18 118
3.77
28.425 7.67
Executive Engineer,(D),
IPH Circle Dharamshala

208 | P a g e
Department of Agriculture (SDSCO, Dehra Gopipur)
5 Strategic Action Plan for Irrigation in District under PMKSY
S.N. Name
of the
block
Concerned
Ministry/
Department
Component Activity Total
number/capacity(Cum)
Commend
Area/Irrigation
potential (Ha)
Period of
implementation(5/7yrs )
Estimated
cost (in
Lakh)
1 MoWR Major irrigation - - - -
2 MoWR Medium
irrigation
- - - -
3 Rait MoWR Har khet ko
pani
Surface minor
Irrigation
- - - -
4 MoWR Lift Irrigation - - - -
5 MoWR Ground Water
Development

209 | P a g e
6 MoWR Repair
Restoration and
Renovation of
Water Bodies
6 7 7 20
7 MoWR Construction of Field Channels
7.1 MoWR Lined Field
Channels
5 100 7 130
7.2 MoWR Unlined
Channels
- - - -
7.3 MoWR Land Protection
work
10 For Land Protection 7 20
8 MoWR Micro-Irrigation - - - -

210 | P a g e
Department of Agriculture, SDSCO Dharamshala
5 Strategic Action Plan for Irrigation in District under PMKSY S.N
.
Name of the
block
Concerned
Ministry/
Department
Component Activity Total
number/cap
acity(Cum)
Commend
Area/Irrigatio
n potential
(Ha)
Period of
implementation(5/7yrs )
Estimated
cost (in Lakh)
1 MoWR Major irrigation - - - -
2 MoWR Medium irrigation - - - -
3 Dharamshala
MoWR Har khet
ko pani
Surface minor
Irrigation
- - - -
4 MoWR Lift Irrigation - - - -
5 MoWR Ground Water
Development
6 MoWR Repair Restoration
and Renovation of
Water Bodies
16 22 7 55
7 MoWR Construction of Field Channels
7.1 MoWR Lined Field Channels
12 280 7 350
7.2 MoWR Unlined Channels - - - -
7.3 MoWR Land Protection work 20 For Land
Protection
7 35
8 MoWR Micro-Irrigation - - - -
Sub Divisional Soil Conservation Officer,
Dharamshala, Distt. Kangra H.P.

211 | P a g e
Information regarding PMKSY in respect of SDSCO Dharamshala
5 Strategic Action Plan for Irrigation in District under PMKSY S.N
.
Name of the
block
Concerned
Ministry/
Department
Component Activity Total
number/cap
acity(Cum)
Commend
Area/Irrigatio
n potential
(Ha)
Period of
implementation(5/7yrs )
Estimated
cost (in Lakh)
1 MoWR Major irrigation - - - -
2 MoWR Medium irrigation - - - -
3 Nagrota
Bagwan
MoWR Har khet
ko pani
Surface minor
Irrigation
- - - -
4 MoWR Lift Irrigation - - - -
5 MoWR Ground Water
Development
6 MoWR Repair Restoration
and Renovation of
Water Bodies
8 11 7 25
7 MoWR Construction of Field Channels
7.1 MoWR Lined Field Channels
8 180 7 230
7.2 MoWR Unlined Channels - - - -
7.3 MoWR Land Protection work 20 For Land
Protection
7 35
8 MoWR Micro-Irrigation - - - -
Sub Divisional Soil Conservation Officer, Dharamshala, Distt. Kangra H.P.

212 | P a g e
Information regarding PMKSY in respect of SDSCO Dharamshala
5 Strategic Action Plan for Irrigation in District under PMKSY S.N
.
Name of the
block
Concerned
Ministry/
Department
Component Activity Total
number/cap
acity(Cum)
Commend
Area/Irrigatio
n potential
(Ha)
Period of
implementation(5/7yrs )
Estimated
cost (in Lakh)
1 MoWR Major irrigation - - - -
2 MoWR Medium irrigation - - - -
3 Rait
MoWR Har khet
ko pani
Surface minor
Irrigation
- - - -
4 MoWR Lift Irrigation - - - -
5 MoWR Ground Water
Development
6 MoWR Repair Restoration
and Renovation of
Water Bodies
6 7 7 20
7 MoWR Construction of Field Channels
7.1 MoWR Lined Field Channels
5 100 7 130
7.2 MoWR Unlined Channels - - - -
7.3 MoWR Land Protection work 10 For Land
Protection
7 20
8 MoWR Micro-Irrigation - - - -
Sub Divisional Soil Conservation Officer,
Dharamshala, Distt. Kangra H.P.

213 | P a g e
Department of Agriculture, SDSCO Fatehpur
5. Strategic Action plan for Irrigation in District under PMKSY i.r.o Sub Divisional Soil Conservation Officer Fatehpur, Distt. Kangra (HP).
Development Block Fatehpur
Sr.
No. Name of
the Block/
Sub
District
Concerned Ministry/
Department Component
Activity
Total Number/
Capacity (cum)
Command
Area/
Irrigation
Potential
(Ha.)
Period of
Implementatio
n (5/7 yrs)
Estimat
ed cost
(Rs. In
lacs)
1 Soil
Conservation
Sub Division
Fatehpur
MoW
R
AIBP Major
Irrigatio
n
0 0 0 0
2 MoWR Medium
Irrigatio
n
0 0 0 0
3 MoWR Surface Minor
Irrigation
0 0 0 0
4 MoWR Har Khet Ko Pani Lift Irrigation
(Community Solar
Lift Irrigation
Scheme)
8 40 7 140.00
5 MoWR Ground
Water
Development
6 MoWR Repair, Restoration
and Renovation of
Water Bodies
18 9 7 34.00
7 MoWR Construction of field channels
7.1 MoWR Lined Field Channels
(Distribution Channel
from existing
tubewells)
9 90 7 80.00
7.2 MoWR Unlined 0 0 0 0

214 | P a g e
Channels
8 MOA &FW-
DAC&FW
Micro
Irrigatio
n
0 0 0 0
9 MOA &FW-
DAC&FW
Per drop
more
crop
(Micro
Irrigation
)
DPAP
Drip
0 0 0 0
10 MOA &FW- DAC&FW DPAP
Sprinkle
r
0 0 0 0
11 MOA &FW- DAC&FW Non -DPAP
Drip
0 0 0 0
12 MOA &FW- DAC&FW Non -DPAP
Sprinkler
0 0 0 0
13 MOA &FW-
DAC&FW
Per drop
more
crop
(Supplem
entar y
water
managem
ent
activities
)
Topping up
of
MGNREGA
0 0 0 0
14 MOA &FW-
DAC&FW
Drought
Proofing
through
check
Dams/Water
Harvesting
Structures
15 0 6 75.00
15 MOA &FW- DAC&FW Secondary
Storage
Structures
(at tail end of water
source)
55 5.5 7 40.00
16 MOA &FW- DAC&FW On Farm
Development
(distribution pipe /
raised bed and furrow
system etc.)
0 0 0 0
17 DoLR-
MoRD
Newly created
WHS
17.1 DoLR-MoRD PMKSY
Watershe
Farm
Ponds
0 0 0 0
17.2 DoLR-MoRD Check
Dams
0 0 0 0

215 | P a g e
17.3 DoLR-MoRD d
Nallah
Bunds
0 0 0 0
17.4 DoLR-MoRD Percolation
Tanks
0 0 0 0
17.5 DoLR-MoRD Other Ground Water
Recharge Structure
0 0 0 0
17.6 DoLR-MoRD Fishery
ponds/cattle
pond
0 0 0 0
18 DoLR-MoRD PMKSY
Watershe
d
Renovated
WHS
18.1 DoLR-MoRD Farm Ponds
0 0 0 0
18.2 DoLR-MoRD Check
Dams
0 0 0 0
18.3 DoLR-MoRD Nallah
Bunds
0 0 0 0
18.4 DoLR-MoRD Percolation
Tanks
0 0 0 0
18.5 DoLR-MoRD Other Ground Water
Recharge Structure
0 0 0 0
18.6 DoLR-MoRD Fishery
ponds/cattle
pond
0 0 0 0
19 DoLR-MoRD Newly
Created
19.1 DoLR-MoRD Converge
nce with
MGNRE
GA
Water
Conservation
0 0 0 0
19.2 DoLR-MoRD Water
Harvesting
:
0 0 0 0
19.3 DoLR-MoRD Creation of Irrigation
canals and Drains:
0 0 0 0
19.4 DoLR-MoRD Providing
Infrastructure for
Irrigation:
0 0 0 0
19.5 DoLR-MoRD Land
Development
0 0 0 0
20 DoLR-MoRD Renovation
20.1 DoLR-MoRD Renovation of water 0 0 0 0

216 | P a g e
Sub Divisional Soil Conservation Officer
Fatehpur, Distt. Kangra (HP)
bodies including de-
silting:
20.2 DoLR-MoRD Renovation &
Maintenance of
Irrigation Canals &
Drains:
0 0 0 0
21 State Planned Scheme of Irrigation
21.1 State
Irrigation
Department
Name of
the
scheme
Major
Irrigation
21.2 State
Irrigation
Department
Name of
the
scheme
Medium
Irrigation
21.3 State
Irrigation
Department
Name of
the
scheme
Surface Minor
Irrigation
List of Schemes executed in Soil Conservation Sub Division
Fatehpur attached at ANNEXURE-I
22 Irrigation Schemes of
State Agriculture
Department
Name of the scheme
23 Irrigation Scheme of
State
Agriculture
Department
Name of the scheme
24 Externally aided projects Name of the scheme
25 Other loan projects
NABARD
Name of the scheme

217 | P a g e
5. Strategic Action plan for Irrigation in District under PMKSY i.r.o Sub Divisional Soil Conservation Officer Fatehpur, Distt. Kangra (HP).
Development Block Nagrota Surian
Sr.
No. Name of
the Block/
Sub
District
Concerned Ministry/
Department Component
Activity
Total Number/
Capacity (cum)
Command
Area/
Irrigation
Potential
(Ha.)
Period of
Implementatio
n (5/7 yrs)
Estimat
ed cost
(Rs. In
lacs)
1 Soil
Conservation
Sub Division
Fatehpur
MoW
R
AIBP Major
Irrigatio
n
0 0 0 0
2 MoWR Medium
Irrigatio
n
0 0 0 0
3 MoWR Surface Minor
Irrigation
0 0 0 0
4 MoWR Har Khet Ko Pani Lift Irrigation
(Community Solar
Lift Irrigation
Scheme)
8 40 7 140.00
5 MoWR Ground
Water
Development
6 MoWR Repair, Restoration
and Renovation of
Water Bodies
14 7 7 26.00
7 MoWR Construction of field channels
7.1 MoWR Lined Field Channels
(Distribution Channel
from existing
tubewells)
7 70 7 60.00
7.2 MoWR Unlined
Channels 0 0 0 0

218 | P a g e
8 MOA &FW-
DAC&FW
Micro
Irrigatio
n
0 0 0 0
9 MOA &FW-
DAC&FW
Per drop
more
crop
(Micro
Irrigation
)
DPAP
Drip
0 0 0 0
10 MOA &FW- DAC&FW DPAP
Sprinkle
r
0 0 0 0
11 MOA &FW- DAC&FW Non -DPAP
Drip
0 0 0 0
12 MOA &FW- DAC&FW Non -DPAP
Sprinkler
0 0 0 0
13 MOA &FW-
DAC&FW
Per drop
more
crop
(Supplem
entar y
water
managem
ent
activities
)
Topping up
of
MGNREGA
0 0 0 0
14 MOA &FW-
DAC&FW
Drought
Proofing
through
check
Dams/Water
Harvesting
Structures
15 0 6 75.00
15 MOA &FW- DAC&FW Secondary
Storage
Structures
(at tail end of water
source)
45 4.5 7 34.00
16 MOA &FW- DAC&FW On Farm
Development
(distribution pipe /
raised bed and furrow
system etc.)
0 0 0 0
17 DoLR-
MoRD
Newly created
WHS
17.1 DoLR-MoRD PMKSY
Watershe
d
Farm
Ponds
0 0 0 0
17.2 DoLR-MoRD Check
Dams
0 0 0 0
17.3 DoLR-MoRD Nallah 0 0 0 0

219 | P a g e
Bunds
17.4 DoLR-MoRD Percolation
Tanks
0 0 0 0
17.5 DoLR-MoRD Other Ground Water
Recharge Structure
0 0 0 0
17.6 DoLR-MoRD Fishery
ponds/cattle
pond
0 0 0 0
18 DoLR-MoRD PMKSY
Watershe
d
Renovated
WHS
18.1 DoLR-MoRD Farm Ponds
0 0 0 0
18.2 DoLR-MoRD Check
Dams
0 0 0 0
18.3 DoLR-MoRD Nallah
Bunds
0 0 0 0
18.4 DoLR-MoRD Percolation
Tanks
0 0 0 0
18.5 DoLR-MoRD Other Ground Water
Recharge Structure
0 0 0 0
18.6 DoLR-MoRD Fishery
ponds/cattle
pond
0 0 0 0
19 DoLR-MoRD Newly
Created
19.1 DoLR-MoRD Converge
nce with
MGNRE
GA
Water
Conservation
0 0 0 0
19.2 DoLR-MoRD Water
Harvesting
:
0 0 0 0
19.3 DoLR-MoRD Creation of Irrigation
canals and Drains:
0 0 0 0
19.4 DoLR-MoRD Providing
Infrastructure for
Irrigation:
0 0 0 0
19.5 DoLR-MoRD Land
Development
0 0 0 0
20 DoLR-MoRD Renovation
20.1 DoLR-MoRD Renovation of water
bodies including de-0 0 0 0

220 | P a g e
Sub Divisional Soil Conservation Officer
Fatehpur, Distt. Kangra (HP)
silting:
20.2 DoLR-MoRD Renovation &
Maintenance of
Irrigation Canals &
Drains:
0 0 0 0
21 State Planned Scheme of Irrigation
21.1 State
Irrigation
Department
Name of
the
scheme
Major
Irrigation
21.2 State
Irrigation
Department
Name of
the
scheme
Medium
Irrigation
21.3 State
Irrigation
Department
Name of
the
scheme
Surface Minor
Irrigation
List of Schemes executed in Soil Conservation Sub Division
Fatehpur attached at ANNEXURE-I
22 Irrigation Schemes of
State Agriculture
Department
Name of the scheme
23 Irrigation Scheme of
State
Agriculture
Department
Name of the scheme
24 Externally aided projects Name of the scheme
25 Other loan projects
NABARD
Name of the scheme

221 | P a g e
Department of Agriculture, SDSCO Nurpur
Block
Irrigation
Scheme of State
Agriculture
Department Total Number/Capacity
(cum)
Command
Area/Irrigation
Potential (Ha)
Period of
Implementation (5/7
years)
Estimated
cost (in
LAck.)
A SDSCO Nurpur
Surface
Minor
Irrigation
indora 1 FIS Malahari 25 25
nurpur 2
FIS Khanni
Jhikhli 10 10
nurpur 3 WHS Jounta 11 11
Sub Total 46 0 46

222 | P a g e
Department of Agriculture, Palampur
Detail of DIP ( Distt. Irriagtaion Plan ) Agriculture Department in r/o Sub Div. Soil Cons. Officer Palampur Distt. Kangra ( H.P )
S.
No.
Name of the Blocks/ Sub
Distt.
Concerned
Ministry/
Deptt.
Activity Name of Scheme CCA
(Hac.)
Estd. Cost
(In lacs)
1 Palampur/Bhedu
Mahadev
Agr. Deptt. Surface Flow
Irrigation
C/o MIS Grain- Di- Kuhal G.P Arla
Tehsil Palampur Distt. Kangra
12.80 18.00
2 Palampur/Bhedu
Mahadev
Agr. Deptt. Surface Flow
Irrigation
C/o MIS Malot Kuhal at Vill. & G.P
Garla Tehsil Palampur
20.00 28.00
3 Palampur/Bhedu
Mahadev
Agr. Deptt. Surface Flow
Irrigation
C/o MIS Branch of Dia-Di- Kuhal Vill.
Boda G.P Sihol
18.00 26.00
4 Palampur/Bhedu
Mahadev
Agr. Deptt. Surface Flow
Irrigation
C/o MIS at Vill. Gagal Khas G.P Gagal
Kholi Palampur
12.00 16.50
5 Palampur/Bhedu
Mahadev
Agr. Deptt. Surface Flow
Irrigation
C/o MIS Hatli Kuhal at V.P.O Tappa G.p
Tandol Palampur
25.00 32.00
6 Palampur/Bhedu
Mahadev
Agr. Deptt. Surface Flow
Irrigation
C/o MIS Kasba Kuhal at G.P Punnar
Palampur
14.00 15.50
7 Palampur/Bhedu
Mahadev
Agr. Deptt. Surface Flow
Irrigation
C/o MIS Patnul( Cheyon- Di- Choe) at
Vill. Bhatton & Batahral G.P Sullah
20.00 28.50
8 Palampur/Bhedu
Mahadev
Agr. Deptt. Surface Flow
Irrigation
C/o MIS Dhoryan- Da- Choe Phase-II at
Vill. Bataheal G.p Sullah
12.00 14.50
9 Palampur/Bhedu
Mahadev
Agr. Deptt.
Surface Flow
Irrigation
C/o MIS Dohli Choe Soon Kuhal To
Patnool Kuhal at Vill. Kathru G.P
Bhatoon Palampur
16.00 25.00
10 Palampur/Bhedu
Mahadev
Agr. Deptt. Surface Flow
Irrigation
C/o MIS Sihoti kuhal at Vill.& G.P
Morhoon Tehsil Palampur
40.00 45.00

223 | P a g e
11 Palampur/Bhedu
Mahadev
Agr. Deptt. Surface Flow
Irrigation
C/o MIS Chaian Da Choe at Vill Choki
G.P Kakrain Tehsil Palampur
35.00 38.00
12 Palampur/Bhedu
Mahadev
Agr. Deptt. Surface Flow
Irrigation
C/o MIS Near Shiv Manider Panah V.P.O
Dehan Teh. Palampur
36.80 40.00
13 Palampur/Bhedu
Mahadev
Agr. Deptt. Surface Flow
Irrigation
C/o MIS Kuhal Dharthul up to Barul
kuhal at Vill. Ballah G.P Ballah
12.00 15.00
14 Palampur/Bhedu
Mahadev
Agr. Deptt. Surface Flow
Irrigation
C/o W.H.S ( Chek Dam at Vill.
Mansimbal (Buhla) Teh. Palampur
20.00 15.00
15 Palampur/Bhedu mahadev Agr. Deptt. Surface Flow
Irrigation
C/o MIS Kuhal Machhlena Har at G.P
Sullah
12.00 15.00
16 Palampur/Bhedu mahadev Agr. Deptt. Surface Flow
Irrigation
C/o MIS Soiyon-di- Kuhal Vill. Panapar
Teh. Palampur
30.00 45.00
17 Palampur/Bhedu mahadev Agr. Deptt. Surface Flow
Irrigation
C/o MIS Meda Kuhal At Vill. Ramehar
G.P Bhawarna
20.00 30.00
18 Palampur/Bhedu mahadev Agr. Deptt. Surface Flow
Irrigation
C/o Mashan Kuhal at Vill. & G.P
Bhawarna
12.00 18.00
19 Palampur/Bhedu mahadev Agr. Deptt. Surface Flow
Irrigation
C/o MIS Branch of Singar Kuhal at Vill.
& G.P Kural Tehsil Palampur
25.00 35.00
20 Palampur/Bhedu mahadev Agr. Deptt. Surface Flow
Irrigation
C/o MIS (Dabona- da- Choe) at Vill.
Garla Sarkari G.P Garla
15.00 22.00
21 Palampur/Bhedu mahadev Agr. Deptt. Surface Flow
Irrigation
C/o MIS Bashoon Choe at Vill. & G.P
Saloh Teh. Palampur
10.00 15.00
22 Palampur/Bhedu mahadev Agr. Deptt. Surface Flow
Irrigation
C/o MIS Gharna- Da- Choe Vill. Pharer
& Parour
12.00 17.00
23 Palampur/Bhedu mahadev Agr. Deptt. Surface Flow
Irrigation
C/o MIS Dohle-Di- Kuhal at Vill. & G.P
Parour
15.00 18.00

224 | P a g e
24 Palampur/Bhedu mahadev Agr. Deptt. Surface Flow
Irrigation
C/o MIS Buka -Da- Choe at Vill. & G.P
parour
10.00 15.00
25 Palampur/LambaGaon Agr. Deptt. Surface Flow
Irrigation
C/o MIS Dardni Nallah to Nettru Kuhal
G.P Bijapur Teh. Jaisinghpur
20.00 30.00
26 Palampur/LambaGaon Agr. Deptt. Surface Flow
Irrigation
C/o MIS Sita ram khad to Dalu Bag G.P
Haled Teh. Jaisinghpur
15.00 22.50
27 Palampur/LambaGaon Agr. Deptt. Surface Flow
Irrigation
C/o MIS Upper Danall to lowr Danall
Kuhal G.P Dhup KiYara
25.00 37.50
28 Palampur/LambaGaon Agr. Deptt. Surface Flow
Irrigation
C/o MIS Lambagaon to Bag G.P
Lambagaon Teh. Jaisinghpur
20.00 30.00
29 Palampur/LambaGaon Agr. Deptt. Surface Flow
Irrigation
C/o Uttar Pal Nallah to Mengri Gaon G.P
Bijapur
25.00 37.50
30 Palampur/LambaGaon Agr. Deptt. Surface Flow
Irrigation
C/o MIS Kangan to Dadh Kuhal G.P
Bardam Teh. Jaisinghpur
20.00 30.00
31 Palampur/LambaGaon Agr. Deptt. Surface Flow
Irrigation
C/o MIS Soon Baned Kuhal G.P Janglet
The. Jaisinghpur
30.00 45.00
32 Palampur/LambaGaon Agr. Deptt. Surface Flow
Irrigation
C/o MIS Suggri Bag Kuhal Vill. Daslu
G.P Lambagam
25.00 37.50
33 Palampur/LambaGaon Agr. Deptt. Surface Flow
Irrigation
C/o MIS Mand Khad To Surya Bag
Kuhal G.P Paplah
30.00 45.00
34 Palampur/LambaGaon Agr. Deptt. Surface Flow
Irrigation
C/o MIS Babdi Deyod Bastti to Rabhal
Kuhal Teh. Jaisinghpur
15.00 22.50
35 Palampur/LambaGaon Agr. Deptt. Surface Flow
Irrigation
C/o MIS Meen Nallah to Jeen Khad G.P
Saboh
20.00 30.00
36 Palampur/LambaGaon Agr. Deptt. Surface Flow
Irrigation C/o Sandri Kuhal to Chohhar G.P Saboh
20.00 30.00

225 | P a g e
37 Palampur P/Rukhi Agr. Deptt. Surface Flow
Irrigation
C/o FIS Palasan Kuhal at Vill. Kothi G.P
Byada
16.00 19.20
38 Palampur P/Rukhi Agr. Deptt. Surface Flow
Irrigation
C/o FIS Kolda Kuhal Vill. & G.P
Lamlehar
15.00 16.30
39 Palampur P/Rukhi Agr. Deptt. Surface Flow
Irrigation
C/o FIS Riggad Gomota Kuhal Vill. &
G.P Simbal Khola
14.00 14.00
40 Palampur P/Rukhi Agr. Deptt. Surface Flow
Irrigation
C/o FIS Bhangsar Kuhal Vill. Bhaugsa
G.P Simbal Khola
12.00 13.50
41 Palampur P/Rukhi Agr. Deptt. Surface Flow
Irrigation
C/o FIS Ghagreda Kuhal Vill. Drati G.P
Tatehal
10.00 10.00
42 Palampur P/Rukhi Agr. Deptt. Surface Flow
Irrigation
C/o FIS Aalang Kuhal Vill. & G.P
Tatehal
24.00 24.00
43 Palampur P/Rukhi Agr. Deptt. Surface Flow
Irrigation
C/o FIS Pranuhal Kuhal Vill. & G.P
Saliana
10.50 12.00
44 Palampur P/Rukhi Agr. Deptt. Surface Flow
Irrigation C/o FIS Pratuhal Kuhal Pt. Parihar
Branch From Simbalu Vill. Pantehar G.P
Tanda
18.00 21.60
45 Palampur P/Rukhi Agr. Deptt. Surface Flow
Irrigation
C/o FIS Chetu Ram Ka Chou at Vill.
Ladoh
16.00 17.60
46 Palampur P/Rukhi Agr. Deptt. Surface Flow
Irrigation C/o FIS Nai Kuhal at Vill.& G.P Gadiara
18.00 18.00
47 Palampur P/Rukhi Agr. Deptt. Surface Flow
Irrigation
C/o FIS Mandwal Auther Kuhal Vill.
Simbal Khola
24.00 28.80
48 Palampur P/Rukhi Agr. Deptt. Surface Flow
Irrigation
C/o FIS Syan Bhan Kuhal to Ramnagar
G.P Tikkar
36.00 40.00
49 Palampur P/Rukhi Agr. Deptt. Surface Flow
Irrigation
C/o FIS Lahman Andora Kuhal G.P
Tikkar
18.00 19.50
50 Palampur P/Rukhi Agr. Deptt. Surface Flow
Irrigation C/o FIS Thara Tikkari Kuhal G.P Tikkar
20.00 22.50

226 | P a g e
51 Palampur P/Rukhi Agr. Deptt. Surface Flow
Irrigation
C/o FIS Chakla Kuhal G.P Ladoh 20.00 24.00
52 Palampur P/Rukhi Agr. Deptt. Surface Flow
Irrigation
C/o FIS Ghore Di Kuhal G.P Tatehal 19.50 23.40
53 Palampur P/Rukhi Agr. Deptt. Surface Flow
Irrigation
C/o FIS Chore Di Kuhal G.P Tatehal 14.00 16.80
54 Palampur P/Rukhi Agr. Deptt. Surface Flow
Irrigation
C/o FIS Tikkari Jhanot G.P Tikkar 12.00 13.20
55 Palampur P/Rukhi Agr. Deptt. Surface Flow
Irrigation
C/o FIS Dattal to Thamba G.P Simbal
Khola
10.00 11.50
56 Palampur P/Rukhi Agr. Deptt. Surface Flow
Irrigation
C/o FIS Behdu Kuhal vill Kamahrnu
Lamehar
18.00 23.40
57 Palampur P/Rukhi Agr. Deptt. Surface Flow
Irrigation
C/o Patte Di Kuhal Vill HandolPatt GP
Saliana
10.00 12.00
58 Palampur/Bhawarna Agr. Deptt. Surface Flow
Irrigation
C/o MIS Ghudthul From Ranjeet Gharat
to Baduhal G.P Rakh
30.00 23.50
59 Palampur/Bhawarna Agr. Deptt. Surface Flow
Irrigation
C/o MIS Pandtuhal Kuhal Vill. Bharmat
G.P Banuri
35.00 28.00
60 Palampur/Bhawarna Agr. Deptt. Surface Flow
Irrigation
C/o MIS Baswan Da Chou Vill. Toru G.P
Lamlehad
40.00 34.00
61 Palampur/Bhawarna Agr. Deptt. Surface Flow
Irrigation
C/o MIS Yash pal Land to Rani Di Kuhal
G.P Aima
15.00 10.00
62 Palampur/Bhawarna Agr. Deptt. Surface Flow
Irrigation
C/o MIS Madhi Kuhal From Bagad Khad
Vill. Padra Vill. Hangloh
30.00 24.50
63 Palampur/P/Rukhi Agr. Deptt. Surface Flow
Irrigation
C/o MIS Bahadu Vill. Deogran G.P
Deogran
30.00 26.50
64 Palampur/P/Rukhi Agr. Deptt. Surface Flow
Irrigation
C/o MIS Shyotu Vill. Hoslu G.P Deogran 35.00 30.00

227 | P a g e
65 Palampur/P/Rukhi Agr. Deptt. Surface Flow
Irrigation
C/o MIS Vaid basti To Chaudhary Basti
G.P Chandropa
30.00 27.60
66 Palampur/P/Rukhi Agr. Deptt. Surface Flow
Irrigation
C/o MIS Mandh Khad To Dyod Basti
G.P Chandropa
40.00 37.50
67 Palampur/P/Rukhi Agr. Deptt. Surface Flow
Irrigation
C/o Rajpur Khad to Chauodhary basti
G.P Chandropa
20.00 22.30
68 Palampur/Bhawarna Agr. Deptt. Surface Flow
Irrigation
C/o MIS Vaid khad to Chaudhary basti
G.P Badehad
30.00 33.60
69 Palampur/Baijnath Agr. Deptt. Surface Flow
Irrigation
C/o MIS Kanduhal kuhal G.P Spaidu 50.00 60.00
70 Palampur/Bhawarna Agr. Deptt. Surface Flow
Irrigation
C/o MIS Ree- Gidha G.P Hangloh 20.00 18.00
71 Palampur/Bhawarna Agr. Deptt. Surface Flow
Irrigation
C/o MIS Khujuhal Kuhal at Vill. & G.P
Banuri
50.00 62.00
72 Palampur/P/rukhi Agr. Deptt. Surface Flow
Irrigation
C/o MIS Dahlu Kuhal to Harijan basti
G.P Chandropa
25.00 23.50
73 Palampur/Baijnath Agr. Deptt. Surface Flow
Irrigation
C/o MIS Chadrul Kuhal GP Spaidu,
rajehad
45.00 52.00
74 Palampur/Baijnath Agr. Deptt. Surface Flow
Irrigation
C/o MIS Nanahar To Baadi Khas
GP Nanahar
25.00 22.50
75 Palampur/Baijnath Agr. Deptt. Surface Flow
Irrigation
C/o MISGaunt To Gawal Thana
GP Nanahar
20.00 18.00
76 Palampur/Bhawarna Agr. Deptt. Surface Flow
Irrigation
C/o MIS Bhairal Khad to Kohali Surad
GP Lohana
20.00 20.50
77 Palampur/Bhawarna Agr. Deptt. Surface Flow
Irrigation
C/o MIS Ghareda Nalla to Badsar
GP Badsar
30.00 35.60
78 Palampur/Bhawarna Agr. Deptt.
Surface Flow
Irrigation
C/o MIS Ramesh Chand Land to
Gopalpur
GP Gopalpur
30.00 33.70
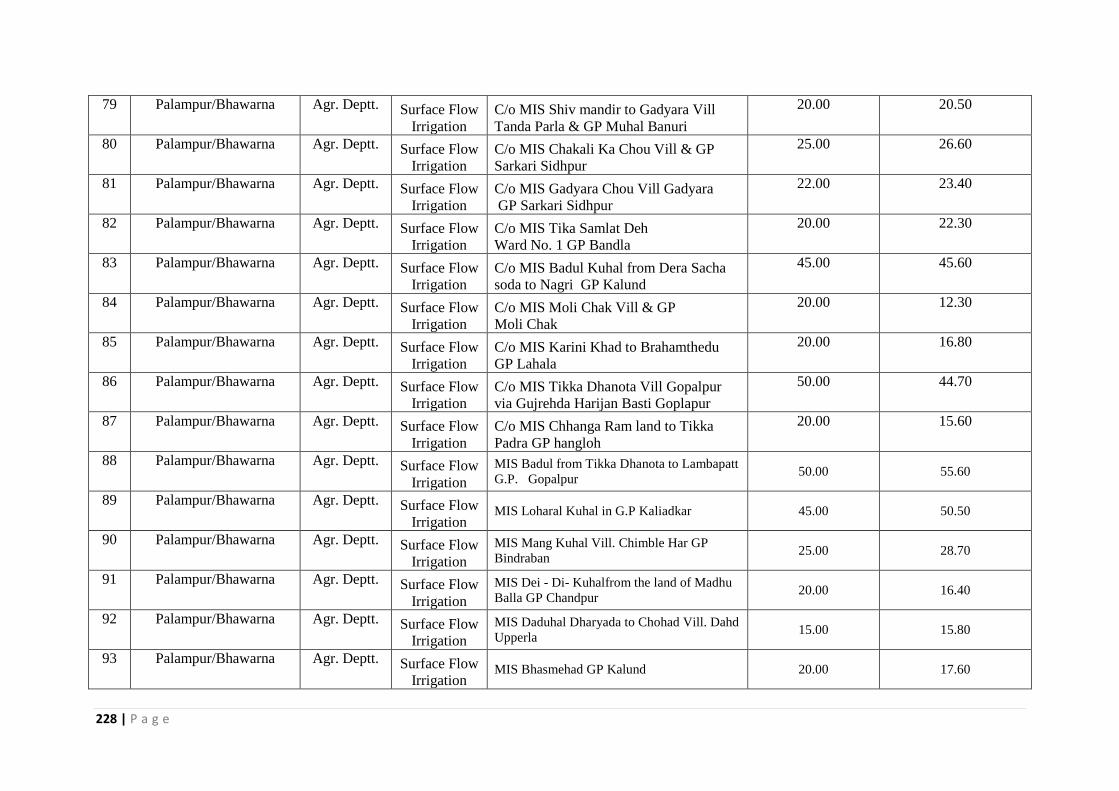
228 | P a g e
79 Palampur/Bhawarna Agr. Deptt. Surface Flow
Irrigation
C/o MIS Shiv mandir to Gadyara Vill
Tanda Parla & GP Muhal Banuri
20.00 20.50
80 Palampur/Bhawarna Agr. Deptt. Surface Flow
Irrigation
C/o MIS Chakali Ka Chou Vill & GP
Sarkari Sidhpur
25.00 26.60
81 Palampur/Bhawarna Agr. Deptt. Surface Flow
Irrigation
C/o MIS Gadyara Chou Vill Gadyara
GP Sarkari Sidhpur
22.00 23.40
82 Palampur/Bhawarna Agr. Deptt. Surface Flow
Irrigation
C/o MIS Tika Samlat Deh
Ward No. 1 GP Bandla
20.00 22.30
83 Palampur/Bhawarna Agr. Deptt. Surface Flow
Irrigation
C/o MIS Badul Kuhal from Dera Sacha
soda to Nagri GP Kalund
45.00 45.60
84 Palampur/Bhawarna Agr. Deptt. Surface Flow
Irrigation
C/o MIS Moli Chak Vill & GP
Moli Chak
20.00 12.30
85 Palampur/Bhawarna Agr. Deptt. Surface Flow
Irrigation
C/o MIS Karini Khad to Brahamthedu
GP Lahala
20.00 16.80
86 Palampur/Bhawarna Agr. Deptt. Surface Flow
Irrigation
C/o MIS Tikka Dhanota Vill Gopalpur
via Gujrehda Harijan Basti Goplapur
50.00 44.70
87 Palampur/Bhawarna Agr. Deptt. Surface Flow
Irrigation
C/o MIS Chhanga Ram land to Tikka
Padra GP hangloh
20.00 15.60
88 Palampur/Bhawarna Agr. Deptt. Surface Flow
Irrigation
MIS Badul from Tikka Dhanota to Lambapatt
G.P. Gopalpur 50.00 55.60
89 Palampur/Bhawarna Agr. Deptt. Surface Flow
Irrigation MIS Loharal Kuhal in G.P Kaliadkar 45.00 50.50
90 Palampur/Bhawarna Agr. Deptt. Surface Flow
Irrigation
MIS Mang Kuhal Vill. Chimble Har GP
Bindraban 25.00 28.70
91 Palampur/Bhawarna Agr. Deptt. Surface Flow
Irrigation
MIS Dei - Di- Kuhalfrom the land of Madhu
Balla GP Chandpur 20.00 16.40
92 Palampur/Bhawarna Agr. Deptt. Surface Flow
Irrigation
MIS Daduhal Dharyada to Chohad Vill. Dahd
Upperla 15.00 15.80
93 Palampur/Bhawarna Agr. Deptt. Surface Flow
Irrigation MIS Bhasmehad GP Kalund 20.00 17.60

229 | P a g e
94 Palampur/Bhawarna Agr. Deptt. Surface Flow
Irrigation MIS Chamduhal GP Bindraban 45.00 42.60
95 Palampur/Bhawarna Agr. Deptt. Surface Flow
Irrigation
MIS Kharol kuhal from Awa khad to
Maniyada-Thandohal GP Banuri Khas 50.00 64.90
96 Palampur/Bhawarna Agr. Deptt. Surface Flow
Irrigation
MIS Khayanpatt to Plah - Tikka GP
Chandropa 20.00 18.70
97 Palampur/Baijnath Agr. Deptt. Surface Flow
Irrigation
C/o FIS Nagoon Kuhal vill Sehal
GP SehalTeh Baijnath
20.00 20.00
98 Palampur/Baijnath Agr. Deptt. Surface Flow
Irrigation
C/o FIS Takruhal Kuhal Vill Tikkari GP
Tikkari Duhki Teh baijnath
25.00 25.00
99 Palampur/Baijnath Agr. Deptt. Surface Flow
Irrigation
C/o FIS Bharag Kuhal at Vill Sansal
GP Sansal
25.00 25.00
100 Palampur/Baijnath Agr. Deptt. Surface Flow
Irrigation
C/o FIS Nohra Palhata at vill Nohra
GP Mahal Patt
20.00 20.00
101 Palampur/Baijnath Agr. Deptt. Surface Flow
Irrigation
C/o FIS Gunehad Kotli Kuhal at villKotli
GP Kotli
30.00 30.00
102 Palampur/Baijnath Agr. Deptt. Surface Flow
Irrigation
C/o Mahlan Nallah Kuhal at vill & GP
Mahakal
25.00 25.00
103 Palampur/Baijnath Agr. Deptt.
Surface Flow
Irrigation
C/o WHS at Dharku Nallah near the
house of Sh Omparkash ward NO. 5
at Vill Mahakal
8.00 6.00
104 Palampur/Baijnath Agr. Deptt. Surface Flow
Irrigation
C/o WHS at Malhan khad Ward No. 3
GP Mahakal
10.00 5.00
105 Palampur/Baijnath Agr. Deptt. Surface Flow
Irrigation C/o WHS at Vill Ghartheda GP paprola
10.00 5.00
106 Palampur/Baijnath Agr. Deptt. Surface Flow
Irrigation
C/o WHS at Vill Darku Nallah Vill
Nagehar GP Chobu
15.00 6.00
107 Palampur/Baijnath Agr. Deptt. Surface Flow
Irrigation
C/o FIS Channeti Kuhal at Tikkari
GP tikkari Duhki
20.00 20.00

230 | P a g e
108 Palampur/Baijnath Agr. Deptt. Surface Flow
Irrigation
C/o WHS at vill Mandrera GP Kothi
Te h Baijnath
15.00 6.00
109 Palampur/Baijnath Agr. Deptt. Surface Flow
Irrigation C/o FIS jhikhli Bhett GP Jkikhli Bhett
20.00 21.50
110 Palampur/Baijnath Agr. Deptt. Surface Flow
Irrigation
C/o FIS Sansali Kuhal GP Sansal
Te h Baijnath
30.00 30.00
111 Palampur/Baijnath Agr. Deptt. Surface Flow
Irrigation
C/o FIS from Mehla Road to Malhan
khad GP Mahakal
30.00 30.00
112 Palampur/Baijnath Agr. Deptt. Surface Flow
Irrigation
C/o FIS from the house of Sh bakshi Ram
to Malhan Khad GP Mahakal
25.00 25.00
113 Palampur/Baijnath Agr. Deptt.
Surface Flow
Irrigation
C/o FIS Kuhal from the house of Sh
Prittam chand to Bharku nallah
Vill & GP Mahakal
15.00 15.00
114 Palampur/Baijnath Agr. Deptt. Surface Flow
Irrigation
C/o FIS Kadsenu Kuhal Vill Chakol
Bhedu GP Majherna
20.00 20.00
115 Palampur/Baijnath Agr. Deptt. Surface Flow
Irrigation
C/o FIS Grandal Kuhal Vill Chakol
Bhedu GP majherna
15.00 15.00
116 Palampur/Baijnath Agr. Deptt. Surface Flow
Irrigation
C/o FIS Bharadi Kuhal Vill Majherna
Khas GP majherna
15.00 15.00
117 Palampur/Baijnath Agr. Deptt. Surface Flow
Irrigation
C/o FIS Tarmundi Kuhal Vill Majherna
Khas GP majherna
21.00 21.00
118 Palampur/Baijnath Agr. Deptt. Surface Flow
Irrigation
C/o FIS Sioti Kuhal Vill Chakol Bhedu
GP majherna
25.00 25.00
119
Palampur/Bhawarna Agr. Deptt.
Surface Flow
Irrigation
C/o Charian Di Kuhal vill Ghanghaltu
GP Uterehar
10.00 12.00
120
Palampur/Baijnath Agr. Deptt.
Surface Flow
Irrigation
C/o FIS Ghumarda Kuhal Vill Ghumarda
GP Hared
20.00 22.00
121
Palampur/Baijnath Agr. Deptt.
Surface Flow
Irrigation
C/o FIS Kandral Kuhal Nallah Vill
Kandral GP Kandral
30.00 35.00

231 | P a g e
122
Palampur/Baijnath Agr. Deptt.
Surface Flow
Irrigation
C/o FIS Lot Kuhal Vill Lot GP
Madhonagar
30.00 38.00
123
Palampur/Baijnath Agr. Deptt.
Surface Flow
Irrigation C/o FIS Jangli Kuhal Vill Kothi Paprola
20.00 20.00
124
Palampur/Baijnath Agr. Deptt.
Surface Flow
Irrigation
C/o FIS Gadmal Kuhal Vill Kothi
Paprola
30.00 30.00
125
Palampur/Baijnath Agr. Deptt.
Surface Flow
Irrigation
C/o FIS Deo Nallah Chou Vill Kothi
Paprola
25.00 25.00
126
Palampur/Baijnath Agr. Deptt.
Surface Flow
Irrigation
C/o FIS Charanatt Kuhal Vill Sakri
Sukarna Ghar W No 1
18.00 19.50
127
Palampur/Baijnath Agr. Deptt.
Surface Flow
Irrigation
C/o FIS Basant Prabha Kuhal Vill
Mandhol W.No. 3
20.00 22.00
128
Palampur/Baijnath Agr. Deptt.
Surface Flow
Irrigation C/o FIS Mandhol Kuhal Vill Mandhol
18.00 20.00
129
Palampur/Baijnath Agr. Deptt.
Surface Flow
Irrigation C/o FIS Khad Ghor Kuhal Vill Mandhol
16.00 18.00
130
Palampur/Baijnath Agr. Deptt.
Surface Flow
Irrigation
C/o FIS Matena Kuhal Vill Bada Bhangal
GP Bada Bhangal
45.00 50.00
131
Palampur/Bhawarna Agr. Deptt.
Surface Flow
Irrigation
C/o FIS from Sai Garden to Gaddi Basti
abadi ward No.4 Lohna
20.00 19.50
132
Palampur/Baijnath Agr. Deptt.
Surface Flow
Irrigation
C/o Kuhal near Sita Ramani Ashram Vill
Malgota & GP Khada Naal Tehsil
Baijnath
12.00 13.50
3009.60 3322.70
Sub Divisional Soil Cons. Officer,
Palampur Distt Kangra (HP)

232 | P a g e
Department of Agriculture, ATMA

233 | P a g e

234 | P a g e

235 | P a g e
Department of Horticulture
District Irrigation Plan of Deputy Director of Horticulture, Distt. Kangra,HP under PMKSY for the year 2017-18
A. Horticulture crops + Vegetable crops B.
Per drop more crop
Technology Category of
Farmers
Average
system
cost (
Per)
Hac as
per
scheme
Blockwise physical targets demanded
Nurp
ur
Indora
N/S
uri
an
Fat
ehpur
Pra
gpur
Deh
ra
Kan
gra
Rai
t
Dhar
amsh
ala
N/B
agw
an
Bhaw
arna
P/
Rukhi
Bai
jnat
h
Sula
h
Lam
bag
aon
Tota
l
Drip-irrigation
System
(Wide spaced
crop)
S & M
8m & above 29375 3 18 18 0.5 0.5 0.5 0 0 0 0.5 0 0.5 0.5 0 0 42
4m to <8m 42375 23 26 25 18 12 12 7 4 1 1 4 1 1 7 7 149
2m to < 4m 73000 0.5 0 0 0.5 0 0.5 2 0 0 0 0 0 0 0 0 3.5
Drip- irrigation
system (Closed
space)
S & M 0
1.2m to <2m 106750 0
<1.2m 125000 0 15 0 0 9 9 0 0 0 0 0 0 0 0 0 33
Micro Sprinkler
Irrigation System S & M 73625 14 8 8 2 1 1 2 2 0 5 0 4 1 1 1 50
Others 0
Mini sprinkler
Irrigation System S & M 106500 34 93 18 32 17 45 17 15 3 4 3 3 15 7 7 313
Others 0
Portable
Sprinkler
Irrigation System
S & M 24500 0 30 0 0 0 0 0 0 0 0 0 0 0 0 3 33
Others 0

236 | P a g e
Semi Permanenrt
sprinkler system S & M 45750 0 60 15 12 0 0 15 0 3 3 0 3 0 0 0 111
Others 0
Borewell/
dugwell 180000 15 150 0 30 30 30 0 0 0 3 3 3 0 0 0 264
Water Storage
Tank (50 cu.
Meter)
140000 15 75 30 60 33 45 9 6 3 6 3 6 9 9 9 318
Tranning program 50000 4 3 4 3 4 3 4 3 4 3 3 3 4 3 3 51
Admin cost @5%
Grand Total 108.5 478 118 158 106.5 146 56 30 14 25.5 16 23.5 30.5 27 30 1367.5
Category
of Farmers
Avera
ge
system
cost (
Per)
Hac as
per
schem
e
Blockwise Financial Implications (FULL COST)
Nurpur Indora Nagrota Surian Fatehpur Pragpur Dehra Kangra Rait
Dharamshala
Nagrota Bagwan
Bhawarna
Panchrukhi Baijnath Sulah
Lambagaon Total
Drip-irrigation
System
(Wide spaced
crop)
S & M
8m &
above 29375 88125 528750 528750 14687.5 14687.5 14687.5 0 0 0 14687.5 0
14687.
5 14687.5 0 0 1233750
4m to <8m 42375 974625 1101750 1059375 762750 508500 508500 296625 169500 42375 42375 169500 42375 42375 296625 296625 6313875
2m to < 4m 73000 36500 0 0 36500 0 36500 146000 0 0 0 0 0 0 0 0 255500
others 0 0

237 | P a g e
8m &
above 0 0
4m to <8m 0 0
2m to < 4m 0 0
Drip-
irrigation
system
(Closed
space)
S & M 0 0 0 0 0 0 0 0 0 0 0 0 0 0 0 0
1.2m to <2m 106750 0
<1.2m 125000 0 1875000 0 0 1125000 1125000 0 0 0 0 0 0 0 0 0 4125000
Others 0
1.2m to <
2m 0 0 0 0 0 0 0 0 0 0 0 0 0 0 0 0
<1.2m 0
Micro
Sprinkler
Irrigatio
n System
S & M 73625
103075
0 589000 589000 147250 73625 73625 147250 147250 0 368125 0 294500 73625 73625 73625 3681250
Others 0
Mini sprinkler
Irrigatio
n System
S & M 106500 362100
0 9904500 1917000 3408000 1810500 4792500 181050
0 159750
0 319500 426000 319500 319500 1597500 745500 745500 3333450
0
Others 0
Portable Sprinkler
Irrigatio
n System
S & M 24500 0 735000 0 0 0 0 0 0 0 0 0 0 0 0 73500 808500
Others 0
Semi
Permane
nrt
sprinkler
system
S & M 45750 0 2745000 686250 549000 0 0 686250 0 137250 137250 0 137250 0 0 0 5078250
Others 0
Borewell
/ dugwell
180000
270000
0
2700000
0 0 5400000 5400000 5400000 0 0 0 540000 540000 540000 0 0 0
4752000
0

238 | P a g e
Water
Storage Tank (50
cu.
Meter)
140000
210000
0
1050000
0 4200000 8400000 4620000 6300000
126000
0 840000 420000 840000 420000 840000 1260000 1260000
126000
0
4452000
0
Tranning
program 50000 200000 150000 200000 150000 200000 150000 200000 150000 200000 150000 150000 150000 200000 150000 150000 2550000

239 | P a g e
Department of Forest
5.Strategic Action Plan for Irrigation in District under PMKSY In respect of Nurpur Forest Division Sr. Name of the
dev.Block/Distt.
Concerned
Ministry/
Department
Component Activity Total number
/Capacity(cum
Command
Area/Irrigation
Potential
Period of
implemen
tation
(5/7 yrs)
Estimated
cost (Rs. In
lacs)
1 Fatehpur/Kangra MOWR Harkhet to Pani Ground water
Development (one
water storage Tank
for Nurseries
3 1.8 5 years 300000
Indora/Kangra MOWR Harkhet to Pani Ground water
Development (one
water storage Tank
for Nurseries
3 1.95 5 years 300000
Nagrota Surian/
Kangra
MOWR Harkhet to
PaniGround Water
Ground water
Development (one
water storage Tank
for Nurseries
3 1.51 5 years 300000
Nurpur/ Kangra MOWR Harkhat to Pani Ground water
Development (one
water storage Tank
for Nurseries, Eco
Park
7 3.21 5 years 700000
16 8.47 1600000
17 DoLR-MORD Newly created
WHS
17.1 Fatehpur/Kangra DoLR-MORD PMKSY Watershed Farm Pond 3 3 5 years 450000
Indora/Kangra DoLR-MORD Farm Pond 3 3 5 years 450000
Nagrota Surian/
Kangra
DoLR-MORD Farm Pond 6 6 5 years 900000

240 | P a g e
Nurpur/ Kangra DoLR-MORD Farm Pond 3 3 5 years 450000
Total: 15 15 2250000
17.2 Fatehpur/Kangra DoLR-MORD Check Dams 80 4 5 years 1200000
Indora/Kangra DoLR-MORD Check Dams 50 3 5 years 750000
Nagrota Surian/
Kangra
DoLR-MORD Check Dams 120 6 5 years 1800000
Nurpur/ Kangra DoLR-MORD Check Dams 50 3 5 years 250000
Total: 300 16 4000000
17.3 Fatehpur/Kangra DoLR-MORD Nallah Bands 90 4 5 years 1350000
Indora/Kangra DoLR-MORD Nallah Bands 70 3 5 years 1050000
Nagrota Surian/
Kangra
DoLR-MORD Nallah Bands 140 6 5 years 2100000
Nurpur/ Kangra DoLR-MORD Nallah Bands 60 3 5 years 900000
Total: 360 16 5400000
17.4 Fatehpur/Kangra DoLR-MORD Percolation
tanks/trenches
160 3 5 years 2400000
Indora/Kangra DoLR-MORD Percolation
tanks/trenches
80 2 5 years 1200000
Nagrota Surian/
Kangra
DoLR-MORD Percolation
tanks/trenches
160 3 5 years 2400000
Nurpur/ Kangra DoLR-MORD Percolation
tanks/trenches
100 2 5 years 1500000
Total: 500 10 7500000
17.5 Fatehpur/Kangra DoLR-MORD Other ground water
recharge
1 2 5 years 100000
Indora/Kangra DoLR-MORD Other ground water
recharge
1 2 5 years 100000
Nagrota Surian/
Kangra
DoLR-MORD Other ground water
recharge
2 4 5 years 200000
Nurpur/ Kangra DoLR-MORD Other ground water
recharge
1 2 5 years 100000

241 | P a g e
Total: 5 10 500000
17.6 Fatehpur/Kangra DoLR-MORD Fishery ponds /
water ponds
2 2 5 years 160000
Indora/Kangra DoLR-MORD Fishery ponds /
water ponds
1 1 5 years 80000
Nagrota Surian/
Kangra
DoLR-MORD Fishery ponds /
water ponds
2 2 5 years 160000
Nurpur/ Kangra DoLR-MORD Fishery ponds /
water ponds
1 1 5 years 80000
Total: 6 6 480000
Total 17 1186 73 20130000
18 Renovated WHS
18.1 0 0 PMKSY Watershed Farm Pond 0 0 0 0
18.2 Fatehpur/Kangra DoLR-MORD Check Dams 8 8 5 years 80000
Indora/Kangra DoLR-MORD Check Dams 4 4 5 years 40000
Nagrota Surian/
Kangra
DoLR-MORD Check Dams 8 8 5 years 80000
Nurpur/ Kangra DoLR-MORD Check Dams 4 4 5 years 40000
Total 24 24 240000
18.3 0 0 0 Nallah Bands 0 0 0 0
18.4 Fatehpur/Kangra DoLR-MORD Percolation
tanks/trenches
10 5 5 years 100000
Indora/Kangra DoLR-MORD Percolation
tanks/trenches
5 3 5 years 50000
Nagrota Surian/
Kangra
DoLR-MORD Percolation
tanks/trenches
10 5 5 years 100000

242 | P a g e
Nurpur/ Kangra DoLR-MORD Percolation
tanks/trenches
5 3 5 years 50000
Total 30 16 300000
18.5 Fatehpur/Kangra DoLR-MORD Other ground water
recharge
1 2 5 years 40000
Indora/Kangra DoLR-MORD Other ground water
recharge
1 2 5 years 40000
Nagrota Surian/
Kangra
DoLR-MORD Other ground water
recharge
2 4 5 years 80000
Nurpur/ Kangra DoLR-MORD Other ground water
recharge
1 2 5 years 40000
Total 5 10 200000
Total 18 59 50 740000
Grand Total 22470000
PRADHAN MANTRI KRISHI SINCHAYEE YOJANA (PMKSY) REVISED STRATEGIC ACTI0N PLAN
5.Strategic Action Plan for Irrigation in District under PMKSY In respect of Palampur Forest Division
Name of the
dev.Block/Distt.
Concerned
Ministry/
Department
Component Activity Total number
/Capacity(cum
Command
Area/Irrigation
Potential
Period of
implemen
tation
(5/7 yrs)
Estimated
cost per
Unit
Estimated
cost (Rs.
In lacs)
1 Baijnath/Kangra MOWR Harkhet Ko Pani
Ground water
Development
(one water
6./50 4.5 5 years 100000 600000

243 | P a g e
storage Tank for
Nurseries
Bhedu Mahadev/
Kangra MOWR Harkhet Ko Pani
Ground water
Development
(one water
storage Tank for
Nurseries
2./20 1.8 5 years 100000 200000
Lambagoan/
Kangra MOWR Harkhet Ko Pani
Ground water
Development
(one water
storage Tank for
Nurseries
1./15 1.2 0 100000 100000
Bhawarna/ Kangra MOWR Harkhet Ko Pani
Ground water
Development
(one water
storage Tank for
Nurseries, Eco
Park
2./20 1.6 5 years 100000 200000
Total 11./105 9.1
1100000
17
DoLR-MORD
Newly created
WHS
Baijnath/Kangra DoLR-MORD
PMKSY
Watershed Farm Pond 3./60 3 5 years 150000 450000
Bhedu Mahadev/
Kangra DoLR-MORD
Farm Pond 6./120 3 5 years 150000 900000
Lambagoan/
Kangra DoLR-MORD
Farm Pond 3./60 6 5 years 150000 450000
Bhawarna/ Kangra DoLR-MORD
Farm Pond 3./60 3 5 years 150000 450000
Total: 15./300 15
150000 2250000
Baijnath/Kangra DoLR-MORD
Check Dams 80 4 5 years 150000 1200000
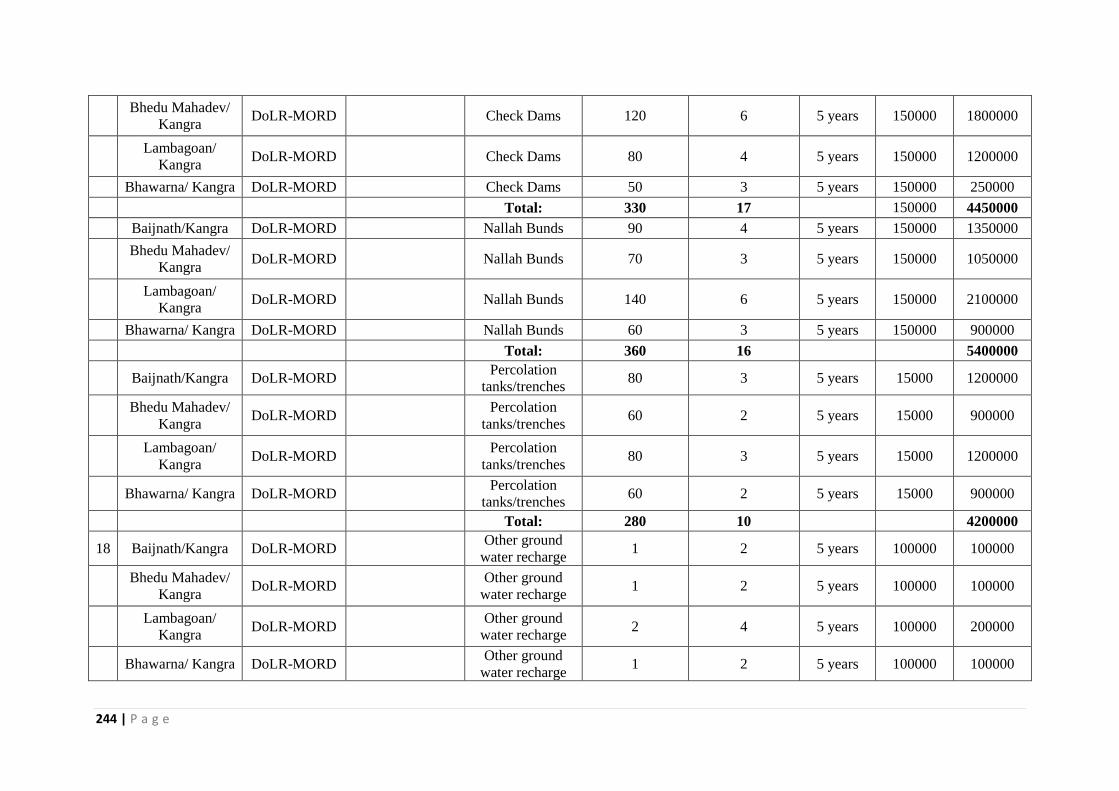
244 | P a g e
Bhedu Mahadev/
Kangra DoLR-MORD
Check Dams 120 6 5 years 150000 1800000
Lambagoan/
Kangra DoLR-MORD
Check Dams 80 4 5 years 150000 1200000
Bhawarna/ Kangra DoLR-MORD
Check Dams 50 3 5 years 150000 250000
Total: 330 17
150000 4450000
Baijnath/Kangra DoLR-MORD
Nallah Bunds 90 4 5 years 150000 1350000
Bhedu Mahadev/
Kangra DoLR-MORD
Nallah Bunds 70 3 5 years 150000 1050000
Lambagoan/
Kangra DoLR-MORD
Nallah Bunds 140 6 5 years 150000 2100000
Bhawarna/ Kangra DoLR-MORD
Nallah Bunds 60 3 5 years 150000 900000
Total: 360 16
5400000
Baijnath/Kangra DoLR-MORD
Percolation
tanks/trenches 80 3 5 years 15000 1200000
Bhedu Mahadev/
Kangra DoLR-MORD
Percolation
tanks/trenches 60 2 5 years 15000 900000
Lambagoan/
Kangra DoLR-MORD
Percolation
tanks/trenches 80 3 5 years 15000 1200000
Bhawarna/ Kangra DoLR-MORD
Percolation
tanks/trenches 60 2 5 years 15000 900000
Total: 280 10
4200000
18 Baijnath/Kangra DoLR-MORD
Other ground
water recharge 1 2 5 years 100000 100000
Bhedu Mahadev/
Kangra DoLR-MORD
Other ground
water recharge 1 2 5 years 100000 100000
Lambagoan/
Kangra DoLR-MORD
Other ground
water recharge 2 4 5 years 100000 200000
Bhawarna/ Kangra DoLR-MORD
Other ground
water recharge 1 2 5 years 100000 100000

245 | P a g e
Total: 5 10
500000
Baijnath/Kangra DoLR-MORD
Fishery ponds /
water ponds 2 2 5 years 80000 160000
Bhedu Mahadev/
Kangra DoLR-MORD
Fishery ponds /
water ponds 1 1 5 years 80000 80000
Lambagoan/
Kangra DoLR-MORD
Fishery ponds /
water ponds 2 2 5 years 80000 160000
Bhawarna/ Kangra DoLR-MORD
Fishery ponds /
water ponds 1 1 5 years 80000 80000
Total: 6 6
480000
74
17280000
18
Renovated WHS
0 0
PMKSY
Watershed Farm Pond 0 0 0
0
Baijnath/Kangra DoLR-MORD
Check Dams 8 8 5 years 10000 80000
Bhedu Mahadev/
Kangra DoLR-MORD
Check Dams 4 4 5 years 10000 40000
Lambagoan/
Kangra DoLR-MORD
Check Dams 8 8 5 years 10000 80000
Bhawarna/ Kangra DoLR-MORD
Check Dams 4 4 5 years 10000 40000
Total 24 24
240000
0 0 0 Nallah Bands 0 0 0
0
Baijnath/Kangra DoLR-MORD
Percolation
tanks/trenches 10 5 5 years 10000 100000
Bhedu Mahadev/
Kangra DoLR-MORD
Percolation
tanks/trenches 10 5 5 years 10000 100000

246 | P a g e
Lambagoan/
Kangra DoLR-MORD
Percolation
tanks/trenches 10 5 5 years 10000 100000
Bhawarna/ Kangra DoLR-MORD
Percolation
tanks/trenches 5 3 5 years 10000 50000
Total 35 18
350000
19 Baijnath/Kangra DoLR-MORD
Other ground
water recharge 1 2 5 years 40000 40000
Bhedu Mahadev/
Kangra DoLR-MORD
Other ground
water recharge 2 4 5 years 40000 80000
Lambagoan/
Kangra DoLR-MORD
Other ground
water recharge 2 4 5 years 40000 80000
Bhawarna/ Kangra DoLR-MORD
Other ground
water recharge 1 2 5 years 40000 40000
Total 6 12
240000
Total 18 65 54
830000
Grand Total
19210000

247 | P a g e
PMKSY -2016-17 (Dharamshala Forest Division)
Sr.
No Name of Blocks/Sub District /Tehsil
Concerned
Ministry
/Depp.
Component Activity
Total
Number/capacity
(Cum)
Command
Area/
Irrigation
potential
(Ha)
Period of
Implementati
on 5/7 years.
Estimated
Cost. (Ranges)
17 Newly Created WHS
17.1 Kangra/Nagrota/ Nagrota MOWR Har khet ko
Pani Farm Ponds 0 0 2016-17 0
Mallan
Range
Kangra/Dharamshala/Dharamshala MOWR Har khet ko
Pani Farm Ponds 0 0 2016-17 0
D/sala
Range
Kangra/Shahpur/ shahpur MOWR Har khet ko
Pani Farm Ponds 1 0 2016-17 150000
Shahpur
Range
Kangra/Kangra/ Kangra MOWR Har khet ko
Pani Farm Ponds 0 0 2016-17 0
Kangra
Range
Kangra/Kangra/ Kangra MOWR Har khet ko
Pani Farm Ponds 0 0 2016-17 0
Lapiana
Range
Total (7.1) = 1 0 0 150000
17.2 Kangra/Nagrota/ Nagrota MOWR Har khet ko
Pani
Check
Dams 15 5 2016-17 375000
Mallan
Range
Kangra/Dharamshala/Dharamshala MOWR Har khet ko
Pani
Check
Dams 15 5 2016-17 375000
D/sala
Range
Kangra/Shahpur/ shahpur MOWR Har khet ko
Pani
Check
Dams 15 5 2016-17 375000
Shahpur
Range
Kangra/Kangra/ Kangra MOWR Har khet ko
Pani
Check
Dams 15 5 2016-17 375000
Kangra
Range
Kangra/Kangra/ Kangra MOWR Har khet ko
Pani
Check
Dams 20 8 2016-17 500000
Lapiana
Range
Total (7.2) = 80 28 2000000
17.3 Kangra/Nagrota/ Nagrota MOWR Har khet ko
Pani Nalla Bunds 20 2 2016-17 300000
Mallan
Range
Kangra/Dharamshala/Dharamshala MOWR Har khet ko
Pani Nalla Bunds 20 2 2016-17 300000
D/sala
Range

248 | P a g e
Kangra/Shahpur/ shahpur MOWR Har khet ko
Pani Nalla Bunds 20 2 2016-17 300000
Shahpur
Range
Kangra/Kangra/ Kangra MOWR Har khet ko
Pani Nalla Bunds 20 2 2016-17 300000
Kangra
Range
Kangra/Kangra/ Kangra MOWR Har khet ko
Pani Nalla Bunds 20 2 2016-17 300000
Lapiana
Range
Total (17.3) = 100 10 1500000
17.4 Kangra/Nagrota/ Nagrota MOWR Har khet ko
Pani
Percolation
Trenches 20 1 2016-17 100000
Mallan
Range
Kangra/Dharamshala/Dharamshala MOWR Har khet ko
Pani
Percolation
Trenches 20 1 2016-17 100000
D/sala
Range
Kangra/Shahpur/ shahpur MOWR Har khet ko
Pani
Percolation
Trenches 20 1 2016-17 100000
Shahpur
Range
Kangra/Kangra/ Kangra MOWR Har khet ko
Pani
Percolation
Trenches 20 1 2016-17 100000
Kangra
Range
Kangra/Kangra/ Kangra MOWR Har khet ko
Pani
Percolation
Trenches 20 1 2016-17 100000
Lapiana
Range
Total (17.4) = 100 5 500000
17.5 Kangra/Nagrota/ Nagrota MOWR Har khet ko
Pani
Other
Ground
Water
Recharge
0 0 2016-17 0 Mallan
Range
Kangra/Dharamshala/Dharamshala MOWR Har khet ko
Pani
Other
Ground
Water
Recharge
0 0 2016-17 0 D/sala
Range
Kangra/Shahpur/ shahpur MOWR Har khet ko
Pani
Other
Ground
Water
Recharge
0 0 2016-17 0 Shahpur
Range
Kangra/Kangra/ Kangra MOWR Har khet ko
Pani
Other
Ground
Water
Recharge
0 0 2016-17 0 Kangra
Range

249 | P a g e
Kangra/Kangra/ Kangra MOWR Har khet ko
Pani
Other
Ground
Water
Recharge
1 3 2016-17 100000 Lapiana
Range
Total (17.5) = 1 3 100000
17.6 Kangra/Nagrota/ Nagrota MOWR Har khet ko
Pani
Fishery
Ponds/
Water
Ponds
0 0 2016-17 0 Mallan
Range
Kangra/Dharamshala/Dharamshala MOWR Har khet ko
Pani
Fishery
Ponds/
Water
Ponds
0 0 2016-17 0 D/sala
Range
Kangra/Shahpur/ shahpur MOWR Har khet ko
Pani
Fishery
Ponds/
Water
Ponds
0 0 2016-17 0 Shahpur
Range
Kangra/Kangra/ Kangra MOWR Har khet ko
Pani
Fishery
Ponds/
Water
Ponds
1 2 2016-17 400000 Kangra
Range
Kangra/Kangra/ Kangra MOWR Har khet ko
Pani
Fishery
Ponds/
Water
Ponds
0 0 2016-17 0 Lapiana
Range
Total (17.6) = 1 2 0 400000
18 Renovated WHS
18.1 Dharamshala Distt. Kangra MOWR Farm Ponds 0 0 2016-17 0
Total (18.1) = 0 0 0
18.2 Kangra/Nagrota/ Nagrota MOWR Check
Dams 0 0 2016-17 0
Mallan
Range
Kangra/Dharamshala/Dharamshala MOWR
Check
Dams
(conctrete)
0 0 2016-17 0 D/sala
Range

250 | P a g e
Kangra/Shahpur/ shahpur MOWR Check
Dams 0 0 2016-17 0
Shahpur
Range
Kangra/Kangra/ Kangra MOWR
Check
Dams
(conctrete)
1 3 2016-17 100000 Kangra
Range
Kangra/Kangra/ Kangra MOWR Check
Dams 0 0 2016-17 0
Lapiana
Range
Total (18.2) = 1 3 0 100000
18.3 Kangra/Nagrota/ Nagrota MOWR Nalla Bunds 0 0 2016-17 0 Mallan
Range
Kangra/Dharamshala/Dharamshala MOWR Nalla Bunds 1 2 2016-17 15000 D/sala
Range
Kangra/Shahpur/ shahpur MOWR Nalla Bunds 0 0 2016-17 0 Shahpur
Range
Kangra/Kangra/ Kangra MOWR Nalla Bunds 1 2 2016-17 15000 Kangra
Range
Kangra/Kangra/ Kangra MOWR Nalla Bunds 0 0 2016-17 0 Lapiana
Range
Total (18.3) = 2 4 0 30000
18.4 Kangra/Nagrota/ Nagrota MOWR Percolation
Trenches 3 3 2016-17 15000
Mallan
Range
Kangra/Dharamshala/Dharamshala MOWR Percolation
Trenches 0 0 2016-17 0
D/sala
Range
Kangra/Shahpur/ shahpur MOWR Percolation
Trenches 3 2 2016-17 15000
Shahpur
Range
Kangra/Kangra/ Kangra MOWR Percolation
Trenches 0 0 2016-17 0
Kangra
Range
Kangra/Kangra/ Kangra MOWR Percolation
Trenches 0 0 2016-17 0
Lapiana
Range
Total (18.4) = 6 5 0 30000
18.5 Kangra/Nagrota/ Nagrota MOWR
Other
Ground
Water
Recharge
1 2 2016-17 35000 Mallan
Range

251 | P a g e
Kangra/Dharamshala/Dharamshala MOWR
Other
Ground
Water
Recharge
0 0 2016-17 0 D/sala
Range
Kangra/Shahpur/ shahpur MOWR
Other
Ground
Water
Recharge
1 3 2016-17 35000 Shahpur
Range
Kangra/Kangra/ Kangra MOWR
Other
Ground
Water
Recharge
0 0 2016-17 0 Kangra
Range
Kangra/Kangra/ Kangra MOWR
Other
Ground
Water
Recharge
0 0 2016-17 0 Lapiana
Range
Total (18.5) = 2 5 0 70000
Grand Total = 294 65 0 4880000
PMKSY -2017-18 (Dharamshala Forest Division)
Sr.
No Name of Blocks/Sub District /Tehsil
Concerned
Ministry
/Depp.
Component Activity
Total
Number/capacity
(Cum)
Command
Area/
Irrigation
potential
(Ha)
Period of
Implementati
on 5/7 years.
Estimated
Cost.
Remerks
(Ranges)
17 Newly Created WHS
17.1 Kangra/Nagrota/ Nagrota MOWR Har khet ko
Pani Farm Ponds 1 0 2017-18 150000
Mallan
Range
Kangra/Dharamshala/Dharamshala MOWR Har khet ko
Pani Farm Ponds 0 0 2017-18 0
D/sala
Range

252 | P a g e
Kangra/Shahpur/ shahpur MOWR Har khet ko
Pani Farm Ponds 1 0 2017-18 150000
Shahpur
Range
Kangra/Kangra/ Kangra MOWR Har khet ko
Pani Farm Ponds 1 0 2017-18 150000
Kangra
Range
Kangra/Kangra/ Kangra MOWR Har khet ko
Pani Farm Ponds 0 0 2017-18 0
Lapiana
Range
Total (7.1) = 3 0 0 450000
17.2 Kangra/Nagrota/ Nagrota MOWR Har khet ko
Pani
Check
Dams 10 3 2017-18 250000
Mallan
Range
Kangra/Dharamshala/Dharamshala MOWR Har khet ko
Pani
Check
Dams 10 3 2017-18 250000
D/sala
Range
Kangra/Shahpur/ shahpur MOWR Har khet ko
Pani
Check
Dams 10 3 2017-18 250000
Shahpur
Range
Kangra/Kangra/ Kangra MOWR Har khet ko
Pani
Check
Dams 10 3 2017-18 250000
Kangra
Range
Kangra/Kangra/ Kangra MOWR Har khet ko
Pani
Check
Dams 10 3 2017-18 250000
Lapiana
Range
Total (7.2) = 50 15 1250000
17.3 Kangra/Nagrota/ Nagrota MOWR Har khet ko
Pani Nalla Bunds 5 1 2017-18 75000
Mallan
Range
Kangra/Dharamshala/Dharamshala MOWR Har khet ko
Pani Nalla Bunds 5 1 2017-18 75000
D/sala
Range
Kangra/Shahpur/ shahpur MOWR Har khet ko
Pani Nalla Bunds 5 1 2017-18 75000
Shahpur
Range
Kangra/Kangra/ Kangra MOWR Har khet ko
Pani Nalla Bunds 5 1 2017-18 75000
Kangra
Range
Kangra/Kangra/ Kangra MOWR Har khet ko
Pani Nalla Bunds 5 1 2017-18 75000
Lapiana
Range
Total (17.3) = 25 5 375000
17.4 Kangra/Nagrota/ Nagrota MOWR Har khet ko
Pani
Percolation
Trenches 20 1 2017-18 100000
Mallan
Range
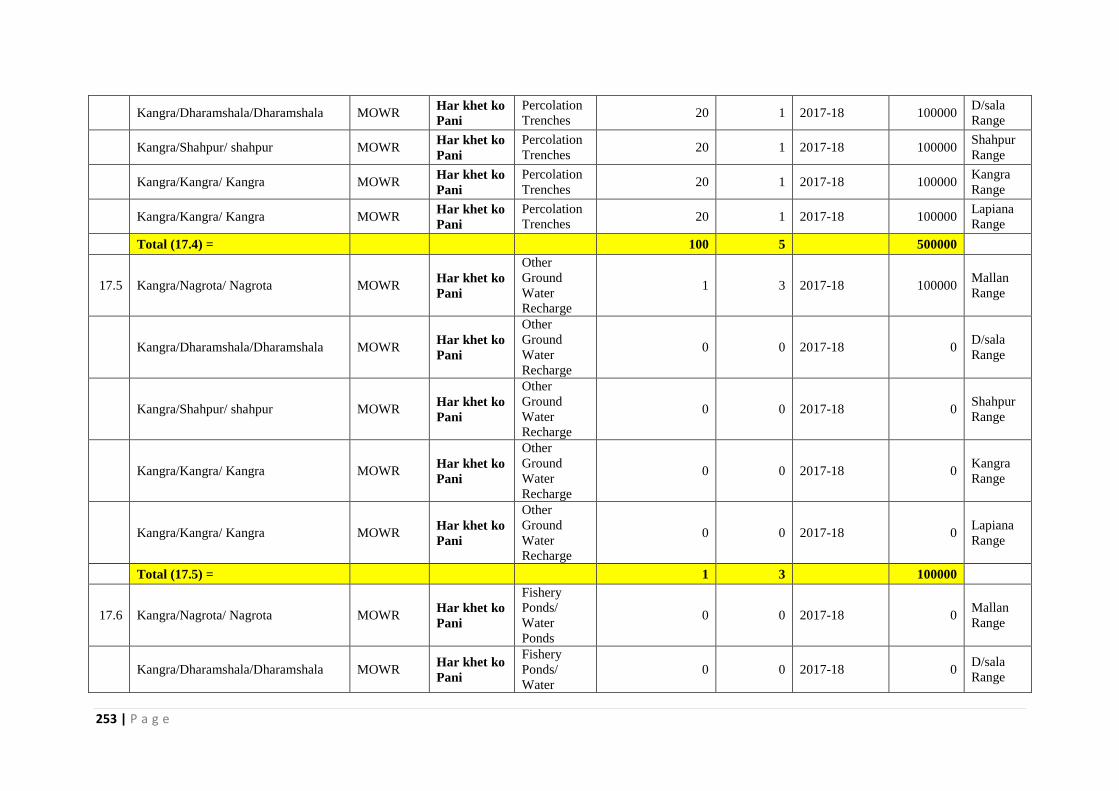
253 | P a g e
Kangra/Dharamshala/Dharamshala MOWR Har khet ko
Pani
Percolation
Trenches 20 1 2017-18 100000
D/sala
Range
Kangra/Shahpur/ shahpur MOWR Har khet ko
Pani
Percolation
Trenches 20 1 2017-18 100000
Shahpur
Range
Kangra/Kangra/ Kangra MOWR Har khet ko
Pani
Percolation
Trenches 20 1 2017-18 100000
Kangra
Range
Kangra/Kangra/ Kangra MOWR Har khet ko
Pani
Percolation
Trenches 20 1 2017-18 100000
Lapiana
Range
Total (17.4) = 100 5 500000
17.5 Kangra/Nagrota/ Nagrota MOWR Har khet ko
Pani
Other
Ground
Water
Recharge
1 3 2017-18 100000 Mallan
Range
Kangra/Dharamshala/Dharamshala MOWR Har khet ko
Pani
Other
Ground
Water
Recharge
0 0 2017-18 0 D/sala
Range
Kangra/Shahpur/ shahpur MOWR Har khet ko
Pani
Other
Ground
Water
Recharge
0 0 2017-18 0 Shahpur
Range
Kangra/Kangra/ Kangra MOWR Har khet ko
Pani
Other
Ground
Water
Recharge
0 0 2017-18 0 Kangra
Range
Kangra/Kangra/ Kangra MOWR Har khet ko
Pani
Other
Ground
Water
Recharge
0 0 2017-18 0 Lapiana
Range
Total (17.5) = 1 3 100000
17.6 Kangra/Nagrota/ Nagrota MOWR Har khet ko
Pani
Fishery
Ponds/
Water
Ponds
0 0 2017-18 0 Mallan
Range
Kangra/Dharamshala/Dharamshala MOWR Har khet ko
Pani
Fishery
Ponds/
Water
0 0 2017-18 0 D/sala
Range

254 | P a g e
Ponds
Kangra/Shahpur/ shahpur MOWR Har khet ko
Pani
Fishery
Ponds/
Water
Ponds
1 2 2017-18 300000 Shahpur
Range
Kangra/Kangra/ Kangra MOWR Har khet ko
Pani
Fishery
Ponds/
Water
Ponds
0 0 2017-18 0 Kangra
Range
Kangra/Kangra/ Kangra MOWR Har khet ko
Pani
Fishery
Ponds/
Water
Ponds
0 0 2017-18 0 Lapiana
Range
Total (17.6) = 1 2 0 300000
18 Renovated WHS
18.1 Dharamshala Distt. Kangra MOWR Farm Ponds 0 0 2017-18 0
Total (18.1) = 0 0 0
18.2 Kangra/Nagrota/ Nagrota MOWR Check
Dams 1 4 2017-18 100000
Mallan
Range
Kangra/Dharamshala/Dharamshala MOWR
Check
Dams
(conctrete)
0 0 2017-18 0 D/sala
Range
Kangra/Shahpur/ shahpur MOWR Check
Dams 1 0 2017-18 0
Shahpur
Range
Kangra/Kangra/ Kangra MOWR
Check
Dams
(conctrete)
0 3 2017-18 100000 Kangra
Range
Kangra/Kangra/ Kangra MOWR Check
Dams 0 0 2017-18 0
Lapiana
Range
Total (18.2) = 2 7 0 200000
18.3 Kangra/Nagrota/ Nagrota MOWR Nalla Bunds 0 0 2017-18 0 Mallan
Range

255 | P a g e
Kangra/Dharamshala/Dharamshala MOWR Nalla Bunds 0 0 2017-18 0 D/sala
Range
Kangra/Shahpur/ shahpur MOWR Nalla Bunds 0 0 2017-18 0 Shahpur
Range
Kangra/Kangra/ Kangra MOWR Nalla Bunds 0 0 2017-18 0 Kangra
Range
Kangra/Kangra/ Kangra MOWR Nalla Bunds 0 0 2017-18 0 Lapiana
Range
Total (18.3) = 0 0 0 0
18.4 Kangra/Nagrota/ Nagrota MOWR Percolation
Trenches 0 0 2017-18 0
Mallan
Range
Kangra/Dharamshala/Dharamshala MOWR Percolation
Trenches 0 0 2017-18 0
D/sala
Range
Kangra/Shahpur/ shahpur MOWR Percolation
Trenches 0 0 2017-18 0
Shahpur
Range
Kangra/Kangra/ Kangra MOWR Percolation
Trenches 4 2 2017-18 20000
Kangra
Range
Kangra/Kangra/ Kangra MOWR Percolation
Trenches 5 3 2017-18 25000
Lapiana
Range
Total (18.4) = 9 5 0 45000
18.5 Kangra/Nagrota/ Nagrota MOWR
Other
Ground
Water
Recharge
0 0 2017-18 0 Mallan
Range
Kangra/Dharamshala/Dharamshala MOWR
Other
Ground
Water
Recharge
1 0 2017-18 35000 D/sala
Range
Kangra/Shahpur/ shahpur MOWR
Other
Ground
Water
Recharge
0 0 2017-18 0 Shahpur
Range
Kangra/Kangra/ Kangra MOWR
Other
Ground
Water
0 0 2017-18 0 Kangra
Range

256 | P a g e
Recharge
Kangra/Kangra/ Kangra MOWR
Other
Ground
Water
Recharge
0 0 2017-18 0 Lapiana
Range
Total (18.5) = 1 0 0 35000
Grand Total = 192 42 0 3255000
PMKSY -2018-19 (Dharamshala Forest Division)
Sr.
No
Name of Blocks/Sub District
/Tehsil
Concerned
Ministry
/Depp.
Component Activity
Total
Number/capacity
(Cum)
Command
Area/
Irrigation
potential
(Ha)
Period of
Implementation
Estimated
Cost.
Remerks
(Ranges)
17 Newly Created WHS
17.1 Kangra/Nagrota/ Nagrota MOWR Har khet ko
Pani Farm Ponds 0 0 2018-19 0
Mallan
Range
Kangra/Dharamshala/Dharamshala MOWR Har khet ko
Pani Farm Ponds 1 0 2018-19 75000
D/sala
Range
Kangra/Shahpur/ shahpur MOWR Har khet ko
Pani Farm Ponds 0 0 2018-19 0
Shahpur
Range
Kangra/Kangra/ Kangra MOWR Har khet ko
Pani Farm Ponds 0 0 2018-19 0
Kangra
Range
Kangra/Kangra/ Kangra MOWR Har khet ko
Pani Farm Ponds 0 0 2018-19 0
Lapiana
Range
Total (7.1) = 1 0 0 75000
17.2 Kangra/Nagrota/ Nagrota MOWR Har khet ko
Pani
Check
Dams 10 3 2018-19 250000
Mallan
Range

257 | P a g e
Kangra/Dharamshala/Dharamshala MOWR Har khet ko
Pani
Check
Dams 10 3 2018-19 250000
D/sala
Range
Kangra/Shahpur/ shahpur MOWR Har khet ko
Pani
Check
Dams 10 3 2018-19 250000
Shahpur
Range
Kangra/Kangra/ Kangra MOWR Har khet ko
Pani
Check
Dams 10 3 2018-19 250000
Kangra
Range
Kangra/Kangra/ Kangra MOWR Har khet ko
Pani
Check
Dams 10 3 2018-19 250000
Lapiana
Range
Total (7.2) = 50 15 1250000
17.3 Kangra/Nagrota/ Nagrota MOWR Har khet ko
Pani
Nalla
Bunds 10 1 2018-19 75000
Mallan
Range
Kangra/Dharamshala/Dharamshala MOWR Har khet ko
Pani
Nalla
Bunds 10 1 2018-19 75000
D/sala
Range
Kangra/Shahpur/ shahpur MOWR Har khet ko
Pani
Nalla
Bunds 10 1 2018-19 75000
Shahpur
Range
Kangra/Kangra/ Kangra MOWR Har khet ko
Pani
Nalla
Bunds 10 1 2018-19 75000
Kangra
Range
Kangra/Kangra/ Kangra MOWR Har khet ko
Pani
Nalla
Bunds 10 1 2018-19 75000
Lapiana
Range
Total (17.3) = 50 5 375000
17.4 Kangra/Nagrota/ Nagrota MOWR Har khet ko
Pani
Percolation
Trenches 20 1 2018-19 100000
Mallan
Range
Kangra/Dharamshala/Dharamshala MOWR Har khet ko
Pani
Percolation
Trenches 20 1 2018-19 100000
D/sala
Range
Kangra/Shahpur/ shahpur MOWR Har khet ko
Pani
Percolation
Trenches 20 1 2018-19 100000
Shahpur
Range
Kangra/Kangra/ Kangra MOWR Har khet ko
Pani
Percolation
Trenches 20 1 2018-19 100000
Kangra
Range
Kangra/Kangra/ Kangra MOWR Har khet ko
Pani
Percolation
Trenches 20 1 2018-19 100000
Lapiana
Range
Total (17.4) = 100 5 500000

258 | P a g e
17.5 Kangra/Nagrota/ Nagrota MOWR Har khet ko
Pani
Other
Ground
Water
Recharge
1 4 2018-19 100000 Mallan
Range
Kangra/Dharamshala/Dharamshala MOWR Har khet ko
Pani
Other
Ground
Water
Recharge
0 0 2018-19 0 D/sala
Range
Kangra/Shahpur/ shahpur MOWR Har khet ko
Pani
Other
Ground
Water
Recharge
0 0 2018-19 0 Shahpur
Range
Kangra/Kangra/ Kangra MOWR Har khet ko
Pani
Other
Ground
Water
Recharge
0 0 2018-19 0 Kangra
Range
Kangra/Kangra/ Kangra MOWR Har khet ko
Pani
Other
Ground
Water
Recharge
0 0 2018-19 0 Lapiana
Range
Total (17.5) = 1 4 100000
17.6 Kangra/Nagrota/ Nagrota MOWR Har khet ko
Pani
Fishery
Ponds/
Water
Ponds
0 0 2018-19 0 Mallan
Range
Kangra/Dharamshala/Dharamshala MOWR Har khet ko
Pani
Fishery
Ponds/
Water
Ponds
0 0 2018-19 0 D/sala
Range
Kangra/Shahpur/ shahpur MOWR Har khet ko
Pani
Fishery
Ponds/
Water
Ponds
1 2 2018-19 300000 Shahpur
Range
Kangra/Kangra/ Kangra MOWR Har khet ko
Pani
Fishery
Ponds/
Water
Ponds
0 0 2018-19 Kangra
Range

259 | P a g e
Kangra/Kangra/ Kangra MOWR Har khet ko
Pani
Fishery
Ponds/
Water
Ponds
0 0 2018-19 0 Lapiana
Range
Total (17.6) = 1 2 0 300000
18 Renovated WHS
18.1 Dharamshala Distt. Kangra MOWR Farm Ponds 0 0 2018-19 0
Total (18.1) = 0 0 0
18.2 Kangra/Nagrota/ Nagrota MOWR Check
Dams 1 4 2018-19 100000
Mallan
Range
Kangra/Dharamshala/Dharamshala MOWR
Check
Dams
(conctrete)
0 0 2018-19 0 D/sala
Range
Kangra/Shahpur/ shahpur MOWR Check
Dams 1 0 2018-19 0
Shahpur
Range
Kangra/Kangra/ Kangra MOWR
Check
Dams
(conctrete)
0 0 2018-19 0 Kangra
Range
Kangra/Kangra/ Kangra MOWR Check
Dams 0 0 2018-19 0
Lapiana
Range
Total (18.2) = 2 4 0 100000
18.3 Kangra/Nagrota/ Nagrota MOWR Nalla
Bunds 0 0 2018-19 0
Mallan
Range
Kangra/Dharamshala/Dharamshala MOWR Nalla
Bunds 0 0 2018-19 0
D/sala
Range
Kangra/Shahpur/ shahpur MOWR Nalla
Bunds 0 0 2018-19 0
Shahpur
Range
Kangra/Kangra/ Kangra MOWR Nalla
Bunds 0 0 2018-19 0
Kangra
Range
Kangra/Kangra/ Kangra MOWR Nalla
Bunds 0 0 2018-19 0
Lapiana
Range
Total (18.3) = 0 0 0 0
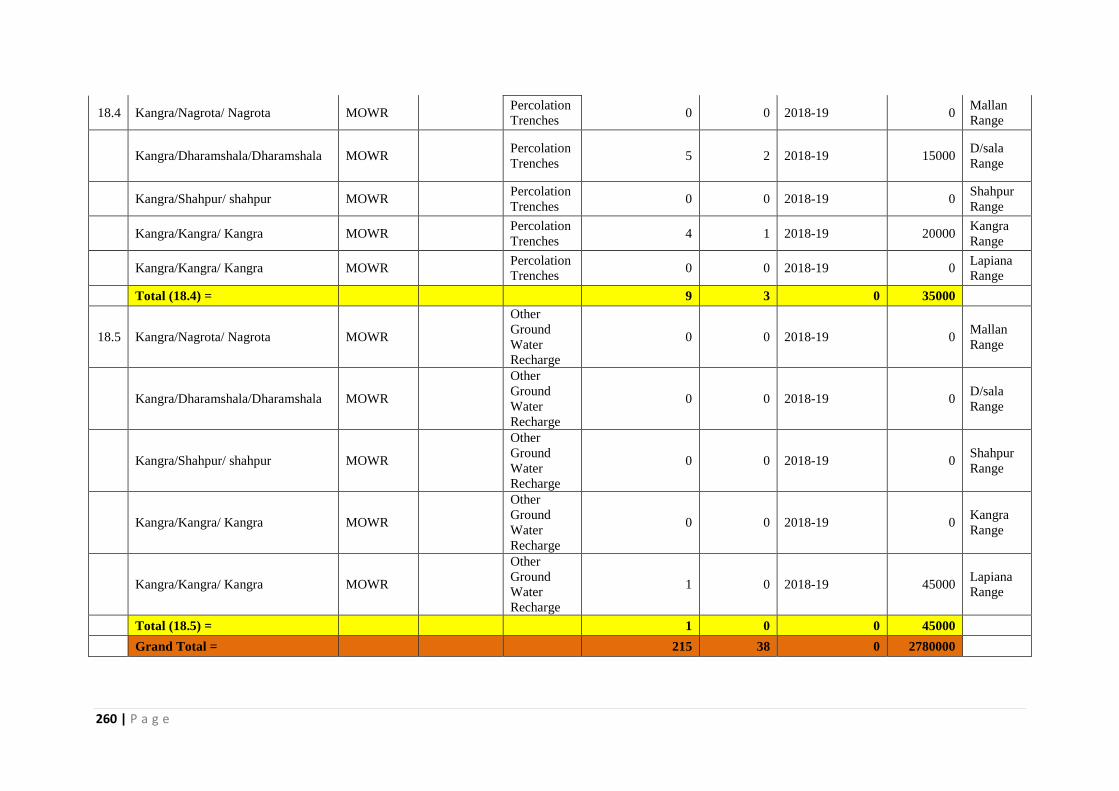
260 | P a g e
18.4 Kangra/Nagrota/ Nagrota MOWR Percolation
Trenches 0 0 2018-19 0
Mallan
Range
Kangra/Dharamshala/Dharamshala MOWR Percolation
Trenches 5 2 2018-19 15000
D/sala
Range
Kangra/Shahpur/ shahpur MOWR Percolation
Trenches 0 0 2018-19 0
Shahpur
Range
Kangra/Kangra/ Kangra MOWR Percolation
Trenches 4 1 2018-19 20000
Kangra
Range
Kangra/Kangra/ Kangra MOWR Percolation
Trenches 0 0 2018-19 0
Lapiana
Range
Total (18.4) = 9 3 0 35000
18.5 Kangra/Nagrota/ Nagrota MOWR
Other
Ground
Water
Recharge
0 0 2018-19 0 Mallan
Range
Kangra/Dharamshala/Dharamshala MOWR
Other
Ground
Water
Recharge
0 0 2018-19 0 D/sala
Range
Kangra/Shahpur/ shahpur MOWR
Other
Ground
Water
Recharge
0 0 2018-19 0 Shahpur
Range
Kangra/Kangra/ Kangra MOWR
Other
Ground
Water
Recharge
0 0 2018-19 0 Kangra
Range
Kangra/Kangra/ Kangra MOWR
Other
Ground
Water
Recharge
1 0 2018-19 45000 Lapiana
Range
Total (18.5) = 1 0 0 45000
Grand Total = 215 38 0 2780000
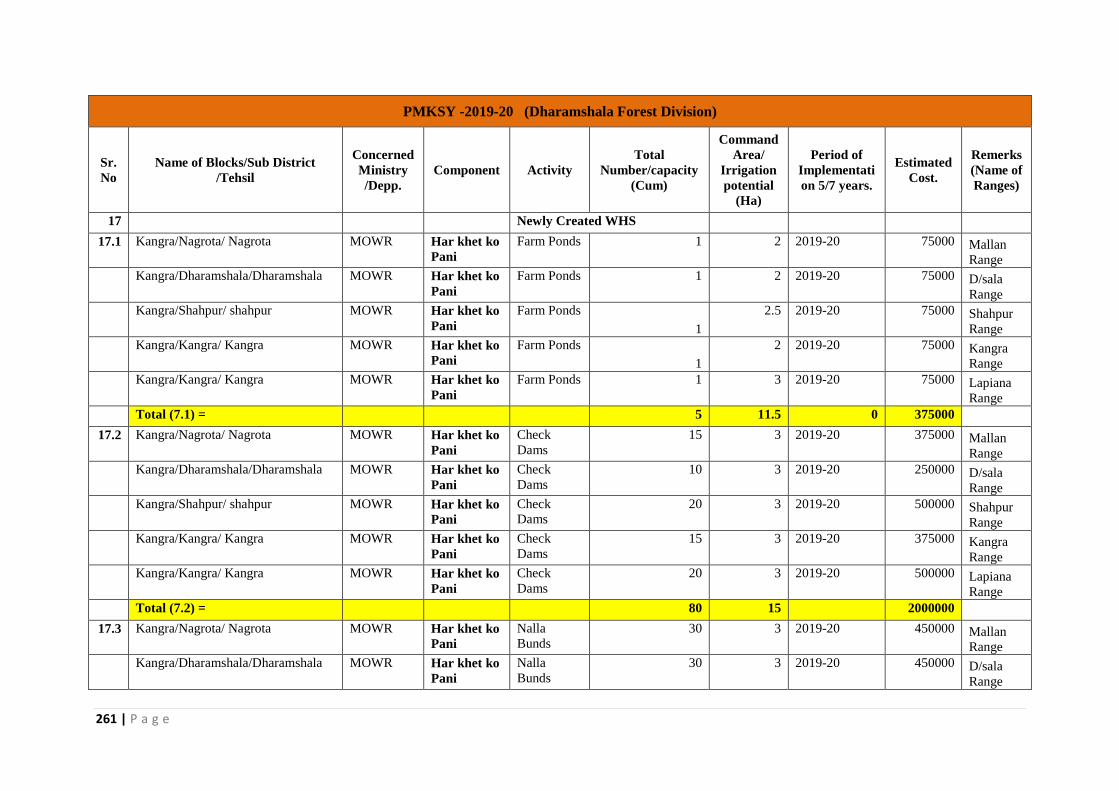
261 | P a g e
PMKSY -2019-20 (Dharamshala Forest Division)
Sr.
No
Name of Blocks/Sub District
/Tehsil
Concerned
Ministry
/Depp.
Component Activity
Total
Number/capacity
(Cum)
Command
Area/
Irrigation
potential
(Ha)
Period of
Implementati
on 5/7 years.
Estimated
Cost.
Remerks
(Name of
Ranges)
17 Newly Created WHS
17.1 Kangra/Nagrota/ Nagrota MOWR Har khet ko
Pani
Farm Ponds 1 2 2019-20 75000 Mallan
Range
Kangra/Dharamshala/Dharamshala MOWR Har khet ko
Pani
Farm Ponds 1 2 2019-20 75000 D/sala
Range
Kangra/Shahpur/ shahpur MOWR Har khet ko
Pani
Farm Ponds
1
2.5 2019-20 75000 Shahpur
Range
Kangra/Kangra/ Kangra MOWR Har khet ko
Pani
Farm Ponds
1
2 2019-20 75000 Kangra
Range
Kangra/Kangra/ Kangra MOWR Har khet ko
Pani
Farm Ponds 1 3 2019-20 75000 Lapiana
Range
Total (7.1) = 5 11.5 0 375000
17.2 Kangra/Nagrota/ Nagrota MOWR Har khet ko
Pani
Check
Dams
15 3 2019-20 375000 Mallan
Range
Kangra/Dharamshala/Dharamshala MOWR Har khet ko
Pani
Check
Dams
10 3 2019-20 250000 D/sala
Range
Kangra/Shahpur/ shahpur MOWR Har khet ko
Pani
Check
Dams
20 3 2019-20 500000 Shahpur
Range
Kangra/Kangra/ Kangra MOWR Har khet ko
Pani
Check
Dams
15 3 2019-20 375000 Kangra
Range
Kangra/Kangra/ Kangra MOWR Har khet ko
Pani
Check
Dams
20 3 2019-20 500000 Lapiana
Range
Total (7.2) = 80 15 2000000
17.3 Kangra/Nagrota/ Nagrota MOWR Har khet ko
Pani
Nalla
Bunds
30 3 2019-20 450000 Mallan
Range
Kangra/Dharamshala/Dharamshala MOWR Har khet ko
Pani
Nalla
Bunds
30 3 2019-20 450000 D/sala
Range

262 | P a g e
Kangra/Shahpur/ shahpur MOWR Har khet ko
Pani
Nalla
Bunds
40 4 2019-20 600000 Shahpur
Range
Kangra/Kangra/ Kangra MOWR Har khet ko
Pani
Nalla
Bunds
35 3.5 2019-20 525000 Kangra
Range
Kangra/Kangra/ Kangra MOWR Har khet ko
Pani
Nalla
Bunds
30 3 2019-20 450000 Lapiana
Range
Total (17.3) = 165 16.5 2475000
17.4 Kangra/Nagrota/ Nagrota MOWR Har khet ko
Pani
Percolation
Trenches
40 2 2019-20 200000 Mallan
Range
Kangra/Dharamshala/Dharamshala MOWR Har khet ko
Pani
Percolation
Trenches
40 2 2019-20 200000 D/sala
Range
Kangra/Shahpur/ shahpur MOWR Har khet ko
Pani
Percolation
Trenches
40 2 2019-20 200000 Shahpur
Range
Kangra/Kangra/ Kangra MOWR Har khet ko
Pani
Percolation
Trenches
40 2 2019-20 200000 Kangra
Range
Kangra/Kangra/ Kangra MOWR Har khet ko
Pani
Percolation
Trenches
40 2 2019-20 200000 Lapiana
Range
Total (17.4) = 200 10 1000000
17.5 Kangra/Nagrota/ Nagrota MOWR Har khet ko
Pani
Other
Ground
Water
Recharge
0 0 2019-20 0
Mallan
Range
Kangra/Dharamshala/Dharamshala MOWR Har khet ko
Pani
Other
Ground
Water
Recharge
0 0 2019-20 0
D/sala
Range
Kangra/Shahpur/ shahpur MOWR Har khet ko
Pani
Other
Ground
Water
Recharge
1 3 2019-20 100000
Shahpur
Range
Kangra/Kangra/ Kangra MOWR Har khet ko
Pani
Other
Ground
Water
Recharge
1 3 2019-20 100000
Kangra
Range

263 | P a g e
Kangra/Kangra/ Kangra MOWR Har khet ko
Pani
Other
Ground
Water
Recharge
0 0 2019-20 0
Lapiana
Range
Total (17.5) = 2 6 200000
17.6 Kangra/Nagrota/ Nagrota MOWR Har khet ko
Pani
Fishery
Ponds/
Water
Ponds
0 0 2019-20 0
Mallan
Range
Kangra/Dharamshala/Dharamshala MOWR Har khet ko
Pani
Fishery
Ponds/
Water
Ponds
1 2 2019-20 300000
D/sala
Range
Kangra/Shahpur/ shahpur MOWR Har khet ko
Pani
Fishery
Ponds/
Water
Ponds
0 0 2019-20 0
Shahpur
Range
Kangra/Kangra/ Kangra MOWR Har khet ko
Pani
Fishery
Ponds/
Water
Ponds
0 0 2019-20
Kangra
Range
Kangra/Kangra/ Kangra MOWR Har khet ko
Pani
Fishery
Ponds/
Water
Ponds
1 2 2019-20 300000
Lapiana
Range
Total (17.6) = 2 4 0 600000
18 Renovated WHS
18.1 Dharamshala Distt. Kangra MOWR Farm Ponds 0 0 2019-20 0
Total (18.1) = 0 0 0
18.2 Kangra/Nagrota/ Nagrota MOWR Check
Dams
1 4 2019-20 100000 Mallan
Range
Kangra/Dharamshala/Dharamshala MOWR Check
Dams
(conctrete)
1 4 2019-20 100000
D/sala
Range

264 | P a g e
Kangra/Shahpur/ shahpur MOWR Check
Dams
1 4 2019-20 100000 Shahpur
Range
Kangra/Kangra/ Kangra MOWR Check
Dams
(conctrete)
1 4 2019-20 100000
Kangra
Range
Kangra/Kangra/ Kangra MOWR Check
Dams
1 4 2019-20 100000 Lapiana
Range
Total (18.2) = 5 20 0 500000
18.3 Kangra/Nagrota/ Nagrota MOWR Nalla
Bunds
0 0 2019-20 0 Mallan
Range
Kangra/Dharamshala/Dharamshala MOWR Nalla
Bunds
0 0 2019-20 0 D/sala
Range
Kangra/Shahpur/ shahpur MOWR Nalla
Bunds
0 0 2019-20 0 Shahpur
Range
Kangra/Kangra/ Kangra MOWR Nalla
Bunds
0 0 2019-20 0 Kangra
Range
Kangra/Kangra/ Kangra MOWR Nalla
Bunds
0 0 2019-20 0 Lapiana
Range
Total (18.3) = 0 0 0 0
18.4 Kangra/Nagrota/ Nagrota MOWR Percolation
Trenches
0 0 2019-20 0 Mallan
Range
Kangra/Dharamshala/Dharamshala MOWR Percolation
Trenches
0 0 2019-20 0 D/sala
Range
Kangra/Shahpur/ shahpur MOWR Percolation
Trenches
1 1 2019-20 15000 Shahpur
Range
Kangra/Kangra/ Kangra MOWR Percolation
Trenches
0 0 2019-20 0 Kangra
Range
Kangra/Kangra/ Kangra MOWR Percolation
Trenches
0 0 2019-20 0 Lapiana
Range
Total (18.4) = 1 1 0 15000
18.5 Kangra/Nagrota/ Nagrota MOWR Other
Ground
Water
Recharge
0 0 2019-20 0
Mallan
Range

265 | P a g e
Kangra/Dharamshala/Dharamshala MOWR Other
Ground
Water
Recharge
1 3 2019-20 30000
D/sala
Range
Kangra/Shahpur/ shahpur MOWR Other
Ground
Water
Recharge
1 2 2019-20 30000
Shahpur
Range
Kangra/Kangra/ Kangra MOWR Other
Ground
Water
Recharge
1 1.5 2019-20 30000
Kangra
Range
Kangra/Kangra/ Kangra MOWR Other
Ground
Water
Recharge
1 2 2019-20 30000
Lapiana
Range
Total (18.5) = 4 8.5 0 120000
Grand Total = 464 92.5 0 7285000
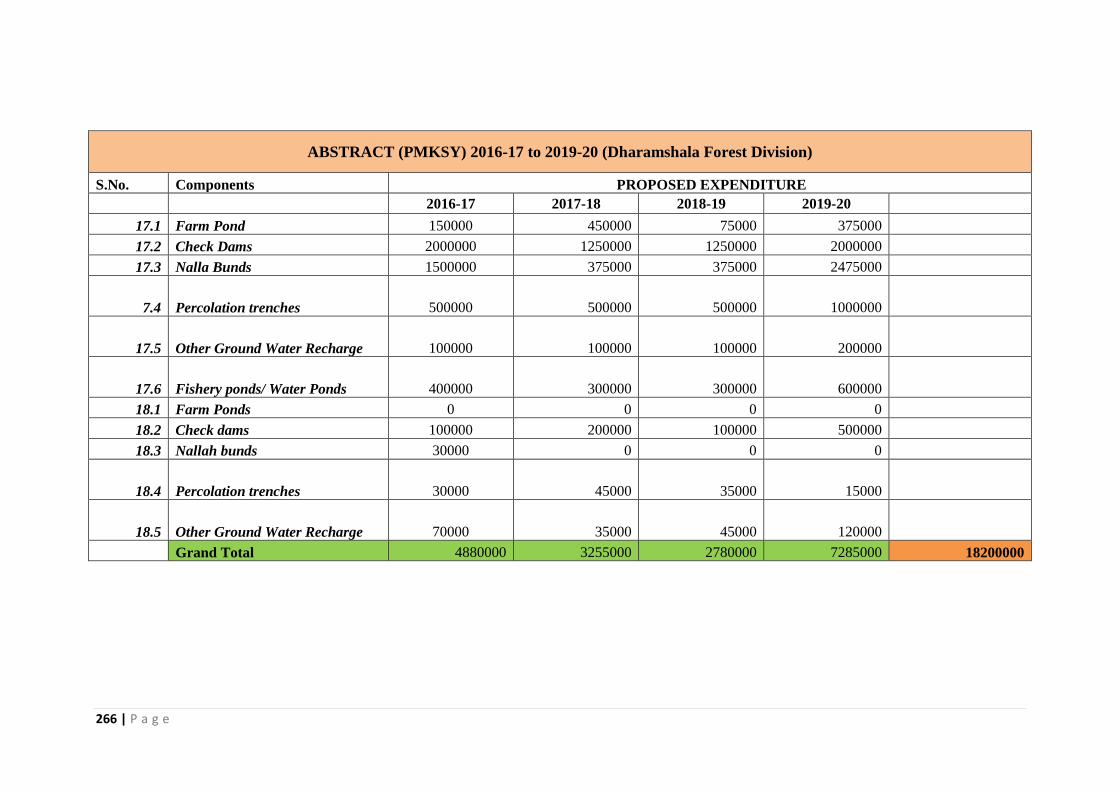
266 | P a g e
ABSTRACT (PMKSY) 2016-17 to 2019-20 (Dharamshala Forest Division)
S.No. Components PROPOSED EXPENDITURE
2016-17 2017-18 2018-19 2019-20
17.1 Farm Pond 150000 450000 75000 375000
17.2 Check Dams 2000000 1250000 1250000 2000000
17.3 Nalla Bunds 1500000 375000 375000 2475000
7.4 Percolation trenches 500000 500000 500000 1000000
17.5 Other Ground Water Recharge 100000 100000 100000 200000
17.6 Fishery ponds/ Water Ponds 400000 300000 300000 600000
18.1 Farm Ponds 0 0 0 0
18.2 Check dams 100000 200000 100000 500000
18.3 Nallah bunds 30000 0 0 0
18.4 Percolation trenches 30000 45000 35000 15000
18.5 Other Ground Water Recharge 70000 35000 45000 120000
Grand Total 4880000 3255000 2780000 7285000 18200000

267 | P a g e
DRDA (IWMP)
OFFICE OF THE DISTRICT WATERSHED DEVELOPMENT AGENCY (DWDA), KANGRA AT DHARAMSHALA
DISTRICT IRRIGATION PLAN UNDER PMKSY (IWMP) 2016-17 TO 2019-2020 (Revised )
IWMP-I to V
DISTRICT:- Kangra
Sr.No
.
Name of
Block
Concerned
Ministry/
Department
Component Activities-wise No. Capaci
ty
(cum)
Comman
d Area/
Irrigatio
n
Potential
(ha)
Period of
Impleme
n-tation
Estimated
Cost (Rs in
lac) 2016-17 2017-18 2018-19 2019-20
17 Water Harvesting Structures (Newly to be created)
17.1
Dehra
District
Watershed
Development Agency, Kangra
at Dharamshala
(MoRD)
PMKSY Water Shed
Farm Ponds 267 3610 956 4 70.76 28.30 28.30 14.15 0.00
17.2 Check Dams 264 8005 3324 4 211.48 84.59 84.59 42.30 0.00
17.3 Nalla Bandhs 0 0 0 4 0.00 0.00 0.00 0.00 0.00
17.4 Percolation Tanks 0 0 0 0 0.00 0.00 0.00 0.00 0.00
17.5
Other ground
water recharge
structure 2089 31127 14508 4 707.73 283.09 283.09 141.55 0.00
17.6
Fishry
Pond/Cattel Ponds 0 0 0 0 0.00 0.00 0.00 0.00 0.00
Sub Total 2620 42742 18788 989.97 395.99 395.99 197.99 0.00
18 Water Harvesting Structures ( to be Renovated)
18.1
PMKSY Water Shed
Farm Ponds 2 8 0 4 0.19 0.07 0.07 0.04 0.00
18.2 Check Dams 0 0 0 0 0.00 0.00 0.00 0.00 0.00
18.3 Nalla Bandhs 0 0 0 0 0.00 0.00 0.00 0.00 0.00
18.4 Percolation Tanks 0 0 0 0 0.00 0.00 0.00 0.00 0.00

268 | P a g e
18.5
Other ground
water recharge
structure 0 0 0 0 0.96 0.39 0.39 0.19 0.00
18.6
Fishry Pond/Cattel
Ponds 0 0 0 0 0.00 0.00 0.00 0.00 0.00
Sub Total 2 8 0
1.15 0.46 0.46 0.23 0.00
18.7(
A) Land Development
i)
PMKSy Water Shed
Afforestation 0 0 0 0 0.00 0.00 0.00 0.00 0.00
ii) Horticulture 0 0 1557 4 109.21 43.68 43.68 21.84 0.00
iii) Agriculture 0 0 346 4 28.52 11.41 11.41 5.70 0.00
iv) Pasture 0 0 517 4 38.74 15.49 15.49 7.75 0.00
Sub Total 0 0 2420
176.46 70.59 70.59 35.29 0.00
18.7(
B) Soil & Moisture Conservation
i)
PMKSY Water Shed
Staggered
Trenching 0 0 0 0 0.00 0.00 0.00 0.00 0.00
ii) Contour Bunding 0 0 0 0 0.00 0.00 0.00 0.00 0.00
iii) Graded Bunding 0 0 0 0 0.00 0.00 0.00 0.00 0.00
iv) Bench terrracing 0 0 0 0 0.00 0.00 0.00 0.00 0.00
v)
Others (Nalah
Bunding, etc.) 0 0 0 0 0.00 0.00 0.00 0.00 0.00
vi) Crate Wire 1345.79 0 2591 4 162.05 64.82 64.82 32.41 0.00
vii) Land leveling 110 0 124 4 9.27 3.71 3.71 1.85 0.00
Sub Total 1455.79 0 2715 4 171.31 68.53 68.53 34.26 0.00

269 | P a g e
Sr.No
.
Name of
Block
Concerned
Ministry/
Department
Component Activities-wise No. Capacity
(cum)
Comman
d Area/
Irrigatio
n
Potential
(ha)
Period of
Impleme
n-tation
Estimated
Cost (Rs in
lac) 2016-17 2017-18 2018-19 2019-20
18.7(
B)
Dehra
District
Watershed
Development Agency, Kangra
at Dharamshala
(MoRD)
Vegetative & Engg. Structure
viii)
PMKSY Water Shed
Earthen Checks 0 0 0 0 0.000 0 0 0 0
ix) Brush Wood Checks 0 0 0 0 0.000 0 0 0 0
x) Gully plugs 0 0 0 0 0.000 0 0 0 0
xi) Loose boulders 0 0 0 0 0.000 0 0 0 0
xii) Gabion structures 475 0 928 4 66.659 26.6635 26.66348 13.33174 0
xiii) Others Structures 0 0 0 0 0.000 0 0 0 0
xiv) Dry check dam 473 0 503 4 37.708 15.0832 15.0832 7.5416 0
xv) Drainage 125 0 128 4 9.610 3.844 3.844 1.922 0
xvi) Bunds repair 30 0 64 4 4.810 1.924 1.924 0.962 0
Sub Total 1103 0 1623
118.787 47.5147 47.51468 23.75734 0
Total 5181 42750 25546
1457.683 583.073 583.0731 291.5365 0
18.7
© Entry Point Activities 0 0 0 0 0.000 0 0 0 0
18.7(
D) DPR 0 0 0 0 0.000 0 0 0 0
18.7(
E) I & CB 96 2419 0 4 88.629 35.4514 35.45144 17.72572 0
18.7(
F) Livelihood 900 9652 0 4 326.313 130.525 130.525 65.26251 0
18.7(
G)
Prod. Sys. & Mirco
Enter.
Activities-wise No. Beneficiaries
Sericulutre 1 1 0 4 0.100 0.04 0.04 0.02 0
Bee Keeping 3 37 0 4 2.300 0.92 0.92 0.46 0
Poultry 3 1516 0 4 35.726 14.2904 14.2904 7.1452 0
Fishry 2 27 0 4 27.980 11.192 11.192 5.596 0
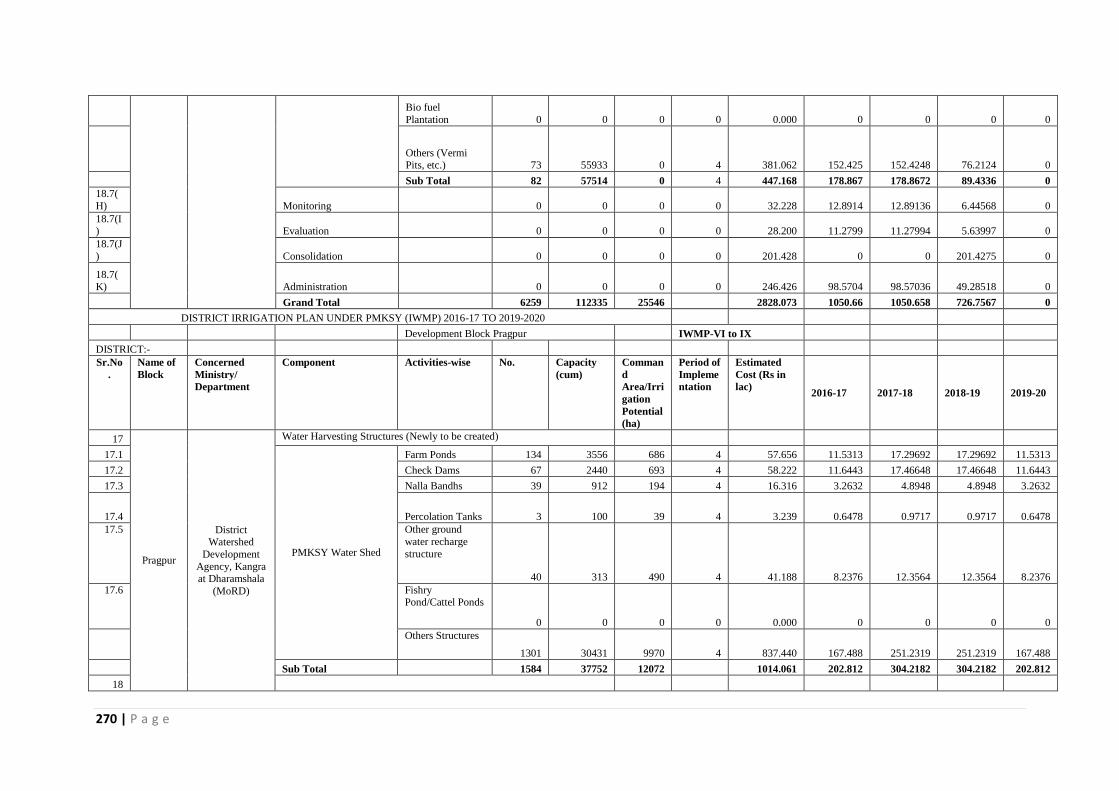
270 | P a g e
Bio fuel
Plantation 0 0 0 0 0.000 0 0 0 0
Others (Vermi Pits, etc.) 73 55933 0 4 381.062 152.425 152.4248 76.2124 0
Sub Total 82 57514 0 4 447.168 178.867 178.8672 89.4336 0
18.7(
H) Monitoring 0 0 0 0 32.228 12.8914 12.89136 6.44568 0
18.7(I) Evaluation 0 0 0 0 28.200 11.2799 11.27994 5.63997 0
18.7(J
) Consolidation 0 0 0 0 201.428 0 0 201.4275 0
18.7(K) Administration 0 0 0 0 246.426 98.5704 98.57036 49.28518 0
Grand Total 6259 112335 25546
2828.073 1050.66 1050.658 726.7567 0
DISTRICT IRRIGATION PLAN UNDER PMKSY (IWMP) 2016-17 TO 2019-2020
Development Block Pragpur IWMP-VI to IX
DISTRICT:-
Sr.No
.
Name of
Block
Concerned
Ministry/
Department
Component Activities-wise No. Capacity
(cum)
Comman
d
Area/Irri
gation
Potential
(ha)
Period of
Impleme
ntation
Estimated
Cost (Rs in
lac) 2016-17 2017-18 2018-19 2019-20
17
Pragpur
District Watershed
Development
Agency, Kangra at Dharamshala
(MoRD)
Water Harvesting Structures (Newly to be created)
17.1
PMKSY Water Shed
Farm Ponds 134 3556 686 4 57.656 11.5313 17.29692 17.29692 11.5313
17.2 Check Dams 67 2440 693 4 58.222 11.6443 17.46648 17.46648 11.6443
17.3 Nalla Bandhs 39 912 194 4 16.316 3.2632 4.8948 4.8948 3.2632
17.4 Percolation Tanks 3 100 39 4 3.239 0.6478 0.9717 0.9717 0.6478
17.5 Other ground
water recharge
structure
40 313 490 4 41.188 8.2376 12.3564 12.3564 8.2376
17.6 Fishry Pond/Cattel Ponds
0 0 0 0 0.000 0 0 0 0
Others Structures
1301 30431 9970 4 837.440 167.488 251.2319 251.2319 167.488
Sub Total 1584 37752 12072
1014.061 202.812 304.2182 304.2182 202.812
18

271 | P a g e
Water Harvesting Structures ( to be Renovated)
18.1
PMKSY Water Shed
Farm Ponds 84 1557 296 4 24.898 4.97964 7.46946 7.46946 4.97964
18.2 Check Dams 0 0 0 4 0.000 0 0 0 0
18.3 Nalla Bandhs 0 0 0 4 0.000 0 0 0 0
18.4
Percolation
Tanks 0 0 0 0 0.000 0 0 0 0
18.5 Other ground water recharge
structure
10 265 99 4 8.305 1.661 2.4915 2.4915 1.661
18.6 Fishry Pond/Cattel
Ponds 0 0 0 0 0.000 0 0 0 0
Others
Structures 257 7387 1796 4 150.906 30.1812 45.27175 45.27175 30.1812
Sub Total 351 9209 2192
184.109 36.8218 55.23271 55.23271 36.8218
18.7(A)
Land Development
i)
PMKSY Water Shed
Afforestation
0 0 120 4 10.100 2.02 3.03 3.03 2.02
ii) Horticulture 0 0 0 0 0.000 0 0 0 0
iii) Agriculture 0 0 0 0 0.000 0 0 0 0
iv) Pasture 0 0 54 4 4.571 0.91416 1.37124 1.37124 0.91416
Sub Total 0 0 175
14.671 2.93416 4.40124 4.40124 2.93416
18.7(
B)
Soil & Moisture Conservation
i)
PMKSY Water Shed
Staggered
Trenching 0 0 37 4 3.107 0.6214 0.9321 0.9321 0.6214
ii) Contour Bunding
0 0 0 0 0.000 0 0 0 0
iii) Graded
Bunding 0 0 84 4 7.018 1.40364 2.105466 2.105466 1.40364
iv) Bench
terrracing 0 0 0 0 0.000 0 0 0 0
v)
Others (Nalah
Bunding, etc.) 0 0 0 0 0.000 0 0 0 0
vi) Crate Wire 0 0 0 0 0.000 0 0 0 0
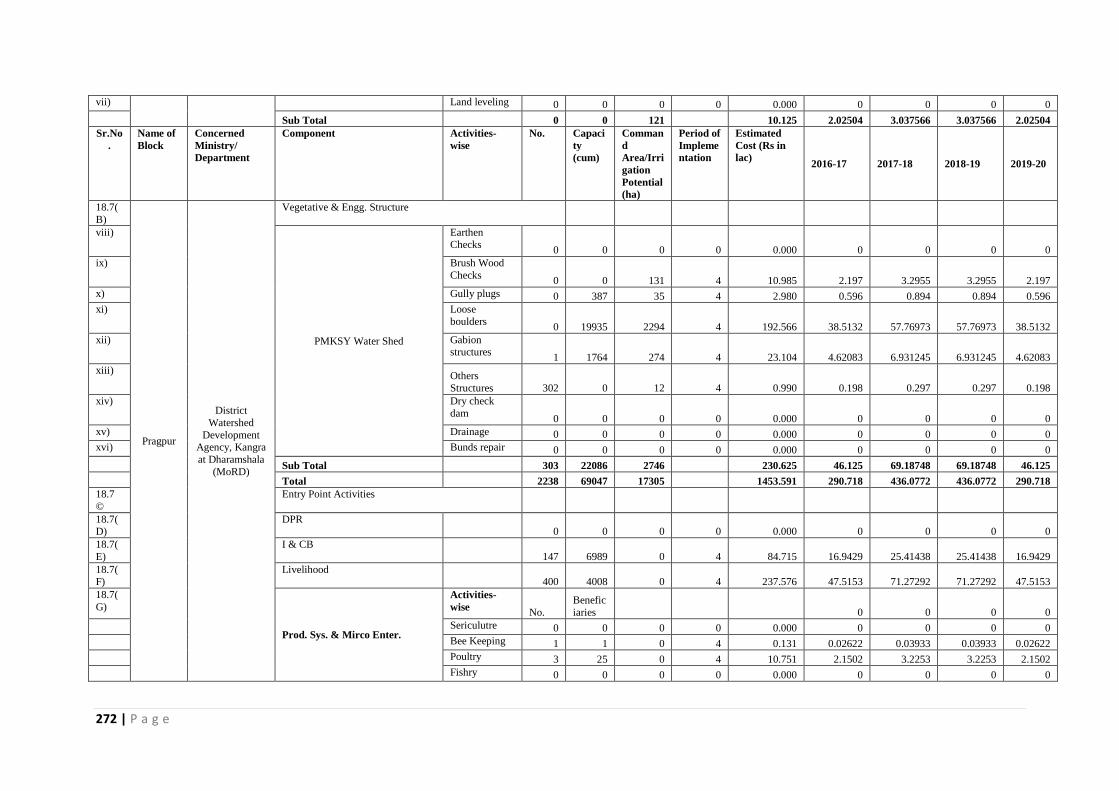
272 | P a g e
vii) Land leveling 0 0 0 0 0.000 0 0 0 0
Sub Total 0 0 121 10.125 2.02504 3.037566 3.037566 2.02504
Sr.No
.
Name of
Block
Concerned
Ministry/
Department
Component Activities-
wise
No. Capaci
ty
(cum)
Comman
d
Area/Irri
gation
Potential
(ha)
Period of
Impleme
ntation
Estimated
Cost (Rs in
lac) 2016-17 2017-18 2018-19 2019-20
18.7(
B)
Pragpur
District
Watershed
Development Agency, Kangra
at Dharamshala
(MoRD)
Vegetative & Engg. Structure
viii)
PMKSY Water Shed
Earthen Checks
0 0 0 0 0.000 0 0 0 0
ix) Brush Wood
Checks 0 0 131 4 10.985 2.197 3.2955 3.2955 2.197
x) Gully plugs 0 387 35 4 2.980 0.596 0.894 0.894 0.596
xi) Loose
boulders 0 19935 2294 4 192.566 38.5132 57.76973 57.76973 38.5132
xii) Gabion structures
1 1764 274 4 23.104 4.62083 6.931245 6.931245 4.62083
xiii) Others
Structures 302 0 12 4 0.990 0.198 0.297 0.297 0.198
xiv) Dry check
dam 0 0 0 0 0.000 0 0 0 0
xv) Drainage 0 0 0 0 0.000 0 0 0 0
xvi) Bunds repair 0 0 0 0 0.000 0 0 0 0
Sub Total 303 22086 2746
230.625 46.125 69.18748 69.18748 46.125
Total 2238 69047 17305
1453.591 290.718 436.0772 436.0772 290.718
18.7
©
Entry Point Activities
18.7(D)
DPR 0 0 0 0 0.000 0 0 0 0
18.7(
E)
I & CB
147 6989 0 4 84.715 16.9429 25.41438 25.41438 16.9429
18.7(F)
Livelihood 400 4008 0 4 237.576 47.5153 71.27292 71.27292 47.5153
18.7(
G)
Prod. Sys. & Mirco Enter.
Activities-
wise No.
Benefic
iaries
0 0 0 0
Sericulutre 0 0 0 0 0.000 0 0 0 0
Bee Keeping 1 1 0 4 0.131 0.02622 0.03933 0.03933 0.02622
Poultry 3 25 0 4 10.751 2.1502 3.2253 3.2253 2.1502
Fishry 0 0 0 0 0.000 0 0 0 0

273 | P a g e
Bio fuel
Plantation 0 0 0 0 0.000 0 0 0 0
Others (Vermi Pits, etc.)
72 10173 0 4 257.954 51.5909 77.38629 77.38629 51.5909
Sub Total 76 10199 0
268.836 53.7673 80.65092 80.65092 53.7673
18.7(
H)
Monitoring
0 0 0 0 25.008 5.0016 7.5024 7.5024 5.0016
18.7(I)
Evaluation 0 0 0 0 21.882 4.3764 6.5646 6.5646 4.3764
18.7(J
)
Consolidation
0 0 0 0 93.780 0 0 0 93.78
18.7(K)
Administration 0 0 0 0 225.072 45.0144 67.5216 67.5216 45.0144
Grand Total 2861 90243 17305 2410.460 463.336 695.004 695.004 557.116
DISTRICT IRRIGATION PLAN UNDER PMKSY (IWMP) 2016-17 TO 2019-20
Development Block Indora
IWMP-X and XVI
District : Kangra
Sr.No
.
Name of
Block
Concerned
Ministry/
Department
Component Activities-
wise
No. Capaci
ty
(cum)
Comman
d
Area/Irri
gation
Potential
(ha)
Period of
Impleme
ntation
Estimated
Cost (Rs in
lac) 2016-17 2017-18 2018-19 2019-20
17
Indora
District
Watershed
Development Agency, Kangra
at Dharamshala
(MoRD)
Water Harvesting Structures (Newly to be created)
17.1
PMKSY Water Shed
Farm Ponds 21 2081 476 4 40.017 8.0034 12.0051 12.0051 8.0034
17.2 Check Dams 37 26104 1554 4 130.518 26.1035 39.15525 39.15525 26.1035
17.3 Nalla Bandhs 0 0 0 0 0.000 0 0 0 0
17.4 Percolation Tanks 0 0 0 0 0.000 0 0 0 0
17.5
Other ground
water recharge
structure 0 0 0 0 0.000 0 0 0 0
17.6
Fishry
Pond/Cattel
Ponds 0 0 0 0 0.000 0 0 0 0
Others (Percolation
tanks, etc.) 2141 8390 3772 4 316.847 63.3694 95.05407 95.05407 63.3694
Sub Total 2199 36574 5802 4 487.381 97.4763 146.2144 146.2144 97.4763

274 | P a g e
18 Water Harvesting Structures ( to be Renovated)
18.1
PMKSY Water Shed
Farm Ponds 5 663 152 4 12.748 2.5496 3.8244 3.8244 2.5496
18.2 Check Dams 0 0 0 0 0.000 0 0 0 0
18.3 Nalla Bandhs 0 0 0 0 0.000 0 0 0 0
18.4
Percolation
Tanks 0 0 0 0 0.000 0 0 0 0
18.5
Other ground water recharge
structure 0 0 0 0 0.000 0 0 0 0
18.6
Fishry Pond/Cattel
Ponds 0 0 0 0 0.000 0 0 0 0
Others
(Percolation tanks, etc.)
6 119 54 4 4.500 0.9 1.35 1.35 0.9
Sub Total 11 782 205
17.248 3.4496 5.1744 5.1744 3.4496
18.7(
A) Land Development
i)
PMKSY Water Shed
Afforestation 0 0 280 4 23.554 4.71074 7.06611 7.06611 4.71074
ii) Horticulture 0 0 754 4 63.350 12.67 19.005 19.005 12.67
iii) Agriculture 0 0 110 4 9.200 1.84 2.76 2.76 1.84
iv) Pasture 0 0 48 4 4.000 0.8 1.2 1.2 0.8
Sub Total 0 0 1192
100.104 20.0207 30.03111 30.03111 20.0207
18.7(
B) Soil & Moisture Conservation
i)
PMKSY Water Shed
Staggered
Trenching 2 0 4 4 0.300 0.06 0.09 0.09 0.06
ii) Contour Bunding 0 0 0 0 0.000 0 0 0 0
iii)
Graded
Bunding 0 0 0 0 0.000 0 0 0 0
iv)
Bench
terrracing 0 0 0 0 0.000 0 0 0 0
v) Others (Nala Bunds, etc.) 0 0 911 4 76.552 15.3103 22.96549 22.96549 15.3103
vi) Crate Wire 0 0 0 0 0.000 0 0 0 0
vii) Land leveling 0 0 0 0 0.000 0 0 0 0
Sub Total 2 0 915 76.852 15.3703 23.05549 23.05549 15.3703

275 | P a g e
Sr.No
.
Name of
Block
Concerned
Ministry/
Department
Component Activities-
wise
No. Capaci
ty
(cum)
Comman
d Area/
Irrigatio
n
Potential
(ha)
Period of
Impleme
ntation
Estimated
Cost (Rs in
lac) 2016-17 2017-18 2018-19 2019-20
18.7(
B)
Indora
District
Watershed
Development
Agency, Kangra
at Dharamshala
(MoRD)
Vegetative & Engg. Structure
viii)
PMKSY Water Shed
Earthen
Checks 0 0 0 0 0.000 0 0 0 0
ix)
Brush Wood
Checks 12 220 13 4 1.100 0.22 0.33 0.33 0.22
x) Gully plugs 5008 12188 1125 4 94.480 18.8961 28.34414 28.34414 18.8961
xi)
Loose
boulders 12 330 38 4 3.200 0.64 0.96 0.96 0.64
xii)
Gabion
structures 62 476 620 4 52.050 10.41 15.615 15.615 10.41
xiii) Others structures 4 0 5 4 0.400 0.08 0.12 0.12 0.08
xiv)
Dry check
dam 0 0 0 0 0.000 0 0 0 0
xv) Drainage 0 0 0 0 0.000 0 0 0 0
xvi) Bunds repair 0 0 0 0 0.000 0 0 0 0
Sub Total 5098 13214 1800
151.230 30.2461 45.36914 45.36914 30.2461
7310 50570 9914
832.815 166.563 249.8446 249.8446 166.563
18.7 © Entry Point Activities 0 0 0 0 0.000 0 0 0 0
18.7(
D) DPR 0 0 0 0 0.000 0 0 0 0
18.7(E) I & CB 106 3370 0 4 57.699 11.5398 17.30969 17.30969 11.5398
18.7(
F) Livelihood 334 4852 0 4 132.853 26.5706 39.85596 39.85596 26.5706
18.7(
G) Prod. Sys. & Mirco Enter. Activities-wise No. Bene.
0 0 0 0
PMKSY Water Shed
Sericulutre 0 0 0 0 0.000 0 0 0 0
Bee Keeping 4 6 0 0 0.600 0.12 0.18 0.18 0.12
Poultry 4 16 0 4 4.850 0.97 1.455 1.455 0.97
Fishry 4 4 0 4 0.300 0.06 0.09 0.09 0.06

276 | P a g e
Bio fuel
Plantation 0 0 0 0 0.000 0 0 0 0
Others (Vermi Pits, etc.) 76 1090 0 4 144.110 28.822 43.23306 43.23306 28.822
Sub Total 88 1116 0 4 149.860 29.972 44.95806 44.95806 29.972
18.7(
H) Monitoring 0 0 0 0 15.406 3.08112 4.62168 4.62168 3.08112
18.7(I) Evaluation 0 0 0 0 14.605 2.92098 4.38147 4.38147 2.92098
18.7(J
) Consolidation 0 0 0 0 51.021 0 0 0 51.021
18.7(K) Administration 0 0 0 0 138.650 27.7301 41.59512 41.59512 27.7301
Grand Total 7838 59908 9914 40 1392.909 268.378 402.5665 402.5665 319.399
DISTRICT IRRIGATION PLAN UNDER PMKSY (IWMP) 2016-17 TO 2019-2020
Development Block
Lambagaon
IWMP-XI
DISTRICT:- Sr.No
.
Name of
Block
Concerned
Ministry/
Department
Component Activities-wise No. Capacity
(cum)
Com
mand
Area/Irrigati
on
Potential
(ha)
Period of
Impleme
ntation
Estimated
Cost (Rs in
lac)
2016-17 2017-18 2018-19 2019-20
17
Lambagaon
District
Watershed
Development
Agency,
Kangra at
Dharamsh
ala
(MoRD)
Water Harvesting Structures (Newly to be created)
17.1
PMKSY Water Shed
Farm Ponds 18 615 93 4 7.851 1.5702 2.3553 2.3553 1.5702
17.2 Check Dams 34 1949 615 4 51.673 10.3346 15.50194 15.50194 10.3346
17.3 Nalla Bandhs 0 0 0 4 0.000 0 0 0 0
17.4
Percolation
Tanks 0 0 0 0 0.000 0 0 0 0
17.5
Other ground water recharge
structure 0 0 0 0 0.000 0 0 0 0
17.6
Fishry
Pond/Cattel Ponds 0 0 0 0 0.000 0 0 0 0

277 | P a g e
Others
recharge
Structes 238 4432 1787 4 150.110 30.022 45.03304 45.03304 30.022
Sub Total 290 6996 2496
209.634 41.9269 62.89028 62.89028 41.9269
18 Water Harvesting Structures ( to be Renovated)
18.1
PMKSY Water Shed
Farm Ponds 20 258 0 4 4.958 0.9916 1.4874 1.4874 0.9916
18.2 Check Dams 0 0 0 0 0.000 0 0 0 0
18.3 Nalla Bandhs 0 0 0 0 0.000 0 0 0 0
18.4
Percolation
Tanks 0 0 0 0 0.000 0 0 0 0
18.5
Other ground
water recharge structure 0 0 0 0 0.000 0 0 0 0
18.6
Fishry
Pond/Cattel
Ponds 0 0 0 0 0.000 0 0 0 0
Others recharge
Structes 60 735 0 4 31.062 6.2124 9.3186 9.3186 6.2124
Sub Total 80 993 0
36.020 7.204 10.806 10.806 7.204
18.7(A) Land Development
i)
PMKSY Water Shed
Afforestation 0 0 67 4 5.674 1.1348 1.7022 1.7022 1.1348
ii) Horticulture 0 0 0 4 0.000 0 0 0 0
iii) Agriculture 0 0 0 4 0.000 0 0 0 0
iv) Pasture 0 0 62 4 5.247 1.0494 1.5741 1.5741 1.0494
Sub Total 0 0 129
10.921 2.1842 3.2763 3.2763 2.1842
18.7(B) Soil & Moisture Conservation
i)
PMKSY Water Shed
Staggered
Trenching 0 0 0 0 0.000 0 0 0 0
ii)
Contour
Bunding 0 0 0 0 0.000 0 0 0 0
iii) Graded Bunding 0 0 0 0 0.000 0 0 0 0
iv)
Bench
terrracing 0 0 0 0 0.000 0 0 0 0

278 | P a g e
v)
Others (Nala
Bunds, etc.) 0 0 0 0 0.000 0 0 0 0
vi) Crate Wire 0 0 0 0 0.000 0 0 0 0
vii) Land leveling 0 0 0 0 0.000 0 0 0 0
Sub Total 0 0 0
0.000 0 0 0 0
Sr.No.
Name of Block
Concerne
d
Ministry/
Departme
nt
Component Activities-wise No. Capacity (cum)
Command
Area/I
rrigation
Potent
ial (ha)
Period of Impleme
ntation
Estimated Cost (Rs in
lac)
2016-17 2017-18 2018-19 2019-20
18.7(
B)
Lambagaon
District
Watershed
Development
Agency,
Kangra at Dharamsh
ala
(MoRD)
Vegetative & Engg. Structure
viii)
PMKSY Water Shed
Earthen
Checks 0 0 0 0 0.000 0 0 0 0
ix) Brush Wood Checks 0 0 0 0 0.000 0 0 0 0
x) Gully plugs 0 0 0 0 0.000 0 0 0 0
xi)
Loose
boulders 0 9066 1077 4 90.431 18.0862 27.1293 27.1293 18.0862
xii) Gabion structures 0 0 0 0 0.000 0 0 0 0
xiii)
Others
Structures 0 0 0 0 0.000 0 0 0 0
xiv) Dry check dam 0 0 0 0 0.000 0 0 0 0
xv) Drainage 0 0 0 0 0.000 0 0 0 0
xvi) Bunds repair 0 0 0 0 0.000 0 0 0 0
Sub Total 0 9066 1077
90.431 18.0862 27.1293 27.1293 18.0862
Total 370 17055 3701
347.006 69.4013 104.1019 104.1019 69.4013
18.7 © Entry Point Activities 0 0 0 0 0.000 0 0 0 0
18.7(
D) DPR 0 0 0 0 0.000 0 0 0 0
18.7(E) I & CB 16 405 0 4 20.223 4.04468 6.067014 6.067014 4.04468
18.7(
F) Livelihood 158 1896 0 4 56.715 11.343 17.0145 17.0145 11.343
18.7(
G) Prod. Sys. & Mirco Enter.
Activities-wise No.
Beneficiari
es
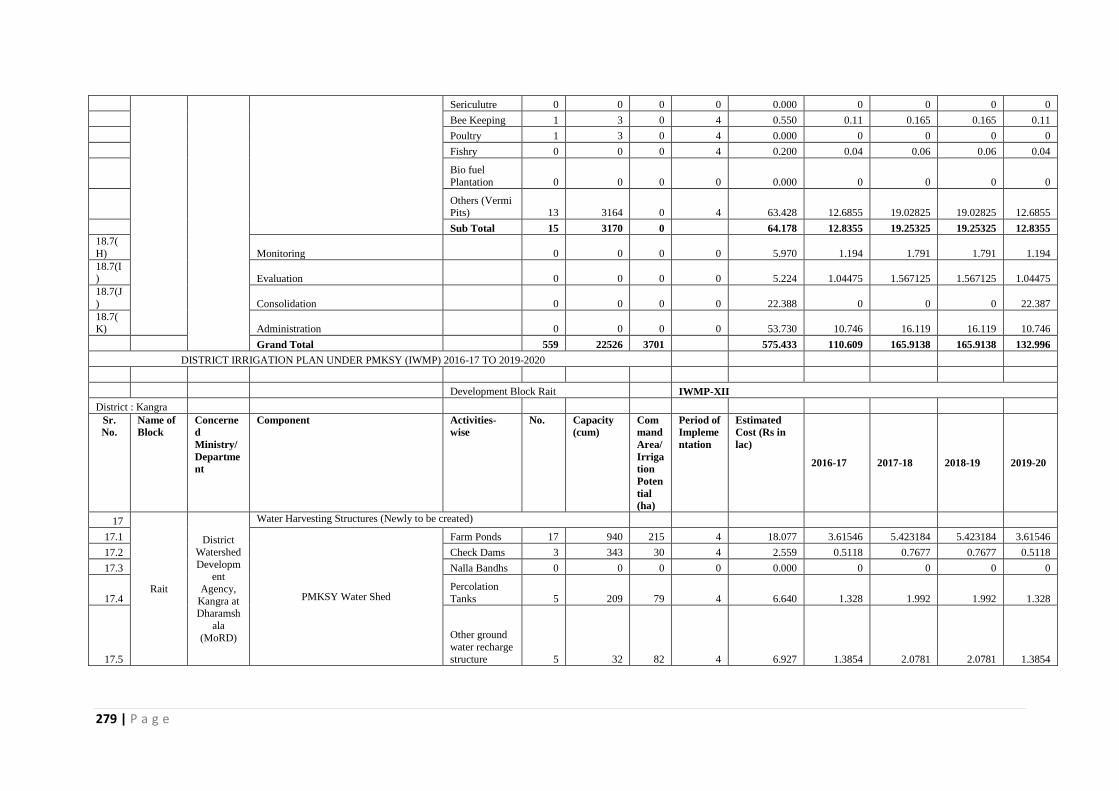
279 | P a g e
Sericulutre 0 0 0 0 0.000 0 0 0 0
Bee Keeping 1 3 0 4 0.550 0.11 0.165 0.165 0.11
Poultry 1 3 0 4 0.000 0 0 0 0
Fishry 0 0 0 4 0.200 0.04 0.06 0.06 0.04
Bio fuel
Plantation 0 0 0 0 0.000 0 0 0 0
Others (Vermi Pits) 13 3164 0 4 63.428 12.6855 19.02825 19.02825 12.6855
Sub Total 15 3170 0
64.178 12.8355 19.25325 19.25325 12.8355
18.7(
H) Monitoring 0 0 0 0 5.970 1.194 1.791 1.791 1.194
18.7(I) Evaluation 0 0 0 0 5.224 1.04475 1.567125 1.567125 1.04475
18.7(J
) Consolidation 0 0 0 0 22.388 0 0 0 22.387
18.7(K) Administration 0 0 0 0 53.730 10.746 16.119 16.119 10.746
Grand Total 559 22526 3701
575.433 110.609 165.9138 165.9138 132.996
DISTRICT IRRIGATION PLAN UNDER PMKSY (IWMP) 2016-17 TO 2019-2020
Development Block Rait
IWMP-XII
District : Kangra
Sr.
No.
Name of
Block
Concerne
d
Ministry/
Departme
nt
Component Activities-
wise
No. Capacity
(cum)
Com
mand
Area/
Irriga
tion
Poten
tial
(ha)
Period of
Impleme
ntation
Estimated
Cost (Rs in
lac)
2016-17 2017-18 2018-19 2019-20
17
Rait
District
Watershed
Development
Agency,
Kangra at Dharamsh
ala
(MoRD)
Water Harvesting Structures (Newly to be created)
17.1
PMKSY Water Shed
Farm Ponds 17 940 215 4 18.077 3.61546 5.423184 5.423184 3.61546
17.2 Check Dams 3 343 30 4 2.559 0.5118 0.7677 0.7677 0.5118
17.3 Nalla Bandhs 0 0 0 0 0.000 0 0 0 0
17.4
Percolation
Tanks 5 209 79 4 6.640 1.328 1.992 1.992 1.328
17.5
Other ground
water recharge
structure 5 32 82 4 6.927 1.3854 2.0781 2.0781 1.3854

280 | P a g e
17.6
Fishry
Pond/Cattel Ponds
0 0 0 0 0.000 0 0 0 0
Others
recharge Structes 181 5868 2678 4 224.951 44.9902 67.48529 67.48529 44.9902
Sub Total 211 7392 3085
259.154 51.8308 77.74627 77.74627 51.8308
18 Water Harvesting Structures ( to be Renovated)
18.1
PMKSY Water Shed
Farm Ponds 0 0 0 0 0.000 0 0 0 0
18.2 Check Dams 0 0 0 0 0.000 0 0 0 0
18.3 Nalla Bandhs 0 0 0 0 0.000 0 0 0 0
18.4 Percolation Tanks 0 0 0 0 0.000 0 0 0 0
18.5
Other ground
water recharge
structure 0 0 0 0 0.000 0 0 0 0
18.6
Fishry
Pond/Cattel
Ponds 0 0 0 0 0.000 0 0 0 0
Others
recharge Structes 0 0 0 0 0.000 0 0 0 0
Sub Total 0 0 0
0.000 0 0 0 0
18.7(
A) Land Development
i)
PMKSY Water Shed
Afforestation 0 0 280 4 23.587 4.71743 7.076142 7.076142 4.71743
ii) Horticulture 0 0 236 4 19.871 3.9742 5.9613 5.9613 3.9742
iii) Agriculture 0 0 29 4 2.362 0.4724 0.7086 0.7086 0.4724
iv) Pasture 0 0 0 4 0.062 0.0124 0.0186 0.0186 0.0124
Sub Total 0 0 546 4 45.882 9.17643 13.76464 13.76464 9.17643
18.7(
B) Soil & Moisture Conservation
i) PMKSY Water Shed
Staggered Trenching 0 0 0 0 0.000 0 0 0 0
ii)
Contour
Bunding 0 0 0 0 0.000 0 0 0 0

281 | P a g e
iii)
Graded
Bunding 0 0 0 0 0.000 0 0 0 0
iv)
Bench
terrracing 0 0 0 0 0.000 0 0 0 0
v) Others (Nala Bunds, etc.) 0 0 0 0 0.000 0 0 0 0
vi) Crate Wire 0 0 0 0 0.000 0 0 0 0
vii) Land leveling 0 0 0 0 0.000 0 0 0 0
Sub Total 0 0 0
0.000 0 0 0 0
Sr.No
.
Name of
Block
Concerne
d
Ministry/
Departme
nt
Component Activities-
wise
No. Capacity
(cum)
Com
mand
Area/
Irriga
tion
Poten
tial
(ha)
Period of
Impleme
ntation
Estimated
Cost (Rs in
lac)
2016-17 2017-18 2018-19 2019-20
18.7(
B)
Rait
District
Watershed
Development
Agency,
Kangra at Dharamsh
ala
(MoRD)
Vegetative & Engg. Structure
viii)
PMKSY Water Shed
Earthen
Checks 0 0 0 0 0.000 0 0 0 0
ix) Brush Wood Checks 0 0 0 0 0.000 0 0 0 0
x) Gully plugs 0 0 0 0 0.000 0 0 0 0
xi)
Loose
boulders 1457 10059 1452 4 122.083 24.4167 36.625 36.625 24.4167
xii)
Gabion
structures 0 0 0 0 0.000 0 0 0 0
xiii) Others Structures 2 0 7 4 1.000 0.2 0.3 0.3 0.2
xiv)
Dry check
dam 0 0 0 0 0.000 0 0 0 0
xv) Drainage 0 0 0 0 0.000 0 0 0 0
xvi) Bunds repair 0 0 0 0 0.000 0 0 0 0
Sub Total 1459 10059 1459
123.083 24.6167 36.925 36.925 24.6167
Total 1670 17451 5090
428.120 85.6239 128.4359 128.4359 85.6239
18.7 © Entry Point Activities 0 0 0 0 0.000 0 0 0 0
18.7(
D) DPR 0 0 0 0 0.000 0 0 0 0
18.7( I & CB 60 1800 0 4 33.860 6.77193 10.1579 10.1579 6.77193

282 | P a g e
E)
18.7(
F) Livelihood 190 2760 0 4 68.519 13.7037 20.55555 20.55555 13.7037
18.7(G)
Prod. Sys. & Mirco Enter.
Activities-wise No. Beneficiaries
0 0 0
Sericulutre 0 0 0 0 0.000 0 0 0 0
Bee Keeping 4 4 0 4 0.600 0.12 0.18 0.18 0.12
Poultry 4 52 0 4 9.570 1.914 2.871 2.871 1.914
Fishry 4 4 0 4 0.240 0.048 0.072 0.072 0.048
Bio fuel
Plantation 0 0 0 0 0.000 0 0 0 0
Others (Vermi Pits) 14 307 0 4 66.170 13.2339 19.85085 19.85085 13.2339
Sub Total 26 367 0
76.580 15.3159 22.97385 22.97385 15.3159
18.7(
H) Monitoring 0 0 0 0 6.449 1.28976 1.93464 1.93464 1.28976
18.7(I) Evaluation 0 0 0 0 5.643 1.12854 1.69281 1.69281 1.12854
18.7(J
) Consolidation 0 0 0 0 24.183 0 0 0 24.183
18.7(K) Administration 0 0 0 0 68.519 13.7037 20.55555 20.55555 13.7037
Grand Total 1946 22379 5090
711.870 137.537 206.3062 206.3062 161.72
DISTRICT IRRIGATION PLAN UNDER PMKSY (IWMP) 2016-17 TO 2019-2020
Development Block Sullah
IWMP-XIII
District : Kangra
Sr.
No.
Name of
Block
Concerne
d
Ministry/
Departme
nt
Component Activities-
wise
No. Capacity
(cum)
Com
mand
Area/
Irriga
tion
Poten
tial
(ha)
Period of
Impleme
ntation
Estimated
Cost (Rs in
lac)
2016-17 2017-18 2018-19 2019-20
17
Bhedu
Mahadev
District
Watershed
Development
Agency,
Kangra at Dharamsh
Water Harvesting Structures (Newly to be created)
17.1
PMKSY Water Shed
Farm Ponds 8 246 56 4 4.729 0.9458 1.4187 1.4187 0.9458
17.2 Check Dams 45 1899 113 4 9.497 1.8994 2.8491 2.8491 1.8994
17.3 Nalla Bandhs 0 0 0 4 0.000 0 0 0 0
17.4
Percolation
Tanks 0 0 0 0 0.000 0 0 0 0

283 | P a g e
17.5
ala
(MoRD) Other ground
water recharge
structure 0 0 0 0 0.000 0 0 0 0
17.6
Fishry
Pond/Cattel
Ponds 9 895 205 4 17.211 3.4422 5.1633 5.1633 3.4422
Others
recharge Structes 1 0 0 4 0.000 0 0 0 0
Sub Total 63 3040 374
31.437 6.2874 9.4311 9.4311 6.2874
18 Water Harvesting Structures ( to be Renovated)
18.1
PMKSY Water Shed
Farm Ponds 0 0 0 0 0.000 0 0 0 0
18.2 Check Dams 0 0 0 0 0.000 0 0 0 0
18.3 Nalla Bandhs 0 0 0 0 0.000 0 0 0 0
18.4 Percolation Tanks 0 0 0 0 0.000 0 0 0 0
18.5
Other ground
water recharge
structure 0 0 0 0 0.000 0 0 0 0
18.6
Fishry
Pond/Cattel
Ponds 0 0 0 0 0.000 0 0 0 0
Others
recharge Structes 0 0 0 0 0.000 0 0 0 0
Sub Total 0 0 0
0.000 0 0 0 0
18.7(
A) Land Development
i)
PMKSY Water Shed
Afforestation 0 0 517 4 43.467 8.6934 13.0401 13.0401 8.6934
ii) Horticulture 0 0 628 4 52.775 10.555 15.83256 15.83256 10.555
iii) Agriculture 0 0 2621 4 220.199 44.0399 66.05978 66.05978 44.0399
iv) Pasture 0 0 0 4 0.000 0 0 0 0
Sub Total 0 0 3767 316.441 63.2883 94.93244 94.93244 63.2883
18.7(
B) Soil & Moisture Conservation
i) PMKSY Water Shed Staggered
Trenching 0 0 0 0 0.000 0 0 0 0

284 | P a g e
ii)
Contour
Bunding 0 0 0 0 0.000 0 0 0 0
iii)
Graded
Bunding 0 0 0 0 0.000 0 0 0 0
iv) Bench terrracing 0 0 0 0 0.000 0 0 0 0
v)
Others (Nala
Bunds, etc.) 0 0 0 0 0.000 0 0 0 0
vi) Crate Wire 0 0 0 0 0.000 0 0 0 0
vii) Land leveling 0 0 0 0 0.000 0 0 0 0
Sub Total 0 0 0
0.000 0 0 0 0
Sr.No
.
Name of
Block
Concerne
d
Ministry/
Departme
nt
Component Activities-
wise
No. Capacity
(cum)
Com
mand
Area/
Irriga
tion
Poten
tial
(ha)
Period of
Impleme
ntation
Estimated
Cost (Rs in
lac)
2016-17 2017-18 2018-19 2019-20
18.7(
B)
Bhedu Mahadev
District
Watershed
Development
Agency,
Kangra at Dharamsh
ala (MoRD)
Vegetative & Engg. Structure
viii)
PMKSY Water Shed
Earthen Checks 0 0 0 0 0.000 0 0 0 0
ix)
Brush Wood
Checks 70 54 12 4 0.970 0.194 0.291 0.291 0.194
x) Gully plugs 0 0 0 4 0.000 0 0 0 0
xi)
Loose
boulders 25 129 15 4 1.251 0.2502 0.3753 0.3753 0.2502
xii) Gabion structures 0 0 0 0 0.000 0 0 0 0
xiii)
Others
Structures 597 0 1004 4 84.306 16.8612 25.2918 25.2918 16.8612
xiv)
Dry check
dam 0 0 0 0 0.000 0 0 0 0
xv) Drainage 7 0 67 4 5.664 1.1328 1.6992 1.6992 1.1328
xvi) Bunds repair 0 0 0 4 0.000 0 0 0 0
Sub Total 699 183 1098
92.191 18.4382 27.6573 27.6573 18.4382
Total 762 3223 5239 1 440.069 88.0139 132.0208 132.0208 88.0139
18.7
© Entry Point Activities 0 0 0 0 0.000 0 0 0 0
18.7( DPR 0 0 0 0 0.000 0 0 0 0

285 | P a g e
D)
18.7(
E) I & CB 62 1860 0 4 34.805 6.96095 10.44143 10.44143 6.96095
18.7(F) Livelihood 196 2752 0 4 70.431 14.0862 21.1293 21.1293 14.0862
18.7(
G)
Prod. Sys. & Mirco Enter.
Activities-wise No.
Beneficiari
es
0 0 0 0
Sericulutre 0 0 0 0 0.000 0 0 0 0
Bee Keeping 0 0 0 0 0.000 0 0 0 0
Poultry 0 0 0 0 0.000 0 0 0 0
Fishry 0 0 0 0 0.000 0 0 0 0
Bio fuel Plantation 0 0 0 0 0.000 0 0 0 0
Others (Vermi
Pits) 36 472 0 4 78.717 15.7434 23.6151 23.6151 15.7434
Sub Total 36 472 0
78.717 15.7434 23.6151 23.6151 15.7434
18.7(H) Monitoring 0 0 0 0 6.629 1.32576 1.98864 1.98864 1.32576
18.7(I
) Evaluation 0 0 0 0 5.800 1.16004 1.74006 1.74006 1.16004
18.7(J) Consolidation 0 0 0 0 24.858 0 0 0 24.858
18.7(
K) Administration 0 0 0 0 70.431 14.0862 21.1293 21.1293 14.0862
Grand Total 1056 #REF! 5239
731.740 141.376 212.0647 212.0647 166.234
DISTRICT IRRIGATION PLAN UNDER PMKSY (IWMP) 2016-17 TO 2019-2020
(Chapter-V)
IWMP-XIV
District : Kangra
Sr.No
.
Name of
Block
Concerne
d
Ministry/
Departme
nt
Component Activities-
wise
No. Capacity
(cum)
Com
mand
Area/
Irriga
tion
Poten
tial
(ha)
Period of
Impleme
ntation
Estimated
Cost (Rs in
lac)
2016-17 2017-18 2018-19 2019-20
17
Fatehpur
District
Watershed Developm
ent
Agency, Kangra at
Dharamsh
Water Harvesting Structures (Newly to be created) 17.1
PMKSY Water Shed
Farm Ponds 16 1868 428 4 35.924 7.1849 10.77735 10.77735 7.1849
17.2 Check Dams 11 4833 288 4 24.165 4.833 7.2495 7.2495 4.833
17.3 Nalla Bandhs 7 0 144 4 12.090 2.418 3.627 3.627 2.418
17.4 Percolation Tanks 0 0 0 0 0.000 0 0 0 0
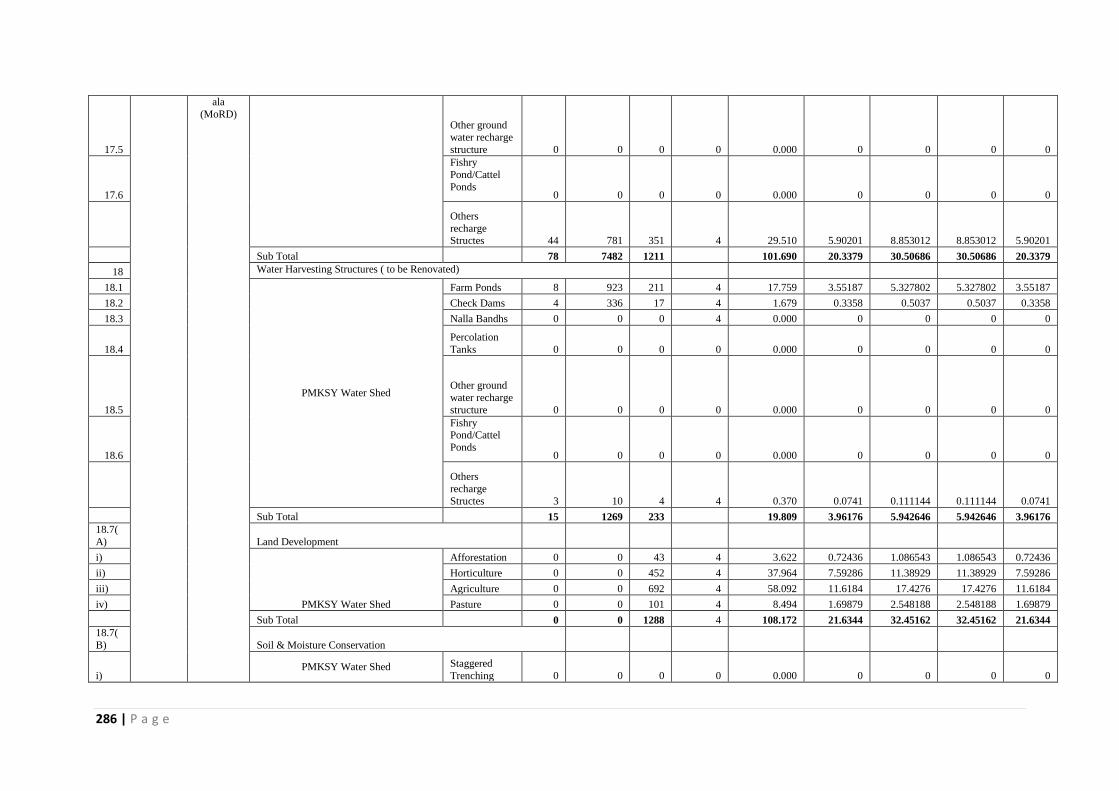
286 | P a g e
17.5
ala
(MoRD) Other ground
water recharge
structure 0 0 0 0 0.000 0 0 0 0
17.6
Fishry
Pond/Cattel
Ponds 0 0 0 0 0.000 0 0 0 0
Others
recharge Structes 44 781 351 4 29.510 5.90201 8.853012 8.853012 5.90201
Sub Total 78 7482 1211
101.690 20.3379 30.50686 30.50686 20.3379
18 Water Harvesting Structures ( to be Renovated)
18.1
PMKSY Water Shed
Farm Ponds 8 923 211 4 17.759 3.55187 5.327802 5.327802 3.55187
18.2 Check Dams 4 336 17 4 1.679 0.3358 0.5037 0.5037 0.3358
18.3 Nalla Bandhs 0 0 0 4 0.000 0 0 0 0
18.4
Percolation
Tanks 0 0 0 0 0.000 0 0 0 0
18.5
Other ground
water recharge
structure 0 0 0 0 0.000 0 0 0 0
18.6
Fishry Pond/Cattel
Ponds 0 0 0 0 0.000 0 0 0 0
Others
recharge
Structes 3 10 4 4 0.370 0.0741 0.111144 0.111144 0.0741
Sub Total 15 1269 233
19.809 3.96176 5.942646 5.942646 3.96176
18.7(
A) Land Development
i)
PMKSY Water Shed
Afforestation 0 0 43 4 3.622 0.72436 1.086543 1.086543 0.72436
ii) Horticulture 0 0 452 4 37.964 7.59286 11.38929 11.38929 7.59286
iii) Agriculture 0 0 692 4 58.092 11.6184 17.4276 17.4276 11.6184
iv) Pasture 0 0 101 4 8.494 1.69879 2.548188 2.548188 1.69879
Sub Total 0 0 1288 4 108.172 21.6344 32.45162 32.45162 21.6344
18.7(
B) Soil & Moisture Conservation
i) PMKSY Water Shed Staggered
Trenching 0 0 0 0 0.000 0 0 0 0

287 | P a g e
ii)
Contour
Bunding 0 0 0 0 0.000 0 0 0 0
iii)
Graded
Bunding 138 0 103 4 8.638 1.7276 2.5914 2.5914 1.7276
iv) Bench terrracing 129 0 51 4 4.315 0.863 1.2945 1.2945 0.863
v)
Others (Nala
Bunds, etc.) 0 0 0 0 0.000 0 0 0 0
vi) Crate Wire 0 0 0 0 0.000 0 0 0 0
vii) Land leveling 0 0 0 0 0.000 0 0 0 0
Sub Total 267 0 154 28 12.953 2.5906 3.8859 3.8859 2.5906
Sr.No
.
Name of
Block
Concerne
d
Ministry/
Departme
nt
Component Activities-
wise
No. Capacity
(cum)
Com
mand
Area/
Irriga
tion
Poten
tial
(ha)
Period of
Impleme
ntation
Estimated
Cost (Rs in
lac)
2016-17 2017-18 2018-19 2019-20
18.7(
B)
Fatehpur
District
Watershed
Development
Agency,
Kangra at Dharamsh
ala (MoRD)
Vegetative & Engg. Structure
viii)
PMKSY Water Shed
Earthen Checks 0 0 0 0 0.000 0 0 0 0
ix)
Brush Wood
Checks 0 0 0 0 0.000 0 0 0 0
x) Gully plugs 4120 11395 1052 4 88.336 17.6672 26.5008 26.5008 17.6672
xi)
Loose
boulders 5 163 19 4 1.585 0.317 0.4755 0.4755 0.317
xii) Gabion structures 65 1132 1473 4 123.697 24.7394 37.10911 37.10911 24.7394
xiii)
Others
Structures 0 0 0 0 0.000 0 0 0 0
xiv)
Dry check
dam 0 0 0 0 0.000 0 0 0 0
xv) Drainage 0 0 0 0 0.000 0 0 0 0
xvi) Bunds repair 0 0 0 0 0.000 0 0 0 0
Sub Total 4190 12690 2543
213.618 42.7236 64.08541 64.08541 42.7236
Total 4550 21442 5428
456.241 91.2483 136.8724 136.8724 91.2483
18.7
© Entry Point Activities 0 0 0 0 0.000 0 0 0 0
18.7( DPR 0 0 0 0 0.000 0 0 0 0

288 | P a g e
D)
18.7(
E) I & CB 76 2280 0 4 36.084 7.21676 10.82514 10.82514 7.21676
18.7(F) Livelihood 202 2860 0 4 73.019 14.6039 21.90578 21.90578 14.6039
18.7(
G) Prod. Sys. & Mirco Enter. Activities-wise No.
Beneficiari
es
0 0 0 0
PMKSY Water Shed
Sericulutre 0 0 0 0 0.000 0 0 0 0
Bee Keeping 0 0 0 0 0.000 0 0 0 0
Poultry 0 0 0 0 0.000 0 0 0 0
Fishry 0 0 0 0 0.000 0 0 0 0
Bio fuel Plantation 0 0 0 0 0.000 0 0 0 0
Others (Vermi
Pits) 33 404 0 4 81.610 16.322 24.48293 24.48293 16.322
Sub Total 33 404 0 4 81.610 16.322 24.48293 24.48293 16.322
18.7(H) Monitoring 0 0 0 0 6.872 1.37448 2.06172 2.06172 1.37448
18.7(I
) Evaluation 0 0 0 0 6.013 1.20267 1.804005 1.804005 1.20267
18.7(J) Consolidation 0 0 0 0 25.772 0 0 0 25.7715
18.7(
K) Administration 0 0 0 0 73.019 14.6039 21.90578 21.90578 14.6039
Grand Total 4861 26986 5428 80 758.631 146.572 219.8578 219.8578 172.343
DISTRICT IRRIGATION PLAN UNDER PMKSY (IWMP) 2016-17 TO 2019-2020
Development Block Bhawarna
IWMP-XV
District : Kangra
Sr.No
.
Name of
Block
Concerne
d
Ministry/
Departme
nt
Component Activities-
wise
No. Capacity
(cum)
Com
mand
Area/
Irriga
tion
Poten
tial
(ha)
Period of
Impleme
ntation
Estimated
Cost (Rs in
lac)
2016-17 2017-18 2018-19 2019-20
17
Bhawarna
District
Watershed Developm
ent
Agency, Kangra at
Dharamsh
Water Harvesting Structures (Newly to be created) 17.1
PMKSY Water Shed
Farm Ponds 3 99 23 4 1.895 0.379 0.5685 0.5685 0.379
17.2 Check Dams 4 2214 132 4 11.071 2.2142 3.3213 3.3213 2.2142
17.3 Nalla Bandhs 7 685 146 4 12.252 2.4504 3.6756 3.6756 2.4504
17.4 Percolation Tanks 0 0 0 0 0.000 0 0 0 0

289 | P a g e
17.5
ala
(MoRD) Other ground
water recharge
structure 0 0 0 0 0.000 0 0 0 0
17.6
Fishry
Pond/Cattel
Ponds 0 0 0 0 0.000 0 0 0 0
Others
recharge Structes 444 4376 1968 4 165.275 33.0551 49.58259 49.58259 33.0551
Sub Total 458 7374 2268
190.493 38.0987 57.14799 57.14799 38.0987
18 Water Harvesting Structures ( to be Renovated)
18.1
PMKSY Water Shed
Farm Ponds 0 0 0 0 0.000 0 0 0 0
18.2 Check Dams 0 0 0 0 0.000 0 0 0 0
18.3 Nalla Bandhs 0 0 0 0 0.000 0 0 0 0
18.4
Percolation
Tanks 0 0 0 0 0.000 0 0 0 0
18.5
Other ground
water recharge
structure 0 0 0 0 0.000 0 0 0 0
18.6
Fishry Pond/Cattel
Ponds 0 0 0 0 0.000 0 0 0 0
Others
recharge
Structes 67 386 174 4 14.580 2.91594 4.37391 4.37391 2.91594
Sub Total 68 386 174
14.580 2.91594 4.37391 4.37391 2.91594
18.7(
A) Land Development
i)
PMKSY Water Shed
Afforestation 0 0 27 4 2.302 0.4604 0.6906 0.6906 0.4604
ii) Horticulture 0 0 144 4 12.108 2.4216 3.6324 3.6324 2.4216
iii) Agriculture 0 0 13 4 1.125 0.225 0.3375 0.3375 0.225
iv) Pasture 0 0 150 4 12.573 2.5146 3.7719 3.7719 2.5146
Sub Total 0 0 335 4 28.108 5.6216 8.4324 8.4324 5.6216
18.7(
B) Soil & Moisture Conservation
i) PMKSY Water Shed Staggered
Trenching 0 0 0 0 0.000 0 0 0 0

290 | P a g e
ii)
Contour
Bunding 0 0 0 0 0.000 0 0 0 0
iii)
Graded
Bunding 0 0 0 0 0.000 0 0 0 0
iv) Bench terrracing 0 0 0 0 0.000 0 0 0 0
v)
Others (Nala
Bunds, etc.) 89 0 422 4 35.486 7.0972 10.6458 10.6458 7.0972
vi) Crate Wire 177 4112 876 4 73.571 14.7142 22.0713 22.0713 14.7142
vii) Land leveling 73 0 356 4 29.931 5.98625 8.979372 8.979372 5.98625
Sub Total 339 4112 1655
138.988 27.7976 41.69647 41.69647 27.7976
Sr.No
.
Name of
Block
Concerne
d
Ministry/
Departme
nt
Component Activities-
wise
No. Capacity
(cum)
Com
mand
Area/
Irriga
tion
Poten
tial
(ha)
Period of
Impleme
ntation
Estimated
Cost (Rs in
lac)
2016-17 2017-18 2018-19 2019-20
18.7(
B)
Bhawarna
District
Watershed
Development
Agency,
Kangra at Dharamsh
ala (MoRD)
Vegetative & Engg. Structure
viii)
PMKSY Water Shed
Earthen Checks 0 0 0 0 0.000 0 0 0 0
ix)
Brush Wood
Checks 3 93 6 4 0.464 0.0928 0.1392 0.1392 0.0928
x) Gully plugs 0 0 0 4 0.000 0 0 0 0
xi)
Loose
boulders 37 278 32 4 2.699 0.5398 0.8097 0.8097 0.5398
xii) Gabion structures 0 0 0 0 0.000 0 0 0 0
xiii)
Others
Structures 0 0 0 0 0.000 0 0 0 0
xiv)
Dry check
dam 0 0 0 0 0.000 0 0 0 0
xv) Drainage 40 0 327 4 27.454 5.4908 8.2362 8.2362 5.4908
xvi) Bunds repair 0 0 0 0 0.000 0 0 0 0
Sub Total 80 371 364
30.617 6.1234 9.1851 9.1851 6.1234
Total 946 12243 4795
402.786 80.5572 120.8359 120.8359 80.5572
18.7
© Entry Point Activities 0 0 0 0 0.000 0 0 0 0
18.7( DPR 0 0 0 0 0.000 0 0 0 0

291 | P a g e
D)
18.7(
E) I & CB 60 1440 0 4 31.856 6.37121 9.556818 9.556818 6.37121
18.7(F) Livelihood 180 1870 0 4 64.464 12.8928 19.3392 19.3392 12.8928
18.7(
G)
PMKSY Water Shed.
Activities-wise No.
Beneficiari
es
Sericulutre 0 0 0 0 0.000 0 0 0 0
Bee Keeping 4 8 0 4 2.100 0.42 0.63 0.63 0.42
Poultry 4 40 0 4 12.250 2.45003 3.675042 3.675042 2.45003
Fishry 3 5 0 4 3.300 0.66 0.99 0.99 0.66
Bio fuel Plantation 0 0 0 0 0.000 0 0 0 0
Others (Vermi
Pits) 17 326 0 4 54.398 10.8796 16.31937 16.31937 10.8796
Sub Total 27 379 0
72.048 14.4096 21.61441 21.61441 14.4096
18.7(H) Monitoring 0 0 0 0 6.067 1.21344 1.82016 1.82016 1.21344
18.7(I
) Evaluation 0 0 0 0 5.309 1.06176 1.59264 1.59264 1.06176
18.7(J) Consolidation 0 0 0 0 22.752 0 0 0 22.752
18.7(
K) Administration 0 0 0 0 64.464 12.8928 19.3392 19.3392 12.8928
Grand Total 1213 15931 4795
669.746 129.399 194.0983 194.0983 152.151
DISTRICT IRRIGATION PLAN UNDER PMKSY (IWMP) 2016-17 TO 2019-2020
Development Blcok Nagrota Surian
IWMP-XVII
DISTRICT:-
Sr.No
.
Name of
Block
Concerne
d
Ministry/
Departme
nt
Component Activities-
wise
No. Capacity
(cum)
Com
mand
Area/
Irriga
tion
Poten
tial
(ha)
Period of
Impleme
ntation
Estimated
Cost (Rs in
lac)
2016-17 2017-18 2018-19 2019-20
17
Nagrota
Surian
District Watershed
Developm
ent Agency,
Kangra at
Dharamsh
Water Harvesting Structures (Newly to be created)
17.1
PMKSY Water Shed
Farm Ponds 0 0 0 0 0.000 0 0 0 0
17.2 Check Dams 21 13415 799 4 67.074 13.4148 20.1222 20.1222 13.4148
17.3 Nalla Bandhs 0 0 0 0 0.000 0 0 0 0
17.4 Percolation Tanks 0 0 0 0 0.000 0 0 0 0

292 | P a g e
17.5
ala
(MoRD) Other ground
water recharge
structure 409 6834 3072 4 258.085 51.617 77.42549 77.42549 51.617
17.6
Fishry
Pond/Cattel
Ponds 0 0 0 0 0.000 0 0 0 0
Others
recharge Structes 0 0 0 0 0.000 0 0 0 0
Sub Total 430 20249 3871
325.159 65.0318 97.54769 97.54769 65.0318
18 Water Harvesting Structures ( to be Renovated)
18.1
PMKSY Water Shed
Farm Ponds 0 0 0 0 0.000 0 0 0 0
18.2 Check Dams 0 0 0 0 0.000 0 0 0 0
18.3 Nalla Bandhs 0 0 0 0 0.000 0 0 0 0
18.4
Percolation
Tanks 0 0 0 0 0.000 0 0 0 0
18.5
Other ground
water recharge
structure 0 0 0 0 0.000 0 0 0 0
18.6
Fishry Pond/Cattel
Ponds 0 0 0 0 0.000 0 0 0 0
Others
recharge
Structes 6 22 10 4 0.827 0.16535 0.248025 0.248025 0.16535
Sub Total 6 22 10
0.8268 0.16535 0.248025 0.248025 0.16535
18.7(
A) Land Development
i)
PMKSY Water Shed
Afforestation 0 0 404 4 33.931 6.7862 10.1793 10.1793 6.7862
ii) Horticulture 0 0 88 4 7.407 1.4814 2.2221 2.2221 1.4814
iii) Agriculture 0 0 117 4 9.816 1.9632 2.9448 2.9448 1.9632
iv) Pasture 0 0 75 4 6.293 1.2586 1.8879 1.8879 1.2586
Sub Total 0 0 684
57.4470 11.4894 17.2341 17.2341 11.4894
18.7(
B) Soil & Moisture Conservation
i) PMKSY Water Shed Staggered
Trenching 50 0 31 4 2.564 0.5128 0.7692 0.7692 0.5128

293 | P a g e
ii)
Contour
Bunding 0 0 0 0 0.000 0 0 0 0
iii)
Graded
Bunding 0 0 0 0 0.000 0 0 0 0
iv) Bench terrracing 0 0 0 0 0.000 0 0 0 0
v)
Others (Nala
Bunds, etc.) 0 0 0 0 0.000 0 0 0 0
vi) Crate Wire 483 6023 1283 4 107.770 21.554 32.331 32.331 21.554
vii) Land leveling 0 0 0 4 0.000 0 0 0 0
Sub Total 533 6023 1314
110.3340 22.0668 33.1002 33.1002 22.0668
Sr.No
.
Name of
Block
Concerne
d
Ministry/
Departme
nt
Component Activities-
wise
No. Capacity
(cum)
Com
mand
Area/
Irriga
tion
Poten
tial
(ha)
Period of
Impleme
ntation
Estimated
Cost (Rs in
lac)
2016-17 2017-18 2018-19 2019-20
18.7(
B)
Nagrota Surian
District
Watershed
Development
Agency,
Kangra at Dharamsh
ala
(MoRD)
Vegetative & Engg. Structure
viii)
PMKSY Water Shed
Earthen Checks 0 0 0 0 0.000 0 0 0 0
ix)
Brush Wood
Checks 207 2363 141 4 11.816 2.3632 3.5448 3.5448 2.3632
x) Gully plugs 0 0 0 0 0.000 0 0 0 0
xi)
Loose
boulders 137 2127 246 4 20.655 4.131 6.1965 6.1965 4.131
xii) Gabion structures 280 689 896 4 75.269 15.0538 22.58064 22.58064 15.0538
xiii)
Others
Structures 0 0 0 0 0.000 0 0 0 0
xiv)
Dry check
dam 0 0 0 0 0.000 0 0 0 0
xv) Drainage 40 0 142 4 11.914 2.3828 3.5742 3.5742 2.3828
xvi) Bunds repair 0 0 0 0 0.000 0 0 0 0
Sub Total 664 5179 1424
119.6538 23.9308 35.89614 35.89614 23.9308
1633 31473 7303
613.4205 122.684 184.0262 184.0262 122.684
18.7
© Entry Point Activities 0 0 0 0 0.000 0 0 0 0

294 | P a g e
18.7(
D) DPR 0 0 0 0 0.000 0 0 0 0
18.7(E) I & CB 86 2580 0 4 48.515 9.703 14.5545 14.5545 9.703
18.7(
F) Livelihood 272 3770 0 4 98.175 19.635 29.4525 29.4525 19.635
18.7(G)
PMKSY Water Shed.
Activities-wise No. Beneficiaries
0 0 0 0
Sericulutre 0 0 0 0 0.000 0 0 0 0
Bee Keeping 0 0 0 0 0.000 0 0 0 0
Poultry 0 0 0 0 0.000 0 0 0 0
Fishry 0 0 0 0 0.000 0 0 0 0
Bio fuel
Plantation 0 0 0 0 0.000 0 0 0 0
Others (Vermi Pits) 34 724 0 4 109.725 21.945 32.9175 32.9175 21.945
Sub Total 34 724 0
109.725 21.945 32.9175 32.9175 21.945
18.7(
H) Monitoring 0 0 0 0 9.240 1.848 2.772 2.772 1.848
18.7(I) Evaluation 0 0 0 0 8.085 1.617 2.4255 2.4255 1.617
18.7(J
) Consolidation 0 0 0 0 34.650 0 0 0 34.65
18.7(K) Administration 0 0 0 0 98.175 19.635 29.4525 29.4525 19.635
Grand Total 2025 38547 7303
1019.986 197.067 295.6007 295.6007 231.717

295 | P a g e
DISTRICT IRRIGATION PLAN UNDER PMKSY (IWMP) 2016-17 TO 2019-2020
Development Block Baijnath
IWMP-XVIII & XIX
Sr.No
.
Name of
Block
Concerne
d
Ministry/
Departme
nt
Component Activities-
wise
No. Capacity
(cum)
Com
mand
Area/
Irriga
tion
Poten
tial
(ha)
Period
of
Impleme
ntation
Estimated
Cost (Rs in
lac)
2016-17 2017-18 2018-19 2019-20
17
Baijnath
District
Watershed
Developm
ent Agency,
Kangra at
Dharamshala
(MoRD)
Water Harvesting Structures (Newly to be created)
17.1
PMKSY Water Shed
Farm Ponds 63 547 146 4 10.518 1.5777 4.2072 3.1554 1.5777
17.2 Check Dams 123 4357 1655 4 129.600 19.44 51.84 38.88 19.44
17.3 Nalla Bandhs 27 0 169 4 14.200 2.13 5.68 4.26 2.13
17.4
Percolation
Tanks 0 0 0 0 0.000 0 0 0 0
17.5
Other ground water recharge
structure 1191 10774 5861 4 388.219 58.2329 155.2876 116.4657 58.2329
17.6 Fishry
Pond/Cattel Ponds
0 0 0 0 0.000 0 0 0 0
Sub Total 1404 15678 7831
542.537 81.3806 217.0148 162.7611 81.3806
18 Water Harvesting Structures ( to be Renovated)
18.1
PMKSY Water Shed
Farm Ponds 2 8 0 4 0.185 0.02775 0.074 0.0555 0.02775
18.2 Check Dams 0 0 0 0 0.000 0 0 0 0
18.3 Nalla Bandhs 0 0 0 0 0.000 0 0 0 0
18.4
Percolation
Tanks 0 0 0 0 0.000 0 0 0 0
18.5
Other ground
water recharge
structure 20 89 0 4 6.700 1.005 2.68 2.01 1.005
18.6 Fishry Pond/Cattel
Ponds 0 0 0 4 0.000 0 0 0 0
Sub Total 22 97 0
6.885 1.03275 2.754 2.0655 1.03275
18.7( Land Development

296 | P a g e
A)
i) Afforestation 0 0 7 4 9.000 1.35 3.6 2.7 1.35
ii) Horticulture 0 0 288 4 20.988 3.1482 8.3952 6.2964 3.1482
iii) Agriculture 0 0 134 4 29.344 4.4016 11.7376 8.8032 4.4016
iv) Pasture 0 0 274 4 20.570 3.0855 8.228 6.171 3.0855
Sub Total 0 0 703
79.902 11.9853 31.9608 23.9706 11.9853
18.7(B) Soil & Moisture Conservation
i)
PMKSY Water Shed
Staggered
Trenching 94 0 7 4 3.500 0.525 1.4 1.05 0.525
ii) Contour
Bunding 44 0 12 4 6.000 0.9 2.4 1.8 0.9
iii) Graded Bunding 42 0 3 4 3.000 0.45 1.2 0.9 0.45
iv) Bench
terrracing 97 0 4 4 5.000 0.75 2 1.5 0.75
v) Others (Nala
Bunds, etc.) 50 0 30 4 10.000 1.5 4 3 1.5
vi) Crate Wire 4 0 4 4 4.000 0.6 1.6 1.2 0.6
vii) Land leveling 2 0 2 4 2.000 0.3 0.8 0.6 0.3
Sub Total 333 0 62 33.500 5.025 13.4 10.05 5.025
Sr.No
.
Name of
Block
Concerne
d
Ministry/
Departme
nt
Component Activities-
wise
No. Capacity
(cum)
Com
mand
Area/
Irriga
tion
Poten
tial
(ha)
Period
of
Impleme
ntation
Estimated
Cost (Rs in
lac)
2016-17 2017-18 2018-19 2019-20
18.7(B)
Baijnath
District Watershed
Developm
ent
Agency,
Kangra at
Dharamshala
(MoRD)
Vegetative & Engg. Structure
viii)
PMKSY Water Shed
Earthen
Checks 39 0 28 4 4.500 0.675 1.8 1.35 0.675
ix) Brush Wood
Checks 90 0 42 4 10.000 1.5 4 3 1.5
x) Gully plugs 250 0 50 4 8.000 1.2 3.2 2.4 1.2
xi) Loose boulders 457 0 89 4 23.000 3.45 9.2 6.9 3.45
xii) Gabion
structures 497 0 838 4 83.828 12.5742 33.5312 25.1484 12.5742

297 | P a g e
xiii) Others bund
structures 16 0 60 4 5.000 0.75 2 1.5 0.75
xiv) Dry check
dam 31 0 127 4 10.000 1.5 4 3 1.5
xv) Drainage 27 0 97 4 8.000 1.2 3.2 2.4 1.2
xvi) Bunds repair 38 0 52 4 23.000 3.45 9.2 6.9 3.45
Sub Total 1445 0 1382
175.328 26.2992 70.1312 52.5984 26.2992
Total 3204 15775 9978
838.152 125.723 335.2608 251.4456 125.723
18.7
© Entry Point Activities 0 0 0 0 59.868 29.868 30 0 0
18.7(D) DPR 0 0 0 0 14.967 14.967 0 0 0
18.7(
E) I & CB 95 3325 0 4 74.835 11.2253 29.934 22.4505 11.2253
18.7(F) Livelihood 201 3015 0 4 134.703 20.2055 53.8812 40.4109 20.2055
18.7(
G)
Prod. Sys. & Mirco Enter.
Activities-wise
No. Beneficiari
es
-
Sericulutre 0 0 0 0 0.000 0 0 0 0
Bee Keeping 0 0 0 0 0.000 0 0 0 0
Poultry 0 0 0 0 0.000 0 0 0 0
Fishry 0 0 0 0 0.000 0 0 0 0
Bio fuel Plantation 0 0 0 0 0.000 0 0 0 0
Others (Vermi
Pits, etc.) 24 12083 0 4 149.670 22.4505 59.868 44.901 22.4505
Sub Total 24 12083 0
149.670 22.4505 59.868 44.901 22.4505
18.7(H) Monitoring
0 0 0 0 14.967 2.24505 5.9868 4.4901 2.24505
18.7(I
) Evaluation
0 0 0
0 14.967 2.24505 5.9868 4.4901 2.24505
18.7(J) Consolidation
0 0 0 0 44.901 0 0 0 44.901
18.7(
K) Administration
0 0 0
0 149.670 22.4505 59.868 44.901 22.4505
Grand Total 3524 34198 9978 40 1496.700 251.38 580.7856 413.0892 251.446

298 | P a g e
DPRs posed to NABARD for consideration under RIDF by the GoHP
Sr. No. Deptt. Sector Name of the Project District Consti-tuency TFO (Rs.
Lakh)
1 IPH MIS Rem. Of FIS Kohla Kuhl in village Phera GP
Upper Lunj in Tehsil Shahpur Kangra Shahpur 39.82
2 IPH MIS C/o FIS Tatwani Kuhl in Tehsil Shahpur Kangra Shahpur 63.69
3 IPH MIS C/o FIS Kaned Kuhl (Dhar Kuhl) from
Katharah Nallah in Tehsil Dharamshala Kangra Dharamshala 78.73
4 IPH MIS C/o LIS Chuharpur and Kursain in Tehsil
Indora Kangra Indora 365.52
5 IPH MIS Augmentation and extension of LIS Kuru
Dehra in Tehsil Dehra Kangra Dehra 410.12
6 IPH MIS C/o LIS Sakri Deora Kathak in Tehsil
Baijnath Kangra Baijnath 101.47
7 IPHD LIS Aug. of LIS Bhadwar in Tehsil Nurpur Kangra Nurpur 388.38
8 IPHD LIS Imp. Of LIS Naleti Panchayat Naleti in Tehsil
Dehra Kangra Dehra 54.08
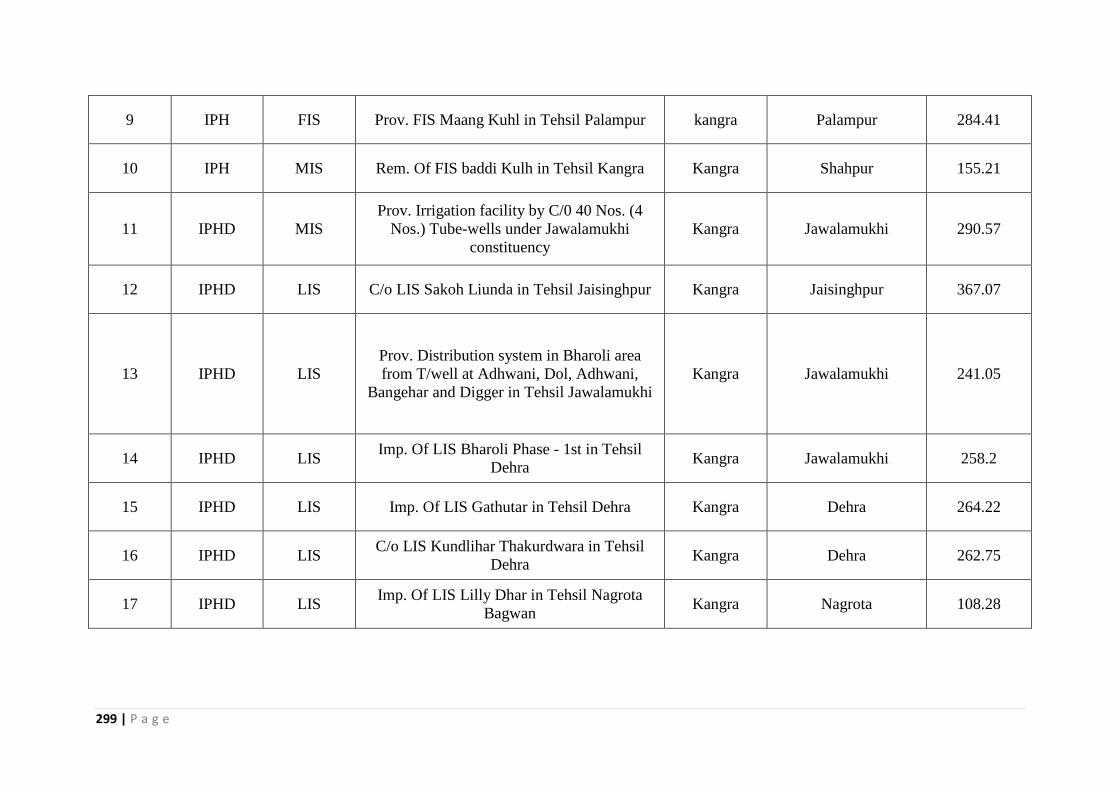
299 | P a g e
9 IPH FIS Prov. FIS Maang Kuhl in Tehsil Palampur kangra Palampur 284.41
10 IPH MIS Rem. Of FIS baddi Kulh in Tehsil Kangra Kangra Shahpur 155.21
11 IPHD MIS
Prov. Irrigation facility by C/0 40 Nos. (4
Nos.) Tube-wells under Jawalamukhi
constituency
Kangra Jawalamukhi 290.57
12 IPHD LIS C/o LIS Sakoh Liunda in Tehsil Jaisinghpur Kangra Jaisinghpur 367.07
13 IPHD LIS
Prov. Distribution system in Bharoli area
from T/well at Adhwani, Dol, Adhwani,
Bangehar and Digger in Tehsil Jawalamukhi
Kangra Jawalamukhi 241.05
14 IPHD LIS Imp. Of LIS Bharoli Phase - 1st in Tehsil
Dehra Kangra Jawalamukhi 258.2
15 IPHD LIS Imp. Of LIS Gathutar in Tehsil Dehra Kangra Dehra 264.22
16 IPHD LIS C/o LIS Kundlihar Thakurdwara in Tehsil
Dehra Kangra Dehra 262.75
17 IPHD LIS Imp. Of LIS Lilly Dhar in Tehsil Nagrota
Bagwan Kangra Nagrota 108.28

300 | P a g e
18 IPHD LIS
Laying of bigger dia pipe for Kathul Kuhl
from village Chamotu to village Gujrera,
Darang, Dhoran, Ghanetta etc. in Tehsil
Palampur
Kangra Sullah 460.42
19 IPHD DTW C/o 15 No. T/wells in Bharmar area in Tehsil
Jawali Kangra Jawali 1001.61
20 IPHD LIS Imp. & Aug. of LIS Dibber Rour in GP
Bangoli Tehsil Dehra Kangra Dehra 483.85
21 IPHD FIS C/o FIS under GP Kholi (Chotti & Baddi
Kuhl) Kangra Kangra 204.68

301 | P a g e
Projects sanctioned under various tranches of RIDF and which still having phasing between the years
2016-17 to 2019-20
Sr. No. Purpose Tranche Name of Project District Constituency Command Area (ha.) TFO (Rs. Lakhs)
1 FIS XXI
Development of
FIS Darini Kuhl in
Tehsil Shahpur
Kangra Shahpur 87.00 220.15
2 DTW XXI
C/o 2 Nos. T/wells
for Prov. Irrigation
facility to village
Andretta and Biara
in GP Andretta and
Biara in Tehsil
Palampur
Kangra Jaisinghpur 24.00 68.23
3 DTW XXI
C/o 12 Nos.
T/wells in Fatehpur
area in Tehsil
Fatehpur
Kangra Fatehpur 271.93 999.07
4 DTW XXI
C/o 15 Nos. T/well
in Indora area in
Tehsil Indora
Kangra Indora 347.25 1018.95
5 FIS XX
C/o FIS Pathiar
Ambari kuhl in
Tehsil Kangra
Kangra Nagrota 174.00 179.9

302 | P a g e
6 LIS XX
C/o LIS Bari
Bhaniari in Tehsil
Jawali
Kangra Jawali 50.35 169.78
7 FIS XX
C/O distribution
system of FIS
Pandtuhal Kuhl in
Tehsil Palampur
Kangra Palampur 170.00 233.64
8 FIS XX C/o FIS Rod Kuhl
in GP Rajiana Kangra Nagrota 88.34 163.26
9 FIS XX
C/O FIS Machhan
Di Kuhl to village
Raserh, Machhan,
Tikkri, Uthra Gran
and village
Tangroti in GP
Tang in tehsil
Dharamshala
Kangra Dharamshala 170.00 210.53
10 FIS XX
C/O FIS Machhul
Kuhl in tehsil
Dharamshala
Kangra Dharamshala 142.00 100.65
11 DTW XX
Imp. & Ext. of
Various T/wells in
Jawali area
Kangra Jawali 668.61 685.66
12 DTW XX
C/o 15 Nos T/well
Guler area in tehsil
Jawali (c/o 11 nos
T/well)
Kangra Jawali 402.24 731.21

303 | P a g e
13 DTW XX
C/o 21 Nos T/wells
in Nurpur
constituency
Kangra Nurpur 484.91 1614.13
14 DTW XX
Re-drilling/
remodelling of 9
No. T/wells in
Nurpur (Fatehpur)
area
Kangra Fatehpur 245.03 578.5
15 RWHS XX
C/o RWHs in
various Gram
Panchayats under
IPH Sub-Division
Khundian
Kangra Jawalamukhi 92.50 375.03
16 LIS XX
Imp. Of
distribution system
of LIS Thural
Kangra Sullah 296.00 176.86
17 LIS XIX
Aug./ Rem. of LIS
Khanni in Tehsil
Nurpur
Kangra Nurpur 73.43 99.77
18 LIS XIX
C/o LIS Hadal and
Kapahri in Tehsil
Nurpur
Kangra Nurpur 56.68 133.73
19 LIS XIX
Imp. of LIS Purba
Balota in tehsil
Palampur
Kangra Sullah 89.40 88.04

304 | P a g e
20 LIS XIX
C/o of LIS to
village Tikkru,
Sanghole, Chambi
etc. in Tehsil
Jaisinghpur
Kangra Thural 126.00 219.7175
21 RWH XIX
Rain Water
Harvesting Project
at various location
in GP Kahanpatt,
Rajhoon & Gaggal
in Tehsil Palampur
Kangra Sullah 29.00 84.19
22 RWH XIX
Rain Water
Harvesting Project
in GP Lahru Kuhan
on Different Hallah
in Tehsil
Jaisinghpur
Kangra Thural 25.00 74.8865
23 RWH XIX
Rain Water
Harvesting Project
over Tal Khad
(between GP
Jarundi Nahlian &
Tipri in Tehsil
Khundian
Kangra Thural 19.00 51.51

305 | P a g e
24 RWH XIX
C/o Rain water
harvesting
structure on Haler
Khad with Prov.
Irrigation facilities
to adjoining area.
Kangra Thural 61.00 292.22
25 RWH XIX
C/o Rain Water
Harvesting
structure on Moul
Khad with prov.
Irrigation facilities
to adjoining area.
Kangra Thural 74.00 361.47
26 RWH &
LIS XIX
Prov. Irrigation
facility to village
Bari Kalan by
construction check
dam at Nagrota
Nallah in Tehsil
Khundian.
Kangra Jwalamukhi 30.62 119.03
*SAVE WATER SAVE FUTURE*