distribution services business planforward this business plan looks at the work performed by the...
TRANSCRIPT

Attachment K Distribution Business Plan

2005-2009 Business Plan
Final

Forward
This business plan looks at the work performed by the Distribution Services Business Unit. The plan outlines a five-year Distribution Services strategy by defining strategic objectives and then identifying the work and resources both in labor, material and dollars to accomplish those objectives.
This business plan is approved by the following:
Title Signature
Phil West, Director, Distribution Services _____________________
Maria Veloso-Koenig, Manager, Planning & Operations _____________________
Ed LaBranch, Manager, Asset Management _____________________
Ron Saufferer, Manager, New Services _____________________
Jerry Nishizaki, Supervisor, Design Resource Center _____________________
Steve Hallmark, Supervisor, Work Performance Resource Center ____________________
Jeff Jacobson, Supervisor, Business & Technology Resource Center ___________________
i

Table of Contents
Executive Summary
1. Introduction 1.1. Background 1.2. Progress to Date 1.3. Organizational Structure 1.4. Process 1.5. DS Sub-Processes
2. Purpose, Values, & Strategy 2.1. Purpose 2.2. Strengths, Weaknesses, Opportunities and Threats 2.3. Strategic Priorities
3. Reliability Assessment 3.1. Measurement 3.2. Historic Reliability Performance 3.3. Reliability Comparisons 3.4. System Performance 3.5. Relationship Between Expenditures and Reliability 3.6. Reliability Improvement 3.7. Conclusion
4. Maintenance 4.1. Maintenance Initiatives 4.2. Strategic Objectives
5. System Improvement Projects 5.1. Substations 5.2. Land Acquisitions 5.3. Feeders 5.4. Capacitor Banks 5.5. Transmission System Projects
ii
6. New Business 6.1. Trends 6.2. 5-Year Projection
7. Human Resource Plan 7.1. Introduction 7.2. Challenges 7.3. Strategic Objectives 7.4. Maintaining A Qualified Workforce 7.5. Non-Productive Time 7.6. Workforce Attrition 7.7. Multi-year Training Programs
8. Material Resources
8.1. Strategic Objective 8.2. Forecast
9. Funding Requirements 9.1. Five Year Requirements
iii
Executive Summary Distribution Services is responsible for the District’s core business process, Deliver Energy. This business plan is Distribution Services’ strategic outlook for 2005-2009 in alignment with the District’s Strategic Plan. This plan provides a means of identifying, prioritizing, and allocating expenditures for Distribution Services that meets the strategic and financial requirements of the District. Distribution Services continues to improve as a process-centered organization through alignment of people, process, and technology. The Service Delivery Information Technology (SDIT) Project will acquire and deploy information technology to enable selective work processes in Distribution Services. The integration of SAP work management and scheduling functions into daily operations has greatly enhanced process performance management. Distribution Services is working to ensure a qualified District workforce to perform the daily operations and complete strategic initiatives. Strategic outsourcing is planned for peak workloads and special initiatives in excess of the base workload. The 2005 – 2009 Business Plan summarizes the major initiatives and funding requirements within Distribution Services that support the process of delivering safe, reliable service in a cost effective manner. The major initiatives include cable replacement, pole replacement, installation of new capacity to support new business, and system maintenance.
The initiatives, cable replacement, pole replacement, installation of capacity, and system maintenance all support the District goal of maintaining the present level of service reliability as measured by the duration and frequency indices SAIDI and SAIFI, respectively. The cable replacement initiative annually replaces 100,000 circuit feet of underground cable and rehabilitates another 100,000 circuit feet through the silicon injection process. The pole replacement program addresses the backlog of double red-tagged poles by year 2006 and addresses double red-tagged poles in the year they are identified from year 2007 and beyond. The addition of line and substation capacity ensures that the distribution system is able to serve the load under peak conditions for both normal and contingency scenarios. Substation and line equipment maintenance are based on manufacturer recommendations and operating experience.
The demand for new service connections continues to represent the largest body of work for Distribution Services. The forecast for the next five years still shows a large volume of new service work as high as 10,000 new subdivision lots in 2005. In addition to residential subdivisions, the new commercial connections remain at a steady pace. The first year of this plan will become Distribution Services’ operational plan for 2005. The approved 2005 budget, with detailed prioritized work plans, will meet the 2005
iv

operational needs of the business unit, thus allowing it to maintain present levels of service reliability and customer service. Throughout the five year period, Distribution Services will review and make adjustments to reflect the District financial and strategic objectives and external business drivers, as well as operating experiences.
v

1. Introduction The Distribution Services organization is responsible for one of the District’s core business processes, Deliver Energy. The organization is responsible for:
• short and long term planning of the distribution system • design, construction, modification and maintenance of the District’s transmission
and distribution systems • operation of the District’s distribution system • design and construction provision for new services • acquisition and management of all land and land rights
This business plan is Distribution Services’ strategic outlook for 2005 - 2009 in alignment with the District’s Strategic Plan. The integration of business unit plans with the District’s strategic plan will provide SMUD greater focus on providing our customers the benefits of a customer-owned utility. The plan will be adjusted, as necessary, to reflect changes in the District’s Strategic Plan and financial requirements. The first year of the Distribution Services 5-Year Business Plan will become the business unit’s 2005 operating plan that is consistent with the overall District strategy. The 2005 operational plan will assist in measuring Distribution Services’ process and business unit performance to ensure strategic success.
1.1. Background Distribution Services incorporates all of the activities within the distribution business area of SMUD, including customer order fulfillment. Distribution Services is a process-centered organization. All business functions directly relating to distribution work processes are the responsibility of the business unit. This organization incorporates many of the activities historically performed within functional departments, aligning work activities, skills and knowledge, and information systems with work processes that bring value to our customers.
1.2. Progress to Date The hallmark of a process-centered organization is the alignment of people, process, and technology. Distribution Services has successfully transitioned to a process-oriented organization and Service Delivery Information Technology (SDIT) will provide the remaining technology components to complete the transition. The SDIT Project will acquire and deploy various information technologies to enable Distribution Services business processes. The underlying SDIT platforms include a geographic information system (GIS), automated distribution design tools, mobile data dispatch (MDD), outage management system (OMS) and engineering support systems (ESS). In April 2001, the
1-1

automated design application (LD-Pro) integrated with SAP was placed into service. Today, the vast majority of design work is completed within this environment. In June 2003, the fully integrated GIS/Design system was accepted and placed into service in July. ESS, which uses the electrical facility model maintained in GIS, has been accepted and will be rolled out in July 2004. Availability of converted data is key to effectively using the SDIT applications. Outstanding progress has been made in this area, noting the vast majority of all electrical distribution facilities and related features have been fully converted. Efforts to incorporate the remaining missing or erroneous data are to be completed by 3rd Quarter 2004, as part of a separate data conversion “back-log” activity. Since May 2000, an early adaptation of OMS has been used to assist in crew management activities during major storm operations. In November 2004, OMS/MDD functionality will be deployed to support outage prediction, analysis and restoration activities specific to the 21kV system. OMS/MDD coverage will be extended to the District’s entire service territory during the 1st Quarter 2005. During this period, approximately 74 vehicles will be outfitted with mobile data terminal (MDT’s) to support OMS and related “unplanned” work. The following schedule summarizes the implementation of the remaining key activities of SDIT.
1-2

1-3

Distribution Services has made significant improvements in scheduling and resource management of line construction work. The scheduling process is well defined and fully implemented. Listed below are enhancements to line construction scheduling and related processes.
• SAP Work Management functionality is utilized extensively to monitor and control this work.
• Line construction schedules are broken down by WBS to identify lead times and resource requirements.
• Regular reporting identifies work not completed on schedule, jobs over budget, and clearly identifies crews responsible for completing work.
• Customer communication has been significantly improved. Customers have a single point of contact for construction schedule information.
• All customer communication is documented in SAP to assure consistent information from all staff.
• Customers have readily available job status information because of multiple staff available to monitor a single phone number and support staff scheduling to minimize missed calls.
• Customer callbacks, when required, are timely and provide escalation where required.
• Customer options have been developed to make expedited schedules available so customers can manage schedule impacts to their project. Subdivisions can utilize external resources for construction helping manage their project timelines.
• Line construction workflow is managed to assure construction lead times are consistently monitored for all types of line construction activities, resources are allocated to support most critical operations, and contract opportunities are identified.
• Contract work is managed in the same process as internal resources. • Scheduling processes assure crews have a clear understanding of their pending
work, its intended order of completion and work status reports from crews are completed and updated in SAP.
• Overtime guidelines have been established that are clear & uniform for the work force. Overtime is managed to focus on lead-time issues, assure equal opportunity to qualified staff, and equalize burden when mandatory overtime is required.
• Night clearances are managed to control crew size and impacts to daytime work schedules.
• Improvements have been implemented in materials management, improved job status information supports identification of future material issues.
• Supply Chain is included in schedule planning meetings to communicate material issues.
1-4

• Improved material requirements reports identify all material requirements for jobs without construction holds and Supply Chain job site delivery of transformers and major materials is coordinated with the construction schedule.
• Line crew management has been improved to include training requirements in workforce availability.
• Line crew staffing is now prioritized by work priority and the actual work by crews is monitored to assure resources are utilized as planned.
• On call crews have been established to control emergency work impacts on regular work activities.
Distribution Services is currently developing and implementing a scheduling process for line design work, in an effort to better manage project schedules and designer resources.
1.3. Organizational Structure Distribution Services is comprised of three process segments (Planning & Operations, Asset Management and New Services) and four Resource Centers (Design, Work Performance, Business Technology, and Supervision & Leadership). See the organizational chart, Figure 1.1.
1-5

1-6
The scope and description of the process segments and resource centers are listed below.
Planning & Operations
As the segment responsible for the governing process, Planning & Operations develops prioritized plans for maintenance and system improvement. The outputs of the planning process are effective System, Area, Maintenance and Service plans, as well as the Distribution Services Business Plan. Planning & Operations is also responsible for the operation of the distribution system. This segment:
• studies, monitors, and analyzes impacts to the distribution system and recommends appropriate responses,
• supports District efforts to attract new customers and retain existing customers, • develops a comprehensive five year distribution business plan to achieve District
strategies and financial objectives, • operates and troubleshoots problems on the distribution system to maintain
service to District customers; and, • configures the distribution system to minimize losses and enhance reliability.
Asset Management
This process segment includes all activities associated with:
• design, modification, and installation of transmission and distribution lines and substations,
• downtown network system improvements and maintenance, • distribution system inspection, • distribution and transmission system maintenance, • vegetation management; and • system reliability & capacity projects.
New Services
This process segment includes all Distribution Services work associated with the design and installation of:
• meters, • service conductors, • subdivision facilities, • commercial/industrial developments, • overhead and underground line extensions, • outdoor lighting, • traffic signals, • new services in the downtown network system,
1-7

• local agency projects; and • special facilities for the delivery of electric service to customers.
Resource Centers
The Resource Centers’ primary functions are to lead and manage the acquisition, development and retention of Distribution Services employees. To ensure adequate skilled resources are available, the Resource Centers conduct skills assessments, prepare training plans, conduct training and in partnership with the process supervisors, manage performance of their resources over the long term. To manage peaks in Process Segment work, the Resource Centers assist with balancing and deploying labor resources to the highest priority work based upon the business unit’s Operational Plan. The Resource Centers develop and administer staff augmentation and task release contracts where possible to meet the Process Segments’ overall labor resource requirements. Distribution Services has four Resource Centers as follows:
Resource Center Description 877 – Business and Technology Provides administrative, management analyst
and business technology labor resources 886 – Design
Provides design, engineering, construction inspection, field survey and real estate resources
887 – Work Performance
Provides field and operations labor resources
881 – Management and Supervision
Provides management and supervisory staff
The four Resource Centers provide the enabling processes to the three process segments. Additional services include information technology solutions, development and implementation of safety and skill-based training programs, development and/or modification of standards and policies; inventory and maintenance of construction tools, and automated metering services. The Resource Centers have been working to reduce bottlenecks between the Process Segments and the enabling processes. Where possible, staff from the enabling processes is fully allocated to the Process Segments and receive their work and prioritization directly from the Process Segments. The Resource Centers maintain general supervision and technical support. These changes help our staff understand that Process Segments
1-8

are responsible for the work and that when they perform work for a Process Segment they are part of that process team and need to maximize the effectiveness of the whole team. The Resource Centers also provide support services functions. Analysts provide process scheduling and cost analysis. Process support staff provides “overhead labor” activities required for Distribution Services’ operations that are not directly part of the Process Segments. As an example, the Resource Centers provide for coordination of Process Segment needs with many of the District’s support departments, including General Services, Human Resources, Labor Relations, Information Technology, Telephone Services, Transportation and Safety Health & Environmental Services.
1.4. Process The District continues to shift from a functionally operated organization to a process centered company. The District business model is shown in Figure 1.2. The model is subdivided into four (4) process groupings: Governance, Strategic, Enabling, and Core.
Distribution Service is responsible for one of the core District processes called Deliver Energy.
Figure 1.2 District Business Model
Figure 1.3 below shows the overall process flow for Distribution Services’ work. The Planning & Operations sub-process is the governing process that develops a comprehensive distribution business plan and operational plan to maintain and improve
1-9

the distribution system. The operational plan is then implemented through the order fulfillment process. Within the order fulfillment process, the Asset Management and New Services sub-processes are triggered with an order from customers and/or internal stakeholders. These sub-processes own the job from beginning to end. The smaller arrows show the interaction with other processes or segments.
Figure 1.3 Distribution Services Process Model
1.5. DS Sub-Processes The sub-processes within the core Deliver Energy process are assigned to process coordinators and measured/monitored in SAP. The sub-processes are tracked in SAP though work breakdown structures or “WBS”. Each WBS has been assigned to a Process Coordinator within one of the process segments. Each WBS has performance measures to track results of the sub-process in terms of output, quality, and cost. Table 1.1 – WBS
1-10

Descriptions shows the WBS short code, description, and scope of work for all of Distribution Services’ WBS’s. It also includes those WBS’s that roll to other business units, but for which a Distribution Services Process Coordinator has beginning to end responsibility.
1-11

Table 1.1 WBS Descriptions
WBS
Description
Scope of Work
DISTRIBUTION OPERATIONS D/PL/O/DO/NO Normal Operations Write, check and dispatch clearances
Compile daily log and outage reports Dispatch trouble tags Issue USA work and complete marking Maintain dispatch maps Charges for relay setting changes for operational reasons
D/PL/O/DO/FO Normal Field Operations
Perform switching in the field Complete trouble tags Troubleshoot system problems Security patrol of substations Respond to customer power quality problems Monitor customer facilities
D/PL/O/DO/EO Emergency Operations Activities for system restoration for storms and other natural disasters that affect more than 10% of our customers; includes all labor and material for all activity types.
D/PL/O/DO/CI Customer Inquiries/Response
Activities associated with responding to customer inquiries for system disturbances, voltage complaints, Board of Director inquiries, and outage information (does not include new service inquiries)
D/PL/O/DO/SP Distribution System Planning
Activities to develop Distribution Services strategic, tactical, and operational plans. Develop system and maintenance plans. Develop 5 year business plan
D/PL/O/DO/MP Miscellaneous Technology Projects
Miscellaneous O&M technology projects specific to Distribution Services
D/PL/C/MP Miscellaneous Technology Projects – Capital
Miscellaneous capital technology projects specific to Distribution Services
D/PL/O/DO/AL Apprentice Line Training Services
Collect all costs associated with business opportunity for providing apprentice line training to outside agencies; includes expenses and reimbursables
C/IG/O/LF Lease Dist Facilities All costs, service fees and income from the lease of District facilities for cellular antenna, fiber optic lines and other related communications facilities.
LINE MAINTENANCE COMPLIANCE D/AM/O/LC/LP Line Patrols (GO 165) Visual inspections of primary distribution facilities to
identify obvious structural problems and hazards. Patrols may be carried out in the course of other company business.
1-12

WBS
Description
Scope of Work
D/AM/O/LC/LI Detailed Line
Inspections (GO 165) An inspection of individual pieces of equipment and structures (careful examination visually and through use of routine diagnostic test, as appropriate). Note: The detailed inspection of network equipment was also budgeted under this WBS.
D/AM/O/LC/PT Pole Test & Treat Program (GO 165)
An intrusive inspection of distribution wood poles, involving movement of soil, taking samples, and/or using more sophisticated diagnostic tools beyond visual inspection.
VEGETATION MANAGEMENT D/AM/O/VM/RT Routine Tree Work -
Distribution System Trim and remove trees on a routine cycle to maintain compliance with GO 95, Rule 35.
D/AM/O/VM/OT Out Of Cycle Tree Work – Distribution System
Tree work identified by customers and District personnel that cannot wait for the next cycle to maintain compliance with GO 95, Rule 35.
D/AM/O/VM/CB Tree Cycle Buster Work- Distribution System
Trim and remove cycle limiting trees (significant trees and other cycle busters) to maintain compliance with GO 95, Rule 35.
E/TM/O/TT Tree Trimming – Transmission System
Trim trees and remove brush on transmission line rights-of-way.
PREVENTATIVE MAINTENANCE D/AM/O/PM/SB Preventative
Maintenance – Distribution Sub
Planned maintenance of distribution substation facilities. Includes: associated relay testing, infrared inspections, transformer testing, nitrogen to transformer banks, investigation of operating substation equipment, battery inspections, and relay setting changes.
D/AM/O/PM/LN Preventative Maintenance –Overhead Distribution Line
Planned maintenance on a routine cycle of overhead distribution line equipment (e.g. overhead switch maintenance). The visual patrols and detailed inspections are planned to other WBS’s. The corrective work resulting from the patrols and inspections are planned under Corrective Maintenance.
D/AM/O/PM/NT Preventative Maintenance – Network
Planned maintenance on a routine cycle of network equipment (e.g. network protector maintenance). The detailed inspection of network equipment was planned under the WBS Detailed Line Inspections (GO 165).
D/AM/O/PM/UL Preventative Maintenance – Underground Distribution Lines
Planned maintenance on a routine cycle of underground distribution line equipment. (e.g., padmount switchgear maintenance).
D/AM/O/PM/CU Customer Contracted Distribution Services
Collect all costs associated with business opportunity for providing maintenance services to customer facilities; includes expenses and reimbursables.
E/TM/O/PS Preventative Maintenance – Transmission Sub
Planned maintenance of transmission substation facilities. Includes relay testing, infrared inspections, transformer testing, battery inspections, and relay setting changes.
1-13

WBS
Description
Scope of Work
E/TM/O/PL Preventative
Maintenance – Transmission Line
Visual inspection of transmission lines.
CORRECTIVE MAINTENANCE D/AM/O/CM/SB Corrective
Maintenance – Distribution Sub
• Troubleshooting of, repairs to, or replacement of failed or damaged distribution substation equipment and/or facilities
• Root cause analysis of distribution substation equipment failures
• Oil sampling and analysis • Minor substation work • IR and other monitoring work
E/TM/O/CL Corrective Maintenance – Transmission Line
Repairs to, or replacement of, failed or damaged transmission line equipment.
E/TM/OCS Corrective Maintenance – Transmission Sub
• Troubleshooting of, repairs to, or replacement of failed or damaged transmission substation equipment and/or facilities
• Root cause analysis of transmission substation equipment failures
• Oil sampling and analysis • Minor substation work • IR and other monitoring work
D/AM/O/CM/LN Corrective Maintenance –Overhead Distribution Line
Repairs to, or replacement of, failed or damaged OH distribution line equipment.
D/AM/C/SI/PL Pole Replacement Program
All work associated with replacing deteriorated poles. Also includes car-pole accident activities.
D/AM/C/SI/CR Cable Replacement Program
Replacement of failed or failing direct buried distribution primary underground cable in order to improve system reliability.
D/AM/C/SI/PE Pole Reinforcement Program
All work associated with reinforcing deteriorated poles.
D/AM/O/CM/NT Corrective Maintenance – Network
Repair or replacement of failed or damaged network facilities.
D/AM/O/CM/UL Corrective Maintenance – Underground Distribution Lines
Repair or replacement of failed or damaged underground distribution facilities. All distribution system underground corrective maintenance including 12 kV and 21 kV.
D/AM/O/CM/ST Corrective Maintenance – St Lights/Dusk Dawn
All work associated with maintaining streetlights and dusk to dawn lighting including pole, fixture, and lamp replacement.
1-14

WBS
Description
Scope of Work
D/AM/O/CM/SV Corrective
Maintenance – Service Reconnect & Repair
All work associated with reconnecting and repairing overhead and underground services. NEW SERVICES
D/NS/C/NC/RS New Services – Residential
Activities associated with connection of new residential customers from single-family homes to residential subdivisions, including design and line construction.
D/NS/C/NC/CI New Services – C/I /Ag
Activities associated with the connection of C&I and Ag customers including design and line construction.
D/NS/C/NC/IL New Services – Install Lighting
All activities associated with the connection of new streetlights including design and construction (dusk to dawn lighting including pole, fixture, and lamp installation).
D/NS/C/NC/SM New Services – Service & Meter
Activities associated with energizing services and setting meters including design and service work.
D/NS/C/OC/SF New Services–Special Facilities
Design and construction of customer requested work that is special facilities (Rule 2).
D/NS/O/CI New Services–Customer Inquiries
Responding to customer requests for information on non-specific jobs.
D/NS/C/OC/LA Local Agency Dist Improv
Activities associated with governmental agency public works projects, including design and line construction (including relocating facilities for road improvements).
SYSTEM DEVELOPMENT D/AM/C/SI/LC Distribution Line
Projects System improvement capital work on distribution lines to ensure that under normal operating conditions the lines perform within established operating limits
D/AM/C/SI/SC Distribution System Substation Capacity Projects
System improvement capital work on distribution system substation assets to ensure that under normal operating conditions the transformers perform within established operating limits. This includes work associated with the addition of bulk substation capacity.
D/AM/C/SI/LR Distribution Capital Replacement
Capital replacement of failed equipment.
D/AM/C/SI/SM Distribution System Substation Modifications
Capital modifications on distribution system substation assets not associated with capacity additions. This includes modification on 230/69 kV bulk transformers and 69kv feeder breakers, 69kV bus, and relay modifications.
D/AM/C/SI/RA Remove Existing Facilities
This WBS is for accounting purposes only. No planning is required for this WBS. Funds will be allocated to this WBS to correspond with FERC requirements.
1-15

WBS
Description
Scope of Work
E/TS/C/TS New /Upgrade Trans
Substation All work associated with the installation and modification of the transmission system as a result of transmission system sponsored work. Does not include transmission system related work associated with the addition of bulk transformer capacity.
E/TS/C/TL Build New Transmission Line
All capital transmission line work. Does not include 69kV sub-transmission work.
METER SERVICE C/RC/O/ME Maintain & Repair
Metering Equip Testing, calibrating, and servicing of new and existing meters and associated equipment
C/RC/O/ML Operate Metering LAN All work associated with operating the metering network C/RC/O/MV Operate MV-90 System All work associated with operating the MV-90 system C/RC/C/PM Purchase & Install
Metering Equip All work associated with the purchase and installation of single phase and three phase metering including labor
and material
1-16

2. Purpose, Values & Strategy 2.1. Purpose
District Purpose Statement
“SMUD’s purpose is to provide solutions for meeting our customers’ electrical energy needs.”
District Core Values
Through an adopted policy, the SMUD Board of Directors has adopted the following core values for the District.
1. Competitive rates
2. Access to credit markets
3. Reliability
4. Customer relations
5. Safety
6. Environmental protection
7. Employee relations
Distribution Services Guiding Principles
To foster a safe, positive, cohesive working environment for our employees and customers, Distribution Services operates under the following guiding principles: Safety
• Send everyone home safe every day • Everyone is accountable for safety
Customer Focus
• Understand our customer expectations • Think about needs from the customer perspective • Consider the impact of our decisions to both the individual customer and
our customer-owners as a whole
2-1

Accountability
• Provide employees with skills and information to perform his/her job • Set/communicate parameters/guidelines to enable responsible decision
making by those closest to the work Teamwork
• Get input from those closest to the work • Communicate how input was considered • Provide reasoning for decisions
2.2. Strengths, Weaknesses, Opportunities and Threats
Our strengths and weaknesses as an organization directly impact our ability to produce a competitive product and satisfy our customers.
Strengths
• A robust electrical distribution system with built-in operational flexibility.
• Information technology projects that enable the work processes.
• Ability to meet peak work demands through outsourcing.
• Established relationships with contractors and suppliers to address resource needs, reduce overall expenditures and increase efficiency.
• Managing unit costs of the various work outputs
• Aligning customer expectations by keeping customers informed with our ability to deliver services.
Weaknesses
• Very limited availability of journey level trades
people and technical professionals in the marketplace.
• An aging infrastructure requiring extensive levels of maintenance expenditures and capital infusion.
• Amount of time and resources required implementing new technology.
• Enabling technology not fully implemented.
Opportunities
• Develop skilled and flexible labor force within the distribution system business.
• Capture new customers due to rate differential. • Diversity in the workplace. • Define and document processes • Provide web-based information for customers. • Develop/strengthen relationship with
employees thru involvement. • Scheduling resources and coordinating
handoffs. • Improved customer services delivered.
Threats
• Unplanned new service demands that could stress resources.
• Legislation/regulation that could potentially drive financial costs and could challenge the ability to complete the work plan.
• Significant expenditures may be required to comply with ADA.
• Aging workforce. • Resources constrain ability to sell ancillary
services to customers based on core competencies.
2-2
2.3. Strategic Priorities Choosing where to invest valuable resources to gain the greatest value for its customers is a challenge for all businesses. All work identified and performed on the distribution system is based on maintaining the District’s existing service reliability record, efficiently dealing with the continuing high level of new service connections and continuing our systematic program of infrastructure improvements.
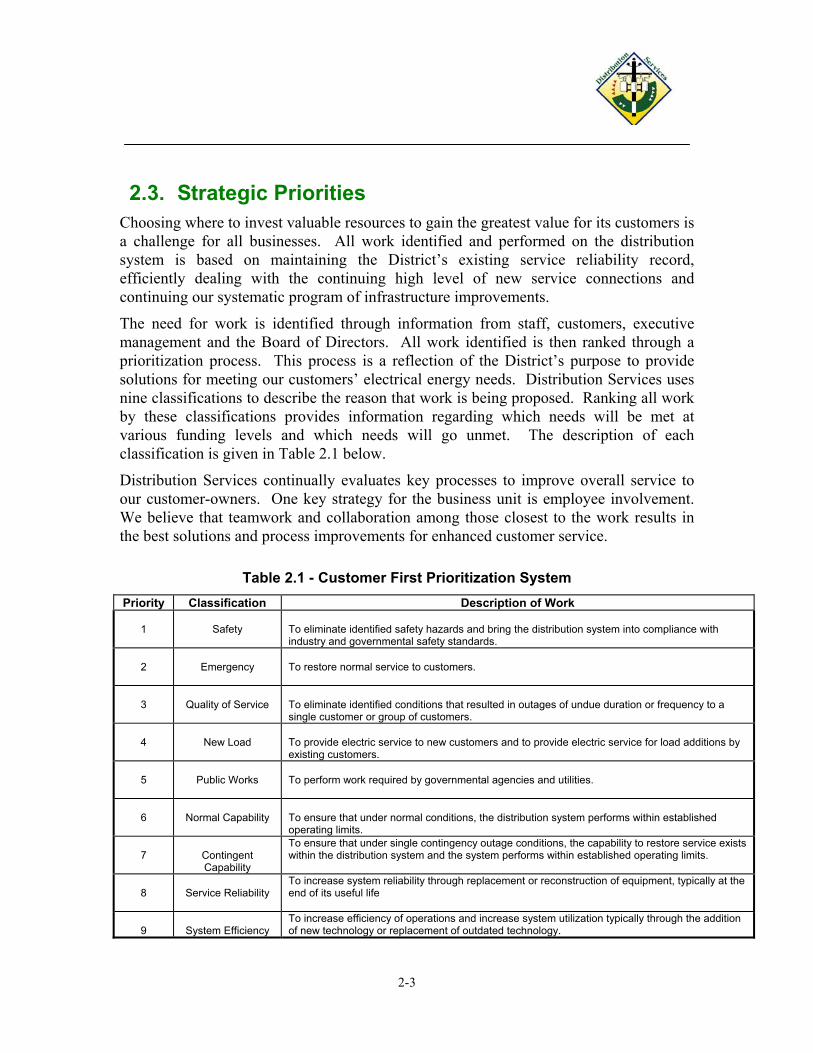
The need for work is identified through information from staff, customers, executive management and the Board of Directors. All work identified is then ranked through a prioritization process. This process is a reflection of the District’s purpose to provide solutions for meeting our customers’ electrical energy needs. Distribution Services uses nine classifications to describe the reason that work is being proposed. Ranking all work by these classifications provides information regarding which needs will be met at various funding levels and which needs will go unmet. The description of each classification is given in Table 2.1 below.
Distribution Services continually evaluates key processes to improve overall service to our customer-owners. One key strategy for the business unit is employee involvement. We believe that teamwork and collaboration among those closest to the work results in the best solutions and process improvements for enhanced customer service.
Table 2.1 - Customer First Prioritization System
Priority Classification Description of Work
1
Safety
To eliminate identified safety hazards and bring the distribution system into compliance with industry and governmental safety standards.
2
Emergency
To restore normal service to customers.
3
Quality of Service
To eliminate identified conditions that resulted in outages of undue duration or frequency to a single customer or group of customers.
4
New Load
To provide electric service to new customers and to provide electric service for load additions by existing customers.
5
Public Works
To perform work required by governmental agencies and utilities.
6
Normal Capability
To ensure that under normal conditions, the distribution system performs within established operating limits.
7
Contingent Capability
To ensure that under single contingency outage conditions, the capability to restore service exists within the distribution system and the system performs within established operating limits.
8
Service Reliability
To increase system reliability through replacement or reconstruction of equipment, typically at the end of its useful life
9
System Efficiency
To increase efficiency of operations and increase system utilization typically through the addition of new technology or replacement of outdated technology.
2-3

3. Reliability Assessment
3.1. Measurement One measure of the performance of the District’s distribution system is its reliability. Reliability is a measure of the constancy of service. Several questions must be asked in order to assess the District’s level of reliability performance and any actions that may be required to attain an optimum level of reliability performance. These include:
• What is the reliability of the District’s distribution system today? • What is an acceptable level, as defined by our customers? • What steps should the District take to attain an optimum level of
distribution reliability? Before an assessment of the distribution system’s reliability can be made, an agreed upon criteria is needed to measure the reliability performance of the system. The utility industry has agreed on several indices to measure the reliability of a system. The District uses some of these indices to measure its performance. The definitions of these measurement indices are found in Table 3.1.
Table 3.1 – Reliability Criteria Definitions
Performance Criteria
Definition
SAIDI
System Average Interruption Duration Index
Total minutes of electric interruption Total # of customers served
SAIFI
System Average Interruption Frequency Index
Total # of customers affected Total # of customers served
CAIDI
Customer Average Interruption Duration Index
Total # of customer-minutes interrupted Total # of customers interrupted
The utilization of these indices has several inherent problems. One, these indices are system averages. Therefore, while an index may show good performance, one or two specific areas within the District may have an unacceptable level of service. To address
3-1

this issue, individual circuit performance is reviewed annually (the goal is to ensure that 80% of distribution circuits will meet or exceed the established reliability index for both SAIDI and SAIFI). Second, these indices do not accurately reflect the performance of the system during a storm. This is because the number of outages during a storm may be so great that the present tracking system is overwhelmed. Third, the District does not have exact numbers of customers affected by each outage. The numbers currently used to generate these indices use approximations for the number of customers impacted during each outage. Once the OMS system is fully implemented, it will provide an accurate customer count of each outage. OMS will also be able to cope with the high volume of outages that occur during storms. The reliability indices are expected to increase as a result of more accurate reporting. The utility industry has several other indices used to measure reliability, however the three listed here are the predominant gauges by which other utilities measure their reliability. Unfortunately, there is no consistent agreement across utilities of what data is included or excluded from the indices, e.g., planned vs. unplanned, momentary outages. The comparison of these indices, therefore, has limited value.
3.2. Historical Reliability Performance The reliability performance data for 2003 is listed in Table 3.2. As mentioned above, storms have a major impact upon the system. The storms of 2003 added 18.66 minutes to the duration index and 0.41 to the frequency index. The reliability numbers for 2003 will be used for comparisons with historical data and the benchmark surveys.
Table 3.2 – 2003 Reliability Performance Values
Distribution Measurement
Criteria
Values (excludes major events, load
shedding & planned (1))
Values (excluding planned)
SAIDI (min) 53.04 71.7 SAIFI (# / cust.) 0.957 1.367
CAIDI (min) 32.74 52.48 Customers Affected 513,264 755,961
Total Outages 1,898 2,332 Minutes
Interrupted 29,565,396 39,673,020
(1) Major events defined as affecting 10% or more of SMUD’s customers.
3-2
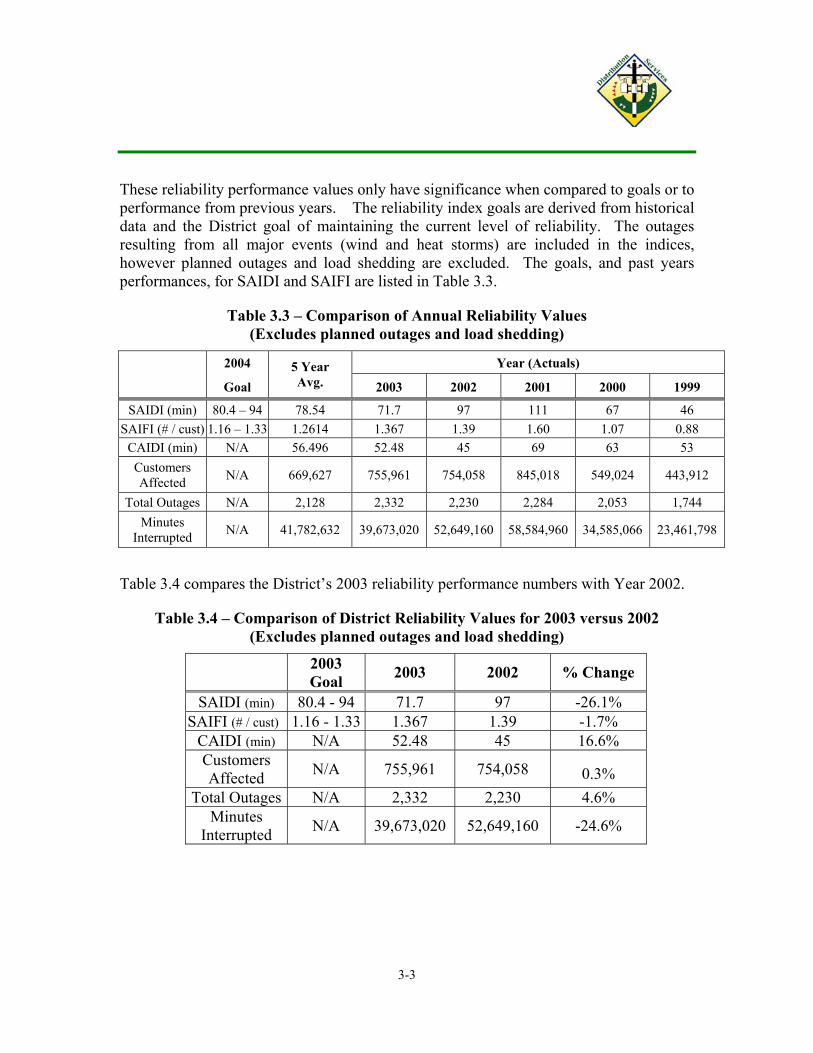
These reliability performance values only have significance when compared to goals or to performance from previous years. The reliability index goals are derived from historical data and the District goal of maintaining the current level of reliability. The outages resulting from all major events (wind and heat storms) are included in the indices, however planned outages and load shedding are excluded. The goals, and past years performances, for SAIDI and SAIFI are listed in Table 3.3.
Table 3.3 – Comparison of Annual Reliability Values (Excludes planned outages and load shedding)
2004 Year (Actuals)
Goal 5 Year Avg. 2003 2002 2001 2000 1999
SAIDI (min) 80.4 – 94 78.54 71.7 97 111 67 46 SAIFI (# / cust) 1.16 – 1.33 1.2614 1.367 1.39 1.60 1.07 0.88
CAIDI (min) N/A 56.496 52.48 45 69 63 53 Customers Affected N/A 669,627 755,961 754,058 845,018 549,024 443,912
Total Outages N/A 2,128 2,332 2,230 2,284 2,053 1,744 Minutes
Interrupted N/A 41,782,632 39,673,020 52,649,160 58,584,960 34,585,066 23,461,798
Table 3.4 compares the District’s 2003 reliability performance numbers with Year 2002.
Table 3.4 – Comparison of District Reliability Values for 2003 versus 2002 (Excludes planned outages and load shedding)
2003 Goal 2003 2002 % Change
SAIDI (min) 80.4 - 94 71.7 97 -26.1% SAIFI (# / cust) 1.16 - 1.33 1.367 1.39 -1.7%
CAIDI (min) N/A 52.48 45 16.6% Customers Affected N/A 755,961 754,058 0.3%
Total Outages N/A 2,332 2,230 4.6% Minutes
Interrupted N/A 39,673,020 52,649,160 -24.6%
3-3

Table 3.5 compares 2004 year-to-date reliability statistics with 2003 for identical time periods. This comparison shows a decrease in reliability in all indices. The decreases are due to two significant storms in January and February 2004. The weather in January and February of 2003 was considered mild in comparison to weather experienced in 2004 for the same months. The storms of 2004 added 37.18 minutes to the duration index and 0.08 to the frequency index.
Table 3.5 – Comparison of District Reliability Values for 2004 versus 2003 for the
Period from January 1 through March 31 (Excludes planned outages and load shedding)
2004 2003
SAIDI (min) 40.20 6.68 SAIFI (# / cust) 0.414 0.30190 CAIDI (min) 96.9 22.14
Customers Affected 230,909 163,994 Total Outages 741 325
Minutes Interrupted 22,375,092 3,630,420
3.3. Reliability Comparisons Comparison to other utilities is another method to determine the reliability performance of the District’s distribution system. In 2003, the District participated in the PACE benchmarking survey performed by the UMS Group. The benchmark survey included electric utility industry performance comparisons and benchmarks for reliability and performance. The study included the performance and practices of 38 electric utilities from around the world.
The UMS Group survey results referenced in this section are taken from the September 2003 study, which is based on 2002 performance data. Unlike the previous benchmark studies where the typical reliability indices are compared against participating utilities, the UMS study makes comparisons based on a cost versus service level metric (Figure 3.1). The “Best” performers are defined as companies that continually show low cost with high productivity combined with high service levels.
SMUD’s overall reliability performance (Figure 3.2) shows a high level of service at a higher cost as compared to the other participating utilities. As a result, Distribution Services continues to look for opportunities to lower cost while continuing to provide the present level of reliability. The opportunities for lowering cost that were identified in the UMS benchmark study include adding aerial devices to reduce the amount of climbing, developing productivity tracking to evaluate unit costs, expand the use of SCADA for
3-4

outage management, expand tree removals, shifting customer management responsibilities to contractors, and developing a life cycle costing tool to improve repair/replace/refurbish decisions, and implementation of infrared monitoring techniques. Many of the opportunities identified for lowering cost have or will be implemented by 2005. This includes adding more aerial trucks for troubleshooters, adding SCADA to ten distribution substations annually, unit cost planning monitoring and reporting, and infrared inspections. The other opportunities outlined in the study will be evaluated in 2005 for implementation in 2006 if appropriate. The entire list of recommendations can be found in the Pace 2003 Distribution Final Report.
3-5

3-6
Figure 3.1

Figure 3.2
3-7

3-8
3.4. System Performance Table 3.6 lists the top five causes of outages in 2003 and the 2002 rank.
Table 3.6– Comparison of the Top Five Outage Causes in 2003 versus 2002
2003 2002
Outage Cause Total #
% Of Total
OutagesRank Total
#
% Of Total
Outages Rank
% Delta
UG Cable Failure 473 20.28% 1 479 21.48% 1 -1.3 Unknown 277 11.88% 2 263 11.79% 2 5.3 Burn Out 175 7.5% 3 200 8.97% 4 -12.5 Lightning 146 6.26% 4 24 1.08% 15 508.3 All Other 1,261 54.1% 1,264 56.7% -2.6 Total Outages 2, 332 2,230 4.6
As shown, Underground Cable Failures and Unknown continue to be the District’s top one and two causes of outages. Unknown outages are outages with no determinable cause. This means that no outage cause was determined during the patrol. For example, an object could make contact with energized facilities and the resulting contact would remove the object from the vicinity. Tree related outages, which had been the largest single cause of outages in 1998, are no longer in the top five causes of outages. This can be attributed to a successful vegetation management program now in its second cycle.
3.5. Relationship between Expenditures and Reliability Our past practices and expenditures have resulted in our present reliability. In areas that have been targeted, the District has seen improvements. The tree-trimming program is a good example where increased expenditures in trimming resulted in a 79% improvement in the number of outages between 1998 and 2002.
Weather plays a major role in the reliability of the system. Unusual events such as wind storms, lightning, and heat storms can impact the reliability in a negative manner. For example, the storms of 2003 added 18.66 minutes to the duration index and 0.41 to the frequency index. Further, as SAIDI and CAIDI are impacted by response and repair time, changes to the outage management systems and labor deployment can have a major impact. Nevertheless, all things being equal, investments in reliability have shown positive results. The investments in reliability however, are generally not realized at the

time of the investment. Typically, improvements in the indices are realized six months to one year after the investment.
3.6. Reliability Improvement Reliability improvement requires a multi-pronged approach. A combination of planning, design, maintenance, and operation all have an impact on distribution system reliability. The analysis of system data (outage trends, maintenance intervals, root cause, etc.) will result in developing an integrated plan for system maintenance. Improvements in maintenance planning, maintenance backlog reductions, planning through establishing capacity levels, redundancy requirements, and protection practices are already making changes that will enhance reliability. These changes include installing backup capacity, the modification of protective relaying schemes to remove fuse saving where appropriate, managing repairs and replacement of failed underground cables, and removal of idle or underutilized facilities.
3.7. Conclusion In order to maintain the current level of reliability and stay within approved funding levels, Distribution Services will continue to monitor the effectiveness of the maintenance plan and work to correlate expenditures with performance using data provided through the new GIS system.
3-9
4. Maintenance It is the mission of Distribution Services to provide a capable distribution system that meets the District’s strategic goals of safety, cost and reliable operation. Proper maintenance is critical to the safe and reliable operation of the distribution system and is key to providing high quality service to our customers.
Preventive maintenance is typically the single largest controllable cost of a utility operation and it has a significant impact on service reliability. A well thought out maintenance program will improve performance and reduce costs by applying maintenance resources where they are most effective.
The maintenance program will strive to achieve the proper balance between preventive, predictive, and corrective maintenance. The maintenance program will focus on the following objectives:
• Ensure employee and public safety,
• Achieve regulatory compliance,
• Improve the availability and reliability of the distribution system,
• Extend the useful life of equipment,
• Minimize the total cost of ownership for equipment, and
• Reduce costs of maintenance activities.
In order to achieve these stated goals and objectives, it is crucial that the process of choosing maintenance tasks incorporate the following values:
• Direct resources to work areas that add the greatest value,
• Replace “what can be done” with “what should be done”,
• Establish common priorities,
• Focus on our customer owners.
The District’s Distribution Services Maintenance Program will address maintenance of the District’s distribution lines and substations.
The Distribution Services maintenance programs and initiatives are tracked utilizing SAP. SAP is a tool that provides key data for the development and implementation of an effectual maintenance plan. SAP provides cost and resource planning and tracking. The SAP tools allow comparison between planned and actual usage. SAP also provides tools to examine the costs to perform maintenance on specific equipment and compare costs for types of equipment. All corrective maintenance work for substations and lines is tracked by SAP orders and notifications. Tracking the corrective maintenance work by location and equipment improves the analysis of lifetime ownership costs and resource requirements.
4-1
4.1. Maintenance Initiatives The Maintenance Plan will address the following distribution system maintenance initiatives:
• Distribution Line Clearance (Vegetation Management) • Distribution Line Maintenance • Network Maintenance • Distribution Line Inspection (G.O. 165) • Substation Maintenance • Transmission Line Maintenance • Cable Replacement Program (Capital) • Cable Rehabilitation (Injection) Program (Capital) • Wood Pole Replacement Program (Capital) • Wood Pole Reinforcement Program (Capital) • Substation Modifications (Capital)
Distribution Line Clearance (Vegetation Management) California Public Utilities Commission General Order 95, Rule 35 requires an 18-inch minimum radial clearance of bare overhead distribution line conductors from tree branches or foliage. Over the last four years, the District has dramatically increased tree trimming and removal activities in order to comply with G.O. 95 and achieved compliance in 2000.
The benefit of this increased line clearance has been a significant improvement in reliability. There were 86 tree related outages in 2003. This represents a 39% reduction as compared to 2002. A minority (approximately 29%) of the tree outages experienced in 2003 were due to uncontrollable circumstances. These circumstances include fallen trees, broken limbs, and palm fronds sailing into lines. In 2003, three significant storms resulted in 20.9% of the tree related outages. In 2002, two significant storms with wind gusts exceeding 50 mph resulted in 19.7% of the tree related outages.
As part of the on-going line clearance process, the District is conducting an inventory of the entire tree population that affects its distribution lines. Information recorded at each property includes the number of trees, tree species cycle limiting or significant trees, and the return date for the next cycle. This information will improve planning and result in reduced outages.
The goal for 2005 and beyond is to continue to maintain a three-year cycle, ensure regulatory compliance and maintain existing levels of reliability. The District has completed one full three-year routine and cycle buster tree trimming cycle.
Distribution Line Maintenance Corrective maintenance for overhead and underground distribution line equipment is required when equipment fails or is found inoperative. Locations on the distribution
4-2

system requiring corrective maintenance are identified through outages, system operation, and system inspection. This workload is prioritized based on a condition rating of the component. Presently, the plan calls for addressing about 2,000 corrective actions annually. With the aid of a fully implemented GIS system, the backlog of tags will be evaluated to remove duplicate entries and develop a multi-year approach to eliminating the backlog of corrective tags. A majority of these requests are corrective actions to eliminate deficiencies identified during the G.O. 165 patrol and detailed inspections.
For 2005 and beyond it is planned to increase the preventive maintenance on overhead and underground equipment. Overhead equipment preventive maintenance increased due to increasing the frequency of overhead switch maintenance from every 25 years to every 10 years (60 switches/yr to 150 switches/yr). Underground equipment preventive maintenance increased due to a change in maintenance philosophies. In past, pad-mounted equipment was visually inspected every five years. The maintenance included cubicle barrier replacement, rodent prevention, rust prevention, marking, and cleanup of the equipment and boxes. The plan now calls for a more thorough inspection that includes exercising the operating mechanisms. On an annual basis, two hundred twenty pad-mounted switches will be maintained. If preventive maintenance is not performed, then future years’ corrective maintenance levels will increase due to increased failures.
Additionally, it is proposed to annually perform infrared inspections on all 545 miles of the 69 kV lines and 150 miles of 12 and 21 kV lines identified throughout the year. The patrol area for the 12 and 21 kV lines will be determined based upon loading and outage history. The goal of the infrared inspections is to identify weak connections that would result in failures and extended outages. The added benefit of the infrared inspections is a detailed patrol of the line that could identify other issues like cracked insulators, broken crossarms, and other pole issues that could result in an outage.
Network Maintenance Corrective maintenance is defined as any activity performed to restore an item of equipment or facility to a safe, operable condition after the occurrence of a malfunction or failure. Corrective maintenance work is performed on transformers, protectors, and cable splices. A network feeder is taken out of service one at a time and identified corrective maintenance work is performed on all pieces of equipment belonging to the feeder.
Preventive maintenance is defined as periodic, condition based, planned and predictive maintenance activities. The preventive maintenance plans for the network equipment have been based on a fixed periodic cycle. The plan to pressurize network protectors is once every year and to perform detailed inspections, maintenance, and testing of equipment is three years.
4-3

Distribution Line Inspection (G.O. 165) California Public Utilities Commission (CPUC) General Order 165, Inspection Cycles for Electric Distribution Facilities, specifies system inspection intervals and reporting requirements to be performed by the Utilities. The purpose of this order is to establish minimum requirements for inspection of electric distribution facilities in order to ensure safe and high-quality electrical service. Although this ruling is specifically directed at investor owned utilities, the District meets the intent of the order. G.O. 165 involves three types of inspections, each requiring different cycle lengths:
• Patrol - a simple visual inspection designed to identify obvious structural problems and hazards.
• Detailed inspection - a careful examination of individual pieces of equipment and structures, visually and through routine diagnostic tests, as appropriate. The condition of each piece of equipment is rated and recorded.
• Intrusive - an inspection involving movement of soil, analysis of samples taken, and/or the use of more sophisticated diagnostic tools beyond visual inspections or instrument reading.
The District’s inspections of its distribution facilities are consistent with General Order 165. Table 4.1 summarizes the inspection intervals of the various pieces of distribution equipment.
Table 4.1 - System Inspection Cycles (Maximum Intervals in Years)
Equipment Patrol Detailed Inspection
Intrusive Inspection
Transformers Overhead 1 5 N/A Underground 1 3 N/A Padmount 1 5 N/A Switching / Protective Devices Overhead 1 5 N/A Underground 1 3 N/A Padmount 1 5 N/A Regulators/Capacitors N/A Overhead 1 5 N/A Underground 1 3 N/A Padmount 1 5 N/A Conductors and Cables 1 5 N/A Poles 1 -- 10
4-4
Substation Maintenance In an effort to reduce maintenance-related costs, new methodologies and techniques based on a Reliability Centered Maintenance (RCM) philosophy will be implemented over the next five years. Changes may include establishing condition-based maintenance tasks rather than fixed interval tasks, and establishing proactive tasks aimed at finding, predicting, and preventing failures.
In order to optimize the District maintenance, the standard maintenance intervals of five years or 15,000 operations has been modified to individual schedules based upon the type, model and condition of the transformer and LTC. In many cases the period between preventive maintenance has been lengthened from five years to seven years. This also includes many circuit breakers.
The District follows the manufacturers recommended maintenance cycles by LTC type, where that information is available. Where the District does not have the manufacturers recommendations, the District’s experience drives the maintenance cycles. The District is in the process of identifying the best practices for LTC maintenance.
Other PM activities performed include detailed biweekly inspections and load reads, annual thermo graphic inspections of the bulk substations, and thermo graphic inspections of the small substations due for preventive maintenance.
Substation Preventive Maintenance work has increased due to work deferrals of prior years. Increased condition monitoring and on-line testing are expected to initially increase the amount of preventive maintenance on individual items of equipment, but overall it is expected to reduce the total ownership costs.
In the area of substation corrective maintenance, inventory of spare substation material (power transformers, circuit breakers, transformer bushings, etc.) will be increased over the next five years in order to ensure that system restoration time is minimized and is consistent with the revenue collected for these items.
Maintenance Planning is also performing studies to determine the appropriate capital replacement vs. repair/maintenance strategies for the substation equipment. These studies include loss of use and risk of failure to the reliability of the system.
Transmission Line Maintenance This initiative covers overhead and underground transmission line maintenance including line patrolling, tree trimming and brush removal activities. In addition to the ground patrol, locations on the transmission system that require work are identified through a helicopter patrol. The helicopter patrol is done twice a year, once during the spring and again during the fall season. The corrective work is prioritized based on a condition rating of the component. Under normal circumstances, corrective actions are completed within the specified time.
Transmission Substation Maintenance
System Operations and Reliability has contracted with Distribution Services to perform maintenance on transmission assets. This work includes relay setting changes to
4-5

improve coordination, transformer, circuit breaker, disconnect switches, batteries, PT’s and CT’s, motor operated switches and reactor maintenance.
Other PM activities performed include detailed biweekly inspections and load reads, annual thermo graphic inspections of the bulk substations for preventive maintenance.
Cable Replacement Program (Capital) The goals of this program are to reduce the annual number of primary underground cable failures and to remove cable of inferior design from the system.
In order to achieve these goals, an evaluation system was put into place that prioritizes cable replacement candidates by their impact to reliability. Each outage is assigned points based on the date of occurrence. The more recent the outage, the greater the point value assigned. Additional points are assigned to a candidate for each of the following conditions: disabled loop or a radial feed; feeder cable; long duration outage; key customer or a customer complaint. A prioritized list is produced with the candidate with the greatest total points assigned the highest priority. In order to focus resources on the most important work, this evaluation is performed monthly. From this prioritized list, cable replacement jobs are selected and scheduled.
Cable is selected for replacement when the above evaluation result is the highest priority. Occasionally, there are special concerns that result in the cable being selected outside of the above criteria. Some of the special concerns that may result in cable being selected are one or a combination of the following conditions:
If the neutral conductor is corroded beyond 50% (for a K circuit)
If the cable has more than two splices per 1,000 ft;
If the cable is in conduit
If there have been a large number of failures in the circuit
If there is a need to reconfigure the circuit due to growth.
The five year plan recommends keeping the annual replacement goal at 100, 000 circuit feet. The replacement of 100,000 circuit feet of underground cable and the rehabilitation (silicon injection) of 100,000 circuit feet is anticipated to maintain the existing level of reliability. Each year the number of cable failures and the amount of cable replaced will be evaluated to ensure that reliability does not decrease.
While age has not been identified as a significant driver for cable failures, the amount of cable installed per year has increased since the District began installing underground cable. The increasing amount of cable installed and in service may result in an increasing amount of cable failures in future years. An increased amount of failures will have a negative impact on SAIDI and SAIFI. Continued monitoring of the failure rates is expected to allow proactive planning for mitigation. Additionally, there may be opportunities for condition monitoring of the cables that may facilitate failure predictions and remediation planning. The long-term strategy for cable replacement will be evaluated in the next two years using the detailed information available in GIS
4-6

(i.e. vintage, manufacturer, operating conditions, etc.). This analysis will provide the foundations for cable replacement and rehabilitation for the next ten years.
Cable Rehabilitation (Injection) Program The goals of this program are to reduce the annual number of primary underground cable failures and to extend the life of the cable at a lower cost than replacement.
In order to achieve these goals, areas presently targeted for cable replacement are evaluated as candidates for silicone injection. Other areas that will be considered for selection will include areas with no failures that are adjacent to areas targeted for replacement and areas with early vintages of cable that have no failures. These locations will aid in determining if this process will stop failures in problem locations and also prevent failures in new areas.
In addition to improving the selection process, the plan recommends keeping the annual cable injection goal of 100,000 circuit feet in 2005 and beyond.
It is anticipated that with the replacement of 100,000 circuit feet of cable per year and the rehabilitation of 100,000 circuit feet per year, that the SAIDI and SAIFI will remain at or slightly better than the current levels.
Wood Pole Replacement and Reinforcement Programs (Capital) The District owns and maintains approximately 145,000 wood poles. Annually, 1/10th of the total number of poles, or 14,500 poles, will be tested. This testing program meets the requirements of G.O. 165. Field data suggests that approximately 5.15 % of poles that are tested require replacement or reinforcement. The plan for 2005 and beyond proposes to address the backlog of 918 pole replacements by the end of 2006 and 24,439 pole inspections by the end of 2007. Beyond 2007, it is expected that the annual number of rejected poles requiring replacement, projected at 327, will be replaced during the same year they are identified in order to effectively manage this work. The following table details this plan.
4-7

Proposed 2005-2009 Pole Replacement Plan
Year Backlog of Double Red-
Tagged Poles at Beginning of
Year
Double Red-Tagged Poles
Identified Through
Inspection
Double Red-Tagged Poles
Identified Through
Operation
Poles Replaced
Backlog of Double Red-Tagged Poles
at End of Year
2004 1,363 450 305 1,200 918
2005 918 550 100 1,200 368
2006 368 550 50 968 0
2007 0 327 50 377 0
2008 0 327 50 377 0
2009 0 327 50 377 0
Based on the increased number of poles being inspected for the next four years, it is expected that more than 700 poles will be identified as needing reinforcement or stubbing. Those poles that are identified as candidates for reinforcement (estimated at 734 in 2005-2006 and 457 beyond on an annual basis) will be addressed during the same year as they are found.
Pertinent information collected during the pole test will be documented to provide adequate and consistent auditable inspection records. The records will also create a history of types of findings to analyze and improve construction practices, as well as forecast the workload for pole replacements and reinforcements.
Substation Modifications (Capital) This initiative includes those substation projects designed to improve safety, reliability, extend equipment service life, or reduce maintenance requirements by upgrading or replacing substation components.
Regulatory Requirements (Capital) This initiative includes the installation of oil spill containment structures to meet the requirements of 40CFR Part 112 for Spill Prevention, Control, and Countermeasures (SPCC) at the District’s Substations. It is necessary to install new spill containment structures at our substations. A review of the District’s SPCC plan and 40CFR112 requirements indicates that the District could be liable for very large fines and penalties (>>$200,000) in the event of an oil spill at a substation that has not been retrofitted. This program will result in the completion of the required spill containment systems by February 18, 2006.
4-8

4.2. Strategic Objectives Appendix A outlines the work units for the planning period 2005-2009. This plan’s objectives will result in the following: • Development of a maintenance and capital investment plan to address the expected
life span of facilities. • Development of a mix of maintenance activities to maintain service reliability within
the District’s financial requirements.
4-9

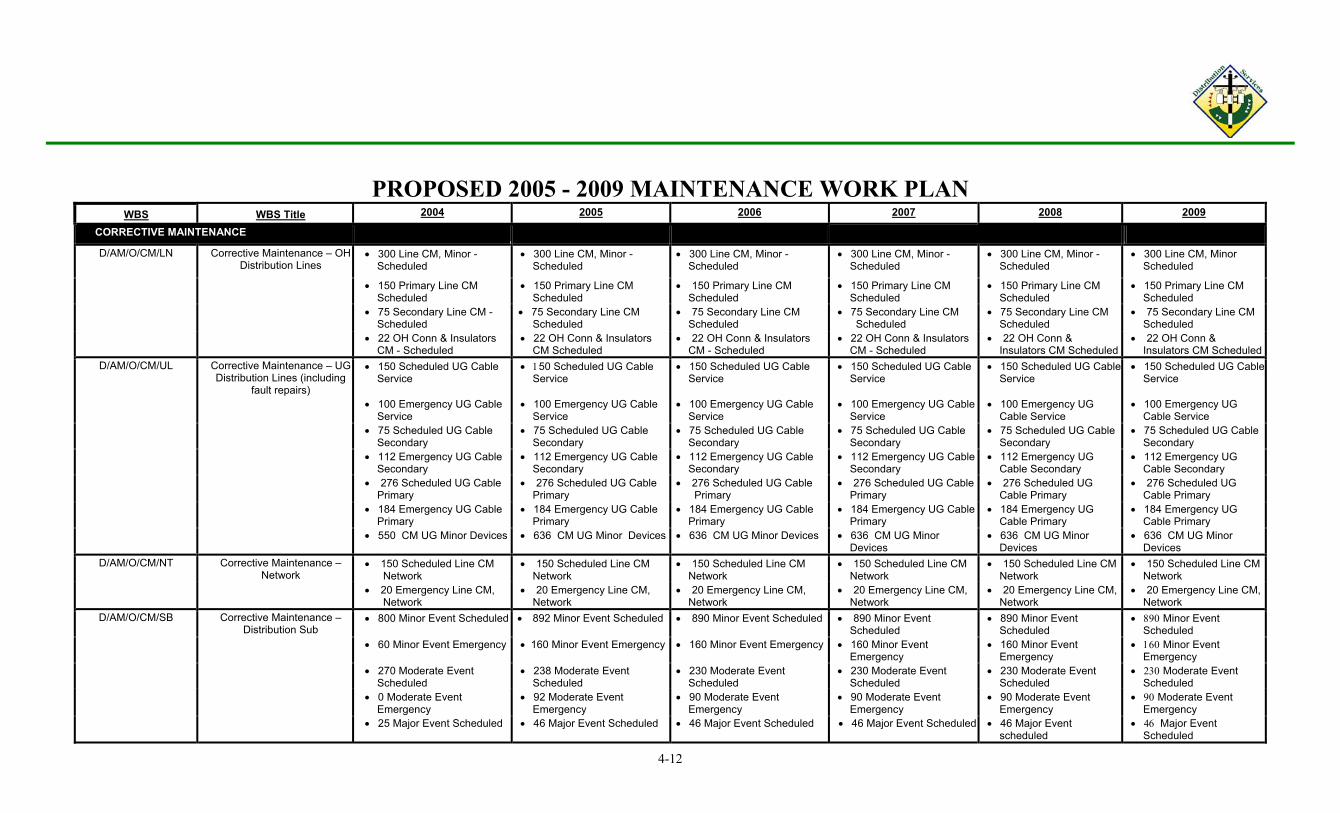
Appendix A - PROPOSED 2005 - 2009 MAINTENANCE WORK PLAN
2004 2005 2006 2007 2008 2009 WBS WBS Title
Requirement Requirement Requirement Requirement Requirement Requirement
LINE MAINTENANCE COMPLIANCE D/AM/O/LC/LP Line Patrols (GO165) Patrol 9,800 Miles Patrol 9,800 Miles Patrol 9,800 Miles Patrol 9,800 Miles Patrol 9,800 Miles Patrol 9,800 Miles
D/AM/O/LC/LI Detailed Line Inspections (GO 165)
Inspect 34,000 Locations Inspect 45,000 Locations Inspect 45,000 Locations Inspect 45,000 Locations Inspect 45,000 Locations Inspect 45,000 Locations
D/AM/O/LC/PT Pole Test & Treat Program (GO 165)
Inspect 19,615 Poles Inspect 24,878 Poles Inspect 24,878 Poles Inspect 24,878 Poles Inspect 24,878 Poles Inspect 14,526 Poles
VEGETATION MANAGEMENT D/AM/O/VM/RT Routine Tree Work –
Distribution Trim 77,000 trees Trim 66,050 trees Trim 66,050 trees Trim 66,050 trees Trim 66,050 trees Trim 66,050 trees
Remove 7,700 trees Remove 6,050 trees Remove 6,050 trees Remove 6,050 trees Remove 6,050 trees Remove 6,050 trees
Remove brush 250 sites Remove brush 250 sites Remove brush 250 sites Remove brush 250 sites Remove brush 250 sites Remove brush 250 sites
D/AM/O/VM/CB Cycle Buster Tree Work – Distribution
Trim 12,010 trees Trim 18,000 trees Trim 18,000 trees Trim 18,000 trees Trim 18,000 trees Trim 18,000 trees
Remove 963 trees Remove 2,000 trees Remove 2,000 trees Remove 2,000 trees Remove 2,000 trees Remove 2,000 trees
D/AM/O/VM/OT Out Of Cycle Tree Work – Distribution
Trim 1,200 trees Trim 1,250 trees Emergency Trims 175
Trim 1,250 trees Emergency Trims 175
Trim 1,250 trees Emergency Trims 175
Trim 1,250 trees Emergency Trims 175
Trim 1,250 trees Emergency Trims 175
Remove 300 trees Remove 400 trees Remove 400 trees Remove 400 trees Remove 400 trees Remove 400 trees
PREVENTIVE MAINTENANCE D/AM/O/PM/SB Preventive Maintenance –
Distribution Sub 55 Transformer PM 55 Transformer PM 55 Transformer PM 43 Transformer PM 38 Transformer PM 55 Transformer PM
2 Transformer Head Job 3 Transformer Head Job 2 Transformer Head Job 2 Transformer Head Job 2 Transformer Head Job 2 Transformer Head Job
7 69 kV CB PM 14 69 kV CB PM 1 5 69 kV CB PM 18 69 kV CB PM 4 69 kV CB PM 6 69 kV CB PM
11 21 kV CB PM 7 21 kV CB PM 20 21 kV CB PM 14 21 kV CB PM 14 21 kV CB PM 2 21 kV CB PM
125 <15 kV CB PM 125 <15 kV CB PM 125 <15 kV CB PM 125 <15 kV CB PM 125 <15 kV CB PM 125 <15 kV CB PM
Test 561 Relays Test 430 Relays Test 586 Relays Test 335 Relays Test 491 Relays Test 491 Relays
9 Circuit Switchers 9 Circuit Switchers 10 Circuit Switchers 10 Circuit Switchers 11 Circuit Switchers 10 Circuit Switchers
0 Disconnects 5 0 Disconnects 115 Disconnects 115 Disconnects 115 Disconnects 115 Disconnects
19 Large Station IR Insp 19 Large Station IR Insp 19 Large Station IR Insp 19 Large Station IR Insp 19 Large Station IR Insp 19 Large Station IR Insp
35 Small Station IR Insp 70 Small Station IR Insp 70 Small Station IR Insp 45 Small Station IR Insp 70 Small Station IR Insp 70 Small Station IR Insp
4-10

PROPOSED 2005 - 2009 MAINTENANCE WORK PLAN 2004 2005 2006 2007 2008 2009
WBS WBS Title Requirement Requirement Requirement Requirement Requirement Requirement
Clean 0 Cap Banks Clean 70 Cap Banks Clean 70 Cap Banks Clean 70 Cap Banks Clean 70 Cap Banks Clean 70 Cap Banks
ess 330 Maintain XFMR N2 Press
260 Maintain XFMR N2 Press
260 Maintain XFMR N2 Pr 260 Maintain XFMR N2 Press
260 Maintain XFMR N2 Press
260 Maintain XFMR N2 Press
Filter Insulating oil 6 times Filter Insulating oil 6 times Filter Insulating oil 6 times Filter Insulating oil 6 times Filter Insulating oil 6 times Filter Insulating oil 6 times
Function test 200 CB's Function test 400 CB's Function test 600 CB's Function test 600 CB's Function test 600 CB's Function test 600 CB's
Annual DOBLE Training Annual DOBLE Training Annual DOBLE Training Annual DOBLE Training Annual DOBLE Training Annual DOBLE Training
1068 Battery Inspection 1188 Battery Inspection 1308 Battery Inspection 1428 Battery Inspection 1548 Battery Inspection 1548 Battery Inspection
1 Capacitor Bank Insp 222 Capacitor Bank Insp 222 Capacitor Bank Insp 232 Capacitor Bank Insp 232 Capacitor Bank Insp 232 Capacitor Bank Insp
D/AM/O/PM/LN Preventive Maintenance – Overhead Distribution Line
• 188 Line Switches • 25 Line Switches • 150 Line Switches • 150 Line Switches • 150 Line Switches • 150 Line Switches
Line Line Line Inspect 1 In In Inspect 150 Inspect 150
Network 16
(Contracted Out) 137 Network Protectors 137 Network Protectors 137 Network Protectors 137 Network Protectors 1375 Network Protectors
189 Detailed Manhole Inspections Inspections Inspections Inspections Inspections Inspections 52 Detailed Inspections
52 Detailed Va 52 Detailed Va 52 Detailed Inspections
52 Detailed • 52 Detailed Va
Underground Distribution Lines
220 Padmou • 50 P • 22 • 220 Padmoun • 220 Padmo
Primary Cable
Inspect 545 Miles of 69 kV
Inspect 545 Miles of 69 kV Line Inspect 545 Miles of 69 kV Line Inspect 545 Miles of 69 kV
Inspect 545 Miles of 69 kV
50 Miles Dist line spect 150 Miles Dist line spect 150 Miles Dist line Miles Dist line Miles Dist line
D/AM/O/PM/NT Preventive Maintenance – • 5 Network Protectors
• • • • •
•
• 93 Detailed Manhole
• 93 Detailed Manhole
• 93 Detailed Manhole
• 93 Detailed Manhole
• 93 Detailed Manhole
• Vault
• ult Inspections • ult Inspections • Vault
• Vault Inspections ult Inspections
D/AM/O/PM/UL Preventive Maintenance - • nt Switchgear admount Switchgear 0 Padmount Switchgear t Switchgear • 220 Padmount Switchgear unt Switchgear
• Test 50,000 circuit feet of
4-11
PROPOSED 2005 - 2009 MAINTENANCE WORK PLAN WBS WBS Title 2004 2005 2006 2007 2008 2009
CORRECTIVE MAINTENANCE D/AM/O/CM/LN Corrective Maintenance – OH
Distribution Lines • 300 Line CM, Minor -
Scheduled • 300 Line CM, Minor -
Scheduled • 300 Line CM, Minor -
Scheduled • 300 Line CM, Minor -
Scheduled • 300 Line CM, Minor -
Scheduled • 300 Line CM, Minor
Scheduled
• 150 Primary Line CM Scheduled
• 150 Primary Line CM Scheduled
• 150 Primary Line CM Scheduled
• 150 Primary Line CM Scheduled
• 150 Primary Line CM Scheduled
• 150 Primary Line CM Scheduled
• 75 Secondary Line CM - Scheduled
• 75 Secondary Line CM Scheduled
• 75 Secondary Line CM Scheduled
• 75 Secondary Line CM Scheduled
• 75 Secondary Line CM Scheduled
• 75 Secondary Line CM Scheduled
• 22 OH Conn & Insulators CM - Scheduled
• 22 OH Conn & Insulators CM Scheduled
• 22 OH Conn & Insulators CM - Scheduled
• 22 OH Conn & Insulators CM - Scheduled
• 22 OH Conn & Insulators CM Scheduled
• 22 OH Conn & Insulators CM Scheduled
D/AM/O/CM/UL Corrective Maintenance – UG Distribution Lines (including
fault repairs)
• 150 Scheduled UG Cable Service
• 150 Scheduled UG Cable Service
• 150 Scheduled UG Cable Service
• 150 Scheduled UG Cable Service
• 150 Scheduled UG Cable Service
• 150 Scheduled UG Cable Service
• 100 Emergency UG Cable Service
• 100 Emergency UG Cable Service
• 100 Emergency UG Cable Service
• 100 Emergency UG Cable Service
• 100 Emergency UG Cable Service
• 100 Emergency UG Cable Service
• 75 Scheduled UG Cable Secondary
• 75 Scheduled UG Cable Secondary
• 75 Scheduled UG Cable Secondary
• 75 Scheduled UG Cable Secondary
• 75 Scheduled UG Cable Secondary
• 75 Scheduled UG Cable Secondary
• 112 Emergency UG Cable Secondary
• 112 Emergency UG Cable Secondary
• 112 Emergency UG Cable Secondary
• 112 Emergency UG CableSecondary
• 112 Emergency UG Cable Secondary
• 112 Emergency UG Cable Secondary
• 276 Scheduled UG Cable Primary
• 276 Scheduled UG Cable Primary
• 276 Scheduled UG Cable Primary
• 276 Scheduled UG Cable Primary
• 276 Scheduled UG Cable Primary
• 276 Scheduled UG Cable Primary
• 184 Emergency UG Cable Primary
• 184 Emergency UG Cable Primary
• 184 Emergency UG Cable Primary
• 184 Emergency UG CablePrimary
• 184 Emergency UG Cable Primary
• 184 Emergency UG Cable Primary
• 550 CM UG Minor Devices • 636 CM UG Minor Devices • 636 CM UG Minor Devices • 636 CM UG Minor Devices
• 636 CM UG Minor Devices
• 636 CM UG Minor Devices
D/AM/O/CM/NT Corrective Maintenance – Network
• 150 Scheduled Line CM Network
• 150 Scheduled Line CM Network
• 150 Scheduled Line CM Network
• 150 Scheduled Line CM Network
• 150 Scheduled Line CM Network
• 150 Scheduled Line CM Network
• 20 Emergency Line CM, Network
• 20 Emergency Line CM, Network
• 20 Emergency Line CM, Network
• 20 Emergency Line CM, Network
• 20 Emergency Line CM, Network
• 20 Emergency Line CM, Network
D/AM/O/CM/SB Corrective Maintenance – Distribution Sub
• 800 Minor Event Scheduled • 892 Minor Event Scheduled • 890 Minor Event Scheduled • 890 Minor Event Scheduled
• 890 Minor Event Scheduled
• 890 Minor Event Scheduled
• 60 Minor Event Emergency • 160 Minor Event Emergency • 160 Minor Event Emergency • 160 Minor Event Emergency
• 160 Minor Event Emergency
• 160 Minor Event Emergency
• 270 Moderate Event Scheduled
• 238 Moderate Event Scheduled
• 230 Moderate Event Scheduled
• 230 Moderate Event Scheduled
• 230 Moderate Event Scheduled
• 230 Moderate Event Scheduled
• 0 Moderate Event Emergency
• 92 Moderate Event Emergency
• 90 Moderate Event Emergency
• 90 Moderate Event Emergency
• 90 Moderate Event Emergency
• 90 Moderate Event Emergency
• 25 Major Event Scheduled • 46 Major Event Scheduled • 46 Major Event Scheduled • 46 Major Event Scheduled • 46 Major Event scheduled
• 46 Major Event Scheduled
4-12

3
PROPOSED 2005 - 2009 MAINTENANCE WORK PLAN WBS WBS Title 2004 2005 2006 2007 2008 2009
CAPITAL REPLACEMENT / LIFE EXTENSION
D/AM/O/CM/SB Corrective Maintenance – Distribution Sub
• 3 Major Event - Emergency
• 42 Major Event - Emergency
• 40 Major Event - Emergency
• 40 Major Event Emergency
• 40 Major Event Emergency
• 40 Major Event Emergency
D/AM/C/SI/CR Cable Replacement Program • 100,000 circuit feet • 100,000 circuit feet • 100,000 circuit feet • 100,000 circuit feet • 100,000 circuit feet • 100,000 circuit feet
D/AM/C/SI/CR Silicone Injection Program • 100,000 circuit feet • 100,000 circuit feet • 100,000 circuit feet • 100,000 circuit feet • 100,000 circuit feet • 100,000 circuit feet
D/AM/C/SI/LR Transformer and SwitchgearCapital Replacement
• 40 - 1 Ph PB XFMR Sch • 40 - 1 Ph PB XFMR Sch • 40 - 1 Ph PB XFMR Sch • 40 - 1 Ph PB XFMR Sch • 40 - 1 Ph PB XFMR Sch • 40 - 1 Ph PB XFMR Sch
• 40 - 1 Ph PB XFMR Em • 40 - 1 Ph PB XFMR Em • 40 - 1 Ph PB XFMR Em • 40 - 1 Ph PB XFMR Em • 40 - 1 Ph PB XFMR Em • 40 - 1 Ph PB XFMR Em • 52 - 3 Ph PB XFMR Sch • 52 - 3 Ph PB XFMR Sch • 52 - 3 Ph PB XFMR Sch • 52 - 3 Ph PB XFMR Sch • 52 - 3 Ph PB XFMR Sch • 52 - 3 Ph PB XFMR Sch • 23 - 3 Ph PB XFMR Em • 23 - 3 Ph PB XFMR Em • 23 - 3 Ph PB XFMR Em • 23 - 3 Ph PB XFMR Em • 23 - 3 Ph PB XFMR Em • 23 - 3 Ph PB XFMR Em • 104 - PM XFMR Sch • 104 - PM XFMR Sch • 104 - PM XFMR Sch • 104 - PM XFMR Sch • 104 - PM XFMR Sch • 104 - PM XFMR Sch • 78 - PM XFMR Em • 78 - PM XFMR Em • 78 - PM XFMR Em • 78 - PM XFMR Em • 78 - PM XFMR Em • 78 - PM XFMR Em • 65 - PM SWGR Sch • 65 - PM SWGR Sch • 65 - PM SWGR Sch • 65 - PM SWGR Sch • 65 - PM SWGR Sch • 65 - PM SWGR Sch • 5 - PM SWGR Em • 5 - PM SWGR Em • 5 - PM SWGR Em • 5 - PM SWGR Em • 5 - PM SWGR Em • 5 - PM SWGR Em • 21 - 600 KVAR Fixed Cap
Bank Sch • 21 - 600 KVAR Fixed Cap
Bank Sch • 21 - 600 KVAR Fixed Cap
Bank Sch • 21 - 600 KVAR Fixed Cap
Bank Sch • 21 - 600 KVAR Fixed
Cap Bank Sch • 21 - 600 KVAR Fixed
Cap Bank Sch • 20 - 1200 KVAR Fixed
Cap Bank Sch • 20 - 1200 KVAR Fixed Cap
Bank Sch • 20 - 1200 KVAR Fixed
Cap Bank Sch • 20 - 1200 KVAR Fixed
Cap Bank Sch • 20 - 1200 KVAR Fixed
Cap Bank Sch • 20 - 1200 KVAR Fixed
Cap Bank Sch • 22 - 1800 KVAR Fixed
Cap Bank Sch • 22 - 1800 KVAR Fixed Cap
Bank Sch • 22 - 1800 KVAR Fixed
Cap Bank Sch • 22 - 1800 KVAR Fixed
Cap Bank Sch • 22 - 1800 KVAR Fixed
Cap Bank Sch • 22 - 1800 KVAR Fixed
Cap Bank Sch D/AM/C/SI/PL Pole Replacement Program • 1,200 poles • 1,200 poles • 968 poles • 377 poles • 377 poles • 377 poles
• 31 steel poles • 120 Pole Emergency Repl • 120 Pole Emergency Repl • 120 Pole Emergency Repl
• 120 Pole Emergency Repl
• 120 Pole Emergency Repl
D/AM/C/SI/PE Pole Reinforcement Program • 897 poles • 797 poles • 797 poles • 457 poles • 457 poles • 457 poles
4-1

PROPOSED 2005 - 2009 MAINTENANCE WORK PLAN WBS WBS Title 2004 2005 2006 2007 2008 2009
SYSTEM IMPROVEMENT (D/AM/C/SI/SM) Project M-353 Install On-line LTC Oil Filter
System Install 20 On-Line Filters Install 1 On-Line Filters Install 5 On-Line Filters Install 5 On-Line Filters Install 5 On-Line Filters Install 5 On-Line Filters
Project M- 355 Purchase Replacement Circuit Breakers for Metal clad Switchgear
Repl 11 CB's Repl 3 CB's Repl 11 CB's Repl 11 CB's Repl 11 CB's Repl 11 CB's
Project M-356 Repaint Substations Repaint 10 items of Substation Equip
Repaint 10 items of Substation Equip
Repaint 10 items of Substation Equip
Repaint 10 items of Substation Equip
Repaint 10 items of Substation Equip
Repaint 10 items of Substation Equip
Project M-357 Evaluate and/or Replace Substation Ground Grids
Replace 10 Ground Grids Replace 10 Ground Grids Replace 10 Ground Grids- Replace 10 Ground Grids Replace 10 Ground Grids Replace 10 Ground Grids
Project M-358 Remove Idle Substation Equipment
Remove 10 items of equipment
Remove 13 items of equipment
Project M-359 Oil Containment Retrofit Project Compliance - install oil containment systems
Compliance - install oil containment systems
Project M-254 PCB Capacitor Removal and Replacement
Remove & Replace 4 banks Complete tank replacements
Project M-362 Replace Substation Fencing Replace 8 Fences Replace 8 Fences Replace 8 fences
Project M-364 Purchase Spare 230/69 kV 224 MVA transformer
Order Transformer Receive Transformer
Project M-435 Investigate North City Control Building
Investigate North City Control Building
Replace/Refurbish Control building
4-14

PROPOSED 2005 - 2009 MAINTENANCE WORK PLAN WBS WBS Title 2004 2005 2006 2007 2008 2009
TRANSMISSION SYSTEM MAINTENANCE E/TM/O/TT Tree Trimming - Transmission
System Remove brush 16
miles Remove brush 16 miles Remove brush 16
miles Remove brush 16 miles Remove brush 16 miles Remove brush 16 miles
Vegetation Management Vegetation Mangement Vegetation
Management Vegetation Management Vegetation Management
1 - Helicopter Patrol 1 - Helicopter Patrol 1 - Helicopter Patrol 1 - Helicopter Patrol 1 - Helicopter Patrol 1 - Helicopter Patrol E/TM/O/PL
Transmission Line Inspection
& PM T/L Inspection - Foot Patrol 100 miles
T/L Inspection - Foot Patrol 100 miles
T/L Inspection - Foot Patrol 100 miles
T/L Inspection - Foot Patrol 100 miles
T/L Inspection - Foot Patrol 100 miles
T/L Inspection - Foot Patrol 100 miles
T/L Inspection - Towers - 240
240 Locations
240 Locations Locations
T/L Inspection - Towers - 240 Locations
T/L Inspection - Towers - 240 Locations
T/L Inspection - Towers -
T/L Inspection - Towers - 240 Locations
T/L Inspection - Towers -
T/L IR Helicopter Patrol 1/yr
T/L IR Helicopter Patrol 1/yr
T/L IR Helicopter Patr 1/yr
T/L IR Helicopter Patrol 1/yr
T/L IR Helicopter Patrol 1/yr
T/L IR Helicopter Patrol 1/yr
T/L Tower Helicopter Inspection 1/yr
T/L Tower Helicopter Inspection 1/yr
T/L Tower Helicopter Inspection 1/yr
T/L Tower Helicopter Inspection 1/yr
T/L Tower Helicopter Inspection 1/yr
T/L Tower Helicopter Inspection 1/yr
T/L Cathodic Protection Maintenance 1/yr
T/L Cathodic Protection Maintenance 1/yr
T/L Cathodic Protection Maintenance 1/yr
T/L Cathodic Protection Maintenance 1/yr
T/L Cathodic Protection Maintenance 1/yr
T/L Cathodic Protection Maintenance 1/yr
E/TM/O/PS Transmission Sub Preventive Maintenance
200 Events - Modify Control & Relay
ttings
ttings Settings
200 Events - Modify Control & Relay Settings
200 Events - Modify Control & Relay Settings
200 Events - Modify Control & Relay Se
200 Events - Modify Control & Relay Settings
200 Events - Modify Control & Relay Se
150 - Relay Testing 150 - Relay Testing 150 - Relay Testing 150 - Relay Testing 150 - Relay Testing 150 - Relay Testing 15 - CB PM > 100 kV 15 - CB PM > 100 kV 15 - CB PM > 100 kV 15 - CB PM > 100 kV 15 - CB PM > 100 kV 15 - CB PM > 100 kV 48 - Battery
Inspections pections 48 - Battery Inspections 48 - Battery Inspections 48 - Battery Ins 48 - Battery Inspections 48 - Battery Inspections
1 - PM Transformers 1 - PM Transformers 1 - PM Transformers 1 - PM Transformers 1 - PM Transformers 1 - PM Transformers 2 - IR Transmission
Substations
2 - IR Transmission
Substations 2 - IR Transmission
Substations 2 - IR Transmission
Substations 2 - IR Transmission
Substations 2 - IR Transmission
Substations 30 - Replace nitrogen
bottles
30 - Replace nitrogen
bottles 30 - Replace nitrogen
bottles 30 - Replace nitrogen
bottles 30 - Replace nitrogen
bottles 30 - Replace nitrogen
bottles E/TM/O/CL Transmission Line Corrective
Maintenance 24 - Transmission Line
CM
24 - Transmission Line CM 24 - Transmission Line CM
24 - Transmission Line CM
24 - Transmission Line CM 24 - Transmission Line CM
4-15

PROPOSED 2005 - 2009 MAINTENANCE WORK PLAN WBS WBS Title 2004 2005 2006 2007 2008 2009
TRANSMISSION SYSTEM MAINTENANCE E/TM/O/CS
Transmission SubstationCorrective Maintenance
38 - Minor CM Events - Scheduled
38 - Minor CM Events - Scheduled
38 - Minor CM Events - Scheduled
38 - Minor CM Events - Scheduled
38 - Minor CM Events - Scheduled
38 - Minor CM Events - Scheduled
25 - Minor CM Events - Emergency
25 - Minor CM Events - Emergency
25 - Minor CM Events - Emergency
25 - Minor CM Events - Emergency
25 - Minor CM Events - Emergency
25 - Minor CM Events - Emergency
23 - Moderated CM Events - Scheduled
ents ents 23 - Moderated CM Events - Scheduled
23 - Moderated CM Events - Scheduled
23 - Moderated CM Events - Scheduled
23 - Moderated CM Ev - Scheduled
23 - Moderated CM Ev - Scheduled
15 - Moderated CM Events - Emergency
15 - Moderated CM Events - Emergency
15 - Moderated CM Events - Emergency
15 - Moderated CM Events - Emergency
15 - Moderated - Emergency
15 - Moderated - Emergency
2 - Major Event - Scheduled
2 - Major Event - Scheduled
2 - Major Event - Scheduled
2 - Major Event - Scheduled
2 - Major Event - Scheduled 2 - Major Event - Scheduled
3 - Major Event - Emergency
3 - Major Event - Emergency
3 - Major Event - Emergency
3 - Major Event - Emergency
3 - Major Event - Emergency
3 - Major Event - Emergency
CM Events
CM Events
4-16
5. System Improvement Projects In order to meet our customers’ increasing electrical demand, capital dollars are required to increase the capacity of the District’s distribution system. This includes building new substations, adding new substation transformer banks, new overhead and underground lines, capacitor banks for VAR support, and circuit modifications. The proposed projects will ensure that the distribution system has sufficient capacity to serve the needs of our customers during peak demands and single outage contingencies.
5.1. Substations The Sacramento area electrical load is forecast to grow at a rate of 2.3% (61 MW) per year for the next five years. This rate is calculated by multiplying the forecasted customer growth by 5.11 kW per customer. This method of forecasting has replaced the traditional trend line forecast using historical peak loads. The impact that the rotating blackouts had on the electrical usage during the summer of 2000, coupled with the amount of conservation that has occurred since then, has made it very difficult to use a traditional forecast using linear Least-Means-Squared line fitting with past data.
The District’s Board approved planning criteria calls for the installation of sufficient capacity to meet peak summer demands with enough reserve capacity for a single contingency outage while maintaining existing service reliability levels. Therefore, in order to serve the increasing electrical demands, new substations will be built and existing substations will be modified to increase the capacity of the District’s distribution system. A five-year summary of substation expenditures and substation projects are listed in Table 5.1 and Table 5.2.
The District will annually consider the level of automation of distribution substations within the business unit’s capital financial targets. Substation automation provides the Distribution Operators (DSO) with three key pieces of information. First, it will allow DSO to instantly know the loading of all the circuits in the field. Alarm points will be set up at values below their tripping or overload thresholds, which will give the DSO time to order field switching to reduce the loading on the circuits. Second, the automation will give the DSO control of the breakers in the substations, allowing them to remotely open and close these devices. This will save time that has, up to now, been spent waiting for Troubleshooters to arrive at the stations to perform these tasks. And finally, the DSO will instantly be aware of circuit and substation outages. Troubleshooters can be dispatched to the area without waiting for customer calls to come into the office.
In addition to the benefits of key operating information, substation automation allows for better utilization of District assets.
5-1

5.1.1. 2005 Substation Projects The five-year plan calls for the installation of 370 MVA of 12 kV distribution substation capacity, 80 MVA of 21 kV capacity, and 224 MVA of 69 kV capacity at a new bulk substation (Douglas Substation) at a total cost of $47,050,000 (present value). The cost distribution is detailed in Table 5.1 and the volume of work each year is shown in Table 5.2. In addition to capacity additions, a number of substation modification projects are planned for the next five years. The projects include protective relay upgrades, equipment replacements, metering modifications, oil containment projects, and exterior wall upgrades. (The substation capacity projects are listed in “Appendix B - Substation Capacity Projects”)
Table 5.1 - Total Substation Expenditures ($ x 1,000)
2005 2006 2007 2008 2009
Increase Substation Capacity 9,050 12,710 12,250 6,520 6,520
Substation Modifications 6,900 9,090 4,930 5,120 5,120
Total Substation Costs 15,950 18,800 20,180 11,640 11,640
Table 5.2 - Substation Projects New Distribution Substations 4 3 4 3 1
Add 2nd Unit at Existing Sub. 0 1 0 0 2
115/21 kV and 230/69 kV Substation Projects 0 1 1 1 0
5.2. Land Acquisitions The land acquisition process and environmental process present the greatest challenge for completing the substation capacity projects on time. The developers recognize the need to install electric capacity for their developments, but generally do not want these facilities located within the development. Many perceive that substations and overhead 69 kV sub-transmission lines devalue property. The opposition to substations and overhead lines continues to be strong which may require the District to pursue legal condemnation to acquire land and easements for electric facilities in order to serve electrical load.
5-2
The need for future substation sites has to be included in the specific plans generated by the County or City for the area that will be served by the substation. A collaborative effort by the City, County, developer, and SMUD needs to find agreeable sites for all
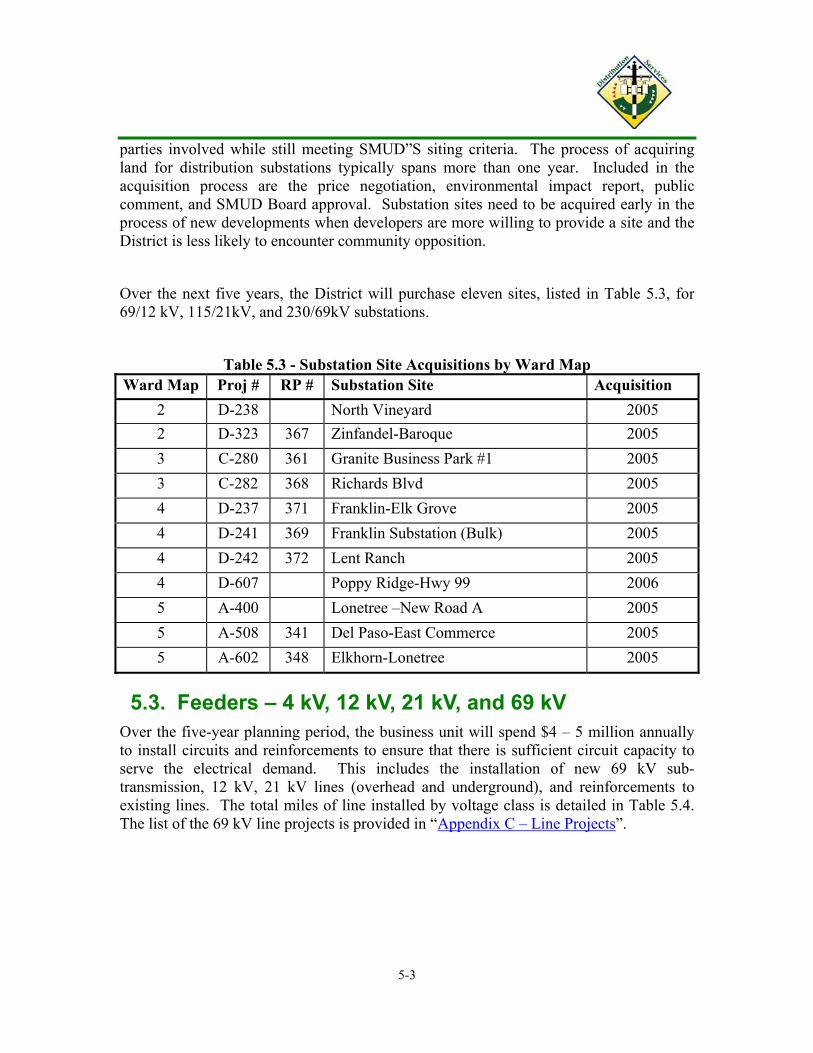
parties involved while still meeting SMUD”S siting criteria. The process of acquiring land for distribution substations typically spans more than one year. Included in the acquisition process are the price negotiation, environmental impact report, public comment, and SMUD Board approval. Substation sites need to be acquired early in the process of new developments when developers are more willing to provide a site and the District is less likely to encounter community opposition.
Over the next five years, the District will purchase eleven sites, listed in Table 5.3, for 69/12 kV, 115/21kV, and 230/69kV substations.
Table 5.3 - Substation Site Acquisitions by Ward Map Ward Map Proj # RP # Substation Site Acquisition
2 D-238 North Vineyard 2005 2 D-323 367 Zinfandel-Baroque 2005 3 C-280 361 Granite Business Park #1 2005 3 C-282 368 Richards Blvd 2005 4 D-237 371 Franklin-Elk Grove 2005 4 D-241 369 Franklin Substation (Bulk) 2005 4 D-242 372 Lent Ranch 2005 4 D-607 Poppy Ridge-Hwy 99 2006 5 A-400 Lonetree –New Road A 2005 5 A-508 341 Del Paso-East Commerce 2005 5 A-602 348 Elkhorn-Lonetree 2005
5.3. Feeders – 4 kV, 12 kV, 21 kV, and 69 kV Over the five-year planning period, the business unit will spend $4 – 5 million annually to install circuits and reinforcements to ensure that there is sufficient circuit capacity to serve the electrical demand. This includes the installation of new 69 kV sub-transmission, 12 kV, 21 kV lines (overhead and underground), and reinforcements to existing lines. The total miles of line installed by voltage class is detailed in Table 5.4. The list of the 69 kV line projects is provided in “Appendix C – Line Projects”.
5-3
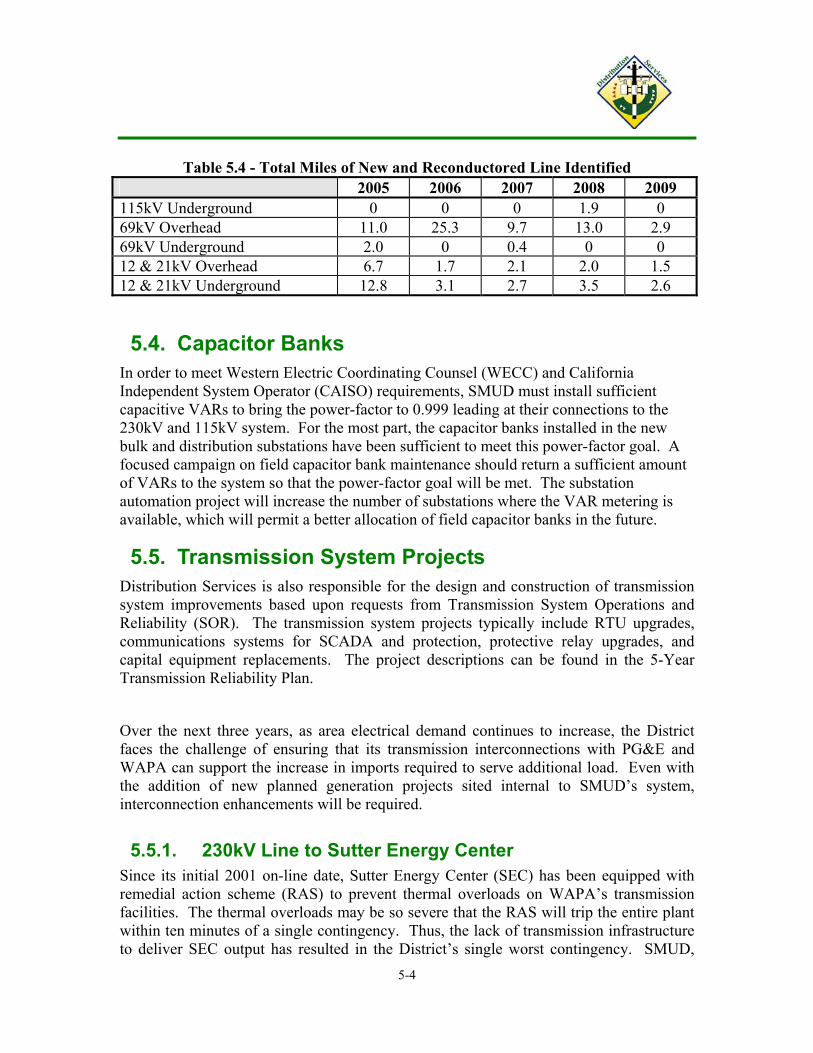
Table 5.4 - Total Miles of New and Reconductored Line Identified
2005 2006 2007 2008 2009 115kV Underground 0 0 0 1.9 0 69kV Overhead 11.0 25.3 9.7 13.0 2.9 69kV Underground 2.0 0 0.4 0 0 12 & 21kV Overhead 6.7 1.7 2.1 2.0 1.5 12 & 21kV Underground 12.8 3.1 2.7 3.5 2.6
5.4. Capacitor Banks In order to meet Western Electric Coordinating Counsel (WECC) and California Independent System Operator (CAISO) requirements, SMUD must install sufficient capacitive VARs to bring the power-factor to 0.999 leading at their connections to the 230kV and 115kV system. For the most part, the capacitor banks installed in the new bulk and distribution substations have been sufficient to meet this power-factor goal. A focused campaign on field capacitor bank maintenance should return a sufficient amount of VARs to the system so that the power-factor goal will be met. The substation automation project will increase the number of substations where the VAR metering is available, which will permit a better allocation of field capacitor banks in the future.
5.5. Transmission System Projects Distribution Services is also responsible for the design and construction of transmission system improvements based upon requests from Transmission System Operations and Reliability (SOR). The transmission system projects typically include RTU upgrades, communications systems for SCADA and protection, protective relay upgrades, and capital equipment replacements. The project descriptions can be found in the 5-Year Transmission Reliability Plan.
Over the next three years, as area electrical demand continues to increase, the District faces the challenge of ensuring that its transmission interconnections with PG&E and WAPA can support the increase in imports required to serve additional load. Even with the addition of new planned generation projects sited internal to SMUD’s system, interconnection enhancements will be required.
5.5.1. 230kV Line to Sutter Energy Center Since its initial 2001 on-line date, Sutter Energy Center (SEC) has been equipped with remedial action scheme (RAS) to prevent thermal overloads on WAPA’s transmission facilities. The thermal overloads may be so severe that the RAS will trip the entire plant within ten minutes of a single contingency. Thus, the lack of transmission infrastructure to deliver SEC output has resulted in the District’s single worst contingency. SMUD,
5-4

WAPA, and Calpine are in the process of developing transmission upgrades to mitigate this contingency. This line could be completed in the 2006 timeframe or beyond.
5.5.2. Third 230kV Circuit to Tracy As SMUD loads continue to grow, SMUD will need long-term transmission arrangements for additional import capability. The District is currently up against physical and contractual limits on import capability. WAPA has indicated that any new long term transmission contracts by SMUD for long term transmission rights across the WAPA system will be incrementally more expensive than existing transmission arrangements. This situation makes a SMUD-funded transmission line financially attractive. The proposed interconnection would be a 3rd 230 kV circuit connection with the Tracy substation. The currently proposed route is from the Tracy Substation along existing WAPA rights of way to the point the Right-of-Way intersects SMUD’s existing Rancho Seco - Pocket 230-kV lines. This line will cost approximately $35 million dollars in the 2006-2007 time frame. For the 5-year capital plan, it is assumed that SMUD will fund the construction with costs spread over 2006-2007.
5.5.3. Accommodating Area Merchant Plant Development Recent studies have shown that merchant power plant construction in the area could impact our transmission system. At the present time, no overloads are forecasted (outside of the corrective projects listed in this section). However, the construction of merchant power plants could result in construction projects to correct overload situations. These overloads will have to be addressed on a case-by-case basis.
5.5.4. Cosumnes Power Plant: Three projects to support this major generation addition will be designed and built by Distribution Services.
1. Upgrade Twin City-Clay Substation to provide adequate capacity for pumps associated with cooling water requirements.
2. A new 69-4kV Substation is required to support power plant auxiliaries. 3. Short 230 kV lines will be designed and built from the power plant switchyard
to the existing Rancho Seco switchyard.
5.5.5. Fiber Optics Extension The current communication of SMUD power system data back to SMUD’s control center is a patchwork of PacBell phone lines, radio, power line carrier (for relay coordination), and fiber optics. To increase the reliability of data communication, the fiber optic backbone is being extended so that phone line, radio, and power line carrier connections can be replaced as the primary data carrier where practical (they may remain in some cases as backup data pathways). This includes increasing the bandwidth of fiber optic communication down to the backup control center site at Rancho Seco. As the fiber optic extensions project progresses, distribution system substations that are in the vicinity of the fiber backbone will be connected in as well.
5-5

6. New Business
6.1. Trends SMUD’s Business Planning Department’s 2004-2013 Load Forecast and Economic Outlook, the latest available, forecasts an average increase of customer accounts of two percent annually over the next ten years. This rate of increase is low compared to the 1980’s, but is the highest in the last ten years and reflects the current outlook of moderate economic activity. Economic risk factors include the national economic recovery and the state budgetary deficit situation. Moderating factors for energy sales include local economic job creation, existing energy efficiency standards for new buildings and appliances, the turnover of older buildings and appliances for new ones, new-customer choice of gas heat over electric pumps, and the slowing growth of energy-intensive customers as the state’s high tech economic sector struggles to resume its former growth. Sacramento County continues to be one of the fastest growing areas in the state, but California’s overall economy is expected to struggle in the coming year due to both budget deficits and lackluster trends in some key industries. Sacramento’s current economic growth is due in large part to its economic diversity as it continues to evolve from its government and agricultural roots. The high-tech sector centered in the Bay Area is growing after several years of retrenchment and many of the companies participating in this growth are likely to relocate back office operations to second-tier cities like Sacramento. Residential & Commercial Subdivision activity will begin in late 2004 in the Laguna Ridge area with the development of 1,900 acres in the Highway 99/Elk Grove/Bruceville Road area. This work is expected to continue for 2 to 3 years. Total build out is estimated at 6,000 single-family homes and 1,900 multi-family units. There are approximately 6,000 acres projected for extensive subdivision development in the Sunrise/Douglas area. Development began in 2003 with total build out estimated at 23,000 homes. The City of Folsom is rapidly approaching large scale residential build-out, however, the expansion of the City’s sphere of influence south of Highway 50 may produce significant growth in the future. As residential growth continues, the construction of new restaurants, grocery stores, drug stores, and the expansion of large retailers will occur more rapidly in the fast growing communities of the northern, southern, and eastern areas of the County. Development of a regional mall in Elk Grove as well as a 1 million square foot Kaiser facility with adjacent retail space of approximately 900,000 square feet in Folsom are expected to materialize in 2005/2006. Also on the horizon for 2005 is the start up of Metro Air Park, 1,886 acres on the eastern edge of Sacramento International Airport zoned by Sacramento
6-1

County for 21 million square feet of warehousing, offices, retail and high-tech space, as well as a golf course with a planned build out over the next quarter century. In addition, tenant improvements and upgraded services are expected to continue at McClellan Park and, as housing starts remain healthy, commercial construction, including apartments, will continue to be strong in the more rapidly growing communities of the County. With regard to Special Facilities, expansion at Intel is continuing but at a cautious pace with the addition of a second substation possibly being online as early as 2005. Intel and one other undefined Special Facilities project is currently planned for 2005. Local Agency Local Agency work is expected to be demanding as local and state agencies continue to bolster existing infrastructures to support ongoing and anticipated growth. The Light Rail extension from the K St. station to the Amtrak station is in design, with construction planned to begin in late 2004 and continue into 2005. The movement of 150 poles along Bradshaw Road has begun and will continue into 2006. The Sacramento Regional County Sanitation District continues to install interceptor lines with construction scheduled for the next several years. These jobs will require various overhead and underground relocations. In addition, design is underway to provide service from the Havenside-Canal Substation to the County Sanitation District Pumping Station in West Sacramento. The settlement between the City of Sacramento and Barden (known as the Barden Case) will likely result in additional relocation projects to comply with ADA access requirements. The scope and timing of these relocations is in the preliminary planning process between the City, District staff, and other affected utilities. Underground Conversion Several communities have strong interest in overhead to underground system conversions that will be funded by the requesting organization. Some of the expected conversions are:
1) Fulton Avenue from Arden Way to Auburn Boulevard. This job is currently in design with construction scheduled for 2005.
2) The City of Rancho Cordova is pursuing both overhead to underground line conversions and the movement of the pole line on Folsom Boulevard along the light rail corridor from Rod Beaudry Road to Sunrise Boulevard.
3) The City of Citrus Heights may be requesting overhead to underground line conversion on Auburn Boulevard from Sylvan Avenue to the County Line.
4) The County of Sacramento wants to convert a portion of Hazel Avenue from the American River Bridge to Madison Avenue in 2007.
6-2

6.2. 5-Year Projection A Summary of the number of new services projected for the next five years is shown in Table 6.1.
Table 6.1 New Business Projections*
New Services
2003 Actual
2004 (Year-end Forecast)
2005 2006 2007 2008 2009
Residential Lots 11,249 8,500 10,000 8,000 8,000 8,000 8,000
Residential Services** 10,500 10,500 12,000 10,000 10,000 10,000 10,000
Commercial & Industrial Jobs 403 400 406 413 418 425 431
Commercial & Industrial Services
1,425 2,200 1,880 1,510 1,540 1,570 1,600
* Developed by New Services with information furnished by the Business Planning & Budget department’s 2004 – 2013 Load Forecast & Economic Outlook report.
** Prior to 2004, Residential Services data did not include individual apartment counts; apartment complexes were counted as one unit. As of 2004 apartments are counted as individual units.
6-3

7. Human Resource Plan 7.1. Introduction
The goal of the human resource plan is to ensure that the right people with the right skills are in the right jobs at the right time.
In order to determine the human resource plan for the next five years, the following steps are taken:
• Identify the composition and capabilities of the current workforce
• Forecast the competencies that will be required by the future workforce
• Compare current capabilities to future needs and determine surpluses and deficiencies
• Develop strategies to build skills that are in short supply in relation to the projected needs
7.2. Challenges As Distribution Services sets out plans to improve services, it faces challenges in recruiting, training, and retaining the staff to achieve Business Unit and District goals and objectives.
• The work force is aging. Retirements are forecast to increase within the next few years based on workforce demographics. Distribution Services needs to tap the knowledge, experience, and institutional memory that will walk out the door with these retirees. The Business Unit has developed a resource acquisition strategy that will provide a qualified workforce.
• Fewer candidates are in the "pipeline," in critical jobs with multi-year training programs than are required to maintain the workforce.
• Finding qualified candidates may be difficult in a wide range of occupations, including line construction, inspection, and engineering due to demand outstripping supply in the marketplace.
• Retention of remaining employees may be difficult as other agencies and utilities change pay and benefits. The District will need to ensure competitive pay and benefits to retain existing employees.
7-1
• Distribution Services continues to establish strategic alliances with contractors and suppliers for workload peaks and special initiatives.
• Improvements in tools, technology, and process will initially require additional resources for training and implementation.
Challenges present difficulties and opportunities. Planning to meet staffing needs in challenging times is no different. Distribution Services may have difficulty recruiting the people it needs, but will also have the opportunity to think, work, and organize in new ways. The business unit will use this opportunity for creative problem solving and innovation.
7.3. Strategic Objectives Distribution Services’ strategic plan is to cover its workload using permanent staff, overtime, and contract resources. The level of permanent staffing will be based on the determination of the expected on-going workload. Resource needs in excess of these requirements will be met using contract resources. Distribution Services’ resource plan assumes that the overtime in any activity type will be planned based upon the needs of the process. Any workload that cannot be met with internal resources will be covered by outside services. For each activity type, the plan is for no more than a 10% overtime rate.
7.4. Maintaining A Qualified Workforce Distribution Services is working to assure that the District has a skilled workforce to carry out day-to-day operations and complete strategic initiatives. Where they do not already exist, the business unit is in the process of developing workforce plans, individual skill assessments, training curriculum for all job classifications, and individual development plans.
7.5. Non-Productive Time Non-Productive time is expected to increase as the average age of the work force increases and sick leave and personal leave usage increases. Detailed activity type planning is completed for each component listed below for each activity type based upon the historical usage patterns. Average values for distribution services are shown below.
7-2

Average non-productive time components are listed below.
• Sick Leave (11 days per employee per year)
• Personal Leave (17 days per employee per year)
• Holidays (9.5 days per employee per year)
• Other Leave (1 day per employee per year)
• Safety (6 – 7 days per employee per year)
• Training (5 days per employee per year)
• Light duty (3 employees continuous)
• Paid rest period where applicable (6 days per applicable employee per year)
7.6. Workforce Attrition More than half the SMUD work force – about 1,200 employees – will be eligible to retire (55 years old or older) in the next seven years. For Distribution Services, 25% of the workforce (600 + employees) is expected to retire within the next five years (See Table 7.1 – Expected Retirements).
Table 7.1 – Expected Retirements
2005 2006 2007 2008 2009
6% 5% 4% 4% 4%
7-3

7.7. Multi-year Training Programs
Distribution Services presently has four activity types with formalized multi-year training programs. These are listed below in Table 7.2.
Table 7.2 - Multi-year Training Programs by Activity Type Activity Type
Description Years of Program
Percent that Pass
886EST Designer 5 90-100% 887ORK Cable Splicer 4.5 75% 887EWK Electrician 4 90-100% 887LWK Lineman/woman 4 50% 887NET Electrical Technician 2 90-100%
All workload assumptions are based upon the current mix of journey and apprentice level workers. In order to meet this need the 887LWK activity type needs to start the apprenticeship with 50% more candidates as needed to successfully accomplish the resource requirement goals. Distribution Services will be asking for additional positions to cover the attrition rate of the apprenticeship programs for 887LWK and 887ORK.
7-4

8. Material Resources Timely procurement of key material resources is critical to the success of the Distribution Business Unit. Distribution Services continues to take a systematic approach to improve its supply strategies, working primarily with end users, suppliers and supply chain professionals, in order to assure the best results for the District and meet our supplier diversity goals.
8.1. Strategic Objective The District continues to optimize its relationships with suppliers to insure availability, reducing the need for large inventories and minimizing procurement time. Our partnership with suppliers focuses on achieving improvements in cost, quality, delivery and reliability. It includes “joint process improvement” initiatives, wherein District representatives and suppliers work together to effectively manage inventory levels, lower total life cycle costs and enhance product and service quality. This year the Supply Chain working with Distribution Services will strive to increase the number of strategic alliances with suppliers. Pursued strategic alliances for this year will include suppliers for Overhead switches, General Electrical Parts, and Subsurface switches. In addition to the pursued alliances, Supply Chain will look to lengthen existing contracts from two and three year to three and four year contracts. Initial analysis has shown that Distribution Services will capture a reduction in costs associated with the procurement of materials. Supply Chain currently has strategic alliances for thirteen different material categories.
8.2. Forecast In addition to external alliances, Distribution Services has formed internal partnerships. Segment Owners and Process Coordinators have identified critical stock items. They have recognized that a shortage of any material potentially jeopardizes the District’s ability to provide timely and cost effective service to our customers. To avoid these circumstances, representatives from material management participate in Distribution Services weekly Job Scheduling meeting. A five-year projection is given based upon the present workload assessment of project work.
In an effort to reduce inventory levels without endangering project schedules, a five-year projection of major material usage has been developed (see Table 8.1).
8-1
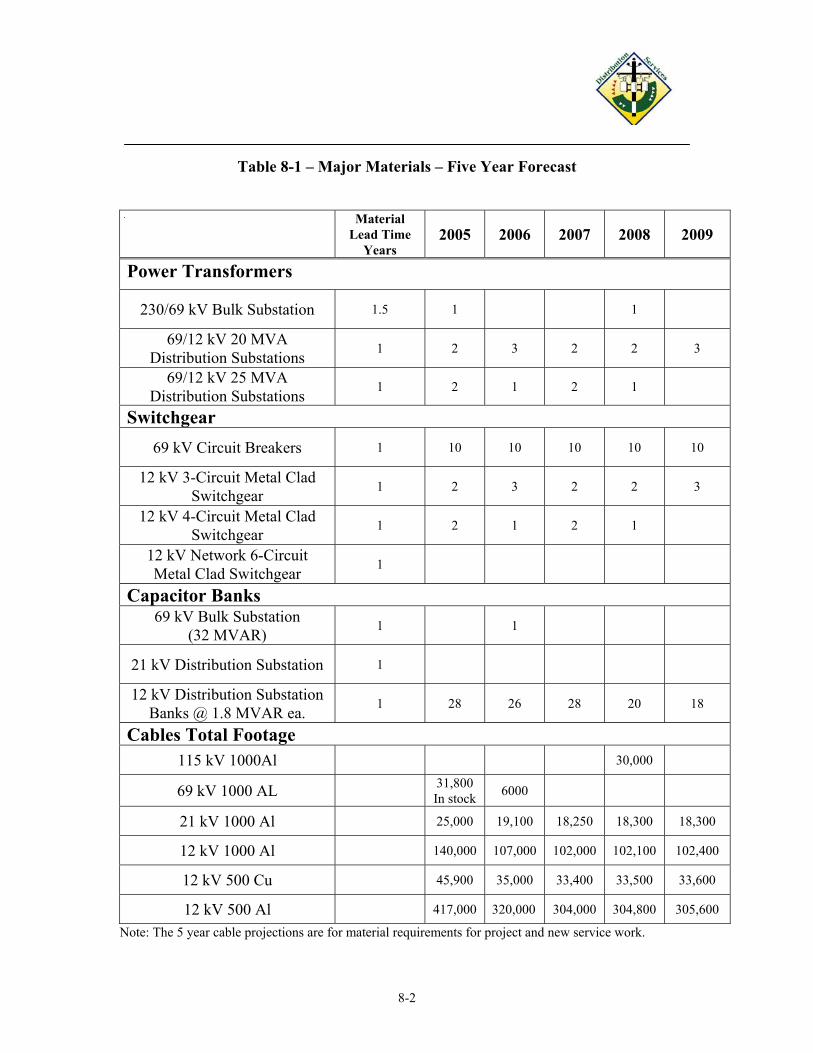
Table 8-1 – Major Materials – Five Year Forecast
Material
Lead Time Years
2005 2006 2007 2008 2009
Power Transformers
230/69 kV Bulk Substation 1.5 1 1
69/12 kV 20 MVA Distribution Substations 1 2 3 2 2 3
69/12 kV 25 MVA Distribution Substations 1 2 1 2 1
Switchgear
69 kV Circuit Breakers 1 10 10 10 10 10
12 kV 3-Circuit Metal Clad Switchgear 1 2 3 2 2 3
12 kV 4-Circuit Metal Clad Switchgear 1 2 1 2 1
12 kV Network 6-Circuit Metal Clad Switchgear 1
Capacitor Banks 69 kV Bulk Substation
(32 MVAR) 1 1
21 kV Distribution Substation 1
12 kV Distribution Substation Banks @ 1.8 MVAR ea. 1 28 26 28 20 18
Cables Total Footage 115 kV 1000Al 30,000
69 kV 1000 AL 31,800 In stock 6000
21 kV 1000 Al 25,000 19,100 18,250 18,300 18,300
12 kV 1000 Al 140,000 107,000 102,000 102,100 102,400
12 kV 500 Cu 45,900 35,000 33,400 33,500 33,600
12 kV 500 Al 417,000 320,000 304,000 304,800 305,600
Note: The 5 year cable projections are for material requirements for project and new service work.
8-2
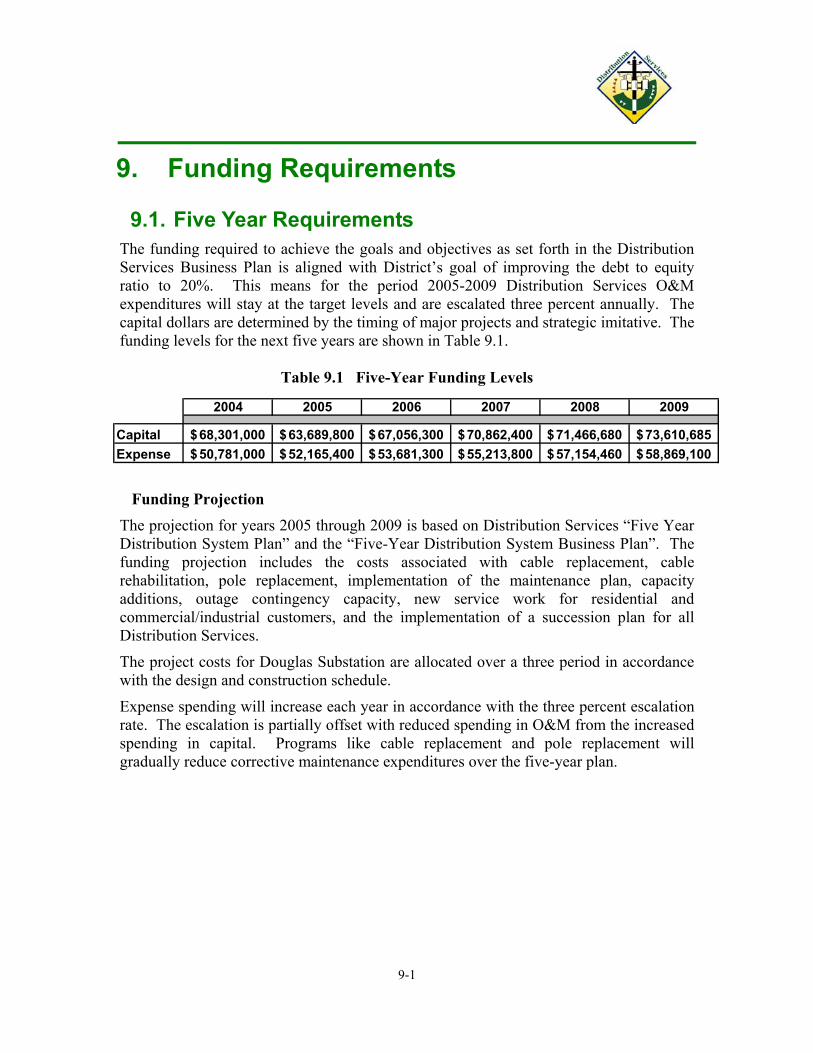
9. Funding Requirements
9.1. Five Year Requirements The funding required to achieve the goals and objectives as set forth in the Distribution Services Business Plan is aligned with District’s goal of improving the debt to equity ratio to 20%. This means for the period 2005-2009 Distribution Services O&M expenditures will stay at the target levels and are escalated three percent annually. The capital dollars are determined by the timing of major projects and strategic imitative. The funding levels for the next five years are shown in Table 9.1.
Table 9.1 Five-Year Funding Levels
2004 2005 2006 2007 2008 2009
Capital 68,301,000$ 63,689,800$ 67,056,300$ 70,862,400$ 71,466,680$ 73,610,685$ Expense 50,781,000$ 52,165,400$ 53,681,300$ 55,213,800$ 57,154,460$ 58,869,100$
Funding Projection The projection for years 2005 through 2009 is based on Distribution Services “Five Year Distribution System Plan” and the “Five-Year Distribution System Business Plan”. The funding projection includes the costs associated with cable replacement, cable rehabilitation, pole replacement, implementation of the maintenance plan, capacity additions, outage contingency capacity, new service work for residential and commercial/industrial customers, and the implementation of a succession plan for all Distribution Services.
The project costs for Douglas Substation are allocated over a three period in accordance with the design and construction schedule.
Expense spending will increase each year in accordance with the three percent escalation rate. The escalation is partially offset with reduced spending in O&M from the increased spending in capital. Programs like cable replacement and pole replacement will gradually reduce corrective maintenance expenditures over the five-year plan.
9-1

________________________________________________ Substation Capacity Projects
Appendix B
Project # In Service
Date Substation Capacity
(MVA) B-213 2005 East Natoma-Golf Links Sub. 20 A-703 2005 Elkhorn-Natomas Sub. (Site Q) 25 A-505 2005 El Centro-Del Paso (Site K) 25 D-307 2005 Franklin-Elk Grove Sub. 20
A-602 2006 Del Paso-East Commerce Sub. (Site E) 25 C-405 2006 Station D #2 (115/21 kV) 40 D-512 2006 Sunco Trade Center #2 20 D-245 2006 Lent Ranch Sub. 20 D-513 2006 North Vineyard Sub. 20
A-708 2007 Elkhorn – Natomas #2 Sub 25 A-707 2007 Elkhorn - Lonetree 25 C-279 2007 Granite Regional Park Sub. # 1 20 D-606 2007 Douglas Substation (230/69 kV) 224 D-608 2007 Poppy Ridge Hwy 99 20
C-320 2008 Richards Sub. (115/21kV) 40 B-414 2008 Iron Point - McAdoo 20 A-820 2008 PFE - Walerga 25 D-705 2008 Zinfandel Baroque 20
B-300 2009 Sylvan-Auburn Sub Add 2nd Bank 20 B-405 2009 Broadstone – Golf Links 20 D-901 2009 Whiterock #2 20

________________________________________________
Line Capacity Projects
Appendix C
Project #In Service
Date Project Name VoltageDistance (Miles)
B-213b 2005 69kV from East Natoma-Golf Links North 69 3.0A-311 2005 Natomas 69kV Ckt # 2 & #3 69 4.2A-365 2005 El Centro 69 kV Extension 69 4.8A-402 2005 Site Q 69kV extension 69 9.1A-600 2005 El Centro 69 kV Rebuild 69 10.2D-307 2005 Franklin-Elk Grove 69kV extension 69 0.169-252 2005 69kV UG betw ENatoma-GolfLinks & Brdstone 69 7.1B-303 2005 69kV UG from Brdstone-GolfLinks South 69 3.5A-504 2005 Metro Air Park 69 kV Tie 69 11.0A-505 2005 El Centro-Del Paso (Site K) 69 0.5A-506 2005 Elkhorn / Map 69kV extension 69 8.3A-507 2005 Natomas # 1 & # 5 Extension 69 10.7D-330 2005 Elk Grove # 3 Reconductor 69 20.0D-509 2005 Whiterock 69kV extension (Teichert Plant) 69 16.0D-510 2005 Elk Grove # 6 Reconductor 69 33.8D-511 2005 69kV along Bradshaw Rd (Elk Grove to Florin) 69 30.0
A-602 2006 Del Paso-East Commerce Sub. (Site E) 69 0.5D-246 2006 Lent Ranch 69kV extension 69 0.5A-503 2006 Elverta #5 & #6 69kV feeder extension 69 6.6A-601 2006 Del Paso / El Centro 69kV Rebuild 69 3.5D-512 2006 Sunco Trade Center- 69kV line extension 69 0.2D-513 2006 North Vineyard 69kV work 69 0.1D-610 2006 Douglas Road Dbl Ckt 69kV & Grantline Road 69 40.1B-405 2006 Golf Links-Broadstone Sub - 69kV work 69 1.0
B-706 2007 Scott-White Rock Sub. - 69kV work 69 7.5C-283 2007 Granite Regional Park 69kV work 69 5.0D-606 2007 Douglas Bulk Sub. 69kV Feeder Exits 69 55.4D-608 2007 Poppy Ridge/ Hwy 99 69kV work 69 0.5
D-705 2008 Zinfandel Baroque 69kV 69 15B-300 2008 Sylvan-Auburn Sub. - 69 kV work 69 0.5B-414 2006 Iron Point-McAdoo Sub. 69kV work 69 1.0