distribution of small molecular weight drugs into the
TRANSCRIPT

Distribution of Small Molecular Weight Drugs into the Porcine Lens:Studies on Imaging Mass Spectrometry, Partition Coefficients, andImplications in Ocular PharmacokineticsEmma M. Heikkinen,*,† Seppo Auriola,‡ Veli-Pekka Ranta,† Nicholas J. Demarais,§ Angus C. Grey,∥
Eva M. del Amo,⊥ Elisa Toropainen,†,# Kati-Sisko Vellonen,† Arto Urtti,†,¶,∇ and Marika Ruponen†
†School of Pharmacy, Biopharmacy Department, ‡School of Pharmacy, Pharmaceutical Chemistry Department, and #Institute ofClinical Medicine, University of Eastern Finland, Yliopistonranta 1, Kuopio 70211, Finland§School of Biological Sciences, University of Auckland, Private Bag 92019, Auckland 1142, New Zealand∥University of Auckland, School of Medical Sciences, Department of Physiology, Private Bag 92019, Auckland 1142, New Zealand⊥School of Health Sciences, Division of Pharmacy & Optometry, University of Manchester, Oxford Road, Manchester M13 9PL,U.K.¶Faculty of Pharmacy, Division of Pharmaceutical Biosciences, University of Helsinki, Viikinkaari, Helsinki 00014, Finland∇Institute of Chemistry, Saint Petersburg State University, 26 Universitetskii Prospect, Saint Petersburg 198504, Russia
*S Supporting Information
ABSTRACT: Lens is the avascular tissue in the eye between the aqueoushumor and vitreous. Drug binding to the lens might affect ocularpharmacokinetics, and the binding may also have a pharmacological role indrug-induced cataract and cataract treatment. Drug distribution in the lens hasbeen studied in vitro with many compounds; however, the experimentalmethods vary, no detailed information on distribution between the lenssublayers exist, and the partition coefficients are reported rarely. Therefore,our objectives were to clarify drug localization in the lens layers and establishpartition coefficients for a wide range of molecules. Furthermore, we aimed to illustrate the effect of lenticular drug binding onoverall ocular drug pharmacokinetics. We studied the distribution of 16 drugs and three fluorescent dyes in whole porcine lensesin vitro with imaging mass spectrometry and fluorescence microscopy techniques. Furthermore, we determined lens/bufferpartition coefficients with the same experimental setup for 28 drugs with mass spectrometry. Finally, the effect of lenticularbinding of drugs on aqueous humor drug exposure was explored with pharmacokinetic simulations. After 4 h, the drugs and thedyes distributed only to the outermost lens layers (capsule and cortex). The lens/buffer partition coefficients for the drugs werelow, ranging from 0.05 to 0.8. On the basis of the pharmacokinetic simulations, a high lens-aqueous humor partition coefficientincreases drug exposure in the lens but does not significantly alter the pharmacokinetics in the aqueous humor. To conclude, thelens seems to act mainly as a physical barrier for drug distribution in the eye, and drug binding to the lens affects mainly thedrug pharmacokinetics in the lens.
KEYWORDS: lens, drug distribution, ocular, pharmacokinetics, imaging mass spectrometry, MALDI-IMS
1. INTRODUCTION
Lens is a transparent, avascular organ positioned in the eyebetween the aqueous humor and vitreous. The main functionof the lens is to change the focal distance of the eye, whichensures the formation of a clear image to the retina withvarious object distances. The lens consists of the lens capsule,lens anterior epithelial cell monolayer, and lens fiber cells1
(Figure S1). The lens capsule surrounds the epithelial and fibercells of the lens and allows the permeation of even largemolecules to the lens.2−4 The lens epithelial cell layer lies inthe anterior lens and possesses tight junctions.5 The fiber cells,named for their long length, are differentiated epithelial cellsthat have migrated from the anterior lens to the lens equatorand further toward the lens center during lens growth. The lensfiber cells can be further divided into loosely structured lens
cortex, which consists of the young lens fiber cells, and denselens nucleus, which consists of the oldest. The maincomponents of the lens are water and proteins, mainly variouscrystallins, and their concentrations vary between the lenscortex and nucleus, the cortex having higher water and lowerprotein content than the nucleus.1 The lens lipids contain ahigh level of cholesterol, and they are mostly associated withproteins in the cell membranes.6 Thus, the lipid content of lensalso increases from the cortex to the nucleus. For a more
Received: May 28, 2019Revised: July 19, 2019Accepted: July 26, 2019Published: July 26, 2019
Article
pubs.acs.org/molecularpharmaceuticsCite This: Mol. Pharmaceutics 2019, 16, 3968−3976
© 2019 American Chemical Society 3968 DOI: 10.1021/acs.molpharmaceut.9b00585Mol. Pharmaceutics 2019, 16, 3968−3976
This is an open access article published under a Creative Commons Attribution (CC-BY)License, which permits unrestricted use, distribution and reproduction in any medium,provided the author and source are cited.
Dow
nloa
ded
via
UN
IV O
F H
EL
SIN
KI
on S
epte
mbe
r 19
, 201
9 at
09:
40:2
0 (U
TC
).Se
e ht
tps:
//pub
s.ac
s.or
g/sh
arin
ggui
delin
es f
or o
ptio
ns o
n ho
w to
legi
timat
ely
shar
e pu
blis
hed
artic
les.

detailed, yet introductory, description of the anatomy of thelens, see the Supporting Information.The role of lens in ocular pharmacology is known to some
extent. First, the lens acts as a physical barrier that limits drugentrance from the anterior chamber to the vitreous and viceversa.7 Therefore, drug distribution between the anterior andposterior parts of the eye becomes easier in aphakic eyes.8,9
Second, drugs may bind to the lens, thereby affecting ocularpharmacokinetics. Third, the lens is the target tissue inpotential drug treatments of cataract (i.e., lens opacity).10−12
For a pharmacological effect, the drug must diffuse deepenough into the lens. Studies on anticataract drugs have notexplored the actual drug distribution or binding in the lens,though the pharmacological effect indicates that at least a lowdrug concentration in the target site is achieved. On the otherhand, drug binding to the lens may also result in cataractformation, for example, with the use of corticosteroids,phenothiazines, and busulfan.13
Drug distribution to the isolated lenses has been studiedwith various compounds, such as pilocarpine,14 chloramphe-nicol,15 dexamethasone,15 epinephrine,15 pilocarpine,15 tim-olol,16 and some aldose reductase inhibitors.17 Drugdistribution between the lens capsule, cortex, and nucleus,however, has not been reported in detail in the literature. Onecomprehensive study with 13 small molecular weight drugsinvestigated the in vitro drug partitioning to rabbit lens andlinked compound lipophilicity with increased lens-incubateconcentration ratio and uptake rate to the lens.18 This studyalso reported concentrations of some drugs in the lens capsuleand body (lens epithelium and fiber cells) and concluded thatlipophilic drugs can penetrate to the lens body and showhigher lens affinity than more polar compounds. In thesestudies, the experimental methods vary, and only rarely actuallens/buffer partition coefficients were reported.Drug distribution between the lens capsule and the
epithelium−cortex−nucleus has been previously studied withradiolabeled compounds, necessitating the mechanical iso-lation of different layers of the lens.14 Imaging massspectrometry (IMS) is a novel technique that should enableanalysis of various compounds simultaneously in the lens tissueat high spatial resolution (≈10 μm).19−21
In the present work, we aimed to study the localization ofvarious compounds in porcine lens with matrix-assisted laserdesorption/ionization IMS (MALDI-IMS) and fluorescencemicroscopy. Furthermore, we determined the lens/bufferpartition coefficients (Kp) for 28 drugs in the isolated porcinelens with liquid chromatography−mass spectrometry (LC−MS/MS). Finally, we illustrated the pharmacokinetic role oflenticular drug distribution with pharmacokinetic simulations.
2. MATERIALS AND METHODS2.1. Tissue Isolation. Enucleated porcine eyes were
received from a local slaughterhouse and transported to thelaboratory in cooled 25 mM phosphate-buffered saline (PBS)within 6 h after enucleation. Extraocular tissues were removedfrom the isolated eyeballs. Then, the eye was cut open fromlimbus and the lens was collected carefully with a spatula. Thelenses were weighed and immediately used in the experiments.2.2. Extent of Drug Distribution into the Isolated
Porcine Lens. 2.2.1. Preparation of the Cassette Mix. Drugdistribution to the lenses was determined by using a mixture of32 compounds: the compounds and their chemical descriptors,vendors, and solvents for stock solutions are listed in ref.22
Lornoxicam was excluded from the mix. Stock solutions [0.5−10 mg/mL in PBS or dimethyl sulfoxide (DMSO)] werecombined and diluted further with Hanks’ balanced saltsolution (HBSS)−HEPES (25 mM) (pH 7.4). Octanol−waterdistribution coefficients of the compounds (log D7.4) and polarsurface areas (PSAs) were previously estimated in silico fromcompound structures with ACD/Labs-software (v12, Ad-vanced Chemistry Development, Inc., Canada).22
2.2.2. Drug Distribution into the Lens: Studies for MALDI-IMS. 2.2.2.1. Incubation. To determine distribution of cassettemix drugs in the lens, the isolated porcine lenses (n = 10) wereincubated in 1200 μL of prewarmed drug solution in cappedflat-bottomed polystyrene vials sealed with parafilm at +35 °Cin a horizontal shaker (Heidolph incubator 1000, HeidolphElektro GmbH & Co., Germany) at 150 rpm shaking. After 4h, the buffer was removed from the vials and the lenses wererinsed with HBSS−HEPES and gently blotted dry. The lenseswere weighed, snap-frozen with liquid nitrogen in flat-bottomed plastic tubes, and then stored at −80 °C untilsample preparation and analysis with MALDI-IMS. For theexperiment, a smaller set of 16 drugs was used. The finalincubation mixture of drugs consisted of acetazolamide,ampicillin, atenolol, atropine, betaxolol, carteolol, ciproflocaxin,ketorolac, lincomycin, nadolol, pilocarpine, pindolol, andpropranolol, each at 10 μg/mL. Also, aztreonam, methazola-mide, and tizanidine were included at 100 μg/mL. FinalDMSO concentration of the solution was 2%.
2.2.2.2. Tissue Preparation. The frozen lenses weremounted onto a chuck using an optimal cutting temperaturecompound (Sakura Finetek, CA, USA) on the equatorial side.The lenses were sectioned to 10 μm thickness at −20 °C on aLeica CM Cryostat (S3050, Leica Microsystems GmbH,Germany), equipped with a FEATHER Microtome C35blade (pfm medical, UK), and collected on a cryofilm(3C16UF, SECTION-LAB Co. Ltd. Yokohama, Japan) bymodified Kawamoto method.23 The film was subsequentlymounted onto a microscopy glass slide using a double-sidedcopper tape. The slides were washed twice with 50 mMammonium formate for 30 s and dried in a vacuum desiccator.The sample slides contained three lens sections from the drugmixture experiment and three blanks. To quantify the amountof each compound present in incubated lenses, 1 μL ofstandard mixture was added on one of the blank lenses usingconcentrations of 0.1, 0.5, 2, and 10 μg/mL. First, the internalstandard solution of atropine-d5 (200 ng/mL in 50%acetonitrile) was sprayed to obtain a 10.2 ng/cm2 correspond-ing to approximately 10 μg/g in the tissue. Matrix α-cyano-4-hydroxycinnamic acid (7 mg/mL in 50% acetonitrilecontaining 1% trifluoro acetic acid) (Sigma-Aldrich, St.Louis, MO, USA) was added via spray deposition using 10passes, flow rate of 100 μL/min, temperature of 77 °C, trackspacing of 2.5 mm, and velocity of 1300 mm/min (HTXIndustries, TM-Sprayer, NC, USA).
2.2.2.3. Fourier Transform-Ion Cyclotron Resonance-IMS.MALDI Fourier transform-ion cyclotron resonance (FT-ICR)-IMS was performed using a Bruker 7T solariX XR massspectrometer (Bruker Daltonics, Germany) at a 75 μm spatialresolution. Spectra were collected in positive ion mode inmass-to-charge ratio (m/z) range of 100−1000, and theresolution was 61 000 at m/z 307. The compounds and m/zvalues ([M + H]+) used were as follows: atropine 290.1751,propranolol 260.1645, atenolol 267.1703, carteolol293.18601860, pilocarpine 209.1285, methazolamide
Molecular Pharmaceutics Article
DOI: 10.1021/acs.molpharmaceut.9b00585Mol. Pharmaceutics 2019, 16, 3968−3976
3969

237.0111, pindolol 249.1598, tizanidine 254.0262, nadolol310.2013, lincomycin 407.2210, and fluconazole 307.1113.2.2.2.4. Analysis of FT-ICR Data and Image Processing.
FT-ICR data were read into Fleximaging 4.1 software (BrukerDaltonics, Germany) and normalized against the d5-atropineinternal standard signal at m/z 295. The drugs were identifiedas their [M + H]+ ions. Peak finding was performed using masserror less than 2.5 ppm. MALDI images for each detectedcompound were plotted using a 0.01 μ mass window. From theimages of the individual drugs, the intensity profiles across a 30pixel (2.25 mm) wide area in anterior−posterior axis wereplotted with ImageJ software (National Institutes of Health,USA).2.2.3. Partition Coefficients for Cassette Mix Drugs.
2.2.3.1. Incubation. To determine the Kp values, thedistribution study was conducted as described in Section2.2.2, but the incubation volume (300 μL), the number ofdrugs, and the drug concentrations in the cassette mix weredifferent. For this experiment, the whole mix of 32 drugs wasused. The test concentrations of the drugs in the cassette mixwere 1 and 10 μg/mL: 1 μg/mL was used for all compoundsexcept aztreonam, bromfenac, dexamethasone, diclofenac,fluorometholone, indomethacin, levocabastine, methazolamide,prednisolone, quinidine, and tizanidine. For these compounds,a concentration of 10 μg/mL was used. Two different drugconcentrations were used to ensure reliable quantitation in theLC−MS/MS analyses. The DMSO concentration of the finalmixture was 0.9%. The lenses were stored at −80 °C untilsample preparation and analysis with LC−MS/MS.2.2.3.2. Sample Preparation for LC−MS/MS. The lenses
were homogenized first with plastic homogenization pestlesand then with ULTRA-TURRAX (model T8, IKA-WerkeGmbH & Co. KG, Germany) in HBSS−HEPES (1 g lens + 9mL buffer). Lens homogenate (200 μL) was mixed with 400μL of methanol (Chromasolv LC−MS Ultra, HoneywellRiedel-de Haen, NC, USA), containing internal standardsatenolol-d7 (Toronto Research Chemicals Inc., Canada),atropine-d5 (Toronto Research Chemicals Inc., Canada),fluconazole-d4 (Toronto Research Chemicals Inc., Canada),and lincomycin-d3 (Toronto Research Chemicals Inc.,Canada) at 24.4 ng/mL each and vortexed. The sampleswere centrifuged at 16 060g for 10 min at +4 °C and theirsupernatants were collected and stored at −20 °C. On the dayof LC−MS run, the sample supernatants (300 μL) werefiltered through a Captiva ND lipid-plate (Agilent Technolo-gies, CA, USA) to a Captiva 96 deep well collection plate(Agilent Technologies, CA, USA) by centrifugation at 1560gfor 40 min at +4 °C. Duplicate standards (eight levels, 5−1000ng/mL) and triplicate quality control (QC) samples (50, 250and 1000 ng/mL) were prepared from cassette mix workingsolutions in a similarly diluted lens homogenates as the actualsamples.2.2.3.3. LC−MS/MS Analysis. For detailed description of the
LC−MS/MS acquisition method, see ref 22. For the LC−MS/MS analyses, the lens samples were run in two separate analysisbatches with independent standards and QC samples. Theresulting data were analyzed with Agilent MassHunterQuantitative Analysis software (vB.09.00, build 9.0.647.0,Agilent Technologies, CA, USA). Internal standards wereused in the calculations. The calibration curves were calculatedfrom duplicate standard series, one of which was run in thebeginning and the other at the end of each analysis. Quadraticfitting with 1/x weighing was used. The criteria for calibration
curve and QC acceptance were 80−120% accuracy of mean for≥66.7% of calibration levels and at LLOQ, 80−120% accuracyfor ≥66.7% of individual QCs and QC levels and <20%coefficient of variation for ≥66.7% of QC levels. The selectivitycriterion of ≥3-fold response ratio of LLOQ to matrix-basedblank sample was employed.
2.2.3.4. Calculation of Lens/Buffer Partition Coefficients(Kp). From the LC−MS/MS results, Kp values were firstcalculated using the total lens volume (eq 1)
= =−
KC
C
m V
C m V
/
/plens,4h
inc,4h
lens,4h lens
inc,init lens,4h inc (1)
where Clens,4h is the drug concentration in the lens at 4 h (ng/mL), Cinc,4h is the drug concentration in the incubate at 4 h(ng/mL), mlens,4h is the drug amount in the lens at 4 h (ng),Vlens is the lens volume (mL) (calculated with the actual lensmass and lens density of 1.183 g/mL24), Cinc,init is the initialdrug concentration in the incubate (ng/mL), and Vinc is thevolume of the buffer (mL).The drug concentration in the incubate at 4 h was calculated
by using the initial drug concentration in the buffer (Cinc,init),buffer volume (Vinc), and drug amount in the lens at 4 h(mlens,4h) instead of the measured concentration in the incubatebecause the concentration in the incubate showed very littledecrease (<5−10%) during the incubation. Kp values were alsocalculated with the actual lens volume into which thecompounds distribute based on the MALDI IMS data (truedistribution volume instead of the total lens volume) (see theSupporting Information). The same approximation for thevolume of distribution was assumed for all cassette mixcompounds.
2.3. Distribution Patterns of Fluorescent Dyes withinthe Lens. 2.3.1. Fluorescent Dyes. The distribution patternsof the compounds in the porcine lenses were studied withthree fluorescent dyes with varying lipophilicities. Rhodamine-B and fluorescein sodium (Sigma-Aldrich) were dissolved intoHBSS−HEPES (pH 7.4) at 1 mg/mL concentration. Rhod-amine-123 (Sigma-Aldrich) was first dissolved into ethanol (10mg/mL) and then diluted in HBSS−HEPES (pH 7.4) to reach0.1 mg/mL (final ethanol concentration was 1%).
2.3.2. Incubation. The distribution studies with fluorescentdyes were conducted separately for each dye, as described inSection 2.2.2, with an incubation volume of 1200 μL. Afterincubation, the lenses were rinsed, blotted dry, frozen in anoptimal cutting temperature compound (Sakura Finetek, SA,USA) in plastic tubes with chilled 2-propanol, and stored at−20 °C until cryosectioning.
2.3.3. Fluorescence Microscopy. The lenses were sectionedto a thickness of 10 μm at −20 °C with Leica CM cryostat(Leica 3050S, Leica Microsystems GmbH, Germany)equipped with a FEATHER Microtome C35 blade (pfmmedical, UK) and collected on a SuperFrost Plus adhesionmicroscope slide (Thermo Fisher Scientific, MA, USA). Thetissue slices were imaged with a fluorescence microscope(Zeiss Axio Imager M2, Carl Zeiss Microscopy GmbH,Germany) equipped with filters 470 nm (65HEAF488) and590 nm (64HEmPlum) filters and Axiocam MRm camera(Carl Zeiss Microscopy GmbH, Germany) using a 2.5-foldmagnification. Exposure times were 600 ms for fluoresceinsodium, 600 ms for rhodamine-B, and 1 s for rhodamine-123.Individual images of the lens sections were merged togethermanually with GNU image processing software (v2.10.6).
Molecular Pharmaceutics Article
DOI: 10.1021/acs.molpharmaceut.9b00585Mol. Pharmaceutics 2019, 16, 3968−3976
3970
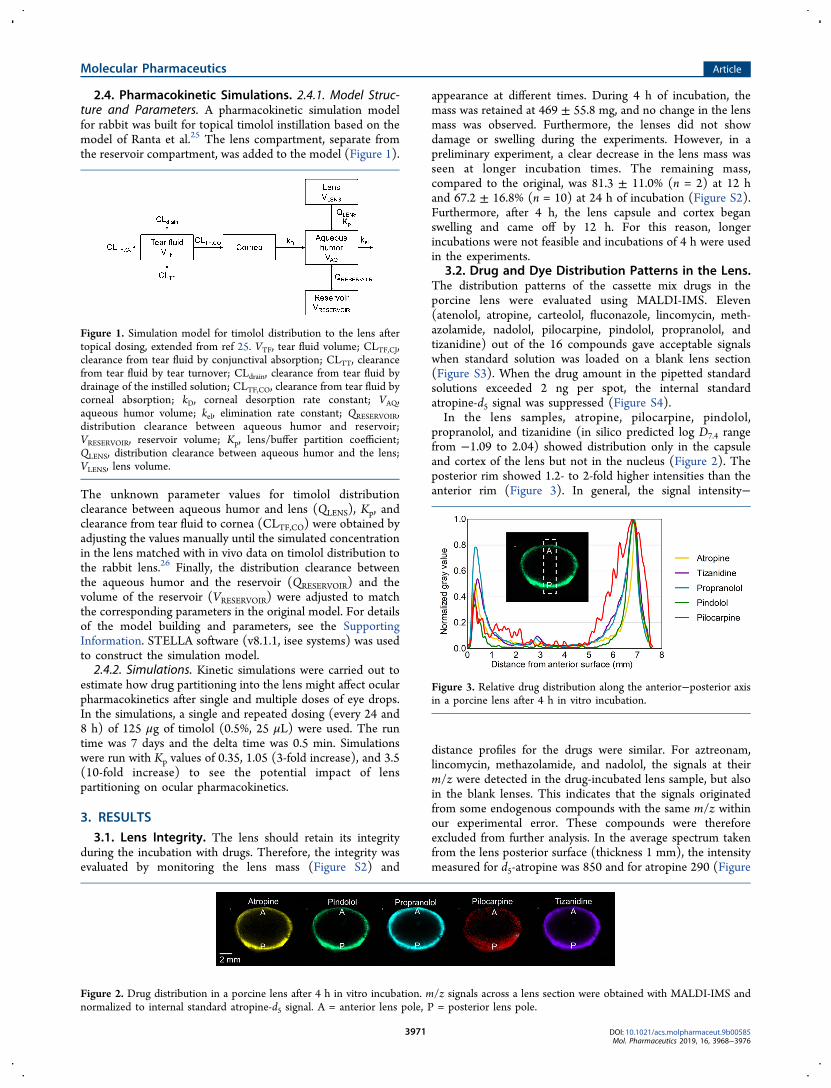
2.4. Pharmacokinetic Simulations. 2.4.1. Model Struc-ture and Parameters. A pharmacokinetic simulation modelfor rabbit was built for topical timolol instillation based on themodel of Ranta et al.25 The lens compartment, separate fromthe reservoir compartment, was added to the model (Figure 1).
The unknown parameter values for timolol distributionclearance between aqueous humor and lens (QLENS), Kp, andclearance from tear fluid to cornea (CLTF,CO) were obtained byadjusting the values manually until the simulated concentrationin the lens matched with in vivo data on timolol distribution tothe rabbit lens.26 Finally, the distribution clearance betweenthe aqueous humor and the reservoir (QRESERVOIR) and thevolume of the reservoir (VRESERVOIR) were adjusted to matchthe corresponding parameters in the original model. For detailsof the model building and parameters, see the SupportingInformation. STELLA software (v8.1.1, isee systems) was usedto construct the simulation model.2.4.2. Simulations. Kinetic simulations were carried out to
estimate how drug partitioning into the lens might affect ocularpharmacokinetics after single and multiple doses of eye drops.In the simulations, a single and repeated dosing (every 24 and8 h) of 125 μg of timolol (0.5%, 25 μL) were used. The runtime was 7 days and the delta time was 0.5 min. Simulationswere run with Kp values of 0.35, 1.05 (3-fold increase), and 3.5(10-fold increase) to see the potential impact of lenspartitioning on ocular pharmacokinetics.
3. RESULTS3.1. Lens Integrity. The lens should retain its integrity
during the incubation with drugs. Therefore, the integrity wasevaluated by monitoring the lens mass (Figure S2) and
appearance at different times. During 4 h of incubation, themass was retained at 469 ± 55.8 mg, and no change in the lensmass was observed. Furthermore, the lenses did not showdamage or swelling during the experiments. However, in apreliminary experiment, a clear decrease in the lens mass wasseen at longer incubation times. The remaining mass,compared to the original, was 81.3 ± 11.0% (n = 2) at 12 hand 67.2 ± 16.8% (n = 10) at 24 h of incubation (Figure S2).Furthermore, after 4 h, the lens capsule and cortex beganswelling and came off by 12 h. For this reason, longerincubations were not feasible and incubations of 4 h were usedin the experiments.
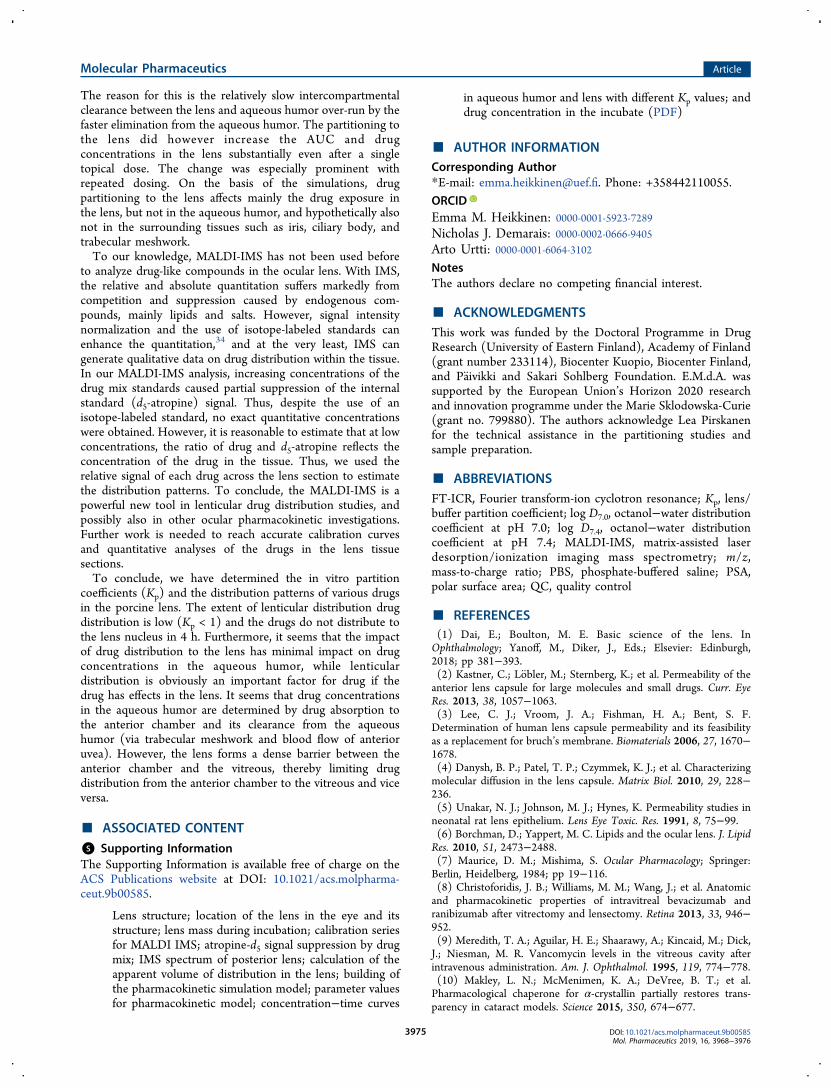
3.2. Drug and Dye Distribution Patterns in the Lens.The distribution patterns of the cassette mix drugs in theporcine lens were evaluated using MALDI-IMS. Eleven(atenolol, atropine, carteolol, fluconazole, lincomycin, meth-azolamide, nadolol, pilocarpine, pindolol, propranolol, andtizanidine) out of the 16 compounds gave acceptable signalswhen standard solution was loaded on a blank lens section(Figure S3). When the drug amount in the pipetted standardsolutions exceeded 2 ng per spot, the internal standardatropine-d5 signal was suppressed (Figure S4).In the lens samples, atropine, pilocarpine, pindolol,
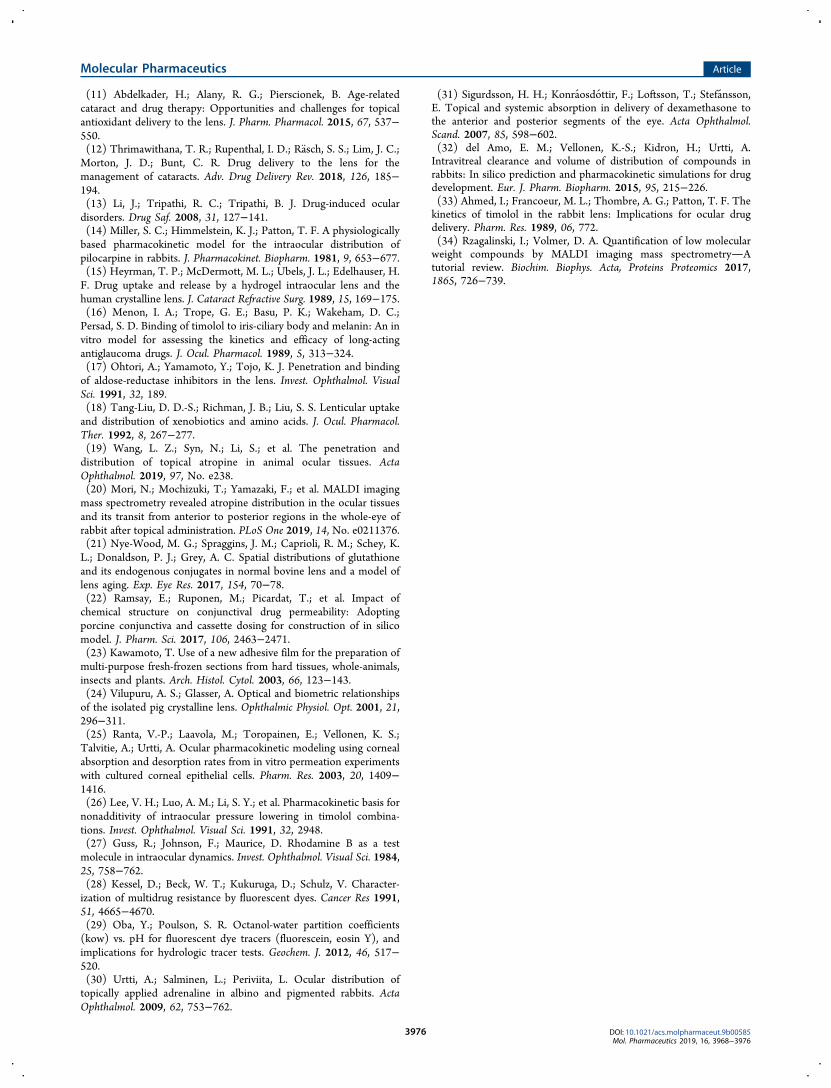
propranolol, and tizanidine (in silico predicted log D7.4 rangefrom −1.09 to 2.04) showed distribution only in the capsuleand cortex of the lens but not in the nucleus (Figure 2). Theposterior rim showed 1.2- to 2-fold higher intensities than theanterior rim (Figure 3). In general, the signal intensity−
distance profiles for the drugs were similar. For aztreonam,lincomycin, methazolamide, and nadolol, the signals at theirm/z were detected in the drug-incubated lens sample, but alsoin the blank lenses. This indicates that the signals originatedfrom some endogenous compounds with the same m/z withinour experimental error. These compounds were thereforeexcluded from further analysis. In the average spectrum takenfrom the lens posterior surface (thickness 1 mm), the intensitymeasured for d5-atropine was 850 and for atropine 290 (Figure
Figure 1. Simulation model for timolol distribution to the lens aftertopical dosing, extended from ref 25. VTF, tear fluid volume; CLTF,CJ,clearance from tear fluid by conjunctival absorption; CLTT, clearancefrom tear fluid by tear turnover; CLdrain, clearance from tear fluid bydrainage of the instilled solution; CLTF,CO, clearance from tear fluid bycorneal absorption; kD, corneal desorption rate constant; VAQ,aqueous humor volume; kel, elimination rate constant; QRESERVOIR,distribution clearance between aqueous humor and reservoir;VRESERVOIR, reservoir volume; Kp, lens/buffer partition coefficient;QLENS, distribution clearance between aqueous humor and the lens;VLENS, lens volume.
Figure 2. Drug distribution in a porcine lens after 4 h in vitro incubation. m/z signals across a lens section were obtained with MALDI-IMS andnormalized to internal standard atropine-d5 signal. A = anterior lens pole, P = posterior lens pole.
Figure 3. Relative drug distribution along the anterior−posterior axisin a porcine lens after 4 h in vitro incubation.
Molecular Pharmaceutics Article
DOI: 10.1021/acs.molpharmaceut.9b00585Mol. Pharmaceutics 2019, 16, 3968−3976
3971

S5). On the basis of the ratio, the concentration of atropine isestimated to be 3.4 μg/g.Distribution studies were also performed with fluorescent
dyes with different lipophilicities. The dyes did not penetrateinto the lens nucleus in 4 h and, thus, fluorescence imagingdata were in accordance with the MALDI-IMS results.Rhodamine-B (experimental log D7.0 = 227) distributed slightlydeeper into the lens cortex than rhodamine-123 (experimentallog D7.0 = 0.428) and fluorescein sodium (experimental log D7.0= 0.129) (Figure 4).
3.3. Lens/Buffer Partition Coefficients. Lens/buffer Kpvalues were obtained for 28 out of 32 drugs by analyzing thedrug amounts in whole porcine lenses with LC−MS/MS. Thewhole lens volume was used in the calculations (eq 1). The Kpvalues were <1.0 for all compounds and <0.5 for most of them(Figure 5). The range was from 0.047 (methazolamide) to0.762 (propranolol).The apparent volume of drug distribution was estimated
from the MALDI-IMS data. On the basis of the MALDI-IMSimages of atropine, pindolol, propranolol, pilocarpine, andtizanidine, the five drugs had a similar spatial distributiondespite having different log D7.4 values, and we estimated thatthe drugs distributed to 27.1% of the total lens volume (see theSupporting Information and Equation S1). This volume wasused for all cassette mix compounds. The use of this volume inthe calculations resulted in higher Kp values (Figure 5), rangingfrom 0.172 (methazolamide) to 2.810 (propranolol). Still, onlysix compounds (propranolol, quinidine, voriconazole, betax-olol, tizanidine, and diclofenac) had Kp > 1.
The Kp values did not show correlation with in silico-predicted log D7.4 within the entire group of drugs (Figure 6,panel A), even though the highest Kp values were seen forcompounds with log D7.4 > 0. Furthermore, the series of β-blockers nadolol, atenolol, carteolol, pindolol, betaxolol, andpropranolol showed increasing Kp with increasing log D7.4(Figure 6, panel A). PSA showed an inverse correlation with Kpin the whole group of drugs (Figure 6, panel B).We did not obtain Kp values for acyclovir, ganciclovir,
aztreonam, and fluorometholone because their quantitativeanalyses did not meet the acceptance criteria.
3.4. Pharmacokinetic Simulations. Pharmacokineticsimulations of a single topical timolol eye drop were carriedout with three lens/buffer Kp values (0.35, 1.05, and 3.5) tosee, whether drug partitioning to the lens affects drugconcentrations or area under the curve (AUC) values in theaqueous humor and the lens. The simulations were also runwith repeated dosing of eye drops at 8 and 24 h intervals.
3.4.1. Single Topical Dose. Neither the simulated peakconcentration nor the shape of the concentration−time curvein aqueous humor were notably affected by the lens Kp (Table1; Figure 7, panel A). In the lens, the peak concentration withKp of 0.35 was 0.28 μg/mL, and with Kp values of 1.05 and 3.5,it was 1.3- and 1.5-fold higher, respectively (Table 1; Figure 7,panel B). Also, AUC0−14d in the lens increased from 111 μg·min/mL 3- and 10-fold, when Kp was increased from 0.35 to1.05 and 3.5, respectively. At 8 h, the drug concentration inaqueous humor was close to 0 regardless of the Kp values,whereas in the lens, the concentration was >0.1 μg/mL with allKp values. The drug concentration in the lens remained above0 for roughly 1, 2, and 8 days with Kp values of 0.35, 1.05, and3.5, respectively.
3.4.2. Repeated Dosing. With every 24 h dosing, the peakconcentration in aqueous humor did not change considerablywith increasing Kp values (Table 1; Figure 8, panel A).Between the doses, the concentration in aqueous humordropped to zero with all Kp values. In the lens, the peakconcentration at steady state was 0.28 μg/mL with Kp of 0.35,and it increased to 1.5- and 3.4-fold with Kp values of 1.05 and3.5, respectively (Table 1; Figure 8, panel B). With the lowestKp (0.35), the concentration in the lens reached 0 between thedoses, whereas with Kp values of 1.05 and 3.5, the minimumconcentrations at steady state were 0.08 and 0.58 μg/mL,respectively.
Figure 4. Distribution of fluorescein (log D7.0 = 0.1), rhodamine-123(log D7.0 = 0.4), and rhodamine-B (log D7.0 = 2) into the porcine lensin vitro after 4 h incubation. A = anterior lens, P = posterior lens.
Figure 5. In vitro lens/buffer partition coefficients (Kp) for the drugs after 4 h incubation with the porcine lens. The Kp values were calculatedbased on the imaged volume of distribution and total anatomical volume of the lens. Mean ± standard deviation (SD), n = 10, except for atenolol n= 5.
Molecular Pharmaceutics Article
DOI: 10.1021/acs.molpharmaceut.9b00585Mol. Pharmaceutics 2019, 16, 3968−3976
3972

With every 8 h dosing, neither the peak nor the minimum
concentration in aqueous humor changed markedly with
increasing Kp (Table 1; Figure 8, panel C). In the lens, the
peak concentrations at steady state increased from 0.34 μg/mL
(Kp 0.35) to 2- and 7-fold with Kp values of 1.05 and 3.5,
respectively (Table 1; Figure 8, panel D). With a Kp of 0.35,
the minimum concentration at steady state was 0.11 μg/mL,
and it increased 5- and 20-fold with Kp values of 1.05 and 3.5,
respectively.
4. DISCUSSION
Drug binding to the lens has a role in ocular pharmacokinetics,pharmacology, and drug delivery. To our knowledge, this is thefirst study that explores lenticular drug distribution using awide range of drugs and dyes. We showed that the extent ofdrug distribution to the porcine lens during 4 h in vitroincubation is low regardless of the compound properties. TheKp values of all drugs ranged from 0.05 to 0.8. Furthermore,the pharmacokinetic simulations indicated that drug partition-ing to the lens does not affect drug concentrations in theaqueous humor but increases the AUC and drug concen-
Figure 6. Relationship between in vitro lens/buffer partition coefficient (Kp) (mean ± SD, n = 5−10) and compound lipophilicity (log D7.4 andPSA) for all of the studied compounds and a series of β-blockers nadolol, atenolol, carteolol, pindolol, betaxolol, and propranolol. The Kp valueswere calculated by using both the image-based distribution volume and the total anatomical volume of the lens.
Table 1. Simulated Timolol Concentrations and AUCs in the Aqueous Humor and Lens with Various Lens/Buffer PartitionCoefficients (Kp) and Dosing Schemes
Kp
0.35 1.05 3.5
single dose of 125 μg (25 μL) aqueous humor Cmax (μg/mL) 2.79 2.79 2.79AUC0−14days (μg·min/mL) 318 318 318
lens Cmax (μg/mL) 0.28 0.36 0.42AUC0−14days (μg·min/mL) 111 333 1111
125 μg (25 μL) once daily aqueous humor Cmax,ss (μg/mL) 2.79 2.79 2.80Cmin,ss (μg/mL) 0.00 0.00 0.00
lens Cmax,ss (μg/mL) 0.28 0.43 0.95Cmin,ss (μg/mL) 0.00 0.08 0.58
125 μg (25 μL) three times daily aqueous humor Cmax,ss (μg/mL) 2.80 2.81 2.81Cmin,ss (μg/mL) 0.01 0.02 0.02
lens Cmax,ss (μg/mL) 0.34 0.80 2.42Cmin,ss (μg/mL) 0.11 0.55 2.16
Figure 7. Simulated timolol concentrations in the aqueous humor and lens after a single 125 μg topical dose to rabbit with different lens/bufferpartition coefficient (Kp) values. The dots present observed timolol concentrations in vivo26 while the lines present the simulated ones. For aqueoushumor, the lines with various Kp values overlap each other.
Molecular Pharmaceutics Article
DOI: 10.1021/acs.molpharmaceut.9b00585Mol. Pharmaceutics 2019, 16, 3968−3976
3973

trations in the lens. It seems that drug partitioning to the lenshas pharmacological significance only if the site of drug actionor toxicity is in the lens.Lens partition coefficients with a broad set of compounds
using the same method have not been presented previously. Ingeneral, the Kp values in previous reports have ranged fromabout 0.3 (pilocarpine15) to 8 (aldose reductase inhibitor CT-11217). The results of this study are roughly in line withpreviously published or recalculated in vitro Kp values. Asexamples from previous literature, pilocarpine has a Kp of 0.3−1.0 in rabbit14 and human15 and dexamethasone 0.3−0.5 inhuman.15 Our Kp values for pilocarpine (0.145) and dexa-methasone (0.102) are slightly lower, but in the same range asthe previous data. Small differences may be caused by testconditions (e.g., incubation time) and species differences inlens biochemistry (e.g., protein content11). Tang-Liu et al.18
reported higher lens/buffer Kp values, more than 5, forlipophilic compounds, but they used a long incubation time of24 h. In our experience, longer than 4 h incubation timesresulted in the loss of lens integrity that may lead tooverestimation of drug distribution into the lens.For most compounds, the incubation time of 4 h was long
enough to reach the concentration equilibrium between theincubate and the lens (see Figure S7). Some compounds suchas ciprofloxacin and diclofenac would have required longerincubation time to reach true equilibria, which might lead tounderestimation of their Kp values. However, it is evident thatdrug distribution to the lens differs substantially from drugdistribution into the iris and ciliary body. The low Kp values forthe lens are in line with ocular pharmacokinetics in vivo, asconcentrations of several drugs (timolol, pilocarpine, atropine,and dexamethasone) in the lens in vivo are much lower than inthe aqueous humor, iris, and ciliary body.14,19,26,30,31 Low Kpvalues are also in line with a report by del Amo et al.,32 whichdemonstrated that the ocular volume of distribution ofintravitreally injected 40 small and 12 macromolecular drugs
was within a narrow range, close to the anatomical volume ofthe vitreous.Interestingly, the drugs and dyes consistently distributed
only to the capsule, epithelium, and cortex of the lens, but notto the lens nucleus. Similar findings have been reported forradiolabeled timolol in vivo33 and arginine vasopressin andprogesterone in vitro.18 The distribution pattern may beexplained by the weaker barrier properties in the lens capsuleand cortex as compared to the lens nucleus. The lens capsuleallows even permeation of macromolecules, such as dextrans(up to 150−160 kDa),2,3 and proteins.4 Thus, it does nothinder the distribution of the small molecular weight drugs tothe lens epithelium and cortex. The lens cortex consists of theyounger, softer lens fiber cells, whereas the older fiber cells aretightly packed in the lens nucleus. This change in theorganization of the lens fibers, higher protein concentrationin the nucleus, and the decrease in extracellular space probablyhinder the permeation of even lipophilic small molecularweight drugs to the lens nucleus. Overall, the tight proteina-ceous structure and low lipid content of the lens seem to resultin low Kp values. The Kp values in total tissue volume were<1.0, and even in the case of true distribution volume, the Kpvalues exceeded 1.0 only in few cases. Relatively low lipidcontent of the lens may explain the correlation and inversecorrelation of Kp with log D7.4 and PSA, respectively, at lowoverall levels of Kp values. In the whole heterogeneous group,the correlation with log D7.4 was not clear, even though weused compounds with distinct levels of hydrophilicity andlipophilicity. For example, the log D7.4 values spanned from−5.10 (methotrexate) to +4.19 (brinzolamide). Moreover, inthe anterior lens, the lens epithelium with tight junctions33
may slow down drug diffusion to the lens fiber cells.Accordingly, the intensities of MALDI-IMS signals werehigher in the posterior than in the anterior lens.In the pharmacokinetic simulations, drug partitioning to the
lens virtually did not affect the drug concentration in theaqueous humor despite repeated dosing and a Kp value of 3.5.
Figure 8. Simulated timolol concentrations in the aqueous humor and lens after repeated topical dosing with different lens/buffer partitioncoefficients (Kp). For aqueous humor, the lines with various Kp values overlap each other.
Molecular Pharmaceutics Article
DOI: 10.1021/acs.molpharmaceut.9b00585Mol. Pharmaceutics 2019, 16, 3968−3976
3974
The reason for this is the relatively slow intercompartmentalclearance between the lens and aqueous humor over-run by thefaster elimination from the aqueous humor. The partitioning tothe lens did however increase the AUC and drugconcentrations in the lens substantially even after a singletopical dose. The change was especially prominent withrepeated dosing. On the basis of the simulations, drugpartitioning to the lens affects mainly the drug exposure inthe lens, but not in the aqueous humor, and hypothetically alsonot in the surrounding tissues such as iris, ciliary body, andtrabecular meshwork.To our knowledge, MALDI-IMS has not been used before
to analyze drug-like compounds in the ocular lens. With IMS,the relative and absolute quantitation suffers markedly fromcompetition and suppression caused by endogenous com-pounds, mainly lipids and salts. However, signal intensitynormalization and the use of isotope-labeled standards canenhance the quantitation,34 and at the very least, IMS cangenerate qualitative data on drug distribution within the tissue.In our MALDI-IMS analysis, increasing concentrations of thedrug mix standards caused partial suppression of the internalstandard (d5-atropine) signal. Thus, despite the use of anisotope-labeled standard, no exact quantitative concentrationswere obtained. However, it is reasonable to estimate that at lowconcentrations, the ratio of drug and d5-atropine reflects theconcentration of the drug in the tissue. Thus, we used therelative signal of each drug across the lens section to estimatethe distribution patterns. To conclude, the MALDI-IMS is apowerful new tool in lenticular drug distribution studies, andpossibly also in other ocular pharmacokinetic investigations.Further work is needed to reach accurate calibration curvesand quantitative analyses of the drugs in the lens tissuesections.To conclude, we have determined the in vitro partition
coefficients (Kp) and the distribution patterns of various drugsin the porcine lens. The extent of lenticular distribution drugdistribution is low (Kp < 1) and the drugs do not distribute tothe lens nucleus in 4 h. Furthermore, it seems that the impactof drug distribution to the lens has minimal impact on drugconcentrations in the aqueous humor, while lenticulardistribution is obviously an important factor for drug if thedrug has effects in the lens. It seems that drug concentrationsin the aqueous humor are determined by drug absorption tothe anterior chamber and its clearance from the aqueoushumor (via trabecular meshwork and blood flow of anterioruvea). However, the lens forms a dense barrier between theanterior chamber and the vitreous, thereby limiting drugdistribution from the anterior chamber to the vitreous and viceversa.
■ ASSOCIATED CONTENT
*S Supporting InformationThe Supporting Information is available free of charge on theACS Publications website at DOI: 10.1021/acs.molpharma-ceut.9b00585.
Lens structure; location of the lens in the eye and itsstructure; lens mass during incubation; calibration seriesfor MALDI IMS; atropine-d5 signal suppression by drugmix; IMS spectrum of posterior lens; calculation of theapparent volume of distribution in the lens; building ofthe pharmacokinetic simulation model; parameter valuesfor pharmacokinetic model; concentration−time curves
in aqueous humor and lens with different Kp values; anddrug concentration in the incubate (PDF)
■ AUTHOR INFORMATIONCorresponding Author*E-mail: [email protected]. Phone: +358442110055.ORCIDEmma M. Heikkinen: 0000-0001-5923-7289Nicholas J. Demarais: 0000-0002-0666-9405Arto Urtti: 0000-0001-6064-3102NotesThe authors declare no competing financial interest.
■ ACKNOWLEDGMENTSThis work was funded by the Doctoral Programme in DrugResearch (University of Eastern Finland), Academy of Finland(grant number 233114), Biocenter Kuopio, Biocenter Finland,and Paivikki and Sakari Sohlberg Foundation. E.M.d.A. wassupported by the European Union’s Horizon 2020 researchand innovation programme under the Marie Sklodowska-Curie(grant no. 799880). The authors acknowledge Lea Pirskanenfor the technical assistance in the partitioning studies andsample preparation.
■ ABBREVIATIONSFT-ICR, Fourier transform-ion cyclotron resonance; Kp, lens/buffer partition coefficient; log D7.0, octanol−water distributioncoefficient at pH 7.0; log D7.4, octanol−water distributioncoefficient at pH 7.4; MALDI-IMS, matrix-assisted laserdesorption/ionization imaging mass spectrometry; m/z,mass-to-charge ratio; PBS, phosphate-buffered saline; PSA,polar surface area; QC, quality control
■ REFERENCES(1) Dai, E.; Boulton, M. E. Basic science of the lens. InOphthalmology; Yanoff, M., Diker, J., Eds.; Elsevier: Edinburgh,2018; pp 381−393.(2) Kastner, C.; Lobler, M.; Sternberg, K.; et al. Permeability of theanterior lens capsule for large molecules and small drugs. Curr. EyeRes. 2013, 38, 1057−1063.(3) Lee, C. J.; Vroom, J. A.; Fishman, H. A.; Bent, S. F.Determination of human lens capsule permeability and its feasibilityas a replacement for bruch’s membrane. Biomaterials 2006, 27, 1670−1678.(4) Danysh, B. P.; Patel, T. P.; Czymmek, K. J.; et al. Characterizingmolecular diffusion in the lens capsule. Matrix Biol. 2010, 29, 228−236.(5) Unakar, N. J.; Johnson, M. J.; Hynes, K. Permeability studies inneonatal rat lens epithelium. Lens Eye Toxic. Res. 1991, 8, 75−99.(6) Borchman, D.; Yappert, M. C. Lipids and the ocular lens. J. LipidRes. 2010, 51, 2473−2488.(7) Maurice, D. M.; Mishima, S. Ocular Pharmacology; Springer:Berlin, Heidelberg, 1984; pp 19−116.(8) Christoforidis, J. B.; Williams, M. M.; Wang, J.; et al. Anatomicand pharmacokinetic properties of intravitreal bevacizumab andranibizumab after vitrectomy and lensectomy. Retina 2013, 33, 946−952.(9) Meredith, T. A.; Aguilar, H. E.; Shaarawy, A.; Kincaid, M.; Dick,J.; Niesman, M. R. Vancomycin levels in the vitreous cavity afterintravenous administration. Am. J. Ophthalmol. 1995, 119, 774−778.(10) Makley, L. N.; McMenimen, K. A.; DeVree, B. T.; et al.Pharmacological chaperone for α-crystallin partially restores trans-parency in cataract models. Science 2015, 350, 674−677.
Molecular Pharmaceutics Article
DOI: 10.1021/acs.molpharmaceut.9b00585Mol. Pharmaceutics 2019, 16, 3968−3976
3975
(11) Abdelkader, H.; Alany, R. G.; Pierscionek, B. Age-relatedcataract and drug therapy: Opportunities and challenges for topicalantioxidant delivery to the lens. J. Pharm. Pharmacol. 2015, 67, 537−550.(12) Thrimawithana, T. R.; Rupenthal, I. D.; Rasch, S. S.; Lim, J. C.;Morton, J. D.; Bunt, C. R. Drug delivery to the lens for themanagement of cataracts. Adv. Drug Delivery Rev. 2018, 126, 185−194.(13) Li, J.; Tripathi, R. C.; Tripathi, B. J. Drug-induced oculardisorders. Drug Saf. 2008, 31, 127−141.(14) Miller, S. C.; Himmelstein, K. J.; Patton, T. F. A physiologicallybased pharmacokinetic model for the intraocular distribution ofpilocarpine in rabbits. J. Pharmacokinet. Biopharm. 1981, 9, 653−677.(15) Heyrman, T. P.; McDermott, M. L.; Ubels, J. L.; Edelhauser, H.F. Drug uptake and release by a hydrogel intraocular lens and thehuman crystalline lens. J. Cataract Refractive Surg. 1989, 15, 169−175.(16) Menon, I. A.; Trope, G. E.; Basu, P. K.; Wakeham, D. C.;Persad, S. D. Binding of timolol to iris-ciliary body and melanin: An invitro model for assessing the kinetics and efficacy of long-actingantiglaucoma drugs. J. Ocul. Pharmacol. 1989, 5, 313−324.(17) Ohtori, A.; Yamamoto, Y.; Tojo, K. J. Penetration and bindingof aldose-reductase inhibitors in the lens. Invest. Ophthalmol. VisualSci. 1991, 32, 189.(18) Tang-Liu, D. D.-S.; Richman, J. B.; Liu, S. S. Lenticular uptakeand distribution of xenobiotics and amino acids. J. Ocul. Pharmacol.Ther. 1992, 8, 267−277.(19) Wang, L. Z.; Syn, N.; Li, S.; et al. The penetration anddistribution of topical atropine in animal ocular tissues. ActaOphthalmol. 2019, 97, No. e238.(20) Mori, N.; Mochizuki, T.; Yamazaki, F.; et al. MALDI imagingmass spectrometry revealed atropine distribution in the ocular tissuesand its transit from anterior to posterior regions in the whole-eye ofrabbit after topical administration. PLoS One 2019, 14, No. e0211376.(21) Nye-Wood, M. G.; Spraggins, J. M.; Caprioli, R. M.; Schey, K.L.; Donaldson, P. J.; Grey, A. C. Spatial distributions of glutathioneand its endogenous conjugates in normal bovine lens and a model oflens aging. Exp. Eye Res. 2017, 154, 70−78.(22) Ramsay, E.; Ruponen, M.; Picardat, T.; et al. Impact ofchemical structure on conjunctival drug permeability: Adoptingporcine conjunctiva and cassette dosing for construction of in silicomodel. J. Pharm. Sci. 2017, 106, 2463−2471.(23) Kawamoto, T. Use of a new adhesive film for the preparation ofmulti-purpose fresh-frozen sections from hard tissues, whole-animals,insects and plants. Arch. Histol. Cytol. 2003, 66, 123−143.(24) Vilupuru, A. S.; Glasser, A. Optical and biometric relationshipsof the isolated pig crystalline lens. Ophthalmic Physiol. Opt. 2001, 21,296−311.(25) Ranta, V.-P.; Laavola, M.; Toropainen, E.; Vellonen, K. S.;Talvitie, A.; Urtti, A. Ocular pharmacokinetic modeling using cornealabsorption and desorption rates from in vitro permeation experimentswith cultured corneal epithelial cells. Pharm. Res. 2003, 20, 1409−1416.(26) Lee, V. H.; Luo, A. M.; Li, S. Y.; et al. Pharmacokinetic basis fornonadditivity of intraocular pressure lowering in timolol combina-tions. Invest. Ophthalmol. Visual Sci. 1991, 32, 2948.(27) Guss, R.; Johnson, F.; Maurice, D. Rhodamine B as a testmolecule in intraocular dynamics. Invest. Ophthalmol. Visual Sci. 1984,25, 758−762.(28) Kessel, D.; Beck, W. T.; Kukuruga, D.; Schulz, V. Character-ization of multidrug resistance by fluorescent dyes. Cancer Res 1991,51, 4665−4670.(29) Oba, Y.; Poulson, S. R. Octanol-water partition coefficients(kow) vs. pH for fluorescent dye tracers (fluorescein, eosin Y), andimplications for hydrologic tracer tests. Geochem. J. 2012, 46, 517−520.(30) Urtti, A.; Salminen, L.; Periviita, L. Ocular distribution oftopically applied adrenaline in albino and pigmented rabbits. ActaOphthalmol. 2009, 62, 753−762.
(31) Sigurdsson, H. H.; Konraosdottir, F.; Loftsson, T.; Stefansson,E. Topical and systemic absorption in delivery of dexamethasone tothe anterior and posterior segments of the eye. Acta Ophthalmol.Scand. 2007, 85, 598−602.(32) del Amo, E. M.; Vellonen, K.-S.; Kidron, H.; Urtti, A.Intravitreal clearance and volume of distribution of compounds inrabbits: In silico prediction and pharmacokinetic simulations for drugdevelopment. Eur. J. Pharm. Biopharm. 2015, 95, 215−226.(33) Ahmed, I.; Francoeur, M. L.; Thombre, A. G.; Patton, T. F. Thekinetics of timolol in the rabbit lens: Implications for ocular drugdelivery. Pharm. Res. 1989, 06, 772.(34) Rzagalinski, I.; Volmer, D. A. Quantification of low molecularweight compounds by MALDI imaging mass spectrometryAtutorial review. Biochim. Biophys. Acta, Proteins Proteomics 2017,1865, 726−739.
Molecular Pharmaceutics Article
DOI: 10.1021/acs.molpharmaceut.9b00585Mol. Pharmaceutics 2019, 16, 3968−3976
3976