distribution automation –smart feeders in a smart …grouper.ieee.org/groups/td/dist/da/members...
TRANSCRIPT

© 2010 Quanta Technology LLC
Distribution Automation – Smart
Feeders in a Smart Grid World
UU208Presented by:
Bob UluskiHahn Tram
Dr. Farid KatiraeiQuanta Technology, LLC
© 2010 Quanta Technology LLC
UU208: Distribution Automation
Smart Feeders in a Smart Grid World
Presented by:Bob UluskiHahn Tram
Dr. Farid Katiraei
Introduction

© 2010 Quanta Technology LLC
Bob Uluski
• DistribuTECH DA/SA Instructor for past 10 years
• 35 years electric utility experience
• Distribution management systems, substation and feeder automation, developing the business case
• Recent DA Projects:
– BC Hydro (Advanced DMS)
– ENMAX (Fdr Auto - Pennwell 2004 Automation Project of the Year)
– Duke Energy (Integrated Volt VAR control)
• Principal author of Down Line Automation Guidebook prepared for NRECA Cooperative Research Network
• Secretary of IEEE PES Smart Distribution Working Group and Task Force on Volt VAR Control
• Registered professional engineer
© 2010 Quanta Technology LLC
Hahn Tram
• Executive Advisor & VP Enterprise with Quanta Technology
• 30+ years in technology solutions for energy utilities
– Helped successful launch of Smart Metering initiatives at Sempra,
BGE, CPS Energy, HECO, etc.
– Supported DMS/OMS implementations at utilities worldwide,
including Cinergy, LGE, Alliant, PG&E, Iberdrola, Korea Electric, etc.
– Helped develop Smart Grid application strategies at Oncor, PHI, etc.
– Helped launch Field Force Automation programs at Exelon, Oncor…
– Careers before joining Quanta:
• Westinghouse, ABB, Convergent Group, SchlumbergerSema, Enspiria
• Industry Activities
– DistribuTECH Advisory Committee Member
– Senior Member of IEEE; Member of Utilimetrics, GITA…
– ~100 publications, short courses, panels and presentations
© 2010 Quanta Technology LLC
Farid Katiraei, PhD
• Senior Advisor of Protection and Automation for Quanta
Technology
• Over 7 years of experience working directly with electric
utilities, governmental research labs and standard committees
• Involved in study and commissioning of several pilot projects in
the area of DG interconnection and renewable energy sources
• Ph.D. in Electrical Engineering, Senior member of IEEE, Several
journal/conference papers and articles
• Member of IEEE P1547.7 and IEA PVPS Task 11 working groups
• Steering committee member of International Microgrid annual
symposium
© 2010 Quanta Technology LLC
Participant Introductions
• Name and Company Affiliation
• Job Responsibilities
• Why did you take this workshop?
• What specific topic(s) do you want covered in
the workshop?
• Other comments?
6

© 2010 Quanta Technology LLC
Agenda
• Introduction
• Feeder automation applications (remote controlled switching, volt-VAR control)
• Distribution management systems and interactions with other enterprise systems
• System components and architecture
• DA Communications
• DA/DMS Role in the “Smart Grid”
• Developing the business case
• Implementation strategies & case studies
• Open Q/A
© 2010 Quanta Technology LLC
Distribution Automation
Not a New Concept?
Many existing examples of automation on the distribution system
Protective Relays
Reclosers, Sectionalizers
Switched Cap Banks
Fully automatic – no man in the loop
Load Tap Changer
© 2010 Quanta Technology LLC
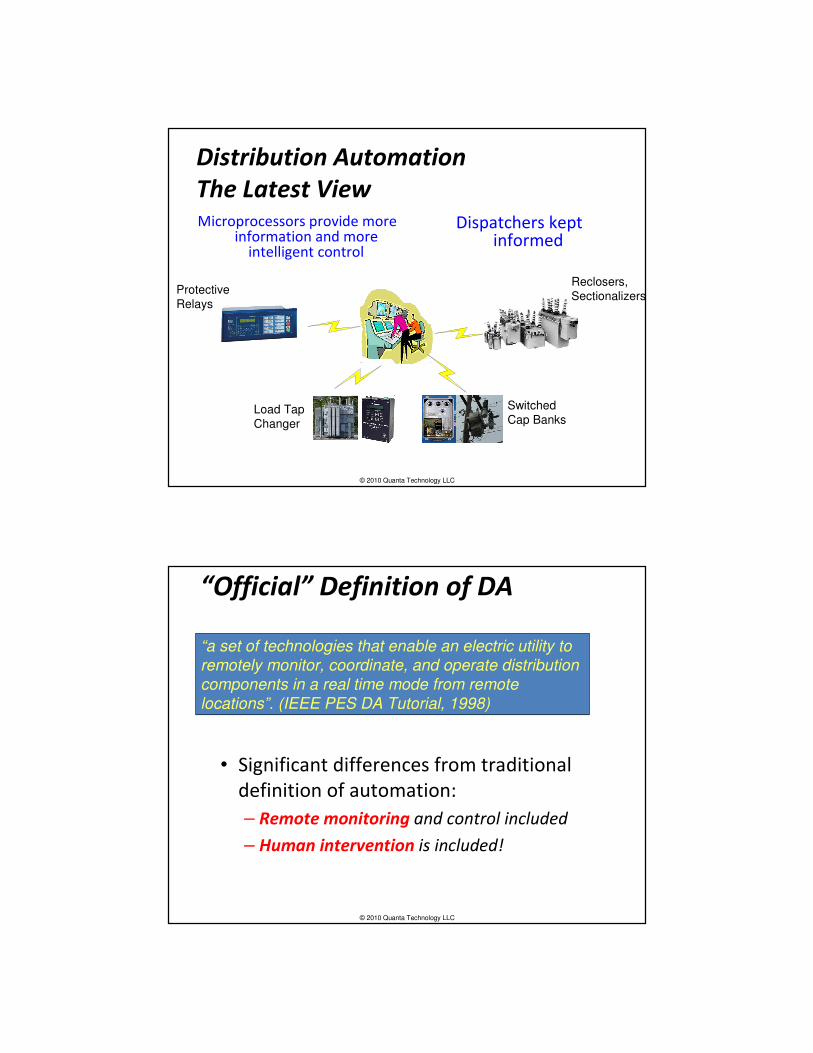
Distribution Automation
The Latest ViewMicroprocessors provide more
information and more intelligent control
Protective Relays
Reclosers, Sectionalizers
Switched Cap Banks
Dispatchers kept informed
Load Tap Changer
© 2010 Quanta Technology LLC
“Official” Definition of DA
• Significant differences from traditional
definition of automation:
– Remote monitoring and control included
– Human intervention is included!
“a set of technologies that enable an electric utility to
remotely monitor, coordinate, and operate distribution
components in a real time mode from remote
locations”. (IEEE PES DA Tutorial, 1998)

© 2010 Quanta Technology LLC
Driving Forces for DA
• Address needs of the 21st Century customer
(the “Smart Grid”)
– Growing customer expectations
– Computers and electronics everywhere
– Service interruptions and power quality
problems unacceptable
• Regulatory “Incentives” (+ and -)
– Economic stimulus funds
– Performance based rates (PBR)
• Pressure to cut costs
© 2010 Quanta Technology LLC
Some Key Definitions
• Supervisory Control and Data Acquisition (SCADA)– a computer and communication system that provides remote
monitoring and remote control of field equipment
– The basic building block for Distribution Automation
• Distribution Automation (DA)– A set of software/hardware applications that use SCADA to control
distribution equipment in an optimal fashion
• Distribution Management System (DMS)– A system with numerous software applications to assist control room
dispatchers in managing the distribution network
– DA is one of these applications, another DMS application is Switch Order Management
© 2010 Quanta Technology LLC
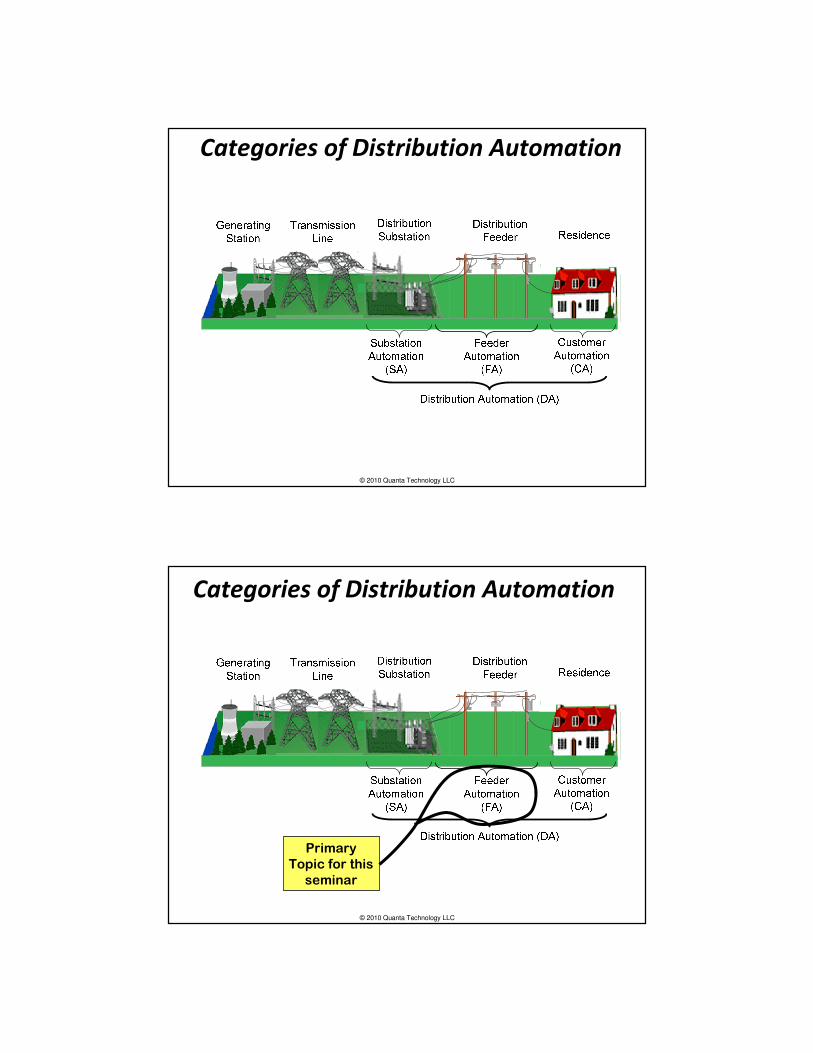
Categories of Distribution Automation
© 2010 Quanta Technology LLC
Primary
Topic for this
seminar
Categories of Distribution Automation

© 2010 Quanta Technology LLC
Distribution System Under Smart Grid
Drawing by General Electric
© 2010 Quanta Technology LLC
Questions?

© 2010 Quanta Technology LLC
Bob Uluski
UU208: Distribution Automation –
Smart Feeders in a Smart Grid World
Automatic Feeder
Switching
© 2010 Quanta Technology LLC
Introduction
• Distribution Feeder Automation is the monitoring
and control of devices located out on the feeders
themselves
– Line reclosers
– Load break switches
– Sectionalizers
– Capacitor banks
– Line regulators

© 2010 Quanta Technology LLC
Main Feeder Automation Applications
• Automated Line Switching (ALS)
• Volt/VAR Control (VVC) (Discussed in next Seminar Module)
© 2010 Quanta Technology LLC
The Value proposition
• Reduce system SAIDI & SAIFI significantly
– Show the concept with a simple illustration
• Accommodate distributed energy resources
• Optimal network reconfiguration
– Reduce peak loading and total technical losses via
load balancing

© 2010 Quanta Technology LLC
Primary ALS Application – “FLISR”
• Fault Location, Isolation, and
Service Restoration
• Use of automated feeder
switching to:
– Detect feeder faults
– Determine the fault location
(between 2 switches)
– Isolate the faulted section of the
feeder (between 2 feeder switches)
– Restore service to “healthy” portions
of the feeder
© 2010 Quanta Technology LLC
Nature of the Problem
• When a permanent fault occurs, customers on “healthy”
sections of the feeder may experience a lengthy outage
• FLISR provides the means to restore service to some
customers before field crews arrive on the scene
FAULTOCCURS
CustomerReportsOutage
FieldCrews
On-Scene
Travel Time
FaultLocated
Fault Investigation& Patrol Time
POWER RESTOREDTO CUSTOMERS ON HEALTHY SECTIONS
OF FEEDERTime to Perform
Manual Switching Repair Time
FeederBack toNormal
5 – 10 minutes
15 – 30 minutes
15 – 20 minutes
10- 15 minutes
45 – 75 minutes

© 2010 Quanta Technology LLC
Time Line Without and With FLISR
FaultOccurs
CustomerReportsOutage
FieldCrews
On-Scene
Travel Time
FaultLocated
Fault Investigation& Patrol Time
POWER RESTOREDTO CUSTOMERS ON HEALTHY SECTIONS
OF FEEDER
Time to PerformManual Switching Repair Time
FeederBack toNormal
5 – 10 minutes
15 – 30 minutes
15 – 20 minutes
10 - 15 minutes
45 – 75 minutes
FAULTOCCURS
FeederBack toNormal
POWER RESTOREDTO CUSTOMERS ON HEALTHY SECTIONS
OF FEEDER
Travel Time
15 – 30 minutes
1 - 4 Hours
Repair Time
1 - 4 Hours
1 to 5 minutes
5 - 10 minutes
PatrolTime
CustomerReportsOutage
5 – 10 minutes
Without FLISR
With FLISR
© 2010 Quanta Technology LLC
Terminology – Sample Feeder
Substation #2
Substation #1 Substation #3
1 2
3
4
5
6 7 8

© 2010 Quanta Technology LLC
Terminology – Automated Switches
Substation #2
Substation #1 Substation #3
1 2
3
4
5
6 7 8
Normally closed (line)
switch
Normally open (tie)
switch
• All switches must be electrically operable
• Can be load break or fault interruptingdevices
© 2010 Quanta Technology LLC
Terminology – Fault Detector (FD)
Substation #2
Substation #1 Substation #3
1 2
3
4
5
6 7 8
FD installed on every switch
FD indicates whether fault current has passed through the switch
NoFault
NoFault
FaultFault
Fault Current

© 2010 Quanta Technology LLC
Terminology – Feeder Sections
Substation #2
Substation #1 Substation #3
1 2
3
4
5
6 7 8
Fault
Faulted Feeder Section
“Healthy”Feeder Section
Section: a portion of the feeder between two automated switches
© 2010 Quanta Technology LLC
Terminology – Sources
Substation #2
Substation #1 Substation #3
1 2
3
4
5
6 7 8
“Strong” Source – Capable of
carrying a significant part of
feeder 1 if necessary
“Weak” Source – Capable of
carrying only a small part of
feeder 1
• Alternate sources required
for maximum DA benefit
• Strong or Weak Source

© 2010 Quanta Technology LLC
FLISR Operation – A Fault Occurs
Substation #2
Substation #1 Substation #3
1 2
3
4
5
6 7 8
Permanent fault occurs in section surrounded by switches 2, 3 and 6
FDs at switches 1 and 2 detect the fault
FLISR stores value of load through each switch just prior to the fault (usually a fifteen minute average).
FLISR logic does not yet open/close any switches
Fault Fault No Fault
No Fault
Fault Current
Fault
© 2010 Quanta Technology LLC
CB Trips – Feeder Deenergized
Substation #2
Substation #1 Substation #3
1 2
3
4
5
6 7 8
Circuit breaker trips
Entire circuit de-energized (dotted line)
FDs at switches 1 and 2 remain picked up
Still no FLISR control actions
Fault Fault No Fault
No Fault
Fault

© 2010 Quanta Technology LLC
Line Recloser Trips –
Portion of Feeder Deenergized
Substation #2
Substation #1 Substation #3
1 2
3
4
5
6 7 8
If line reclosers are used instead of load break switches, only a portion of the feeder is interrupted
Fault Fault No Fault
No Fault
Fault
Line Recloser
© 2010 Quanta Technology LLC
CB Trips – Feeder Deenergized
Substation #2
Substation #1 Substation #3
1 2
3
4
5
6 7 8
Circuit breaker trips
Entire circuit de-energized (dotted line)
FDs at switches 1 and 2 remain picked up
Still no FLISR control actions
Fault Fault No Fault
No Fault
Fault

© 2010 Quanta Technology LLC
CB Recloses – Fault Still There
Substation #2
Substation #1 Substation #3
1 2
3
4
5
6 7 8
FDs at switches 1 and 2 remain picked up
Still no FLISR control actions
Fault Fault No Fault
No Fault
Fault Current
Fault
© 2010 Quanta Technology LLC
CB Trips Again – Feeder Deenergized
Substation #2
Substation #1 Substation #3
1 2
3
4
5
6 7 8
Circuit breaker trips and locks out
Entire circuit de-energized (dotted line)
FDs at switches 1 and 2 remain picked up
FLISR open/close logic triggered
Fault Fault No Fault
No Fault
Fault

© 2010 Quanta Technology LLC
FLISR Step 1 – Identify Faulted Section
Substation #2
Substation #1 Substation #3
1 2
3
4
5
6 7 8
FDs 1 & 2 saw a fault
FDs 3 and 6 did not see the fault
Fault must be in section between switches 2,3, & 6
Fault Fault No Fault
No Fault
Fault
Faulted Feeder
Section
© 2010 Quanta Technology LLC
FLISR Step 2 – Isolate Faulted Section
Substation #2
Substation #1 Substation #3
1 2
3
4
5
6 7 8
Automatically open switches 2,3, & 6
Fault Fault No Fault
No Fault
Fault
Faulted Feeder
Section

© 2010 Quanta Technology LLC
FLISR Step 3 – Restore “Upstream” Section
Substation #2
Substation #1 Substation #3
1 2
3
4
5
6 7 8
FLISR closes CB
No need to check load –we know CB can carry the first section
FD at switch # 1 resets
Fault No Fault
No Fault
Fault
Faulted Feeder
Section
““““UpstreamUpstreamUpstreamUpstream”””” =
between
substation and
faulted section
© 2010 Quanta Technology LLC
FLISR Step 4 – Restore “Downstream” Load
Substation #2
Substation #1 Substation #3
1 2
3
4
5
6 7 8
Substation #2 is a “strong”source – it can carry additional load
Close switch 4 to pick up part of faulted feeder
Fault No Fault
No Fault
Fault
“Downstream”
= between
faulted section
and end of
feeder
(This is the tricky part)

© 2010 Quanta Technology LLC
FLISR Step 5 – Restore “Downstream” Load
(continued)
Substation #2
Substation #1 Substation #3
1 2
3
4
5
6 7 8
Substation #3 is a “weak”source – can’t carry additional load at this time
Switch 7 remains open
Feeder section between switches 6 and 7 remain de-energized
End of FLISR operation
Fault No Fault
No Fault
Fault
© 2010 Quanta Technology LLC
FLISR Benefits
• Reliability Improvement - Significant portion of
customers restored quickly (1 minute or less,
versus 45 – 75 minutes without FLISR)SAIDI Improvement Versus Baseline
52%52%
33%
0%
10%
20%
30%
40%
50%
60%
Conventional recloser 1 load break w ith
Intelliteam II
1 Intellirupter w ith
Intelliteam III
SAIFI Improvement Versus Baseline
42%42%
18%
0%
10%
20%
30%
40%
50%
Conventional recloser 1 load break w ith
Intelliteam II
1 Intellirupter w ith
Intelliteam III
SAIFI(MI) Improvement Versus Baseline
21%
-25%
6%
-30%
-20%
-10%
0%
10%
20%
30%
Conventional recloser 1 load break w ith
Intelliteam II
1 Intellirupter w ith
Intelliteam III
CAIDI Improvement Versus Baseline
17.9%17.9%18.3%
10.0%
12.0%
14.0%
16.0%
18.0%
20.0%
Conventional recloser 1 load break w ith
Intelliteam II
1 Intellirupter w ith
Intelliteam III
DA With Load Break
Switches
DA With Reclosers DA With
Load Break Switches
DA With Reclosers
DA With Load Break
Switches
DA With Reclosers
DA With Load Break
Switches
DA With Reclosers

© 2010 Quanta Technology LLC
Other FLISR Benefits
• Labor Savings – Less fault investigation and patrol
time because fault location is narrowed down
considerably
• Reduction in Unserved Energy – Get some meters
turning sooner
© 2010 Quanta Technology LLC
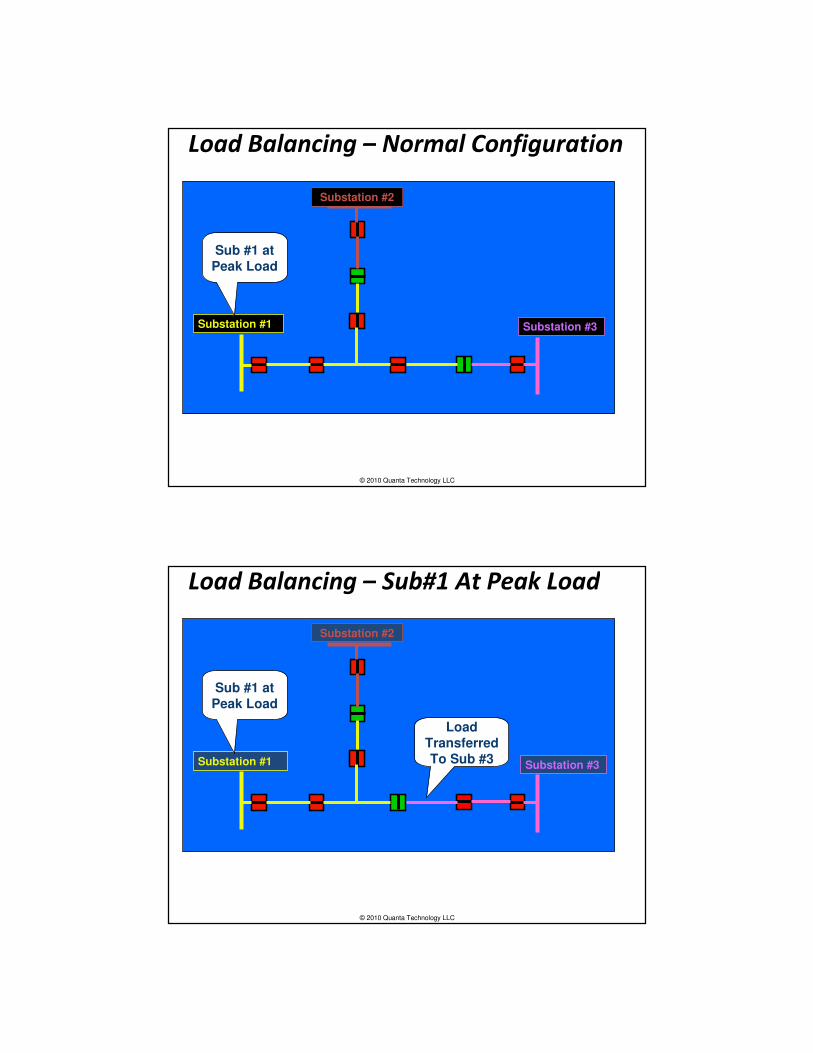
Feeder Load Balancing
• Objective: Reduce peak demand on
feeders/substations by periodically shifting load
between connected feeders to achieve better balance
• Must have significant diversity between feeders
• “Make before break” to avoid momentary outages
0
1
2
3
4
5
6
7
1 2 3 4 5 6 7 8 9 10 11 12 13 14 15 16 17 18 19 20 21 22 23 24 25 26 27
© 2010 Quanta Technology LLC
Load Balancing – Normal Configuration
Substation #2
Substation #1 Substation #3
Sub #1 at Peak Load
© 2010 Quanta Technology LLC
Load Balancing – Sub#1 At Peak Load
Substation #2
Substation #1 Substation #3
Load TransferredTo Sub #3
Sub #1 at Peak Load

© 2010 Quanta Technology LLC
Load Balancing – Sub#3 At Peak Load
Substation #2
Substation #1 Substation #3
Load TransferredTo Sub #1
Sub #3 at Peak Load
© 2010 Quanta Technology LLC
Load Balancing - Benefits
• Reduction of Peak Demand on individual
substation
– Defer capacity addition
– Reduce individual substation demand charges
• Reduction of Electrical Losses
– Total losses with balanced load < Total losses
with one heavily loaded feeder and one lightly
loaded feeder

© 2010 Quanta Technology LLC
Cold Load Pickup
• Objective: Reduce the time to restore load
following extended outage for which cold load
conditions apply
• Restore service a section at a time via remote
control
© 2010 Quanta Technology LLC
Cold Load Pickup Example
Substation #2
Substation #1 Substation #3

© 2010 Quanta Technology LLC
Cold Load Pickup Example
Substation #2
Substation #1 Substation #3
Open all switches via
remote control
© 2010 Quanta Technology LLC
Cold Load Pickup Example
Substation #2
Substation #1 Substation #3
Restore one section
at a time

© 2010 Quanta Technology LLC
Cold Load Pickup Example
Substation #2
Substation #1 Substation #3
Restore one section
at a time
© 2010 Quanta Technology LLC
Cold Load Pickup Benefits
• Reliability Improvement Benefit: Faster overall
service restoration
• Labor Savings: Fewer manual switching
activities, less travel time

© 2010 Quanta Technology LLC
Emergency Load Shedding
• Some utilities are limited in amount of load
shedding that is possible due to presence
of critical (non-interruptible) loads
• Automated switches can be used to shed
load on such feeders without impacting
non-interruptibles
© 2010 Quanta Technology LLC
Load Shedding Using Line Switches
Substation #2
Substation #1Substation #3
Open This Switch
Non-Interruptible Customer in this section
© 2010 Quanta Technology LLC
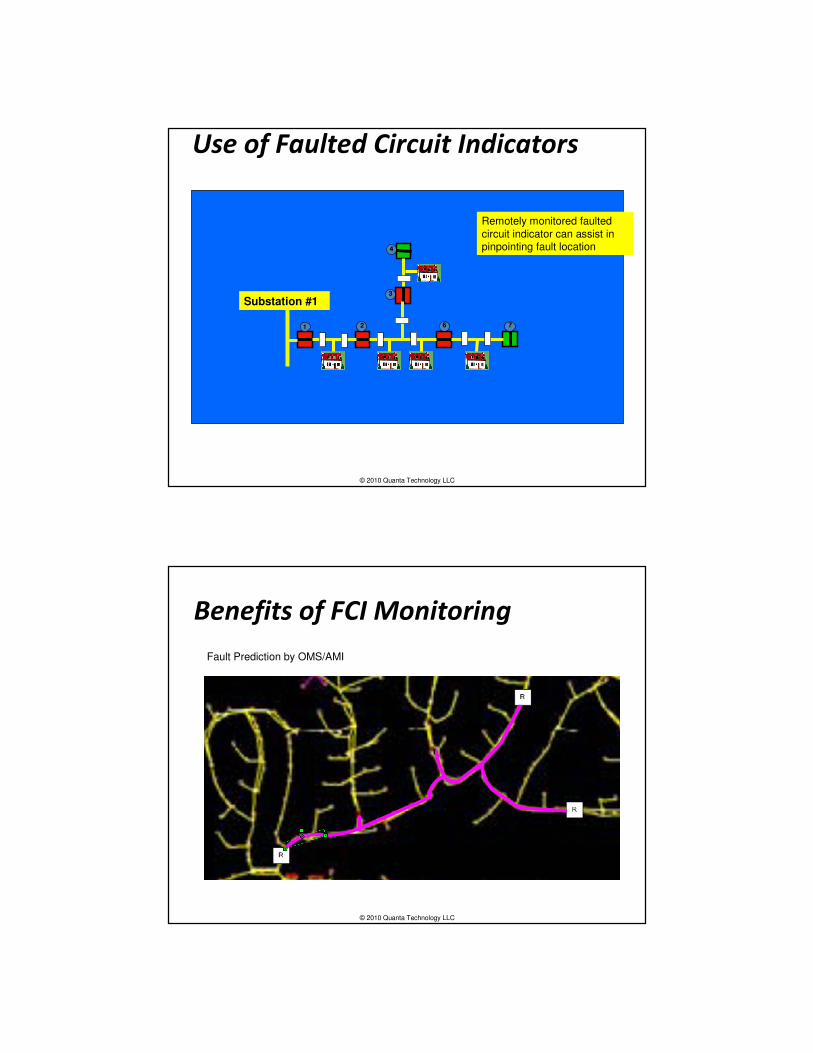
Use of Faulted Circuit Indicators
Substation #1
1 2
3
4
6 7
Remotely monitored faulted circuit indicator can assist in pinpointing fault location
© 2010 Quanta Technology LLC
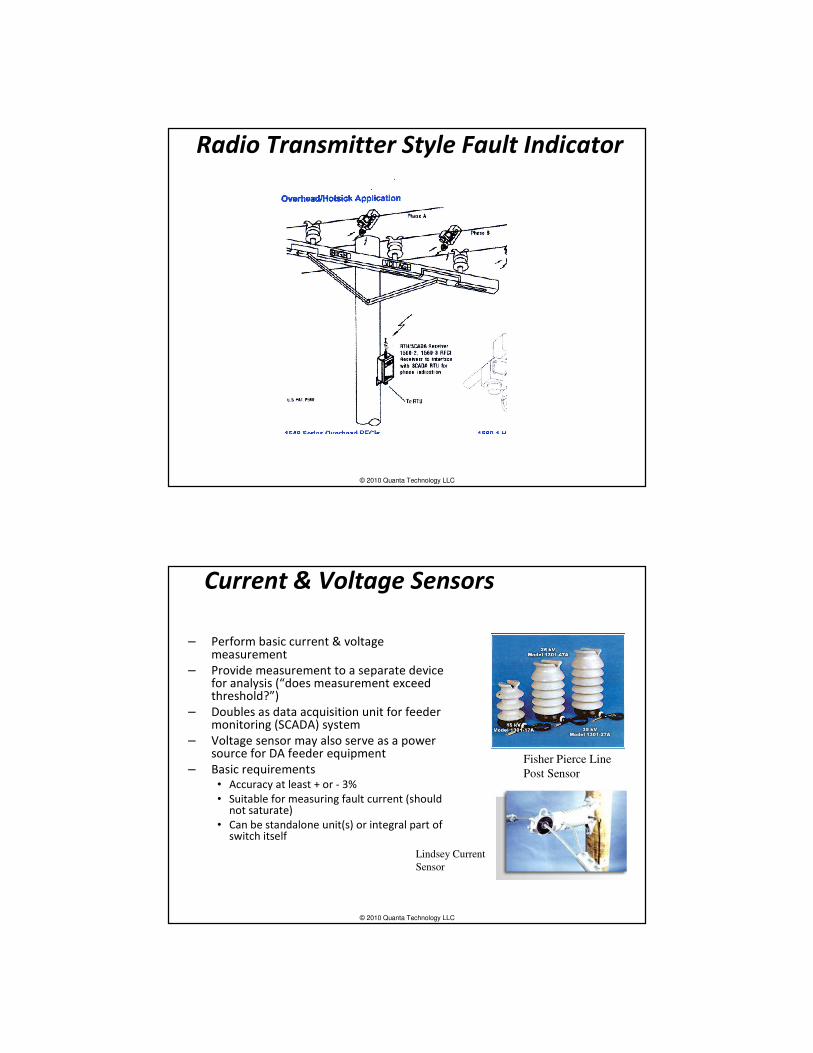
Benefits of FCI Monitoring
Fault Prediction by OMS/AMI

© 2010 Quanta Technology LLC
Benefits of FCI Monitoring
Fault Prediction by OMS/AMI & FCI
© 2010 Quanta Technology LLC
System Components
Distribution SCADA system
– Remote controlled feeder switches
– Feeder RTU or Controller
– Fault detectors
– Two-way communication facilities
(Sp.Spectrum
MAS

© 2010 Quanta Technology LLC
Distribution SCADA System
• Supervisory Control and Data Acquisition (SCADA) system:
– Minimum requirement: Allow distribution system operator to monitor and oversee operation of the feeder automation facilities
– May also perform the bulk of the feeder automation processing (centralized scheme only – more on this in Module 5)
© 2010 Quanta Technology LLC
Feeder Automation Switches
• All switches must be electrically
operable
• Can be load break or fault
interrupting devices
• Can be overhead or underground
(padmount) switches
Kyle® Type NOVA™ Recloser(Fault Interrupting Device).
Photo courtesy of Cooper Power Systems
Load Break Switch.
Photo courtesy of Bridges Electric
Pad Mounted Switch
ABB OVR Recloser

© 2010 Quanta Technology LLC
Retrofit Motor Operators
Retrofit Motor-Operator
Retrofit Padmount. Photo Courtesy of S&C Electric
Co
Retrofit Pole Mounted SwitchPhoto Courtesy of Cleaveland Price, Inc
may be able to save money by
retrofitting a motor operator
on an existing manual switch
© 2010 Quanta Technology LLC
DA Switch Vendors
Ve ndor Name W ebsite Recloser
Loa d
Break
ABB
www.abb.com /produc t/us /9AAC
720078.aspx X X
Cooper Power Systems www.cooperpower.com X X X X
S&C Electric Company www.sandc .com X X X X
Joslyn Hi Voltage www.joslynhivoltage.com X X X
G&W www.gwelec.com X X X X
Bridges Electric www.bridgeselec tric.com X
Cleaveland Price www.cleavelandprice.com X
Turner E lectric Co. LLC
http://www.turnerswitch.com/ins
tallation/operators.html X
Federal Pacific http://www.federalpac ific .com/ X X
Current Interrupting
Pole
Mount Pa dmount
Retrofit
Kit
Soon?Soon?Soon?Soon?
Siemens
FaultFaultFaultFault
InterruptingInterruptingInterruptingInterrupting
NOJA Power (Australia) www.nojapower.com.au X
Update the slide

© 2010 Quanta Technology LLC
Feeder RTU or Local Controller
• Acquires data from FD or local
sensors
• Executes control commands
• May perform bulk of feeder
automation processing
(distributed architecture)
• Provides interface to
communication facilities
S&C 5800
DAQ Polaris Pole-Top RTU
Cooper Form 6 Controller
SEL 451S&C UIM
© 2010 Quanta Technology LLC
Fault Detector (FD)
• Determines that a fault has occurred
“downstream” (further from the
substation)
• Basic Requirements
– Must be able to identify and “capture” the fault
information before fault is cleared (in a few
cycles)
– Must be able to detect all kinds of faults
• Phase faults
• Ground faults – current may be less than
normal load – must use “residual” current

© 2010 Quanta Technology LLC
Two Ways to Accomplish FD
• Faulted Circuit
Indicator (FCI)
• Current/Voltage
Sensor
© 2010 Quanta Technology LLC
Faulted Circuit Indicators
– Clamp on style
– Current inrush restraint
– Must work in either direction
– Reset conditions
• Time
• Restoration of voltage or current
– Local indicator visible from ground level
– Output signal to feeder RTU
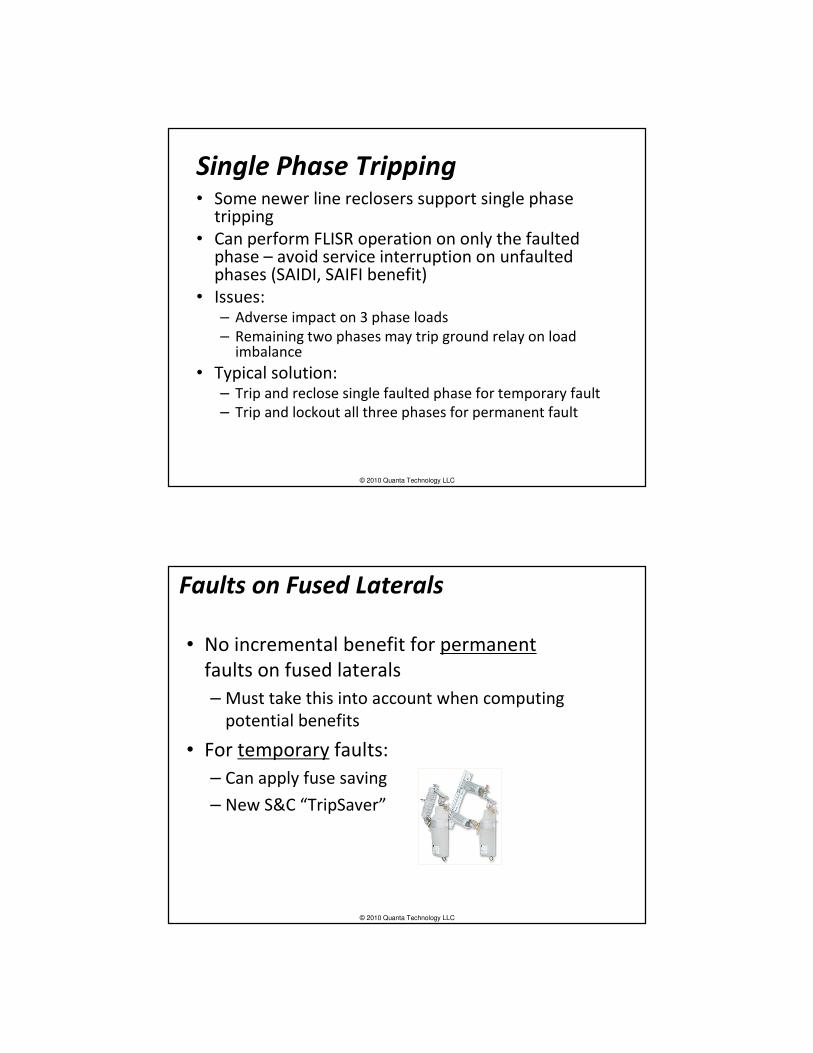
• Radio signal
• Fiber optic/metallic cable
Edison Controls FD
Photo Courtesy of Horstmann/Power Delivery Products
Faulted Circuit Indicator (FCI)Close a contact when pre-established ampere threshold is exceeded
© 2010 Quanta Technology LLC
Radio Transmitter Style Fault Indicator
© 2010 Quanta Technology LLC
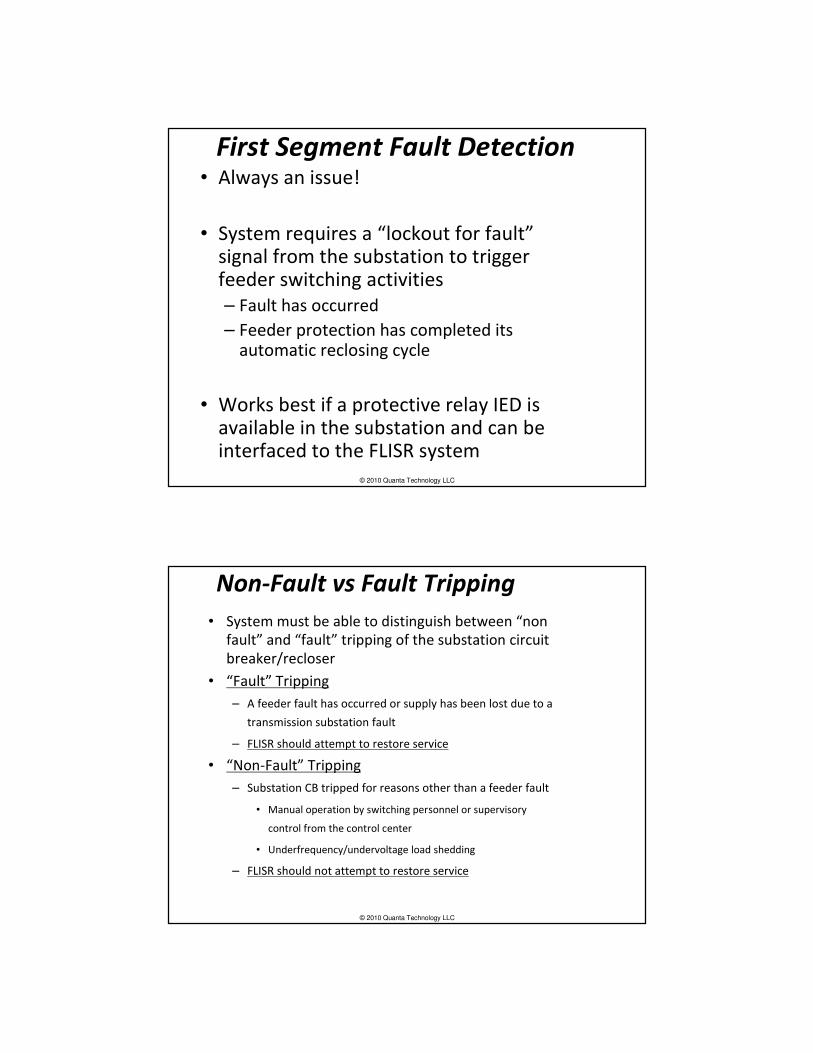
Current & Voltage Sensors
– Perform basic current & voltage measurement
– Provide measurement to a separate device for analysis (“does measurement exceed threshold?”)
– Doubles as data acquisition unit for feeder monitoring (SCADA) system
– Voltage sensor may also serve as a power source for DA feeder equipment
– Basic requirements• Accuracy at least + or - 3%
• Suitable for measuring fault current (should not saturate)
• Can be standalone unit(s) or integral part of switch itself
Lindsey Current
Sensor
Fisher Pierce Line
Post Sensor

© 2010 Quanta Technology LLC
Current & Voltage Sensors
Can be an integral part of the DA switch
Current-
Voltage
Sensor
“ScadaMate” by S&C Electric
© 2010 Quanta Technology LLC
Bidirectional Fault Indicators
• Useful for – Systems with DG
– closed loop, paralleled or networked distribution systems
Power Delivery Products
http://www.powerdeliveryproducts.com/directionalfaultindicator.htm

© 2010 Quanta Technology LLC
Communication Facilities
• System requires reliable 2-way communication
facilities to feeder locations
• Common approaches:
– Licensed UHF MAS radio
– Unlicensed Spread spectrum radio
– Cellular telephone & other commercial services
– Power line carrier
More details on DA Communications laterMore details on DA Communications laterMore details on DA Communications laterMore details on DA Communications later
© 2010 Quanta Technology LLC
Control Panels
• Open/Close Pushbuttons
• Switch status (open/closed) indicators
• Alarm indicators
• Local/remote switch
• Operations counter
– Electrical operations
– Mechanical operations?

© 2010 Quanta Technology LLC
Switch Power Supply (SPS)
• Key Point: Most switch operations run
off the SPS with the line dead!
– Should specify a required number of
operations with the power off (biggest power
drain is radio transmitter)
– As an absolute minimum, must be able to
open switch and close switch once without
recharging (with the line dead)
• Power Source
– Voltage sensor may provide all the power
needed by the switch, controller, and radio
– If not use dedicated voltage transformer or
connect to local secondary circuit
© 2010 Quanta Technology LLC
Categories for Automated Line Switching
• Approaches categorized on how control is
performed:
– Supervised
– Semi-Automatic
– Fully Automatic

© 2010 Quanta Technology LLC
Feeder Automation Categories
• Supervised• No automatic control – “person in the loop”
• System delivers information (recommendations) to Dispatcher
• Dispatcher initiates remote control actions
– Pro’s• Simpler than fully automatic
• Good “starter” approach until confidence is built up
– Con’s• Takes longer to restore service (3 – 5 minutes)
– Communication time (both ways)
– Dispatcher decision time
• Difficult for dispatcher to manage many switches during emergencies involving multiple disturbances
© 2010 Quanta Technology LLC
Feeder Automation Categories
• SEMI-AUTOMATIC
– Mix of automatic and supervised control
– Example– DA system automatically isolates fault and performs “upstream”
restoration (the “easy” part)
– Dispatcher supervises “downstream” restoration activities based on DA system recommendations (the “hard” part)
– Pro’s
• Simpler than fully automatic
• Natural progression from supervised approach
• Where many utilities end up
• “Upstream” customers restored in less than 1 minute
– Con’s
• Takes longer to restore “downstream” service (3 – 5 minutes)
• Difficult for dispatcher to manage many switches during emergencies involving multiple disturbances
• Not supported by some DA vendors

© 2010 Quanta Technology LLC
Feeder Automation Categories
– FULLY AUTOMATIC
– All fault isolation and restoration activities performed automatically
– Current state of the art
– No dispatcher intervention
• Pro’s
– Possible to restore all service in less than one minute
– Less burden on Dispatcher to manage the switching activities
• Con’s
– Most complex approach
– Acceptance difficulties
» Ranges from “Why not?” to “Over my dead body”
© 2010 Quanta Technology LLC
Practical Matters to Consider

© 2010 Quanta Technology LLC
• Tradeoff: “Permanent” vs.
“Momentary” Outages
• Definitions:
– Permanent: Duration > threshold
– Momentary: Duration < threshold
• Use of FLISR will:
– Improve permanent outage statistics
• SAIDI, SAIFI, CAIDI
– Make momentary outage statistics worse
• MAIFI
• Most utilities are willing to accept this
tradeoff!
© 2010 Quanta Technology LLC
• Limitations on Transferring Load
to Adjacent Feeders– It is often difficult to transfer all the “healthy” load
to adjacent feeders without causing overloads
and/or voltage problems
– Especially true during peak load period
– May need to split load being transferred to
alternative sources
– May require additional automated switches to
accomplish FLISR objectives at certain times of the
day
– Key Point: Must have backup source to get
incremental reliability improvement beyond
simple recloser!

© 2010 Quanta Technology LLC
Diminishing Returns
• Additional reliability improvement benefit
declines dramatically as more switches are added
• Usually 2 ½ switches is best for reliability
improvement BFTB – more switches added due
to load transfer constraints, critical customers,
and unusual feeder configuration
Reliability Improvement vs. Cost
0
500
1000
1500
2000
2500
3000
0 20000 40000 60000 80000 100000
Cost ($)
Cu
st O
uta
ge
Min
ute
s
Imp
rove
me
nt
© 2010 Quanta Technology LLC
Importance of Switch Placement• Predicted reliability improvement varies widely with
switch placement strategy
• KEY POINT!: Splitting customer count into equal parts is only best when customers and fault exposure are evenly distributed across the feeder
• Variation observed for sample case:
– SAIDI - 22%
– SAIFI - 31%
– MAIFI - 23%
• Small change in placement (a few hundred feet) produced a 5% change in SAIDI!
• Switch placement analysis is not trivial – should use engineering analysis tool!
© 2010 Quanta Technology LLC
Single Phase Tripping• Some newer line reclosers support single phase
tripping
• Can perform FLISR operation on only the faulted phase – avoid service interruption on unfaulted phases (SAIDI, SAIFI benefit)
• Issues:– Adverse impact on 3 phase loads
– Remaining two phases may trip ground relay on load imbalance
• Typical solution:– Trip and reclose single faulted phase for temporary fault
– Trip and lockout all three phases for permanent fault
© 2010 Quanta Technology LLC
Faults on Fused Laterals
• No incremental benefit for permanent
faults on fused laterals
– Must take this into account when computing
potential benefits
• For temporary faults:
– Can apply fuse saving
– New S&C “TripSaver”
© 2010 Quanta Technology LLC
First Segment Fault Detection• Always an issue!
• System requires a “lockout for fault”signal from the substation to trigger feeder switching activities
– Fault has occurred
– Feeder protection has completed its automatic reclosing cycle
• Works best if a protective relay IED is available in the substation and can be interfaced to the FLISR system
© 2010 Quanta Technology LLC
Non-Fault vs Fault Tripping
• System must be able to distinguish between “non
fault” and “fault” tripping of the substation circuit
breaker/recloser
• “Fault” Tripping
– A feeder fault has occurred or supply has been lost due to a
transmission substation fault
– FLISR should attempt to restore service
• “Non-Fault” Tripping
– Substation CB tripped for reasons other than a feeder fault
• Manual operation by switching personnel or supervisory
control from the control center
• Underfrequency/undervoltage load shedding
– FLISR should not attempt to restore service

© 2010 Quanta Technology LLC
Safety Issues
• Safety for workers and general public must
not be compromised!!!
• Operating practices and procedures must
be reviewed and modified if necessary to
address presence of automatic switchgear
• Safety related recommendations:
– Requirement for “visible gap”
– No automatic closures after two minutes have
elapsed following the initial fault
– System disabled during maintenance (“live
line”) work
© 2010 Quanta Technology LLC
Questions?

© 2010 Quanta Technology LLC
Bob Uluski
UU208: Distribution
Automation –
Smart Feeders in a Smart Grid
World
Volt-VAR Control
© 2010 Quanta Technology LLC
What is Volt-VAR control?
• The use of voltage regulating devices and reactive power
controls to…:
– Maintain acceptable voltages at all points along the feeder under all
loading conditions
– Operate the distribution system as efficiently as possible without
violating any load and voltage constraints
– Support the reactive power needs of the bulk power system during
system emergencies

© 2010 Quanta Technology LLC
How Is Volt-VAR Control Accomplished?
• General technique:
– Measure electrical and ambient conditions
– Analyze the measurements to determine if
electrical conditions are what we expect them to
be
– Determine what control actions (if any) are needed
to restore the desired conditions
– Send control signals to the voltage and reactive
power control devices
© 2010 Quanta Technology LLC
How Is Volt-VAR Control Accomplished?
• Traditional Devices for Volt-VAR Control– Fixed and switched capacitor banks (in substation and out on the
feeder)
– Substation transformers with Load Tap Changers (LTCs)
– Voltage regulators (in substation and/or out on the feeder)
• “Future” Devices for Volt-VAR Control– Distributed generating resources
– Static VAR compensators

© 2010 Quanta Technology LLC
Volt-VAR Control versus Volt-VAR
Optimization
• Principal Objective of Volt-VAR Control
– Maintain acceptable electrical conditions out on
the feeders (i.e., keep the voltage within
allowable limits at all points along the feeder)
• Objectives of VVO (aka IVVC)
– Maintain acceptable electric conditions…
– Reduce losses/improve efficiency
– Lower demand and energy consumption
– Respond to system emergencies
© 2010 Quanta Technology LLC
The Cycle of Interest in this Topic
1 4 7
10
13
16
19
22
25
-1
-0.5
0
0.5
1
© 2010 Quanta Technology LLC
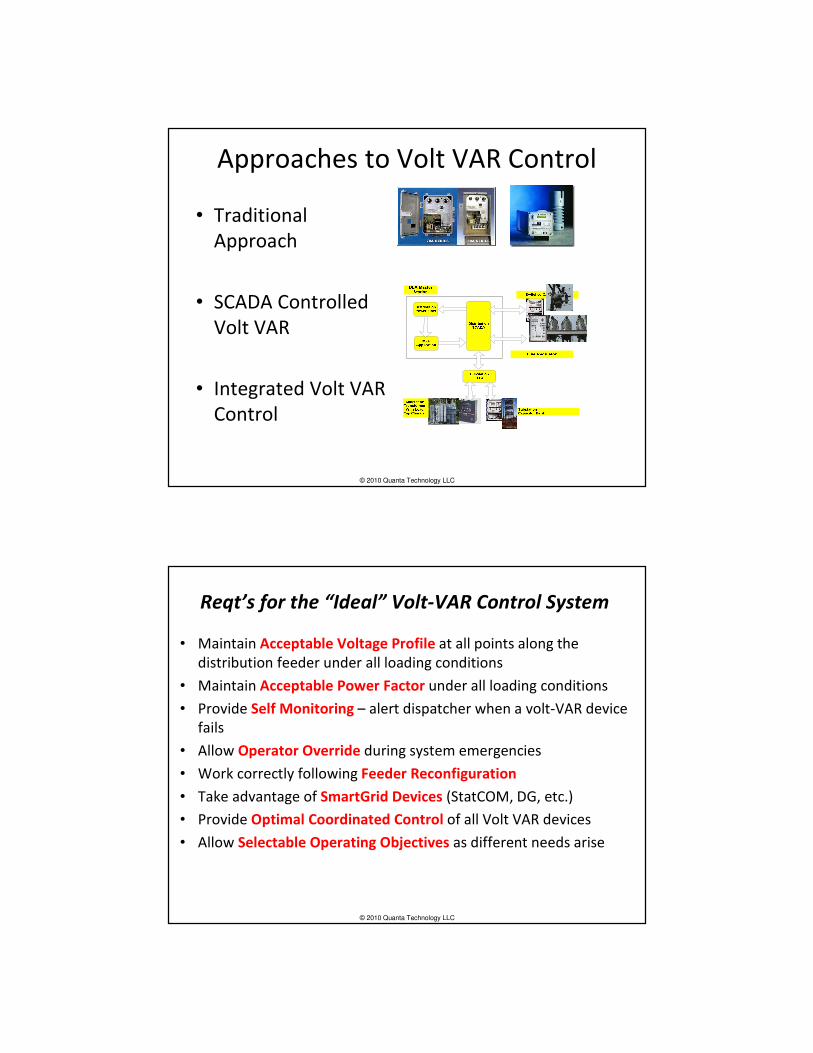
Approaches to Volt VAR Control
• Traditional
Approach
• SCADA Controlled
Volt VAR
• Integrated Volt VAR
Control
© 2010 Quanta Technology LLC
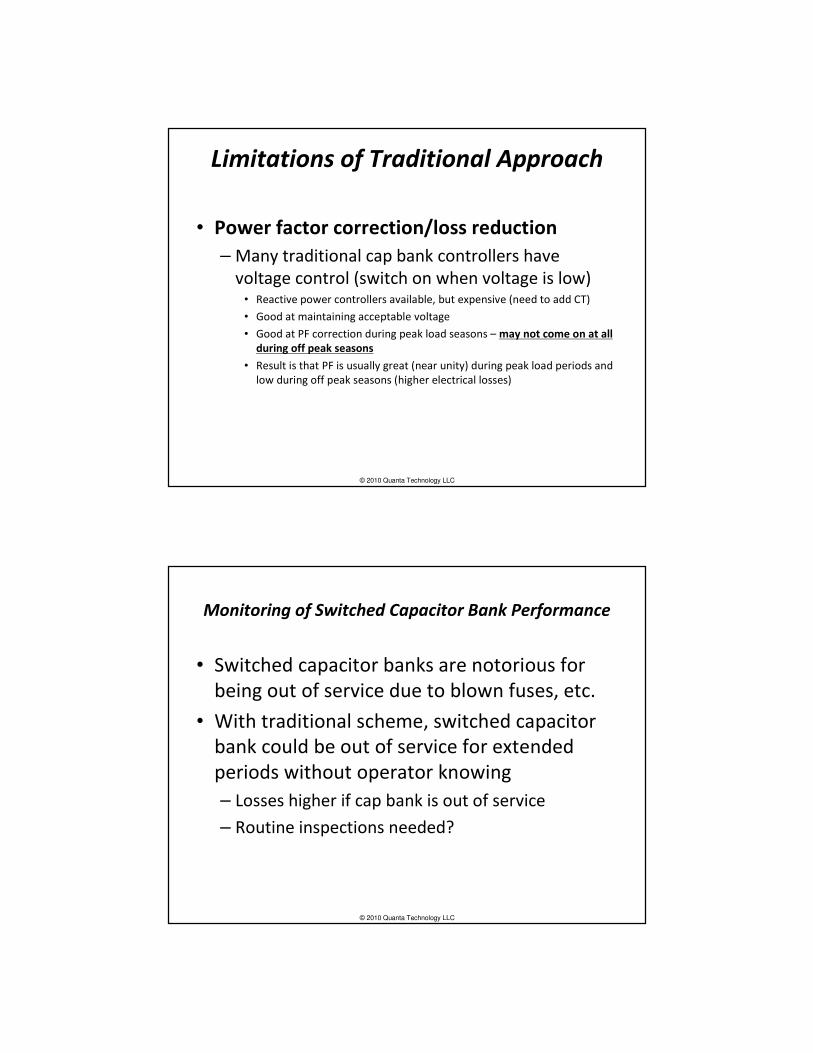
Reqt’s for the “Ideal” Volt-VAR Control System
• Maintain Acceptable Voltage Profile at all points along the
distribution feeder under all loading conditions
• Maintain Acceptable Power Factor under all loading conditions
• Provide Self Monitoring – alert dispatcher when a volt-VAR device
fails
• Allow Operator Override during system emergencies
• Work correctly following Feeder Reconfiguration
• Take advantage of SmartGrid Devices (StatCOM, DG, etc.)
• Provide Optimal Coordinated Control of all Volt VAR devices
• Allow Selectable Operating Objectives as different needs arise

© 2010 Quanta Technology LLC
Traditional Volt-VAR Control
• Volt-VAR flows managed by individual, independent, standalone volt-VAR regulating devices:
– Substation transformer load tap changers (LTCs)
– Line voltage regulators
– Fixed and switched capacitor banks
© 2010 Quanta Technology LLC
Limitations of Traditional Volt-VAR Control
• The system is not continuously monitored
• The system lacks flexibility to respond to changing conditions out on the distribution feeders – can misoperate following automatic reconfiguration
• No effective way to do Conservation Voltage Reduction
• System operation may not be “optimal” under all conditions
• Cannot override traditional operation during power system emergencies
• System may misoperate when modern grid devices (e.g., distributed generators) are present – reverse power flow from DG can “trick” standalone controller to believe feeder has been reconfigured
© 2010 Quanta Technology LLC
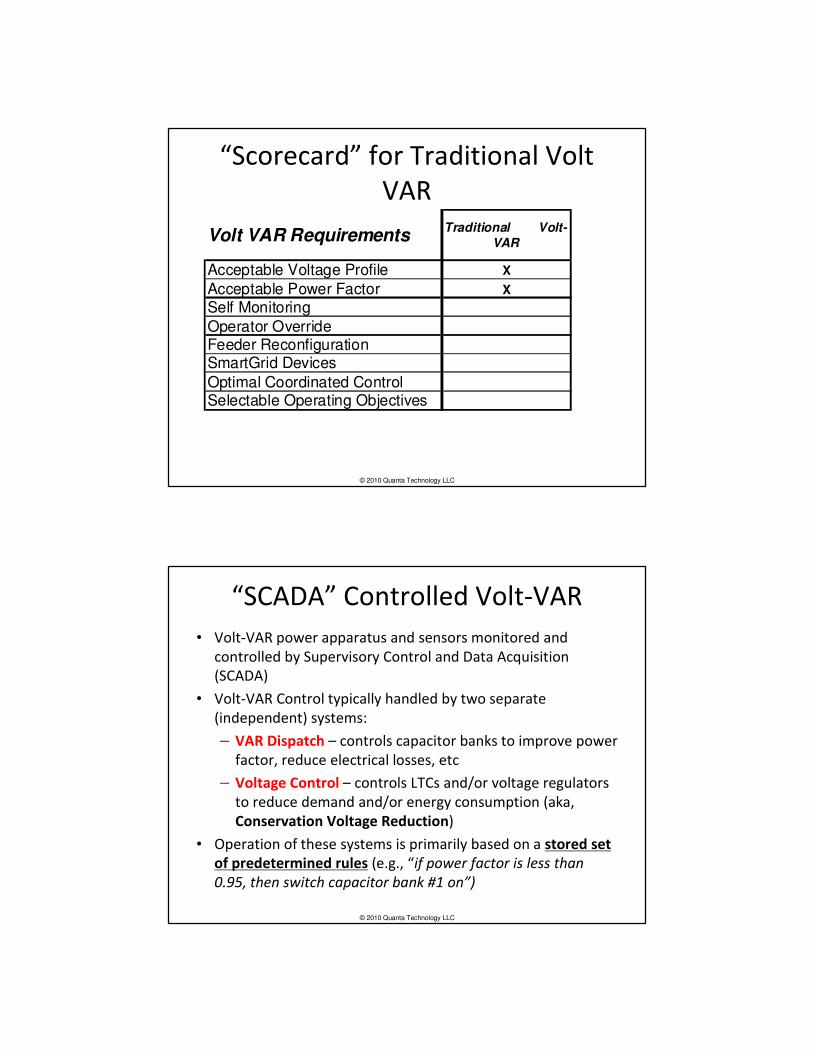
Limitations of Traditional Approach
• Power factor correction/loss reduction
– Many traditional cap bank controllers have
voltage control (switch on when voltage is low)• Reactive power controllers available, but expensive (need to add CT)
• Good at maintaining acceptable voltage
• Good at PF correction during peak load seasons – may not come on at all
during off peak seasons
• Result is that PF is usually great (near unity) during peak load periods and
low during off peak seasons (higher electrical losses)
© 2010 Quanta Technology LLC
Monitoring of Switched Capacitor Bank Performance
• Switched capacitor banks are notorious for
being out of service due to blown fuses, etc.
• With traditional scheme, switched capacitor
bank could be out of service for extended
periods without operator knowing
– Losses higher if cap bank is out of service
– Routine inspections needed?

© 2010 Quanta Technology LLC
Voltage Regulation During Alternate Feed Configuration
• Older style voltage regulators were often designed to handle a purely radial situation – power flow always from the same direction (from the substation)
• Older style Vregs may not work correctly if power flow is from the opposite direction (see example)
– Could raise voltage when during light load, creating high voltage situation
– Could lower voltage when during heavy load, creating low voltage situation
• Feeder reconfiguration may become a more frequent occurrence due to
– Load transferred to another feeder during service restoration (FLISR)
– Optimal network reconfiguration to reduce losses (DMS application)
Incorrect Operation!
Vreg not bi-directional
© 2010 Quanta Technology LLC
Use of “Bidirectional” Voltage Regulator
• Can Use “Bidirectional” voltage regulator controller to handle feeder reconfiguration
• These make the opposite tap position movement when flow is from the reverse direction
Correct Operation!
Vreg bi-directional
© 2010 Quanta Technology LLC
“Scorecard” for Traditional Volt
VAR
Volt VAR RequirementsTraditional Volt-
VAR
Acceptable Voltage Profile X
Acceptable Power Factor X
Self MonitoringOperator OverrideFeeder Reconfiguration SmartGrid Devices
Optimal Coordinated ControlSelectable Operating Objectives
© 2010 Quanta Technology LLC
“SCADA” Controlled Volt-VAR
• Volt-VAR power apparatus and sensors monitored and
controlled by Supervisory Control and Data Acquisition
(SCADA)
• Volt-VAR Control typically handled by two separate
(independent) systems:
– VAR Dispatch – controls capacitor banks to improve power
factor, reduce electrical losses, etc
– Voltage Control – controls LTCs and/or voltage regulators
to reduce demand and/or energy consumption (aka,
Conservation Voltage Reduction)
• Operation of these systems is primarily based on a stored set
of predetermined rules (e.g., “if power factor is less than
0.95, then switch capacitor bank #1 on”)

© 2010 Quanta Technology LLC
VAR Dispatch Components
• Switched & fixed feeder capacitor banks
• Capacitor bank control interface
• Communications facility - one-way paging or load
management communications is sufficient
• Means of monitoring 3-phase var flow at the substation
• Master station running VAR dispatch software
© 2010 Quanta Technology LLC
Monitoring Real and Reactive Power Flow

© 2010 Quanta Technology LLC
VAR Dispatch Rules Applied
© 2010 Quanta Technology LLC
Real and Reactive Load Increases

© 2010 Quanta Technology LLC
Reactive Power Flow Exceeds
Threshold
© 2010 Quanta Technology LLC
Capacitor Switched On
© 2010 Quanta Technology LLC
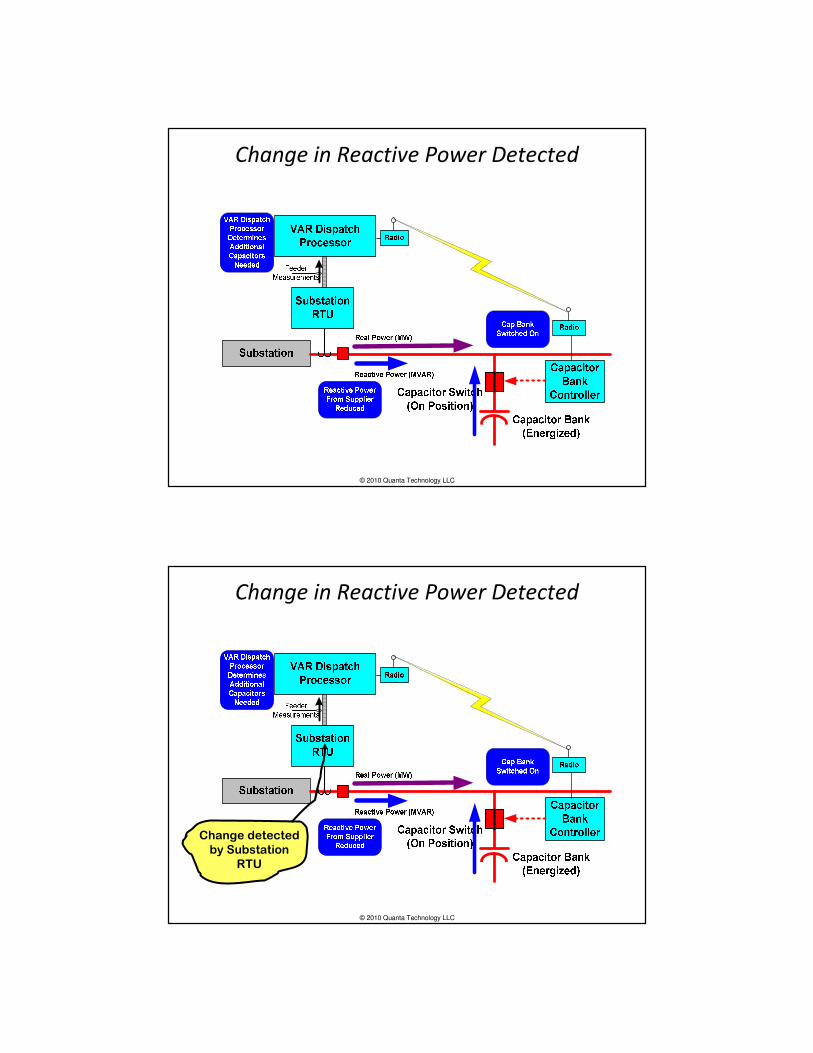
Change in Reactive Power Detected
© 2010 Quanta Technology LLC
Change in Reactive Power Detected
Change detected
by Substation
RTU
© 2010 Quanta Technology LLC
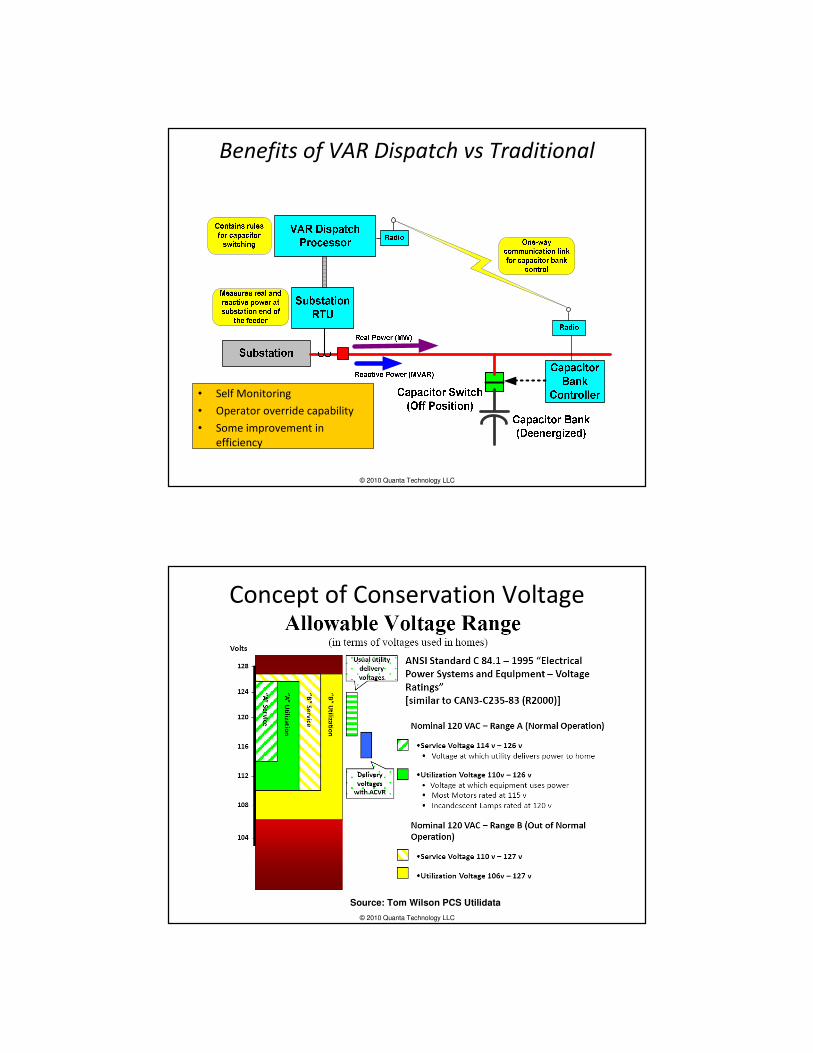
Benefits of VAR Dispatch vs Traditional
• Self Monitoring
• Operator override capability
• Some improvement in
efficiency
© 2010 Quanta Technology LLC
Concept of Conservation Voltage
Reduction
Source: Tom Wilson PCS Utilidata

© 2010 Quanta Technology LLC
Benefits of Voltage Reduction
• Works best with resistive load (lighting and
resistive heating) because power drawn
decreases with the voltage squared .
• Devices that operate using a thermostat
generally do not reduce energy – the devices
just run longer
P = (V / Vnom)2 ÷÷÷÷ R
Constant
Impedance
load
© 2010 Quanta Technology LLC
Benefits of Voltage Reduction
Efficiency improve for small voltage reduction
Incremental change in efficiency drops off and then turns negative as voltage is reduced
Negative effect occurs sooner for heavily loaded motors

© 2010 Quanta Technology LLC
Benefits of Voltage Reduction for Various Types of Loads
• Constant impedance (power consumed is proportional to voltage squared)
– Incandescent lighting, resistive water heaters, stovetop and over cooking
loads
• Constant power (demand is constant regardless of voltage)
– Electric motors, regulated power supplies
• Constant current (demand is proportional to voltage) (few of this type of load)
– Welding units, smelting, electroplating processes
• Feeder load is always a mix of the different
load types
• Rules of thumb:
– 60/40 split (constant power/constant
impedance) for summer peak loads
– 40/60 split for winter peak loads
– 80/20 for industrial areas
– 70/30 for residential load in residential with
summer peaking
– 30/70 for res load with winter peaking
– Commercial loads: 50/50 or 60/40
• Source: Power Distribution Planning
Reference Book”, H. Lee Willis
© 2010 Quanta Technology LLC
Time Decay of CVR Effects
• The most reduction occurs right when the voltage is
reduced and then some of the reduction is lost as
some loads just run longer

© 2010 Quanta Technology LLC
Voltage Control Components
© 2010 Quanta Technology LLC
Load Below Voltage Control Threshold (No Control Actions)
LTC
Substation
RTU
Voltage Control
Processor
Volt Meter
or AMRComm
Interface
Comm
Interface
OO
Reactive Power (MVAR)
Real Power (MW) End of
Feeder
OOOO
OOOO Voltage
Transformer
LTC
Controller
Substation
Transformer

© 2010 Quanta Technology LLC
Load Above Voltage Control Threshold
LTC
Substation
RTU
Voltage Control
Processor
Volt Meter
or AMRComm
Interface
Comm
Interface
OO
Reactive Power (MVAR)
Real Power (MW) End of
Feeder
OOOO
OOOO
LTC
Controller
Substation
Transformer
© 2010 Quanta Technology LLC
Load Above Voltage Control Threshold (lower tap setting)

© 2010 Quanta Technology LLC
Benefits of Voltage Control versus Traditional Volt-VAR
• Self Monitoring
• Operator override capability
• CVR function not available
with traditional
© 2010 Quanta Technology LLC
What SCADA Volt VAR Can’t Do
• Does not adapt to changing feeder configuration (rules are fixed in advance)
• Does not adapt to varying operating needs(rules are fixed in advance)
• Overall efficiency is improved versus traditional approach, but is not necessarily optimal under all conditions
• Operation of VAR and Volt devices is not coordinated
• Does not adapt well to presence of modern grid devices such as DG

© 2010 Quanta Technology LLC
SCADA VAR Dispatch (versus Traditional)
• Power factor correction/loss reduction
– Many traditional cap bank control have voltage
control (switch on when voltage is low)• Reactive power controllers available, but expensive (need to add CT)
• Good at maintaining acceptable voltage
• Good at PF correction during peak load seasons – may not come on at all
during off peak seasons
• Result is that PF is usually great (near unity) during peak load periods and
low during off peak seasons (higher electrical losses)
– SCADA VAR Dispatch addresses low power factor
as well as low voltage at the feeder level• Benefit is reduced electrical losses (e.g. reduced energy consumption)
over the year
• If PF is poor at peak load, loss reduction = demand reduction
© 2010 Quanta Technology LLC
Monitoring of Switched Capacitor Bank Performance
• Switched capacitor banks are notorious for being out
of service due to blown fuses, etc.
• With traditional scheme, switched capacitor bank
could be out of service for extended periods without
operator knowing
– Losses higher if cap bank is out of service
– Routine inspections needed?
• With SCADA VAR Control, can automatically detect
banks that do not respond to switching command
– Eliminate routine inspections (where applicable)
– Reduce incremental losses incurred when cap bank OOS

© 2010 Quanta Technology LLC
Lack of Coordination between Volt and VAR control
• Switching a capacitor bank on raises the
voltage, which:
– Increases no-load losses in distribution
transformers
– Increases energy consumption and possibly
demand
• Lowering the voltage through CVR:
– Makes the capacitor banks less effective (lower
voltage means less capacitive current delivered by
the cap banks
© 2010 Quanta Technology LLC
RealitiesRealities of SCADAof SCADA--ControlledControlled VVCVVC
• Simple but not fully effective.
• Hydro Quebec Demonstration project gained
only 30% of the estimated energy
consumption.
– Volt meters not really at the end of the feeders.
Volt meters installed only on 3 phases circuits.
Targets need to cover also the worst case voltage
drop of the single phase networks.
– Network topology during the demonstration
project (1 year average) was not in its normal
state 40% of the time.

© 2010 Quanta Technology LLC
Volt VAR “Scorecard”
Volt VAR RequirementsTraditional Volt-
VAR
SCADA Volt-
VAR
Acceptable Voltage Profile X X
Acceptable Power Factor X X
Self Monitoring X
Operator Override X
Feeder Reconfiguration SmartGrid Devices
Optimal Coordinated ControlSelectable Operating Objectives
Volt-VAR Approach
© 2010 Quanta Technology LLC
Integrated Volt-VAR Control (IVVC) System Config
Distribution
System Model
Geographic
Information
System (GIS)
Distribution
SCADA
Temp
Changes
Perm
Changes
Dynamic
Changes
On-Line Power
Flow (OLPF)
IVVC
Optimizing
Engine
MDMSAMILine
Switch
Substation RTU
Substation
Transformer
with TCUL
Substation Capacitor
Bank
Switched
Cap Bank
Line
Voltage
RegulatorDevelops a coordinated
“optimal”switching plan for all voltage control
devices and executes the plan

© 2010 Quanta Technology LLC
IVVC “Objectives”
• With IVVC, user can select an optimizing
objective:
– Reduce losses
– Reduce energy consumptions
– Reduce electrical demand
– Minimize “cost”
– Combination of the above
© 2010 Quanta Technology LLC
Integrated Volt-VAR Control (IVVC) System Config
Distribution
System Model
Geographic
Information
System (GIS)
Distribution
SCADA
Temp
Changes
Perm
Changes
Dynamic
Changes
On-Line Power
Flow (OLPF)
IVVC
Optimizing
Engine
MDMSAMILine
Switch
Substation RTU
Substation
Transformer
with TCUL
Substation
Capacitor
Bank
Switched
Cap Bank
Line Voltage
Regulator
Switch StatusVoltage Feedback,
Accurate load data
Bank voltage & status, switch control
Bank voltage & status, switch control
Monitor & control tap position, measure load
voltage and loadMonitor & control tap position, measure load
voltage and load
IVVC requires real-time monitoring & control of sub & feeder devices

© 2010 Quanta Technology LLC
Distribution
System Model
Geographic
Information
System (GIS)
Distribution
SCADA
Temp
Changes
Perm
Changes
Dynamic
Changes
On-Line Power
Flow (OLPF)
IVVC
Optimizing
Engine
MDMSAMILine
Switch
Substation RTU
Substation
Transformer
with TCUL
Substation
Capacitor
Bank
Switched
Cap Bank
Line Voltage
Regulator
Permanent asset changes (line extension,
reconductor)
Cuts, jumpers, manual switching
Real-Time Updates
IVVC requires an accurate, up-to date
electrical model
Integrated Volt-VAR Control (IVVC) System Config
© 2010 Quanta Technology LLC
Integrated Volt-VAR Control (IVVC) System Config
Distribution
System Model
Geographic
Information
System (GIS)
Distribution
SCADA
Temp
Changes
Perm
Changes
Dynamic
Changes
On-Line Power
Flow (OLPF)
IVVC
Optimizing
Engine
MDMSAMILine
Switch
Substation RTU
Substation
Transformer
with TCUL
Substation
Capacitor
Bank
Switched
Cap Bank
Line Voltage
Regulator
OLPF calculates losses, voltage
profile, etc
Powerflow Results

© 2010 Quanta Technology LLC
Integrated Volt-VAR Control (IVVC) System Config
Distribution
System Model
Geographic
Information
System (GIS)
Distribution
SCADA
Temp
Changes
Perm
Changes
Dynamic
Changes
On-Line Power
Flow (OLPF)
IVVC
Optimizing
Engine
MDMSAMILine
Switch
Substation RTU
Substation
Transformer
with TCUL
Substation
Capacitor
Bank
Switched
Cap Bank
Line Voltage
Regulator
Powerflow Results
Alternative Switching
Plan
Determines optimal set of control
actions to achieve a desired objective
© 2010 Quanta Technology LLC
Integrated Volt-VAR Control (IVVC) System Config
Distribution
System Model
Geographic
Information
System (GIS)
Distribution
SCADA
Temp
Changes
Perm
Changes
Dynamic
Changes
On-Line Power
Flow (OLPF)
IVVC
Optimizing
Engine
MDMSAMILine
Switch
Substation RTU
Substation
Transformer
with TCUL
Substation
Capacitor
Bank
Switched
Cap Bank
Line Voltage
Regulator
Optimal Switching
Plan
Determines optimal set of control
actions to achieve a desired objective

© 2010 Quanta Technology LLC
IVVC Benefits
• Dynamic model updates automatically when reconfiguration occurs
• Volt – VAR control actions are coordinated
• System can model the effects of Distributed Generation and other modern grid elements
• Produces “optimal” results
• Accommodates varying operating objectives depending on present need
© 2010 Quanta Technology LLC
Reduced “Wear and Tear” on Vreg
Equipment
• Experience with advanced VVO programs
indicates that:
– Switched capacitor banks switch less often
(extends life of switch, reduces PQ affects of cap
bank switching)
– Tap changers change taps less often (Can bias
recommended control actions to choose switching
scenarios that do not move the taps much)

© 2010 Quanta Technology LLC
Lower Revenue – A Negative Benefit
• Operating with lower voltage on a 7 x 24 basis
results in considerable lost revenue
• In most cases, other benefits outweigh the
lost revenue
Lost Lost revenue revenue
from kWh from kWh
SalesSales
Lower losses, Lower losses, lower demand, lower demand,
extended extended
equipment lifeequipment life
© 2010 Quanta Technology LLC
Impact of Voltage Reduction on Customers
• In most cases, voltage reduction does not
impact customer equipment, but…..
• Some customers are aware of the principle of
voltage reduction and gave already taken
steps to lower their voltage via individual
service voltage regulators
• When utility lowers the voltage on the feeder,
customers who are already lowering their
own voltage will go below the minimum

© 2010 Quanta Technology LLC
Voltage Reduction Limitations
• Feeders voltage limited?
– May not be able to reduce voltage at all
– May need to “flatten” the voltage profile
(Progress Energy, Georgia Power, etc)
© 2010 Quanta Technology LLC
Current Technologies, LLC

© 2010 Quanta Technology LLC
PCS Utilidata – Adaptivolt – VVO without Rules or Models
© 2010 Quanta Technology LLC
Final Volt-VAR “Scorecard”
Volt VAR RequirementsTraditional Volt-
VAR
SCADA Volt-
VAR
Integrated Volt-
VAR
Acceptable Voltage Profile X X X
Acceptable Power Factor X X X
Self Monitoring X X
Operator Override X X
Feeder Reconfiguration X
SmartGrid Devices X
Optimal Coordinated Control X
Selectable Operating Objectives X
Volt-VAR Approach
© 2010 Quanta Technology LLC
Questions?
© 2010 Quanta Technology LLC
Bob Uluski
UU208: Distribution Automation –
Smart Feeders in a Smart Grid World
DA System Architecture

© 2010 Quanta Technology LLC
Objective of this Presentation
• Provide an overview of various approaches to DA system architecture
• Identify key issues to consider
• List pro’s and cons of each approach
• Provide guidance on determining which approach work best under what circumstances
• Identify vendors that support each architecture
© 2010 Quanta Technology LLC
Centralized Architecture
Control
Center
Feeder
Locations
DA Logic
Resides here
• Main logic resides in control center servers
• Logic can be “rule based” or “model based” (model maintained via GIS)
• Usually part of a distribution SCADA, EMS or DMS – can be a third party add-on server
• Many use “dumb” field devices, but some use IED for backup/failsafe
• Numerous communication strategies
• Direct (MAS radio, cellular, etc)
• Flow through substation
• Use AMI “back haul”infrastructure

© 2010 Quanta Technology LLC
Centralized Architecture
Control
Center
Feeder
Locations
DA Logic
Resides here
• With purely centralized approach, nothing happens without the main computer and control center
– Some see this as a disadvantage
– Some see this as an advantage
© 2010 Quanta Technology LLC
Localized, Peer-Peer Approach
– A feature of this approach is that it doesn’t absolutely require a
distribution SCADA system
– Intelligence resides in local processors located out on the feeders –
– Local processors make switching decisions based on local measurements and information acquired from “peers”
– Also have localized automation in the form of standalone IED

© 2010 Quanta Technology LLC
Substation Centered
• Main DA logic runs on a processor located in the substations
• One of the earliest approaches to DA
• Substation processors getting more powerful
• This approach is gaining in popularity
Control
Center
Feeder
Locations
Substation
DA Logic
Resides Here
Drawn by R. Uluski, EnerNex
Substation
Master
© 2010 Quanta Technology LLC
Criteria for Selecting
The Ideal DA Architecture
• Dispatcher Issues
• Ability to handle reconfiguration
• Ability to handle a flexible set of applications
• Scalability
• Performance (the “need for speed”)
• Maintainability
• Support for Smart Grid applications

© 2010 Quanta Technology LLC
Operator Visibility• Operators want to know what’s going on at all times
– Concern about feeders being reconfigured
– Automatic trip and isolate (recloser/sectionalizer) generally not a problem
– Volt-VAR control generally not a problem
• Can be a very passionate issue, especially for utilities that have limited or no experience with feeder automation. This objection tends to soften through periods of successful operation
• Comparison of DA Architectures – Operator Visibility– Centralized approach shines!
• Nothing happens without control center knowing
– Substation centered
• If substation-CC communication circuit fails, operations not reported to CC
• If substation-feeder communication fails, can disable DA (Workaround)
– Localized, peer-peer
• If substation-CC communication circuit fails, operations not reported to CC
• If substation-feeder communication fails, can disable DA (Workaround)
Issue Centralized Substation Centered Localized, Peer-Peer
Operator VisibilityScorecard
© 2010 Quanta Technology LLC
System Performance
• DA system performance must be fast enough to satisfy the most stringent system requirement
– Volt-VAR applications generally are not too time critical
– Fault detection isolation restoration (FDIR) performance requirements vary
• 5 minute momentary/sustained threshold (fast)
• 1 minute momentary/sustained threshold (very fast)
– “Bumpless” transition to microgrid (Extremely fast)
• Comparison of DA Architectures – System Performance– Centralized approach
• Connection back to control center adds latency (delay)
• With high bandwidth fiber optic connection via the substation, delay tolerable for most applications
• With lower bandwidth connection (e.g., 1200 - 4800 baud leased line) delay can be excessive
– Substation centered
• Application uses high speed communications (> 100 kbps) over relatively short distances
• Possible latency through substation processor
– Localized, peer-peer
• Application uses high speed communications (> 100 kbps) over relatively short distances
Scorecard Issue Centralized Substation Centered Localized, Peer-Peer
Performance
`
Event occurs
10:30:00
Event reported
10:30:30
(30 second latency)

© 2010 Quanta Technology LLC
Scalability• In most cases, DA is not deployed at all locations – usually done on worst performing feeders
• Ideally, should be able to handle small and large quantities of feeders, with various “densities”
– “Density” = # feeders per substation
– System cost affected by # units and substation density
– Control center costs are shared by all feeders
– Substation costs are shared by “N” feeders per substation
60
70
80
90
100
0 100 200 300 400
# Feeders to automate
% r
ed
uc
tio
n i
n S
AID
I
© 2010 Quanta Technology LLC
1 Feeder per Substation
$0
$5,000,000
$10,000,000
$15,000,000
$20,000,000
$25,000,000
$30,000,000
$35,000,000
$40,000,000
$45,000,000
1 8 15 22 29 36 43 50 57 64 71 78 85 92 99
# Feeders
Centralized
Substation
Distributed
Number of feeders being automated

© 2010 Quanta Technology LLC
3 Feeders per Substation
$0
$2,000,000
$4,000,000
$6,000,000
$8,000,000
$10,000,000
$12,000,000
$14,000,000
$16,000,000
$18,000,000
1 8 15 22 29 36 43 50 57 64 71 78 85 92 99
# Feeders
Centralized
Substation
Distributed
Number of feeders being automated
© 2010 Quanta Technology LLC
4 Feeders per Substation
$0
$2,000,000
$4,000,000
$6,000,000
$8,000,000
$10,000,000
$12,000,000
$14,000,000
1 8 15 22 29 36 43 50 57 64 71 78 85 92 99
# Feeders
Centralized
Substation
Distributed
Number of feeders being automated

© 2010 Quanta Technology LLC
5 Feeders per Substation
$0
$2,000,000
$4,000,000
$6,000,000
$8,000,000
$10,000,000
$12,000,000
1 8 15 22 29 36 43 50 57 64 71 78 85 92 99
# Feeders
Centralized
Substation
Distributed
Number of feeders being automated
© 2010 Quanta Technology LLC
6 Feeders per Substation
$0
$2,000,000
$4,000,000
$6,000,000
$8,000,000
$10,000,000
$12,000,000
1 8 15 22 29 36 43 50 57 64 71 78 85 92 99
# Feeders
Centralized
Substation
Distributed
Number of feeders being automated

© 2010 Quanta Technology LLC
7 Feeders per Substation
$0
$2,000,000
$4,000,000
$6,000,000
$8,000,000
$10,000,000
$12,000,000
1 8 15 22 29 36 43 50 57 64 71 78 85 92 99
# Feeders
Centralized
Substation
Distributed
Number of feeders being automated
© 2010 Quanta Technology LLC
Scalability
• Comparison of DA Architectures – Scalability
– Centralized approach• Lower cost SCADA type interface at each switch
• Big up front investment in control center
• Moderate investment in substation
• Generally not very scalable– Best application is large number of feeders
– Generally not justifiable for small number of feeders
– Substation centered• Lower cost SCADA type interface at each switch
• Significant investment in each substation
• Somewhat scalable– Can do a single substation
– Economics best with high “substation density”
– Localized, peer-peer• Higher cost per switch controller
• Most highly scalable – can do a single worst performing feeder or a few widely dispersed feeders
ScorecardIssue Centralized Substation Centered Localized, Peer-Peer
Scalability

© 2010 Quanta Technology LLC
Support for
Multiple Applications• DA applications are interrelated
– For example, automatic line switching may relocate a capacitor bank and change the whole way in which the cap bank should be operated
• Ideally, the system should support multiple DA applications so that all interactions are properly accounted for
– Fault location, isolation, and service restoration
– Volt-VAR control
– Optimal Network Reconfiguration (loss reduction, load balance, etc)
– Others
• Comparison of DA Architectures – Support for Multiple Applications– Centralized approach
• Full suite of DA applications available and supported
• Applications can run off the same dynamically operable model
– Substation centered• Possible to rehost key DA applications (FLISR, VVO) to substation processor, along with
relevant portion of models
– Localized, peer-peer• Generally limited to single key function such as FLISR
• S&C DESS microgrid is an exception (possibly others)
Scorecard Issue Centralized Substation Centered Localized, Peer-Peer
Support Multiple Applications
Distribution
SystemManagement
Automatic
ServiceRestoration
Fault
Location
Volt-VAROptimization Optimal
NetworkReconfig
EmergencyLoad Shed
Switch Order
Management
DistributionSCADA
© 2010 Quanta Technology LLC
Operation Following
Feeder Reconfiguration• DA applications should be able to handle changing feeder configuration
• Changes can occur through automated/remote controlled switching or field switching
• DA applications should produce the best possible control actions given the current configuration
• Comparison of DA Architectures – Support for Feeder Reconfiguration– Centralized approach
• Reconfiguration reflected in dynamic models used by centralized approach
– Substation centered• Changes reflected in application with model based solution
• Rule based solution may not work correctly following reconfiguration
– Localized, peer-peer
• Approach usually does not adjust to reconfiguration
ScorecardIssue Centralized Substation Centered Localized, Peer-Peer
Support Multiple Applications

© 2010 Quanta Technology LLC
Maintainability• System must be maintainable, hopefully centralized maintenance is possible
– Need convenient mechanism for making permanent and temporary updates
• Line extensions, new equipment
• Temporary: cuts, jumpers, field switching
– Network management capability – must be able to view the health of components and communication network
• Comparison of DA Architectures – Maintainability– Centralized approach
• Temporary changes handled though dispatcher user interface
• Permanent changes handled via GIS (assuming GIS data is correct)
• GIS interface process not easy, but a well known process
– Substation centered
• Vendor specific software for centralized maintenance
• Concern about remote setting changes on control equipment (similar concern to remote relay setting changes)
– Localized, peer-peer
• Vendor specific software for centralized maintenance
• Relatively straightforward process for reconfiguring system
• Concern about remote setting changes on control equipment (similar concern to remote relay setting changes)
ScorecardIssue Centralized Substation Centered Localized, Peer-Peer
Maintainability
© 2010 Quanta Technology LLC
SG: Support for Microgrid
Operation• Support for microgrid and DER operation is clearly a key SmartGrid requirement
• Key requirements:– High speed control actions for coordinated operation of static devices
– Reduced reliance on communication facilities
• Comparison of DA Architectures – Support for Microgrid Operation
– Centralized approach• Connection back to control center adds latency (delay)
• Reliance on communication facilities over long distances
– Substation centered• Some delay possible as controllers communicate via the substation
• Reliance on communication facilities over moderate distances
– Localized, peer-peer• Minimal delay
• No “indirect” communication “hops”
ScorecardIssue Centralized Substation Centered Localized, Peer-Peer
Support for Microgrid Operation

© 2010 Quanta Technology LLC
SmartGrid: Data Concentration
and Preprocessing
• A number of advanced applications (fault anticipator, HQ fault locator) require ability to:
– Acquire large quantities of data from the field (current and voltage waveform data)
– Store and Process the data
– Send simple English language results to the dispatcher (“Device “X” is broken”)
• Comparison of DA Architectures – Data Concentration and Pre-Processing– Centralized approach
• Need to transport large volume of data to the central location – this can heavily burden the communication facilities
• Once the data gets to the control center, plenty of storage and processing capability
– Substation centered
• Substation processor able to store and pre-process the raw data from sensors and IEDs
• Communicate concise info (“Device “A” Broken!”) upstream to control center
• No need to burden upstream communications
– Localized, peer-peer• Ok if entire function is packaged in a single IED
• If not, approach is not well suited for this application
Scorecard Issue Centralized Substation Centered Localized, Peer-Peer
Data Concentration & Preprocessing
© 2010 Quanta Technology LLC
Summary Scorecard
Issue Centralized Substation Centered Localized, Peer-Peer
Operator Visibility
Operating Modes
Performance
Scalability
Support Multiple Applications
Support Feeder Configuration
Maintainability
Data Concentration & Preprocessing
Support for Microgrid Operation

© 2010 Quanta Technology LLC
Centralized Approach – Sample
Architecture
Database Servers
DMS Application
Servers
DMS Data CenterLocal Area Network
`
Programmer Console
Operator Consoles
Database Servers
DMS Application
Servers
DMS Data CenterLocal Area Network
`
Programmer Console
Operator Consoles
Firewall
Outage Management
System
Geographic Information
System (GIS)
SCADA/DMS LAN
Front End Processors
Secure Substation Network
AMI Network
DMSHistorian
Distribution Control Center (Site One)
DMS FEP Servers
Distribution Feeder Devices
(Line reclosers, switched capacitor banks, voltage
regulators)
IPP
Substation RTUs or Data Concentrators
Corporate LAN
Distribution Control Center (Site Two)
© 2010 Quanta Technology LLC
Some Vendors That Support the
Centralized DA Approach
• ABB (Network Manager)
• Advanced Control Systems (PRISM)
• AREVA (eterradistribution)
• DigitaLogic (IAR)
• GE Energy (ENMAC system)
• Hitachi
• Open Systems International (OpenDNA)
• Siemens-Intergraph
• SNC Lavalin (GENe)
• Survalent (former Quindar)
• Telvent/Abengoa-DMS Group (OASys)

© 2010 Quanta Technology LLC
A Variation of the Centralized Approach• SCADA system resides on one central platform
• DA/DMS functions reside on a second system
• The two independent systems communicate via a data link (e.g., ICCP)
Oracle Utilities NMS, PCS Utilidata, UCI
Supplied By Vendor 2
Supplied By Vendor 1
© 2010 Quanta Technology LLC
DA Vendors That Support Substation
Centered Approach
Substation Automation
ApplicationACS
AREVA
T&D
BOW
NETWORKS
GENERAL
ELECTRICNOVATECH SEL
SIEMENS
PT&DTELVENT
Automatic feeder reconfiguration: � � � � � � � �
Volt/var optimization� � � � � �
Simple cap bank control � � � � � � �
FACTS SCADA or control � � �
Remote fault location � � � � � �
Equipment condition
monitoring � � � � � �
Distributed Energy Resource Mon & control
� � � �
IEC 61131 support � � � � � �
IEC 61850 8-1, 9-2, 9-2 � � � � �
Synchrophasor handling � �
AMI network interface �
Source: Survey of SA Vendors conducted by Bob Uluski, Quanta Technology, October 2008
© 2010 Quanta Technology LLC
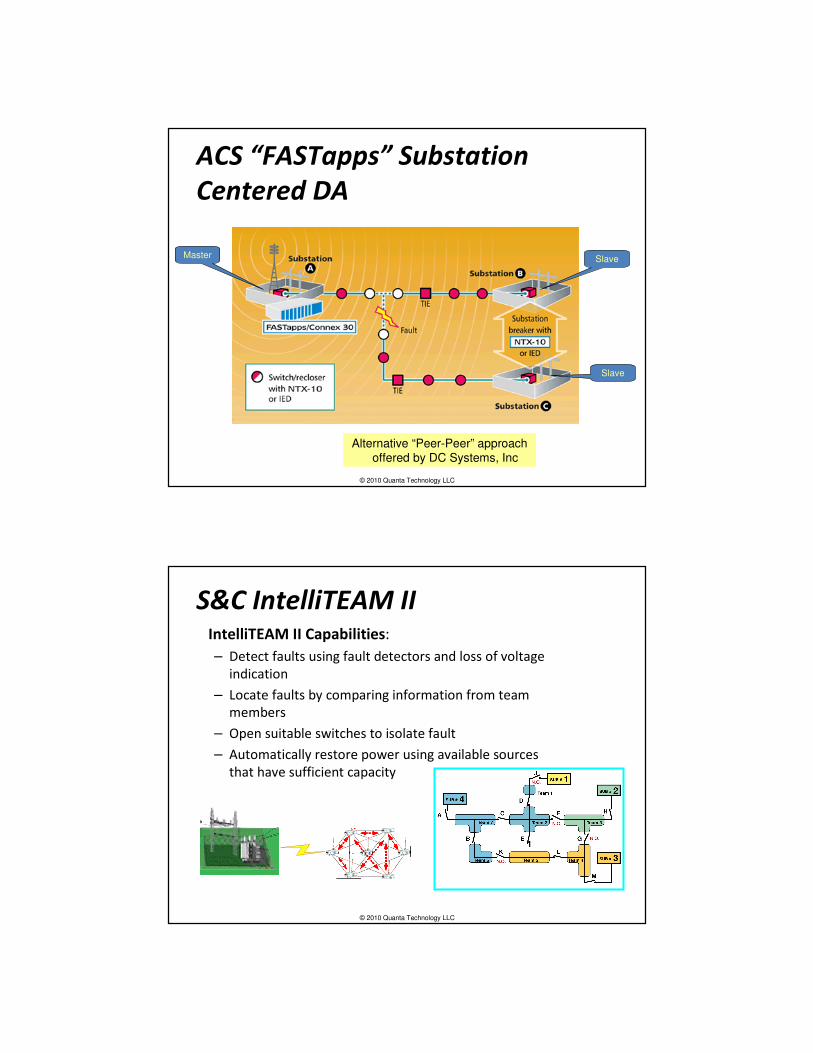
ACS “FASTapps” Substation
Centered DA
Master Slave
Slave
Alternative “Peer-Peer” approach offered by DC Systems, Inc
© 2010 Quanta Technology LLC
S&C IntelliTEAM IIIntelliTEAM II Capabilities:
– Detect faults using fault detectors and loss of voltage
indication
– Locate faults by comparing information from team
members
– Open suitable switches to isolate fault
– Automatically restore power using available sources
that have sufficient capacity

© 2010 Quanta Technology LLC
Example Peer-to-Peer Architecture
Jungle Mux
Terminal Server
D20
Spread Spectrum Radio
Substation
S&C 5800
Switch
Controller
S&C 5800
Switch
Controller
S&C 5800
SwitchController
Jungle Mux
Terminal Server
D20
Spread Spectrum Radio
Substation
S&C 5800
Switch
Controller
S&C 5800
Switch
Controller
S&C 5800
SwitchController
Survalent Master Proxy Server
Jungle Mux
Firewall
Logic Module
Jungle Mux
Terminal Server
D20
Spread Spectrum Radio
Substation
S&C 5800
Switch
Controller
S&C 5800
SwitchController
Control Center
S&C 5800
Switch
Controller
Broadband Fibreoptic Network
System Architecture
© 2010 Quanta Technology LLC
Schweitzer (SEL)
• Basic Building Block Approach
– SCE, PSE&G, others

© 2010 Quanta Technology LLC
Comparison of System Architecture
© 2010 Quanta Technology LLC
DA System Vendors
Vendor Name FLISR
VAR
Dispatch
Voltage
Control IVVC Centralized
Centralized
Variation
Substation
Centered Distributed
ABB X XUnder
development XUnder
development
Advanced Control Systems X X X X X X
AREVA T&D X X X X X
Cooper/Cannon TechnologyUnder
development X X X X X X X
DAQ Electronics X X X X X
General Electric (GE Energy) X X X X X X
Novatech X X X X
Oracle Utilities XUnder
development X
S&C Electric Company X X
Siemens/ Integraph X X X X X
SNC Lavalin X X X X X
Survalent Technologies X X
Telvent-Abengoa X X X X X
Applications Supported Architecture Supported

© 2010 Quanta Technology LLC
DA Vendor Websites Vendor Name Website
ABB http://www.abb.com/cawp/GAD02181/C1256D71001E0037C1256
D1F004C79B6.aspx
Advanced Control
Systems (ACS)
www.acsatlanta.com
Areva TD http://www.areva-td.com/static/html/TDE-AGF_ProdFamily-
ProductFamily_Detailsv2_1080218383387.html?&productline=111
4091350220
Cooper Power/Cannon
Technologies
http://www.cooperpower.com/peercomm/
DAQ Electronics www.daq.net
General Electric http://www.geindustrial.com/cwc/solutions?id=37
Novatech, Inc http://www.novatechweb.com/electric.html
S&C Electric Company http://www.sandc.com/products/distributionautomation.asp
Siemens Power T&D https://www.energy-portal.siemens.com/
SNC Lavalin http://www.snclavalin.com/ecs/En/dmsproj.htm
Survalent Technologies www.survalent.com
Telvent http://www.telvent.com/products/electric/dms.pdf
© 2010 Quanta Technology LLC
Conclusions
• There is no ideal approach that fits all
circumstances
• Many current system are centralized, but
growing trend toward distributed processing
• Most likely, a hybrid approach that has
elements of the three categories will evolve

© 2010 Quanta Technology LLC
Questions?
© 2010 Quanta Technology LLC
Hahn TramBob Uluski
UU208: Distribution Automation –
Smart Feeders in a Smart Grid World
Distribution Management
Systems

© 2010 Quanta Technology LLC
DMS Defined
• Distribution Management System
A Decision Support System to assist the
control room and field operating personnel with the monitoring and control of the
electric distribution system Note: Not to be confused with Demand Side Management (DSM)!
© 2010 Quanta Technology LLC
DMS Defined – What’s included?
• Basic operating tools
– Distribution SCADA (DSCADA)
– “Person in Charge” software tools
• managing permits, clearances, safety
protection guarantees
• Generating switching orders

© 2010 Quanta Technology LLC
DMS Defined – What’s included?
• Advanced Distribution Applications
– On line power flow
– Load forecasting (short and long term)
– State estimation
– Fault location
– Distribution contingency analysis
– Distribution “congestion management”
– System optimization (e.g. Optimal Network Reconfiguration)
© 2010 Quanta Technology LLC
DMS Defined – What’s included?
• May be a host for DA
(feeder automation)
applications
– Fault location isolation
and service restoration
(FLISR)
– Volt-VAR optimization
(VVO)
Control
Center
Feeder
Locations
DA Logic
Resides here

© 2010 Quanta Technology LLC
The DMS Concept at BC Hydro
DMS Concept at BC Hydro
© 2010 Quanta Technology LLC
Topics
• DMS Functions pertaining to DA
– On-Line Power Flow (OLPF)
– State estimation
– Fault Location
– Switch Order Management (SOM)
– Contingency Analysis
– Congestion management
• System Integration (Hahn)

© 2010 Quanta Technology LLC
State Estimation
• Objectives– Topology verification
– Estimation of loads
– Validation of telemetered data
– Load calibration
• A Data Consolidation Process– Take the advantages of sufficient measurement redundancy (M/N
> 1.5)
– Correct data errors due to conflict/incorrect/inaccurate/asynchronous
– measurements
• Candidate State Variables (independent variables)– Voltages
– Branch Currents
– Nodal Injections
© 2010 Quanta Technology LLC
DMS State Estimation
• DMS State Estimation (SE) - a procedure used to
calculate the state of distribution system based on:
– distribution system configuration (topology),
– real time measurements and
– customer load profiles – pseudo measurement
• Consists of:
– Static state estimation
– Identification and re-estimation of bad measurements and
parameters

© 2010 Quanta Technology LLC
On-Line Power Flow (OLPF)• What is OLPF?
– A real-time version of the well known engineering power flow tool (“off line”power flow)
• What does it do?– Calculates electrical conditions
(voltage, current, real/reactive power) at all points along the feeder.
• OLPF objectives:– Provide operators with nearly
continuous “visibility” of all points along the feeder where no SCADA measurements exist (“state estimator”for distribution circuits)
– Provide feeder electrical information needed by other DMS applications (FLISR, IVVC, Switch order management, etc)
© 2010 Quanta Technology LLC
On-Line Power Flow• How does it work?
– Works in much the same way as the engineering tool
– Uses one of the many available iterative solution techniques:
• Newton Raphson, YBus, ZBus, Forward/Backward “Sweep”
– Must be able to handle radial circuit and “weakly meshed” circuit
• Note: “Weakly meshed” means there may be a few loops
– Unlike off-line engineering tool, OLPF results are scaled to match available real-time measurements
• Substation end of feeder (breaker via DSCADA)
• Mid line measurements (recloser via feeder SCADA)
• Handful of AMI measures from strategically-placed measurements (distribution transformer, voltage at feeder extremities)

© 2010 Quanta Technology LLC
How DG is Modeled By DMS Vendors• Variations exist in the way the DMS vendors handle DG resources:
– Full regulating model• Generally the best approach fo modeling the dynamic behavior of the dg units under normal and
emergency
• PQ type (fixed real and reactive power) or PV type (fixed real power and target regulating voltage)
– Negative Load Model• Can be profiled, such as CHP (combined heating and power) units.
• Fault current contribution is not accounted for in fault-level calculations
• Cannot be the only source of power for de-energized island
– No model – DER outputs captured by SCADA in real-time• No guesswork regarding generator status and output
• May not be able to determine fault current contribution without dynamic model
• Not really suitable for outage planning and engineering analysis (study mode)
– Three phase and single phase models• some vendors cannot handle single phase DER units, others can
• Some require balanced 3 phase generator output, other models support unbalanced performance
• Conclusion:– Regulating Model (PQ or PV) is needed to properly model the effects of DG units under normal
and emergency conditions (e.g. fault contribution)
– Not all DMS vendors support the necessary facilities for handling DG
– Need to ask detailed questions; and make decisions accordingly
© 2010 Quanta Technology LLC
On-Line Power Flow Models
• Feeder electrical model
– Unbalanced 3-phase representation
– Some DMS applications (especially IVVC) require modeling from substation transformer high side to distribution service transformer
– Handle radial and weakly meshed circuits
– Modeling of distributed generating resources
• Fully regulating model
• Negative load
– Creating and maintaining the model
• Via Geographic Information System (GIS) for large systems
• Via existing engineering model or OMS
• Manually (small systems only)

© 2010 Quanta Technology LLC
On-Line Power Flow Models• Load models
– OLPF solution requires load approximation for each distribution
service transformer – Load Estimator function handles this
– Conventional approach – use load profile obtained via statistical load
survey
– “Smart” approach: Use near real time AMI data from representative
distribution transformers instead of load profile.
© 2010 Quanta Technology LLC
Viewing OLPF results• Tabular display (SNC Lavalin)
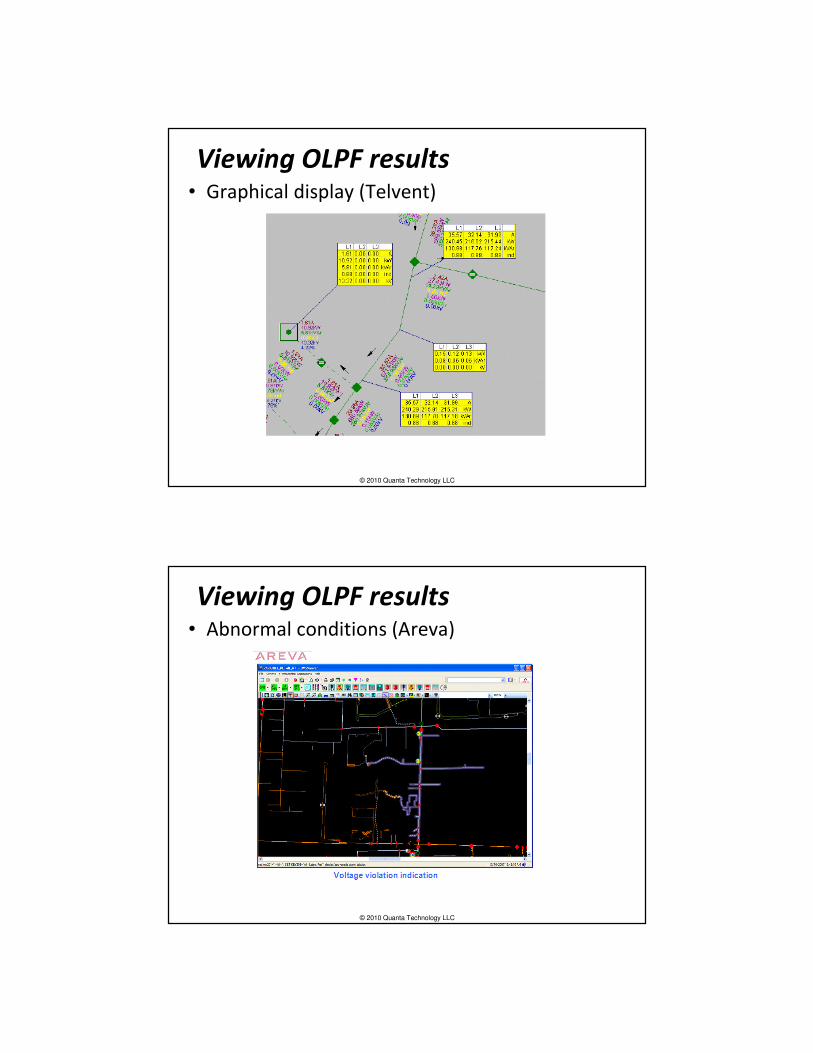
© 2010 Quanta Technology LLC
Viewing OLPF results• Graphical display (Telvent)
© 2010 Quanta Technology LLC
Viewing OLPF results• Abnormal conditions (Areva)

© 2010 Quanta Technology LLC
Fault Location• Objective: Assist field crews in pinpointing fault location
• Fault distance provided by protective relay IEDs not accurate:
– Assumes homogeneous wire size/arrangement
– Fault impedance unknown
• DMS Approach:
– “Reverse short circuit” analysis
• Obtain fault magnitude and type (A, B, C, A-B, etc) fro
relay IED
• Determine possible fault locations using DMS short
circuit analysis tool and associated feeder model
• Determine electrical distance using reactance to fault –
eliminate effects of mostly resistive fault impedance
© 2010 Quanta Technology LLC
Fault Location – DMS Reverse SCA
Approach