distribution and conservation of andean agrobiodiversity in ......tropaeolum tuberosum, oxalis...
TRANSCRIPT

Distribution and
Conservation of Andean
Agrobiodiversity in
Imbabura (Ecuador)
María José Romero
Universidad Técnica del Norte - Ecuador

Overview
•The Andes’ highlands are one of the most important
centers of agrobiodiversity in Ecuador (Sánchez,
2014).
•The ever increasing advance in GIS has made it
possible their use to support the study of genetic
resources.
•The objective of this study was to determine the
geographical distribution and conservation of
agrobiodiversity in the Andes’ highlands of the
province of Imbabura.

Area of Study
• Andes’ highlands (> 2500 masl - 8202 ft)
• Biological, cultural and ethnic diversity
• 85 communities in 6 cantons

Text goes here
Methods
• Georeferenced primary information.
• Structured survey (small farmers in Andes’ communities).
Geographic Distribution
• ArcGIS Analysis Tools: Spatial Directional Distribution (Standard Deviational Ellipse)
• Cartography
• Biodiversity Pro: Diversity indexes: Shannon-Weinner, Simpson, Margalef and cluster analysis
• Cartography
Richness and Conservation
• ArcGIS Interpolation: Inverse Distance Weighted (IDW)
• Cartography
Agro -biodiversity
Uses
• ArcGIS Spatial Statistics Tools: Spatial Autocorrelation (Morans I)
• ArcGIS Analysis Tools: Near
• Cartography
Proximity to Urban Areas

Results
Agrobiodiversity found in the study.
Crop Group
Leguminous (Phaseolus vulgaris, Pisum sativum, Lupinus mutabilis, Vicia faba, Cicer
arietinum, Lens culinaris)
Gramineous (Avena sativa, Zea mays, Hordeum vulgare, Triricum spp.)
Roots and Tubers (Smallanthus sonchifolius, Solanum tuberosum, Ullucus tuberosus,
Tropaeolum tuberosum, Oxalis tuberosa, Ipomea batatas, Arracacia xanthorrhiza, Daucus
carota)
Chenopodiaceae and amaranthaceae (Chenopodium quinoa, Amaranthus spp.)
Fruits (Persea americana, Carica pentagona, Prunus spp., Fragaria sp., Passiflora spp., Citrus
spp., Pyrus malus, Rubus glaucus, Solanum betaceum, Physalis peruviana)
Cucurbits (Cucurbita spp.)
Vegetables (Brassica spp., Beta vulgaris, Allium spp., Lactuca sativa, Raphanus sativus)

Results
Distribution of agrobiodiversity
Standard
deviational
ellipses
showed a
tendency to
elongated
distribution

Results
Crop richness
• High crop diversity in the whole province.
• Otavalo has the largest number of crops, meaning
the greatest agrobiodiversity richness by crop
group (up to 17 crops/farmer).
• Bean: 24 local names
• Corn: 13 local names

Results
Crop richness

Results
•Diversity indexes to determine conservation levels
Índices A. Ante Cotacachi Ibarra Otavalo Pimampiro Urcuquí
Shannon H’ Log Base 10 0.848 1.050 1.014 1.089 1.118 0.931
Shannon Hmax Log Base 10 0.954 1.204 1.279 1.602 1.322 1
Shannon J’ 0.888 0.872 0.793 0.680 0.845 0.931
Simpson Diversity (D) 0.15 0.105 0.121 0.115 0.095 0.119
Margalef M Base 10 24.384 23.657 17.005 15.307 20.975 22.759
• Pimampiro greater Shannon (H ') diversity.
• Otavalo highest maximum diversity (H max).
• Urcuquí highest values of homogeneity (Shannon J ').
• Simpson dominance index (D) show the probability that two individuals
randomly selected from a sample will belong to the same species.
• Margalef index show that all sampling sites have a high diversity of
species (values superior than 5).

Results
•Cluster analysis
Cluster analysis, shows 73% of similarity between
species (crops) in Cotacachi and Antonio Ante
cantons.

Results
• Agrobiodiversity uses
Preparations
are specific to
the area and
allow
maintenance
of certain
varieties
because of
their
importance in
the cultural
context

Results
• Influence of proximity to urban areas
Results
• Influence of proximity to urban areas
• The application of spatial autocorrelation analysis
Moran’s I recognizes the existence of a pattern of
spatial distribution of crops.
• The correlation coefficient between the variables
number of crops and distance to urban areas is
0.15.
• This value shows a low positive correlation,
showing a slight tendency of agrobiodiversity to be
found away from urban areas.
Results
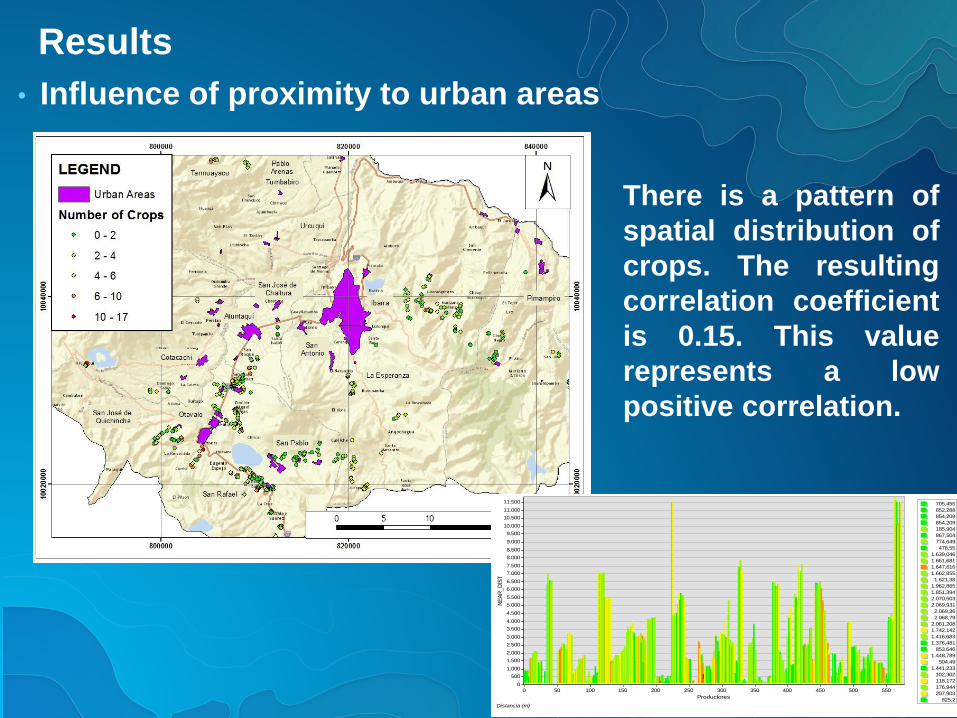
• Influence of proximity to urban areas
705,455
852,288
854,209
854,209
185,904
867,504
774,649
478,55
1.639,046
1.661,681
1.647,616
1.662,855
1.621,38
1.962,865
1.851,394
2.070,503
2.069,931
2.069,36
2.068,79
2.061,208
1.742,142
1.416,683
1.376,481
853,646
1.448,789
504,49
1.441,233
102,302
118,172
176,944
207,903
825,2
DISTANCIA PRODUCTORES A ZONAS URBANAS
Distancia (m)
Productores
550500450400350300250200150100500
NE
AR
_D
IST
11.500
11.000
10.500
10.000
9.500
9.000
8.500
8.000
7.500
7.000
6.500
6.000
5.500
5.000
4.500
4.000
3.500
3.000
2.500
2.000
1.500
1.000
500
0
There is a pattern of
spatial distribution of
crops. The resulting
correlation coefficient
is 0.15. This value
represents a low
positive correlation.

Conclusions
▪ The results show that the most agrobiodiverse areas
are located, predominantly, in canton Otavalo.
▪ A common perception is that beans and corn are the
main crops in all cantons.
▪ The results show that Shannon (H') index presents a
low diversity in all cantons. The Simpson (D)
dominance index shows that there is less diversity in
canton Antonio Ante. The Margalef index is greater
when the sampled area is smaller. Cluster analysis
shows that the highest similarity between cultivated
species occurs between cantons of Antonio Ante and
Cotacachi.
Conclusions
▪ There is a greater number of uses of agrobiodiversity
in Otavalo, Florida and San Clemente in Ibarra,
promoting more conservation.
▪ In terms of Moran’s I values, the estimation confirms a
tendency to clustering. Agrobiodiversity conservation
shows spatial autocorrelation.
▪ This study found that proximity to urban areas slightly
affects the agrobiodiversity conservation.
▪ The application of GIS on this research was relevant,
because it allowed recognizing the most
agrobiodiverse areas in the province.
