distributed systems challenges of monitoring · challenges of monitoring distributed systems may...
TRANSCRIPT

Challenges of Monitoring Distributed Systems
May 2017
Nenad [email protected]@smartcat.io
SmartCatwww.smartcat.io
@SmartCat_io

Agenda● Monitoring 101
● Metric data stream and tools
● Log data stream and tools
● Combine metrics and logs for full control
● Alerting
Monitoring 101• Monitoring domain consists of:
○ Metrics data stream
○ Log data stream
○ Alerting
Metrics Data Stream

Metric data stream• Easily forgotten and pushed aside when chasing deadlines
• Metrics are indicators that everything is working within expected boundaries
• Good dashboard has enough information (not too much, not too little)
Distributed system -> many graphs to watch -> information overload trap
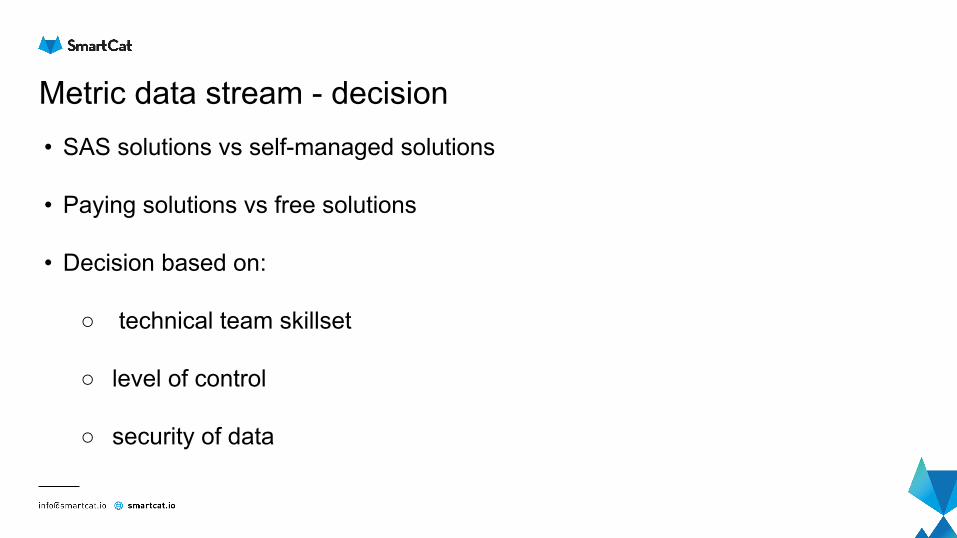
Metric data stream - decision• SAS solutions vs self-managed solutions
• Paying solutions vs free solutions
• Decision based on:
○ technical team skillset
○ level of control
○ security of data

Metric data stream - stack• Riemann as sink that handles events and sends them to Riemann server
• InfluxDB as NoSQL store which is build for measurements
• Grafana as visualization tool (flexible configurable graphs from many data
sources)

Log Data Stream
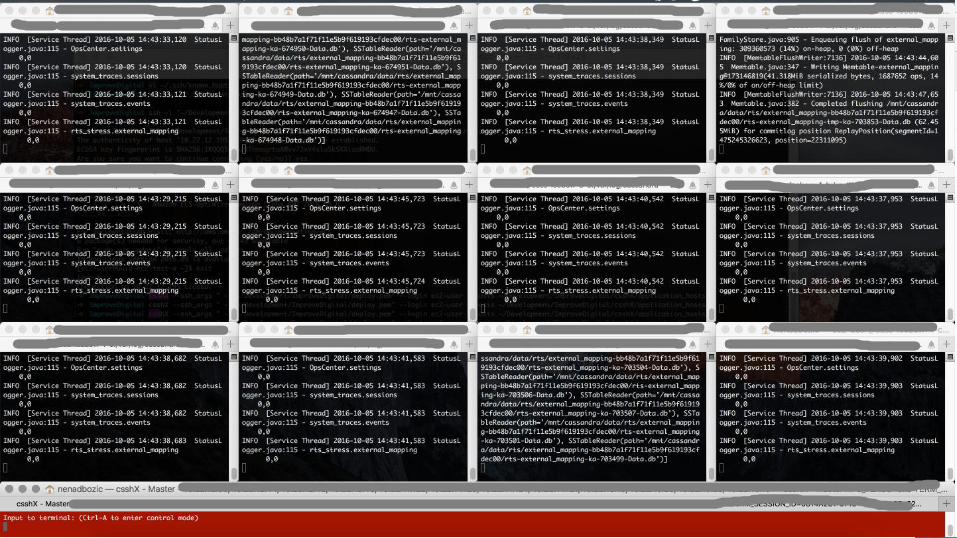
Log data stream• Log monitoring on single machine requires skill and knowledge
• Same challenges as with metrics (not too much, not too little)
• Metrics are indicator that something happened and logs provide context (what
happened)
Distributed system -> many terminals open -> information overload trap
Log data stream - decision• SAS solutions vs self-managed solutions
• Paying solutions and free solutions
• Decision based on:
○ technical team skillset
○ level of control
○ security of your data
Log data stream - ELK stack• ELK (ElasticSearch, LogStash, Kibana) all open source
• Filebeat is sending log messages from instances
• Logstash can filter, manipulate and transform messages
• ElasticSearch indexes log messages for easier searching
• Kibana is visualization tool with filtering capabilities

Combine logs and metrics
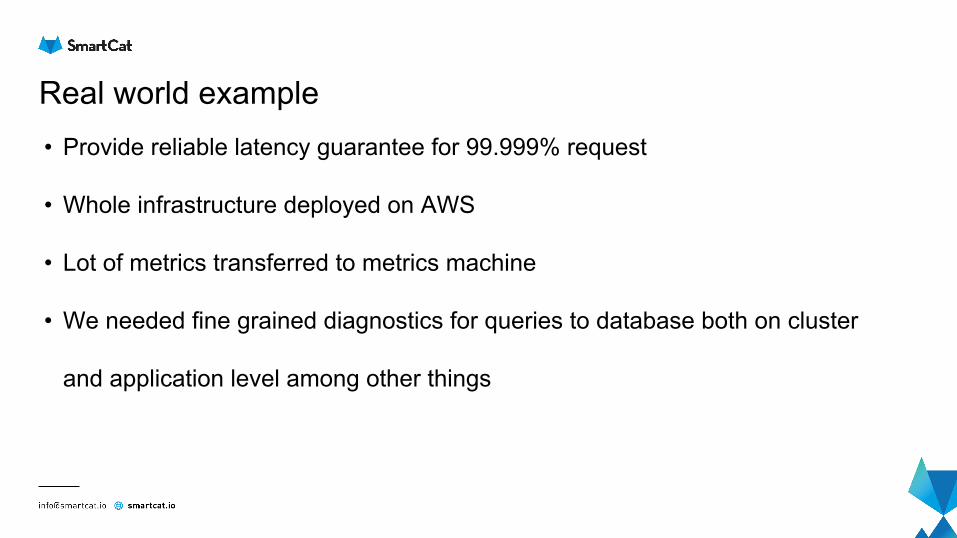
Real world example• Provide reliable latency guarantee for 99.999% request
• Whole infrastructure deployed on AWS
• Lot of metrics transferred to metrics machine
• We needed fine grained diagnostics for queries to database both on cluster
and application level among other things
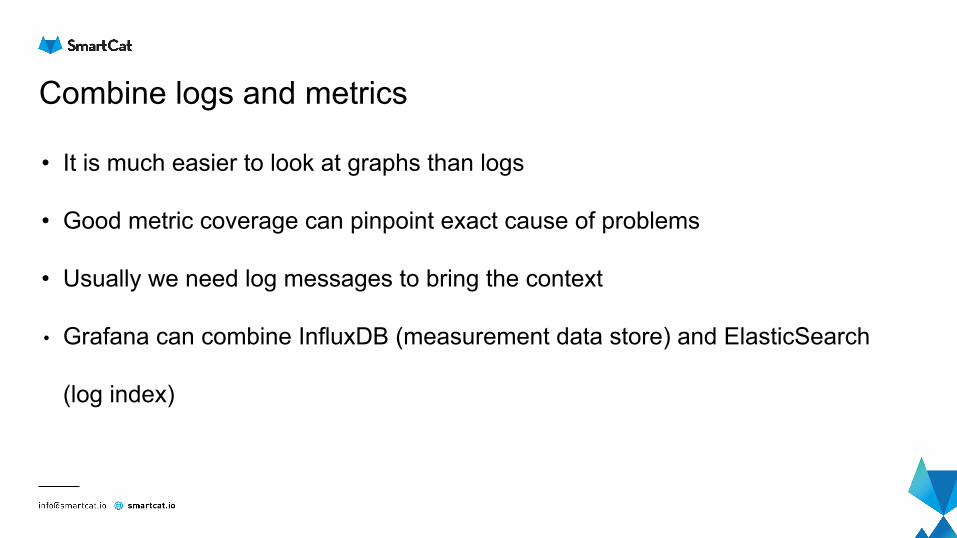
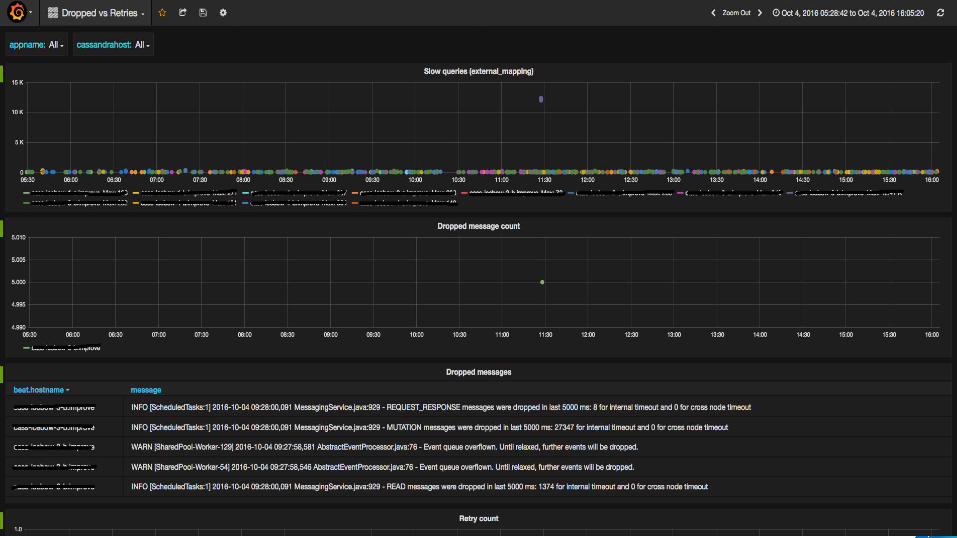
Combine logs and metrics
• It is much easier to look at graphs than logs
• Good metric coverage can pinpoint exact cause of problems
• Usually we need log messages to bring the context
• Grafana can combine InfluxDB (measurement data store) and ElasticSearch
(log index)


Alerting
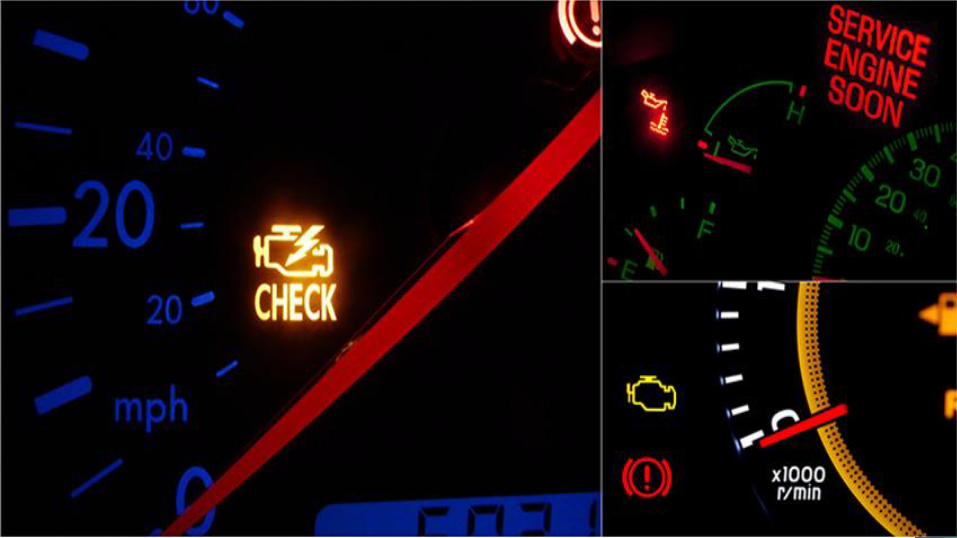
Alerting• Alerting is giving you freedom not to look at graphs
• Someone else placed domain knowledge about alerts
• Alerting must not be frequent since you will end up ignoring alerts
Distributed system -> many alerts -> information overload trap

Sentinel - SMART Alerting• Have more context when anomaly happens
• Have snapshot of the system at moment something happened
• Be proactive, not reactive, let system predict cause of malfunction and prevent
it instead of curing it
Sentinel - SMART Alerting
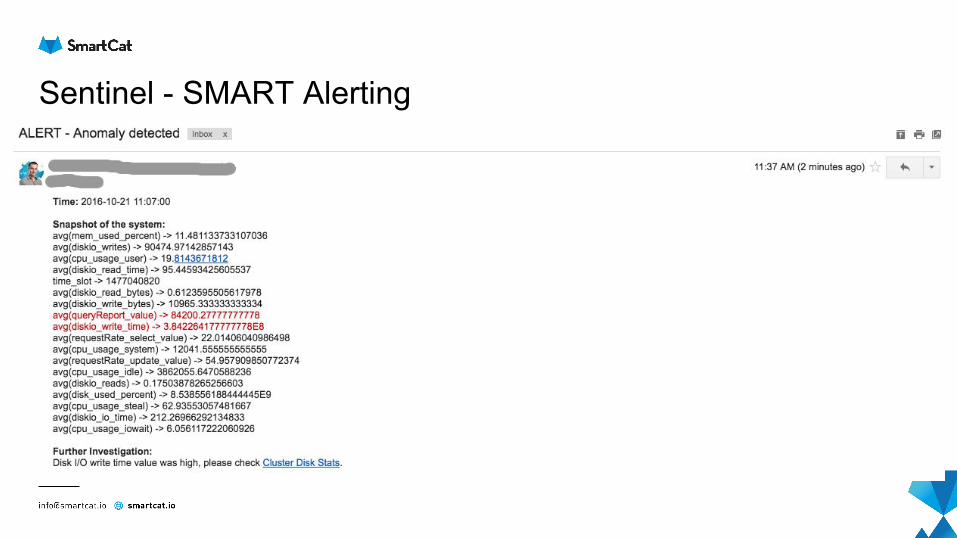
Sentinel - SMART Alerting

Conclusion
Conclusion• Have right amount of information, not too much, not too little
• Having good selection of metrics and logs is iterative process
• Do not end up fixing monitoring machine instead of fixing application code
(especially in distributed world)
• Be proactive, not reactive
• Tailor metrics by your needs, build tools if there are not any that suite your use
case
Links• Monitoring stack for distributed systems - SmartCat blog post
• Distributed logging - SmartCat blog post
• Metrics collection stack for distributed systems - SmartCat blog post
• Monitoring machine ansible project (Riemann, Influx, Grafana, ELK) -
SmartCat github project
Twitter@NenadBozicNs

Q&A
Thank you
Nenad Bozic@NenadBozicNs
SmartCatwww.smartcat.io
@SmartCat_io