distributed software router management - core · prof. marco gribaudo ... prof. federica cappelluti...
TRANSCRIPT
POLITECNICO DI TORINO
SCUOLA DI DOTTORATODottorato in Ingegneria Elettronica e delle Comunicazioni
XXIV ciclo
Tesi di Dottorato
Distributed Software RouterManagement
Fikru Getachew Debele
Tutore Coordinatore del corso di dottoratoprof. Andrea Bianco prof. Ivo Montrosset
February 28, 2013

Graduation committee:
Chairman:Prof Carla Raffaelli (University of Bologna, Italy)
Members:Prof. Emilio Leonardi (Politecnico di Torino, Italy)Prof. Marco Gribaudo (Politecnico di Milano, Italy)
Internal committe:Riccardo Scopigno (Istituto Superiore Mario Boella research institute, Italy)Prof. Federica Cappelluti (Politecnico di Torino, Italy)Prof. Maurizio M. Munaf (Politecnico di Torino, Italy)


Distributed Software Router Managementby
Fikru Getachew Debele
Submitted to the Department of Electronics and Telecommunicationin partial fulfillment of the requirements for the degree of
Doctor of Philosophyat the
Politecnico di Torino
February 28, 2013Copyright c© Fikru Getachew Debele
All rights reserved


Acknowledgements
Dear God, thank you so much that you have been walking along my side during thetough times I passed through during this research work, and indeed, throughout mylife.
One of the joys of completion is to look over the journey past and remember allwho have been with me along this long but fulfilling road.
First and foremost, I would like to express my heartfelt gratitude to Prof.Andrea Bianco for his constant and professional guidance. You showed me howto do research and your support uphold me to finish my study. I am also gratefulto all other people at TLC that I have learned to know over the years and who havelet me take part of their professional experience during seminars and discussions.
I have been very fortunate to get involved in a research group that beleives inteamwork. I want therefore to thank all the people I have collaborated with in theseyears. Among them, special thanks go to Robert Birke, who really took the time tofamiliarize with my research and come up with new and inspiring research directionsduring early days of my Ph.D. study. Many thanks also to Luca Giraudo andNanfang Li with whom I happily collaborate during some of my research activities.
I gratefully acknowledge the funding sources that made my Ph.D. work possible.My research work was supported by the Italian Government for the first 3 years andthen by SFINGI project.
Last, but not least, I would like to thank my family for their love and under-standing. More than ever, I would like to express my love to the most importantpersons in my life: my lovely wife, Tigist Seyum, and my wonderful child YegetaFikru.

Abstract
With the stunning success of the Internet, information and communication tech-nologies diffused increasingly attracting more uses to join the the Internet arsenalwhich in turn accelerates the traffic growth. This growth rate does not seem to slowdown in near future. Networking devices support these traffic growth by offering anever increasing transmission and switching speed, mostly due to the technologicaladvancement of microelectronics granted by Moore’s Law. However, the comparablegrowth rate of the Internet and electronic devices suggest that capacity of systemswill become a crucial factor in the years ahead.
Besides the growth rate challenge that electronic devices face with respect to traf-fic growth, networking devices have always been characterized by the developmentof proprietary architectures. This means that incompatible equipment and architec-tures, especially in terms of configuration and management procedures. The majordrawback of such industrial practice, however, is that the devices lack flexibility andprogrammability which is one of the source of ossification for today’s Internet.
Thus scaling or modifying networking devices, particularly routers, for a de-sired function requires a flexible and programmable devices. Software routers (SRs)based on personal computers (PCs) are among these devices that satisfy the flexi-bility and programmability criteria. Furthermore, the availability of large numberof open-source software for networking applications both for data as well as con-trol plane and the low cost PCs driven by PC-market economy scale make softwarerouters appealing alternative to expensive proprietary networking devices. That is,while software routers have the advantage of being flexible, programmable and lowcost, proprietary networking equipments are usually expensive, difficult to extend,program, or otherwise experiment with because they rely on specialized and closedhardware and software.
Despite their advantages, however, software routers are not without limitation.The objections to software routers include limited performance, scalability problemsand lack of advanced functionality. These limitations arose from the fact that a singleserver limited by PCI bus width and CPU is given a responsibility to process largeamount of packets. Offloading some packet processing tasks performed by the CPUto other processors, such as GPUs of the same PC or external CPUs, is a viableapproach to overcome some of these limitations.
In line with this, a distributed Multi-Stage Software Router (MSSR) architec-ture has been proposed in order to overcome both the performance and scalabilityissues of single PC based software routers. The architecture has three stages: i)a front-end layer-2 load balancers (LBs), open-software or open-hardware based,that act as interfaces to the external networks and distribute IP packets to ii) back-end personal computers (BEPCs), also named back-end routers in this thesis, that

provide IP routing functionality, and iii) an interconnection network, based on Eth-ernet switches, that connects the two stages. Performance scaling of the architectureis achieved by increasing the redundancy of the routing functionality stage wheremultiple servers are given a coordinated task of routing packets. The scalabilityproblem related to number of interfaces per PC is also tackled in MSSR by bundlingtwo or more PCs’ interfaces through a switch at the front-end stage. The overallarchitecture is controlled and managed by a control entity named Virtual ControlProcessor (virtualCP), which runs on a selected back-end router, through a DISTprotocol. This entity is also responsible to hide the internal details of the multistagesoftware router architecture such that the whole architecture appear to externalnetwork devices as a single device.
However, building a flexible and scalable high-performance MSSR architecturerequires large number of independently, but coordinately, running internal compo-nents. As the number of internal devices increase so does the architecture controland management complexity. In addition, redundant components to scale perfor-mance means power wastage at low loads. These challenges have to be addressedin making the multistage software router a functional and competent network de-vice. Consequently, the contribution of this thesis is to develop an MSSR centralizedmanagement system that deals with these challenges. The management system hastwo broadly classified sub-systems:
I) power management: a module responsible to address the energy inefficiency inmultistage software router architecture
II) unified information management: a module responsible to create a unified man-agement information base such that the distributed multistage router architec-ture appears as a single device to external network from management informa-tion perspective.
The distributed multistage router power management module tries to minimizethe energy consumption of the architecture by resizing the architecture to the trafficdemand. During low load periods only few components, especially that of routingfunctionality stage, are required to readily give a service. Thus it is wise to devicea mechanism that puts idle components to low power mode to save energy duringlow load periods. In this thesis an optimal and two heuristic algorithms, namelyon-line and off-line, are proposed to adapt the architecture to an input load demand.We demonstrate that the optimal algorithm, besides having scalability issue, is anoff-line approach that introduce service disruption and delay during the architecturereconfiguration period. In solving these issues, heuristic solutions are proposed andtheir performance is measured against the optimal solution. Results show that thealgorithms fairly approximate the optimal solution and use of these algorithms saveup to 57.44% of the total architecture energy consumption during low load periods.
The on-line algorithms are superior among the heuristic solutions as it has theadvantage of being less disruptive and has minimal service delay.
Furthermore, the thesis shows that the proposed algorithms will be more efficientif the architecture is designed keeping in mind energy as one of the design parameter.In achieving this goal three different approaches to design an MSSR architecture areproposed and their energy saving efficient is evaluated both with respect to theoptimal solution and other similar cluster design approaches.
The multistage software router is unique from a single device as it is composed ofindependently running components. This means that the MSSR management infor-mation is distributed in the architecture since individual components register theirown management information. It is said, however, that the MSSR internal deviceswork cooperatively to appear as a single network device to the external network.The MSSR architecture, as a single device, therefore requires its own managementinformation base which is built from the management information bases dispersedamong internal components. This thesis proposes a mechanism to collect and or-ganize this distributed management information and create a single managementinformation base representing the whole architecture. Accordingly existing SNMPmanagement communication model has been modified to fit to distributed multi-stage router architecture and a possible management architecture is proposed. Incompiling the management information, different schemes has been adopted to dealwith different SNMP management information variables. Scalability analysis showsthat proposed management system scales well and does not pose a threat to theoverall architecture scalability.

Contents
Page
Abstract IX
1 Introduction 11.1 Multistage software router architecture . . . . . . . . . . . . . . . . . 21.2 Open issues in multistage software router . . . . . . . . . . . . . . . . 61.3 Goal, research questions and approach . . . . . . . . . . . . . . . . . 71.4 Thesis outline . . . . . . . . . . . . . . . . . . . . . . . . . . . . . . . 9
2 State-of-the-art: Distributed software routers and management 112.1 Software routers . . . . . . . . . . . . . . . . . . . . . . . . . . . . . . 112.2 Power management in distributed architecture . . . . . . . . . . . . . 15
2.2.1 Energy efficient cluster design . . . . . . . . . . . . . . . . . . 182.3 Distributed information management system . . . . . . . . . . . . . . 192.4 Conclusion . . . . . . . . . . . . . . . . . . . . . . . . . . . . . . . . . 21
3 Multistage architecture energy management 233.1 Off-line algorithms . . . . . . . . . . . . . . . . . . . . . . . . . . . . 24
3.1.1 Problem definition and MILP formulation . . . . . . . . . . . 253.1.2 Two-step approach . . . . . . . . . . . . . . . . . . . . . . . . 273.1.3 Performance evaluation . . . . . . . . . . . . . . . . . . . . . . 30
3.2 On-line algorithm . . . . . . . . . . . . . . . . . . . . . . . . . . . . . 353.2.1 System modeling . . . . . . . . . . . . . . . . . . . . . . . . . 363.2.2 Proposed heuristic algorithm . . . . . . . . . . . . . . . . . . . 373.2.3 Computational complexity . . . . . . . . . . . . . . . . . . . . 423.2.4 Performance evaluation . . . . . . . . . . . . . . . . . . . . . . 44
3.3 Conclusions . . . . . . . . . . . . . . . . . . . . . . . . . . . . . . . . 56
4 Energy efficient multistage architecture design 574.1 Energy efficient back-end routers design . . . . . . . . . . . . . . . . . 58
4.1.1 Goal programming design approach . . . . . . . . . . . . . . . 58

4.1.2 Heuristic design approach . . . . . . . . . . . . . . . . . . . . 604.1.3 Locally optimal design approach . . . . . . . . . . . . . . . . . 61
4.2 Design validation . . . . . . . . . . . . . . . . . . . . . . . . . . . . . 624.2.1 Traffic traces . . . . . . . . . . . . . . . . . . . . . . . . . . . 624.2.2 Experimental setup . . . . . . . . . . . . . . . . . . . . . . . . 624.2.3 Results . . . . . . . . . . . . . . . . . . . . . . . . . . . . . . . 64
4.3 Conclusions . . . . . . . . . . . . . . . . . . . . . . . . . . . . . . . . 69
5 Multistage architecture network management 715.1 Problem description . . . . . . . . . . . . . . . . . . . . . . . . . . . . 715.2 Multistage architecture internal network management requirements . 735.3 Proposed management architecture . . . . . . . . . . . . . . . . . . . 74
5.3.1 Manager-agent communication model . . . . . . . . . . . . . . 765.3.2 multistage router MIB . . . . . . . . . . . . . . . . . . . . . . 785.3.3 Single-entity management information view: the case of ag-
gregate variables . . . . . . . . . . . . . . . . . . . . . . . . . 785.3.4 Scalability analysis . . . . . . . . . . . . . . . . . . . . . . . . 825.3.5 Software implementation . . . . . . . . . . . . . . . . . . . . . 84
5.4 Conclusions . . . . . . . . . . . . . . . . . . . . . . . . . . . . . . . . 84
6 Conclusions 856.1 Overall conclusions . . . . . . . . . . . . . . . . . . . . . . . . . . . . 856.2 Future research directions . . . . . . . . . . . . . . . . . . . . . . . . 87
Appendix A Splittable item with variable bin size and cost - mapping 89
Bibliography 91
List of Abbreviations 97
Index 99
List of Figures
1.1 Single PC software router performance . . . . . . . . . . . . . . . . . 3
1.2 Performance measurement of PacketShader . . . . . . . . . . . . . . . 4
1.3 MSSR Architecture: the load balancers (first stage), the switch (sec-ond stage) and the back-end routers (third stage) . . . . . . . . . . . 5
2.1 Router transfer rate comparison for different packet sizes . . . . . . . 12
2.2 Performance of FPGA-enhanced NICs with two-priority traffic . . . . 12
2.3 Server forwarding rate for minimal-forwarding application as a func-tion of different packet-size distribution . . . . . . . . . . . . . . . . . 13
2.4 High-level view of a traditional router and a server cluster-based router 15
2.5 Protocol-based network management interaction . . . . . . . . . . . . 20
3.1 Load proportional energy saving scheme in back-end routers . . . . . 32
3.2 Relative difference due to variability in router and link parameters . . 33
3.3 MSSR architecture power saving scheme block diagram . . . . . . . . 42
3.4 Input traffic trace used in the experiment . . . . . . . . . . . . . . . . 46
3.5 Comparison of different algorithms for unsplittable input traffic . . . 48
3.6 On-line algorithms relative difference with respect to optimal algorithm 49
3.7 Comparison of different algorithms for unsplittable input traffic . . . 50
3.8 Comparison of different algorithms for unsplittable input traffic . . . 51
3.9 Configuration difference between two consecutive solutions (unsplit-table traffic) . . . . . . . . . . . . . . . . . . . . . . . . . . . . . . . . 52
3.10 Comparison of different algorithms for splittable input traffic . . . . . 53
3.11 Comparison of different algorithms for splittable input traffic . . . . . 54
3.12 Configuration difference between two consecutive solution . . . . . . . 55
3.13 Comparison of on-line algorithms based on NIC+ and NIC− efficiencysorting . . . . . . . . . . . . . . . . . . . . . . . . . . . . . . . . . . . 55
4.1 Input traffic trace used in the experiment . . . . . . . . . . . . . . . . 62
4.2 Power dissipation of back-end PCs defined by different design ap-proaches (based on 60min traffic sampling) . . . . . . . . . . . . . . . 65

4.3 Energy consumption of back-end PCs defined by different design ap-proaches (based on 60min traffic sampling) . . . . . . . . . . . . . . . 66
4.4 Cluster cost for different design approaches . . . . . . . . . . . . . . . 674.5 Energy consumption: Design-I, Design-II, Design-III, Design-IV, and
Design-V,I3 (based on 15min and 60min traffic sampling) . . . . . . . 684.6 Design and sampling mismatch effect . . . . . . . . . . . . . . . . . . 69
5.1 Management System used in multistage Software Router: logical ar-chitecture . . . . . . . . . . . . . . . . . . . . . . . . . . . . . . . . . 75
5.2 Modified manager-agent communication model for the multistage soft-ware router . . . . . . . . . . . . . . . . . . . . . . . . . . . . . . . . 77
5.3 Main IF and IP counters involved in packet forwarding for a single-stage router (right) and the multistage software router (left) . . . . . 80

List of Tables
3.1 Maximum size of the MILPs in terms of number of routers and inter-faces to obtain a solution in reasonable time . . . . . . . . . . . . . . 28
3.2 Cr scenario description . . . . . . . . . . . . . . . . . . . . . . . . . . 333.3 Simulation parameters for on-line algorithm performance evaluation . 45
4.1 Group of PCs and corresponding parameters used in the back-endrouter cluster design . . . . . . . . . . . . . . . . . . . . . . . . . . . 63

Chapter 1
Introduction
The Internet traffic is growing at faster rate as more and more bandwidth hungryapplications and services such as audio and video streaming are deployed. Theproliferation of tablets, mobile phones, and other smart devices are driving up thedemand for connectivity as well. In addition, with the stunning success of the In-ternet, information and communication technologies diffused increasingly attractingmore uses to join the the Internet arsenal which in turn accelerates the traffic growth.This growth rate does not seem to slow down in near future [1, 2].
Networking devices support these traffic growth by offering an ever increasingtransmission and switching speed, mostly due to the technological advancement ofmicroelectronics granted by Moore’s Law [3]. However, the comparable growth rateof the Internet and electronic devices suggest that capacity of systems will becomea crucial factor in the years ahead. Given the current trend of increase in systemcapacity and traffic growth, the former will lag by a factor of 10 over the same timeperiod [4].
Besides the growth rate challenge that networking devices face with respect totraffic growth, they have always been characterized by the development of propri-etary architectures. This means that incompatible equipments and architectures,especially in terms of configuration and management procedures. The major draw-back of such industrial practice, however, is that the devices lack flexibility andprogrammability which is one of the source of ossification in the Internet [5]. Forinstance networking devices, more importantly those deployed at the core of the In-ternet, shows such inflexibility that deploying simple changes to a network to adaptto a traffic demand incurs huge cost due to required upgrade or even equipment re-placement. Fixing problems and introducing new features is almost difficult becauseof unavailability of devices’ software source codes.
Thus scaling or modifying networking devices, particularly routers, for a desired
1
1 – Introduction
function requires flexible and programmable devices. Software routers (SRs) 1 areamong the devices that satisfy the flexibility and programmability criteria. Becauseof the aforementioned challenges related to real hardware routers, the technique ofmodifying PCs and using them as a router is an appealing alternative. Modificationsto a PC include but not limited to attaching two or more network interface cards(NICs) that connect different networks, upgrading the current hardware to improveperformance, installing networking applications, etc.
The flexibility and programmability feature of software router comes from thefact that the hardware is available from multi-vendor at low cost and the largeavailability of open-source software for networking application, such as Linux [6]and Click Modular Router [7] for the data plane, as well as eXtensible Open RouterPlatform (XORP) [8] and Quagga [9] for control plan. However software routers arenot without limitation. Most criticisms to single PC based software routers includelimited performance such as routing capability, lack of scalability such as number ofinterface and lack of advanced functionalities.
In the following a multistage software router architecture, proposed to addresssingle PC based software router limitations, will be introduced (Section 1.1), andthen we point out what is considered the main open issues in multistage architecture(Section 1.2). The analysis of such open issues leads to present the goal and theresearch questions addressed in this thesis (Section 1.3). Finally, the outline of thisthesis is presented (Section 1.4).
1.1 Multistage software router architecture
High-end performance can not be obtained easily today with routers based on asingle PC architecture. State-of-the-art PC based routers and switches have apotential for switching up to few Gbps if the packet processing is performed bythe CPU [10–12] or few tens of Gbps if a specialized packet processing is imple-mented [13]. While such capacity is more than enough for a large number of appli-cations, by no means comparable to carrier-grade equipments that scales as high as92 Tbps [14].
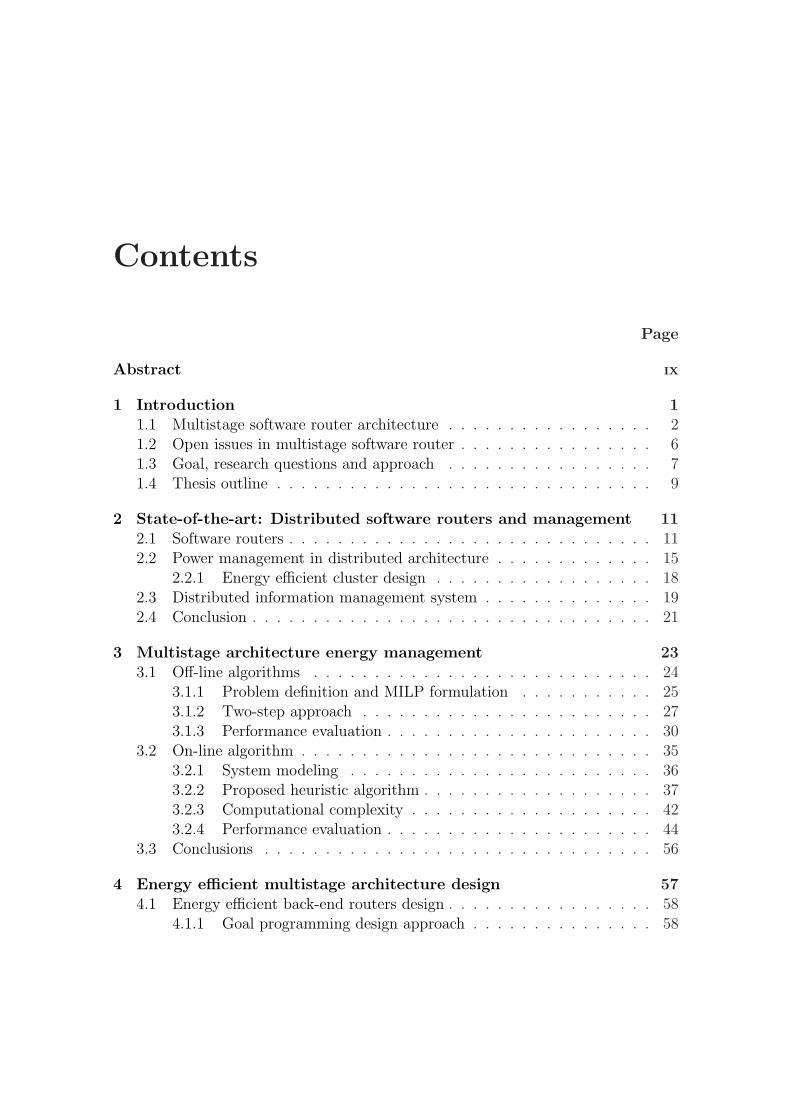
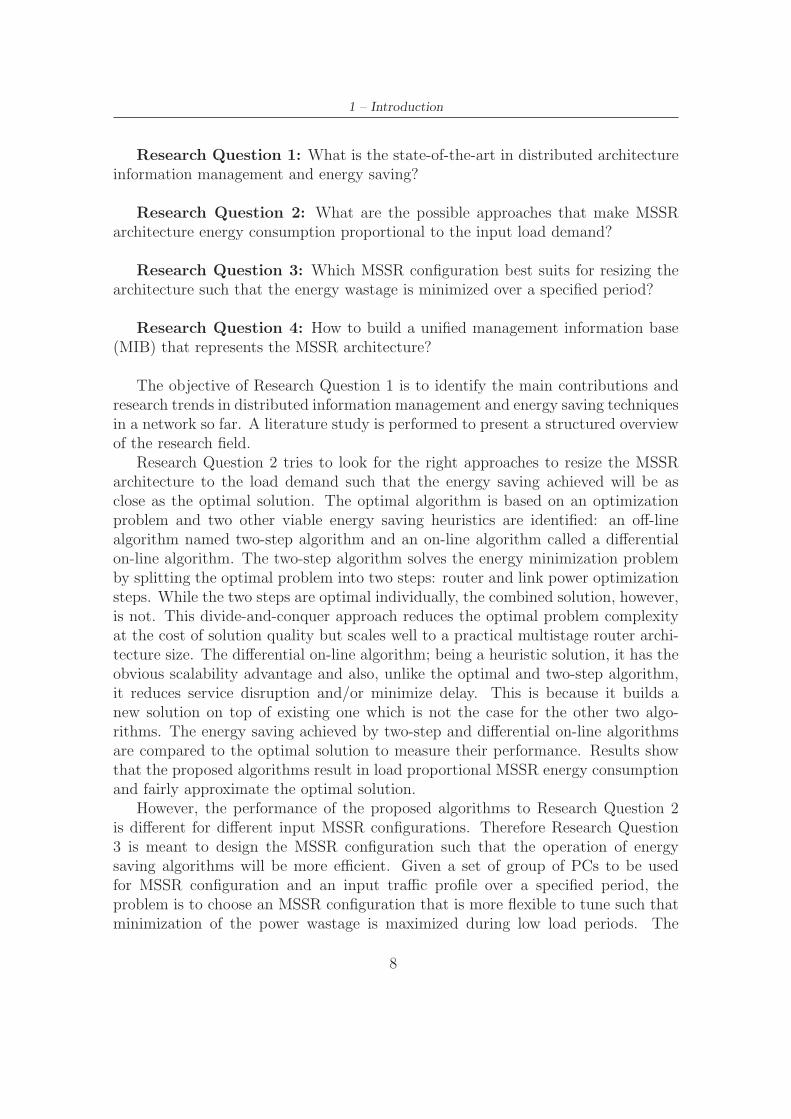
The scalability and performance limitation of single PC based software routersarose from the fact that PCs are limited by Peripheral Component Interconnect(PCI) bus and processing capacity as shown in Figure 1.1. Figure 1.1(a) showsthroughput for single PC software router having the following specification: PCI -X Intel PRO/1000 Gigabit Ethernet line cards, a single Intel Xeon CPU running at2.6 GHz, equipped with 1 Gigabyte 128-bit wide, 200 MHz double data rate (DDR)RAM, and PCI-X bus running at 133 MHz, that is, with 8 Gbps bandwidth as
1Software router is a term denoting a personal computer, equipped with two or more networkcards, designated to do the task of routing packets between networks.
2

1.1 – Multistage software router architecture
(a) thoughput (b) saturation forwarding rate
Figure 1.1. Single PC software router performance
the baseline system [10, 15]. The plot clearly depicts the impact of packet size onperformance, showing that a single PC can only reach about 640 kpps (kilo packetper second), considering the minimum-size Ethernet frames. For smaller Ethernetframes the bottleneck stem from the maximum packet rate that the PC architecturecan forward because of CPU availability and memory-read-latency constraint.
On the other hand, Figure 1.1(b) shows the source of the bottleneck as the packetsize increases. This time the number of interfaces increase to eight 1 Gigabyte cardsto evaluate the routers performance under multiple flows simultaneously crossing therouter. The maximum throughput is limited to about 4 Gbps, which correspondsto the PCI bus bandwidth that must be crossed twice by each packet to be storedinto the RAM, processed, and then transmitted [10,15].
It is possible that the maximum throughput a single PC can sustain is furtherreduced if more complex operations that increase per-packet processing time mustbe performed by the CPU; for example, imposing access control list (ACL) rules,network address translation (NAT) operations, and so on.
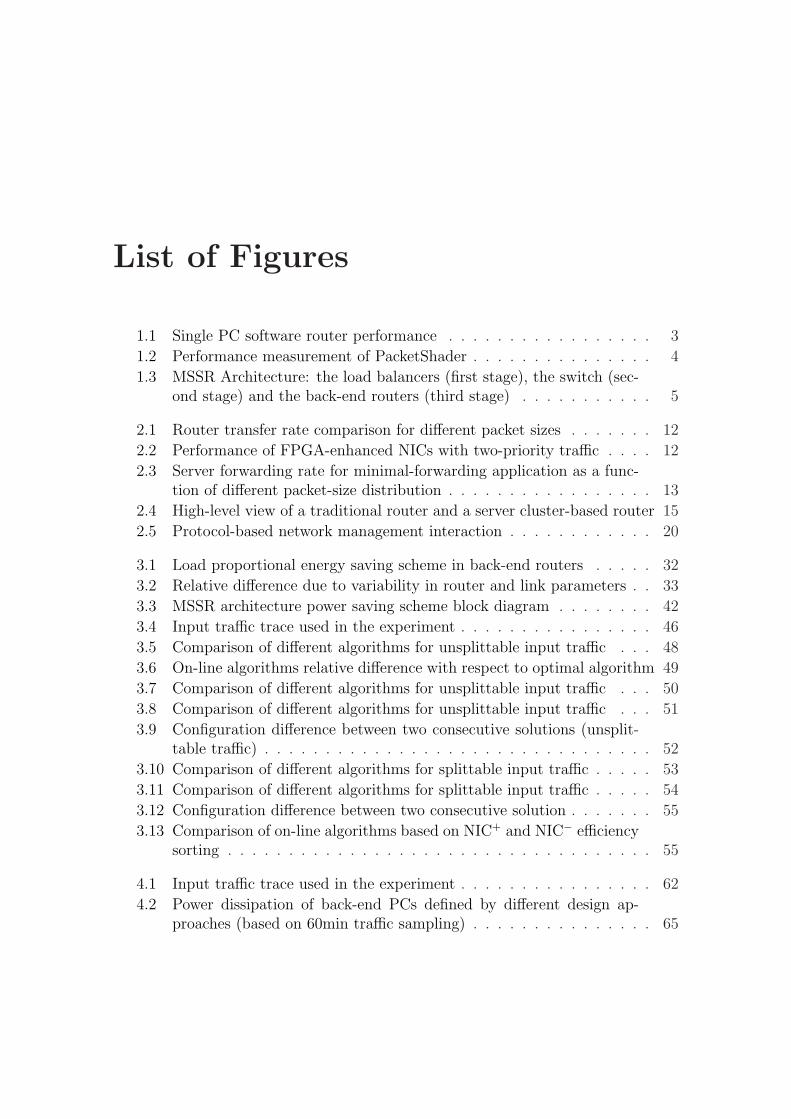
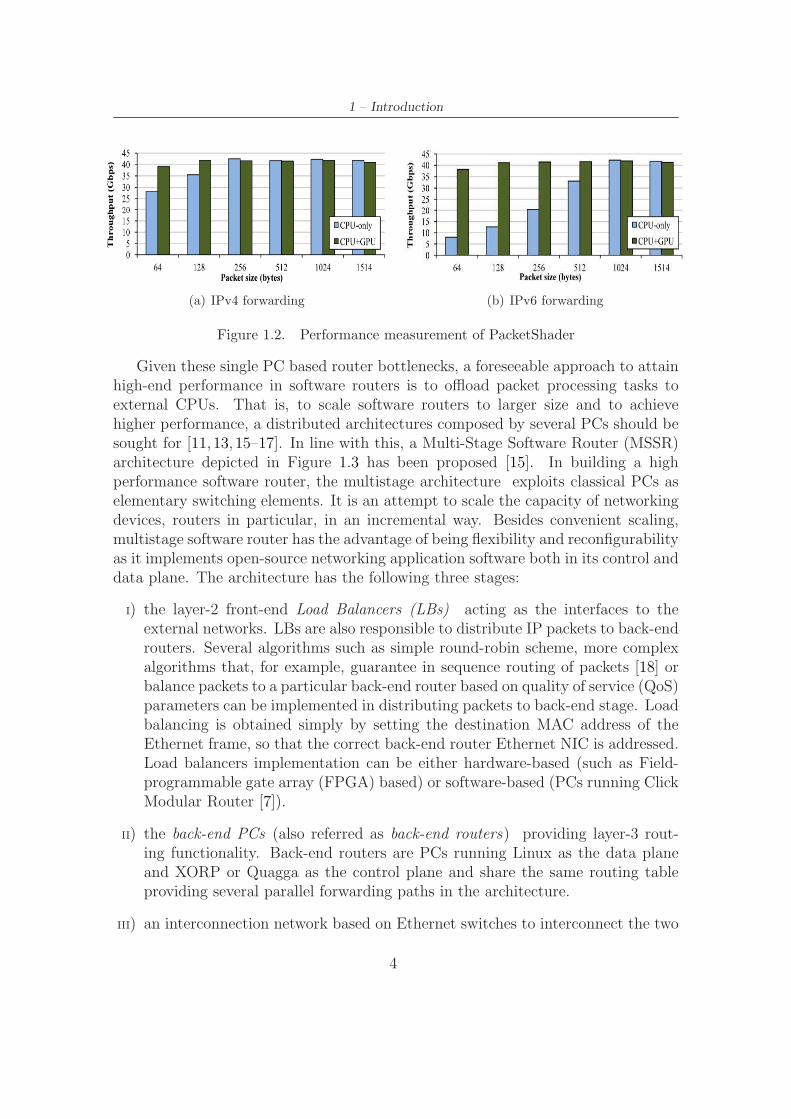
Optimizing Linux network stack to eliminate per-packet memory managementoverhead and to process packets in batch and/or offloading core packet processingoperations (such as IP table lookup or IPsec encryption) to Graphics ProcessingUnits (GPUs) enhances software routers performance by many folds as shown inFigure 1.2. The platform is called PacketShader [13]. Figures 1.2(a) and 1.2(b)show IP packet forwarding performance of PacketShader for all packet sizes. TheCPU+GPU mode reaches close to the maximum throughput of 40 Gbps. While thisrequires modification in kernel source codes, it demonstrates that software routershave capacity to route few tens of Gbps. Despite this progress, however, softwarerouters based on single PC still lag behind their specialized hardware based routerscounterpart.
3
1 – Introduction
(a) IPv4 forwarding (b) IPv6 forwarding
Figure 1.2. Performance measurement of PacketShader
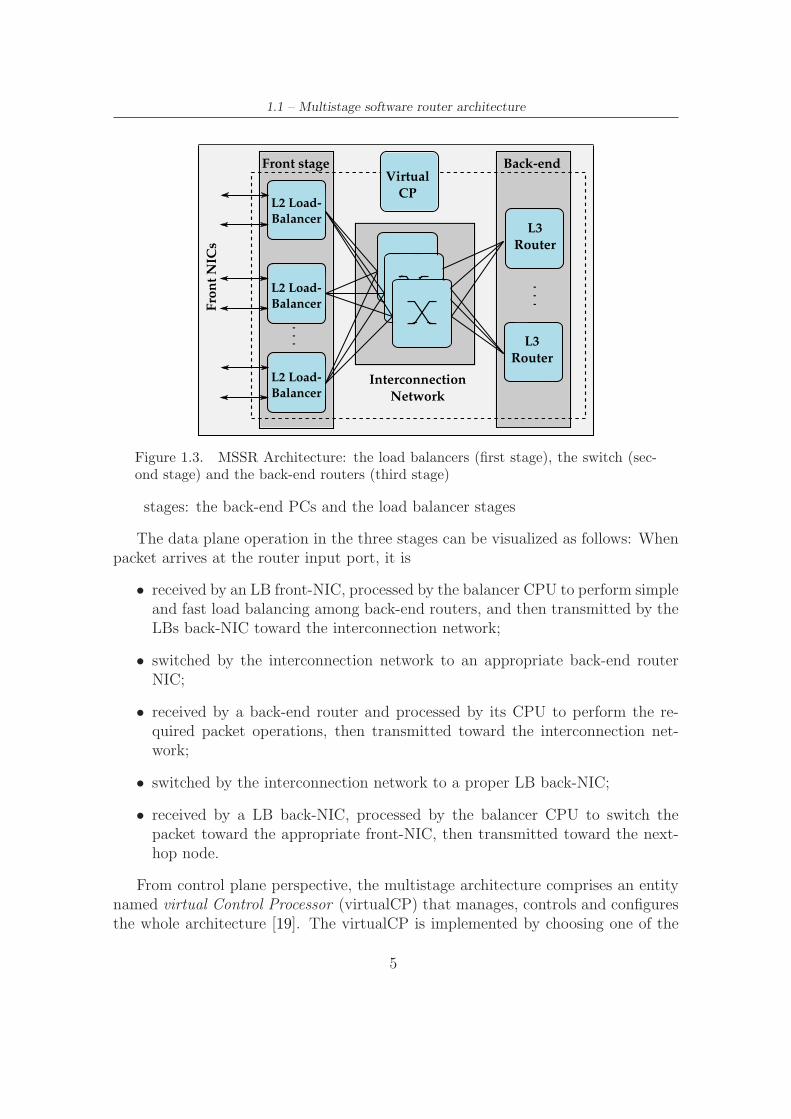
Given these single PC based router bottlenecks, a foreseeable approach to attainhigh-end performance in software routers is to offload packet processing tasks toexternal CPUs. That is, to scale software routers to larger size and to achievehigher performance, a distributed architectures composed by several PCs should besought for [11, 13, 15–17]. In line with this, a Multi-Stage Software Router (MSSR)architecture depicted in Figure 1.3 has been proposed [15]. In building a highperformance software router, the multistage architecture exploits classical PCs aselementary switching elements. It is an attempt to scale the capacity of networkingdevices, routers in particular, in an incremental way. Besides convenient scaling,multistage software router has the advantage of being flexibility and reconfigurabilityas it implements open-source networking application software both in its control anddata plane. The architecture has the following three stages:
I) the layer-2 front-end Load Balancers (LBs) acting as the interfaces to theexternal networks. LBs are also responsible to distribute IP packets to back-endrouters. Several algorithms such as simple round-robin scheme, more complexalgorithms that, for example, guarantee in sequence routing of packets [18] orbalance packets to a particular back-end router based on quality of service (QoS)parameters can be implemented in distributing packets to back-end stage. Loadbalancing is obtained simply by setting the destination MAC address of theEthernet frame, so that the correct back-end router Ethernet NIC is addressed.Load balancers implementation can be either hardware-based (such as Field-programmable gate array (FPGA) based) or software-based (PCs running ClickModular Router [7]).
II) the back-end PCs (also referred as back-end routers) providing layer-3 rout-ing functionality. Back-end routers are PCs running Linux as the data planeand XORP or Quagga as the control plane and share the same routing tableproviding several parallel forwarding paths in the architecture.
III) an interconnection network based on Ethernet switches to interconnect the two
4
1.1 – Multistage software router architecture
.
.
.
.
.
.
L3
Router
L3
Router
L2 Load-
Balancer
L2 Load-
Balancer
L2 Load-
BalancerFront NIC
s
Virtual
CP
Back-endFront stage
Interconnection
Network
Figure 1.3. MSSR Architecture: the load balancers (first stage), the switch (sec-ond stage) and the back-end routers (third stage)
stages: the back-end PCs and the load balancer stages
The data plane operation in the three stages can be visualized as follows: Whenpacket arrives at the router input port, it is
• received by an LB front-NIC, processed by the balancer CPU to perform simpleand fast load balancing among back-end routers, and then transmitted by theLBs back-NIC toward the interconnection network;
• switched by the interconnection network to an appropriate back-end routerNIC;
• received by a back-end router and processed by its CPU to perform the re-quired packet operations, then transmitted toward the interconnection net-work;
• switched by the interconnection network to a proper LB back-NIC;
• received by a LB back-NIC, processed by the balancer CPU to switch thepacket toward the appropriate front-NIC, then transmitted toward the next-hop node.
From control plane perspective, the multistage architecture comprises an entitynamed virtual Control Processor (virtualCP) that manages, controls and configuresthe whole architecture [19]. The virtualCP is implemented by choosing one of the
5
1 – Introduction
back-end routers as a master node and this node runs all the routing protocols. LBsredirect all the routing protocol traffic to this master node. An internal controlprotocol named DIST, that cooperates strictly with the routing software, has beendeveloped to:
(I) coordinate the routing process among back-end routers and the load balancingfunction among LBs;
(II) configure the architecture; and
(III) provide automatic fault recovery mechanisms.
The virtualCP is also responsible to present the MSSR architecture to the externalnetwork as a single, large router by hiding the internal architectural detail.
At the cost of control and management complexity, the multistage software routerarchitecture is able to:
• overcome the performance limitation of single PC based routers by offeringmultiple, parallel forwarding paths;
• scale the total number of interfaces an MSSR can host, and as a consequence,the router capacity;
• improve router performance by incrementally adding/upgrading internal ele-ments seamlessly;
• recover from faults through automatic reconfiguration of the internal elements;
• provide functional distribution, to overcome single PC CPU limitations, forexample, allowing the offloading of CPU intensive tasks such as filtering/cryp-tography to dedicated PC
Note that routing capacity and number of interfaces scaling simply involves increas-ing the number and/or capacity of the back-end routers and the front stage PCsrespectively. The interconnecting switch can also be duplicated for capacity scalingor if redundancy is required.
1.2 Open issues in multistage software router
Like many networking devices, the MSSR is typically designed for the peak load.Therefore, a high-end MSSR architecture might require tens or hundreds of PCs.Let’s demonstrate this through a practical example. Suppose we want to design aMSSR equivalent to a Juniper T320 core router that supports up to sixteen 10 Gbpsports and has 160 Gbps forwarding capacity [20]. The following internal componentsare available:
6
1.3 – Goal, research questions and approach
• back-end routers with 5.5 Gbps forwarding capacity and equipped with single10 Gbps interface;
• LBs with two (one internal and one external) 10 Gbps interface;
• a hardware switch with enough capacity to interconnect LBs and routers.
As per this specification, we need 16 LBs, 1 switch and 29 back-end routers to de-sign a 160 Gbps capable MSSR equivalent to T320 router. That is the architecturerequires a total of 45 PCs and 1 network switch. It is easy to see that this num-ber increases with performance. As the number of internal devices increase, themultistage software router architecture faces two challenges.
First, control and management complexity increases with the number of internaldevices. The virtualCP has to communicate to each device to infer their operationstatus, update them with control messages, detect any abnormalities and take mea-sure, etc. Furthermore, individual internal devices register their own managementinformation system. Thus, the virtualCP has to collect this information and builda management information system that represents the whole architecture. All thesetasks create complexity in controlling and managing the architecture. This com-plexity problem has partially been solved from the control plane perspective [19].
Second, performance scaling implies a high level of redundancy at the back-endstage which translates into a source of energy wastage during low traffic periods.Thus, at low load MSSR architecture is not efficient from energy cost perspective.For example the T320 equivalent MSSR has 20 back-end routers but only few ofthem are needed at low loads. From high load perspective, energy consumptioncould threaten the scalability feature of the MSSR architecture. That is as moreand more performance is needed, it might not be realistic to increase the number ofinternal devices from energy consumption perspective.
Dealing with some of these challenges that the multistage architecture faces isthe task of this thesis as detailed in the following subsection.
1.3 Goal, research questions and approach
In light of the reasoning so far, the goal of this thesis is to develop a centralizedMSSR management system that (i) collects and compiles a unified management in-formation system, and (ii) resize the MSSR architecture to the input traffic in anefficient way such that the power wastage is minimized during low load periods. Inachieving this goal, an answer for the following research questions will be sought-after:
7
1 – Introduction
Research Question 1: What is the state-of-the-art in distributed architectureinformation management and energy saving?
Research Question 2: What are the possible approaches that make MSSRarchitecture energy consumption proportional to the input load demand?
Research Question 3: Which MSSR configuration best suits for resizing thearchitecture such that the energy wastage is minimized over a specified period?
Research Question 4: How to build a unified management information base(MIB) that represents the MSSR architecture?
The objective of Research Question 1 is to identify the main contributions andresearch trends in distributed information management and energy saving techniquesin a network so far. A literature study is performed to present a structured overviewof the research field.
Research Question 2 tries to look for the right approaches to resize the MSSRarchitecture to the load demand such that the energy saving achieved will be asclose as the optimal solution. The optimal algorithm is based on an optimizationproblem and two other viable energy saving heuristics are identified: an off-linealgorithm named two-step algorithm and an on-line algorithm called a differentialon-line algorithm. The two-step algorithm solves the energy minimization problemby splitting the optimal problem into two steps: router and link power optimizationsteps. While the two steps are optimal individually, the combined solution, however,is not. This divide-and-conquer approach reduces the optimal problem complexityat the cost of solution quality but scales well to a practical multistage router archi-tecture size. The differential on-line algorithm; being a heuristic solution, it has theobvious scalability advantage and also, unlike the optimal and two-step algorithm,it reduces service disruption and/or minimize delay. This is because it builds anew solution on top of existing one which is not the case for the other two algo-rithms. The energy saving achieved by two-step and differential on-line algorithmsare compared to the optimal solution to measure their performance. Results showthat the proposed algorithms result in load proportional MSSR energy consumptionand fairly approximate the optimal solution.
However, the performance of the proposed algorithms to Research Question 2is different for different input MSSR configurations. Therefore Research Question3 is meant to design the MSSR configuration such that the operation of energysaving algorithms will be more efficient. Given a set of group of PCs to be usedfor MSSR configuration and an input traffic profile over a specified period, theproblem is to choose an MSSR configuration that is more flexible to tune such thatminimization of the power wastage is maximized during low load periods. The
8
1.4 – Thesis outline
energy saving is computed over the input traffic sampling periods. We proposethree MSSR design approaches; namely goal programming, performance-power ratioheuristic and locally optimal design approaches. The proposed design approachesenergy efficiency is then compared with other existing cluster design approaches andthe optimal solution. It is shown that our design approaches permit up to 10% ofenergy saving compared to existing design approaches for similar MSSR architecturecost.
Finally Research Question 4 deals with distributed management informationgathering and compilation mechanisms. As stated earlier the multistage is com-posed of large number of autonomous systems that individually register their ownmanagement information. As a single device, however, the MSSR requires a man-agement information base that represents the whole architecture. This informationbase is built from internally dispersed management information bases located ineach internal component which requires collection and compilation. This researchquestion, therefore, seeks a mechanism to build a unified management system suchthat the architecture appear as a single device from management perspective. Inthe thesis, after identifying MSSR internal network management requirements, anSNMP manager-agent communication model is extended to fit the multistage archi-tecture. The model defines mechanisms to collect data from distributed elements ina reliable way and aggregate the data to a unified view.
1.4 Thesis outline
The thesis structure closely follows the Research Questions. It is organized as fol-lows:
• Chapter 2: State-of-the-art: Distributed software routers and man-agement presents a structured overview of the main contributions so far inthe field of distributed architecture management. It divides the literature sur-vey into three main categories: software routers, energy saving in networksand distributed information management.
• Chapter 3: Multistage architecture energy management presents thedifferent energy saving algorithms. Performance comparison is supported bysimulation results [21,22]. Chapter 4: Energy efficient multistage archi-tecture design, which closely related to energy saving algorithms, focuses ondesigning an energy efficient MSSR architecture [23].
• Chapter 5: Multistage architecture network management investigateshow to create a unified management information base that represents the wholearchitecture from internally dispersed management information bases local toeach internal devices [24].
9

1 – Introduction
• Chapter 6: Conclusions finally closes the thesis by drawing conclusions andidentifying directions for future work.
10

Chapter 2
State-of-the-art: Distributedsoftware routers and management
As described in Section 1.1 a multistage software router is a distributed architecturethat is composed of many internal components. The large number of autonomouslyrunning devices could translate into energy consumption and management informa-tion is distributed among internal components. This requires additional effort tomake the architecture energy efficient and a mechanism to manage the distributedinformation system.
In the following, different efforts made by the research community to addressthe issue of energy consumption in a network as well as management of distributedinformation in similar architecture to multistage will be presented. Software routerrelated research activities so far will be detailed in Section 2.1. Section 2.2 focuseson main contributions in power management in distributed architecture while Sec-tion 2.3 presents different schemes used to manage distributed information systems.
2.1 Software routers
Over the years, viability of software routers as an alternative to expensive andproprietary networking devices have been studied extensively. Different researchersalso tried to solve the scalability and performance related issue to software routersto make them practical to deploy in large networks.
Andrea et al. [10, 25] assessed the feasibility of building a high-performance IProuter out of a common PC hardware and open source operating system. Fig. 2.1shows the saturation transfer rate for Linux and Click, when the routers are crossedby four traffic flows, either unidirectional (UNI) or bidirectional (BI) for differentEthernet payload sizes. The results are based on a high-end PC with a Super-MicroX5DPE-G2 mainboard equipped with one 2.8 GHz Intel Xeon processor and 1 Gbyte
11

2 – State-of-the-art: Distributed software routers and management
Figure 2.1. Router transfer rate comparison for different packet sizes
of PC2100 DDR RAM consisting of two interleaved banks, so as to bring the memorybus transfer rate to 4.2 Gbyte/s. Eight 1 Gbps Intel PRO 1000 NICs are installedon the router to generate the required number of flows. The result shows that thesoftware router can transfer up to 500 Mbps when handling minimum size packetsand up to 5.5 Gbps when handling 1518 byte packets. For minimum-size Ethernetframe, it is not possible to route a single 1 Gbps traffic flow even if the PCI busbandwidth is 8 Gbps. The main limitation stem from central processing unit (CPU)overloading and from large host-memory-read latency.
A similar work has been presented in [26, 27] but this time the authors usedFPGA-enhanced NICs to offload the CPU from performing IP routing and directlytransfer packets across the PCI bus, completely bypassing the standard Linux IPstack. Thus the NIC operation is in fast-path routing mode. Packet transfers on thePCI-bus are regulated by a distributed (asynchronous) scheduling algorithm basedupon in-band messages exchange among the FPGA-enhanced NICs. This approach
Figure 2.2. Performance of FPGA-enhanced NICs with two-priority traffic
12
2.1 – Software routers
Figure 2.3. Server forwarding rate for minimal-forwarding application as a func-tion of different packet-size distribution
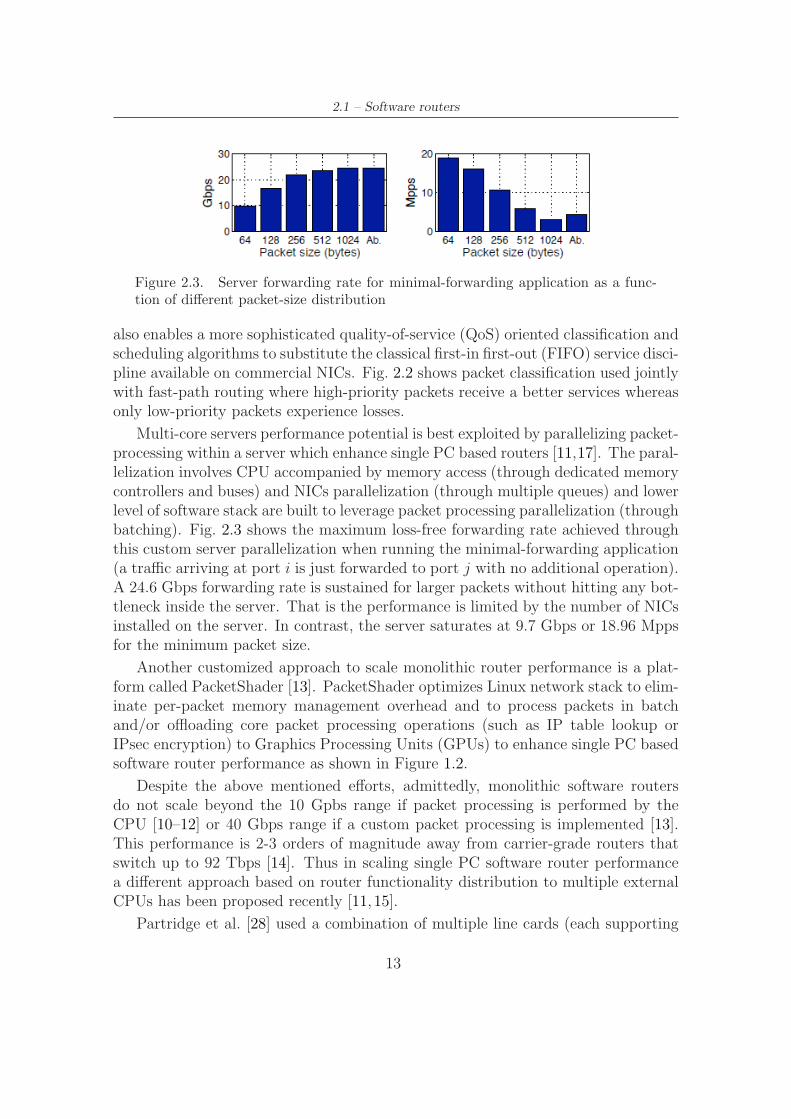
also enables a more sophisticated quality-of-service (QoS) oriented classification andscheduling algorithms to substitute the classical first-in first-out (FIFO) service disci-pline available on commercial NICs. Fig. 2.2 shows packet classification used jointlywith fast-path routing where high-priority packets receive a better services whereasonly low-priority packets experience losses.
Multi-core servers performance potential is best exploited by parallelizing packet-processing within a server which enhance single PC based routers [11,17]. The paral-lelization involves CPU accompanied by memory access (through dedicated memorycontrollers and buses) and NICs parallelization (through multiple queues) and lowerlevel of software stack are built to leverage packet processing parallelization (throughbatching). Fig. 2.3 shows the maximum loss-free forwarding rate achieved throughthis custom server parallelization when running the minimal-forwarding application(a traffic arriving at port i is just forwarded to port j with no additional operation).A 24.6 Gbps forwarding rate is sustained for larger packets without hitting any bot-tleneck inside the server. That is the performance is limited by the number of NICsinstalled on the server. In contrast, the server saturates at 9.7 Gbps or 18.96 Mppsfor the minimum packet size.
Another customized approach to scale monolithic router performance is a plat-form called PacketShader [13]. PacketShader optimizes Linux network stack to elim-inate per-packet memory management overhead and to process packets in batchand/or offloading core packet processing operations (such as IP table lookup orIPsec encryption) to Graphics Processing Units (GPUs) to enhance single PC basedsoftware router performance as shown in Figure 1.2.
Despite the above mentioned efforts, admittedly, monolithic software routersdo not scale beyond the 10 Gpbs range if packet processing is performed by theCPU [10–12] or 40 Gbps range if a custom packet processing is implemented [13].This performance is 2-3 orders of magnitude away from carrier-grade routers thatswitch up to 92 Tbps [14]. Thus in scaling single PC software router performancea different approach based on router functionality distribution to multiple externalCPUs has been proposed recently [11, 15].
Partridge et al. [28] used a combination of multiple line cards (each supporting
13

2 – State-of-the-art: Distributed software routers and management
one or more network interfaces) and forwarding engine cards all plugged into aswitched backplane to build a 50 Gbps software router in a custom configuration. Itwas the first multigigabit router using conventional CPUs that demonstrate routerscan continue to serve as a key component in high-speed networks.
Recently Bianco et al. proposed one of the possible distributed software routerarchitecture introduced in Section 1.1 that distribute router functionality into mul-tiple off-the-shelf commodity PCs [15, 16]. The architecture is named multistagesoftware router for the reason that the architecture is composed of three stages:Load balancers, interconnection network and back-end routers (See Section 1.1 fordetail). The authors demonstrate that the performance of a multistage softwarerouter formed by N1 load balancers, each equipped with at least three back-endNICs, and N2 back-end routers scales as:
Pmin = min(N1 × 1488,N2 × 640)kpps (2.1)
considering a minimum sized packet. The theoretical maximum of 1488 kpps and thesingle router forwarding limit of 640 kpps when IP routing is adopted are reportedin Fig. 1.1(a).
Due to the need of high number of ports and performance, the number of PCsin a multistage architecture could be large. Thus, many internal devices need tobe controlled and configured. In addition, the internal interconnection must appearto external network as a single entity which again requires a special coordination.In addressing this issue Bianco et al. [19] proposed a control protocol named DISTthat directly interact with software routing suites such as Quagga and XORP to beoperating system independent. The protocol is responsible to:
(I) coordinate the routing process among back-end routers and the load balancingfunction among LBs;
(II) configure the architecture; and
(III) provide automatic fault recovery mechanisms.
The multistage software router has also been extended to virtualized environ-ment [29] in looking for increased flexibility (scalability, maintenance and consolida-tion) and easier introduction of new features such as energy saving mechanism. Theauthors measured the performance of multistage software router and demonstratedits feasibility in a virtualized environment.
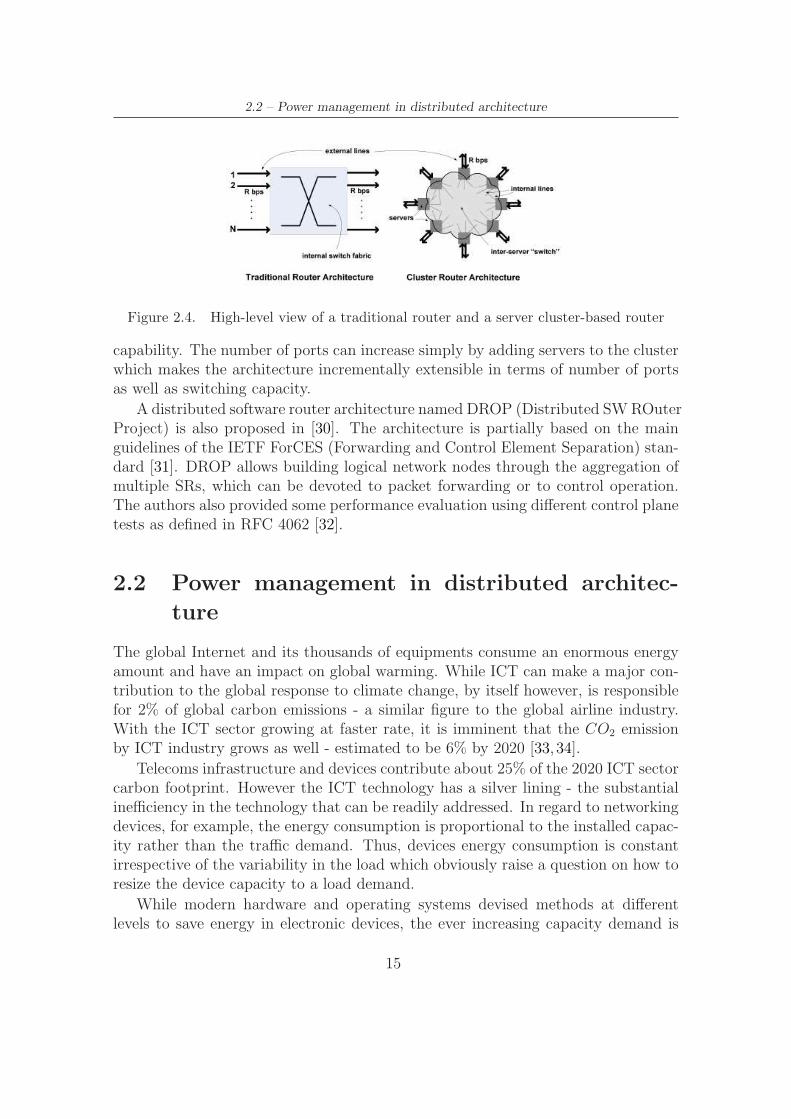
RouteBricks [11,17] is based on parallelizing router functionality across multipleservers and within each server. Fig. 2.4 depicts a high-level view of a traditionalrouter and RouteBricks architecture. In the architecture there is no centralizedcomponents and no component in the architecture need to operate at a rate greaterthan cR, where c ranges typically from 2 to 3 and R is the servers’ packet processing
14
2.2 – Power management in distributed architecture
Figure 2.4. High-level view of a traditional router and a server cluster-based router
capability. The number of ports can increase simply by adding servers to the clusterwhich makes the architecture incrementally extensible in terms of number of portsas well as switching capacity.
A distributed software router architecture named DROP (Distributed SWROuterProject) is also proposed in [30]. The architecture is partially based on the mainguidelines of the IETF ForCES (Forwarding and Control Element Separation) stan-dard [31]. DROP allows building logical network nodes through the aggregation ofmultiple SRs, which can be devoted to packet forwarding or to control operation.The authors also provided some performance evaluation using different control planetests as defined in RFC 4062 [32].
2.2 Power management in distributed architec-
ture
The global Internet and its thousands of equipments consume an enormous energyamount and have an impact on global warming. While ICT can make a major con-tribution to the global response to climate change, by itself however, is responsiblefor 2% of global carbon emissions - a similar figure to the global airline industry.With the ICT sector growing at faster rate, it is imminent that the CO2 emissionby ICT industry grows as well - estimated to be 6% by 2020 [33,34].
Telecoms infrastructure and devices contribute about 25% of the 2020 ICT sectorcarbon footprint. However the ICT technology has a silver lining - the substantialinefficiency in the technology that can be readily addressed. In regard to networkingdevices, for example, the energy consumption is proportional to the installed capac-ity rather than the traffic demand. Thus, devices energy consumption is constantirrespective of the variability in the load which obviously raise a question on how toresize the device capacity to a load demand.
While modern hardware and operating systems devised methods at differentlevels to save energy in electronic devices, the ever increasing capacity demand is
15
2 – State-of-the-art: Distributed software routers and management
generating an increase in power consumption both at device and network level. Forinstance, while desktop computers produced in 2003 consume roughly 100-120 Wwhen used moderately, the same is also true for today’s desktops [35]. On theinfrastructure side, the power dissipation of routers has grown with a 1.4 timesincrease in power dissipation for every doubling of capacity [36]. Therefore a commonopinion among network researchers is that the sole introduction of low consumptionsilicon technologies may not be enough to curb energy requirements, thus the focusis shifting towards different areas. For instance, there is an ample opportunity ofsaving energy by controlling the devices as well as network topology during lowtraffic periods, considering that the networks are typically oversized [37].
Therefore, beginning with a position paper by Gupta et al. [38], researchers in ITfocused on how to save energy in data network holistically. In this section we discussstate-of-the-art energy saving techniques in a distributed architecture, particularlyclusters similar to the multistage software router architecture.
In line with this, Chase et al. [39] proposed an energy-conscious request switchingparadigm to reduce energy usage for server cluster during low traffic periods. Theswitch monitors cluster load and concentrates traffic on the minimal set of serversthat can serve it at a specified utilization and latency. This induces the remainingidle servers to step down to a low-power state. The proposal basically extends theload-balancing switches with an energy-conscious routing policy that leverages thepower management features of the back-end servers.
A similar approach is proposed by Pinheiro E. et al. [40]. In this case a systemthat dynamically turns cluster nodes on to be able to handle increase in load andoff to save energy during low load periods is proposed. A control-theoretic and loaddistribution algorithm makes the cluster reconfiguration decision by considering thecluster total load and the power and performance implication of changing the currentconfiguration. The technique saves up to 38% in energy.
Power-aware request distribution [41] is a method of scheduling service requestsamong servers in a cluster so that energy consumption is minimized, while main-taining a particular level of performance. Energy efficiency is obtained by poweringdown some servers when the desired quality of service can be met with fewer servers.
The schemes in [39–41] allow energy saving only at the coarse-granularity of theentire server and/or only homogeneous servers are considered. In multistage archi-tecture however, besides the back-end routers are heterogeneous in capacity as wellas power consumption, they could have one or more network cards adding anotherlayer to an optimization problem. Indeed, the minimization of active internal NICsand/or interfaces on NICs can lead to large energy saving especially in high ratednetwork cards. For instance a 10 Gbps link consumes in the order of 20 watts [42]. Ifwe install four of such NIC per PC, then the consumption is proportional to the PCitself. Therefore the wastage in the network cards needs to be addressed. Moreover,the heterogeneity requires a mechanism to prioritize the back-end routers according
16

2.2 – Power management in distributed architecture
to their energy efficiency.In reducing the granularity, Heath T. et al. [43] designed a cooperative Web
server for a heterogeneous cluster that uses modeling and optimization to minimizethe energy consumed per request. The approach conserves 45% more energy thanan energy-conscious server that was proposed for homogeneous clusters. While theirapproach is similar to the optimization problem defined in this thesis, we show thatoptimal solution is an off-line solution that results in service disruption. Goingbeyond the off-line solution, we propose an on-line heuristic energy saving schemesin a heterogeneous back-end router cluster.
Two forms of energy saving in a network; namely rate adaptation and sleeping ofnetwork devices, has been proposed as an appealing alternatives [44]. Researchersexploit these options to save energy in a network through smart topology reconfigu-ration. Chiaraviglio et al. [45] addressed a network design problem by considering theminimization of the total power consumed by the network. They proposed heuris-tics to select a minimum set of routers and links to be used in order to support agiven traffic demand. The main idea is to power off links and even full routers whileguaranteeing QoS constraints such as maximum link utilization. A novel energyreduction approach at the network level by considering nodes capable of adaptingtheir performance to the actual load has also been proposed in [46]. While thoseresearchers focus on energy-aware routing, this thesis focuses on energy-aware load-balancing.
A white paper from Juniper Networks, Inc. [47] reports an energy criteria used tocompare energy consumption of different network devices. The normalized energyconsumption rating (ECR), measured in watts/Gbps, is defined as
ECR =E
T(2.2)
where E is energy consumption of the device and T is the effective full-duplexthroughput. Both values may come from either internal testing or the vendor’sdata sheet. ECR is a peak metric that reflects the highest performance capacityof the device. In our energy saving algorithms and MSSR design we used similarcriteria as one of device selection parameter in setting up a new back-end routerconfiguration.
Finally, Bolla et al. gives a detailed survey [48] on emerging technologies,projects, and work-in-progress standards which can be adopted in networks andrelated infrastructures in order to reduce their energy and carbon footprint. Theauthors categorized current approaches to save energy in fixed network infrastruc-ture into three groups:
• Re-engineering approaches - aim at introducing and designing more energy-efficient elements for network device architectures;
17
2 – State-of-the-art: Distributed software routers and management
• Dynamic adaptation of network/device resources - focuses on adapting packetprocessing engines and of network interfaces to actual traffic load;
• Sleeping/standby approaches - used to smartly and selectively force idle net-work/device portion to low power mode.
In this thesis the proposed energy saving techniques fall under sleep/standby cate-gory where unused elements (PCs or network cards) set to sleep mode and wake uponly if needed.
2.2.1 Energy efficient cluster design
A cluster is a group of stand alone computational resources that work cooperativelytogether to achieve a single purpose. It is a viable approach to cope with thefast growth of the Internet [1]. Clusters can serve purposes such as infrastructurescalability, high availability, increased computational resources and load balancing.Data centers as well as networking devices such as routers that already use clusterapproach are presented in [15,49,50].
Server cluster design focuses on server types that currently give the best per-formance per unit of price, or the types that give the best absolute performance(i.e, highest computational capacity). The Google cluster architecture [49] consid-ers best performance per unit of price as PCs selection criterion to setup a cluster.This approach prioritize commodity-class PCs to high-end multi-processor serversbecause of their cost advantage. Software reliability, instead of hardware, is the pre-requisite for this design principle. The choice of the commodity-class PCs implieslarger number of PCs in a cluster to handle the peak load, which results in a highpower consumption.
Designers also estimate cluster capacity based on the applications running on itwhere capacity could mean bandwidth, CPU, RAM, storage etc needed as a serverconfiguration. The aim is to use servers with best absolute performance such thatthe cluster handles peak load [51, 52] with fewer reliable computers. However, suchcluster is far more expensive than the cluster based on commodity-class PCs for thesame performance, due to the higher interconnect bandwidth and reliability of theservers [49]. Furthermore, the high capacity granularity implies power inefficiencydespite power saving schemes deployment similar to the one proposed in [21, 22].This is because even for small traffic demand we have to turn on high capacityserver which consumes high power.
In this thesis we propose three different multistage software router back-endcluster design approaches with main focus on energy efficiency. The first approach,given a pool of different types of computers, searches for an optimal back-end routerconfiguration that minimize power consumption over a specified period for a given
18
2.3 – Distributed information management system
traffic profile. The problem is formulated as a preemptive goal programming. Inthe second approach we consider performance-power ratio as PCs’ selection criteriain building a cluster. In this case the cluster is composed of homogeneous PCswhich has the advantage of simple management. The last approach sizes the back-end router configuration based on local optimization. This approach optimize theconfiguration for the peak load and resizes this configuration for the other loadscenarios.
2.3 Distributed information management system
Multistage architecture is build on the principle that the whole architecture will beviewed as a single device to external network. This principle applies for the man-agement information as well. Hence the multistage architecture is required to havea single management information base (MIB), which could be virtual or accessiblelocally to the internal manager, representing the whole architecture. Managementinformation unification is necessary because each component in the multistage archi-tecture, as an independent element, stores its own management information. Thatis, the management information is dispersed internally and there is no single man-agement information base (MIB) representing the whole multistage architecture.For example consider the sysUpTime1. Each internal component in MSSR has itsown sysUpTime but which one represents the up time of the multistage architectureas a whole? Or do we need to generate a new sysUpTime? Thus creating a MIB formultistage software router requires additional complexity to compile a response toexternal manager request. Hence building a multistage software router MIB is oneof the main task of this thesis.
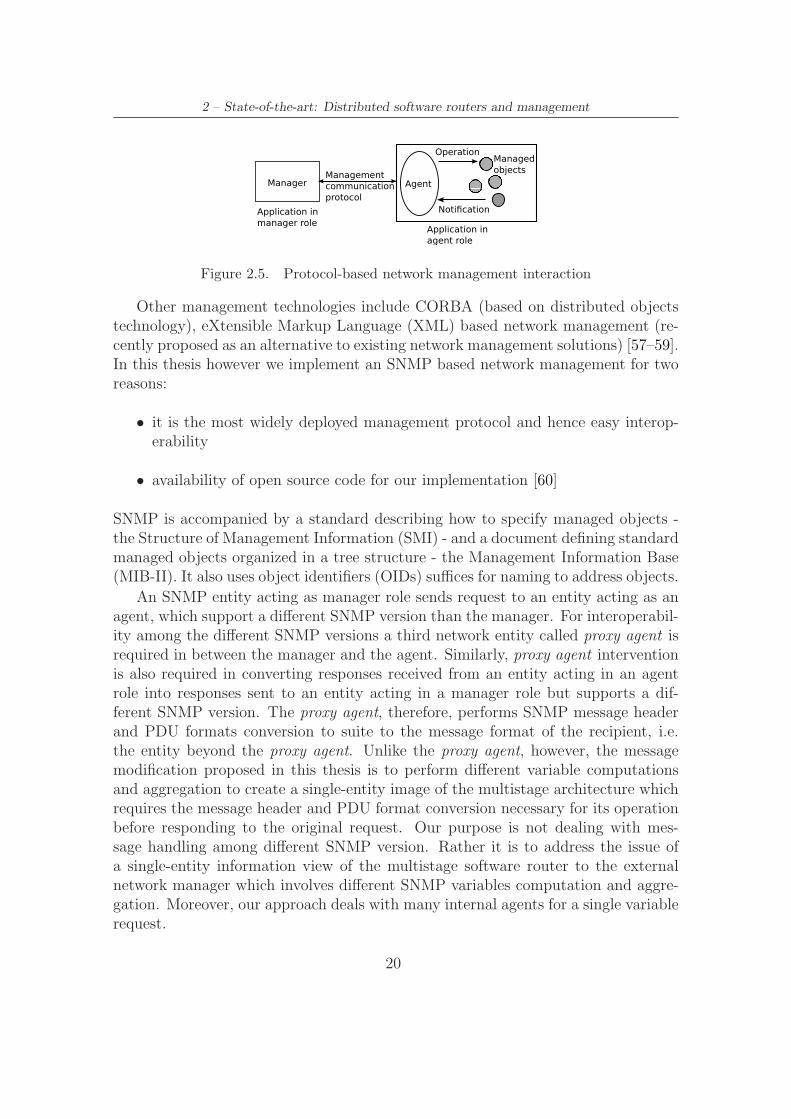
Since the inception of network management in late 1980s, there have been sev-eral approaches to manage networks, systems and services. Initial solutions wereprotocol-based management approaches that adopted the manager-agent paradigm.Manageable resources are modeled through ”cluster” of managed objects at differentlevels of abstraction. Managed objects encapsulate the underlying resource and offeran abstract access interface at the object boundary [54, Ch. 2. p. 63ff]. An appli-cation in an agent role accesses the managed objects via the management interfaces.The access interface is defined through formal specification of the relevant managedobject classes and the associated access mechanism. Figure 2.5 depicts the man-agement interaction of protocol-based network management approaches. OSI sys-tems managment (OSI-SM) [55] and Internet Simple Network Management Protocol(SNMP) [56] are the two prominent technologies that adopted the manager-agentparadigm.
1sysUpTime is the time (in hundredths of a second) since the network management portion ofthe MSSR architecture was last re-initialized [53].
19
2 – State-of-the-art: Distributed software routers and management
Manager AgentManagement
communication
protocol
Operation
NotificationApplication in
manager roleApplication in
agent role
Managed
objects
Figure 2.5. Protocol-based network management interaction
Other management technologies include CORBA (based on distributed objectstechnology), eXtensible Markup Language (XML) based network management (re-cently proposed as an alternative to existing network management solutions) [57–59].In this thesis however we implement an SNMP based network management for tworeasons:
• it is the most widely deployed management protocol and hence easy interop-erability
• availability of open source code for our implementation [60]
SNMP is accompanied by a standard describing how to specify managed objects -the Structure of Management Information (SMI) - and a document defining standardmanaged objects organized in a tree structure - the Management Information Base(MIB-II). It also uses object identifiers (OIDs) suffices for naming to address objects.
An SNMP entity acting as manager role sends request to an entity acting as anagent, which support a different SNMP version than the manager. For interoperabil-ity among the different SNMP versions a third network entity called proxy agent isrequired in between the manager and the agent. Similarly, proxy agent interventionis also required in converting responses received from an entity acting in an agentrole into responses sent to an entity acting in a manager role but supports a dif-ferent SNMP version. The proxy agent, therefore, performs SNMP message headerand PDU formats conversion to suite to the message format of the recipient, i.e.the entity beyond the proxy agent. Unlike the proxy agent, however, the messagemodification proposed in this thesis is to perform different variable computationsand aggregation to create a single-entity image of the multistage architecture whichrequires the message header and PDU format conversion necessary for its operationbefore responding to the original request. Our purpose is not dealing with mes-sage handling among different SNMP version. Rather it is to address the issue ofa single-entity information view of the multistage software router to the externalnetwork manager which involves different SNMP variables computation and aggre-gation. Moreover, our approach deals with many internal agents for a single variablerequest.
20
2.4 – Conclusion
2.4 Conclusion
In this chapter, we provided a survey of the state-of-the-art in distributed archi-tecture management spanning the period 2005 - 2010. Section 2.1 summarizes themain effort made by researchers in scaling software routers. Both single PC basedrouter scaling and distributed router architecture based on multiple CPUs to achievehigh-end router performance have been discussed.
For distributed router solution, the energy consumption of the architecture in-creases with performance since performance scaling is proportional to the numberof interconnected devices. Thus Section 2.2 details the energy saving mechanismsadopted in networks in general, and distributed architecture similar to MSSR inparticular. The Subsection 2.2.1 presents energy efficient cluster design approacheswhich contributes to energy efficiency of distributed architectures.
Finally, a distributed architecture information management schemes have beendiscussed with main focus on SNMP management.
21

Chapter 3
Multistage architecture energymanagement
Like many networking devices, the multistage software router is typically sized forpeak traffic. State-of-the-art PC-based routers can route only few Gbps [10, 11] ifthe packet processing is performed by the CPU or few tens of Gbps if a specializedpacket processing is implemented [13]. Therefore, the multistage architecture mightrequire tens or hundreds of back-end routers to achieve high-end performance. Thisperformance scaling implies a high level redundancy at the back-end stage whichtranslates to a source of energy wastage at low loads. To reduce such a wastageduring low traffic periods, the routing task can be transferred to a subset of back-end routers and all other routers are put in low power state to save energy untilthey will be required again to manage higher traffic.
Let us consider a realistic scenario: we want to realize a router with 16 interfacesat 10 Gbps (i.e. equivalent to a Juniper T series (T320) core router with 160 Gbpsforwarding capacity and up to 2.8 kW power consumption [20]) using a multistagesoftware router with the following internal components:
• back-end routers with 5.5 Gbps forwarding capacity [10] and each equippedwith single 10 Gbps interface;
• LBs each with two 10 Gbps interfaces (one connect to external and the otherto internal network);
• a hardware switch with enough capacity to interconnect LBs and routers.
Then the architecture will be composed of 16 LBs, 1 switch and 29 back-end routers.If we assume LBs and routers are running on PC with idle power consumption equalto 60 Watts (approximate lower side idle power consumption for today computers),then this architecture consumes 2.7 kW in idle state excluding the switch and the
23
3 – Multistage architecture energy management
NICs on back-end routers. However, the energy saving mechanism proposed in thischapter can reduced the architecture consumption down to 1 kW in idle state, whichis the equivalent consumption of 16 LBs and 1 back-end router.
While back-end routers and switch are redundant during low traffic periods, LBsare not because they act as external interfaces (which must stay active to guaran-tee external connectivity). Energy saving in LBs could be achieved if operating atnetwork level, where the whole network energy consumption is optimized by redi-recting the traffic over a subset of routers, not when operating at the device level [45].Therefore saving in LBs is not discussed in this thesis.
The main contributions of this chapter are the MILP formulation, proposal ofan off-line algorithm called two-step algorithm and an on-line differential algorithmto solve MSSR energy wastage problem. The analysis of the proposed algorithmsare also presented. Thus the chapter is divided into two major topics: Off-line algo-rithm and on-line algorithm to save energy in MSSR. In Section 3.1 we describe theenergy saving problem in multistage architecture and give a detailed formulation ofthe problem followed by an off-line energy saving algorithms. Performance evalua-tion of the two-step algorithm will be discussed in Subsection 3.1.3. Highlighting theadvantages and disadvantages of off-line approaches, Section 3.2 presents an alter-native: an on-line algorithm. Computational complexity and implementation issuesare also briefly described. Subsection 3.2.4 discusses simulation results of on-linealgorithm and finally conclude the chapter in Section 3.3.
3.1 Off-line algorithms
In light of the Research Question 2 discussed in Chapter 1, we propose a mixedinteger linear programming model (MILP) to select a subset of back-end routers,characterized by different power consumption and routing capacity,1 so as to mini-mize overall power consumption while satisfying the traffic demand. The problem isa typical resource allocation problem: objects (the traffic) have to be stored in a setof bins (the routers) while minimizing a total cost (the power consumption). Thus,while our research focuses on multistage software router, the proposed techniquecan be applied to many load distribution scenarios such as a computational clusters,where is it possible to identify a set of resources and a set of containers with anassociated cost and capacity (e.g. jobs to workers or tasks to processors).
1Routing capacity for a PC is defined as the amount of traffic it can process and forward persecond, measured in bits/sec
24

3.1 – Off-line algorithms
3.1.1 Problem definition and MILP formulation
The redundancy in the back-end routers designed to handle the peak hour traffic mayresult in energy waste under low traffic periods. We design mechanisms to reduceenergy consumption by adapting the number of back-end routers to the currentlyoffered traffic load.
The proposed saving mechanism is based on an optimization technique whichrequires the virtualCP to collect periodically the information about the componentsof the architecture and the incoming traffic. In this section we use different param-eters and variables to describe the system as a Mixed Integer Linear Programming(MILP) model and we introduce them here to clarify the notation:
• Input: the total input traffic to the multistage router, T ∈ R
• Routers: B is the set of back-end routers. ∀r ∈ B, Pr ∈ R is the routerpower consumption (excluding line cards) and Cr ∈ R is the routing capacity
• Links: L is the set of all internal links. Lr ⊆ L is the set of internal linksconnected to router r. ∀r ∈ B, ∀l ∈ Lr, Prl ∈ R is the link power consumptionand Crl ∈ R is the link capacity
• MILP variables: ∀r ∈ B, αr is a router selection variable (equal to 1 if therouter is activated, 0 otherwise). ∀r ∈ B, ∀l ∈ Lr, βrl is the link selectionvariable (equal to 1 if the link is used, 0 otherwise). Finally, trl is a portion oftraffic T to be forwarded by router r on its link l.
In the problem formulation we have to take care of different details and dif-ferent assumption about the system, ranging from the input traffic to the powerconsumption of a link. The key points considered in our work are as follows:
1. Traffic measurements are available at the virtualCP : we do not focus on theissue of measuring or estimating the incoming traffic and collecting measure-ments. We assume that the virtualCP is able to obtain reliable aggregatemeasurements on the input traffic.
2. The input traffic T is splittable among the back-end routers : every packet ismanaged independently by LBs and sent to a different back-end router. Thismay create out-of-sequence delivery of packets belonging to the same flow,unless reordering is envisioned at LBs.
3. Routers and NICs energy consumption: the router and its cards are optimizedseparately. That is while a router is used in forwarding traffic on some of itsinterfaces during low load periods, the remaining network cards can be turnedOFF to contribute to energy saving.
25

3 – Multistage architecture energy management
4. Single link per card scenario: we focus on single link per card scenario. How-ever, a back-end router can be connected to the switch with more than onelink. We further assume that techniques such as smart power down [61] willput a card to low power mode upon a decision taken by the controller toturn off the link on that card. Therefore, we represent the combined powerconsumption of the card and the link l on a given router r by Prl ∈ R
5. ON-OFF power model for the back-end routers and links : measurements showthat power consumption of network devices and links can be approximatedby a linear model [46, 62] with an initial step. Indeed, most of the energyconsumption is due to the activation of the resource, whereas the remainingpart depends linearly on the actual load. To keep the problem formulationas simple as possible, we chose the ON-OFF model: the energy consumptiondoes not depend on the actual resource load, but it is either zero or a constantvalue.
6. Off-line solution: the energy saving problem is solved using an off-line al-gorithm: the problem is not taking into account the evolution of the inputtraffic, but it is designed to give the best solution given a specific input traffic.Solutions obtained with different input traffic loads are independent, i.e., thesets of activated routers under similar loads may be completely disjoint. Asa result, under frequently changing input traffic, the multistage router config-uration may be ”unstable”: the set of active routers may change completelyeven for small variations of the input traffic load. Furthermore, the virtualCPmust manage state transitions (e.g. turning on and off back-end routers dueto a new solution) in a non-disruptive way. A feasible mechanism would be toturn on all PCs in current and in future solutions, then to redirect the trafficto the subset of routers belonging to future solution only and finally to turnoff the idle routers belonging exclusively to the first solution. This solutioncompromises the optimal solution. Another alternative could be an on-linedifferential algorithm that builds a new configuration solution on top of anexisting one (See section 3.2 for detail)
Based on the fourth and fifth assumptions mentioned above, the maximum powerconsumption of a back-end router r is given by:
Pr +∑
l
Prl (3.1)
Thus, the multistage software router energy saving scheme can be formalized as a
26
3.1 – Off-line algorithms
MILP problem as follows:
min Pcombined =∑
r(Prαr +∑
l Prlβrl) (3.2)
s.t.∑
r
∑
l trl = 1 (3.3)∑
l trlT ≤ Crαr ∀r ∈ B (3.4)
trlT ≤ Crlβrl ∀r ∈ B,∀l ∈ Lr (3.5)
αr ≥ βrl ∀r ∈ B,∀l ∈ Lr (3.6)
αr,βrl ∈ {0,1},trl ∈ [0,1] (3.7)
In the MILP formulation, (3.3) ensures that all the input traffic T is served,while (3.4) and (3.5) make sure the capacity constraints of each router (Cr) and link(Crl) are not violated. (3.6) ensures that router r is active if at least one of its linksis chosen to carry some traffic.
Equations (3.2)–(3.7) define a MILP problem that optimizes the multistage ar-chitecture power consumption, considering both routers and NICs. Hence, we referto it as the combined problem in the next sections. The problem is NP-hard, and itcannot be mapped easily in its complete form to a well-known problem as demon-strated in Appendix A. Thus, exact methods can only be used to solve small sizecases.
3.1.2 Two-step approach
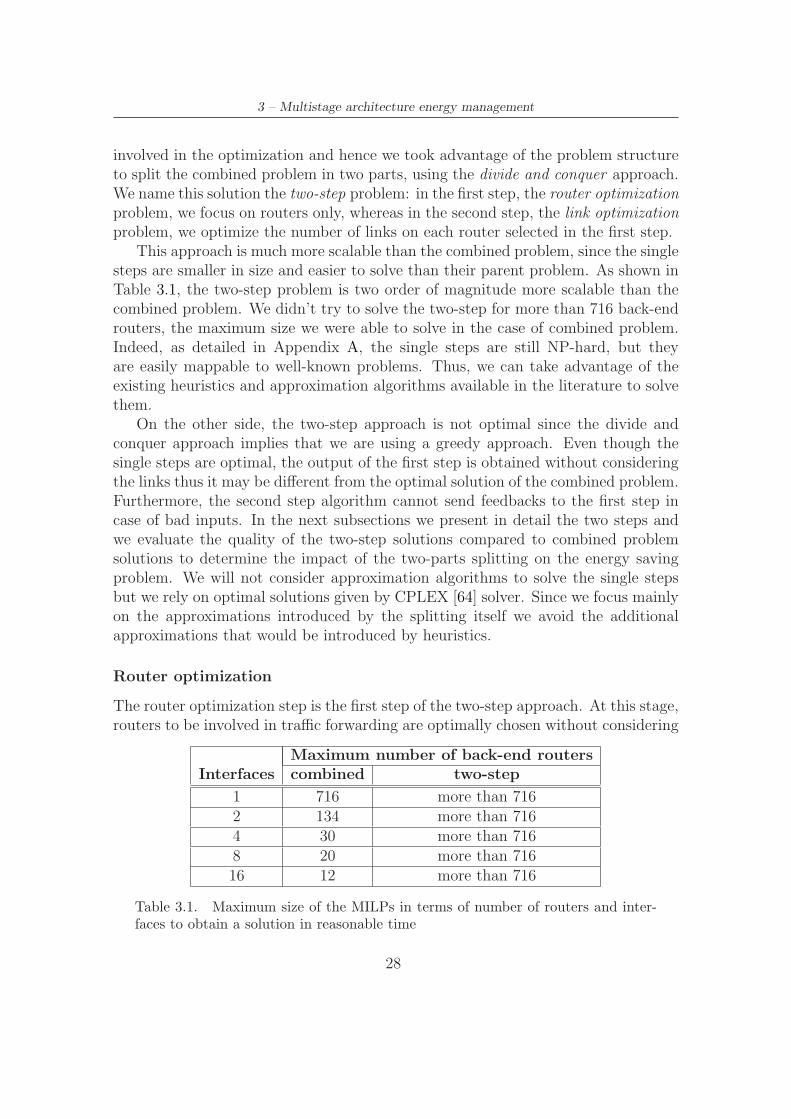
The combined problem cannot be mapped directly to problems with well knownsolutions, although it is similar to some classical problems in the area of resourceallocation (e.g. Knapsack and Bin-Packing [63]). Being NP-hard, the combinedproblem is complex because it jointly optimizes routers and links and it is unsolvablefor large size. Indeed, in Table 3.1 we report the maximum size of the multistagerouter as the number of back-end routers, for a given number of interfaces per router,for which we were able to obtain a solution in reasonable time (e.g. 5 minutes, thedefault SNMP collection interval time which can be the basis for an estimation ofthe current traffic load). It is clear from Table 3.1 that as soon as the numberof interfaces per router grows the maximum number of routers drops quickly inthe combined problem case. Thus, the combined problem is seriously limited inscalability by the number of interfaces per router; since the number of interfacesshould be easily around 10 in a normal PC, then the size of the multistage routerwould be limited among 12 to 20 routers, which may not be enough even in theJuniper T320 example introduced earlier in this chapter.
Since the combined problem is not scalable and cannot be used even for smallsize multistage routers with few links per back-end router, we focus on heuristicssolutions to improve scalability. We have two elements (i.e. routers and links)
27
3 – Multistage architecture energy management
involved in the optimization and hence we took advantage of the problem structureto split the combined problem in two parts, using the divide and conquer approach.We name this solution the two-step problem: in the first step, the router optimizationproblem, we focus on routers only, whereas in the second step, the link optimizationproblem, we optimize the number of links on each router selected in the first step.
This approach is much more scalable than the combined problem, since the singlesteps are smaller in size and easier to solve than their parent problem. As shown inTable 3.1, the two-step problem is two order of magnitude more scalable than thecombined problem. We didn’t try to solve the two-step for more than 716 back-endrouters, the maximum size we were able to solve in the case of combined problem.Indeed, as detailed in Appendix A, the single steps are still NP-hard, but theyare easily mappable to well-known problems. Thus, we can take advantage of theexisting heuristics and approximation algorithms available in the literature to solvethem.
On the other side, the two-step approach is not optimal since the divide andconquer approach implies that we are using a greedy approach. Even though thesingle steps are optimal, the output of the first step is obtained without consideringthe links thus it may be different from the optimal solution of the combined problem.Furthermore, the second step algorithm cannot send feedbacks to the first step incase of bad inputs. In the next subsections we present in detail the two steps andwe evaluate the quality of the two-step solutions compared to combined problemsolutions to determine the impact of the two-parts splitting on the energy savingproblem. We will not consider approximation algorithms to solve the single stepsbut we rely on optimal solutions given by CPLEX [64] solver. Since we focus mainlyon the approximations introduced by the splitting itself we avoid the additionalapproximations that would be introduced by heuristics.
Router optimization
The router optimization step is the first step of the two-step approach. At this stage,routers to be involved in traffic forwarding are optimally chosen without considering
Maximum number of back-end routersInterfaces combined two-step
1 716 more than 7162 134 more than 7164 30 more than 7168 20 more than 71616 12 more than 716
Table 3.1. Maximum size of the MILPs in terms of number of routers and inter-faces to obtain a solution in reasonable time
28
3.1 – Off-line algorithms
the NICs. Thus the router optimization step is formulated as follows:
min PR OPT =∑
r Prαr (3.8)
s.t.∑
r tr = 1 (3.9)
trT ≤ C∗
rαr, ∀r ∈ B (3.10)
αr ∈ {0,1} (3.11)
tr ∈ [0,1] (3.12)
where all variables, constraints and terms have the same meaning as in (3.2)–(3.7)with the following modification: trl which is redefined as tr because links are notconsidered here and C∗
r = min(Cr,Crl) which defines the actual routing capacityof a router. This problem is a variation of the well known bin-packing problemwith splittable item (traffic T ) where the bins (routers) have different size (routingcapacity Cr). Unlike the classical bin-packing problem where the cost of using abin is the same as the size of the bins, in this scheme the cost (power consumption Pr)of the routers is different from the size (routing capacity Cr). Therefore, the aboveproblem is a bin-packing problem with generalized cost and variable
sized bins [65] with splittable items. (3.8) – (3.12) are used to optimally select therouters to be used in packing the splittable traffic T while minimizing the powerconsumption.
As previously mentioned, the two-step approach is based on the divide and con-quer paradigm. Therefore the information required to globally optimize the systemis partitioned among the two steps making them less optimal from a global point ofview. To assess the impact of information partitioning, we introduce two differentschemes to configure the first step:
• Router-Power scheme (NIC−): no link information is made available tothe first step. In this scheme we use (3.8)–(3.12) with no modification.
• Router+Link-Power scheme (NIC+): NIC power consumption is consid-ered in the first step.
In the NIC+ scheme the cost of using a router is defined as the power consumptionof the router plus the sum of the power consumption of all of its network cards.Hence the Pr parameter in (3.8) is replaced by
P newr = Pr +
∑
l
Prl (3.13)
P newr is the same as in (3.1) and it represents the maximum power consumption of
router r including its NICs.
29
3 – Multistage architecture energy management
Link optimization
The link optimization problem makes use of the solution of the router optimizationstep, so it is always the second step in two-step approach. Once the routers arechosen by the first step and the amount of traffic Tr (such that
∑
r Tr = T ) sent torouter r is determined, then the links on each router r are chosen according to thefollowing optimization problem to be solved independently on each router r ∈ B:
min PL OPTr =
∑
l Prlβrl (3.14)
s.t.∑
l trl = 1 (3.15)
trlTr ≤ Crlβrl, ∀l ∈ Lr (3.16)
βrl ∈ {0,1},trl ∈ [0,1] (3.17)
where Tr is the portion of the traffic T to be routed by router r, as provided by therouter optimization step. trl is a portion of Tr sent on link l to router r and it isan optimization variable for this step. The other variables and parameters have thesame meaning as before. Note that the link optimization is performed independentlyfor each active router r ∈ B. As in the first step, this formulation is a generalized
cost variable sized bin-packing problem, where the links are the bins with costPrl and size Crl and the traffic is the splittable item Tr.
After solving the second step on each router, the total power consumption of themultistage architecture due to the two-step approach is given by:
Ptwostep = PR OPT +∑
r
PL OPTr (3.18)
3.1.3 Performance evaluation
In this section we present results obtained using CPLEX [64] to implement the op-timization models and we compare the combined and two-step solutions against thescenario where no energy saving mechanism is implemented. This approach gives usmore opportunity to control single parameters and to focus on algorithm behaviorswithout introducing additional complexity, implementation issues and approxima-tions (e.g. two-step scheme is based on Bin Packing problem which is typicallysolved by heuristics).
In the comparison, we fixed our attention to a realistic scenario, i.e. a multistagerouter architecture with features comparable to those of a Juniper T320 router [20].The main parameters [11, 35, 42] used in the simulation are:
• LBs and router power consumption PLB = Pr = 80 W;
• back-end router routing capacity Cr = 8000 Mbps;
30
3.1 – Off-line algorithms
• link capacity Crl = 1000 Mbps;
• link power consumption Prl = 2 W;
According to this profile, the 160 Gbps forwarding capability of Juniper T320 canbe realized using 20 back-end routers interconnected through a switch, each back-end router being equipped with eight 1 Gbps single-port network cards. Withoutenergy saving scheme, this network consumes about 20 ∗ 80 + 2 ∗ 8 ∗ 20 + 16 ∗ 80 =3200 W (1920 W by back-end routers) without considering the internal switch andassuming to have 16 LBs each with one 10 Gbps link. However, the energy-savingscheme proposed can save up to 1838 W when a minimal traffic is offered at inputs(i.e. only one back-end router and one of its link are active to guarantee minimalfunctionalities). This saving accounts for 57.44% of the total energy consumptionof the MSSR architecture.
Besides the analysis performed with the above described multistage router con-figuration, we also evaluate independently the impact of the variability of four con-figuration parameters (i.e. Cr, Pr, Crl and Prl) on the solution quality (measuredas the difference between the combined solution and the two-step solution). Moreprecisely, we fix three of the parameters to the above given default values, while wevary the fourth parameter as follows:
• Cr: uniformly distributed in the range 5000 Mbps ≤ Cr ≤ 10000 Mbps. Tenlinks (at 1 Gbps) for each router are required to avoid bottleneck.
• Pr: uniformly distributed in the range 60 W ≤ Pr ≤ 120 W.
• Crl: one of the standard link rates with priority to 1 Gbps links (100 Mpbswith probability p = 0.25, 1 Gbps with probability p = 0.75).
• Prl: randomly chosen from {2,3,4} W.
For each of the four above described scenarios, we run the combined model andthe two-step schemes for traffic loads ranging from 10% to 100% of the total routingcapacity of the multistage architecture. For each of those load values, 20 randominstances were generated and results were averaged over the instances. Furthermore,in the case of the two-step scheme, we evaluate both the router-optimization schemesdescribed in subsection 3.1.2 (i.e. NIC− and NIC+ schemes) under the same con-figurations. The comparison metric is the total power consumption of the back-endstage (minimum, maximum and average over the 20 instances). The relative differ-ence between the optimal and the proposed algorithm is also reported to clarify thecomparison metric where relative difference is defined as:
Relative difference =Ptwostep − Pcombined
Pcombined
(3.19)
31

3 – Multistage architecture energy management
0
400
800
1200
1600
2000
0.1 0.2 0.3 0.4 0.5 0.6 0.7 0.8 0.9 1
Pow
er (
Wat
t)
Load
OptimalNIC+ two-stepNIC- two-step
No Saving Scheme
Figure 3.1. Load proportional energy saving scheme in back-end routers
where Ptwostep and Pcombined are the two-step and optimal algorithm solution respec-tively.
Main results
First of all, the most important result is that the usage of off-line energy savingschemes proposed makes the energy consumption of the back-end stage of the mul-tistage router proportional to input load allowing a huge energy saving when theinput load is not maximum, as reported in Fig. 3.1. For the above given experimen-tal setup the energy saving ranges from 0 W in the case of maximum input loadto 1838 W (equivalent to 95.73% of maximum power consumption of the back-endrouter) when input load is smaller than one link capacity and one router only isneeded.
Secondly, the solutions of combined and two-step approaches are very similarin terms of power consumption. In the worst case considered in our simulationsthe maximum power difference between the two-step approach and the optimalsolution is less than 9% as reported in Fig. 3.2, where all the considered scenariosare compared. In the next section we explain more in detail the differences amongthe solutions
Finally, the NIC− and NIC+ schemes obtain the same results in most of thescenarios, but the NIC+ has a huge impact on the Prl scenario where link power israndomized. In this scenario our heuristic allows to improve the two-step solutionand to make it equivalent to the combined solution as reported in Fig. 3.2(a) andFig.3.2(b), meanwhile it has no negative impact on the other scenarios. Thus theNIC+ heuristic is useful to reduce the negative impact due to the variability of link
32

3.1 – Off-line algorithms
0 1 2 3 4 5 6 7 8 9
0 0.1 0.2 0.3 0.4 0.5 0.6 0.7 0.8 0.9 1
Rel
ativ
e di
ffer
ence
(%
)
Load
CrPr
CrlPrl
(a) NIC- two-step heuristic
0 1 2 3 4 5 6 7 8 9
0 0.1 0.2 0.3 0.4 0.5 0.6 0.7 0.8 0.9 1
Rel
ativ
e di
ffer
ence
(%
)
Load
CrPr
CrlPrl
(b) NIC+ two-step heuristic
Figure 3.2. Relative difference due to variability in router and link parameters
features and to improve the greedy approach followed by the two-step schemes.
Detailed results
In this section we explain more in detail the impact of each parameter on the pro-posed algorithms.
Cr scenario
The effect of Cr variability on the two-step approach is minimal as reported inFig. 3.2. The difference is due to the greedy nature of the two-step: In the firststep there is no knowledge of the available links, so it happens that the amount oftraffic sent to routers by the first step cannot be managed efficiently by the secondoptimization step on each of the routers. For instance, consider a simple scenarioinvolving two back-end routers:
Cr (Mbps) Pr (W) No. of links Crl (Gbps) Prl (W)
R1 9100 80 10 1 4R2 7300 80 10 1 4
Table 3.2. Cr scenario description
Observe that the routers are equivalent from the point of view of the objectivefunction of the first step (i.e. Pr) and the difference is only in the routing capacityas required by Cr scenario. Let us assume an input load T = 11 Gbps. A possibleoptimal solution is to route 9 Gbps to R1 and 2 Gbps to R2 using nine links on R1and two links on R2 at full capacity and consuming 2 ∗ 80 + 9 ∗ 4 + 2 ∗ 4 = 204 W.
However, in the two-step approach the final solution is typically different from the
33
3 – Multistage architecture energy management
optimal one. Since there is no knowledge of links in the first step, the first solutionusually maximizes the usage of one of the routers. For instance, one possible choiceis to forward 9100 Mbps to R1 and 1900 Mbps to R2 using ten links on R1 andtwo links on R2 (two links, one on R1 and another on R2, are not used at full load)consuming 2 ∗ 80 + 10 ∗ 4 + 2 ∗ 4 = 208 W, 4 W worse than the optimal powerconsumption.
Thus, the solution of the first step is not always well-suited to efficiently loadthe links, leading to higher energy consumption. However, the amount of additionalenergy required is generally small because only few additional links are involved (e.g.up to ten links at load equal to 0.9 in our case). Finally, there is no difference amongNIC− and NIC+, because the routers support the same set of links. In the case ofNIC+ the same amount of power is added to all the routers, thus the differenceamong routers remain the same.
Pr scenario
There is no difference among the two-step and the combined approaches, becausethe variability is introduced in the optimization parameter included in the objectivefunction. Since the first step is the reduced version of the combined problem whileconsidering routers only, then the optimal and two-step approaches are equivalentin this case. Indeed, there are no issues related to the inefficiency in link utilizationin the second step as in the previous case, because the total available capacity Cr
(8 Gbps) is exactly the sum of the available links (eight links at 1 Gbps). Thismeans that the same routers will be chosen by both schemes, showing no differencein Fig. 3.2. Furthermore, NIC− and NIC+ are equivalent for the same reasonsexplained in previous scenario.
Crl scenario
This scenario is introducing variability in link features, thus it highlights the weak-nesses of the two-step approach especially at high loads (See Fig. 3.2). In this casethe links have the same power consumption, but they may have a different capacity(e.g. 100 Mbps or 1 Gbps). Since all the routers have the same power consumption,it is important to be able to use efficiently the links by sending the right amountof load to all the routers as in Cr scenario; this is done efficiently by the combinedscheme, but it cannot be done by the two-step scheme where all the routers areequivalent in the router optimization step regardless of their links. Furthermore,the difference among optimal and two-step schemes increases with the load, becausean increasing number of routers are activated and more routers will receive a wrongportion of the load. Finally, the NIC+ heuristic cannot improve the solution sinceit is focused on link power consumption only, which is the same for all the links.
34
3.2 – On-line algorithm
Prl scenario
As in the previous scenario, the variability in links highlights the weaknesses of two-step scheme as shown in Fig. 3.2. In this case, all the routers are the same from thepoint of view of power consumption and capacity thus they are equally likely to beincluded in the solution by the two-step scheme. The relative difference reported inFig. 3.2(a) is decreasing with load because at small loads it is less likely to activatethe best routers (which are randomly chosen because they are equivalent). However,at high loads, most of the routers are activated; thus, it is less likely to exclude thebest routers from the solution.
Finally, in this scenario the NIC+ heuristic is very effective reducing the errorin the considered configurations almost to zero because the aggregated power con-sumption of links and routers allows to choose more efficiently the best routers: theset of power-hungry links influences the choice of routers giving more priority inthe first step to routers hosting power-efficient links. As presented in Fig. 3.2(b),there are still some small differences at low load, but this is due to the fact thatthe heuristic aggregates all links in a single bunch. Thus, the router optimizationstep is choosing on the aggregate power and not on the single link power. As aconsequence, some errors are more likely when few links will be used, as in the lowload case.
3.2 On-line algorithm
In the previous section we show that the two-step algorithm closely approximatethe optimal solution considering different scenarios under the assumption that theinput traffic is splittable (at a packet level) among the back-end routers. Giventhis assumption, the two-step algorithm also scales to a practical size of a MSSRarchitecture. However, if flow based routing is required, the two-step problem mapsto a generalized cost variable sized bin packing problem [66] and its scalabilitydeteriorates. In addition, as we describe later in this section, the off-line algorithms(both the optimal and two-step) are more service disruptive and introduce moredelay unless the solution quality is compromised.
This section provides an alternative to off-line approaches; namely on-line dif-ferential energy saving algorithms. Unlike the optimal and two-step algorithms, theon-line algorithms set up a new back-end router configuration by modifying an ex-isting configuration. It is less optimal compared to the off-line algorithms but hasthe advantage of being less disruptive and scales well to solve large configurationsize both under splittable and flow based routing.
35
3 – Multistage architecture energy management
3.2.1 System modeling
While the assumptions presented in subsection 3.1.1 still holds, in this section weconsider an on-line solution for the following two traffic scenarios:
• unsplittable input traffic: Flow based input traffic information is necessaryif ordered delivery at the output interface is important to minimize out oforder delivery and delay needed to order the flows. The ordered deliver canbe performed by load balancing the incoming traffic based on flows, wherea flow is defined as packets belonging to the same source and destination.Input traffic belonging to same flow will be directed by load balancers to thesame back-end PCs for routing operation. This input traffic is referred to asunsplittable input traffic since a flow does not split into different back-end PCsbut forwarded only by a single PC. QoS provision is another perspective tosee the need for flow based routing.
• splittable input traffic: If ordered deliver and QoS provision is not manda-tory, the input traffic can be present to the optimizer as an aggregate input.The LBs split the aggregate traffic among available back-end PCs for rout-ing operation as in the case of off-line algorithms. We refer to this traffic assplittable input traffic.
Consequently, the multistage architecture energy saving model presented in Sec. 3.1requires a slight modification to fit both splittable and unsplittable input trafficscenario. In the following, we discuss this modification in detail.
Problem formulation
Based on the the above stated assumptions, the multistage architecture energy sav-ing scheme can be stated and formalized as follows: Given i) a set of back-endPCs B; each PC b ∈ B characterized by power consumption (excluding networkcards) Pb ∈ R and routing capacity Cb ∈ R, ii) a set of links Lb connected to eachPC b ∈ B; each link l ∈ Lb characterized by power consumption Pbl ∈ R and linkcapacity Cbl ∈ R, and iii) a set of input traffic demand T ∈ R, Select PCs andlinks required in routing the traffic demand such that the energy consumption ofthe architecture is minimized, Subject to link rate and router capacity.
In formalizing the problem definition, let αb be a PC selection binary variable(equal to 1 if a PC b ∈ B is activated, 0 otherwise), and βbl be the link selectionbinary variable (equal to 1 if the link l ∈ Lb connected to PC b ∈ B is used, 0otherwise). And let δblk be
• a flow selection binary variable, δblk ∈ {0,1}, for unsplittable input traffic; 1 ifa flow tk ∈ T is forwarded on link l of router b , 0 otherwise, OR
36
3.2 – On-line algorithm
• a portion of splittable input traffic to be forwarded by router b on link l; i.e.,δblk ∈ [0,1]. Note that for splittable traffic, the set T has only one elementwhich is the aggregate input traffic. Thus k = 1 under splittable traffic scenarioand δblk represents a portion of an input traffic T .
Given the above definitions and assumptions, the MSSR energy saving problem canbe formulated as a mixed integer linear programming (MILP) as follows:
min. P =∑
b(Pbαb +∑
l Pblβbl) (3.20)
s.t.∑
b
∑
l δblk = 1 ∀k ∈ T (3.21)∑
l
∑
k δblkSk ≤ Cbαb ∀b ∈ B,∀k ∈ T (3.22)∑
k δblkSk ≤ Cblβbl ∀b ∈ B,∀l ∈ Lb,∀k ∈ T (3.23)
αb ≥ βbl ∀b ∈ B,∀l ∈ Lb (3.24)
αb,βbl ∈ {0,1}
δblk ∈ {0,1} ∨ [0,1]
where Sk is the size of flow k. (3.21) ensures that all the input traffic T is servedwhile (3.22) and (3.23), respectively, make sure the capacity constraints of eachrouter (Cb) and link (Cbl) are not violated. (3.24) ensures that router b is active ifat least one of its links is chosen to carry some traffic.
Equations (3.20) – (3.24) define a MILP problem that optimizes the MSSR ar-chitecture power consumption, considering both PCs and NICs simultaneously forboth unsplittable and splittable input traffic. The solution to the above definedproblem is a back-end PCs configuration capable of routing an input traffic T underdevices capacity constraint while minimizing the energy consumption. The problemis categorized as NP-hard problems as demonstrated in appendix A. Thus, exactmethods can only be used to solve small size cases and therefore we opt for a heuris-tic method. We use the results, however, as a reference to measure the performanceof our proposed heuristic algorithms.
3.2.2 Proposed heuristic algorithm
Besides the optimal problem is NP-hard, reconfiguration of back-end PCs to handlechanges in input traffic usually causes service disruption or forwarding delay unlessan optimal solution is compromised. This is because a solution which is optimalin one input traffic scenario will not be optimal in another. Thus the change inan input traffic triggers re-computation for optimal solution under current trafficdemand. Most frequently, the new solution differs from the previous solution whichmeans turning off some already active devices and turning on some others. This
37
3 – Multistage architecture energy management
transition requires some time resulting in a reduced routing capacity temporary.That is some input traffic are delayed or not served at all during reconfigurationphase. One solution could be to keep the previous configuration until a new one issetup but this compromises the optimality of the solution during the reconfigurationphase since the previous configuration is not optimal under current traffic scenario.
Algorithm description
The proposed energy saving heuristic is an on-line differential algorithm that definesa new back-end stage configuration needed to satisfy the current traffic demand bymodifying an existing MSSR configuration to avoid service interruption or delay.The algorithm is a modified first-fit-decreasing bin-packing algorithm [63] with bins(PCs) having different size (actual routing capacity Ca) and different usage cost(power dissipation) where the items (input traffic) can be splittable or unsplittable.The algorithm also has to consider bins (links) within a bin (PC) scenario duringpacking. More specifically, the algorithm tries to pack the links with portion of theinput traffic taking heed of the routing capacity of the PC being not exceeded.
During the initialization phase, the algorithm performs two tasks: computes theactual routing capacity of each PCs and sorts the devices (both PCs and links).The actual routing capacity of a PC acting as a router is limited either by theCPU packet processing capacity or by the sum of link rates on the PC [10] [11].For example, if a PC has 4 Gbps routing capacity but has only single 1 Gbpslink, then the actual routing capacity is limited to the link capacity; i.e. 1 Gbps.Since the devices have different capacity and power dissipation, sorting devices isnecessary in order to increases the packing efficiency [66]. The initialization phaseof the algorithm performs these tasks according to a predefined criteria (detail insection 3.2.2). Furthermore, for unsplittable input traffic the flows will be sorted indescending order - again to increase the efficiency of packing.
After the initialization phase, the algorithm continues to monitor changes in theinput traffic. If the input traffic increases, the algorithm will retain the currentconfiguration and augments the current capacity by turning on additional devices.Otherwise, if the input traffic decreases, the algorithm turns off some devices to downsize the current active configuration to the traffic demand (detail in section 3.2.2).
Algorithm initialization
At start up, the algorithm analyze the MSSR available configuration, i.e. the setof PCs used as the back-end stage and of their NIC cards, to determine the actualrouting capacity (Ca) of each PC and therefore of the whole architecture (C
MSSR).
38

3.2 – On-line algorithm
The algorithm computes these capacities as:
Ca = min(Cb,∑
l
Cbl) (3.25)
CMSSR
=∑
b
Ca (3.26)
Equation (3.25) defines actual capacity of a PC as the minimum between a PC CPUpacket processing capacity (Cb) and the sum of all the link rates on that PC. Thenthe sum of all back-end PCs actual routing capacity defines the MSSR architecturecapacity (C
MSSR).
Then the algorithms sort devices, both PCs and links, according to the followingtwo schemes:
I) device efficiency - devices are ordered in descending order of efficiency OR
II) device power dissipation - devices are ordered in ascending power dissipation
The sorted devices are used in the packing algorithm (described in Sec. 3.2.2) thatprioritize the first device in the sorted list which has a capacity to handle a trafficdemand.
In the first sorting scheme, efficiency is defined, in general, as the amount oftraffic routed per watt:
η =actual capacity
power(3.27)
When sorting PCs according to their efficiency, two slight variations are considered.The version of the algorithm denoted as η
NIC−
does not consider the NICs powerconsumption when evaluating PCs’ efficiency.
ηNIC−
=Ca
Pb
(3.28)
Instead, the version of the algorithm that takes into account also the link powerconsumption during PCs sorting stage is named η
NIC+. In this case, (3.28) can be
rewritten as:
ηNIC+
=Ca
Pb +∑
l Pbl
(3.29)
where N is the number of links connected to back-end PC b. Similarly, links in aPC b are also sorted according to their efficiency η
bl:
ηbl=
Cbl
Pbl
(3.30)
39
3 – Multistage architecture energy management
The second sorting scheme sorts devices by power dissipation where less dissipat-ing devices come first in the list. That is less energy consuming devices are preferredif they have a residual capacity to route incoming traffic. PCs sorted according totheir power consumption also has P
NIC−
and PNIC+
versions. Accordingly, PNIC+
sorts PCs considering links power consumption as:
PNIC+
= Pb +∑
l
Pbl (3.31)
On the other hand, PNIC−
considers only the PCs power consumption for sorting.Links on a PC also will be sorted according to their power consumption in case thesecond sorting scheme is deployed.
Packing algorithm
The goal of the algorithm is to minimize energy consumed by a subset of back-endPCs that serves the requested traffic demand. Therefore, after the devices sortingphase, the algorithm follows a greedy approach in packing the incoming traffic to theback-end PCs. For efficiency sorting scheme, the algorithm starts activating (i.e.,setting in the on state) the available most efficient PC b according to (3.28) or (3.29)and the most efficient links l on that PC b according to (3.30). When the firstPC’s actual capacity (Ca) is fully utilized, the algorithm considers packing residualincoming traffic to the next available most efficient PC. This procedure is iterateduntil all the incoming traffic is served. If the incoming traffic exceeds the MSSRarchitecture capacity (CMSSr), the extra amount of traffic is discarded. Similarly,if the sorting is based on device power consumption, the algorithm starts packingthe least power consuming PCs and least consuming links on those PCs until allincoming traffic is served.
After each configuration setup, the algorithm continues to monitor the incomingtraffic change to identify a traffic modification worth of a reconfiguration phase. Areconfiguration phase initialized in following two ways:
I) threshold based or
II) sampling based
In threshold based reconfiguration initialization, a specified threshold is defined. Ifthe traffic change exceeds this threshold, then a new back-end PCs configurationwill be defined by the algorithm to handle the new traffic demand. We assumed aninput traffic change by ±5% of total input traffic to initiate reconfiguration of theback-end PCs. Any smaller change in input traffic that does not reach ±5% of totaltraffic will not activate a reconfiguration step. To serve such a small variation in theinput traffic, however, the current configuration can be augmented by 5% of total
40
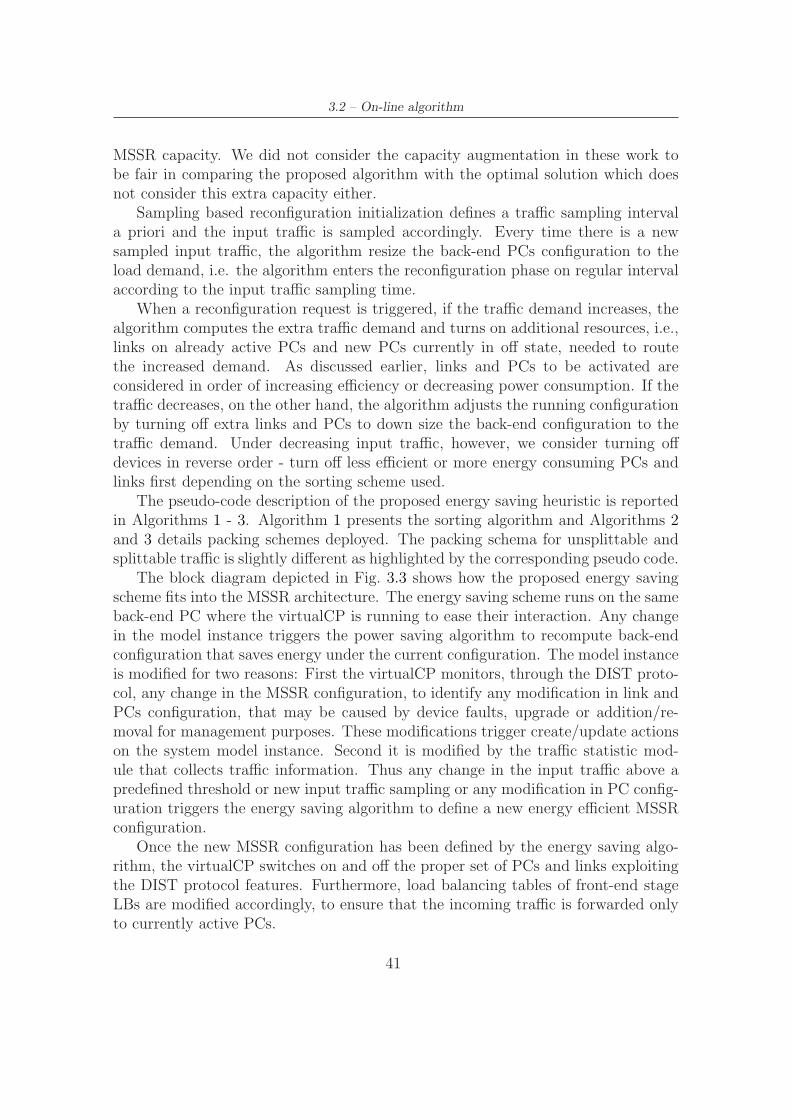
3.2 – On-line algorithm
MSSR capacity. We did not consider the capacity augmentation in these work tobe fair in comparing the proposed algorithm with the optimal solution which doesnot consider this extra capacity either.
Sampling based reconfiguration initialization defines a traffic sampling intervala priori and the input traffic is sampled accordingly. Every time there is a newsampled input traffic, the algorithm resize the back-end PCs configuration to theload demand, i.e. the algorithm enters the reconfiguration phase on regular intervalaccording to the input traffic sampling time.
When a reconfiguration request is triggered, if the traffic demand increases, thealgorithm computes the extra traffic demand and turns on additional resources, i.e.,links on already active PCs and new PCs currently in off state, needed to routethe increased demand. As discussed earlier, links and PCs to be activated areconsidered in order of increasing efficiency or decreasing power consumption. If thetraffic decreases, on the other hand, the algorithm adjusts the running configurationby turning off extra links and PCs to down size the back-end configuration to thetraffic demand. Under decreasing input traffic, however, we consider turning offdevices in reverse order - turn off less efficient or more energy consuming PCs andlinks first depending on the sorting scheme used.
The pseudo-code description of the proposed energy saving heuristic is reportedin Algorithms 1 - 3. Algorithm 1 presents the sorting algorithm and Algorithms 2and 3 details packing schemes deployed. The packing schema for unsplittable andsplittable traffic is slightly different as highlighted by the corresponding pseudo code.
The block diagram depicted in Fig. 3.3 shows how the proposed energy savingscheme fits into the MSSR architecture. The energy saving scheme runs on the sameback-end PC where the virtualCP is running to ease their interaction. Any changein the model instance triggers the power saving algorithm to recompute back-endconfiguration that saves energy under the current configuration. The model instanceis modified for two reasons: First the virtualCP monitors, through the DIST proto-col, any change in the MSSR configuration, to identify any modification in link andPCs configuration, that may be caused by device faults, upgrade or addition/re-moval for management purposes. These modifications trigger create/update actionson the system model instance. Second it is modified by the traffic statistic mod-ule that collects traffic information. Thus any change in the input traffic above apredefined threshold or new input traffic sampling or any modification in PC config-uration triggers the energy saving algorithm to define a new energy efficient MSSRconfiguration.
Once the new MSSR configuration has been defined by the energy saving algo-rithm, the virtualCP switches on and off the proper set of PCs and links exploitingthe DIST protocol features. Furthermore, load balancing tables of front-end stageLBs are modified accordingly, to ensure that the incoming traffic is forwarded onlyto currently active PCs.
41
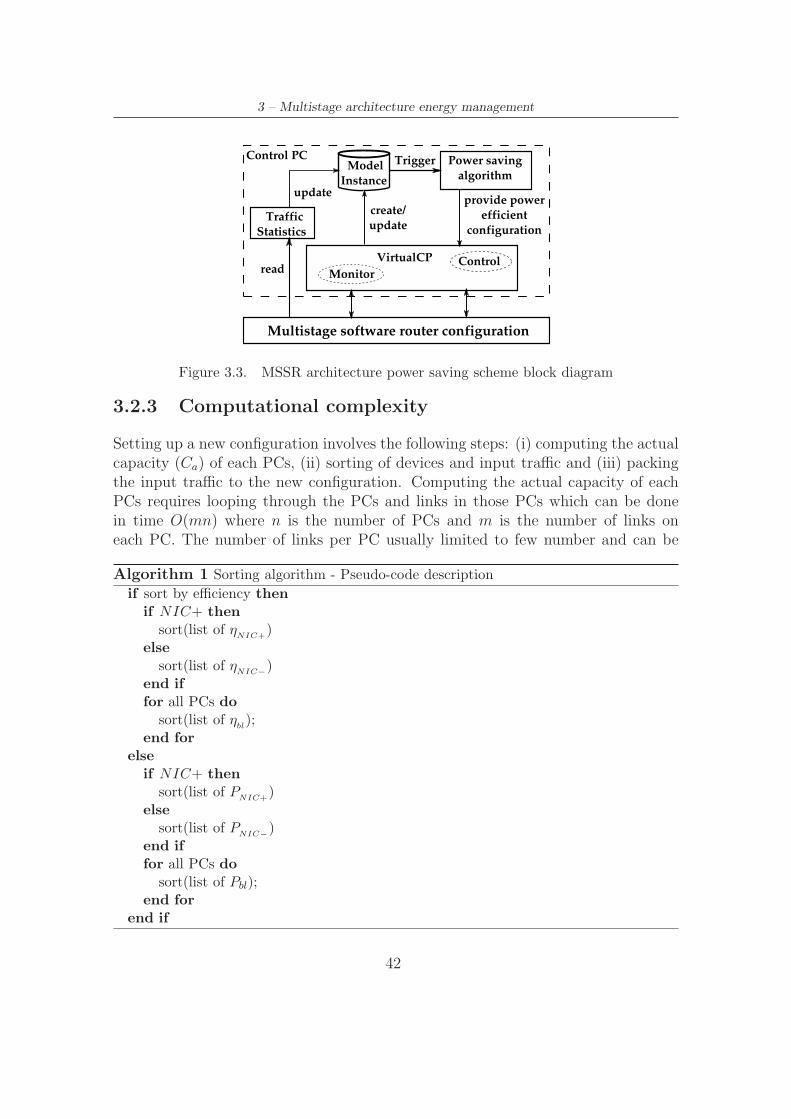
3 – Multistage architecture energy management
Power saving
algorithm
MonitorControl
Traffic
Statistics
Model
Instance
VirtualCP
create/
update
update
read
provide power
efficient
configuration
Trigger
Multistage software router configuration
Control PC
Figure 3.3. MSSR architecture power saving scheme block diagram
3.2.3 Computational complexity
Setting up a new configuration involves the following steps: (i) computing the actualcapacity (Ca) of each PCs, (ii) sorting of devices and input traffic and (iii) packingthe input traffic to the new configuration. Computing the actual capacity of eachPCs requires looping through the PCs and links in those PCs which can be donein time O(mn) where n is the number of PCs and m is the number of links oneach PC. The number of links per PC usually limited to few number and can be
Algorithm 1 Sorting algorithm - Pseudo-code description
if sort by efficiency then
if NIC+ then
sort(list of ηNIC+
)else
sort(list of ηNIC−
)end if
for all PCs dosort(list of η
bl);
end for
else
if NIC+ then
sort(list of PNIC+
)else
sort(list of PNIC−
)end if
for all PCs dosort(list of Pbl);
end for
end if
42

3.2 – On-line algorithm
Algorithm 2 Unsplittable traffic routing - Pseudo-code description
sort(list of flows)sort(list of device)A = 1; //number of active PCs, at least one device to readily give serviceloop
if reconfiguration required then
for All flows f = 1, 2, ..., M do
for All PCs b = 1, 2, ..., N do
for All links l = 1, 2, ... L do
if Flow f fits in link l thenPack flow f in link l ;break;
end if
end for
if Flow f packed then
break;end if
end for
if Flow f did not fit in any A PCs link then
if b is less than N then
Turn on next PC in the listdecrement f ;
else
drop flow f ;end if
end if
end for
if b less than A then
extra PCs = A - b;switch off extra PCs;
end if
A = b;end if
end loop
considered as a constant. Thus actual capacity computation can be performed in atime O(n). Considering merge sort, sorting devices and input traffic (in case of flowbased routing), can be done in worst case in a time O(nlogn) [67]. We implementeda first-fit-decreasing algorithms for packing which has a worst case running time ofO(nlogn) [68]. Summarizing the three steps, a configuration choice can be performedin a time O(n + nlogn + nlogn) = O(nlogn) which scales logarithmically in thenumber of flows and PCs.
43
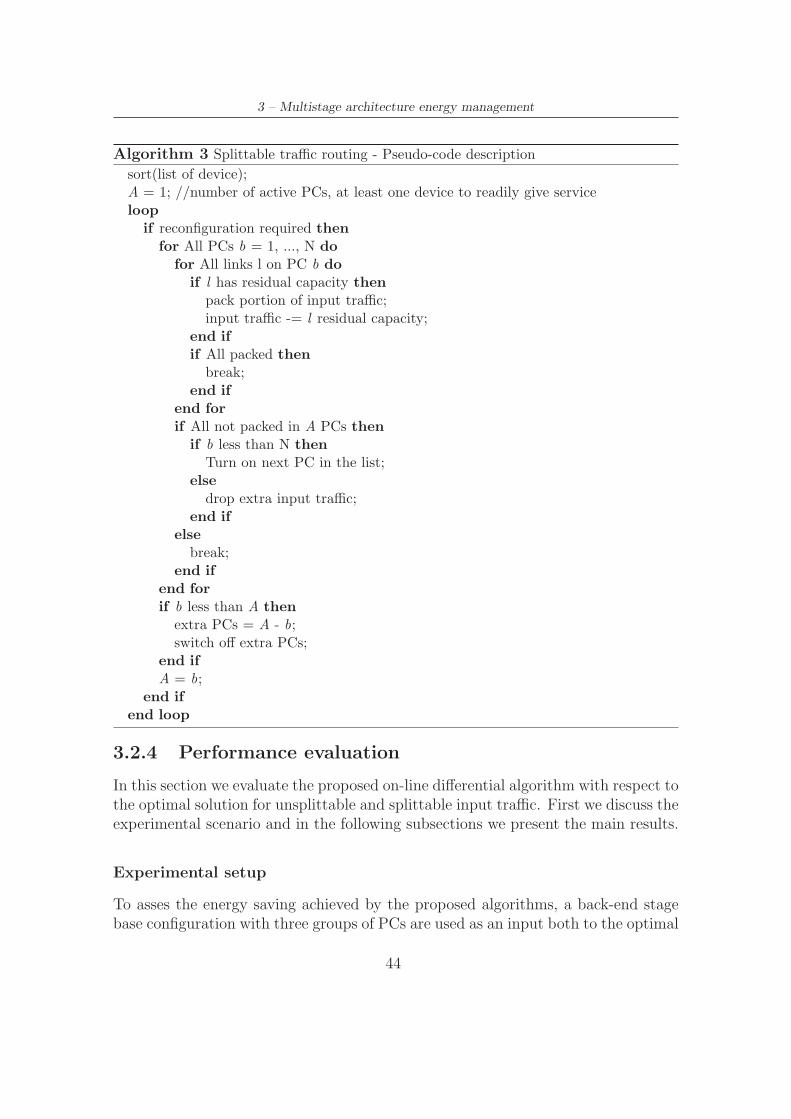
3 – Multistage architecture energy management
Algorithm 3 Splittable traffic routing - Pseudo-code description
sort(list of device);A = 1; //number of active PCs, at least one device to readily give serviceloop
if reconfiguration required then
for All PCs b = 1, ..., N do
for All links l on PC b do
if l has residual capacity then
pack portion of input traffic;input traffic -= l residual capacity;
end if
if All packed then
break;end if
end for
if All not packed in A PCs thenif b less than N then
Turn on next PC in the list;else
drop extra input traffic;end if
else
break;end if
end for
if b less than A then
extra PCs = A - b;switch off extra PCs;
end if
A = b;end if
end loop
3.2.4 Performance evaluation
In this section we evaluate the proposed on-line differential algorithm with respect tothe optimal solution for unsplittable and splittable input traffic. First we discuss theexperimental scenario and in the following subsections we present the main results.
Experimental setup
To asses the energy saving achieved by the proposed algorithms, a back-end stagebase configuration with three groups of PCs are used as an input both to the optimal
44
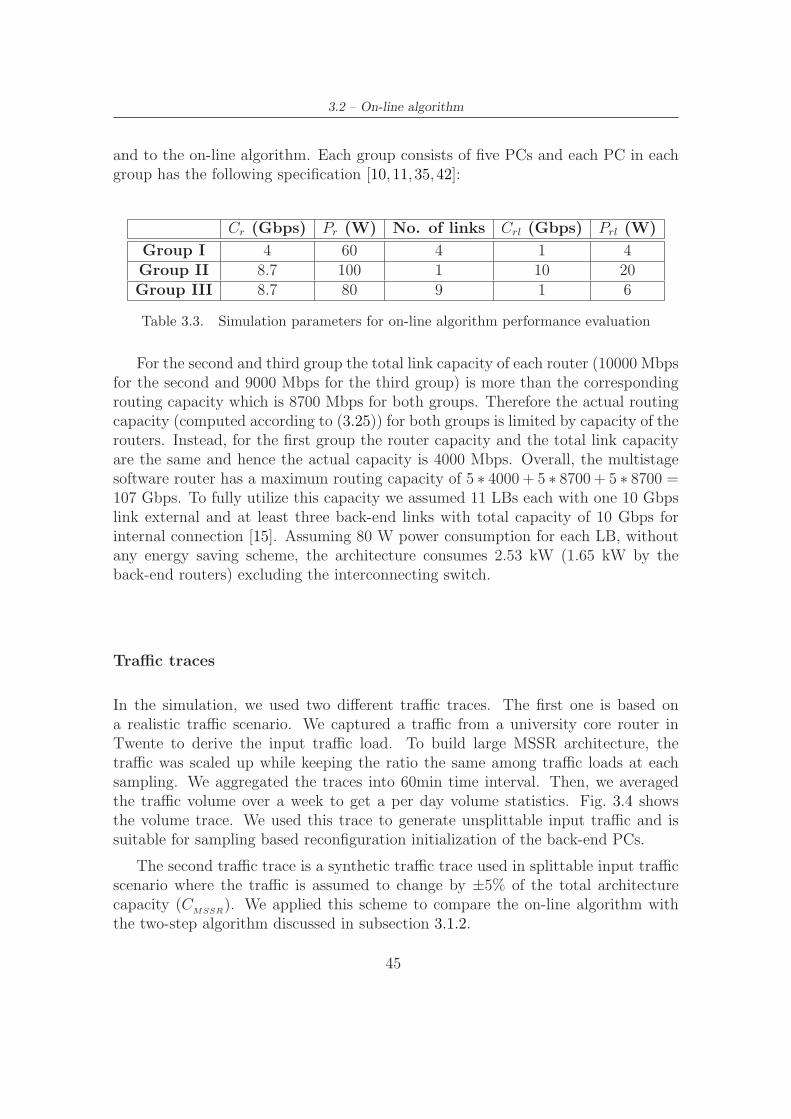
3.2 – On-line algorithm
and to the on-line algorithm. Each group consists of five PCs and each PC in eachgroup has the following specification [10,11,35,42]:
Cr (Gbps) Pr (W) No. of links Crl (Gbps) Prl (W)
Group I 4 60 4 1 4Group II 8.7 100 1 10 20Group III 8.7 80 9 1 6
Table 3.3. Simulation parameters for on-line algorithm performance evaluation
For the second and third group the total link capacity of each router (10000 Mbpsfor the second and 9000 Mbps for the third group) is more than the correspondingrouting capacity which is 8700 Mbps for both groups. Therefore the actual routingcapacity (computed according to (3.25)) for both groups is limited by capacity of therouters. Instead, for the first group the router capacity and the total link capacityare the same and hence the actual capacity is 4000 Mbps. Overall, the multistagesoftware router has a maximum routing capacity of 5 ∗ 4000 + 5 ∗ 8700 + 5 ∗ 8700 =107 Gbps. To fully utilize this capacity we assumed 11 LBs each with one 10 Gbpslink external and at least three back-end links with total capacity of 10 Gbps forinternal connection [15]. Assuming 80 W power consumption for each LB, withoutany energy saving scheme, the architecture consumes 2.53 kW (1.65 kW by theback-end routers) excluding the interconnecting switch.
Traffic traces
In the simulation, we used two different traffic traces. The first one is based ona realistic traffic scenario. We captured a traffic from a university core router inTwente to derive the input traffic load. To build large MSSR architecture, thetraffic was scaled up while keeping the ratio the same among traffic loads at eachsampling. We aggregated the traces into 60min time interval. Then, we averagedthe traffic volume over a week to get a per day volume statistics. Fig. 3.4 showsthe volume trace. We used this trace to generate unsplittable input traffic and issuitable for sampling based reconfiguration initialization of the back-end PCs.
The second traffic trace is a synthetic traffic trace used in splittable input trafficscenario where the traffic is assumed to change by ±5% of the total architecturecapacity (C
MSSR). We applied this scheme to compare the on-line algorithm with
the two-step algorithm discussed in subsection 3.1.2.
45

3 – Multistage architecture energy management
40
50
60
70
80
90
100
110
0 2 4 6 8 10 12 14 16 18 20 22 24
Tot
al tr
affi
c (G
bps)
Time (hours)
60min sampling
Figure 3.4. Input traffic trace used in the experiment
Evaluation metrics
Based on the experimental scenario and the input traffic traces, we compare theproposed energy saving on-line algorithm with respect to the optimal off-line algo-rithm and with an on-line heuristic version that is not sorting PCs in terms of energyconsumption. We also compare the different algorithms in terms of the differencebetween two consecutive configurations.
An energy consumption of the back-end routers over a given period is obtainedfrom power dissipation curves as:
Energy = power× time (3.32)
This is equivalent to compute the area under each power curve. Both the powerdissipation and a derivate energy consumption of the back-end PCs configurationdefined by each algorithms will be reported.
The configuration difference, expressed as the difference between two consecutiveback-end PCs configuration in terms of number of PCs, is a measure of serviceinterruption or delay. Turning off some devices in the current configuration duringthe reconfiguration step, means that the capacity of the MSSR decreases by thenumber of devices turned off until the new configuration come on-line resulting isservice interruption temporarily.
We also consider the two router sorting policies NIC+ and NIC- to highlightthe impact of link power when sorting PCs. Accordingly, results from the followingalgorithms will be presented for both splittable and unsplittable input traffic:
• Optimal: back-end PCs configuration solved optimally. We used CPLEX [64]to solve Equations (3.20) - (3.24)
46

3.2 – On-line algorithm
• ηNIC+
: an on-line heuristic that sort devices according to their efficiency andconsiders link consumption in PC sorting
• ηNIC−
: same as ηNIC+
but does not consider link consumption in PC sorting
• PNIC+
: an on-line heuristic that sort devices according to their power dissipa-tion and considers link consumption in PC sorting
• PNIC−
: same as PNIC+
but does not consider link consumption in PC sorting
• Random: on-line heuristics without device sorting scheme
Recall that saving for LBs are not considered, as discussed in Sec. 3. Therefore,the results presented include only the back-end PCs configuration. The resultsreported are average over 5 runs for each scenario under unsplittable input trafficconsidering the amount of time it took us to solve the optimal problem. For splittableinput traffic we averaged the results over 10 runs since it is much faster to solve theoptimal problem under this scenario.
Results: Unsplittable input traffic
In unsplittable input traffic scenario, we consider sampling based MSSR reconfig-uration initialization as discussed in Sec. 3.2.2 and Sec. 3.2.4. That is we samplethe input traffic every given sampling interval and reconfigure the back-end PCsto handle the sampled traffic. This configuration lasts for the sampling interval.For this simulation we choose the realistic traffic trace depicted in Fig. 3.4 but itis equally applicable for synthetic traffic scenario. The unsplittable traffic is com-posed of mainly smaller and larger flows. A parameter α (and β = 1 − α) definesthe proportion of smaller and larger flows to be used in a given simulation. In oneextreme we choose large amount of smaller flows and in the other large amount oflarger flows to see the impact of flow sizes on the proposed algorithm. Thus thefollowing α are defined:
• α = 0.2,β = 0.8 - more number of larger flows
• α = 0.5,β = 0.5 - same proportion of smaller and larger flows
• α = 0.8,β = 0.2 - more number of smaller flows
At each sampling time, for each defined α, we generate flows such that the sumequal to a traffic volume (See Fig. 3.4) at that sampling time. Smaller flows areuniformly generated from 1 Mbits to 10 Mbits and larger flows from 50 Mbits to100 Mbits. The first scenario is used to evaluate the algorithms under worst casesince packing larger flows results in less efficiency. In the following we present detail
47

3 – Multistage architecture energy management
600
800
1000
1200
1400
1600
1800
0 5 10 15 20
Pow
er (
Wat
ts)
Time (Hrs)
α=0.2
Optimal
ηNIC+
PNIC+
Random
No scheme
(a) Load proportional power dissipation
15
20
25
30
15 16 17 18 19 20 21 22 23
Ene
rgy
cons
umpt
ion
(KW
h)
Time (Hrs)
α=0.2
Optimal
ηNIC+
PNIC+
Random
0
4
8
12
16
0 5 10 15
(b) Energy consumption over 24 hours
Figure 3.5. Comparison of different algorithms for unsplittable input traffic
results for unsplittable input traffic generated as per the defined α and β. Note thatat full load it is possible all the flows might not be served even under optimal packingbecause of some capacity wastage in each PCs during packing. Fig. 3.5(a) reports thepower dissipation of the back-end PCs configuration set up by different energy savingalgorithms for α = 0.2. The on-line algorithms (labeled η
NIC+and P
NIC+) sorts the
back-end PCs considering their link consumption as discussed in Sec. 3.2.2. Thefigure shows that the power dissipation of the back-end PCs configurations definedby different algorithms is proportional to the load demand. However the powersaving that can be achieved by the different algorithms differs. The power savingby each algorithm can be computed as the gap between the power dissipation of thearchitecture if no power saving scheme is deployed, the curve labeled ”No scheme”,and the power dissipation of the architecture defined by each algorithm. Fig. 3.5(b)and Fig. 3.6 confirms the claim that each algorithm saves different amount of power.Fig. 3.5(b) depicts the energy consumption of the back-end PCs configuration over24 hours as given by (3.32). The figure is magnified over the time range 15 to 23while the smaller inset in Fig. 3.5(b) shows the remaining part for the time range 0to 15.
It clearly shows that the saving by the ηNIC+
algorithm is as good as the optimaland that of P
NIC+is just as worse as the unsorted case. η
NIC+on-line algorithm
is successful because in sorting the PCs it can globally see which PCs are moreefficient than the others. This algorithm losses against the optimal because of thelast PC choice for a given configuration. The choice of the PCs in setting up aconfiguration for η
NIC+is influenced by the sorting algorithm. That is the algorithm
does not have a freedom to choose the last device in a configuration, even if it is lessloaded. Therefore the capacity wastage is translated into energy inefficiency. Whilethe global view of devices is also true for P
NIC+algorithm, it does so from power
consumption point of view. But least power consumption does not, in general,
48
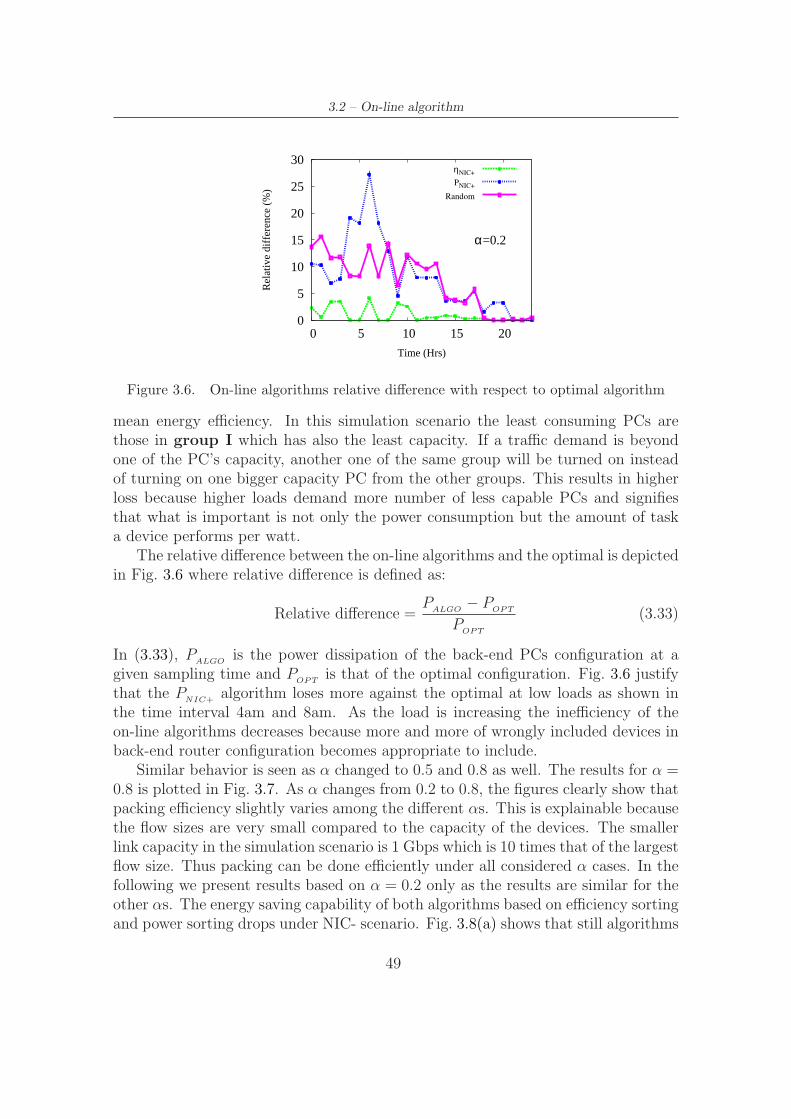
3.2 – On-line algorithm
0
5
10
15
20
25
30
0 5 10 15 20
Rel
ativ
e di
ffer
ence
(%
)
Time (Hrs)
α=0.2
ηNIC+
PNIC+
Random
Figure 3.6. On-line algorithms relative difference with respect to optimal algorithm
mean energy efficiency. In this simulation scenario the least consuming PCs arethose in group I which has also the least capacity. If a traffic demand is beyondone of the PC’s capacity, another one of the same group will be turned on insteadof turning on one bigger capacity PC from the other groups. This results in higherloss because higher loads demand more number of less capable PCs and signifiesthat what is important is not only the power consumption but the amount of taska device performs per watt.
The relative difference between the on-line algorithms and the optimal is depictedin Fig. 3.6 where relative difference is defined as:
Relative difference =P
ALGO− P
OPT
POPT
(3.33)
In (3.33), PALGO
is the power dissipation of the back-end PCs configuration at agiven sampling time and P
OPTis that of the optimal configuration. Fig. 3.6 justify
that the PNIC+
algorithm loses more against the optimal at low loads as shown inthe time interval 4am and 8am. As the load is increasing the inefficiency of theon-line algorithms decreases because more and more of wrongly included devices inback-end router configuration becomes appropriate to include.
Similar behavior is seen as α changed to 0.5 and 0.8 as well. The results for α =0.8 is plotted in Fig. 3.7. As α changes from 0.2 to 0.8, the figures clearly show thatpacking efficiency slightly varies among the different αs. This is explainable becausethe flow sizes are very small compared to the capacity of the devices. The smallerlink capacity in the simulation scenario is 1 Gbps which is 10 times that of the largestflow size. Thus packing can be done efficiently under all considered α cases. In thefollowing we present results based on α = 0.2 only as the results are similar for theother αs. The energy saving capability of both algorithms based on efficiency sortingand power sorting drops under NIC- scenario. Fig. 3.8(a) shows that still algorithms
49
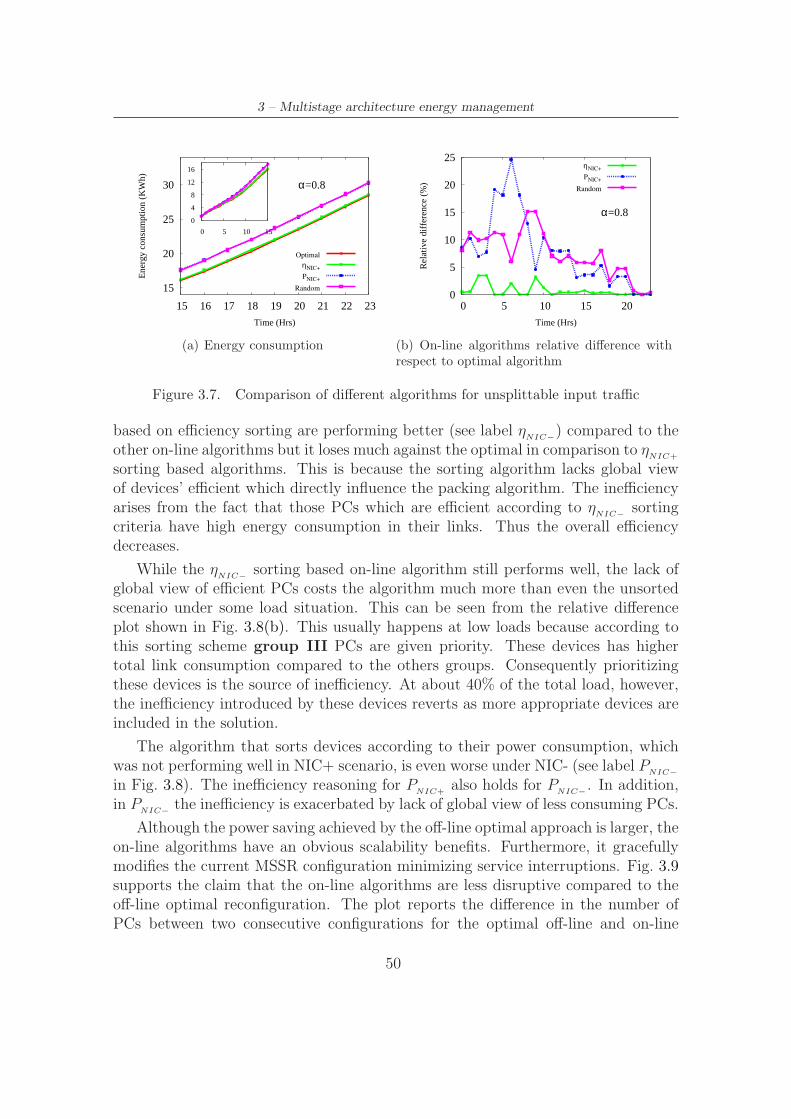
3 – Multistage architecture energy management
15
20
25
30
15 16 17 18 19 20 21 22 23
Ene
rgy
cons
umpt
ion
(KW
h)
Time (Hrs)
α=0.8
Optimal
ηNIC+
PNIC+
Random
0
4
8
12
16
0 5 10 15
(a) Energy consumption
0
5
10
15
20
25
0 5 10 15 20
Rel
ativ
e di
ffer
ence
(%
)
Time (Hrs)
α=0.8
ηNIC+
PNIC+
Random
(b) On-line algorithms relative difference withrespect to optimal algorithm
Figure 3.7. Comparison of different algorithms for unsplittable input traffic
based on efficiency sorting are performing better (see label ηNIC−
) compared to theother on-line algorithms but it loses much against the optimal in comparison to η
NIC+
sorting based algorithms. This is because the sorting algorithm lacks global viewof devices’ efficient which directly influence the packing algorithm. The inefficiencyarises from the fact that those PCs which are efficient according to η
NIC−
sortingcriteria have high energy consumption in their links. Thus the overall efficiencydecreases.
While the ηNIC−
sorting based on-line algorithm still performs well, the lack ofglobal view of efficient PCs costs the algorithm much more than even the unsortedscenario under some load situation. This can be seen from the relative differenceplot shown in Fig. 3.8(b). This usually happens at low loads because according tothis sorting scheme group III PCs are given priority. These devices has highertotal link consumption compared to the others groups. Consequently prioritizingthese devices is the source of inefficiency. At about 40% of the total load, however,the inefficiency introduced by these devices reverts as more appropriate devices areincluded in the solution.
The algorithm that sorts devices according to their power consumption, whichwas not performing well in NIC+ scenario, is even worse under NIC- (see label P
NIC−
in Fig. 3.8). The inefficiency reasoning for PNIC+
also holds for PNIC−
. In addition,in P
NIC−
the inefficiency is exacerbated by lack of global view of less consuming PCs.
Although the power saving achieved by the off-line optimal approach is larger, theon-line algorithms have an obvious scalability benefits. Furthermore, it gracefullymodifies the current MSSR configuration minimizing service interruptions. Fig. 3.9supports the claim that the on-line algorithms are less disruptive compared to theoff-line optimal reconfiguration. The plot reports the difference in the number ofPCs between two consecutive configurations for the optimal off-line and on-line
50
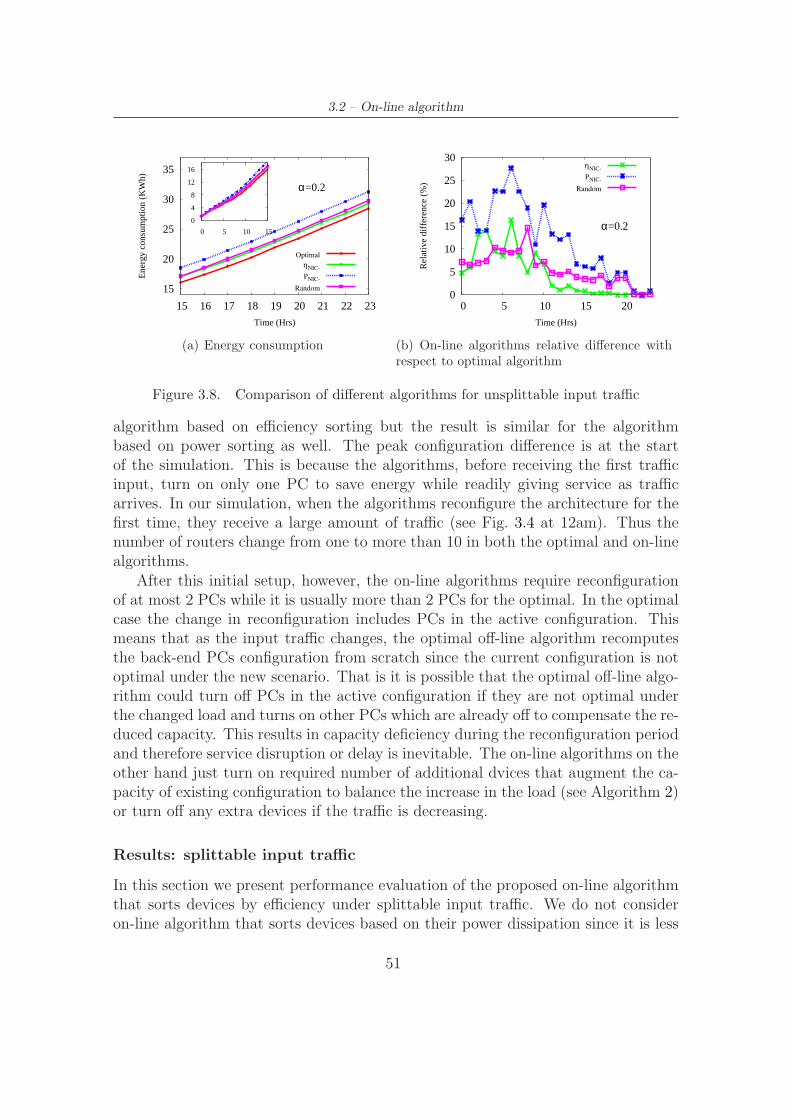
3.2 – On-line algorithm
15
20
25
30
35
15 16 17 18 19 20 21 22 23
Ene
rgy
cons
umpt
ion
(KW
h)
Time (Hrs)
α=0.2
Optimal
ηNIC-
PNIC-
Random
0
4
8
12
16
0 5 10 15
(a) Energy consumption
0
5
10
15
20
25
30
0 5 10 15 20
Rel
ativ
e di
ffer
ence
(%
)
Time (Hrs)
α=0.2
ηNIC-
PNIC-
Random
(b) On-line algorithms relative difference withrespect to optimal algorithm
Figure 3.8. Comparison of different algorithms for unsplittable input traffic
algorithm based on efficiency sorting but the result is similar for the algorithmbased on power sorting as well. The peak configuration difference is at the startof the simulation. This is because the algorithms, before receiving the first trafficinput, turn on only one PC to save energy while readily giving service as trafficarrives. In our simulation, when the algorithms reconfigure the architecture for thefirst time, they receive a large amount of traffic (see Fig. 3.4 at 12am). Thus thenumber of routers change from one to more than 10 in both the optimal and on-linealgorithms.
After this initial setup, however, the on-line algorithms require reconfigurationof at most 2 PCs while it is usually more than 2 PCs for the optimal. In the optimalcase the change in reconfiguration includes PCs in the active configuration. Thismeans that as the input traffic changes, the optimal off-line algorithm recomputesthe back-end PCs configuration from scratch since the current configuration is notoptimal under the new scenario. That is it is possible that the optimal off-line algo-rithm could turn off PCs in the active configuration if they are not optimal underthe changed load and turns on other PCs which are already off to compensate the re-duced capacity. This results in capacity deficiency during the reconfiguration periodand therefore service disruption or delay is inevitable. The on-line algorithms on theother hand just turn on required number of additional dvices that augment the ca-pacity of existing configuration to balance the increase in the load (see Algorithm 2)or turn off any extra devices if the traffic is decreasing.
Results: splittable input traffic
In this section we present performance evaluation of the proposed on-line algorithmthat sorts devices by efficiency under splittable input traffic. We do not consideron-line algorithm that sorts devices based on their power dissipation since it is less
51
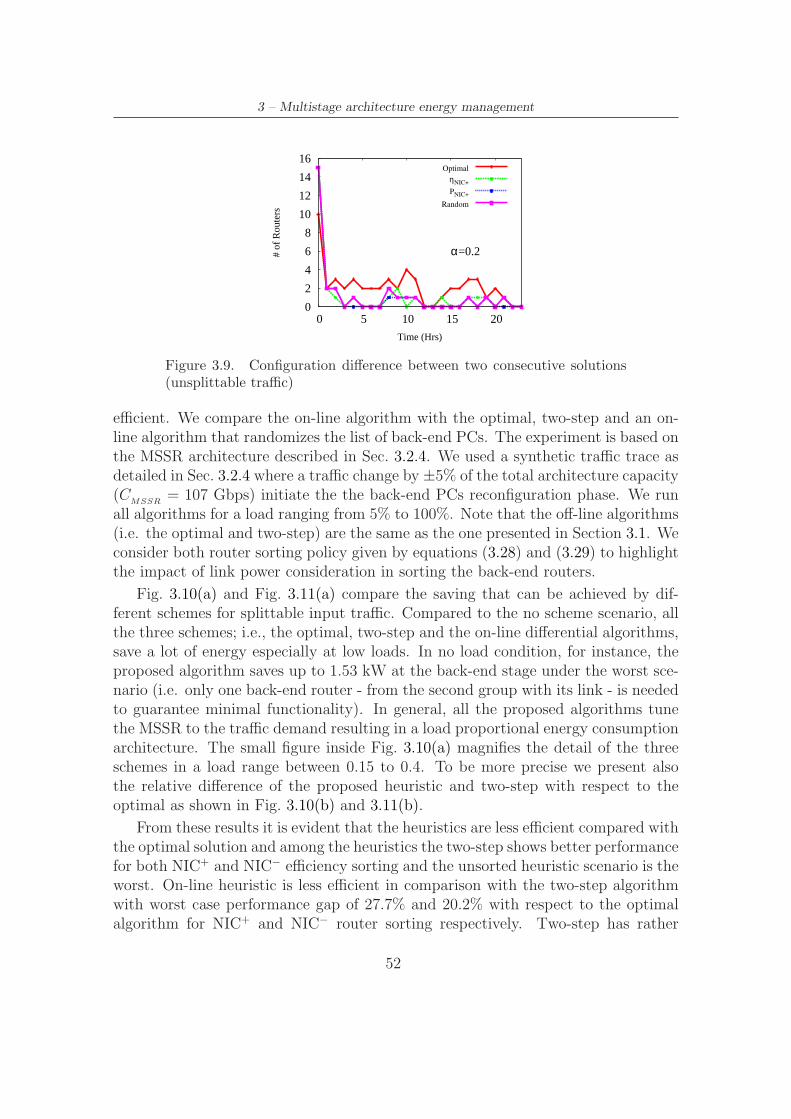
3 – Multistage architecture energy management
0
2
4
6
8
10
12
14
16
0 5 10 15 20
# of
Rou
ters
Time (Hrs)
α=0.2
Optimal
ηNIC+
PNIC+
Random
Figure 3.9. Configuration difference between two consecutive solutions(unsplittable traffic)
efficient. We compare the on-line algorithm with the optimal, two-step and an on-line algorithm that randomizes the list of back-end PCs. The experiment is based onthe MSSR architecture described in Sec. 3.2.4. We used a synthetic traffic trace asdetailed in Sec. 3.2.4 where a traffic change by ±5% of the total architecture capacity(C
MSSR= 107 Gbps) initiate the the back-end PCs reconfiguration phase. We run
all algorithms for a load ranging from 5% to 100%. Note that the off-line algorithms(i.e. the optimal and two-step) are the same as the one presented in Section 3.1. Weconsider both router sorting policy given by equations (3.28) and (3.29) to highlightthe impact of link power consideration in sorting the back-end routers.
Fig. 3.10(a) and Fig. 3.11(a) compare the saving that can be achieved by dif-ferent schemes for splittable input traffic. Compared to the no scheme scenario, allthe three schemes; i.e., the optimal, two-step and the on-line differential algorithms,save a lot of energy especially at low loads. In no load condition, for instance, theproposed algorithm saves up to 1.53 kW at the back-end stage under the worst sce-nario (i.e. only one back-end router - from the second group with its link - is neededto guarantee minimal functionality). In general, all the proposed algorithms tunethe MSSR to the traffic demand resulting in a load proportional energy consumptionarchitecture. The small figure inside Fig. 3.10(a) magnifies the detail of the threeschemes in a load range between 0.15 to 0.4. To be more precise we present alsothe relative difference of the proposed heuristic and two-step with respect to theoptimal as shown in Fig. 3.10(b) and 3.11(b).
From these results it is evident that the heuristics are less efficient compared withthe optimal solution and among the heuristics the two-step shows better performancefor both NIC+ and NIC− efficiency sorting and the unsorted heuristic scenario is theworst. On-line heuristic is less efficient in comparison with the two-step algorithmwith worst case performance gap of 27.7% and 20.2% with respect to the optimalalgorithm for NIC+ and NIC− router sorting respectively. Two-step has rather
52
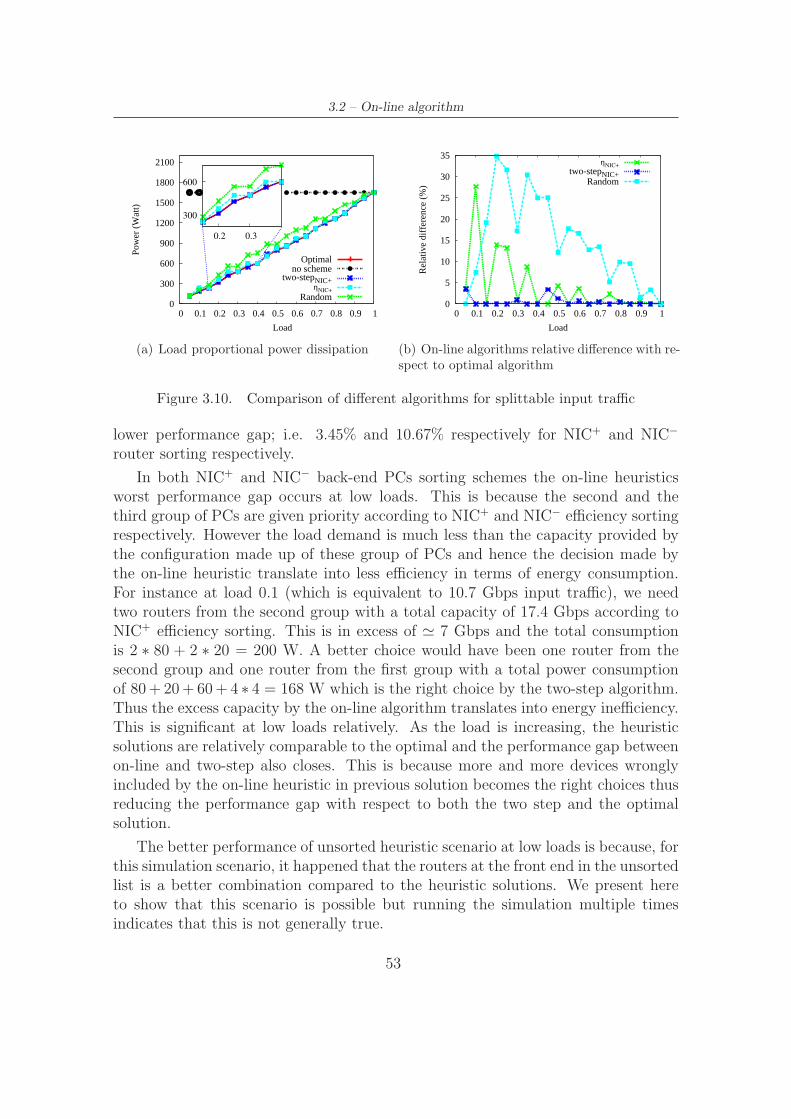
3.2 – On-line algorithm
0
300
600
900
1200
1500
1800
2100
0 0.1 0.2 0.3 0.4 0.5 0.6 0.7 0.8 0.9 1
Pow
er (
Wat
t)
Load
Optimalno scheme
two-stepNIC+ηNIC+
Random
300
600
0.2 0.3
(a) Load proportional power dissipation
0
5
10
15
20
25
30
35
0 0.1 0.2 0.3 0.4 0.5 0.6 0.7 0.8 0.9 1
Rel
ativ
e di
ffer
ence
(%
)
Load
ηNIC+
two-stepNIC+Random
(b) On-line algorithms relative difference with re-spect to optimal algorithm
Figure 3.10. Comparison of different algorithms for splittable input traffic
lower performance gap; i.e. 3.45% and 10.67% respectively for NIC+ and NIC−
router sorting respectively.
In both NIC+ and NIC− back-end PCs sorting schemes the on-line heuristicsworst performance gap occurs at low loads. This is because the second and thethird group of PCs are given priority according to NIC+ and NIC− efficiency sortingrespectively. However the load demand is much less than the capacity provided bythe configuration made up of these group of PCs and hence the decision made bythe on-line heuristic translate into less efficiency in terms of energy consumption.For instance at load 0.1 (which is equivalent to 10.7 Gbps input traffic), we needtwo routers from the second group with a total capacity of 17.4 Gbps according toNIC+ efficiency sorting. This is in excess of ≃ 7 Gbps and the total consumptionis 2 ∗ 80 + 2 ∗ 20 = 200 W. A better choice would have been one router from thesecond group and one router from the first group with a total power consumptionof 80+ 20+ 60+ 4 ∗ 4 = 168 W which is the right choice by the two-step algorithm.Thus the excess capacity by the on-line algorithm translates into energy inefficiency.This is significant at low loads relatively. As the load is increasing, the heuristicsolutions are relatively comparable to the optimal and the performance gap betweenon-line and two-step also closes. This is because more and more devices wronglyincluded by the on-line heuristic in previous solution becomes the right choices thusreducing the performance gap with respect to both the two step and the optimalsolution.
The better performance of unsorted heuristic scenario at low loads is because, forthis simulation scenario, it happened that the routers at the front end in the unsortedlist is a better combination compared to the heuristic solutions. We present hereto show that this scenario is possible but running the simulation multiple timesindicates that this is not generally true.
53
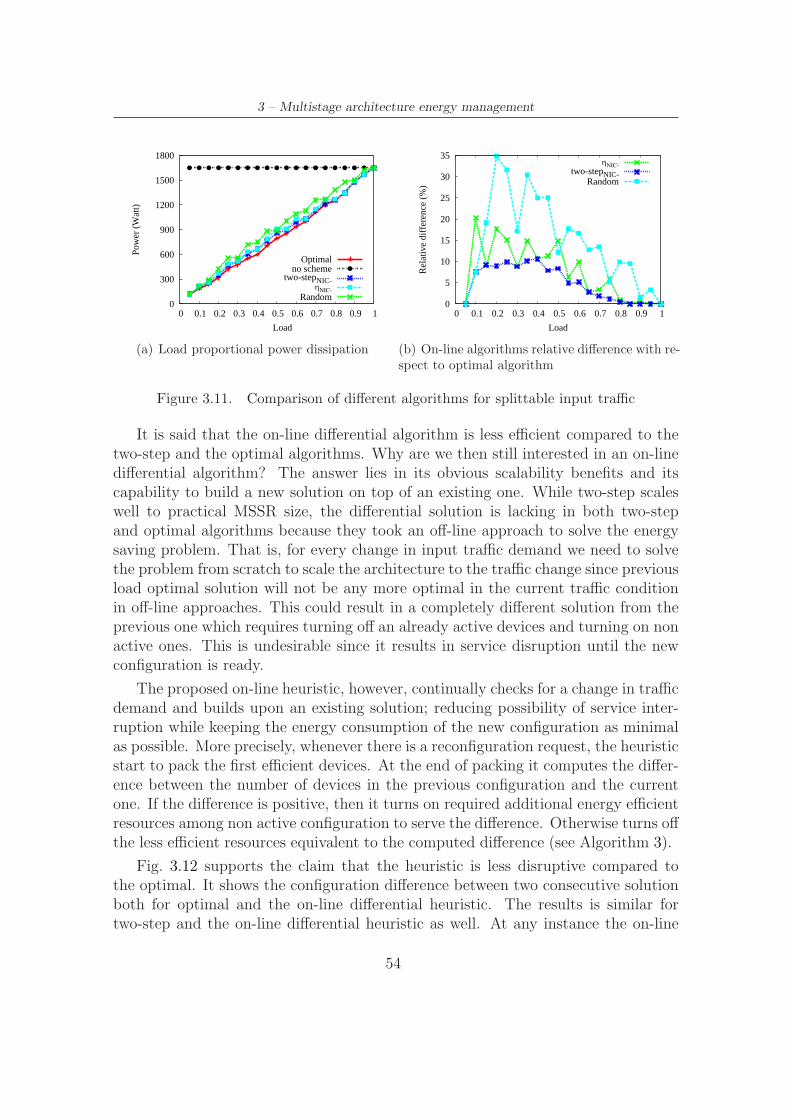
3 – Multistage architecture energy management
0
300
600
900
1200
1500
1800
0 0.1 0.2 0.3 0.4 0.5 0.6 0.7 0.8 0.9 1
Pow
er (
Wat
t)
Load
Optimalno scheme
two-stepNIC-ηNIC-
Random
(a) Load proportional power dissipation
0
5
10
15
20
25
30
35
0 0.1 0.2 0.3 0.4 0.5 0.6 0.7 0.8 0.9 1
Rel
ativ
e di
ffer
ence
(%
)
Load
ηNIC-
two-stepNIC-Random
(b) On-line algorithms relative difference with re-spect to optimal algorithm
Figure 3.11. Comparison of different algorithms for splittable input traffic
It is said that the on-line differential algorithm is less efficient compared to thetwo-step and the optimal algorithms. Why are we then still interested in an on-linedifferential algorithm? The answer lies in its obvious scalability benefits and itscapability to build a new solution on top of an existing one. While two-step scaleswell to practical MSSR size, the differential solution is lacking in both two-stepand optimal algorithms because they took an off-line approach to solve the energysaving problem. That is, for every change in input traffic demand we need to solvethe problem from scratch to scale the architecture to the traffic change since previousload optimal solution will not be any more optimal in the current traffic conditionin off-line approaches. This could result in a completely different solution from theprevious one which requires turning off an already active devices and turning on nonactive ones. This is undesirable since it results in service disruption until the newconfiguration is ready.
The proposed on-line heuristic, however, continually checks for a change in trafficdemand and builds upon an existing solution; reducing possibility of service inter-ruption while keeping the energy consumption of the new configuration as minimalas possible. More precisely, whenever there is a reconfiguration request, the heuristicstart to pack the first efficient devices. At the end of packing it computes the differ-ence between the number of devices in the previous configuration and the currentone. If the difference is positive, then it turns on required additional energy efficientresources among non active configuration to serve the difference. Otherwise turns offthe less efficient resources equivalent to the computed difference (see Algorithm 3).
Fig. 3.12 supports the claim that the heuristic is less disruptive compared tothe optimal. It shows the configuration difference between two consecutive solutionboth for optimal and the on-line differential heuristic. The results is similar fortwo-step and the on-line differential heuristic as well. At any instance the on-line
54
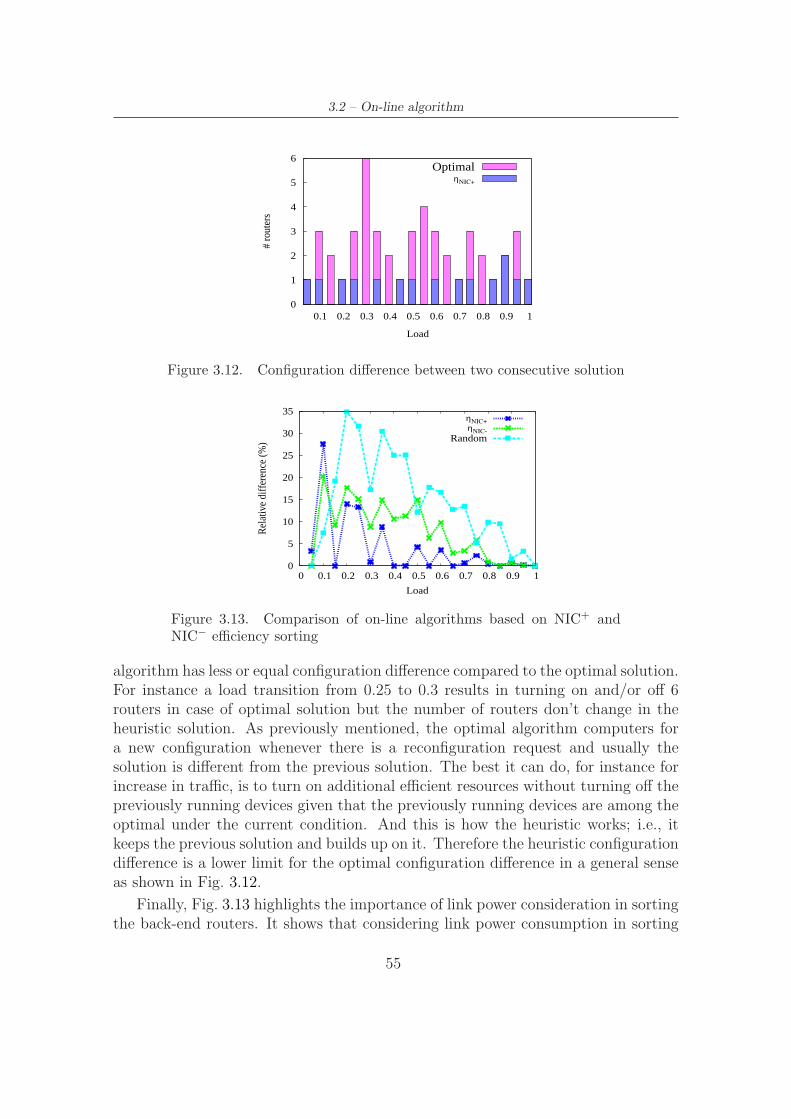
3.2 – On-line algorithm
0
1
2
3
4
5
6
0.1 0.2 0.3 0.4 0.5 0.6 0.7 0.8 0.9 1
# ro
uter
s
Load
OptimalηNIC+
Figure 3.12. Configuration difference between two consecutive solution
0
5
10
15
20
25
30
35
0 0.1 0.2 0.3 0.4 0.5 0.6 0.7 0.8 0.9 1
Rel
ativ
e di
ffer
ence
(%)
Load
ηNIC+
ηNIC-
Random
Figure 3.13. Comparison of on-line algorithms based on NIC+ andNIC− efficiency sorting
algorithm has less or equal configuration difference compared to the optimal solution.For instance a load transition from 0.25 to 0.3 results in turning on and/or off 6routers in case of optimal solution but the number of routers don’t change in theheuristic solution. As previously mentioned, the optimal algorithm computers fora new configuration whenever there is a reconfiguration request and usually thesolution is different from the previous solution. The best it can do, for instance forincrease in traffic, is to turn on additional efficient resources without turning off thepreviously running devices given that the previously running devices are among theoptimal under the current condition. And this is how the heuristic works; i.e., itkeeps the previous solution and builds up on it. Therefore the heuristic configurationdifference is a lower limit for the optimal configuration difference in a general senseas shown in Fig. 3.12.
Finally, Fig. 3.13 highlights the importance of link power consideration in sortingthe back-end routers. It shows that considering link power consumption in sorting
55

3 – Multistage architecture energy management
routers improves the efficiency of the on-line heuristic except the unique behaviorseen at very low loads. At this load, among the randomized routers list, routerswith better efficiency have been at the front of the unsorted list favoring unsortedscenario but this is not true in general.
3.3 Conclusions
In this chapter, we presented energy saving algorithms that minimize the energyconsumption of a multistage software router by resizing the architecture to thetraffic demand through proper choose of subset of the back-end routers. We definedan optimal problem and proposed a two-step heuristic to overcome the scalabilityissue related to the optimal algorithm. The simulation results obtained on a realisticscenario show that the solution quality of the proposed scheme is within 9% of theoptimal solution in the worst case considered.
We also presented an energy saving on-line differential algorithm to solve thesame problem. We evaluated the algorithm in relation to the optimal solution andcompared its performance with respect to the two-step approach as well. The resultsshows that, even though the on-line differential heuristic is less optimal comparedto the off-line approaches (both the optimal and two-step algorithms), the savingis still significant in comparison to the no saving scheme. The main advantage ofon-line heuristic lies in its capability to build a new solution upon existing one.This makes the algorithm non disruptive and therefore superior to the off-line ap-proaches in terms of QoS provision. Moreover, it scales well to solve large size MSSRconfiguration.
Finally, all algorithms make MSSR architecture to be energy efficient. That isthe architecture consumes energy proportional to the input traffic load demand.The saving achieved by the proposed algorithms reaches up to 57.44% of the totalarchitecture energy consumption at low loads.
Though the energy saving schemes are defined for multistage software router,the schemes could easily be adapted to other distributed architectures composedof different parts (e.g. a proprietary router with multiple line cards) where energyefficiency of the parts need to be addressed independently.
56
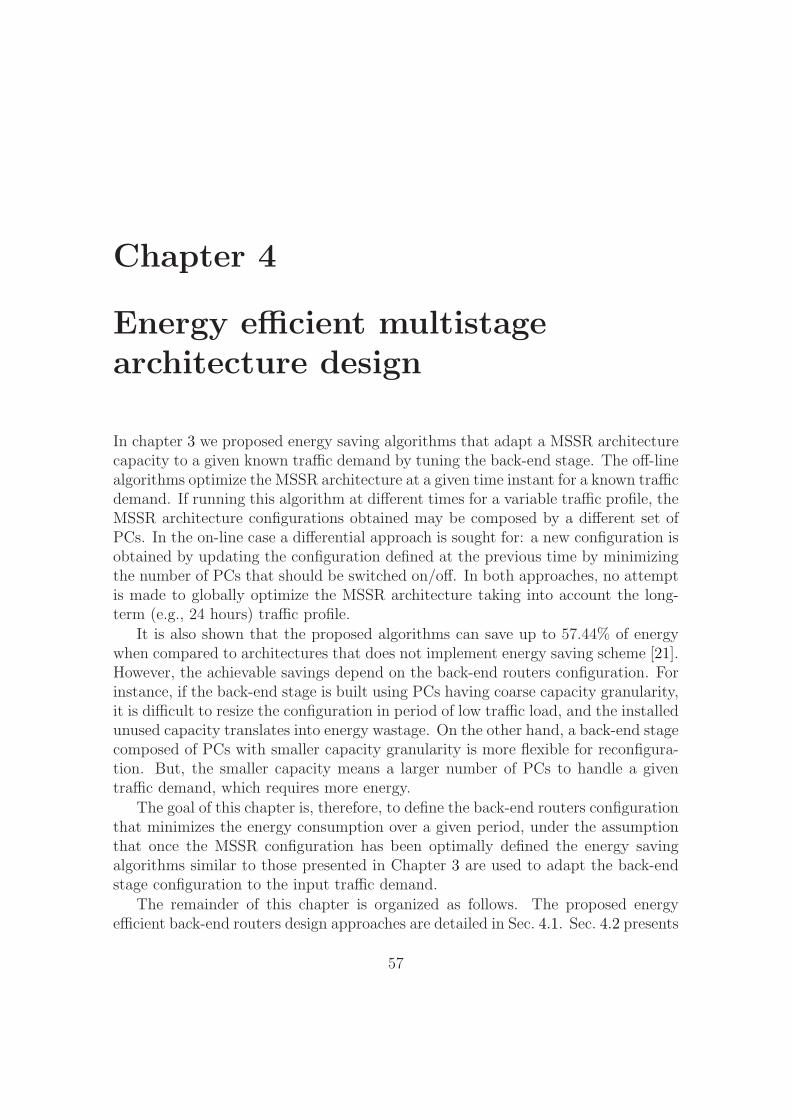
Chapter 4
Energy efficient multistagearchitecture design
In chapter 3 we proposed energy saving algorithms that adapt a MSSR architecturecapacity to a given known traffic demand by tuning the back-end stage. The off-linealgorithms optimize the MSSR architecture at a given time instant for a known trafficdemand. If running this algorithm at different times for a variable traffic profile, theMSSR architecture configurations obtained may be composed by a different set ofPCs. In the on-line case a differential approach is sought for: a new configuration isobtained by updating the configuration defined at the previous time by minimizingthe number of PCs that should be switched on/off. In both approaches, no attemptis made to globally optimize the MSSR architecture taking into account the long-term (e.g., 24 hours) traffic profile.
It is also shown that the proposed algorithms can save up to 57.44% of energywhen compared to architectures that does not implement energy saving scheme [21].However, the achievable savings depend on the back-end routers configuration. Forinstance, if the back-end stage is built using PCs having coarse capacity granularity,it is difficult to resize the configuration in period of low traffic load, and the installedunused capacity translates into energy wastage. On the other hand, a back-end stagecomposed of PCs with smaller capacity granularity is more flexible for reconfigura-tion. But, the smaller capacity means a larger number of PCs to handle a giventraffic demand, which requires more energy.
The goal of this chapter is, therefore, to define the back-end routers configurationthat minimizes the energy consumption over a given period, under the assumptionthat once the MSSR configuration has been optimally defined the energy savingalgorithms similar to those presented in Chapter 3 are used to adapt the back-endstage configuration to the input traffic demand.
The remainder of this chapter is organized as follows. The proposed energyefficient back-end routers design approaches are detailed in Sec. 4.1. Sec. 4.2 presents
57
4 – Energy efficient multistage architecture design
the energy consumption and back-end routers cost comparison of proposed designapproaches with the optimal and existing design methods. Finally we conclude thischapter in Sec. 4.3.
4.1 Energy efficient back-end routers design
Capacity to handle traffic is the basic requirement when designing a high perfor-mance MSSR to satisfy the peak load demand. However, the approach of sizingback-end routers on the peak demand does not translate into energy efficient con-figuration. Given the increasing importance of energy saving in networks, back-endrouter design should consider energy consumption in addition to peak load capac-ity requirement. To achieve this goal, we propose three different back-end routersdesign approaches: a goal programming based methodology, a heuristic and a lo-cally optimal approach, described in detail in the subsections 4.1.1, 4.1.2, and 4.1.3respectively.
All design approaches assumes the following input parameters:
• splittable input traffic Tt ∈ R: an average traffic profile, derived by estimatesor measures, and sampled every time t;
• set of available PCs to be used as back-end routers. Let S be a set of groupsof PCs of different types. Each PC in the same group is characterized by thesame power consumption Pk ∈ R, routing capacity Ck ∈ R, and hardware costWk ∈ R. In the design phase, in each group k ∈ S, PCs are assumed to beavailable in infinite number.
4.1.1 Goal programming design approach
The goal programming design approach models the energy efficient MSSR designas a preemptive goal programming problem. The model has two objectives: energyminimization and cost minimization. The primary objective is to minimize theenergy consumption of the back-end routers over the traffic sampling duration. Thisdefines the the number of PCs, Nk, from each group k to be used as a back-end routerin the MSSR architecture. The problem is constrained by each router capacity anda maximum admissible budget I. The budget constraint is used to keep the MSSR
58
4.1 – Energy efficient back-end routers design
cost under control. The problem is formulated as follows:
minimize
O(t,k) =∑
t
∑
k PkNkαt (4.1)
subject to∑
k CkNkαt ≥ Tt ∀t (4.2)∑
k WkNk ≤ I ∀k ∈ S (4.3)
0 ≤ Nkαt ≤ Nk ∀k ∈ S,∀t, (4.4)
Nk,Nkαt ∈ N
αt ∈ [0,1]
The solution to the optimization problem (4.1) – (4.4) is the number of PCs Nk
from each group k to be used to build the back-end routers configuration. (4.2)adapts Nk by αt ∈ [0,1] defining the suitable Nk composition that satisfies Tt ateach sampling instance t. It takes into account the energy saving algorithms runningafter the initial design phase to adapt the designed configuration to the input trafficdemand Tt. (4.3) ensures that the hardware cost of the selected PCs should notexceed the maximum cost I and (4.4) bounds the number of PCs needed at eachsampling time t within Nk.
The objective function, O(t,k), minimizes the sum of each sampling instanceactive configuration power dissipation. This is equivalent to minimizing the energyconsumption of MSSR architecture over a specified period. Note that the activeconfiguration at time instance t consists of only Nkαt PCs from each group k. Hence,the power dissipation of a MSSR configuration varies for each sampling time t.
If the maximum admissible budget I, which is difficult to set up a priori, is toolarge with respect to traffic needs, the first design phase could result in an over-sizedconfiguration because the optimization target is the energy consumption. This situ-ation may incur unnecessary cost to set up the back-end router configuration. Thus,we define a second step that optimize the cost of the back-end routers by tailoringany possibly over-sized configuration obtained in the first step. To maintain theprimary objective, we enforce the energy cost obtained from the energy optimiza-tion problem as an equality constraint and build the budget optimization model as
59

4 – Energy efficient multistage architecture design
follows:
minimize
O(k) =∑
k WkNk (4.5)
subject to∑
k CkNkαt ≥ Tt ∀t (4.6)
0 ≤ Nkαt ≤ Nk ∀t,∀k ∈ S (4.7)∑
t
∑
k PkNkαt = O(t,k) (4.8)
Nk,Nkαt ∈ N
αt ∈ [0,1]
Constraints (4.6) and (4.7) have the same meaning as in (4.2) and (4.4) respec-tively. (4.8) guarantees that the new back-end routers configuration dissipates thesame power as in the previous phase. As pointed out earlier the primary objectiverepresents the sum of each sampling instance active devices power dissipation. Thusthe cost minimization step, except trimming any excess devices from the configura-tion, should not affect the primary objective. This is achieved through minimizationof the total cost while maintaining the primary objective and satisfying the trafficdemand at each time t which is a problem defined through (4.5) – (4.8).
In summary, equations (4.1) – (4.8) define a preemptive goal programming modelthat minimizes the aggregate energy consumption of back-end routers over a speci-fied period with right cluster cost.
4.1.2 Heuristic design approach
The heuristic approach defines the back-end routers configuration by greedily choos-ing the most efficient PCs until the traffic requirement is satisfied. The PCs efficiencyis defined as performance per unit watt.
ηk =Ck
Pk
(4.9)
Since we assume infinite PCs for each group, only the most efficient group k is usedto build the back-end routers cluster. Thus, the number of PCs, Nk, required tohandle a peak load Tmax is simply computed as:
Nk =
⌈
Tmax
Ck
⌉
(4.10)
whereTmax = max(Tt) (4.11)
60

4.1 – Energy efficient back-end routers design
As discussed in Chapter 2, similar cluster design approaches exist in the literature.The Google cluster architecture [49] considers performance per unit of price as PCsselection criteria to setup a cluster configuration. This approach gives priority tocommodity-class PCs to high-end multi-processor servers because of their cost ad-vantage. The other and most common way of resizing a cluster capacity is to useservers with best absolute performance such that the cluster handles peak load withfewer reliable computers [51,52]. In both cases the clusters have not been analyzedfor power consumption. In the design validation section we will compare the energycost of the clusters designed by these design schemes with those of our proposeddesign techniques.
4.1.3 Locally optimal design approach
This optimal design approach defines the optimal back-end routers configurationconsidering only the peak load. The problem is therefore defined as: given a peakload Tmax as define in (4.11) and a set of group of PCs, S, where each PC in groupk ∈ R is characterized by the same power consumption Pk ∈ R and routing capacityCk ∈ R, select a subset of S within a budget constraint that minimize the powerconsumption of the back-end router configuration and satisfy the peak load demand.It is formulated as follows:
minimize∑
k PkNk (4.12)
subject to∑
k CkNk ≥ Tmax (4.13)∑
k WkNk ≤ I ∀k ∈ S (4.14)
Nk ∈ N
(4.12) – (4.14) is a simplified form of (4.1) – (4.4) with a single sampling time,i.e. the peak load sampling time. Thus the decision variable αt has no meaning andTt is replaced by Tmax. Once the back-end router configuration is set up, i.e. Nk isknown from each group k, then this configuration is used as a basis for the othersampling time t adjusted (by energy saving algorithms deployed after the designstage) to the traffic demand Tt at each sampling instance. Of course this design isnot globally optimal since an optimal configuration in one load condition will not beoptimal (even after adjustment by energy saving algorithms) under another load.
61
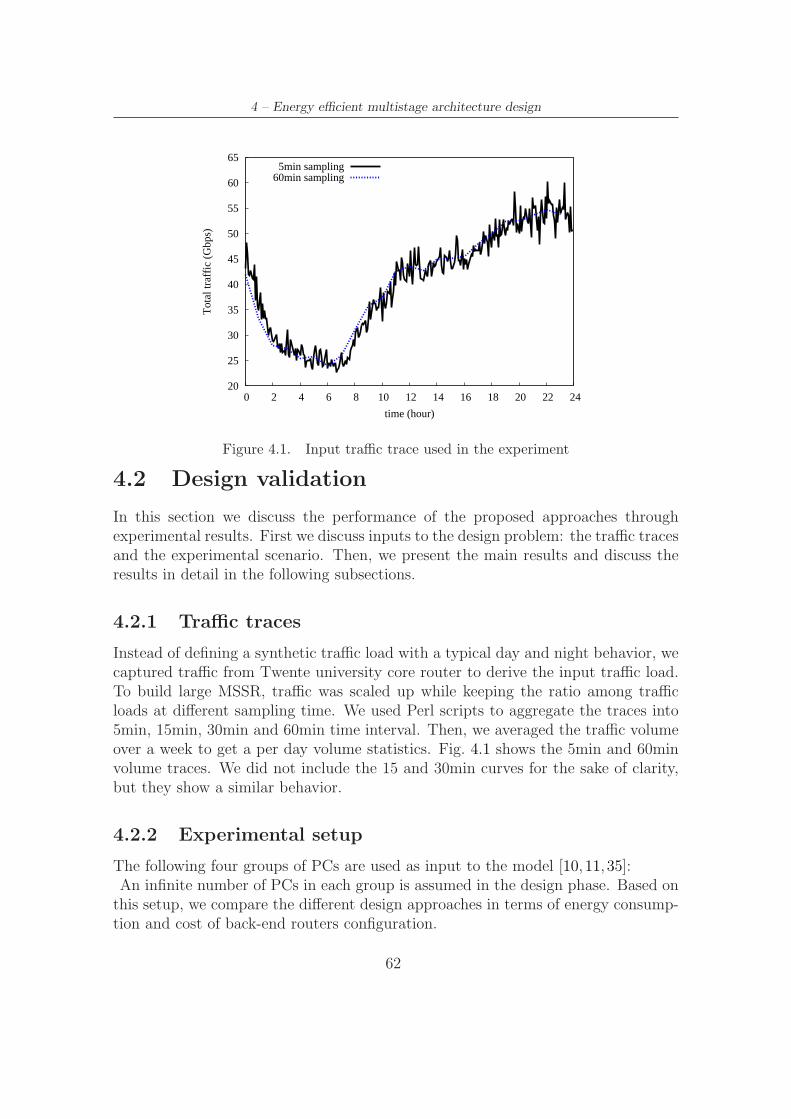
4 – Energy efficient multistage architecture design
20
25
30
35
40
45
50
55
60
65
0 2 4 6 8 10 12 14 16 18 20 22 24
Tot
al tr
affi
c (G
bps)
time (hour)
5min sampling60min sampling
Figure 4.1. Input traffic trace used in the experiment
4.2 Design validation
In this section we discuss the performance of the proposed approaches throughexperimental results. First we discuss inputs to the design problem: the traffic tracesand the experimental scenario. Then, we present the main results and discuss theresults in detail in the following subsections.
4.2.1 Traffic traces
Instead of defining a synthetic traffic load with a typical day and night behavior, wecaptured traffic from Twente university core router to derive the input traffic load.To build large MSSR, traffic was scaled up while keeping the ratio among trafficloads at different sampling time. We used Perl scripts to aggregate the traces into5min, 15min, 30min and 60min time interval. Then, we averaged the traffic volumeover a week to get a per day volume statistics. Fig. 4.1 shows the 5min and 60minvolume traces. We did not include the 15 and 30min curves for the sake of clarity,but they show a similar behavior.
4.2.2 Experimental setup
The following four groups of PCs are used as input to the model [10, 11, 35]:An infinite number of PCs in each group is assumed in the design phase. Based onthis setup, we compare the different design approaches in terms of energy consump-tion and cost of back-end routers configuration.
62

4.2 – Design validation
• Design-I : builds a back-end routers cluster by choosing PCs with highest per-formance/price ratio [49]. As discussed in Chapter 2, this approach minimizethe cost of the cluster which we verify through our simulation. It achieves thisgoal by giving high priority to commodity PCs to set up the cluster becauseof their cost advantage.
• Design-II : builds a back-end routers cluster by choosing PCs with the highestperformance (i.e, routing capacity) [51, 52]. This approach is the most widelyused cluster sizing technique. In this case, the design approach prioritize high-end PCs to take advantage of the absolute performance they provide and toensure hardware reliability.
• Design-III : builds a back-end routers cluster by choosing PCs with the highestperformance/power ratio. This is the heuristic cluster design scheme proposedin this chapter. It orders the group of PCs according to their efficiency (perfor-mance/power ratio) and selects the most efficient group to design the cluster.
• Design-IV : This approach is another design scheme proposed. It designs theback-end routers cluster by locally optimizing the configuration at the peakload. Then this configuration output will be used as a basis for other trafficinput sampled at a different time.
• Design-V,Ix: This is our third back-end routers cluster design scheme. Itsolves the optimization problem defined in (4.1) – (4.8) for different budgetconstraints Ix where x = 1,2,...n and I1 < I2 < ... < In to set up the cluster.
In comparing these design approaches, we derive the energy consumption over aperiod of 24 hours. The optimal solution which is obtained by solving the following
Group ParametersGroup Ck (Mbps) Pk (W) Wk (Units)
I 6500 75 250II 8700 95 400III 10000 120 500IV 8500 92 400
Table 4.1. Group of PCs and corresponding parameters used in the back-end router cluster design
63

4 – Energy efficient multistage architecture design
Integer Linear programming (ILP) model will be used as a reference for comparison:
minimize
Ooptimal =∑
k PkNk (4.15)
subject to∑
k CkNk ≥ Tt (4.16)
Nk ∈ N
Note that we do not have any additional constraint in this model, except to guaranteethe capacity for the traffic load and solved for each sampling time t independently.
We also assume that algorithms similar to those presented in Chapter 3 willbe used to turn on/off PCs at each traffic sampling time to adapt a configurationsetup by the different cluster design schemes to the traffic demand. To avoid anyapproximations, however, we rely on CPLEX [64] to collect the results.
4.2.3 Results
In this subsection we compare the back-end routers selected by the different designapproaches from the energy consumption and cost perspective. We also discuss theimpact of traffic sampling interval on each design approaches.
Energy consumption
Fig. 4.2 compares the power dissipation of the different configurations. The result isbased on the 60 minutes input traffic sampling. The figure is split into two figuresfor clarity. The optimal solution (labeled as ”Optimal”) obtained by solving theILP model (4.15) – (4.16) is included in both graphs as a reference. It is the lowerlimit to the energy consumption of back-end routers defined by the other designapproaches. One can also observe from both figures that all the design approachesresult in an energy proportional cluster configuration except that the efficiency ofthe energy saving algorithms differ under different design approaches.
Fig. 4.2(a) presents power dissipation of a cluster designed by goal programmingapproach for different initial investment Ix. It is easy to see that the most constraineddesign (Design-V,I1) is the least energy efficient. This is because, constrained bybudget, the optimization problem has no option but to choose PCs with least costthough they are not energy efficient. However, as the budget is relaxed, the back-endrouters energy efficiency improves where the least constrained design (Design-V,I4)is the most efficient. Design-V,I4 has the same performance as the optimal solutionbecause extreme relaxation of the initial investment is the same as no constraint atall which is the case of the optimal solution.
64

4.2 – Design validation
0.3
0.4
0.5
0.6
0.7
0 5 10 15 20
Pow
er (
kWat
ts)
Time (hours)
I1<I2<I3<I4
OptimalDesign-V,I1Design-V,I2Design-V,I3Design-V,I4
(a) Power dissipation: Design-V for different bud-get constraints, Ix
0.3
0.4
0.5
0.6
0.7
0 5 10 15 20
Pow
er (
kWat
ts)
Time (hours)
OptimalDesign-I
Design-IIDesign-IIIDesign-IV
Design-V,I3
(b) Power dissipation: Design-I, Design-II, Design-III, Design-IV and Design-V,I3
Figure 4.2. Power dissipation of back-end PCs defined by different design ap-proaches (based on 60min traffic sampling)
Fig. 4.2(b) compares the power dissipation of Design-I, Design-II, Design-III,Design-IV and Design-V. Only of the goal programming approach, i.e Design-V,I3,is reported in this plot for comparison with the other design approaches. The reasonof choosing Design-V,I3 will be clear soon while we discuss about the cost of the back-end router cluster cost in Subsection 4.2.3. But this result shows that Design-V,I3 isperforming better than the others and Design-II is the worst cluster design approachfrom energy cost perspective. To distinguish among the other design approaches’performance, we report the energy consumption of the back-end routers computedusing (3.32) which is equivalent to computing the area under each power curve.The result is shown for a 24 hrs traffic pattern in Fig. 4.3(a) and Fig. 4.3(b).
Fig. 4.3(b) confirms that Design-II consumes the highest energy in the specifiedperiod. This design approach gives priority to high performance devices to setup theback-end routers cluster. Since the high-end servers have large capacity granularity,resizing the configuration to the input traffic mostly ends up in wasting some ca-pacity. Thus, less loaded PCs in the back-end are sources of energy inefficiency andthe energy required by this approach is roughly 2kWh larger than the one requiredby the optimal algorithm per day.
The design principle that configures back-end routers based on performance/priceratio, Design-I, has better tailoring properties as it give priority to mid-range PCsthat have relatively smaller capacity and consume less energy, making it easier tomatch input traffic. This yields roughly 1kWh (per day) less energy consumptionthan Design-II, although it is fairly far from the optimal.
Design-IV is comparable to the goal programming approach, being roughly0.25kWh less efficient than the optimal solution over 24 hours. Since this design
65
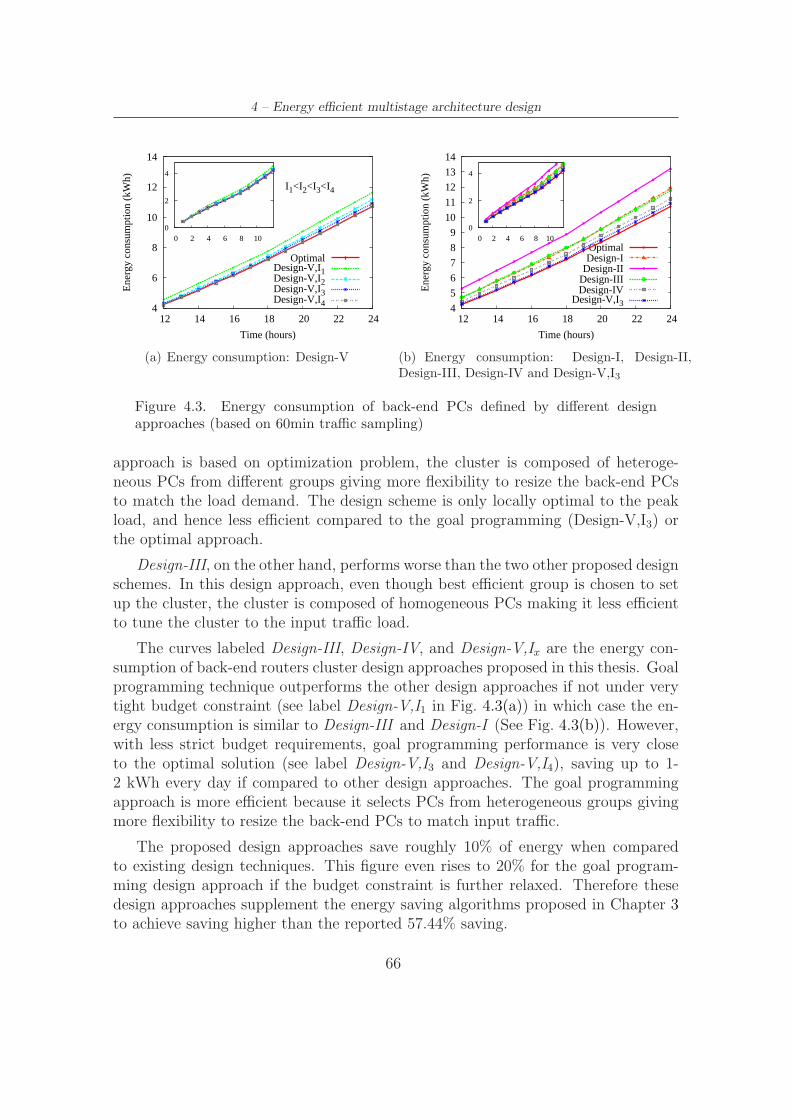
4 – Energy efficient multistage architecture design
4
6
8
10
12
14
12 14 16 18 20 22 24
Ene
rgy
cons
umpt
ion
(kW
h)
Time (hours)
I1<I2<I3<I4
OptimalDesign-V,I1Design-V,I2Design-V,I3Design-V,I4
0
2
4
0 2 4 6 8 10
(a) Energy consumption: Design-V
4
5
6
7
8
9
10
11
12
13
14
12 14 16 18 20 22 24
Ene
rgy
cons
umpt
ion
(kW
h)
Time (hours)
OptimalDesign-I
Design-IIDesign-IIIDesign-IV
Design-V,I3
0
2
4
0 2 4 6 8 10
(b) Energy consumption: Design-I, Design-II,Design-III, Design-IV and Design-V,I3
Figure 4.3. Energy consumption of back-end PCs defined by different designapproaches (based on 60min traffic sampling)
approach is based on optimization problem, the cluster is composed of heteroge-neous PCs from different groups giving more flexibility to resize the back-end PCsto match the load demand. The design scheme is only locally optimal to the peakload, and hence less efficient compared to the goal programming (Design-V,I3) orthe optimal approach.
Design-III, on the other hand, performs worse than the two other proposed designschemes. In this design approach, even though best efficient group is chosen to setup the cluster, the cluster is composed of homogeneous PCs making it less efficientto tune the cluster to the input traffic load.
The curves labeled Design-III, Design-IV, and Design-V,Ix are the energy con-sumption of back-end routers cluster design approaches proposed in this thesis. Goalprogramming technique outperforms the other design approaches if not under verytight budget constraint (see label Design-V,I1 in Fig. 4.3(a)) in which case the en-ergy consumption is similar to Design-III and Design-I (See Fig. 4.3(b)). However,with less strict budget requirements, goal programming performance is very closeto the optimal solution (see label Design-V,I3 and Design-V,I4), saving up to 1-2 kWh every day if compared to other design approaches. The goal programmingapproach is more efficient because it selects PCs from heterogeneous groups givingmore flexibility to resize the back-end PCs to match input traffic.
The proposed design approaches save roughly 10% of energy when comparedto existing design techniques. This figure even rises to 20% for the goal program-ming design approach if the budget constraint is further relaxed. Therefore thesedesign approaches supplement the energy saving algorithms proposed in Chapter 3to achieve saving higher than the reported 57.44% saving.
66
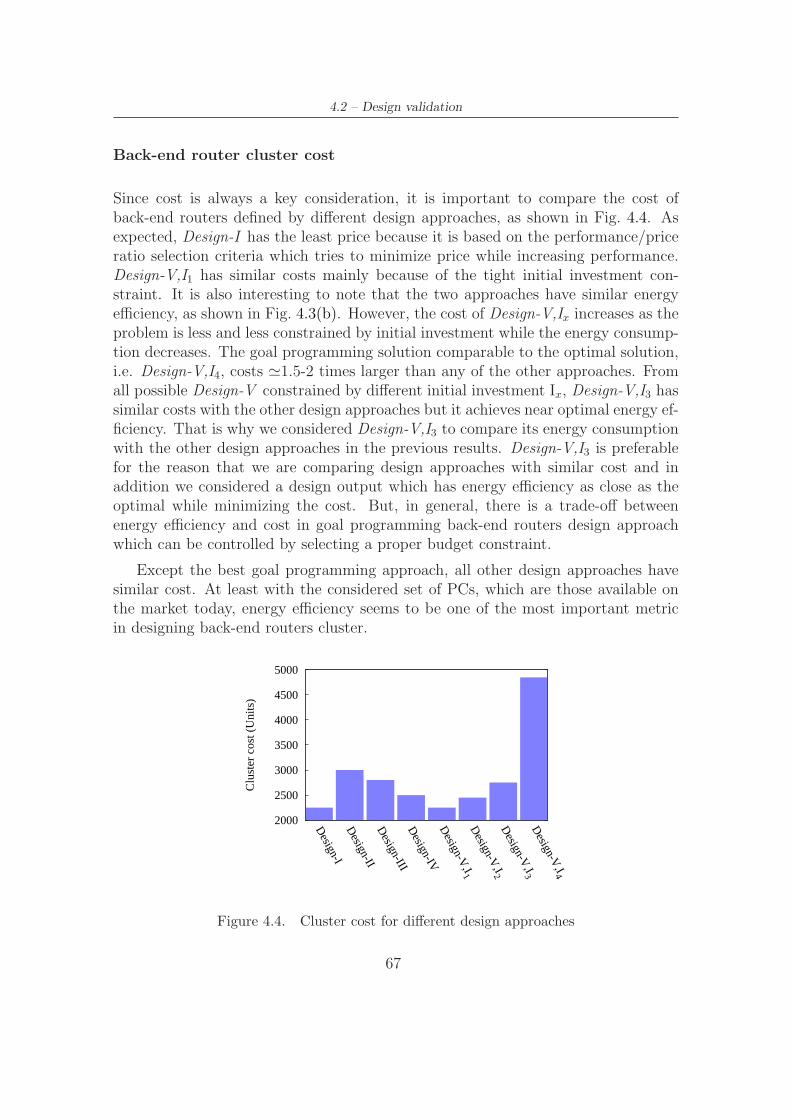
4.2 – Design validation
Back-end router cluster cost
Since cost is always a key consideration, it is important to compare the cost ofback-end routers defined by different design approaches, as shown in Fig. 4.4. Asexpected, Design-I has the least price because it is based on the performance/priceratio selection criteria which tries to minimize price while increasing performance.Design-V,I1 has similar costs mainly because of the tight initial investment con-straint. It is also interesting to note that the two approaches have similar energyefficiency, as shown in Fig. 4.3(b). However, the cost of Design-V,Ix increases as theproblem is less and less constrained by initial investment while the energy consump-tion decreases. The goal programming solution comparable to the optimal solution,i.e. Design-V,I4, costs ≃1.5-2 times larger than any of the other approaches. Fromall possible Design-V constrained by different initial investment Ix, Design-V,I3 hassimilar costs with the other design approaches but it achieves near optimal energy ef-ficiency. That is why we considered Design-V,I3 to compare its energy consumptionwith the other design approaches in the previous results. Design-V,I3 is preferablefor the reason that we are comparing design approaches with similar cost and inaddition we considered a design output which has energy efficiency as close as theoptimal while minimizing the cost. But, in general, there is a trade-off betweenenergy efficiency and cost in goal programming back-end routers design approachwhich can be controlled by selecting a proper budget constraint.
Except the best goal programming approach, all other design approaches havesimilar cost. At least with the considered set of PCs, which are those available onthe market today, energy efficiency seems to be one of the most important metricin designing back-end routers cluster.
2000
2500
3000
3500
4000
4500
5000
Design-I
Design-II
Design-III
Design-IV
Design-V
,I1D
esign-V,I2
Design-V
,I3D
esign-V,I4
Clu
ster
cos
t (U
nits
)
Figure 4.4. Cluster cost for different design approaches
67
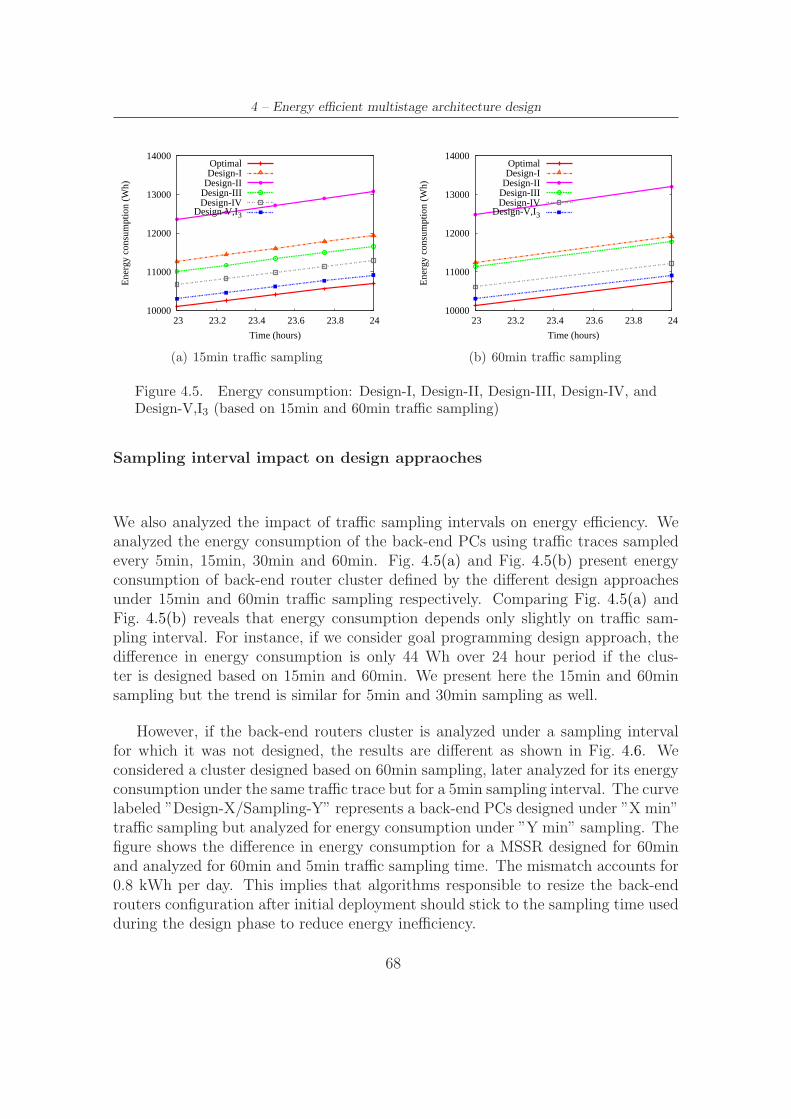
4 – Energy efficient multistage architecture design
10000
11000
12000
13000
14000
23 23.2 23.4 23.6 23.8 24
Ene
rgy
cons
umpt
ion
(Wh)
Time (hours)
OptimalDesign-I
Design-IIDesign-IIIDesign-IV
Design-V,I3
(a) 15min traffic sampling
10000
11000
12000
13000
14000
23 23.2 23.4 23.6 23.8 24
Ene
rgy
cons
umpt
ion
(Wh)
Time (hours)
OptimalDesign-I
Design-IIDesign-IIIDesign-IV
Design-V,I3
(b) 60min traffic sampling
Figure 4.5. Energy consumption: Design-I, Design-II, Design-III, Design-IV, andDesign-V,I3 (based on 15min and 60min traffic sampling)
Sampling interval impact on design appraoches
We also analyzed the impact of traffic sampling intervals on energy efficiency. Weanalyzed the energy consumption of the back-end PCs using traffic traces sampledevery 5min, 15min, 30min and 60min. Fig. 4.5(a) and Fig. 4.5(b) present energyconsumption of back-end router cluster defined by the different design approachesunder 15min and 60min traffic sampling respectively. Comparing Fig. 4.5(a) andFig. 4.5(b) reveals that energy consumption depends only slightly on traffic sam-pling interval. For instance, if we consider goal programming design approach, thedifference in energy consumption is only 44 Wh over 24 hour period if the clus-ter is designed based on 15min and 60min. We present here the 15min and 60minsampling but the trend is similar for 5min and 30min sampling as well.
However, if the back-end routers cluster is analyzed under a sampling intervalfor which it was not designed, the results are different as shown in Fig. 4.6. Weconsidered a cluster designed based on 60min sampling, later analyzed for its energyconsumption under the same traffic trace but for a 5min sampling interval. The curvelabeled ”Design-X/Sampling-Y” represents a back-end PCs designed under ”X min”traffic sampling but analyzed for energy consumption under ”Y min” sampling. Thefigure shows the difference in energy consumption for a MSSR designed for 60minand analyzed for 60min and 5min traffic sampling time. The mismatch accounts for0.8 kWh per day. This implies that algorithms responsible to resize the back-endrouters configuration after initial deployment should stick to the sampling time usedduring the design phase to reduce energy inefficiency.
68
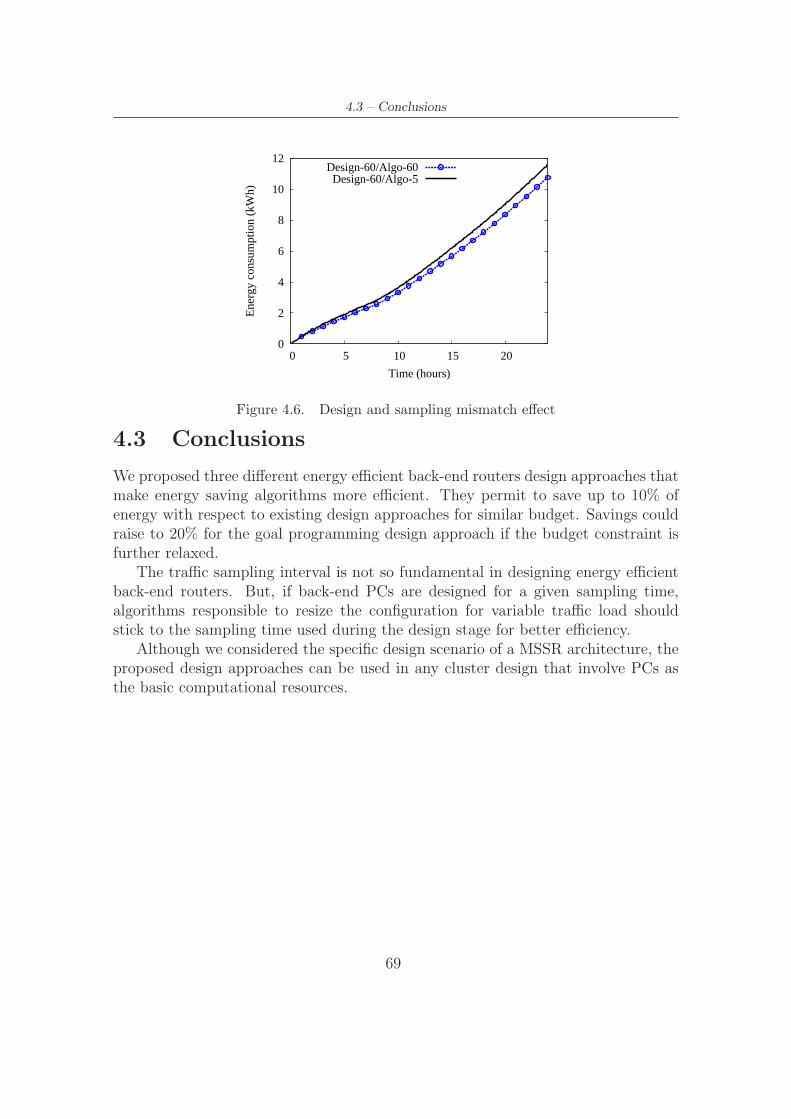
4.3 – Conclusions
0
2
4
6
8
10
12
0 5 10 15 20
Ene
rgy
cons
umpt
ion
(kW
h)
Time (hours)
Design-60/Algo-60Design-60/Algo-5
Figure 4.6. Design and sampling mismatch effect
4.3 Conclusions
We proposed three different energy efficient back-end routers design approaches thatmake energy saving algorithms more efficient. They permit to save up to 10% ofenergy with respect to existing design approaches for similar budget. Savings couldraise to 20% for the goal programming design approach if the budget constraint isfurther relaxed.
The traffic sampling interval is not so fundamental in designing energy efficientback-end routers. But, if back-end PCs are designed for a given sampling time,algorithms responsible to resize the configuration for variable traffic load shouldstick to the sampling time used during the design stage for better efficiency.
Although we considered the specific design scenario of a MSSR architecture, theproposed design approaches can be used in any cluster design that involve PCs asthe basic computational resources.
69

Chapter 5
Multistage architecture networkmanagement
In Chapter 1 we discussed that the MSSR advantages come at the cost of controland management complexity. This complexity problem has partially been addressedfrom the control plane perspective [19]: An internal control protocol named DISThas been developed to: i) configure the architecture; ii) coordinate the routingprocess among back-end routers and the load balancing function among LBs; andiii) provide automatic fault recovery mechanisms. Furthermore, DIST dynamicallymaps the virtualCP on one of the back-end routers.
In Chapter 3 and 4 we discussed MSSR energy management in detail. In thischapter we tackle the information management issue in MSSR architecture. Afterbriefly introducing management information organization, we discuss MSSR archi-tecture management complexity problems (Section 5.1) and set management re-quirements to build a management system suitable for MSSR (Sec. 5.2). Then inSections 5.3.1, 5.3.2 and 5.3.3 we describe the solution to the MSSR internal net-work management problem detailing required communication model modificationand methods on how to create a unified information management system that rep-resents the MSSR architecture. Scalability analysis of proposed solution is detailedin Section 5.3.4. Finally in Section 5.3.5 we briefly discuss the proposed solutionimplementation and conclude the chapter in Section 5.4.
5.1 Problem description
Networks require management procedures to monitor and control their operation.To reach this goal, network devices keep track of management information, suchas cross-traffic, interface status and general system statistics. This informationis organized into a management information base (MIB) [53] accessible through
71
5 – Multistage architecture network management
different management protocols such as SNMP, NetConf and NetFlow [56,69,70].
The MIB is organized in a tree structure for individual network devices: objects,ranging from scalar objects such as the system up time to tabular objects, such asthe routing table, are represented as tree leaves. A MIB object has the followingspecifications: a unique name, attributes and valid operations that can be performedon the objects (read and write). A numeric tag, called object identifier (OID), isused to navigate through the tree to uniquely identify each MIB object.
Individual devices in a network has its own MIB and hence MIB variables aredirectly accessible. The MSSR architecture, however, has a unique characteristics.It is different from local area network in that the internal network has to be hiddenfrom external network mimicking a single device. It is different as well from a singledevice because internally it is composed of devices having independent computingcapability. From management perspective this means that the MIB informationis distributed among different internal elements and none of them represents themultistage architecture. For example consider the sysUpTime1. Each internal com-ponent in MSSR has its own sysUpTime but which one represents the up time of themultistage architecture as a whole? Or do we need to generate a new sysUpTime?Analyzing such management related questions to create a unique MIB for multistagesoftware router requires additional complexity.
In this chapter we discuss building a multistage software router MIB from theinternally distributed management information among internal components. There-fore the problem of MSSR information management can be seen as the problemof mapping and/or combining the distributed information into an aggregated view.This problem is twofold: i) definition of a communication model to collect the dis-tributed data and ii) mapping the various data to create a single-entity view. Wedefine an internal network manager that coordinate the internal elements and oper-ate on the MIB information distributed among the internal elements to create sucha single-entity view.
In addition the internal network manager has to work in coordination with othermodules, such as the multistage energy saving module described in Chapter 3, thataffects management operation. Turned off devices by the energy saving algorithmsare not available to respond to a management request. Consequently a multistagemanagement system need to track such unaccessible information for consistent man-agement.
Access to management information is further complicated if any of the internaldevice is not management capable. For instance LBs implemented in FPGA [26] arenot management capable because these devices do not support management agents
1sysUpTime is the time (in hundredths of a second) since the network management portion ofthe MSSR architecture was last re-initialized [53].
72
5.2 – Multistage architecture internal network management requirements
which are responsible to respond to management requests. Therefore it is not possi-ble to request for management information at all if the devices are not managementcapable. Whenever it is possible to request for management information, these de-vices track only limited number of the vast majority of management information.The obvious question to answer is that how does the MSSR build its managementinformation from internal devices under this condition?
Addressing these and similar challenges require either modification of existingfunctional areas of network management [71,72] or definition of new design require-ments and new approach to manage MSSR architectures. In this thesis we tookthe later road and present our proposal to solve the above described managementcomplication.
5.2 Multistage architecture internal network man-
agement requirements
In this section we discuss multistage network management design requirements whichguides us in proposing an MSSR management solution and evaluating its feasibility.We identified the following four management requirements and a fifth one is includedas a future work.
1) Unified management information: MSSR is build on the principle thatthe whole architecture will be viewed as a single device to external network. Thisprinciple applies for the management information as well. Hence the multistagearchitecture should have a single MIB, which could be virtual or accessible locallyto the internal manager, representing the whole architecture. Management informa-tion unification is necessary because each component in the multistage architecture,as an independent element, stores its own management information. That is, themanagement information is dispersed internally and there is no single managementinformation base (MIB) representing the whole multistage architecture. Thereforebuilding such a unified MIB is one of the fundamental requirements.
2) Management information coherence: The internal network is prone tofailure. In such situation management information of the failed device is not ac-cessible. Besides internal component failures, other functional modules of the ar-chitecture controls the internal devices in achieving some objective. For instance,the energy module proposed in Chapter 3 turns off back-end routers to save energyconsumption of the architecture. During this off period, the MIB of the turned offdevice is not available to the internal manager. Those internal fluctuations resultin management information inconsistency when observed by the external managerunless the internal manager copes up with such internal effects.
3) Scalability: The internal manager runs on one of the back-end router;
73

5 – Multistage architecture network management
namely the virtualCP. The amount of management information to be gathered frominternal devices at any time should not impede the performance of the virtualCPas it is responsible for internal architecture coordination. Furthermore excessivemanagement information (if any) should not affect internal link bandwidth espe-cially that of the VirtualCP. Thus, in designing a multistage management system,scalability should have to be taken into account as well.
4) Predict non-management capable devices management information:Some internal devices, for instance LBs implemented on NetFPGA, of the MSSRarchitecture do not have management capability. In other words, the standardmanagement agents do not run in these devices to collect management information.The internal manager, therefore, has to predict information related to devices thatdo not have management capability.
5.3 Proposed management architecture
Given the MSSR management system requirements, we present our solution to themanagement challenges an MSSR architecture faces in the following sections. Theproposal is based on building a virtual MIB. That is the virtualCP does not havemost of required management information locally rather collects the informationfrom internal devices and compiles it at the time an external manager requests forit. This design approach has the advantage of being scalable as will be discussedlater in this chapter. The other design approach could be to build a MIB local tothe virtualCP and regularly update the MIB with the information collected frominternal devices irrespective of a request from external manager. This could resultsin management information flooding in the internal network and could threat themanagement system as well as the whole architecture scalability. We postponed thisresearch as a future activity.
As detailed in Section 2.2, SNMP is successful in network management and it isa widely deployed protocol. And hence we consider SNMP as preferred managementprotocol for MSSR network management as well. We also adopted the hierarchicalarchitecture management approach shown in Fig. 5.1 as a network managementsystems (NMS). It uses the concept of manager of managers sitting at a higher leveland requesting information from smaller domain managers in a tree like fashion.
We propose an SNMP dual-role entity named aggregator that coordinates theinternal, independently running, SNMP agents and interacts with the external man-agers issuing SNMP requests. The aggregator is logically one of the modules of thevirtualCP, the entity in charge of architecture control and coordination. However,it may run independently of other modules, possibly in a different back-end router.
Load balancers redirect any external SNMP requests to the aggregator. Whenan SNMP request is received, the aggregator queries the internal SNMP agents to
74
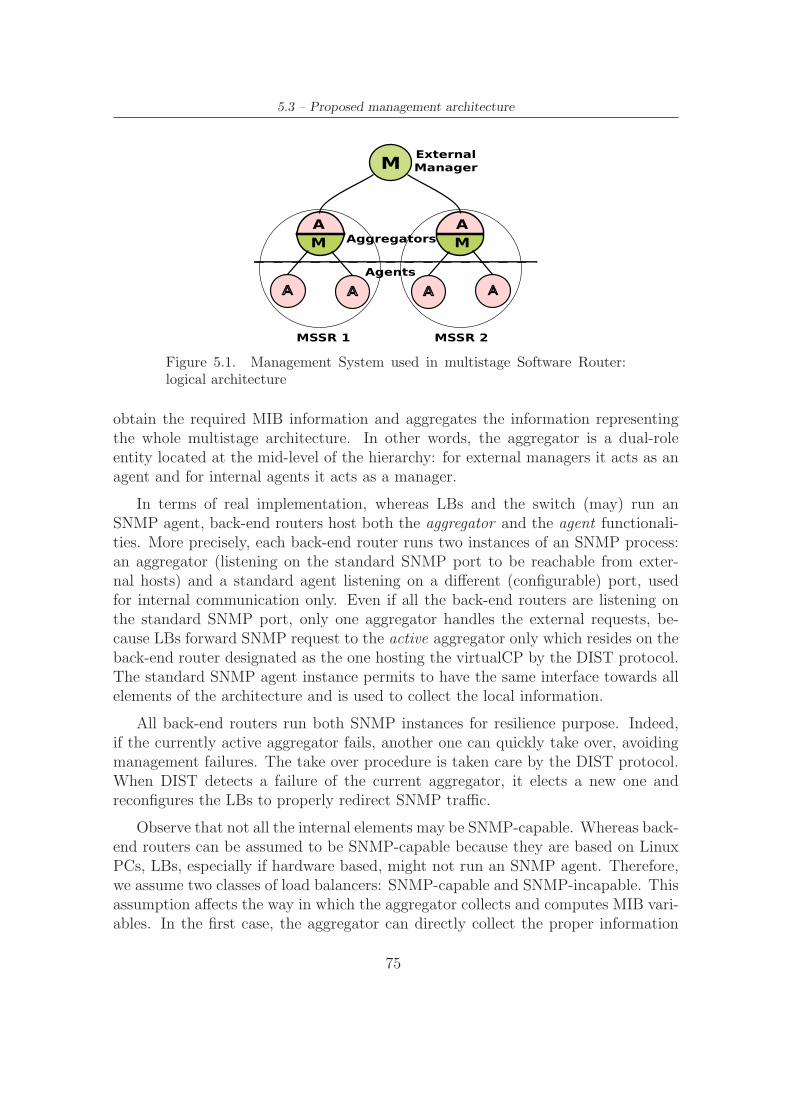
5.3 – Proposed management architecture
A
M
A
MSSR 1
Agents
Aggregators
External
Manager
A
M
A
M
AA
MSSR 2
Figure 5.1. Management System used in multistage Software Router:logical architecture
obtain the required MIB information and aggregates the information representingthe whole multistage architecture. In other words, the aggregator is a dual-roleentity located at the mid-level of the hierarchy: for external managers it acts as anagent and for internal agents it acts as a manager.
In terms of real implementation, whereas LBs and the switch (may) run anSNMP agent, back-end routers host both the aggregator and the agent functionali-ties. More precisely, each back-end router runs two instances of an SNMP process:an aggregator (listening on the standard SNMP port to be reachable from exter-nal hosts) and a standard agent listening on a different (configurable) port, usedfor internal communication only. Even if all the back-end routers are listening onthe standard SNMP port, only one aggregator handles the external requests, be-cause LBs forward SNMP request to the active aggregator only which resides on theback-end router designated as the one hosting the virtualCP by the DIST protocol.The standard SNMP agent instance permits to have the same interface towards allelements of the architecture and is used to collect the local information.
All back-end routers run both SNMP instances for resilience purpose. Indeed,if the currently active aggregator fails, another one can quickly take over, avoidingmanagement failures. The take over procedure is taken care by the DIST protocol.When DIST detects a failure of the current aggregator, it elects a new one andreconfigures the LBs to properly redirect SNMP traffic.
Observe that not all the internal elements may be SNMP-capable. Whereas back-end routers can be assumed to be SNMP-capable because they are based on LinuxPCs, LBs, especially if hardware based, might not run an SNMP agent. Therefore,we assume two classes of load balancers: SNMP-capable and SNMP-incapable. Thisassumption affects the way in which the aggregator collects and computes MIB vari-ables. In the first case, the aggregator can directly collect the proper information
75
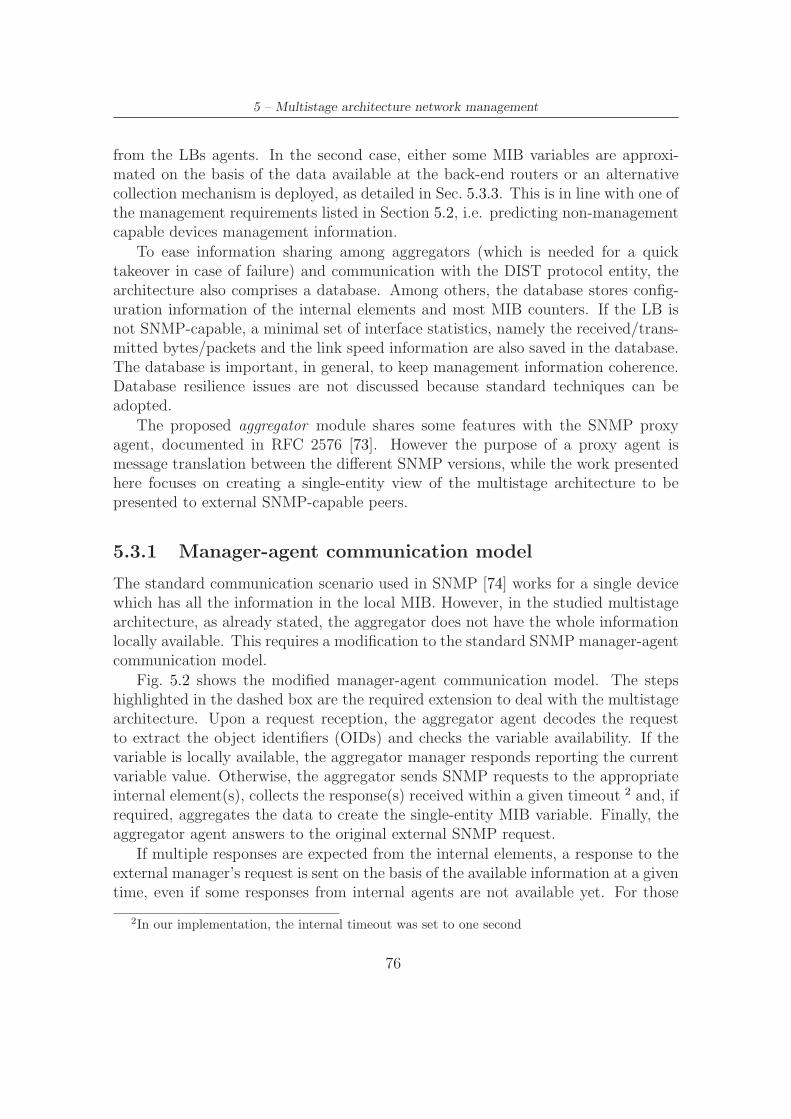
5 – Multistage architecture network management
from the LBs agents. In the second case, either some MIB variables are approxi-mated on the basis of the data available at the back-end routers or an alternativecollection mechanism is deployed, as detailed in Sec. 5.3.3. This is in line with one ofthe management requirements listed in Section 5.2, i.e. predicting non-managementcapable devices management information.
To ease information sharing among aggregators (which is needed for a quicktakeover in case of failure) and communication with the DIST protocol entity, thearchitecture also comprises a database. Among others, the database stores config-uration information of the internal elements and most MIB counters. If the LB isnot SNMP-capable, a minimal set of interface statistics, namely the received/trans-mitted bytes/packets and the link speed information are also saved in the database.The database is important, in general, to keep management information coherence.Database resilience issues are not discussed because standard techniques can beadopted.
The proposed aggregator module shares some features with the SNMP proxyagent, documented in RFC 2576 [73]. However the purpose of a proxy agent ismessage translation between the different SNMP versions, while the work presentedhere focuses on creating a single-entity view of the multistage architecture to bepresented to external SNMP-capable peers.
5.3.1 Manager-agent communication model
The standard communication scenario used in SNMP [74] works for a single devicewhich has all the information in the local MIB. However, in the studied multistagearchitecture, as already stated, the aggregator does not have the whole informationlocally available. This requires a modification to the standard SNMP manager-agentcommunication model.
Fig. 5.2 shows the modified manager-agent communication model. The stepshighlighted in the dashed box are the required extension to deal with the multistagearchitecture. Upon a request reception, the aggregator agent decodes the requestto extract the object identifiers (OIDs) and checks the variable availability. If thevariable is locally available, the aggregator manager responds reporting the currentvariable value. Otherwise, the aggregator sends SNMP requests to the appropriateinternal element(s), collects the response(s) received within a given timeout 2 and, ifrequired, aggregates the data to create the single-entity MIB variable. Finally, theaggregator agent answers to the original external SNMP request.
If multiple responses are expected from the internal elements, a response to theexternal manager’s request is sent on the basis of the available information at a giventime, even if some responses from internal agents are not available yet. For those
2In our implementation, the internal timeout was set to one second
76
5.3 – Proposed management architecture
Command
Responder/
Commander
Dispatcher
Message
Processing
Model
Security
Model
Receive SNMP
Request from
Network
Process PDU
prepareDataElement
aggregateResponsePDU
processIncomingMsg
createInternalPDU
prepareOutgoingMsg
generateRequestMsg
Send SNMP
Request to
Internal Agents
Receive SNMP
Response from
Internal Agents
prepareDataElement
processIncomingMsg
returnResponsePDU
prepareResponseMsg
generateResponseMsg
Send SNMP
Response to
Network
Figure 5.2. Modified manager-agent communication model for the mul-tistage software router
elements which did not respond for whatever reason, the aggregator uses, if available,the corresponding variable value saved in the database at the previous successfulrequest. On reception of a new request for a counter type MIB variable, if the agentcomes back to service, the aggregator checks to detect any variable re-initialization:if found, the old value contained in the database and the newly available countervalue are summed up to mask the discontinuity. This compensation guarantees thatcounters are kept monotonically increasing. Violating the monotonicity behavior ofcounters would be disturbing for the external management software, because these
77
5 – Multistage architecture network management
values are typically used to compute temporal trends.
5.3.2 multistage router MIB
In the MIB definition of our multistage software router architecture, we mainlyconsider, among all variables defined in the MIB tree, the system, the interface (IF)and the IP group objects and demonstrate on how to build a unified managementinformation for MSSR architecture. This is one of the main MSSR managementrequirements that we want to achieve (See Section 5.2 for detail).
The MIB variables can be grouped into two main categories, based on how theaggregator computes the response:
Global Variables This category contains variables which are global for the mul-tistage software router, e.g., the routing table (ipRouteTable), the system up time(sysUpTime) or the system name (sysName). These variables do not depend on aspecific internal element; hence, they are stored in the database to ease informationsharing among all aggregators. A response to an external SNMP request for thistype of variables translates simply into a query to the database. The database mightbe populated by the aggregator itself or by the DIST daemon depending on the spe-cific information. For example, the system name is provided by the aggregator,while the routing information is updated by DIST.
Collected Variables This category comprises all the variables requiring collectionof data from one or more internal agents, e.g., interface information. A furtherdivision is between specific and aggregated variables. Specific variables can be fetchedthrough a single request to a specific internal element. This group comprises all thevariables containing specific properties of an internal element, e.g., the link status(ifOperStatus) or the link speed (ifSpeed). Instead, aggregate variables need multiplequeries to different internal agents and require some kind of data aggregation. Forinstance, the total number of received packets at the IP layer (ipInReceives) or thediscarded packets at the interface (ifInDiscards) are computed using counters fromseveral internal elements.
5.3.3 Single-entity management information view: the caseof aggregate variables
Global and collected variables are easy to handle: a simple request forwarding eitherto the database manager or to an internal agent is needed. Thus, we focus on howto compute the more complex aggregate variables. These variables mainly compriseIF and IP counters.
78

5.3 – Proposed management architecture
Fig. 5.3 shows the main counters involved during packet forwarding, both in asingle device router and in the multistage software router. The challenge is to definea mapping between the counters on the left, representing the single-entity view wewant to achieve, and the counters on the right distributed over the three stages ofthe multistage architecture. In the following subsections we present such mapping.Where ambiguity might exist, we use an over-line to indicate the mapped computedvariables and the superscript LB and BR for counters at LB or back-end routerinterface respectively. Furthermore, for simplicity, we define ifInPkts as the sumof both unicast (ifInUcastPkts) and non-unicast (ifInNUcastPkts) packets.
ifInOctets, ifInErrors and ifInUnknownProtos
ifInOctets, ifInErrors and ifInUnknownProtos count respectively the numberof received bytes, the number of discarded packets due to errors and to unknown/un-supported protocols. These counters are interface specific and, therefore, simplytreated as collected variables.
As already introduced earlier, the computation of MIB variables may be difficultbecause some elements may be non SNMP-capable. For this reason, we considerthree different cases:
• SNMP-capable LBs: SNMP messages are used;
• SNMP-incapable, DIST-capable LBs: The existing control plane is extendedto transport minimal traffic statistics (e.g. packet and byte counters);
• SNMP-incapable and DIST-incapable LBs: Data collection is not possible.Counters are approximated using the information available at the back-endrouters (which are SNMP-capable), assuming a uniform distribution of trafficamong front-end interfaces. Unfortunately, ifInErrors and ifInUnknownProtos
variables are not available in this case, because these events occur at LBs’ in-terfaces only.
Similar considerations apply to the outgoing counterparts: ifOutOctets, ifOutErrors
and ifOutUnknownProtos.
79

5–Multistagearchitecture
network
managem
ent
ifInoctets
ifInErrors
ifInUnknown-
Protos
ifInDiscards
ifOutErrors
ifIn
ifOutUnknownProtos
ifIn
ifOutDiscards
ifIn
ifOut ifInPkts
ifInPkts
INOUTIN
ifOutErrors
ifIn
ifOutUnknownProtos
ifIn
ifOutDiscards
ifIn
ifOut ifInPkts
INOUT
ifOutErrors
ifIn
ifOutUnknownProtos
ifIn
ifOutDiscards
ifIn
ifOut ifInPkts
INOUT
ipInReceives
ipInHdrErrors
ipInAddrErrors
ipInDiscards
ipInUnknown-
Protos
ipForw-
Datagrams
ipInDelivers
IN OUT
ipOutReceives
ipOutHdrErrors
ipOutAddrErrors
ipOutDiscards
ipOutUnknown-
Protos
ipOutDelivers
Layer 2
Layer 3
ifOutErrors
ifIn
ifOutUnknownProtos
ifIn
ifOutDiscards
ifIn
ifOut ifInPkts
INOUT OUT
ifOutoctets
ifOutErrors
ifOutUnknown-
Protos
ifOutDiscards
ifOutPkts
Load
BalancerLoad
Balancer
Switch Backend
Router
Switch
ipInReceives
ipInHdrErrors
ipInAddrErrors
ipInDiscards
ipInUnknown-
Protos
ipForw-
Datagrams
ipInDelivers
IN OUT
ipOutReceives
ipOutHdrErrors
ipOutAddrErrors
ipOutDiscards
ipOutUnknown-
Protos
ipOutDelivers
ifInoctets
ifInErrors
ifInUnknown-
Protos
ifInDiscards
ifInPkts
INLayer 2
Layer 3
OUT
ifOutoctets
ifOutErrors
ifOutUnknown-
Protos
ifOutDiscards
ifOutPkts
Single Device Router Multi-stage Software Router
Inbound Path Outbound Path
Figure 5.3. Main IF and IP counters involved in packet forwarding for a single-stage router (right) andthe multistage software router (left)
80

5.3 – Proposed management architecture
ifInDiscards
As defined in the RFC 1213 [53], the variable ifInDiscards counts the packetswhich, even if correct at reception time, are discarded by the device for any rea-son. We use this definition to compute all packets lost while traversing the internalnetwork of the multistage architecture. However, it is not possible to track the ex-act path (and thereof the exact counters involved) of each packet within the multi-stage architecture, due to the unpredictable decision of the load balancing scheduler.Hence, we define Di as the share of packets internally discarded for interface i.
Di is computed as the difference of the correctly received packets at the inputinterface of the LB (ifInPktsLBi ) and the sum of correctly received packets at allthe interfaces of the back-end routers RBR, weighted by wi, the percentage of trafficreceived at interface i. RBR and wi are computed as:
RBR =M∑
j=1
(ifInPktsBRj ) (5.1)
wi =ifInOctetsLBi
∑N
k=1ifInOctetsLBk
(5.2)
where M is the total number of back-end router interfaces, and N the total numberof external LBs interfaces. Thus,
Di = ifInPktsLBi − wiRBR (5.3)
ifInDiscardsi = ifInDiscardsLBi +Di (5.4)
The above formulas make the implicit assumption that the loss probability is thesame on all internal paths, but it has the nice property of being completely indepen-dent of the internal load balancing scheme adopted. Thanks to this property, thesame procedure can also be applied on the reverse path to compute ifOutDiscardiwithout knowing the result of the routing operation.
In case of SNMP-incapable and DIST-incapable LB, ifInDiscardsi is directlyapproximated by Di, replacing ifInOctets and ifInPkts in Eq. (5.1)-(5.4) with thereceived bytes rxBytes and received packets rxPkts statistics, respectively, storedin the database by DIST.
ifInPkts
ifInPkts is the sum of all the corresponding counters at the back-end routersweighted by wi.
ifInPktsLBi = wi(M∑
j=1
ifInPktsBRj ) (5.5)
81
5 – Multistage architecture network management
For SNMP-incapable and DIST-incapable LB the same substitution as for ifInDiscards
apply.
IP counters
The IP counters are located only at the back-end routers. The mapping consists ofthe sum of all the corresponding IP counters at the back-end routers. For instance,ipInReceives is computed as:
ipInReceives =M∑
j=1
ipInReceivesBRj (5.6)
sysUpT ime
In addition to the above counters, a special mention is needed for the sysUpT ime,a global variable used to store the elapsed time since the management system wasrunning. This information is used as a time reference for the other variables by theexternal management software, to plot temporal graphs. Given that the aggregatorcan run on different back-end routers at different time, it is important that thesysUpT ime is not related to a specific instance of the aggregator, but rather tied tothe up time of the whole architecture. To achieve this, the first aggregator stores thereference startup time into the database. When an aggregator fails and another takesover, the start up information remains the same. The sysUpT ime is re-initialized ifand only if all the back-end routers fail.
5.3.4 Scalability analysis
The use of a centralized aggregator has the advantage of reduced management com-plexity. However, scalability issue might arise due to the concentration of SNMPtraffic. We said in Section 5.2 scalability should be considered as one of the man-agement system requirement. Thus, we try to estimate the amount of SNMP trafficinternally generated to process an external SNMP request. The worst case scenariois a request for IfInDiscards, because it implies the collection of the largest numberof variables from the multistage architecture (see Eq. (5.1)-(5.4)).
As reported in Section 5.3.3, M is the total number of back-end router interfaces,meanwhile N is the total number of external LB interfaces. Eq. (5.1) requires tocollect 2M variables, because IfInPkts is the sum of two variables and Eq. (5.2)requires N variables. Furthermore, three more variables are needed for Eq. (5.3)and (5.4). In the worst case, for each variable two SNMP messages (request andresponse) are required. Typically, the management station repeats the requests in
82

5.3 – Proposed management architecture
time to plot temporal graphs and keep device history. Therefore, the amount ofmanagement traffic can be computed as:
total traffic =2(2M +N + 3)S
T
≈2(2M +N)S
T(5.7)
where S is the SNMPmessage size, typically about 100 bytes for SNMP response [75],and T is the update period, typically set to about 5 minutes.
Let us now consider two scenarios: i) a medium range edge router with 360interfaces at 1Gbps (i.e. a mid-range 7600 series Cisco router [76]) and ii) a corerouter with 16 interfaces at 10Gbps (i.e. a high-end Juniper T series router [20]).Assuming back-end PCs with 1Gbps routing capability and one LB per interface(worst case in terms of generated messages), we have that for i) M = 360,N = 360and for (ii) M = 160,N = 16. Even assuming a very aggressive update period of 1s,the management traffic would be equal to 216 KBytes/s and 67 Kbytes/s respec-tively for one MIB variable. Even considering tens of MIB variables traced by themanagement station, the management traffic is negligible with respect to the totalforwarding routing capacity, posing no threat to the overall architecture.
The above example considers the worst case scenario where one request is sentto collect one variable from internal device. In our implementation, however, theaggregator generates a request containing a list of varbinds to a device to collectmore than one variable instances in one response to reduce SNMP traffic generatedinternally. For each additional variable to the list we have an average 18bytes pay-load. For one variable the SNMP packet average packet size is 100bytes and for twovariables it will be 118bytes and so on. That is, if k is the number of variables inthe varbinds list and l the payload due to one variable in the list, then the totalSNMP traffic generated will be
Total bytes ∼= SNMP packet sizeavg + k × l (5.8)
Thus instead of sending individual request to internal devices, request to multiplevariables are bundled together into a single SNMP message, which would allow tosignificantly reduce the number of messages and increase transmission efficiency.Furthermore, (5.7) overestimates the real internal management traffic, because anSNMP request is smaller than an SNMP response message.
From these arguments we conclude that the proposed management system scaleswell for large size of MSSR and does not pose a threat to the overall architecturescalability in general.
83
5 – Multistage architecture network management
5.3.5 Software implementation
The management architecture proposed in this chapter was implemented and verifiedin a test-bed, similar to the figure shown in Fig. 1.3. More precisely, the prototype isbased on a customized version of Net-SNMP (ver. 5.4.2.1) [60] and MySQL DBMSin addition to the software required to implement the multistage architecture.
5.4 Conclusions
The multistage software router, being a distributed router architecture, requires acoordinated information management to mask the internal structure and to presentthe architecture to external managers (e.g. Cacti and MRTG) as a single device.
We defined a hierarchical management system based on three elements (a man-ager, aggregators and agents) as an extension of the standard manager-agent com-munication model. The new system consists of a multistage distributed MIB and anextended communication model, which define the mechanisms to collect data fromdistributed elements in a reliable way and to aggregate the data in an unified view.The net-SNMP 5.4.2.1 [60] implementation has been modified and tested in a smallscale test-bed and its scalability was assessed through simple load computations fortwo classical high-end router configurations.
84
Chapter 6
Conclusions
In this chapter overall conclusions to the research topics discussed in this thesis inaccordance with the research question identified in Chapter 1 are presented (Sec-tion 6.1) and finally conclude the thesis by pointing out possible extension and futureresearch directions in Section 6.2
6.1 Overall conclusions
A multistage software router architecture has the advantage of low cost, flexibilityand programmability over their proprietary networking devices and overcomes asingle PC based software routers performance limitation by offering multiple, parallelforwarding paths. Scalability issues of single PC based software routers has also beenaddressed in MSSR architecture since the number of interfaces as well as performancecan be increased/improved by incrementally adding/upgrading internal elementsseamlessly.
Like many networking devices, the MSSR is typically designed for the peaktraffic and hence a high-end MSSR architecture might require tens or hundredsof PCs. As the number of internal devices increases, however, MSSR faces twochallenges: control and management complexity and energy wastage during lowtraffic periods. The large amount of energy consumption at high load could alsothreaten the scalability feature of the MSSR architecture. In addressing these issues,this thesis dare to develop a centralized MSSR management system that (i) collectsand compiles a unified information management system, and (ii) resize the MSSRarchitecture to the input traffic in an efficient way such that the power wastage isminimized during low load periods.
To solve energy related issues of MSSR architecture, three algorithms, namelyoptimal, two-step and on-line differential algorithms, with their respective pros andcons have been proposed in Chapter 3 to address the Research Question 2. The
85
6 – Conclusions
algorithms adapt the energy consumption of multistage software router to a trafficload by properly choosing a set of active back-end routers to match incoming load.Results show that the proposed algorithms save up to 57.44% of the architectureenergy consumption compared to the no saving scheme at low loads.
The two-step algorithm takes a divide-and-conquer approach to overcome thescalability issue of the optimal algorithm. Even if the single steps in the two-stepapproach are optimal, the combined solution however is not. This is because theinformation required to globally optimize the system is partitioned among the twosteps making them less optimal from a global point of view. The two-step scaleswell to a practical size of MSSR architecture and closely approximate the optimalwith a solution quality within 9% difference in the worst case considered.
Both the optimal and two-step algorithms face service disruption and/or in-creased delay during reconfiguration period. The on-line differential algorithm, eventhough less optimal compared to the off-line approaches (both the optimal and two-step algorithms), has the advantage of being non disruptive and therefore superiorto the off-line approaches in terms of QoS provision. Moreover, it scales well to solvelarge size MSSR configuration. The worst case performance gap of on-line algorithmwith with respect to the optimal algorithm is about 27.7% .
In Chapter 4 an energy efficient back-end routers design approaches that supple-ment the efficiency of energy saving algorithms have been proposed. The back-endPCs cluster design approaches permit to save up to 10% of energy with respect toexisting design approaches for similar budget constraint. The design schemes incombination with the energy saving algorithms makes the MSSR implementationpractical by reducing energy wastage in MSSR architecture that could threaten itsscalability feature.
The answer to the Research Question 4 has been provided in Chapter 5. Mul-tistage architecture is build on the principle that the whole architecture will beviewed as a single device to external network. This principle applies for the man-agement information as well. Therefore, a mechanism that coordinated informationmanagement to mask the internal MSSR structure and present the architecture toexternal managers as a single device has been proposed as a solution to informationmanagement complexity.
The MSSR management system is designed to satisfy requirements: unifiedmanagement view, management information coherence, scalability and capabilityto interact with management incapable internal devices. The system consists ofan extended communication model, which defines mechanisms to collect data fromdistributed internal elements in a reliable way and aggregate the data to create aunified management view. A database local to the virtualCP provides mechanismto mask information inconsistency and also use to store management incapable de-vices management information. From scalability test, we argued that the proposedmanagement system scales well and does not pose scalability threat to the overall
86
6.2 – Future research directions
architecture.
6.2 Future research directions
In this section we present some future research directions in MSSR management:
• In Chapter 3 we considered a single link NIC scenario where turning off a linkimplied turning off the network card itself. Both the energy saving problemmodeling and simulation can be extended to include a multi-link network cardscenario where saving in the links and NICs are performed separately.
• Our MSSR back-end router cluster design discussed in Chapter 4 does notconsider the QoS issues. Inclusion of such parameter increases the complexityof the problem but also results in a more complete work. In addition capacityscaling of an MSSR architecture is performed by adding one or more PCsto the back-end stage. However, the PCs to be added to the architecturehas to be carefully selected in such a way that the energy efficiency of thearchitecture is not compromised. Hence inclusion of quality of service issuesas an additional design requirement and energy efficient capacity scaling couldbe potential research activities in future.
• In extending Research Question 4 one could ask if it is possible to develop asingle MIB local to the virtualCP. In Chapter 5 we considered a virtual MIB -the internal manager has to collect and compile SNMP variables from internalcomponents upon arrival of a request from external manager. The time needto collect and compile the variables may increase with the number of inter-nal devices which could result in response delay. This is undesirable for sometime critical applications. Therefore, compiling the information ahead beforethe external manager request for it could be an alternative to reduce dissat-isfaction by the external manager operator [77, 78]. This requires building aMIB - a data base that stores compiled management information - local to thevirtualCP and updating frequently whether external managers ask for man-agement information or not. Thus, responding to an external manger requestjust involves querying the local data base which would be much faster thanthe method proposed in this thesis. In addition the management system couldinclude the remaining SNMP features not considered in this thesis, namelysupport to SNMP set and trap messages. How to set a MIB variable which islocated in scattered manner in the software router and get trap informationabout the software router are other challenges for future work.
87

Appendix A
Splittable item with variable binsize and cost - mapping
The combined problem considering router and link optimization is too complexand it is not easily mappable to any of the well-known NP-hard problems whenconsidered in its full form. Thus we consider a simplified version of the combinedproblem where the links are not considered, assuming that they are consuming anegligible amount of energy. In this case the router selection is sufficient to optimizethe overall energy consumption.
The simplified version of our problem is as follows:
minimize∑
r Prαr (A.1)
s.t.∑
r tir = 1 ∀i ∈ I (A.2)∑
i Ttir ≤ Crαr ∀r ∈ B (A.3)
αr ∈ {0,1} (A.4)
tir ∈ {0,1} ∨ [0,1] (A.5)
where I is the set of all items to be packed. This formulation is equivalent to theformulation of the single steps described in Sec. 3.1.2, except for the fact that herewe consider a more general formulation with many items which may be splittable(e.g. tir ∈ [0,1]) or unsplittable (e.g. tir ∈ {0,1}).
If the items are unsplittable, the problem can be directly mapped to the Gen-
eralized Cost Variable Sized Bin-Packing problem [65], where the itemsare represented by traffic flows and the bins by the routers. Since that problem isNP-hard, then the unsplittable version of our simplified problem is NP-hard as wellas the complete form which introduces the link optimization too.
On the other side, the splittable problem can be mapped to the Knapsack
problem [68], but looking at the allocation problem from a different perspective: theitems to be packed are the routers, meanwhile the knapsack is the traffic (which we
89

A – Splittable item with variable bin size and cost - mapping
consider as a single aggregated entity without considering network flows). But inthis case the mapping is not direct as in the previous case, since major differencesare present in the formulation of the problems. In fact, the Knapsack problem isas follows:
maximize∑
i vixi (A.6)
s.t.∑
i wixi ≤ W (A.7)
xi ∈ {0,1} (A.8)
where xi is the selection variable for router i, vi and wi are respectively the valueand the capacity of the router i and W is the size of the traffic. The two maindifferences in the formulations are:
1. the Knapsack problem is a maximization problem, while our problem is aminimization problem, due to the usage of values instead of costs.
2. in the Knapsack problem the total size of selected items must not exceedW , meanwhile in our case it must be at least equal to W in order to allocateenough capacity to forward the input traffic T .
The first issue is negligible according that a correct transformation from energycosts Pi to values vi exists (e.g. vi = 1
Pi). The second issue is also negligible
according that it is possible to obtain the minimum W ≥ T such that∑
i wixi ≤ W
and∑
i wixi ≥ T . If such an algorithm to select the optimal W exists, then ourproblem can be mapped directly to the Knapsack problem which is known to beNP-hard [68], thus the splittable version of our simplified problem is NP-hard aswell as its complete form.
Finally, a simple algorithm to select the optimal W is based on the iterativesolution of a sequence of Knapsack problems, starting with W = T then increasingW by the minimum unit at every step until the condition in Eq. A.9 is verified:
∑
i
wixi ≤ W ∧∑
i
wixi ≥ T (A.9)
When the condition in Eq. A.9 is verified the optimal W is obtained as well as theoptimal solution for the simplified energy saving problem.
90
Bibliography
[1] “Cisco Visual Networking Index: Global Mobile Data Traf-fic Forecast Update, 2011–2016,” white paper. [Online]. Avail-able: http://www.cisco.com/en/US/netsol/ns827/networking solutions subsolution.html [Accessed: Dec., 2012]
[2] “Internet usage statistics.” [Online]. Available:http://www.internetworldstats.com/stats.htm [Accessed: Nov., 2012]
[3] R. Schaller, “Moore’s law: past, present and future,” Spectrum, IEEE, vol. 34,no. 6, pp. 52–59, 1997.
[4] R. Tkach, “Scaling optical communications for the next decade and beyond,”Bell Labs Technical Journal, vol. 14, no. 4, pp. 3–9, 2010.
[5] J. Turner and D. Taylor, “Diversifying the internet,” in Global Telecommuni-cations Conference, 2005. GLOBECOM’05. IEEE, vol. 2. IEEE, 2005, pp.6–pp.
[6] “Linux.” [Online]. Available: http://www.kernel.org/ [Accessed: Dec., 2012]
[7] E. Kohler, R. Morris, B. Chen, J. Jannotti, and M. F. Kaashoek, “The ClickModular Router,” ACM Trans. Comput. Syst., vol. 18, no. 3, pp. 263–297, 2000.
[8] M. Handley, O. Hodson, and E. Kohler, “XORP: an Open Platform for NetworkResearch,” SIGCOMM Comput. Commun. Rev., vol. 33, no. 1, pp. 53–57, 2003.
[9] “Quagga routing suite.” [Online]. Available: http://www.nongnu.org/quagga/[Accessed: Dec., 2012]
[10] A. Bianco, R. Birke, D. Bolognesi, J. Finochietto, G. Galante, M. Mellia,M. Prashant, and F. Neri, “Click vs. Linux: two efficient open-source IP net-work stacks for software routers,” in High Performance Switching and Routing,2005. HPSR. 2005 Workshop on, May 2005, pp. 18–23.
[11] M. Dobrescu, N. Egi, K. Argyraki, B. Chun, K. Fall, G. Iannaccone, A. Knies,M. Manesh, and S. Ratnasamy, “RouteBricks: Exploiting parallelism to scalesoftware routers,” in ACM SOSP, 2009, pp. 15–28.
[12] “Vyatta Series 2500.” [Online]. Available: http://www.vyatta.com/ [Accessed:July, 2011]
[13] S. Han, K. Jang, K. Park, and S. Moon, “PacketShader: a GPU-acceleratedsoftware router,” SIGCOMM Comput. Commun. Rev., vol. 40, pp. 195–206,
91

Bibliography
August 2010.[14] “Cisco carrier routing system.” [Online]. Available:
http://www.cisco.com/en/US/products/ps5763/index.html [Accessed: Dec.,2012]
[15] A. Bianco, J. Finochietto, M. Mellia, F. Neri, and G. Galante, “Multistageswitching architectures for software routers,” Network, IEEE, vol. 21, no. 4,pp. 15–21, July–August 2007.
[16] A. Bianco, J. Finochietto, G. Galante, M. Mellia, D. Mazzucchi, andF. Neri, “Scalable layer-2/layer-3 multistage switching architectures for soft-ware routers,” GLOBECOM 2006, 2006.
[17] K. Argyraki, S. Baset, B. Chun, K. Fall, G. Iannaccone, A. Knies, E. Kohler,M. Manesh, S. Nedevschi, and S. Ratnasamy, “Can software routers scale?”in Proceedings of the ACM workshop on Programmable routers for extensibleservices of tomorrow. ACM, 2008, pp. 21–26.
[18] I. Keslassy and N. McKeown, “Maintaining packet order in two-stage switches,”in INFOCOM 2002. Twenty-First Annual Joint Conference of the IEEE Com-puter and Communications Societies. Proceedings. IEEE, vol. 2. IEEE, 2002,pp. 1032–1041.
[19] A. Bianco, R. Birke, J. Finochietto, L. Giraudo, F. Marenco, M. Mellia,A. Khan, and D. Manjunath, “Control and management plane in a multi-stage software router architecture,” in High Performance Switching and Rout-ing, 2008. HSPR 2008. International Conference on, May 2008, pp. 235–240.
[20] “T Series Core Routers.” [Online]. Available:www.juniper.net/us/en/local/pdf/datasheets/1000051-en.pdf [Accessed:Dec., 2012]
[21] A. Bianco, F. G. Debele, and L. Giraudo, “Energy saving in distributed routerarchitectures,” Communications (ICC), 2012 IEEE International Conferenceon, June 2012.
[22] ——, “On-line energy saving in a distributed multistage router architecture,”pp. 1–6, December 2012.
[23] A. Bianco, F. G. Debele, and N. Li, “Energy efficient distributed router design,”Communications (ICC), 2013 IEEE International Conference on, June 2013.
[24] A. Bianco, R. Birke, F. G. Debele, and L. Giraudo, “SNMP Management ina Distributed Software Router Architecture,” in Communications (ICC), 2011IEEE International Conference on. IEEE, 2011, pp. 1–5.
[25] A. Bianco, J. M. Finochietto, G. Galante, M. Mellia, and F. Neri, “Open-Source PC-based software souters: A viable approach to high-performancepacket switching,” in QoS-IP (Third international workshop on QoS in mul-tiservice IP networks). Springer Berlin / Heidelberg, 2005, pp. 353–366.
[26] A. Bianco, R. Birke, G. Botto, M. Chiaberge, J. Finochietto, G. Galante,M. Mellia, F. Neri, and M. Petracca, “Boosting the performance of PC-based
92
Bibliography
software routers with FPGA-enhanced network interface cards,” in High Per-formance Switching and Routing, 2006 Workshop on. IEEE, 2006, pp. 6–pp.
[27] M. Petracca, R. Birke, and A. Bianco, “HERO: High-speed Enhanced RoutingOperation in Ethernet NICs for software routers,” Computer Networks, vol. 53,no. 2, pp. 168–179, 2009.
[28] C. Partridge, S. Member, P. P. Carvey, I. Castineyra, T. Clarke, J. Rokosz,J. Seeger, M. Sollins, S. Starch, B. Tober, G. D. Troxel, D. Waitzman, andS. Winterble, “A 50-Gb/s IP router,” IEEE/ACM Transactions on Networking,vol. 6, pp. 237–248, 1998.
[29] A. Bianco, R. Birke, L. Giraudo, and N. Li, “Multistage software routers in avirtual environment,” in Global Telecommunications Conference (GLOBECOM2010), 2010 IEEE. IEEE, 2010, pp. 1–5.
[30] R. Bolla, R. Bruschi, G. Lamanna, and A. Ranieri, “DROP: An open-sourceproject towards distributed SW router architectures,” in Global Telecommuni-cations Conference, 2009. GLOBECOM 2009. IEEE. IEEE, 2009, pp. 1–6.
[31] L. Yang, R. Dantu, T. Anderson, and R. Gopal, “Forwarding and control ele-ment separation (forces) framework,” RFC3746, pp. 5–30, 2004.
[32] V. Manral, R. White, and A. Shaikh, “Benchmarking basic OSPF single routercontrol plane,” IETF Request for Comments, vol. 4061, 2005.
[33] M. Webb et al., “SMART 2020: Enabling the low carbon economy in theinformation age,” The Climate Group. London, vol. 1, no. 1, pp. 1–1, 2008.
[34] S. Mingay, “Green IT: the new industry shock wave,” Gartner RAS Core Re-search Note G, vol. 153703, p. 2, 2007.
[35] “Approximate desktop, notebook, & netbook power usage.” [Online]. Available:http://www.upenn.edu/computing/provider/docs/hardware/powerusage.html[Accessed: March, 2012]
[36] D. Neilson, “Photonics for switching and routing,” Selected topics in quantumelectronics, IEEE Journal of, vol. 12, no. 4, pp. 669–678, July–Aug. 2006.
[37] “ARBOR Networks.” [Online]. Available:http://asert.arbornetworks.com/2009/08/the-internet-after-dark/ [Accessed:Dec., 2012]
[38] M. Gupta and S. Singh, “Greening of the Internet,” in Proceedings of the 2003conference on Applications, technologies, architectures, and protocols for com-puter communications, ser. SIGCOMM ’03. ACM, 2003, pp. 19–26.
[39] J. Chase and R. Doyle, “Balance of power: Energy management for server clus-ters,” in Proceedings of the 8th Workshop on Hot Topics in Operating Systems(HotOS), 2001, pp. 163–165.
[40] E. Pinheiro, R. Bianchini, E. Carrera, and T. Heath, “Dynamic cluster recon-figuration for power and performance,” in Compilers and operating systems forlow power. Kluwer Academic Publishers, 2003, pp. 75–93.
93

Bibliography
[41] T. Heath, B. Diniz, E. Carrera, W. Meira Jr, and R. Bianchini, “Energy conser-vation in heterogeneous server clusters,” in Proceedings of the tenth ACM SIG-PLAN symposium on Principles and practice of parallel programming. ACM,2005, pp. 186–195.
[42] Broadcom Corporation, “Broadcom NetXtreme II network adapter user guide.”[Online]. Available: http://www.broadcom.com/docs/support/ethernetnic/Broadcom NetXtremeII Server T7.4.pdf [Accessed: Dec. 2012]
[43] K. Rajamani and C. Lefurgy, “On evaluating request-distribution schemes forsaving energy in server clusters,” in Performance Analysis of Systems and Soft-ware, 2003. ISPASS. 2003 IEEE International Symposium on. IEEE, 2003,pp. 111–122.
[44] S. Nedevschi, L. Popa, G. Iannaccone, S. Ratnasamy, and D. Wetherall, “Re-ducing network energy consumption via sleeping and rate-adaptation,” in Pro-ceedings of the 5th USENIX Symposium on Networked Systems Design andImplementation, ser. NSDI’08. USENIX Association, 2008, pp. 323–336.
[45] L. Chiaraviglio, M. Mellia, and F. Neri, “Energy-aware backbone networks: Acase study,” in Communications Workshops, 2009. ICC Workshops 2009. IEEEInternational Conference on, June ’09, pp. 1–5.
[46] J. Restrepo, C. Gruber, and C. Machuca, “Energy profile aware routing,” inCommunications Workshops, 2009. ICC Workshops 2009. IEEE InternationalConference on, June 2009, pp. 1–5.
[47] “Energy efficiency for network equipment: two stepsbeyond greenwashing,” white Paper. [Online]. Available:http://www.juniper.net/us/en/local/pdf/whitepapers/2000284-en.pdf [Ac-cessed: Dec., 2012]
[48] R. Bolla, R. Bruschi, F. Davoli, and F. Cucchietti, “Energy efficiency in the fu-ture Internet: A survey of existing approaches and trends in energy-aware fixednetwork infrastructures,” Communications Surveys Tutorials, IEEE, vol. 13,no. 2, pp. 223–244, quarter 2011.
[49] L. Barroso, J. Dean, and U. Holzle, “Web search for a planet: The Googlecluster architecture,” Micro, IEEE, vol. 23, no. 2, pp. 22–28, March-April 2003.
[50] Q. Ye and M. MacGregor, “Cluster-based IP router: Implementation and evalu-ation,” in Cluster Computing, 2006 IEEE International Conference on. IEEE,2006, pp. 1–10.
[51] “Windows clustering.” [Online]. Available:http://technet.microsoft.com/en-us/library/cc757731(v=ws.10) [Accessed:Dec., 2012]
[52] “Domino 8.0 administration.” [Online]. Available:http://publib.boulder.ibm.com/infocenter/domhelp/v8r0/index.jsp [Accessed:Dec., 2012]
[53] K. McCloghrie and M. Rose, “RFC 1213 Management Information Base for
94
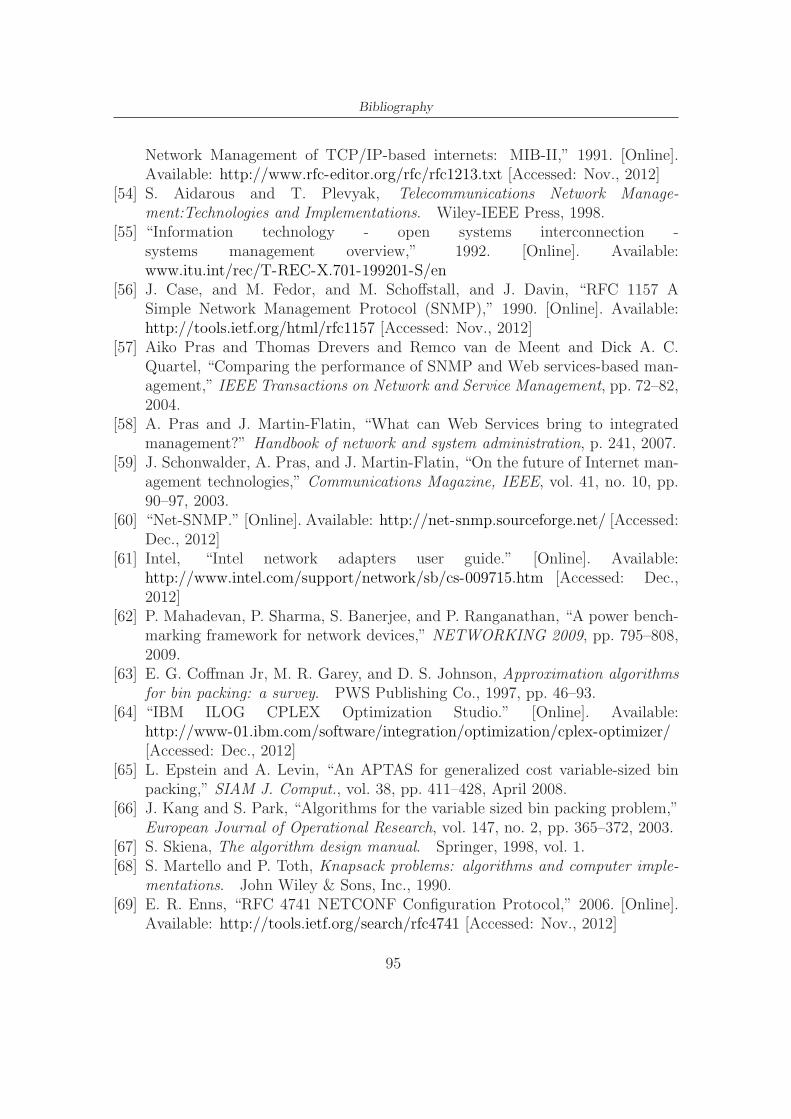
Bibliography
Network Management of TCP/IP-based internets: MIB-II,” 1991. [Online].Available: http://www.rfc-editor.org/rfc/rfc1213.txt [Accessed: Nov., 2012]
[54] S. Aidarous and T. Plevyak, Telecommunications Network Manage-ment:Technologies and Implementations. Wiley-IEEE Press, 1998.
[55] “Information technology - open systems interconnection -systems management overview,” 1992. [Online]. Available:www.itu.int/rec/T-REC-X.701-199201-S/en
[56] J. Case, and M. Fedor, and M. Schoffstall, and J. Davin, “RFC 1157 ASimple Network Management Protocol (SNMP),” 1990. [Online]. Available:http://tools.ietf.org/html/rfc1157 [Accessed: Nov., 2012]
[57] Aiko Pras and Thomas Drevers and Remco van de Meent and Dick A. C.Quartel, “Comparing the performance of SNMP and Web services-based man-agement,” IEEE Transactions on Network and Service Management, pp. 72–82,2004.
[58] A. Pras and J. Martin-Flatin, “What can Web Services bring to integratedmanagement?” Handbook of network and system administration, p. 241, 2007.
[59] J. Schonwalder, A. Pras, and J. Martin-Flatin, “On the future of Internet man-agement technologies,” Communications Magazine, IEEE, vol. 41, no. 10, pp.90–97, 2003.
[60] “Net-SNMP.” [Online]. Available: http://net-snmp.sourceforge.net/ [Accessed:Dec., 2012]
[61] Intel, “Intel network adapters user guide.” [Online]. Available:http://www.intel.com/support/network/sb/cs-009715.htm [Accessed: Dec.,2012]
[62] P. Mahadevan, P. Sharma, S. Banerjee, and P. Ranganathan, “A power bench-marking framework for network devices,” NETWORKING 2009, pp. 795–808,2009.
[63] E. G. Coffman Jr, M. R. Garey, and D. S. Johnson, Approximation algorithmsfor bin packing: a survey. PWS Publishing Co., 1997, pp. 46–93.
[64] “IBM ILOG CPLEX Optimization Studio.” [Online]. Available:http://www-01.ibm.com/software/integration/optimization/cplex-optimizer/[Accessed: Dec., 2012]
[65] L. Epstein and A. Levin, “An APTAS for generalized cost variable-sized binpacking,” SIAM J. Comput., vol. 38, pp. 411–428, April 2008.
[66] J. Kang and S. Park, “Algorithms for the variable sized bin packing problem,”European Journal of Operational Research, vol. 147, no. 2, pp. 365–372, 2003.
[67] S. Skiena, The algorithm design manual. Springer, 1998, vol. 1.[68] S. Martello and P. Toth, Knapsack problems: algorithms and computer imple-
mentations. John Wiley & Sons, Inc., 1990.[69] E. R. Enns, “RFC 4741 NETCONF Configuration Protocol,” 2006. [Online].
Available: http://tools.ietf.org/search/rfc4741 [Accessed: Nov., 2012]
95
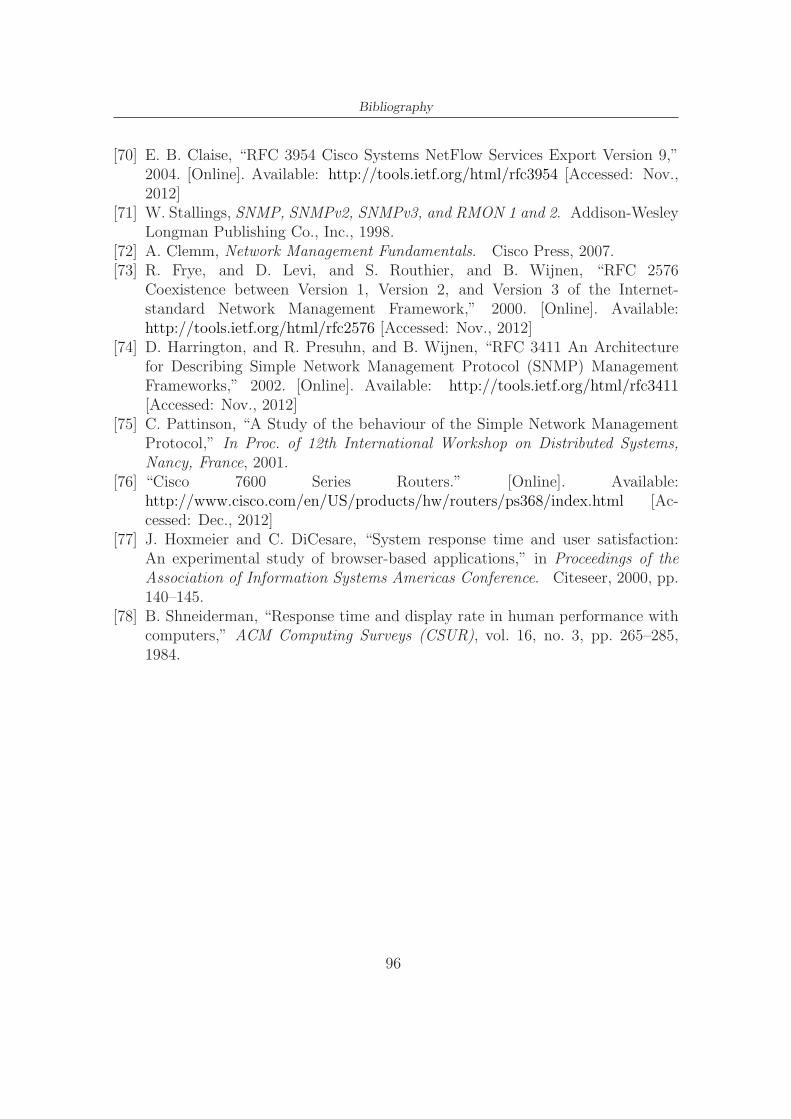
Bibliography
[70] E. B. Claise, “RFC 3954 Cisco Systems NetFlow Services Export Version 9,”2004. [Online]. Available: http://tools.ietf.org/html/rfc3954 [Accessed: Nov.,2012]
[71] W. Stallings, SNMP, SNMPv2, SNMPv3, and RMON 1 and 2. Addison-WesleyLongman Publishing Co., Inc., 1998.
[72] A. Clemm, Network Management Fundamentals. Cisco Press, 2007.[73] R. Frye, and D. Levi, and S. Routhier, and B. Wijnen, “RFC 2576
Coexistence between Version 1, Version 2, and Version 3 of the Internet-standard Network Management Framework,” 2000. [Online]. Available:http://tools.ietf.org/html/rfc2576 [Accessed: Nov., 2012]
[74] D. Harrington, and R. Presuhn, and B. Wijnen, “RFC 3411 An Architecturefor Describing Simple Network Management Protocol (SNMP) ManagementFrameworks,” 2002. [Online]. Available: http://tools.ietf.org/html/rfc3411[Accessed: Nov., 2012]
[75] C. Pattinson, “A Study of the behaviour of the Simple Network ManagementProtocol,” In Proc. of 12th International Workshop on Distributed Systems,Nancy, France, 2001.
[76] “Cisco 7600 Series Routers.” [Online]. Available:http://www.cisco.com/en/US/products/hw/routers/ps368/index.html [Ac-cessed: Dec., 2012]
[77] J. Hoxmeier and C. DiCesare, “System response time and user satisfaction:An experimental study of browser-based applications,” in Proceedings of theAssociation of Information Systems Americas Conference. Citeseer, 2000, pp.140–145.
[78] B. Shneiderman, “Response time and display rate in human performance withcomputers,” ACM Computing Surveys (CSUR), vol. 16, no. 3, pp. 265–285,1984.
96

List of Abbreviations
ACL Access Control List
CORBA Common Object Request Broker Architecture
CPU Central Processing Unit
DBMS Data base management system
DROP Distributed SW ROuter Project
ECR energy consumption ratio
FIFO First In, First Out
ForCES Forwarding and Control Element Separation
FPGA Field-Programmable Gate Array
GPUs Graphics Processing Units
ILP Integer linear programming
LBs Load Balancers
MIB Management Information Base
MILP Mixed Integer Linear programming
MRTG Multi Router Traffic Grapher
MSSR Multi-Stage Software Router
NAT Network Address Translation
NIC Network Interface Card
NMS Network Management Systems
97
List of Abbreviations
OID object Identifiers
OSI SM Open Systems Interconnection - systems managment
PCI Peripheral Component Interconnect
PDU Protocol data unit
pps packets per second
QoS Quality-of-Service
SMI Structure of Management Information
SNMP Simple Network Management Protocol
SR Software Router
VirtualCP Virtual Control Processor
XML Extensible Markup Language
XORP eXtensible Open Router Platform
98
Index
Aggregator, 74
Back-end routers, 4design, 58power management, 23
Cluster design, 18, 57capacity based scaling, 18, 61goal programming, 58Google cluster, 18, 61heuristic approach, 60locally optimal, 61
Distributed software routerDROP, 15Multistage software router, 14RouterBricks, 14
Load balancer, 4
Management information base, 71mapping, 78
Multistage architecture, 4, 14virtualCP, 5back-end PCs, 4back-end routers, 4control plan, 6data plan, 5load balancer, 4management plane, 6, 71
Network management, 19, 71communication model, 76architecture, 74management information base, 71, 78
protocols, 72Network management architecture, 74
aggregator, 74requirements, 73scalability, 82
Network management requirements, 73
Off-line algorithms, 24link optimization, 30performance, 30router optimization, 28
On-line algorithms, 35complexity, 42description, 38performance, 44
Open-source network application, 2Click Modular Router, 2Linux, 2Quagga, 2XORP, 2
Power management, 15, 23modeling, 25, 36off-line algorithms, 24on-line algorithm, 35
Software router, 2, 11Click Modular Router, 2multistage architecture, 4PacketShader, 13performance, 2
VirtualCP, 5
99

About the author
Fikru Getachew was born in Fitche, Ethiopia, on Setember 19th, 1974. He stud-ied Electrical and Electronics Technology, Nazareth, Ethiopia and graduated in1998 (Batchelor of Electrical/Electronics Technology). After four years of servicein govenmental university as an assistance graduate, he started to pursue his studyand obtained Masters of Technology(MTech) from Indian institute of Technology,Kanpur, India in 2004. Until he joined Politecnico di Torino as PhD student in2009, he served at Arba Minch University, Ethiopia as lecturer. In those years healso worked as an ICT coordinator (2006 - 2009) and Departement head (2004 -2006). During his office he successfully coordinated and follow up implementationof World Bank financed projects which he won based on competition among otheruniversities in the country.
Since Jan. 2009 he has been with Department of Electronics and Telecommuni-cations (DET) of Politecnico di Torino performing research activity mainly relatedto distributed software routers and management. His main topics of interest in-clude distributed systems, network management, network virtualization and cloudcomputing.
A list of his publications in reverse chronological order are:
• Andrea Bianco, Fikru Getachew Debele, Nanfang Li, Energy Efficient Dis-tributed Router Design, IEEE International Conference on Communications,Budapest, Hangary, June 2013
• Andrea Bianco, Fikru Getachew Debele, Luca Giraudo, On-line DifferentialEnergy Saving in a Distributed Router Architecture, IEEE Global Communi-cation conference, California, USA, December 2012
• Andrea Bianco, Fikru Getachew Debele, Luca Giraudo, Energy Saving in Dis-tributed Router Architecture, IEEE International Conference on Communica-tions, Ottawa, Canada, June 2012
• Andrea Bianco, Robert Birke, Fikru Getachew Debele, Luca Giraudo, SNMPManagement in a Distributed Software Router Architecture, IEEE Interna-tional Conference on Communications, Kyoto, Japan, June 2011
101