distributed energy resources in practice: a case study ... · download from ... tom ditoro (hdr)...
TRANSCRIPT

LBNL -52753
Distributed Energy Resources in Practice: A Case Study Analysis and Validation of LBNL’s Customer Adoption Model
Owen Bailey, Charles Creighton, Ryan Firestone, Chris Marnay, and Michael Stadler
Environmental Energy Technologies Division February 2003 Download from http://eetd.lbl.gov/EA/EMP The work described in this report was funded by the Assistant Secretary of Energy Efficiency and Renewable Energy, Distributed Energy and Electric Reliability Program of the U.S. Department of Energy under Contract No. DE-AC03-76SF00098.
ERNEST ORLANDO LAWRENCE BERKELEY NATIONAL LABORATORY

Disclaimer
This document was prepared as an account of work sponsored by the United States Government. While this document is believed to contain correct information, neither the United States Government nor any agency thereof, nor The Regents of the University of California, nor any of their employees, makes any warranty, express or implied, or assumes any legal responsibility for the accuracy, completeness, or usefulness of any information, apparatus, product, or process disclosed, or represents that its use would not infringe privately owned rights. Reference herein to any specific commercial product, process, or service by its trade name, trademark, manufacturer, or otherwise, does not necessarily constitute or imply its endorsement, recommendation, or favoring by the United States Government or any agency thereof, or The Regents of the University of California. The views and opinions of authors expressed herein do not necessarily state or reflect those of the United States Government or any agency thereof, or The Regents of the University of California. Ernest Orlando Lawrence Berkeley National Laboratory is an equal opportunity employer.

LBNL-52753
Distributed Energy Resources in Practice:
A Case Study Analysis and Validation of LBNL’s Customer Adoption Model
Prepared for the Distributed Energy and Electric Reliability Program
U.S. Department of Energy
Principal Authors Owen Bailey, Charles Creighton, Ryan Firestone, Chris Marnay, and Michael Stadler
Other DER-CAM Team Members
Emily Bartholomew, Norman Bourassa, Jennifer Edwards, Kristina Hamachi LaCommare, Tim Lipman, and Afzal Siddiqui
Energy Analysis Department Ernest Orlando Lawrence Berkeley National Lab
One Cyclotron Road, MS 90-4000 Berkeley, CA 94720-8061
February 2003 The work described in this paper was funded by the Assistant Secretary of Energy Efficiency and Renewable Energy, Distributed Energy and Electric Reliability Program of the U.S. Department of Energy under Contract No. DE-AC03-76SF00098.


Distributed Energy Resources in Practice
i
Abstract This report describes a Berkeley Lab effort to model the economics and operation of small-scale (<500 kW) on-site electricity generators based on real-world installations at several example customer sites. This work builds upon the previous development of the Distributed Energy Resource Customer Adoption Model (DER-CAM), a tool designed to find the optimal combination of installed equipment, and idealized operating schedule, that would minimize the site’s energy bills, given performance and cost data on available DER technologies, utility tariffs, and site electrical and thermal loads over a historic test period, usually a recent year. This study offered the first opportunity to apply DER-CAM in a real-world setting and evaluate its modeling results. DER-CAM has three possible applications: first, it can be used to guide choices of equipment at specific sites, or provide general solutions for example sites and propose good choices for sites with similar circumstances; second, it can additionally provide the basis for the operations of installed on-site generation; and third, it can be used to assess the market potential of technologies by anticipating which kinds of customers might find various technologies attractive. A list of approximately 90 DER candidate sites was compiled and each site’s DER characteristics and their willingness to volunteer information was assessed, producing detailed information on about 15 sites of which five sites were analyzed in depth. The five sites were not intended to provide a random sample; rather they were chosen to provide some diversity of business activity, geography, and technology. More importantly, they were chosen in the hope of finding examples of true business decisions made based on somewhat sophisticated analyses, and pilot or demonstration projects were avoided. Information on the benefits and pitfalls of implementing a DER system was also presented from an additional ten sites including agriculture, education, health care, airport, and manufacturing facilities. The five sites are:
1. A&P Waldbaum’s Supermarket: A Long Island supermarket that has installed a microturbine with CHP for desiccant dehumidification.
2. Guarantee Savings Building: An historic office building in California’s central valley that has undergone a major remodel and will house two federal agencies. Three fuel cells with an absorption chiller are being installed.
3. The Orchid: A Hawaiian resort that has installed propane fired reciprocating engines and an absorption chiller.
4. BD Biosciences Pharmingen: A San Diego biotech company that is installing reciprocating engines with heat recovery for the almost constant space heating required because of frequent air changes needed for laboratories.
5. USPS San Bernardino: A postal sorting facility in southern California that is considering a reciprocating engine, possibly with absorption cooling.
All of these sites provided enough information on their loads, the tariffs they face, any subsidies or incentives they expected, and their analysis of their project for a parallel DER-CAM analysis to be completed. However, their various projects were at different stages of completion, so that the accuracy of available data was not consistent. For example, the Guarantee Savings Building

Distributed Energy Resources in Practice
ii
remodel that was in progress at the time of this study was so major that historic energy use data was of no use and had to be replaced by simulation. Scenarios were modeled to show the potential options and the financial value of different energy system designs such as the base case energy consumption with no DER installation, unrestricted installation of DER technologies, and a replication of the site’s DER installation decision. The modeling results also emphasized the importance of DER grants and included sensitivity analyses on important parameters such as the spark-spread rate, standby charges, and general tariff structures. This study accomplished the following goals: DER site project experience was analyzed, described, and disseminated; real-world problems involved with DER adoption decision-making and system design were described; DER-CAM financial estimates and technology adoption decisions were validated; the accuracy of DER-CAM was improved and its capabilities were expanded based on real-world experience; contacts were established with relevant DER sites for future research. The results of this case study report provide information on DER system costs and benefits that can be used to analyze the financial value of the DER project using tools such as net present value (NPV) and payback analysis. Important results in the report are the head-to-head comparison of DER technologies chosen at the site and the technologies recommended by DER-CAM. Typically the DER-CAM solution involves a higher capacity installation than that chosen by the site. Some sites’ technology adoption decisions differed from DER-CAM due to factors not included in the model. Comparisons of DER-CAM results to the sites’ estimates of DER system costs and benefits are presented. Note that most projects were in the installation or initial operation stage and actual costs could diverge significantly because of unanticipated operating conditions. The key results are:
• Calculating financial costs and benefits of each DER system and using this information to validate DER-CAM’s estimates.
• In general, DER-CAM and Berkeley Lab staff were able to reproduce energy bills and other
key data with reasonable accuracy, typically within about 10%.
• DER-CAM generally found reciprocating engines often with absorption cooling to be the most attractive technology and, consequently, fairly accurately predicted its adoption for those sites installing engines. In one notable case where DER-CAM chose a reciprocating engine, the Guarantee Savings Building, the developers have adopted fuel cells in large part for reasons not incorporated into DER-CAM.
• DER-CAM tends to choose higher capacities than sites themselves choose. This seems to
suggest a quite reasonable conservatism and risk averseness on the part of customers.
• This project has provided an excellent opportunity for Berkeley Lab to exercise DER-CAM, to learn about real world DER installations, and to develop a base of data and personal contacts that will be invaluable in future research on DER adoption.

Distributed Energy Resources in Practice
iii
Acknowledgments
We would like to thank the people involved with providing assistance during this case study report. Thanks to those at the five sites studied in depth: A&P Supermarket
Hugh Henderson (CDH Energy) Steve DePalo (KeySpan Energy) David Tomicki (A&P) Walter Woods (NAEA) BD Biosciences Pharmingen
Bob Schultze (BD Biosciences Pharmingen) Ray Miller (Clarus Energy) Wendy Gumb (Clarus Energy) Guarantee Savings Building
Ron Allison (Zahra Properties) Sam Logan (Logan Energy) Jack O. Payne (Nova Greening) Ann Heiniger (Champion Industrial Contractors) Ken McCormic (Electric Motor Shop) The Orchid
Orville Thompson (The Orchid) Chris Winiewicz (Hess Microgen) Jennifer Collins (Hess Microgen) United States Postal Service, San Bernardino Mail Handling Facility
Steve Szychulda (USPS, San Bernardino) Ray Levinson (USPS) Joe Vandenberg (USPS) Bill Golove (Berkeley Lab) Dave Suich (SoCal Gas) Earl Plummer (SoCal Gas) Ben Hough (Tetratech)

Distributed Energy Resources in Practice
iv
Thanks to the people who helped to arrange site visits for other sites, especially: AA Dairy
Bob Aman (AA Dairy) Steve Zicari (Cornell University) Byron Bergen School District
Mike List (Byron Bergen) Bill Cristofaro (IEC Engineering) Cortland Community Hospital
Dave Schilling (Entrust Energy) East Bay Municipal Utility District
Diosdado V. Hernandez (EBMUD) Frank Pizzimenti (EBMUD) James Hankins (EBMUD) Greater Rochester International Airport
Patrick Corrigan (Siemens Engineering) Bill Cristofaro (IEC Engineering) Harbec Plastics
Robert Bechtold (Harbec Plastics) Sea Crest Health Care Facility
Gregg Giampaolo (All Systems Energy) Rick Cincotta (All Systems Energy) John Franceschina (KeySpan Energy) Wyoming County Community Hospital
Leon Kuczmarski (WCCH) Ted Fritz (WCCH) Steve Aughey (Trane) Thanks to others who provided information about their DER systems: Conde Nast
Bob Fox (Fox and Fowle Architects)

Distributed Energy Resources in Practice
v
Todd Coulard (The Durst Organization) First National Bank of Omaha
Keith A. Spitznagel (Sure Power) Dennis Hughes (First National Buildings, Inc.) Tom Ditoro (HDR) Tim Lange (HDR) Bob Lobsiger (FNBO) Richard Callahan (Enerfex) Brian Johnston (FTS) PC Richards
Bill Cristofaro (IEC Engineering) Joe Weinschreider (IEC Engineering) Southern Container
Robert Braun (KeySpan Engineering) Bruce Schadler (KeySpan Engineering) SUNY Buffalo
Fred Smeader (SUNY Buffalo) United States Postal Service, Alaska
Jim Buckley (Energy Alternatives) Cathe Grosshandler (USPS Alaska) Peter Poray (Chugach Electric Association) Thanks to the people at NYSERDA for arranging the CHP conference in June 2002, and the presenters at each session. Also, thanks to Steve Zicari and Stefan Minott, graduate students in Biological and Environmental Engineering at Cornell University, for information on the digester system at AA Dairy and for data obtained in the process of completing their Master's theses. Thanks to Joseph H Eto, and Ernst Worrell of Berkeley Lab, and Shirley F Rivera of AESC, and Nag Patibandla and Dana Levy at NYSERDA for taking the time to review this work and provide useful feedback. The authors would also like to express their gratitude for the support and guidance of our program managers for this work, Gilbert C Bindewald and Patricia A Hoffman, and to their office, the Distributed Energy and Electric Reliability Office of the U.S. Department of Energy, for supporting it.


Distributed Energy Resources in Practice
vii
Table of Contents
Abstract ............................................................................................................................................ i Acknowledgments.......................................................................................................................... iii Table of Contents.......................................................................................................................... vii List of Tables ................................................................................................................................. xi Appendix Tables .......................................................................................................................... xiii List of Figures ............................................................................................................................... xv Appendix Figures........................................................................................................................ xvii Acronyms and Definitions ........................................................................................................... xix Executive Summary ..................................................................................................................... xxi 1. Introduction............................................................................................................................. 1
1.1 Background..................................................................................................................... 1 1.2 The Distributed Energy Resource-Customer Adoption Model ...................................... 2 1.3 Purpose of Research........................................................................................................ 3
1.3.1 Analyze, Describe, and Disseminate DER Site Project Experience....................... 3 1.3.2 Describe Real-World Issues Involved with DER Adoption Decision-Making and System Design ........................................................................................................................ 4 1.3.3 Validate DER-CAM Financial Estimates and Technology Adoption Decisions ... 4 1.3.4 Improve DER-CAM Accuracy and Expand its Capabilities Based on Real-World Experience............................................................................................................................... 5 1.3.5 Establish Contacts with Relevant DER Sites for Future Research ......................... 5 1.3.6 Methodology & Application Summary .................................................................. 5
2. Methodology........................................................................................................................... 9 2.1 Site Selection Procedures................................................................................................ 9
2.1.1 Candidate Site List Compilation............................................................................. 9 2.1.2 Required and Desired Site Characteristics.............................................................. 9 2.1.3 Final Site Selection ............................................................................................... 10
2.2 Data Requirements for Each Site.................................................................................. 12 2.2.1 Utility Provider and Applicable Tariff Schedules: ............................................... 12 2.2.2 Performance and Cost Characteristics for each of the DG Technologies Considered ............................................................................................................................ 12 2.2.3 Load Data.............................................................................................................. 13 2.2.4 Financial Analysis................................................................................................. 13 2.2.5 Special Constraints Faced By the Site .................................................................. 16
2.3 Tariff Information ......................................................................................................... 16 2.4 DOE-2 Load Development ........................................................................................... 17 2.5 Automation Manager .................................................................................................... 18 2.6 Scenarios Considered for Each Site.............................................................................. 19
2.6.1 Description of the Six Scenarios........................................................................... 19 2.6.2 Graphical Representation of Scenario Results...................................................... 21
2.7 Sensitivity Analysis ...................................................................................................... 22 2.7.1 Spark Spread Sensitivity ....................................................................................... 22 2.7.2 Standby Charge Sensitivity................................................................................... 23 2.7.3 Flat Rate Electricity Sensitivity ............................................................................ 25

Distributed Energy Resources in Practice
viii
2.8 Assumptions of Modeling Process................................................................................ 25 2.9 Including Rebates and Grants for DER Technologies in Model .................................. 28
2.9.1 CPUC Self-generation Incentive Program, : ......................................................... 28 2.9.2 New York State Funding for Energy Efficiency and DER................................... 30 2.9.3 DOD and CERL Climate Change Fuel Cell program........................................... 30
3. The Test Cases ...................................................................................................................... 31 3.1 Summary of the Test Cases........................................................................................... 31 3.2 Case A: A&P Waldbaum’s Supermarket, Hauppauge, NY.......................................... 33
3.2.1 The Decision-Making Process .............................................................................. 35 3.2.2 Description of the Data Collection Process .......................................................... 42 3.2.3 Assumptions of Modeling Process........................................................................ 45 3.2.4 Model Results ....................................................................................................... 46 3.2.5 Discussion of Results............................................................................................ 50 3.2.6 Limitations of this Analysis .................................................................................. 55 3.2.7 Observed Outcomes of Installed Technology....................................................... 56 3.2.8 Conclusions from A&P Test Site Analysis........................................................... 56
3.3 Case B: Guarantee Savings Building, Fresno California.............................................. 59 3.3.1 The Decision-Making Process .............................................................................. 61 3.3.2 Description of Data Collection Process ................................................................ 65 3.3.3 Assumptions of Modeling Process........................................................................ 67 3.3.4 Model Results ....................................................................................................... 67 3.3.5 Discussion of Results............................................................................................ 70 3.3.6 Limitations of this Analysis .................................................................................. 74 3.3.7 Observed Outcomes of Installed Technology....................................................... 75 3.3.8 Conclusions from GSB Test Site Analysis ........................................................... 75
3.4 Case C: The Orchid Resort, Mauna Lani, Hawaii ........................................................ 77 3.4.1 The Decision-Making Process .............................................................................. 78 3.4.2 Description of Data Collection Process ................................................................ 82 3.4.3 Assumptions of Modeling Process........................................................................ 83 3.4.4 Model Results ....................................................................................................... 84 3.4.5 Discussion of Results............................................................................................ 86 3.4.6 Limitations of this Analysis .................................................................................. 90 3.4.7 Observed Outcomes of Installed Technology:...................................................... 91 3.4.8 Conclusions from The Orchid Resort Test Site Analysis ..................................... 91
3.5 Case D: BD Biosciences Pharmingen........................................................................... 93 3.5.1 The Decision-Making Process: ............................................................................. 94 3.5.2 Description of Data Collection Process ................................................................ 99 3.5.3 Assumptions of Modeling Process........................................................................ 99 3.5.4 Model Results ..................................................................................................... 100 3.5.5 Discussion of Results.......................................................................................... 102 3.5.6 Limitations of this Analysis ................................................................................ 106 3.5.7 Observed Outcomes of Installed Technology..................................................... 107 3.5.8 Conclusions from BD Biosciences Pharmingen Test Site Analysis................... 107
3.6 Case E: San Bernardino USPS Handling Facility, Redlands, California ................... 109 3.6.1 The Decision Process:......................................................................................... 110 3.6.2 Description of the Data Collection Process ........................................................ 112

Distributed Energy Resources in Practice
ix
3.6.3 Assumptions of Modeling Process...................................................................... 113 3.6.4 Model Results ..................................................................................................... 113 3.6.5 Discussion of Results.......................................................................................... 116 3.6.6 Limitations of this Analysis ................................................................................ 120 3.6.7 Observed Outcomes of Installed Technology..................................................... 121 3.6.8 Conclusions from San Bernardino Test Site Analysis........................................ 121
4. Other Test Cases ................................................................................................................. 123 4.1 AA Dairy..................................................................................................................... 124 4.2 Alaska USPS............................................................................................................... 125 4.3 Byron Bergen Schools ................................................................................................ 125 4.4 Compudye ................................................................................................................... 126 4.5 Conde Nast.................................................................................................................. 127 4.6 Cortland Memorial Hospital ....................................................................................... 127 4.7 East Bay Municipal Utility District ............................................................................ 128 4.8 First National Bank of Omaha .................................................................................... 129 4.9 Greater Rochester International Airport ..................................................................... 130 4.10 Green Mountain Coffee .............................................................................................. 131 4.11 Harbec Plastics............................................................................................................ 131 4.12 International Paper ...................................................................................................... 132 4.13 PC Richards ................................................................................................................ 133 4.14 Resource Conservation Management ......................................................................... 133 4.15 Sea Crest Health Care Facility.................................................................................... 133 4.16 Southern Container ..................................................................................................... 134 4.17 State University of New York, Buffalo ...................................................................... 135 4.18 Synagro ....................................................................................................................... 135 4.19 Twin Birch Farm......................................................................................................... 135 4.20 Victoria Packing Corp................................................................................................. 136 4.21 Wyoming County Community Hospital ..................................................................... 136
5. Lessons in Decision-Making and DER Adoption............................................................... 141 6. Discussion of Overall Results............................................................................................. 145 7. Limitations of Analysis....................................................................................................... 157 8. Areas for DER-CAM Improvement and Further Study...................................................... 161
8.1.1 Interface features to add to DER-CAM .............................................................. 161 8.1.2 Additional data to obtain for DER-CAM............................................................ 161 8.1.3 Capabilities to add to DER-CAM....................................................................... 161
9. Conclusion .......................................................................................................................... 165 10. References....................................................................................................................... 167 Appendix A. Tabular Presentation of Results ...................................................................... 169
A.1 Results for A&P.......................................................................................................... 169 A.2 Results for Guaranteed Savings Building ................................................................... 172 A.3 Results for The Orchid................................................................................................ 175 A.4 Results for BD Biosciences Pharmingen .................................................................... 178 A.5 Results for San Bernardino United States Postal Service Mail Handling Facility ..... 181
Appendix B. Summary of Results........................................................................................ 185 B.1 Sample Daily Consumption Patterns .......................................................................... 187
Appendix C. Selected Sites for Case Study Analysis and Description of DER System...... 193

Distributed Energy Resources in Practice
x
Appendix D. Financial Calculations..................................................................................... 195 Appendix E. Capital Cost and Grant Information for Selected Sites................................... 213 Appendix F. GAMS............................................................................................................. 217
F.1 Introduction to GAMS model ..................................................................................... 217 F.2 Model Description ...................................................................................................... 217 F.3 General Algebraic Modeling System (GAMS)........................................................... 218 F.4 Mathematical Formulation.......................................................................................... 218
Appendix G. Site Questionnaire........................................................................................... 225 Appendix H. Site Pictures .................................................................................................... 237
H.1 A&P Waldbaum’s Supermarket ................................................................................. 237 H.2 Guaranteed Savings Building ..................................................................................... 238 H.3 The Orchid Resort....................................................................................................... 240 H.4 BD Biosciences Pharmingen....................................................................................... 242 H.5 San Bernardino USPS................................................................................................. 244
Appendix I. Electricity and Natural Gas Tariffs ..................................................................... 247 Appendix J. DOE-2 ................................................................................................................. 249 Appendix K. Load Profiles................................................................................................... 251 Appendix L. Guaranteed Savings Building QF Calculation................................................ 277 Appendix M. Orchid Natural Gas to Propane Engine Conversion ....................................... 279
M.1 Turning actual natural gas engine data into generic engine data: ............................... 279 Appendix N. BD Biosciences Pharmingen Sample Data ..................................................... 283 Appendix O. SB USPS Sample Operation Log Sheet.......................................................... 287 Appendix P. Technology Cost and Performance Data ........................................................ 289 Appendix Q. Capstone Turbine Costs and Performance...................................................... 295 Appendix R. Instructions for formatting load data output from DOE-2 .............................. 299 Appendix S. Sample Cover Letters to Individual Test Sites ............................................... 301 Appendix T. Errata: Inaccurate Electrical Efficiency Data ................................................. 305
Distributed Energy Resources in Practice
xi
List of Tables Table 1: DER Test Site Descriptions ......................................................................................... xxiii Table 2: Summary of Project Costs and Benefits as Estimated by Site and DER-CAM .......... xxiv Table 3: Site Peak Electric Load and DER System Capacity Information................................. xxv Table 4: Description of Scenarios Analyzed for each Test Site ............................................... xxvii Table 5: Validation of Base Case Cost of Utility Bills Prior to DER Adoption........................ xxix Table 6: Validation of DER Energy System Annual Costs ........................................................ xxx Table 7: Validation of DER Annual Net Benefits (Including Capital Costs)............................ xxxi Table 8: Validation of DER Annual Benefits ........................................................................... xxxii Table 9: Comparison of Site DER System Selection Decisions.............................................. xxxiii Table 10: Lessons Learned and Information from Sites Not Fully Studied ............................ xxxvi Table 11: List of Potential Sites Providing Enough Information to Perform Full DER-CAM
Analysis ........................................................................................................................... 11 Table 12: Definition of Financial Terms Used in Analysis .......................................................... 13 Table 13: Financial Formulas ....................................................................................................... 14 Table 14: Description of Six Scenarios in DER-CAM................................................................. 21 Table 15: Technologies Eligible for CPUC Self-Generation Rebates......................................... 29 Table 16: NYSERDA DER Program Funding ............................................................................. 30 Table 17: Summary of Project Costs and Benefits at Test Sites................................................... 31 Table 18: CDH Energy Assumptions for Engineering Analysis at A&P Waldbaum’s................ 36 Table 19: CDH Energy Annual Savings (Costs) at A&P Waldbaum’s........................................ 36 Table 20: Major Project Expenditures at A&P Waldbaum’s........................................................ 37 Table 21: Net Present Value and Payback Analysis for A&P Waldbaum’s................................. 37 Table 22: Estimated Thermal Energy Use at A&P for Alternative CHP Systems ....................... 41 Table 23: DOE-2 Peak Verses Maximum Average for A&P Waldbaum’s.................................. 44 Table 24: Capstone Microturbine Capital and Operating Costs ................................................... 44 Table 25: Parameter Modifications in DER-CAM for A&P Waldbaum’s................................... 45 Table 26: Scenario results for A&P Without Grants .................................................................... 48 Table 27: Scenario Results for A&P With Grants ........................................................................ 50 Table 28: Comparison of A&P Assumptions and Annual Cost Estimates With DER-CAM ...... 52 Table 29: Net Present Value and Payback Analysis for GSB ...................................................... 63 Table 30: Results for GSB Without Grants .................................................................................. 68 Table 31: Scenario Results for Guaranteed Savings Building With Grants ................................. 69 Table 32: Managerial Concerns About Installing Onsite Generation at The Orchid Resort ........ 79 Table 33: Net Present Value and Payback Analysis for The Orchid............................................ 80 Table 34: Comparison of Costs and Benefits for The Orchid at Different Tariff Rates............... 81 Table 35: DOE-2 Peak Verses Maximum Average for The Orchid............................................. 83 Table 36: Scenario Results for The Orchid................................................................................... 86 Table 37: Net Present Value and Payback Analysis for BD Biosciences Pharmingen ................ 97 Table 38: Scenario Results for BD Biosciences Pharmingen..................................................... 102 Table 39: System Performance Data Provided By Clarus Energy ............................................. 107 Table 40: Net Present Value and Payback for San Bernardino USPS........................................ 111 Table 41: DER-CAM cost outputs compared to costs listed in SoCal Gas Report .................... 114 Table 42: Scenario Results for San Bernardino USPS ............................................................... 116 Table 43: Effects of California Project Cost Subsidies on DER-CAM Decision....................... 119

Distributed Energy Resources in Practice
xii
Table 44: Lessons Learned from Sites Not Fully Studied .......................................................... 123 Table 45: Validation of Base Case Cost of Utility Bills Prior to DER Adoption....................... 145 Table 46: Validation of DER System Annual Costs................................................................... 147 Table 47: Validation of DER Annual Net Benefits (Including Capital Costs)........................... 148 Table 48: Validation of DER Annual Benefits (Without Capital Costs).................................... 149 Table 49: Validation of DER System Annual Costs (The Orchid at High Tariff Rate) ............. 150 Table 50: Validation of DER Annual Net Benefits (Including Capital Costs, The Orchid at High
Tariff Rate) .................................................................................................................... 152 Table 51: Validation of DER Annual Benefits (Without Capital Costs and The Orchid at High
Tariff Rate) .................................................................................................................... 153 Table 52: DER System Project Cost and Benefit: Comparison Between Site and DER-CAM’s
Estimates ....................................................................................................................... 154 Table 53: Comparison of Site DER System Selection Decisions............................................... 155

Distributed Energy Resources in Practice
xiii
Appendix Tables Table A- 1: Scenario Results for A&P Without Grants.............................................................. 169 Table A- 2: Scenario Results for A&P With Grants................................................................... 170 Table A- 3: Standby Sensitivity for A&P................................................................................... 171 Table A- 4: Flat Rate Electricity Sensitivity for A&P................................................................ 171 Table A- 5: Spark Spread Sensitivity for A&P........................................................................... 171 Table A- 6: Scenario Results for Guaranteed Savings Building Without Grants....................... 172 Table A- 7: Scenario Results for Guaranteed Savings Building With Grants............................ 172 Table A- 8: Standby Sensitivity for Guaranteed Savings Building ............................................ 173 Table A- 9: Flat Electricity Rate Sensitivity for Guaranteed Savings Building ......................... 173 Table A- 10: Spark Spread Sensitivity for Guaranteed Savings Building.................................. 174 Table A- 11: Scenario Results for The Orchid ........................................................................... 175 Table A- 12: Flat Rate Electricity Sensitivity for The Orchid.................................................... 176 Table A- 13: Standby Charge Sensitivity for The Orchid .......................................................... 177 Table A- 14: Spark Spread Sensitivity for The Orchid............................................................... 177 Table A- 15: Scenario Results for BD Biosciences Pharmingen................................................ 178 Table A- 16: Flat Electricity Rate Sensitivity for BD Biosciences Pharmingen ........................ 179 Table A- 17: Standby Sensitivity for BD Biosciences Pharmingen ........................................... 180 Table A- 18: Spark Spread Sensitivity for BD Biosciences Pharmingen................................... 180 Table A- 19: Scenario Results for San Bernardino USPS .......................................................... 181 Table A- 20: Flat Electricity Rate Sensitivity for San Bernardino USPS................................... 182 Table A- 21: Photovoltaic Installation Subsidy Sensitivity for San Bernardino USPS.............. 182 Table A- 22: Standby Sensitivity for San Bernardino USPS...................................................... 183 Table A- 23: Spark Spread Sensitivity for San Bernardino USPS ............................................. 183 Table A- 24: Summary of Financial Results............................................................................... 185 Table A- 25: Comparison of Site DER System Selection Decisions.......................................... 186 Table A- 26: Sites Selected for DER-CAM Analysis................................................................. 193 Table A- 27: Definition of Financial Terms Used in Analysis................................................... 195 Table A- 28: Financial Formulas ................................................................................................ 195 Table A- 29: Summary of Actual Project Costs and Benefits as Estimated by Site and DER-
CAM.............................................................................................................................. 196 Table A- 30: Site Peak Electric Load and DER System Capacity Information.......................... 197 Table A- 31: Validation of Base Case Cost of Utility Bills Prior to DER Adoption ................. 198 Table A- 32: Validation of DER System Annual Costs ............................................................. 199 Table A- 33: DER Annual Net Benefits Including Capital Costs (Base Case to Scenario 5) .... 200 Table A- 34: DER Annual Benefits Without Capital Costs ....................................................... 201 Table A- 35: Validation of DER System Annual Costs (The Orchid at High Tariff Rate)........ 202 Table A- 36: Validation of DER Annual Net Benefits (Including Capital Costs, The Orchid at
High Tariff Rate) ........................................................................................................... 203 Table A- 37: Validation of DER Annual Benefits (Without Capital Costs and The Orchid at High
Tariff Rate) .................................................................................................................... 204 Table A- 38: DER System Costs Comparing Site vs. DER-CAM Scenario 2 (The Orchid at
Original Low Tariff Rate) ............................................................................................. 205 Table A- 39: Comparison of DER Annual Net Benefits Including Capital Costs for Scenario 2
(The Orchid at Low Tariff Rate) ................................................................................... 206

Distributed Energy Resources in Practice
xiv
Table A- 40: Comparison of DER Benefits Without Capital Costs for Scenario 2 (The Orchid at Low Tariff Rate)............................................................................................................ 207
Table A- 41: Comparison of Base Case Costs (The Orchid at High Tariff Rate) ...................... 208 Table A- 42: DER System Costs Comparing Site vs. DER-CAM Scenario 2 (The Orchid at High
Tariff Rate) .................................................................................................................... 209 Table A- 44: Comparison of DER Annual Benefits Without Capital Cost for Scenario 2 (The
Orchid at High Tariff Rate) ........................................................................................... 211 Table A- 45: Comparison of Site DER System Selection Decisions.......................................... 212 Table A- 46: Capital Cost and Grant Information for Selected Sites ......................................... 213 Table A- 47: Propane engine data in DER-CAM ....................................................................... 282 Table A- 48: Diesel Engines Cost and Performance .................................................................. 289 Table A- 49: Fuel Cells (base data derived from information from Guaranteed Savings Building
data) ............................................................................................................................... 290 Table A- 50: Natural Gas Engines (base data derived from information obtained from San
Bernardino USPS) ......................................................................................................... 291 Table A- 51: Microturbines (base data derived from data obtained from Andrew Wang of
Capstone Microturbines) ............................................................................................... 292 Table A- 52: Photovoltaics (data obtained from RealGoods and PowerLight) .......................... 292 Table A- 53: Propane Engines (see Appendix M for the derivation of this data) ...................... 293 Table A- 54: Capstone Turbine Costs and Performance ............................................................ 295 Table A- 55: Sample Output Files Excerpts from DER-CAM Runs.......................................... 296 Table A- 56: Comparison of Electrical Efficiencies of Natural Gas Engines from DER-CAM and
Coastintelligen............................................................................................................... 305 Table A- 57: Case Studies Results and Updated Results (in parentheses) ................................. 306 Table A- 58: Comparison of Sensitivity Results ........................................................................ 307

Distributed Energy Resources in Practice
xv
List of Figures Figure 1: Graphical Depiction of DER-CAM ............................................................................xxvi Figure 2: Validation of Base Case..............................................................................................xxix Figure 3: Validation of System Annual Energy Costs ................................................................xxx Figure 4: Validation of DER Annual Net Benefits (Including Capital Costs)..........................xxxii Figure 5: Validation of DER Annual Benefits .........................................................................xxxiii Figure 6: Graphical Depiction of DER-CAM .................................................................................3 Figure 7: DER-CAM Automation Manager Graphical User Interface .........................................18 Figure 8: Sample Scenario Results................................................................................................22 Figure 9: Sample Spark Spread Sensitivity...................................................................................23 Figure 10: Sample Standby Charge Sensitivity.............................................................................24 Figure 11: Sample Flat Electricity Rate Sensitivity ......................................................................25 Figure 12: A&P Waldbaum’s Supermarket, Long Island, NY .....................................................33 Figure 13: Schematic of Heat Recovery Options for A&P (Source: CDH Energy) .....................39 Figure 14: Roof-mounted DER Equipment (Microturbine and Heat Exchanger) ........................40 Figure 15: Scenario Results for A&P Without Grants ..................................................................47 Figure 16: Scenario Results for A&P With Grants .......................................................................49 Figure 17: Spark Spread Sensitivity for A&P...............................................................................53 Figure 18: Standby Sensitivity for A&P .......................................................................................54 Figure 19: Flat Rate Electricity Sensitivity for A&P ....................................................................55 Figure 20: Guaranteed Savings Building, Fresno, CA..................................................................59 Figure 21: NOx Emissions of DER Equipment ............................................................................61 Figure 22: Scenario Results for Guaranteed Savings Building Without Grants ...........................68 Figure 23: Scenario Results for Guaranteed Savings Building With Grants ................................69 Figure 24: Spark Spread Sensitivity for Guaranteed Savings Building ........................................72 Figure 25: Standby Sensitivity for Guaranteed Savings Building ................................................73 Figure 26: Flat Rate Electricity Sensitivity for Guaranteed Savings Building ............................74 Figure 27: The Orchid Resort, Mauna Lani, Hawaii....................................................................78 Figure 28: Scenario Results for The Orchid..................................................................................85 Figure 29: Spark Spread Sensitivity for The Orchid.....................................................................88 Figure 30: Standby Sensitivity for The Orchid .............................................................................89 Figure 31: Flat Rate Electricity Sensitivity for The Orchid ..........................................................90 Figure 32: BD Biosciences Pharmingen, Torrey Pines, California..............................................93 Figure 33: Cumulative Energy Expense Projections from BD Biosciences Pharmingen.............96 Figure 34: Aggregated Yearly Energy Cost Estimates from BD Biosciences Pharmingen..........97 Figure 35: Scenario Results for BD Biosciences Pharmingen ....................................................101 Figure 36: Spark Spread Sensitivity for BD Biosciences Pharmingen .......................................104 Figure 37: Flat Rate Electricity Sensitivity for BD Biosciences Pharmingen ............................105 Figure 38: Standby Charge Sensitivity for BD Biosciences Pharmingen...................................106 Figure 39: San Bernardino USPS, Redlands, CA ......................................................................110 Figure 40: Scenario Results for San Bernardino USPS .............................................................115 Figure 41: Spark Spread Sensitivity for San Bernardino USPS.................................................117 Figure 42: Standby Sensitivity for San Bernardino USPS..........................................................118 Figure 43: Flat Rate Electricity Sensitivity Results for San Bernardino USPS ..........................119 Figure 44: Photovoltaic Rebate Sensitivity for San Bernardino USPS......................................120

Distributed Energy Resources in Practice
xvi
Figure 45: Validation of Base Case of Utility Bills Prior to DER Adoption ..............................146 Figure 46: Validation of DER System Annual Costs..................................................................147 Figure 47: Validation of DER Annual Net Benefits (Including Capital Costs)..........................148 Figure 48: Validation of DER System Annual Benefits (Without Capital Costs) ......................150 Figure 49: Validation of DER System Annual Costs (The Orchid at High Tariff Rate) ............151 Figure 50: Validation of DER Annual Net Benefits (Including Capital Costs, The Orchid at High
Tariff Rate) ....................................................................................................................152 Figure 51: Validation of DER Annual Benefits (Without Capital Costs and The Orchid at High
Tariff Rate) ....................................................................................................................153
Distributed Energy Resources in Practice
xvii
Appendix Figures Figure A- 1: January Weekday Electricity Supplied to the Orchid............................................187 Figure A- 2: July Weekday Electricity Supplied to the Orchid .................................................188 Figure A- 3: January Weekday Heating Supplied to the Orchid................................................188 Figure A- 4: July Weekday Heating Supplied to the Orchid .....................................................189 Figure A- 5: January Weekday Electricity Supplied to BD Biosciences Pharmingen...............189 Figure A- 6: July Weekday Electricity Supplied to BD Biosciences Pharmingen ....................190 Figure A- 7: January Weekday Heating Supplied to BD Biosciences Pharmingen...................190 Figure A- 8: July Weekday Heating Supplied to BD Biosciences Pharmingen ........................191 Figure A- 9: Validation of Base Case Utility Bills Prior to DER Adoption ...............................198 Figure A- 10: Validation of DER System Annual Costs ............................................................199 Figure A- 11: DER Annual Net Benefits Including Capital Costs (Base Case to Scenario 5) ...200 Figure A- 12: DER Annual Benefits Without Capital Costs ......................................................201 Figure A- 13: Validation of DER System Annual Costs (The Orchid at High Tariff Rate) .......202 Figure A- 14: Validation of DER Annual Net Benefits (Including Capital Costs, The Orchid at
High Tariff Rate) ...........................................................................................................203 Figure A- 15: Validation of DER Annual Benefits (Without Capital Costs and The Orchid at
High Tariff Rate) ...........................................................................................................204 Figure A- 16: DER System Costs Comparing Site vs. DER-CAM Scenario 2
(The Orchid at Original Low Tariff Rate) .....................................................................205 Figure A- 17: Comparison of DER Annual Net Benefits Including Capital Costs for Scenario 2
(The Orchid at Low Tariff Rate)....................................................................................206 Figure A- 18: Comparison of DER Benefits Without Capital Costs for Scenario 2
(The Orchid at Low Tariff Rate)....................................................................................207 Figure A- 19: Comparison of Base Case Costs (The Orchid at High Tariff Rate) .....................208 Figure A- 20: DER System Costs Comparing Site vs. DER-CAM Scenario 2
(The Orchid at High Tariff Rate)...................................................................................209 Figure A- 21: Comparison of DER Annual Benefits Including Capital Costs for Scenario 2
(The Orchid at High Tariff Rate)...................................................................................210 Figure A- 22: Comparison of DER Annual Benefits Without Capital Cost for Scenario 2
(The Orchid at High Tariff Rate)...................................................................................211 Figure A- 23: A&P Waldbaum’s Supermarket ...........................................................................237 Figure A- 24: Capstone 60 kW Microturbine, MicroGen Heat Exchanger, and Munters Unit ..237 Figure A- 25: Compressors Inside of Control Room ..................................................................237 Figure A- 26: Guaranteed Savings Building ...............................................................................238 Figure A- 27: Construction of Parking Garage Where Fuel Cells Will Be Housed ...................238 Figure A- 28: Whole Building Internal Renovations in Preparation For New Tenants..............239 Figure A- 29: The Orchid Resort ................................................................................................240 Figure A- 30: Generation Equipment (Propane Engines) and Islanding Switch ........................240 Figure A- 31: Propane Tank........................................................................................................241 Figure A- 32: BD Biosciences Pharmingen ................................................................................242 Figure A- 33: Water Heating and Cooling Loops .......................................................................242 Figure A- 34: Site for the Two 150 kW Natural Gas Engines with Excess Heat Radiator in
Background....................................................................................................................243 Figure A- 35: San Bernardino USPS facility ..............................................................................244

Distributed Energy Resources in Practice
xviii
Figure A- 36: San Bernardino mail handling equipment (annex space) .....................................244 Figure A- 37: San Bernardino USPS rooftop (evaluated as potential PV site)...........................245 Figure A- 38: San Bernardino USPS mail handling equipment (main building area) ................245 Figure A- 39: DOE-2 user interface developed for DER-CAM team.......................................249 Figure A- 40: DER-CAM costs for natural gas engines .............................................................279 Figure A- 41: Modified costs for natural gas engines .................................................................280 Figure A- 42: Heat rates in DER-CAM and modified heat rates for natural gas engines...........280 Figure A- 43: Sample Electricity 10995 Load Profile Provided by BD Biosciences Pharmingen
for June 2001 .................................................................................................................283 Figure A- 44: Electricity Bills for Several BD Biosciences Pharmingen Buildings
(DER studies were done on the 10995 Torreyana Rd. Building). .................................284 Figure A- 45: Savings Estimates Due to DER as Determined by BD Biosciences Pharmingen285 Figure A- 46: USPS Sample Operation Log Sheet ....................................................................287 Figure A- 47: Sample Introductory Letter Sent to Prospective Test Sites .................................303 Figure A- 48: Sample Cover Letter Sent to Individual Test Sites..............................................304

Distributed Energy Resources in Practice
xix
Acronyms and Definitions AESC Alternative Energy Systems Consulting Inc. AGA American Gas Association A&P A&P Waldbaum’s Supermarket BD BD Biosciences Pharmingen, also referred to as Pharmingen in figures CDM Energy a consulting, engineering, constructions and operations firm CEC California Energy Commission CERL Construction Engineering Research Laboratory CHP combined heat and power CPLEX a trademark of CPLEX Optimization, Inc CPUC California Public Utilities Comission DEER Office of Distributed Energy and Electric Reliatiblity, U.S. DOE DER distributed energy resources DER-CAM Distributed Energy Resources Customer Adoption Model DG distributed generation DHW domestic hot water DOD Department of Defense DOE Department of Energy DOE-2 Building energy simulation software developed by at Berkeley Lab EBMUD East Bay Municipal Utility District ERC emission reduction credits FERC Federal Regulatory Energy Commission GAMS General Algebraic Modeling System GIS geographic information systems GSA U.S. General Services Administration GSB Guarantee Savings Building GTI Gas Technology Institute HELCO Hawaii Electric Light Company Inc. HHV higher heating value HVAC heating, ventilation, and air conditioning IC internal combusion (engine) IEM imbalance energy market LHV lower heating value LIPA Long Island Power Authority MTH high pressure (natural gas) microtubine MTL low pressure (natural gas) microtubine NAEA National Accounts Energy Alliance NEMS National Energy Modeling System NG natural gas NPV net present value NREL National Renewable Energy Laboratory NYSEG New York State Electric and Gas NYSERDA New York State Energy Research and Development Authority NY PSC New York State Public Service Commission ORNL Oak Ridge National Laboratory

Distributed Energy Resources in Practice
xx
PG&E Pacific Gas and Electric PPA power purchase agreement PURPA Public Utility Regulatory Policy Act PV photovoltaic QF qualifying facility RG&E Rochester Gas and Electric RIA Rochester (NY) International Airport SBC system benefits charge SCE Southern California Edison SDG&E San Diego Gas and Electric Company SoCalGas Southern California Gas Company USPS United States Postal Service, San Bernardino facility UTC United Technologies Corporation
Distributed Energy Resources in Practice
xxi
Executive Summary The worldwide restructuring of the electric utility industry is changing energy markets and creating opportunities to invest in new techniques to provide energy services and increase energy efficiency in the United States. In the U.S., The Public Utility Regulatory Policy Act (PURPA) of 1978 invited relatively small-scale generators into the energy market, and the halting ongoing restructuring of the electric utility industry is fundamentally changing the relationship between electric utilities and their customers. The improvement of small-scale and renewable generators has, in recent years, made even smaller (business-scale) electricity generation an economically viable option for some consumers. On-site energy production, known as Distributed Energy Resources (DER) potentially offers consumers many benefits, such as energy bill savings (especially where waste heat is utilized), improved reliability, and control over power quality. Despite these benefits, DER adoption can be a daunting move for a customer accustomed to simply paying a monthly utility bill. Work on customer adoption of distributed energy resources (DER) has been ongoing at Berkeley Lab for three years. The effort has focused on the adoption of small-scale (<500 kW) generators, especially where CHP and multiple generation technologies are chosen. The most significant achievement of this effort has been the development of the distributed energy resource customer adoption model (DER-CAM). This model finds the optimal combination of equipment a site should install based on a historic test period to minimize the cost of satisfying its electrical and heat loads. An idealized operating schedule for the installed equipment also emerges from the solution. DER-CAM is a pure optimization model and can serve as a basis for the evaluation of real world projects and also assess the importance of actual constraints and considerations not currently represented in DER-CAM. This study offered the first opportunity to apply DER-CAM in a real world setting and evaluate its modeling results, and to assess the benefits of expanding its capabilities. One of the analytic challenges of predicting customer adoption of DER, and consequently, its market penetration, derives from the highly variable motives driving adoption decisions. It is not possible to represent the range of investor circumstances, motivations, and constraints. The only reasonable approach is to study actual conditions and outcomes and attempt to apply what is observed in a theoretical modeling framework as generally as possible. This study was undertaken with the following goals: 1. Analyze, describe, and disseminate DER site project experience. 2. Describe real-world issues involved with DER adoption decision-making and system design. 3. Validate DER-CAM financial estimates and technology adoption decisions. 4. Improve DER-CAM accuracy and expand its capabilities based on real-world experience. 5. Establish contacts with relevant DER sites for future research. A list of approximately 90 DER project sites was developed initially complied that served as the starting point for potential case study sites. This list was pared down to about 50 promising sites based on installation size (0-500 kW preferred but up to 1 MW if from multiple generators), use of CHP, and DER installation being motivated by economic rather than demonstration purposes. These sites were contacted to obtain information about their DER system. Responses to phone calls

Distributed Energy Resources in Practice
xxii
and letters sent to appropriate contact people were used to determine the site’s willingness to participate in the case study analysis and share information about their DER adoption decision. The sites’ decision-making process, the factors that influenced it, and the data that was used in support of it were analyzed. The information collection process established relationships with nine sites that provided enough information and data for analysis. From these nine sites, five were selected that represented the best mix of important characteristics such as business type, geographic diversity, DER technology selection, access to engineering and financial information, and availability of information about their business-based decision-making criteria. Table 1 shows summary descriptions of the nine sites that volunteered enough data for a full case study and validation analysis. The four sites not studied in detail, AA Dairy, East Bay Municipal Utility District, Rochester International Airport, and Wyoming County Community Hospital would all make excellent future case studies.

Distributed Energy Resources in Practice
xxiii
Table 1: DER Test Site Descriptions
Site Location/Utility Type of facility Installed Technology AA Dairy* Candor, NY
NYS Electric & Gas Dairy Farm Digester biogas system
converted 130 kW engine A&P Waldbaum’s* Hauppauge, NY (Long
Island) Long Island Power Authority
Supermarket 60 kW Capstone microturbine, CHP for space heating & desiccant dehumidification
East Bay Municipal Utility District (EBMUD)
Oakland, CA PG&E
Administration Building
10 x 60 kW Capstone microturbines, 530 kW (150 ton) absorption chiller and CHP
Guarantee Savings Building (GSB)
Fresno, CA PG&E
12 story office building for IRS and INS
3 x 200 kW Phosphoric Acid Fuel Cells, CHP, 350 kW (100 ton) adsorption chiller
The Orchid* Big Island, HI Hawaiian Electric Light Company
Resort hotel 4 x 200 kW propane fired engine with 840 kW (240 ton) absorption and CHP
BD Biosciences Pharmingen (BD)
San Diego, CA San Diego Gas and Electric
Industrial bio-technology supplier
2 x 150 kW natural gas engines, CHP space heating
Rochester International Airport* (RIA)
Rochester, NY Rochester Gas and Electric
Airport 2 x 750 kW natural gas engines, CHP and absorption cooling
San Bernardino U.S. Postal Service (USPS)
Redlands, CA Southern California Edison
Mail handling facility
500 kW natural gas engine without CHP
Wyoming County Community Hospital* (Wyoming)
Warsaw, NY NYSEG electricity and Rochester Gas and Electric natural gas
Hospital 560 kW natural gas engine with CHP and absorption cooling
*Sites with operating DER systems The five sites analyzed for this project are listed in Table 2. The fifth site, USPS, has two alternative system designs because this site made two analyses available and has not selected a design at the time of writing. The results of this case study report provide information on DER system costs and benefits that can be used to analyze the financial value of the DER project using tools such as Net Present Value (NPV) and payback analysis. The values in Table 2 are derived from costs and savings as estimated primarily by the test site and by this project team using the results from DER-CAM. These estimates are with respect to the overall cost of the DER project without regard to the financial arrangement actually used. That is, these values may be different from the costs and benefits of the project from the perspective of the site’s owner due to contract agreements (e.g. shared savings or

Distributed Energy Resources in Practice
xxiv
loans) with the energy developer. The payback period from DER-CAM was calculated by dividing the project cost (provided by the site or estimated from DER-CAM) by the annual benefit without capital cost. Table 2: Summary of Project Costs and Benefits as Estimated by Site and DER-CAM
Source of Financial Estimates
Project Cost Grants Received
Annual Benefit (without capital cost)
Net Present Value (NPV) (including grants)
Payback (including grants)
A&P $145,000 $95,000 $8,312 $51,826 6 years A&P DER-CAM
$145,000 $95,000 $11,777 $94,274 4.2 years
GSB $4,353,375 $2,100,000 NA NA NA GSB DER-CAM
$4,353,375 $2,100,000 $218,495 $(518,466) 10.3 years
The Orchid NA $0 $700,000 $2,917,754 estimate
3.8 years
The Orchid DER-CAM
$2,636,109 $0 $732,124 $3,091,430 3.7 years
BD Confidential $112,500 $103,085
$530,000 estimate
2.5 years
BD DER-CAM
Confidential $112,500 $96,888 $506,218 2.7 years
USPS DG only
$480,000 $0 $75,000 $115,057 6.4 years
USPS DG only DER-CAM
$480,000 $0 $217,544 $1,246,014 2.2 years
USPS Absorption Cooling
$680,000 $0 ($204,000 potential)
$159,000 $581,520 4.3 years
USPS Abs. DER-CAM
$680,000 $0 ($204,000 potential)
$303,695 $1,729,543 2.2 years
NA = not available Estimated values are derived from DER-CAM data rather than information provided directly from site.

Distributed Energy Resources in Practice
xxv
Table 3 lists the capacity of all nine sites’ DER system with respect to the peak load and provides a brief description of the technologies comprising each DER system. Table 3: Site Peak Electric Load and DER System Capacity Information
Site Peak Load DER Capacity Percentage of Peak AA Dairy* 75 kW Digester biogas system
converted 130 kW engine
170%
A&P* 600 kW 60 kW Capstone microturbine, CHP for space heating & desiccant dehumidification
10%
EBMUD 2000 kW 600 kW Capstone microturbines, 530 kW (150 ton) absorption chiller and CHP
30%
GSB 600 kW – 900 kW 600 kW Phosphoric Acid Fuel Cells, CHP, 350 kW (100 ton) adsorption chiller
70% -100%
The Orchid* 1400 kW 800 kW propane fired engine with 840 kW (240 ton) absorption and CHP
60%
BD
700 kW 300 kW natural gas engines, CHP space heating
40%
RIA* 2100 kW 1500 kW natural gas engines, CHP and absorption cooling
70%
USPS 1600 kW 500 kW natural gas engine without CHP
30%
Wyoming* 850 kW 560 kW natural gas engine with CHP and absorption cooling
70%
*Sites with operating DER systems

Distributed Energy Resources in Practice
xxvi
DER-CAM optimization:
DER-CAM is a mixed integer program formulated in GAMS1 (General Algebraic Modeling System). The objective function to be minimized is the annual cost of providing energy services to the site, through either utility electricity and gas purchases or DER operation (or a combination of both) in total dollars for a test year. The test year is typically a recent historic year. The objective function value is an annuity based on the estimated annual costs of electricity purchases, gas purchases, operating and maintenance costs and the amortized costs of DER equipment. Typical inputs to the model include the site’s end-use energy load profiles, the tariff structure under which a site buys electricity and other fuels, and values from a database of technology costs and performance. Energy use is divided into five end-uses: electricity-only, cooling, space heating, water heating, and natural-gas-only. The output is a set of DER technologies to install (if any) and their hourly operating schedule as well as utility electricity and natural gas purchases, selected to minimize annual costs of meeting energy demand for the site. A key constraint included in the model (that is, condition to be met) is that energy demand for each hour must be met by the purchase of energy from utilities, operation of any technology or set of technologies selected by the model, or a combination of purchase and on-site generation. In addition, all environmental rules must be obeyed, and equipment capabilities must not be exceeded. The model’s inputs and outputs are depicted graphically in Figure 1 below
Figure 1: Graphical Depiction of DER-CAM
1 GAMS is a proprietary software product used for high-level modeling of mathematical programming problems. It is owned by the GAMS Development Corporation (http://www.gams.com) and is licensed to Berkeley Lab.

Distributed Energy Resources in Practice
xxvii
Operating Scenarios: Six standard scenarios were modeled. The scenarios describe the potential options available for DER installation, and each provides unique information about the benefits of different DER system designs. Table 4: Description of Scenarios Analyzed for each Test Site
Scenario 1 Base Case Utility purchase of electricity and gas
Scenario 2 Unlimited installation of DER technologies Any technology and capacity combination allowed (true optimization)
Scenario 3 Choice of only the technology type (e.g. natural gas engines) installed at site. No requirement to install or capacity constraint. ≥0 technology units (same type)
Scenario 4 Forced purchase of same technology as site At least one unit must be purchased. ≥ 1 technology units (same units)
Scenario 5 Forced purchase of same technology unit as installed at site and same capacity (replicate site decision)
Scenario 6 Forced purchase of same technology and capacity as site chose. Fixed operating level in terms of kWh output
Scenario 1: The Base Case, or “Business as Usual” Case
The site purchased electricity and gas from the utility company at the standard tariff rates for this location. This scenario also improved understanding of the local tariff and site energy costs (i.e. composition of total bill as electricity and heating fuel and, of specific time period charges for energy and demand). This scenario also provided a way to check if estimates of site electricity and gas load were an accurate estimate of actual energy use. Scenario 2: Unlimited installation
This scenario allowed for theoretical energy cost minimization by allowing the model to choose an optimal combination of technologies from all the technologies in its database. In other words, DER-CAM is run as an optimization with no restrictions on technology choices or capacity levels. Scenario 3: Unlimited installation of technology type selected at site
This scenario restricted the model to potentially install the technology that was actually installed at the site by the proprietor and developer. Hence, the possible solutions are to not install DER or to install the particular DER technology type (e.g., all natural gas engines and CHP configurations) selected at the site with any capacity value.

Distributed Energy Resources in Practice
xxviii
Scenario 4: Forcing purchase of selected technology at site
This scenario requires the model to install the chosen technology, but additionally prohibits zero installation. This scenario was developed to obtain information about the costs of installing and operating a specific technology, in any capacity level, at the site. Scenario 4 was established because in Scenario 3 the model may not install the available technology and the results match those of Scenario 1. Scenario 4 forces the installation of the technology selected at the site but in unlimited capacity levels. Scenario 5: Forcing purchase of selected technology and same capacity as site
This scenario is similar to Scenario 4 although it requires the installation of the same capacity, or number of units, as decided upon at the actual site. This scenario will provide the most accurate description of the installation and operating cost of the system as specified in the design at the case study site. Scenario 6: Force same technology, capacity, and set operating level
Scenario 6 was developed to require the model to select the technologies and capacities as in Scenario 5 but also to require the technology to operate at a certain level of output. This scenario was developed to address the issue of having technologies installed by the model but not operated. Scenario 6 was not used to date since the model, when forced to install a certain technology and or capacity, chose to run the technology at least part of the time. This scenario, however, may be useful in future modeling work. This scenario could also be used to obtain annual operating cost information for technologies operating at a certain fixed load level set in advance of the model run. Model Validation: The model validation reported here involves three levels. • At the first level the sites’ historic energy costs for electricity and gas (estimated from utility
bills if possible) are compared with a DER-CAM base case annual cost (Scenario 1) without installing DER systems.
• At the second level, the annual costs of a technology adoption decision, as predicted by DER-CAM Scenario 5, are compared with projected costs from the customer’s energy analyses or actual costs of operating DER systems.
• At the third level, DER-CAM’s optimal technology selection Scenario 2 is compared with the technologies selected at the actual site.
1. Energy Cost Validation The results of the first validation (Base Case utility bills) are given in Table 5 and graphically in Figure 2. In general, DER-CAM was able to match the base case utility bills within a few percent when enough data were available for calibration. This is more significant and difficult than it may appear given the importance of accurately modeling the loads and tariff structures of various facilities. The sites with historic data often had enough to reproduce their entire load profile for some end uses. As a result, the loads accurately matched the site loads and accurately modeling the

Distributed Energy Resources in Practice
xxix
tariff structure and bill calculations was possible. In other cases, projects were not complete, or for other reasons data were inadequate, and estimating bills and savings was more problematic. Table 5: Validation of Base Case Cost of Utility Bills Prior to DER Adoption
Base Case Utility Costs ($/year) Site Actual DER-CAM Ratio A&P New building $245,000 NA GSB New building $490,000 NA The Orchid $1,333,000 (estimate) $1,474,000 1.11 BD $315,000 $334,000 1.06 USPS $1,283,000 $1,261,000 0.98
0
200
400
600
800
1000
1200
1400
1600
A&P GSB The Orchid Pharmingen USPS SanBernardino
k$
Site DER-CAM
Figure 2: Validation of Base Case
The second part of the Energy Cost Validation is a comparison of the site’s actual estimates of project operation costs and DER-CAM estimates. The DER-CAM cost estimates are obtained from Scenario 5 where the model replicates the technology adoption decision of the site. These costs include the capital cost of the DER technologies, the operation and maintenance costs, and the costs of utility purchases of electricity and natural gas. The results of this validation comparison are presented in Table 6 and graphically in Figure 3. Not surprisingly these estimates vary much more than historic information, but again the pattern tends to reflect the amount of detail available on

Distributed Energy Resources in Practice
xxx
each project. In the case of The Orchid, the rates changed from $0.16/kWh at the time of the DER adoption decision to $0.19/kWh at the time of their financial benefit estimation. Model runs using the higher tariff rates for The Orchid are cited in the following tables and figures when validating the financial results. Table 6: Validation of DER Energy System Annual Costs
Energy Annual Costs ($/year) Site Actual Site Estimate DER-CAM Ratio A&P $241,000 $235,000 0.98 GSB NA $571,000 NA The Orchid $965,000 (estimate) $1,300,000 1.35 BD $245,000 $266,000 1.09 USPS $1,269,000 $1,137,000 0.90 USPS with absorption chiller
$1,210,000 $1,054,000 0.87
0
200
400
600
800
1000
1200
1400
A&P GSB The Orchid Pharmingen USPS DG only
USPSAbsorption
Cooling
k$
Site DER-CAM
Figure 3: Validation of System Annual Energy Costs

Distributed Energy Resources in Practice
xxxi
2. Annual Project Benefits Validation Another way of evaluating the results of installing a DER system (the second type of validation) is to compare the economic benefits estimated by the site with those computed by DER-CAM. Most sites quantified their expected benefits even if they did not have reliable figures on their historic energy costs or large changes to the site were expected, e.g. because of site changes other than DER adoption. There are two types of annual benefits reported: including capital costs and without capital costs. Annual net benefits including capital costs are the net reduction of costs considering both the post-DER system operating costs and the amortized loan payments needed to cover the capital cost of the DER system installation. This is found by subtracting all DER related costs (utility electricity and gas purchases, loan payments, O&M, etc.) from the base case utility bills. Annual benefits without capital cost are the difference between the base case utility bills and the annual operating costs without considering capital cost payments. The latter benefits are useful for computing payback period or for computing NPV assuming the capital cost is paid in full at the start of the project. The comparisons cover a wide range. Some DER-CAM results are close to site estimates, while others are dramatically higher. DER-CAM’s estimates of DER system costs are obtained from Scenario 5, where the model assumes the DER equipment installed at the site is the same as installed at the actual site. Further analysis, presented in Appendix D: Financial Calculations, presents the comparison of costs and benefits estimated from DER-CAM’s Scenario 2, the optimal solution of the model, to the costs and benefits estimated at the site. The annual net benefits including capital costs are presented in Table 7 and Figure 4 (The Orchid’s values reflect their recent rate increase to $0.19/kWh). This is a comparison between the sites’ estimated annual net benefit and the annual net benefit derived from DER-CAM Scenario 5. That is, DER-CAM provided an annual cost estimate for the DER system matching the technologies installed at each site. Table 7: Validation of DER Annual Net Benefits (Including Capital Costs)
DER Annual Net Benefits ($/year) Site Actual Site Estimate DER-CAM Ratio A&P $4,359 $10,000 2.3 GSB NA $(81,000) NA The Orchid $368,000 $400,000 1.09 BD $70,000 $68,000 0.97 USPS $14,000 $124,000 8.86 USPS with absorption chiller
$73,000 $207,000 2.84

Distributed Energy Resources in Practice
xxxii
-200
-100
0
100
200
300
400
500
A&P GSB The Orchid Pharmingen USPS DG only
USPSAbsorption
Cooling
k$
Site DER-CAM
Figure 4: Validation of DER Annual Net Benefits (Including Capital Costs)
The annual benefits without capital costs are presented in Table 8 and Figure 5. Table 8: Validation of DER Annual Benefits
DER Annual Benefits ($/year) Site Actual Site Estimate DER-CAM Ratio A&P $8,000 $11,777 1.4 GSB NA $218,495 NA The Orchid* $700,000 $732,000 1.05 BD $103,000 $97,000 0.94 USPS $75,000 $217,544 2.9 USPS with absorption chiller
$159,000 $303,695 1.9
* = The Orchid values reflect their recent tariff increase to $0.19/kWh.

Distributed Energy Resources in Practice
xxxiii
0
100
200
300
400
500
600
700
800
A&P GSB The Orchid Pharmingen USPS DG only
USPSAbsorption
Cooling
k$
Site DER-CAM
Figure 5: Validation of DER Annual Benefits
3. Technology Adoption Comparison The final validation involves comparing the site’s actual technology installation decision with those obtained in DER-CAM. Table 9 presents the technologies installed at the test site compared to the optimal solution in DER-CAM. Table 9: Comparison of Site DER System Selection Decisions
Site Actual DER system DER-CAM optimal solution A&P 60 kW
Microturbine (60 kW) with CHP
60 kW Microturbine (60 kW) with CHP
GSB 600 kW Fuel Cells 600 kW capacity: (3 x 200 kW) with CHP and absorption chiller
765 kW PV (1 x 100 kW), natural gas engines (3 x 55 kW) with CHP, and natural gas engine (1 x 500 kW) with absorption chiller
The Orchid 800 kW Propane engines (4 x 200 kW)
900 kW Propane engines (2 x 200 kW)

Distributed Energy Resources in Practice
xxxiv
Site Actual DER system DER-CAM optimal solution with CHP and absorption chiller
with CHP, (1 x 500 kW) with absorption chiller
BD 300 kW Natural gas engines (2 x 150 kW) with CHP
500 kW Natural gas engine (1 x 500 kW) with CHP
USPS 500 kW Natural gas engines (1 x 500 kW) no CHP, electric chiller, perhaps additional absorption chiller
1120 kW Natural gas engine (2 x 500) kW with absorption chiller, and microturbines (2 x 60 kW) with absorption chiller
The results presented in Table 9 are the most important results derived in this report, i.e. the head-to-head comparison of DER technologies chosen at the site and the technologies recommended by DER-CAM. Note that in every case except A&P, the DER-CAM solution involves a higher capacity installation than chosen by the site. This is a fully anticipated outcome. It derives from the fact that DER-CAM takes a full-system approach to minimizing energy bills, whereas any one adoption tends to be based on a yes-no project decision for a certain piece of equipment. This difference together with a perfectly reasonable conservative approach to an unfamiliar technology will quite naturally lead to the observed outcome. The A&P results showed the project was uneconomic without the large grants covering 65% of the installation costs. The Orchid and BD Biosciences Pharmingen results are very similar, underlining that both applied fairly rigorous financial criteria, and that gas-fired reciprocating engines with heat recovery is the incumbent technology. The USPS results are interesting in two ways. First, there is a significant cooling load at this site due to internal heat generation from equipment and high ambient temperatures characteristic of southeastern California. DER-CAM results suggest that this large cooling load warrants the use of absorption cooling. Compared to previously analyzed coastal sites with less significant cooling loads, the high cooling loads here provide a better absorption cooling opportunity. Second, the DER-CAM result includes technological diversity, i.e. some microturbines are chosen in addition to the reciprocating engines. This latter effect is also quite clear in the GSB results. In this case a PV system is chosen, as well as natural gas engines with heat recovery and absorption cooling capabilities. However, these chosen technologies do not include the one being installed at the site, i.e. fuel cells. Here the developer was strongly inclined towards fuel cells because of environmental concerns and regulations, which the simple cost minimization of DER-CAM clearly would not predict. This analysis did not consider the perceived costs of energy reliability and energy price stability, which were the features that made GSB’s fuel cell decision practical. Zahra Properties provides the tenant (IRS and INS via the U.S. General Service Administration (GSA)) with high-reliability electricity at a high 10 year fixed price. GSA’s willingness to pay approximately twice the current utility electricity prices for reliability and price stability has made the Zahra Properties’ fuel cell a viable venture. In other words, the high cost of fuel cells was borne because of their reliability, for which GSA was prepared to pay a premium, and the ability of the developer to avoid the time and expense

Distributed Energy Resources in Practice
xxxv
of the air quality permitting process required for combustion technologies. The availability of grants for fuel cell DER systems also reduced the project’s capital cost. The results are very encouraging. In most cases, developers appear to be making comprehensible choices and DER-CAM appears to replicate the decisions with interesting discrepancies that enhance understanding of DER adoption decisions. Summary of Validation Overall, the use of DER-CAM was successful in replicating the Base Case (Scenario 1) energy bills. Discrepancies between DER-CAM and site energy bills were minor and are discussed in the specific case sections of this report. DER-CAM was also successful in identifying optimal DER systems for given sites (Scenario 2). It is unclear how successful DER-CAM was at replicating the actual cost of a DER system (with Scenario 5) since only one of the five sites considered (The Orchid) actually had a DER system installed and running at the time of writing this report. DER costs and benefits quoted by sites, therefore, are only estimates, and it is unclear whether DER-CAM cost estimates or site cost estimates will be more accurate. Note that the two estimates could diverge significantly because of different operating assumptions and outcomes. DER-CAM resolves this endogenously. It was difficult to model a specific test site’s technology adoption decision due to the many considerations that cannot be included in a computer model. Models can still be very useful for estimating what choices will be made in aggregate, and for providing idealized results that can serve as examples to developers. Other issues such as changing tariff rates and the availability of grants, for example, necessitate making assumptions about what the decision-makers knew when they made their decision to install a DER system. DER-CAM provides more guidance into what organizations should do rather than what they will do, in any specific case, which tends to be generally the case with economic models. Lessons Learned about DER Systems As a result of this case study project much information was obtained about real-world DER decision making and implementation factors such as the DER design process, technology integration and interconnection issues, the drivers and hurdles of DER adoption, and the factors involved with matching electric and thermal loads to DER capacity, energy production, and distribution. Valuable insight was obtained into DER adoption decisions and the influence of perceptions, data, and analyses that support those decisions. This insight came through working with many of the sites to obtain information on their energy systems and operations, the DER adoption decision, and their energy costs prior to DER installation, and expected or actual annual energy costs after DER installation. Site visits provided knowledge of how the DER systems were integrated into operations, and the necessary technologies for DG, CHP, absorption and compressor chilling, boilers, and control systems. These site visits allowed for questions about what was working and what pitfalls to avoid. The lessons learned from each site modeled in this report have been added to the individual case descriptions. Furthermore these interactions highlighted the complexities of

Distributed Energy Resources in Practice
xxxvi
tariffs, utility interconnection, and environmental permitting issues faced by DER systems and the influence of grants on the financial profitability of these systems. In the process of narrowing down the test case selections to the five analyzed in full, initial studies on a number of other sites were performed. Table 10 below provides a summary of some lessons learned from sites considered but not analyzed in full detail. Table 10: Lessons Learned and Information from Sites Not Fully Studied
Site Notable issues learned from this site AA Dairy The economics of using cow manure on a dairy farm for operating a biogas
powered DER system to produce electricity and heat. The digester system also helps resolve a solid waste disposal issue and simultaneously opens new business opportunities such as selling high-quality compost and operating a greenhouse for growing tomatoes.
Alaska USPS The utility was closely involved with the DER system analysis but had an unfavorable opinion of the economics of the DER system. Utility involvement may help to limit DER adoption to the most economic project opportunities.
Byron Bergen Schools
This is a grid independent high school in upstate NY running on mix of natural gas and diesel generators. The project resulted from efforts to reduce utility costs and take advantage of an on-site natural gas well.
Cortland Memorial Hospital
The first grid independent hospital in New York State. A utility unsupportive to DER resulted in this unique DER system consisting of 3 x 560 kW Waukesha engines with diesel generator backup.
East Bay Municipal Utility District EBMUD
They shut down 4 of 10 microturbines during off-peak hours and use absorption chillers to meet QF status. With QF status they are able to obtain funding through CPUC’s SELFGEN program.
First National Bank Omaha
The energy service company HDR designed the fuel cell powered DER system to be highly reliable and replicable although it is not known if other sites have been willing to implement this system.
Rochester International Airport
The cogeneration system has an energy efficiency rating of 59%. The Waukesha engine and generator set failed shortly after going into operation. It was noted that the engine (from Waukesha) and the generator (from another company) are tested independently and when operating as a unit are subject to vibration and misalignment problems that were not apparent in the separate tests.
Harbec Plastics This plastic manufacturing company is powered almost exclusively by Capstone microturbines. They needed to integrate their DER system into a plant expansion in order to secure a bank loan. They had numerous rejections for funding from banks when the project was described as solely a DER installation.
Sea Crest Health Care
All Systems Energy, an energy service company on Long Island, provided numerous details about their cogeneration project and also the though process behind installing natural gas engines. NG engines are preferred because of the well-understood technology, their competitive capital costs,

Distributed Energy Resources in Practice
xxxvii
Site Notable issues learned from this site and the large amount of heat they produce make them attractive for CHP applications. In addition, the engineers at All Systems believe the typical mechanical failures with NG engines tend to be well understood and easier to repair than the failures with other types of DER systems.
Wyoming County Hospital
This hospital was negotiating with the utility company (NYSEG) to avoid having to pay demand charges when their DER system was tripped off line as a result of an interruption in utility power. The restructuring of the utility industry in NY and the fear of having difficulty of obtaining economic and reliable power supplies lead them to investigate a DER system.
Improvements to DER-CAM The fourth goal of this report is to improve DER-CAM accuracy and expand its capabilities based on real-world experience. This was accomplished to a large extent by the development of the Automation Manager. This Visual Basic front end allows for a rapid change of input parameters such as the site loads, technology data, and tariff information. This facilitates sensitivity analysis and aids in the iterative process that is a part of a test site model validation study. Furthermore, the validation of base-case loads against actual utility bills provided a means for checking the various aspects of demand and energy charges to ensure they are accounted for properly in the model’s cost calculations. This comparison led to the discovery of a limitation in using average loads in DER-CAM. The DOE-2 load data could be used to quantify the difference between the peak load and the maximum average load. It turned out to be a substantial difference at some sites, 20% at A&P, 16% at GSB, 7.5% at The Orchid, and 12% at USPS and demand charges were adjusted accordingly to compensate for this difference. The scenario analysis development was also an important contribution of this work. These scenarios help to compare actual site decisions with different modeling options. For example, they provide information on the financial benefit of adopting a given set of technologies, continuing to obtain all energy services through the utility, or the potential for further efficiency gains through additional capacity installation. Sensitivity analyses may also be performed on these various scenarios leading to unique insights about the DER decision-making process and the potential financial benefits. Establishing Contacts with DER Sites and Future Research The final goal for this report was to establish contacts with relevant sites for future work. The sites selected for in depth analysis were chosen because of their willingness to work with us, answer questions, return phone calls, and provide data on their DER system costs, load estimates, and expected benefits. In addition, they also shared their knowledge of the benefits and drawbacks of DER systems, the potential pitfalls, the mistakes made, lessons learned, joys and frustrations encountered, and the excitement of working on a developing area of energy design. The relationships developed in the process of completing this report may provide a testing ground for future research such as work on system design, integration, reliability analysis, control system

Distributed Energy Resources in Practice
xxxviii
software development, emissions testing, and other areas. The knowledge gained by different sites sub-metering their systems will also prove extremely valuable to understand, for example, the potential residual heat available of different technologies, their availability and patterns of outages, and the ability to serve thermal loads with this residual heat. This knowledge will help to formulate enhanced versions of DER-CAM in the future and provide better tools for policy making and forecasting DER adoption patterns in many regions. Although only five sites were thoroughly studied in the process of validating DER-CAM, the results were positive enough to indicate that DER-CAM is a useful policy tool and potentially a useful engineering design tool for providing beneficial technology sets for specific facility sites. The enhancements made to DER-CAM in the process of completing this report and the enhancements envisioned for future versions of the model will improve its performance as a policy tool and allow DER-CAM to be used for forecasting DER market penetration.

Distributed Energy Resources in Practice
1
1. Introduction
1.1 Background
The current national trend towards energy deregulation has encouraged consumers to search for the most appealing energy provisions for themselves. Considerations include price, price stability, energy reliability, energy quality, and emissions. Because of recent improvements in small-scale electricity generation technologies, many of these considerations are favorably addressed by the use of distributed energy resources (DER). However, the dramatic shift in structure from monopolistic supplier to decision-enabled consumer requires much research and confirmation before customer adoption. This report represents the most recent step in two years of work on Distributed Energy Resource Customer Adoption Model (DER-CAM). It focuses on case studies of distributed energy resources (DER) and acts as a model validation study for DER-CAM. The model is validated against real-world test sites. This report develops case studies at sites across the Unites States of DER installations and examines the business decisions that led to the installations. All efforts at Berkeley Lab have focused on small-scale on-site generation (i.e. < 1 MW), especially those involving combined heat and power (CHP) applications. While the 1 MW limit is somewhat arbitrary, it represents a reasonable size above which generation would be big enough to be installed under existing PURPA rules of participation in wholesale electricity and ancillary services markets, which typically specify a minimum size of 1 MW. DER-CAM was originally developed for analysis of microgrids, or small semi-autonomous collections of utility customers. Technology adoption decisions of hypothetical microgrids offer insight into the potential cost, energy savings and environmental consequences resulting from the application of distributed energy resources. DER-CAM has since been enhanced, and its applicability broadened. The first enhancement to DER-CAM included the addition of thermal energy modeling, as it had previously been limited to modeling of electrical energy loads. This enhancement involved many assumptions and modeling difficulties, but resulted in the ability to analyze CHP systems. DER-CAM was then further developed through integration with Geographical Information Systems (GIS), and applied to the modeling of a hypothetical microgrid in San Diego that was based on a collection of businesses in that city. DER-CAM is also capable of being used for pollution emissions studies, as reported in Marnay et al (2002), where the authors studied the effects of carbon tax on the adoption of DER technologies.2 DER-CAM has also proven to be viable tool for sensitivity analysis. In the study of the hypothetical San Diego microgrid, the effects of varying parameters thought influential on DER technology adoption were studied. The results were surprising in that the level of standby charges, often cited by people within the DER industry to be the biggest hurdle to technology adoption, were 2 Marnay et al. “Effects of a Carbon Tax on Combined Heat and Power Adoption by a Microgrid,” presented at the Second International Symposium on Distributed Generation, Stockholm, Sweden. October 2-4 2002.

Distributed Energy Resources in Practice
2
not significant. Other factors such as electricity and gas prices, along with the technology capital costs, were determined to be more important at influencing the technology adoption decision. After conducting these studies and surmising results contradictory to popular opinion, it was deemed appropriate to validate the model and ensure that results from previous DER-CAM studies were accurate towards this end: the use of test sites allowed for collection of input data to DER-CAM and a comparison of results from DER-CAM to the financial analysis performed by each site in the process of their technology adoption decision. The technology adoption decision itself could also be compared to the output from DER-CAM of the least-cost technology installation and operation decision for a given site. 1.2 The Distributed Energy Resource-Customer Adoption Model
DER-CAM is a cost minimization mixed integer program formulated in GAMS3 (General Algebraic Modeling System) and solved with CPLEX. It has a Visual Basic front end, developed internally by the Berkeley Lab DER-CAM team, to improve the ease of data and parameter entry into the model. The full mathematical model is described in Appendix F. The objective function to be minimized is the annual cost of providing energy services to the site, through either utility electricity and gas purchases, or DER operation (or a combination of both) in total dollars for the test year. The objective function value is an annuity based on the estimated annual costs of electricity purchases, gas purchases, operating and maintenance costs and the amortized costs of DER equipment. Typical inputs to the model include the site’s five load profiles, tariff structure under which the site buys electricity and other fuels, and values from a database of technology costs and performance. The five load profiles are electricity-only (not including cooling), cooling, space heating, water heating, and natural-gas-only. The output is a set of installed DER technologies that minimize annual costs of meeting energy demand for the site. The hourly operating schedule of each selected technology is provided in the output, as well. A key constraint included in the model (that is, conditions to be met) is that energy demand for each hour must be met by the purchase of energy from utilities, operation of any technology or set of technologies selected by the model, or a combination of purchase and on-site generation. In addition, all environmental rules must be obeyed, and equipment capabilities must not be exceeded.
3 GAMS is a proprietary software product used for high-level modeling of mathematical programming problems. It is owned by the GAMS Development Corporation (http://www.gams.com) and is licensed to Berkeley Lab.
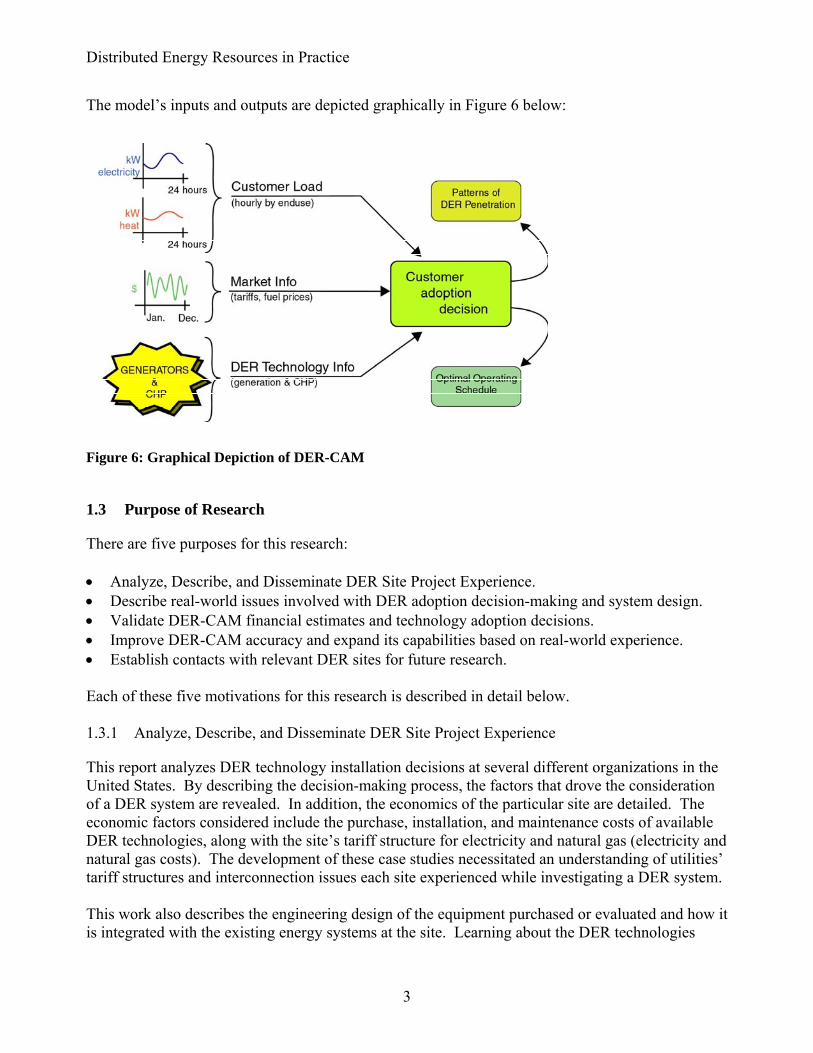
Distributed Energy Resources in Practice
3
The model’s inputs and outputs are depicted graphically in Figure 6 below:
Figure 6: Graphical Depiction of DER-CAM
1.3 Purpose of Research
There are five purposes for this research: • Analyze, Describe, and Disseminate DER Site Project Experience. • Describe real-world issues involved with DER adoption decision-making and system design. • Validate DER-CAM financial estimates and technology adoption decisions. • Improve DER-CAM accuracy and expand its capabilities based on real-world experience. • Establish contacts with relevant DER sites for future research. Each of these five motivations for this research is described in detail below. 1.3.1 Analyze, Describe, and Disseminate DER Site Project Experience
This report analyzes DER technology installation decisions at several different organizations in the United States. By describing the decision-making process, the factors that drove the consideration of a DER system are revealed. In addition, the economics of the particular site are detailed. The economic factors considered include the purchase, installation, and maintenance costs of available DER technologies, along with the site’s tariff structure for electricity and natural gas (electricity and natural gas costs). The development of these case studies necessitated an understanding of utilities’ tariff structures and interconnection issues each site experienced while investigating a DER system. This work also describes the engineering design of the equipment purchased or evaluated and how it is integrated with the existing energy systems at the site. Learning about the DER technologies

Distributed Energy Resources in Practice
4
installed at various sites furthered the team’s knowledge of cost, performance, and integration of distributed generation, CHP, and absorption cooling technologies. The various DER systems covered by these case studies provide further evidence of the potential for a DER system to reduce cost, improve reliability, and maintain the quality of energy services delivered. One goal of this report is to collect and disseminate information on the variety of applications for which DER systems are being used and to quantify the financial savings achieved in a variety of sectors. 1.3.2 Describe Real-World Issues Involved with DER Adoption Decision-Making and System
Design
Studying the process a business or other organization follows to evaluate onsite generation opportunities provides important insights into the factors influencing adoption of DER technologies. One purpose of this study was to examine the decision-making process and then to evaluate it in DER-CAM. The differences between DER-CAM cost optimization results and real-world decisions would then be examined. DER-CAM would be used to for sensitivity studies regarding key factors in the decision making process at the actual test sites. In studying real-world decision making, consideration should be given to modeling and optimizing correct input values. For example, if at a site the technology is selected prior to an engineering and financial analysis, future improved generations of a technology selection model, no matter how accurate, will not provide useful information in the real world. It may, however, provide information that counters pre-conceived notions of the most appropriate technology for the particular site. This study provides useful information to assist in defining what a model can and cannot do, and helps define the boundaries between the modeling process and the real world decision-making process. 1.3.3 Validate DER-CAM Financial Estimates and Technology Adoption Decisions
This study seeks to validate the financial results and technology selection decisions of DER-CAM against the technology adoption decisions made at actual sites. Understanding the decision-making process for real-world DER implementation provides an understanding of important considerations that are not included in DER-CAM or are difficult to quantify. This study may reveal other factors that were not considered but could be included in future editions of the model. In addition, the seriousness of some of the known limitations of the model can be calibrated. This validation involves three components. The first component compares the sites’ historic energy costs for electricity and gas with a DER-CAM base case annual cost without installing DER systems. The second validation component compares the predicted costs of a technology adoption decision, on an annual basis, with projected costs from energy analyses or actual costs of operating DER systems. The third validation component compares the site’s estimated annual benefit to the estimated annual benefit from DER-CAM. The fourth validation component compares DER-CAM’s optimal technology selection with the technologies selected in the real world. Future validation work may include validating DER system cost estimates with actual installation and operating costs once the DER systems are operational.

Distributed Energy Resources in Practice
5
1.3.4 Improve DER-CAM Accuracy and Expand its Capabilities Based on Real-World Experience
As this study provides understanding of the real-world decision-making process it will also provide insight into the limitations of DER-CAM. These limitations will likely fall into two categories: those that are “fixable” by enhancing model capabilities, and those that are too difficult to quantify and include into any type of computer model. See Section 8, Areas for DER-CAM Improvement and Further Study, for a description of suggested improvements to DER-CAM and lessons learned about the model from this work. This goal also leads to future work using the improved accuracy of DER-CAM in order to establish it as a policy tool for forecasting DER market penetration. This work may take the form of integrating DER-CAM results with the National Energy Modeling System (NEMS). 1.3.5 Establish Contacts with Relevant DER Sites for Future Research
A fifth purpose for this study is to establish a list of DER sites that may provide a testing ground for future research such as work on system design, integration, reliability analysis, control system software development, emissions testing, and other areas. One potential future benefit of DER-CAM is to assist in the development of the control systems necessary to transpose an operating schedule output from DER-CAM into a set of instructions understood by DER equipment. Operating DER systems at sites running a variety of equipment for numerous commercial purposes should provide useful experience and potential demonstration centers for future control systems work. This work focuses on the decision making process for technology selection. However, it is equally important to learn about the impact that installation of DER and their subsequent operating processes have on system design after the decision is made. Gaining knowledge of the pitfalls of design and installation, integration ability of DG, CHP, absorption chillers, electric chillers, control systems, end-use loads, and the plumbing and wiring that connects it all together is extremely valuable. Experience will also be gained on the reliability of different DER systems. 1.3.6 Methodology & Application Summary
As stated above, the goals and purpose of this report are to develop case studies of DER systems, study real world decision making processes, validate DER-CAM’s financial estimates and technology adoption decisions, find areas in which to improve DER-CAM, and establish contacts with sites for future research. The first step in this study was to develop a list of desirable characteristics for case study sites. These characteristics were then ranked by importance (see Section 2.1.2). Next, case study sites with these characteristics were sought by reviewing electronic newsletters and various journals, talking with colleagues, searching DER related web pages, and attending conferences focused on DER and CHP. Letters describing the project were drafted to help enlist people at the sites. Far more sites were sought than could reasonably be analyzed with the time and resources available, due to the

Distributed Energy Resources in Practice
6
expectation that many promising sites would not be able to provide necessary information at some stage of the report. Sites that seemed both interesting (they met criteria described in Section 2.1.2) and interested in participating in the study were analyzed in more detail. Questionnaires were developed to obtain thorough information about the sites’ decision process, the DER technologies installed, how the technologies were integrated, and the information used to support the decision (see Appendix G). Completed questionnaires were followed up with phone calls to clarify information and seek more detail if necessary. The information requested from sites included data on the factors driving the decision making process, site loads, their DER equipment and capacities selected, the cost of installing the DER system. The requested information is described in Section 2.2

Distributed Energy Resources in Practice
7
Data Requirements for Each Site. Follow-up phone calls were often made to site contacts to clarify or obtain further information. The information obtained from sites sometimes required modification before it could be incorporated into DER-CAM. This process involved filling in additional details needed by estimating particular end-use loads or tariffs from partial information provided, or generating loads using the DOE-2 building simulator. Once the required data sets were complete, through either use of site data, estimation processes or building simulating software, they were used as input data to DER-CAM. DER-CAM results are compared with actual site information in three stages. First, each of the sites’ historic energy costs for electricity and gas are compared to its respective DER-CAM simulation base case of annual cost calculated without installing DER systems. The second set of analyses involves comparing the predicted annual costs of a particular technology adoption decision for a site, with projected costs obtained either from the site or from energy analysis. The third set of analyses involves comparing DER-CAM’s optimal technology selection with the technologies selected in by the respective test site. Sensitivity analyses were performed to understand the influence of key parameters (the cost of natural gas, the presence of standby charges, and the demand charges vs. flat electricity rates for each site) on the decision to install DER technologies and their resulting effect on cost effectiveness. Lessons about real-world decision-making are also summarized in Section 5 Lessons in Decision-Making and DER Adoption. This involves comparing tools used in real-world analysis with the DER-CAM process. The final step is to draw conclusions from this work and then disseminate the results and conclusions to colleagues and the public.

Distributed Energy Resources in Practice
9
2. Methodology
2.1 Site Selection Procedures
It was originally estimated that to gather the required detailed information from five final qualifying sites, approximately 50 to 70 sites would need to be found initially. 2.1.1 Candidate Site List Compilation
Based on the requirement to locate 70 sites in the US that had considered installing DER technologies, the first task was to locate sources of information about current DER projects. The available sources of this information included colleagues, trade journals and magazines (especially the DER Weekly electronic journal), DER-focused web sites, and conference proceedings. A list of approximately 90 DER project sites was developed that contained the site name, location, the energy developers, the type of technology installed along with notes about the origin of the contact and its status. This list was pared down to about 50 promising sites based on installation size (0-500 kW preferred but up to 1 MW if from multiple generators), use of CHP, and DER installation being motivated by economic rather than demonstration purposes. See Section 2.1.2 for a full list of required site characteristics. The New York State Energy Research and Development Authority (NYSERDA) conference in New York was a source of approximately ten contact sites that met the test site requirements. The sites considered in this case study analysis were based on contacts with sites from the DER project list, a desire to maintain a balance of the desirable characteristics, and their willingness to participate in the case study project. 2.1.2 Required and Desired Site Characteristics
The site characteristics required for inclusion into this study include: 1. Generating capacity: 0-500 kW from a single unit, up to 1 MW if from multiple units; 2. Use of combined heat and power (CHP) technology; 3. High potential for a favorable relationship to be developed with site and developer; 4. DER adoption was motivated by entrepreneurial reasons such as financial, reliability, service or
power quality, or competitive advantage. No pure demonstration sites would be considered; 5. Financial analysis was performed during the decision-making process; 6. On-site generation was to be a source of primary power, not just for back-up power; 7. Developers were willing to share cost and load data with Berkeley Lab along with information
on the conditions that influenced the technology adoption decision process. Additional desired site characteristics include: • Prior knowledge of contact at site, or previous relationship; • Considered multiple DER technologies for providing power and energy; • Completed a financial and engineering analysis of potential DER systems other than those
installed;

Distributed Energy Resources in Practice
10
• Selected a type of technology to install and its capacity; • Considered small (< 500 kW) generation systems, microturbines, fuel cells, natural gas engines
preferably used in combination with absorption chillers, desiccant dehumidification, or heat recovery units;
• Receipt of grant money was considered acceptable; • DER to provide a significant portion of total electricity requirement; • Projects motivated by performance, cost or other competitive considerations; • Replicable benefits (i.e. chain stores or representative businesses) are considered attractive; • A mix of sites from different economic sectors such as manufacturing, agriculture, retail, health
care, and commercial office building was considered desirable; • A range of geographical locations, although finding examples of DER in areas with low
electricity cost proved difficult; • Sites with groupings of customers or related activities potentially benefiting from DER systems
was desirable; • Projects with little previous exposure in energy publications were preferred. The list of potential sites was narrowed down based on first meeting the required criteria and then based on meeting desirable characteristics listed above. Efforts were then focused on obtaining more information about each site. The sites’ decision-making process, the factors that influenced it, and the data that was used in support of it were analyzed. Responses to phone calls and letters sent to appropriate contact people were used to determine the site’s willingness to participate in the case study analysis and share information about their DER adoption decision. In the process of developing this report, twelve case study sites were visited in New York, California, and Hawaii. These site visits were important for establishing relationships with the facility managers, obtaining cost and load data from the site, and gaining insight into the real world problems and issues involved with designing and installing a DER system. Lessons learned from the site visits are discussed in Section 5. 2.1.3 Final Site Selection
As a result of the site discovery and elimination steps taken above, sufficient data on DER system costs (or estimated costs if the system was not yet installed) and customer energy loads were obtained for an initial analysis on the nine sites listed in Table 11 below. From these nine sites, five were selected that represented the best mix of important characteristics such as business type, geographic diversity, DER technology selection, access to engineering and financial information, and availability of information about their business-based decision-making criteria. An effort was made to include regional diversity among the sites selected. However, information about DER projects in the South was difficult to obtain, apparently due to the lack of DER investment in the South. The little information obtained about DER sites in the South was not obtained early enough for the purposes of this project.

Distributed Energy Resources in Practice
11
Table 11: List of Potential Sites Providing Enough Information to Perform Full DER-CAM Analysis
Site Location/Utility Type of facility Installed Technology AA Dairy* Candor, NY
NYS Electric & Gas Dairy Farm Digester biogas system
converted 130 kW diesel engine
A&P* Hauppauge, NY (Long Island) Long Island Power Authority
Supermarket 60 kW Capstone microturbine, CHP for space heating & desiccant dehumidification
East Bay Municipal Utility District (EBMUD)
Oakland, CA PG&E
Administration Building
10 x 60 kW Capstone microturbines, 530 kW (150 ton) absorption chiller and CHP
Guarantee Savings Building (GSB)
Fresno, CA PG&E
12 Story Office Building for IRS and INS
3 x 200 kW Phosphoric Acid Fuel Cells, CHP, 350 kW (100 ton) absorption chiller
The Orchid* Big Island, Hawaii Hawaiian Electric Light Company
Resort Hotel 4 x 200 kW propane fired engine with 840 kW (240 ton) absorption and CHP
BD Biosciences Pharmingen (BD)
San Diego, CA San Diego Gas and Electric
Industrial Bio-Technology Supplier
2 x 150 kW natural gas engines, CHP space heating
Rochester International Airport (RIA)*
Rochester, New York Rochester Gas and Electric
Airport 2 x 750 kW natural gas engines, CHP and absorption cooling
San Bernardino US Postal Service (USPS)
Redlands, CA Southern California Edison
Mail Handling Facility
500 kW natural gas engine without CHP
Wyoming County Community Hospital (Wyoming)*
Warsaw, NY NYSEG electricity and Rochester Gas and Electric natural gas
Hospital 560 kW natural gas engine with CHP and absorption cooling
* Sites with operating DER systems

Distributed Energy Resources in Practice
12
2.2 Data Requirements for Each Site
The following data were requested from each site. While some of these data are required for DER-CAM, other information was requested to help understand the specific requirements of each case study site. 2.2.1 Utility Provider and Applicable Tariff Schedules:
The utility tariff schedule (which can be accessed on-line) provided the following information required by DER-CAM: • Electricity rate, • Natural gas rate, • Demand charges – if applicable, • Standby charges – if applicable, • Net metering prices (for kWh sold to utility) – if available, and • Special utility interconnection charges. 2.2.2 Performance and Cost Characteristics for each of the DG Technologies Considered
The following information regarding the candidate DG technologies for installation were also requested: • Model numbers and type, • Capital cost expected, • Delivery and installation cost, • Fixed annual operation and maintenance costs, • Variable annual operation and maintenance costs, • Expected operating lifetime, • Expected operating hours per year, • Delivery date expected, • Cost of required ancillary equipment (such as heat exchanger systems for capturing and
delivering thermal energy):
Absorption cooling conversion cost (if applicable), Compressor cost, Fuel conditioning equipment costs, Monitoring equipment, and Cost of ancillary equipment required by utility for interconnecting.
Information on DG technologies that were eliminated from consideration based on past experience, knowledge of technology cost and performance, or other issues such as vendor availability (to deliver technology on time) was also requested.

Distributed Energy Resources in Practice
13
2.2.3 Load Data
The following information regarding the sites’ electric and thermal loads was requested; • Electric consumption by end-use load on an hourly basis if possible; • Thermal energy loads by end-use and type of fuel on an hourly basis if possible; • Metered electric and gas consumption data from utility bills; • Seasonal fluctuations (if not included in above data). 2.2.4 Financial Analysis
To reproduce the financial analysis performed by the test sites, capital costs and tariffs were required. Consequently, the following information was requested: • Type of financial analysis used (time to payback, net present value, return on investment, etc.)
to determine the value of the project to the company, including the interest rates used. • How future utility prices were estimated. • How risk was incorporated into the analysis. • Information pertaining to which federal, state, and non-government grants and rebates were
available and requested. • Permitting and inspection costs. • Details on site regulatory constraints, such as those on air emissions, noise, solid waste, fuel
storage, containment issues, and emissions trading considerations. The following definitions and terminology help to clarify the financial calculations presented in this section. Table 12: Definition of Financial Terms Used in Analysis
Base Case The annual cost of paying electric and natural gas utility bills at a facility prior to installing a DER system.
Capital Cost The up-front, turnkey DER system cost. It is considered in this respect a one time cost at the start of a project.
Annualized Capital Cost
This is the Capital Cost turned into an annuity over the expected lifetime of the technology at a given interest rate. The default values for most DER technologies were 12.5 years at 7.5%. PV systems were given lifetimes of 20 years. Annual compounding is assumed.
DER Annuity
The annual cost of installing and operating a DER system. This cost includes the annualized capital cost of the DER technology, O&M costs, fuel purchases, and the cost of purchasing any additional electricity and natural gas from the utility. It is an annual cost over the lifetime of the DER technology.
Annual Payment
The cost of operating a DER system including O&M costs, fuel purchases, and the cost of purchasing any additional electricity and natural gas from the utility. These are the costs of providing energy services to a facility if the DER system capital costs are paid in full at the start of the project
Annual The difference between the Base Case and the Annual Payment. These benefits are
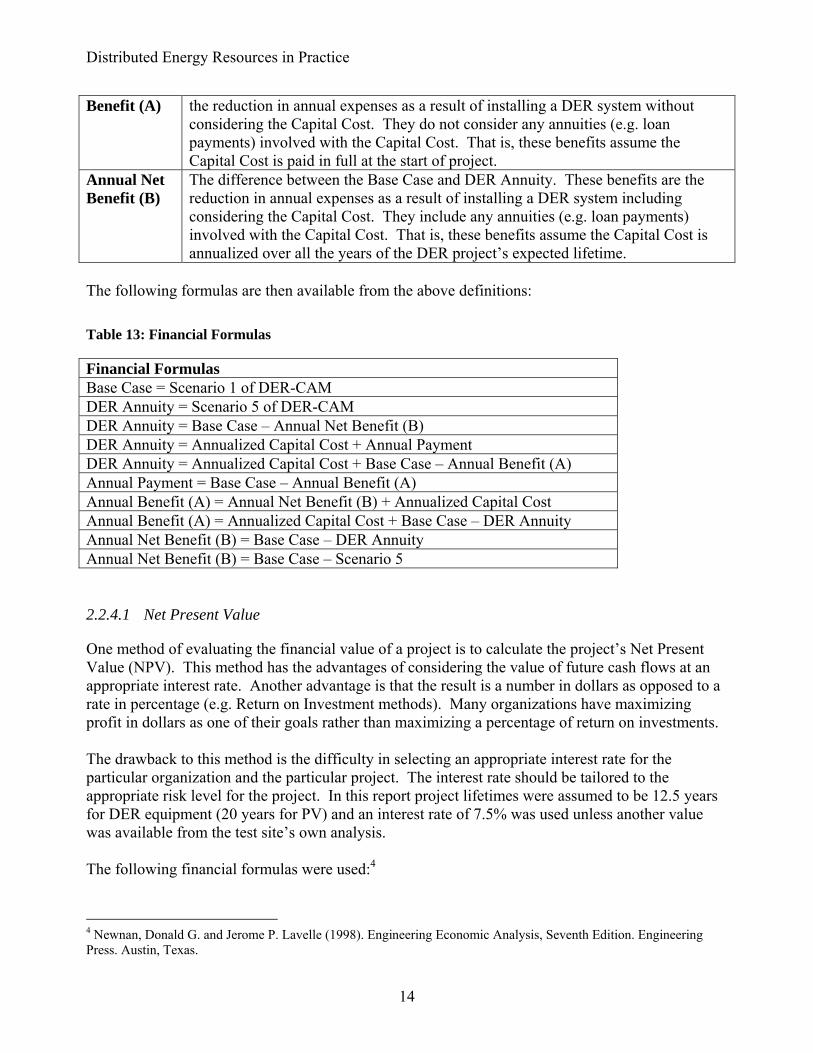
Distributed Energy Resources in Practice
14
Benefit (A) the reduction in annual expenses as a result of installing a DER system without considering the Capital Cost. They do not consider any annuities (e.g. loan payments) involved with the Capital Cost. That is, these benefits assume the Capital Cost is paid in full at the start of project.
Annual Net Benefit (B)
The difference between the Base Case and DER Annuity. These benefits are the reduction in annual expenses as a result of installing a DER system including considering the Capital Cost. They include any annuities (e.g. loan payments) involved with the Capital Cost. That is, these benefits assume the Capital Cost is annualized over all the years of the DER project’s expected lifetime.
The following formulas are then available from the above definitions: Table 13: Financial Formulas
Financial Formulas Base Case = Scenario 1 of DER-CAM DER Annuity = Scenario 5 of DER-CAM DER Annuity = Base Case – Annual Net Benefit (B) DER Annuity = Annualized Capital Cost + Annual Payment DER Annuity = Annualized Capital Cost + Base Case – Annual Benefit (A) Annual Payment = Base Case – Annual Benefit (A) Annual Benefit (A) = Annual Net Benefit (B) + Annualized Capital Cost Annual Benefit (A) = Annualized Capital Cost + Base Case – DER Annuity Annual Net Benefit (B) = Base Case – DER Annuity Annual Net Benefit (B) = Base Case – Scenario 5 2.2.4.1 Net Present Value
One method of evaluating the financial value of a project is to calculate the project’s Net Present Value (NPV). This method has the advantages of considering the value of future cash flows at an appropriate interest rate. Another advantage is that the result is a number in dollars as opposed to a rate in percentage (e.g. Return on Investment methods). Many organizations have maximizing profit in dollars as one of their goals rather than maximizing a percentage of return on investments. The drawback to this method is the difficulty in selecting an appropriate interest rate for the particular organization and the particular project. The interest rate should be tailored to the appropriate risk level for the project. In this report project lifetimes were assumed to be 12.5 years for DER equipment (20 years for PV) and an interest rate of 7.5% was used unless another value was available from the test site’s own analysis. The following financial formulas were used:4
4 Newnan, Donald G. and Jerome P. Lavelle (1998). Engineering Economic Analysis, Seventh Edition. Engineering Press. Austin, Texas.
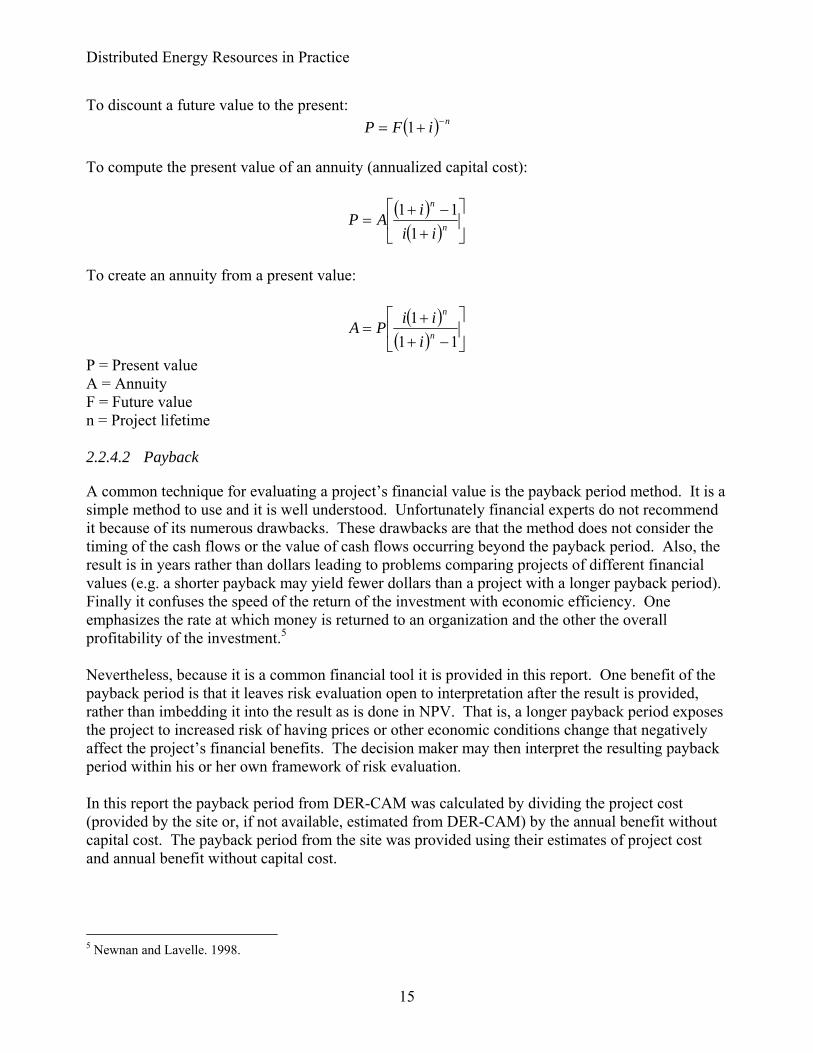
Distributed Energy Resources in Practice
15
To discount a future value to the present: ( ) niFP −+= 1
To compute the present value of an annuity (annualized capital cost):
( )( ) ⎥
⎦
⎤⎢⎣
⎡
+−+
= n
n
iiiAP
111
To create an annuity from a present value:
( )( ) ⎥
⎦
⎤⎢⎣
⎡
−++
=11
1n
n
iiiPA
P = Present value A = Annuity F = Future value n = Project lifetime 2.2.4.2 Payback
A common technique for evaluating a project’s financial value is the payback period method. It is a simple method to use and it is well understood. Unfortunately financial experts do not recommend it because of its numerous drawbacks. These drawbacks are that the method does not consider the timing of the cash flows or the value of cash flows occurring beyond the payback period. Also, the result is in years rather than dollars leading to problems comparing projects of different financial values (e.g. a shorter payback may yield fewer dollars than a project with a longer payback period). Finally it confuses the speed of the return of the investment with economic efficiency. One emphasizes the rate at which money is returned to an organization and the other the overall profitability of the investment.5 Nevertheless, because it is a common financial tool it is provided in this report. One benefit of the payback period is that it leaves risk evaluation open to interpretation after the result is provided, rather than imbedding it into the result as is done in NPV. That is, a longer payback period exposes the project to increased risk of having prices or other economic conditions change that negatively affect the project’s financial benefits. The decision maker may then interpret the resulting payback period within his or her own framework of risk evaluation. In this report the payback period from DER-CAM was calculated by dividing the project cost (provided by the site or, if not available, estimated from DER-CAM) by the annual benefit without capital cost. The payback period from the site was provided using their estimates of project cost and annual benefit without capital cost.
5 Newnan and Lavelle. 1998.

Distributed Energy Resources in Practice
16
2.2.5 Special Constraints Faced By the Site
Information regarding constraints faced by the site was requested. Examples include diesel engine hours per year restrictions, combustion emissions restrictions, reliability requirements (or financial cost of outages per unit of time), size or weight limits of equipment, and other factors that might eliminate certain technologies (such as the oil requirements of reciprocating engines). 2.3 Tariff Information
Some of the most significant inputs to DER-CAM are electricity and natural gas tariffs. Tariff structures vary by site and are often complex. They can include flat rate tariff schedules, time of use (TOU) tariff schedules, customer charges, demand charges both on maximum demand and by rate period ($/kW), energy charges ($/kWh), standby charges, site minimums, rate limiters, etc. In addition, each of these charges can vary by month or by season. See Appendix I for detailed tariff worksheets developed for each site and descriptions of how each charge applies to the respective sites. Perhaps due to the complexity of many tariff agreements the test sites are subject to, gathering the precise information required by DER-CAM proved difficult. In most cases, site managers did not have a thorough knowledge of their rate structures outside of the more general details (such as which rate schedule they are on or the level of standby charges they are subject to). While the utilities were generally forthright in providing the correct tariff information, deciphering the schedules for application to the modeling process was challenging. Due to their ability to make use of waste heat from on-site generation for heating and cooling needs, many of the sites studied are considered Qualifying Facilities (QF). QFs are facilities that meet criterion set forth by the Federal Energy Regulatory Commission (FERC) for minimum efficiencies and other requirements for on-site power generation.6 It is sometimes the case that standby charges are waived for QFs depending upon the utility service territory. See Section 2.9 for more detailed description QF status and how these benefits of QF status were applied in this model. The California Public Utilities Commission offers rebates on QF project costs as described in Section 2.9.1. Individual utilities within the state offer alternative tariff schedules for QFs. Alternative tariff schedules generally waive stand-by charges but include an additional demand charge that is implemented if the installed generation equipment is unavailable for more than a specified amount of time per month. In New York State, utilities were required to develop a new service classification to deal with standby rates for customers with DER systems. Qualifying facilities have the option to select a different rate than their standard rate. However, this different rate is not necessarily beneficial and does not necessarily include removal of standby charges.7 Almost all utilities in New York have
6 FERC document 18 C.F.R. 292.203(a) specifies the requirements of a Qualifying Small Power Production Facility and document 18 C.F.R. 292.203(b) specifies the requirements of a Qualifying Cogeneration Facility. 7 Mike Reader, NYPSC, personal communication, 19 September 2002.

Distributed Energy Resources in Practice
17
filed new proposals for industrial customer rates and the earliest proposals have been accepted by the PSC, including a new tariff structure from Niagara Mohawk.8 2.4 DOE-2 Load Development9
No sites were able to provide complete electric and thermal load profiles available on an hourly basis, as required by DER-CAM. The DOE-2 building energy simulator was used to model any unavailable hourly electricity, heating, or cooling loads (see Appendix J). A simplified user interface was developed for the DER-CAM team, from which hourly load information was generated based on building type, location, interior area, and known information about the building’s energy consumption. Output data were generated as hourly reports containing selected DOE-2 output specifications. The DER-CAM load input is a matrix containing average hourly load data by weekday and weekend for the twelve months of the year. Thus, there are 24 rows of data per load type. There are five end-use load types, giving a total of 120 rows of load data, with 24 columns (one for each hour of the day). The five DER-CAM load types used in this study are: • Electric-only: loads met only by electricity and that cannot be met by natural gas or CHP heat
(i.e. lighting, computing, etc.). • Space cooling: loads met by electricity or heat recovery through absorption chillers. • Space heating: loads met either directly by natural gas or with residual heat from CHP. • Water heating: loads met either directly by natural gas or with residual heat from CHP. • Natural-gas-only: loads met only by natural gas and not CHP opportunities (i.e. primarily
cooking loads). The DOE-2 output was converted to appropriate SI units, and then each load profile was added to one of the five end-use load types. This involved estimation of the type of energy system DOE-2 modeled during the load profile generation. A Visual Basic for Applications macro was built in Microsoft Excel to convert the DOE-2 output into the format needed by DER-CAM. An hour-by-hour load profile for each month was computed from hourly load profiles for each day of the year (8760 hours total), end-use, and day type by averaging all the values of each particular hour, month, end-use, and day type. This macro also recorded the peak hourly load for each month and each day type and compared it to the maximum average hourly load for each hour and each day type. Average loads (averaged over each hour of each month and each day type) were used in DER-CAM so this comparison was between the peaks before and after averaging to provide information on how much the peak load was reduced by the averaging process. These load profiles were displayed in a spreadsheet and calibrated to match any information provided by the sites regarding their energy use. The test site load profiles described in this report are presented in Appendix K.
8 Mike Reader, NYSPSC, personal communication, 19 September 2002. 9 Performed with the kind assistance of Norman Bourassa, LBNL.

Distributed Energy Resources in Practice
18
2.5 Automation Manager
Figure 7 below depicts the graphical front-end developed by Michael Stadler in Visual Basic. It allows rapid data entry for tables used in DER-CAM by GAMS and the modification of common parameters. This interface was essential to this project due to the large number of model runs with different data sets and parameter specifications.
Figure 7: DER-CAM Automation Manager Graphical User Interface

Distributed Energy Resources in Practice
19
2.6 Scenarios Considered for Each Site
2.6.1 Description of the Six Scenarios
Six scenarios were established that modeled potential decisions at each site with the goal of obtaining insight into various decision-making situations and results. From these six scenarios, modifications were made based on conditions at each site and situation to conduct specific sensitivity analysis. In these scenarios described below, the term “selected technology” is used to describe the specific technology types selected at a particular case study test site. These six Scenarios are: 2.6.1.1 Scenario 1: The Base Case, or “Business as Usual” Case
The site purchased electricity and gas from the utility company at the standard tariff rates for this location. This scenario used the site electric and thermal load data, and the tariff information from the utility to estimate the yearly energy bill for electricity and gas. This scenario allowed critical calibration of DER-CAM to past energy cost information. This scenario also improved our understanding of the local tariff and the structure of site energy costs (i.e. composition of total bill as electricity and heating fuel and, of specific time period charges for energy and demand). This scenario also provided a way to check if estimates of site electricity and gas load were an accurate estimate of actual energy use. Additionally, this scenario was helpful for the initial model runs to catch bugs and errors in model parameters. 2.6.1.2 Scenario 2: Unlimited installation
This scenario allowed for theoretical energy cost minimization by allowing the model to choose an optimal combination of technologies from all the technologies in its database. In other words, DER-CAM is run as an optimization with no restrictions on technology choices or investment levels. 2.6.1.3 Scenario 3: Unlimited installation of technology type selected at site
This scenario restricted the model to choose the technology that was actually installed at the site by the proprietor and developer. However, the number of units selected could range from zero to infinity. Hence, the possible solutions are to not install DER or to install the particular DER technology type (e.g., all natural gas engines and CHP configurations) selected at the site with any capacity value. Scenario 3 was often used for sensitivity analysis of annual operating cost to changes in the spark spread rate, natural gas prices and standby charges. By adjusting the parameters in this scenario, how the actual technology adoption decision may have come out differently can be gauged. 2.6.1.4 Scenario 4: Forcing purchase of selected technology at site
This scenario requires the model to install the chosen technology, but additionally prohibits zero installation. This scenario was developed to obtain information about the costs of installing a specific technology, in any capacity level, at the site. This provides information about the annual operating costs of the selected technology at the site. Scenario 4 was established because in

Distributed Energy Resources in Practice
20
Scenario 3 the model may not install the available technology and the results match those of Scenario 1. Scenario 4 forces the installation of the technology selected at the site but in unlimited capacity levels. Scenario 4 often had four different versions (A through D) to represent the four potential configurations of a DER system: a) DG technology alone, b) DG with CHP capability, c) DG with absorption chiller, and d) DG with CHP and absorption chillers. Scenario 4 could be run with each of these versions to provide information on the annual operating cost of the different configurations of a particular technology. 2.6.1.5 Scenario 5: Forcing purchase of selected technology and same capacity as site
This scenario is similar to Scenario 4 although it requires the installation of the same capacity, or number of units, as decided upon at the actual site. This scenario will provide the most accurate description of the installation and operating cost of the system as specified in the design at the case study site. 2.6.1.6 Scenario 6: Force same technology, capacity, and set operating level
Scenario 6 was developed to require the model to select the technologies and capacities as in Scenario 5 but also to require the technology to operate at a certain level of output. This scenario was developed to address the issue of having technologies installed by the model but not operated. A constraint forces a certain level of output to be dedicated to a specific load. It should be noted that this level of output must be less than both the installed capacity and the minimum load that the output is directed toward. Also the load must be matched with the type of technology selected. For example, an electric-only load may cause problems with a technology that produces electricity, heating, and cooling. Scenario 6 was not used to date since the model, when forced to install a certain technology and or capacity, chose to run the technology at least part of the time. This scenario, however, may be useful in future modeling work. This scenario could also be used to obtain annual operating cost information for technologies operating at a certain fixed load level set in advance of the model run.

Distributed Energy Resources in Practice
21
Table 14: Description of Six Scenarios in DER-CAM
Scenario 1 Base Case scenario Utility purchase of electricity and gas
Scenario 2 Unlimited installation of DER technologies Any technology and capacity combination allowed (true optimization)
Scenario 3 Choice of only technology type (e.g. natural gas engines) installed at site. No requirement to install or capacity constraint. >= 0 technology units (same type)
Scenario 4 Forced purchase of same technology as site At least one unit must be purchased. >= 1 technology units (same units)
Scenario 5 Forced purchase of same technology unit as installed at site And same capacity = X technologies (same number of units)
Scenario 6 Forced purchase of same technology and capacity as site chose Fixed operating level in terms of kWh output
2.6.2 Graphical Representation of Scenario Results
In the interest of brevity, a graphical presentation of each site’s scenario results is presented in their respective sections along with a table summarizing the results from each scenario, while all numerical results and sensitivity analyses are presented in tabular form in Appendix A. Figure 8 below is a sample graphical presentation of scenario results. Each bar represents the results of one scenario, as labeled at the bottom of the bar. The three shaded sections represent the proportions of annual energy costs for self-generation (equipment capital costs and operation and maintenance costs), electricity from the utility, and natural gas from the utility. Natural gas purchases include all natural gas purchases from the utility, including those used to fuel DER equipment. These graphs do not depict the type or amount of DER equipment selected by DER-CAM. These data are presented in Section 6, in Table 53: Comparison of Site DER System Selection Decisions, and in the results section of each site.

Distributed Energy Resources in Practice
22
Figure 8: Sample Scenario Results
Another output from DER-CAM is the daily average source of energy consumed (e.g. utility or DER) for a given load type for a given day type in a particular month. For example, DER-CAM produces information on the amount of electricity serving the electric-only load that comes from the utility or the DER system during a weekday in January. This information may be graphed for cooling, space-heating, and water-heating loads as well (natural-gas only loads are considered for these sites to always come from the utility, even if the natural-gas load is served by propane). Examples of these daily consumption graphs are presented Appendix B. 2.7 Sensitivity Analysis
Sensitivity analyses on the model runs were performed to understand the influence of key parameters on the decision to install DER technologies and their resulting cost effectiveness. Sensitivity analyses were preformed on the cost of natural gas and on standby charges for each site. In addition, the net cost of electricity, including energy, demand, time of use, and standby charges, was converted into a flat $/kWh energy charge for all hours. The sensitivities are described below. The results from these sensitivity analyses are presented in the individual case study sections. 2.7.1 Spark Spread Sensitivity
Sensitivity to natural gas is a simple way of examining the more complex parameter, the spark spread. Spark spread is defined as the ratio of cost per unit energy of electricity to the cost per unit energy of gas. A large spark spread implies energy from electricity is much more expensive than energy from natural gas. When the cost of electricity is high enough relative to that of natural gas (large spark spread), self-generating electricity using natural gas becomes economically attractive. By varying the natural gas costs, the spark spread is varied.

Distributed Energy Resources in Practice
23
Figure 9 below is a sample of the graphical presentation of spark spread sensitivity results. Each bar represents the installed capacity chosen by DER-CAM for a different spark spread, and the label below each bar specifies the spark spread and, in parentheses, the gas prices used for that run as a percentage of actual gas prices. The three shadings on the bars portray the proportions of installed capacity that is generation only, generation with heat recovery (CHP), and generation with heat recovery for absorption cooling. The horizontal line depicts the maximum electric load of the site so that installed capacity (bar) can be compared to maximum demand. The other line plotted on the graph is the yearly energy cost (DER, electricity, and gas) with respect to the vertical axis on the right side of the graph. The spark spread sensitivity analysis was performed on Scenario 3 to understand the effect of gas and electricity prices on the costs of the DER technology type selected at each site.
Figure 9: Sample Spark Spread Sensitivity
2.7.2 Standby Charge Sensitivity
Standby charges are imposed on DER adopters as a monthly cost per kW of installed DER capacity. This is intended to make self-generating sites pay for the excess capacity that the utility must have on hand in the event that the on-site DER equipment is not operating. Standby charges are often cited as a barrier to customer adoption of DER systems. Sensitivities to standby charges were done to see what affect standby charges had on customers’ decisions to self-generate. The standby charge analysis was performed on Scenario 3 to determine the effects of standby charges on the optimal costs, capacities and types of the selected technologies at each site. A Scenario 3 sensitivity analysis allows selection of any capacity within a given type (e.g. natural gas engines) and provides

Distributed Energy Resources in Practice
24
the flexibility, while still staying within the constraints of each site, to obtain more information about other cost effective DER system designs. It should be noted that standby charges have the same affect as increasing the capital cost of equipment—i.e., they are a fixed cost per kW of capacity. Every dollar of monthly standby charge per kW of capacity translates into $12 annually per kW of capacity. In the DER-CAM models used for these case studies, a discount rate of 7.5% was used, and the lifetime of all equipment was assumed to be 12.5 years. These values give an annuity on capital costs of 12.6% per year. Thus, a fixed annual cost (such as standby charges) is equivalent to 12.6% of a capital cost increase: Each dollar of a monthly standby charge ($12/kW annually) is equivalent to increasing the capital cost of equipment by $95/kW. Figure 10 below is a sample graphical presentation of standby charge sensitivity results. Bars are similar to those for spark spread sensitivity graphs (Figure 9) in that each one represents DER-CAM’s chosen installed capacity for a given standby charge in dollars per month (the label at the bottom of each bar). The bars are sectioned into proportions of generation only, generation with CHP, and generation with absorption cooling, which are selected. The horizontal line depicts the maximum electric load of the site so that installed capacity (bar) can be compared to maximum demand. The other line plotted on the graph is the yearly energy cost (DER, electricity, and gas) with respect to the vertical axis on the right side of the graph.
Figure 10: Sample Standby Charge Sensitivity

Distributed Energy Resources in Practice
25
2.7.3 Flat Rate Electricity Sensitivity
The application of time of use (TOU) electricity rates and demand charges has been the utilities’ method of applying real-time pricing to a commodity that, historically, was too expensive to meter in real-time. This creates a peaky rate schedule, arguably more so than would result from actual real-time pricing. In order to understand and compare DER adoption decisions and energy use patterns without the influence of rate schedules that fluctuate throughout the day, flat electricity rates (same cost per kWh at any time and no demand charges) were applied to each model. Flat rates were determined by dividing the sites’ total energy costs (in dollars) prior to DER installation to their total energy consumption (in kWh) prior to DER installation. The flat rate sensitivity analysis was performed on Scenario 2 of each site in order to determine the influence on overall DER adoption decisions. Figure 11 below is a sample graphical presentation of flat electricity rate sensitivity results. Bars represent the total yearly energy cost (DER costs, electricity, and gas), which are broken into proportions of the three costs. The line depicts the level of installed capacity chosen by DER-CAM in each scenario.
Figure 11: Sample Flat Electricity Rate Sensitivity
2.8 Assumptions of Modeling Process
There are two sets of assumptions in this modeling process: general assumptions required by the structure of DER-CAM, and assumptions that are specific to a particular test site. This section covers the general assumptions inherent in using DER-CAM. The case study site analysis will cover the assumptions made for each particular test site.

Distributed Energy Resources in Practice
26
The DER-CAM modeling process makes the following assumptions: • The modeling process assumes the software models are accurate. These software models
include DOE-2 and the assumption that the output is correct and linearly scalable. In other words, when DOE-2 energy use estimates disagree with actual data, the load profiles are still valid and can be scaled to meet actual data.
• All decisions are made in the same year: all technology, load, and tariff information is
concurrent. • Perfect information is assumed in the decision-making process: all technology cost and
performance data is accurate and known by all the decision makers involved in the process. Furthermore the cost estimates of a DER system do not change during a project’s installation period or after it is operating.
• All technologies in the model have one of four types depending upon the outputs it is capable of
producing: DG (electricity only), DG with CHP (heat recovery) capability, DG with absorption chiller (cooling) capability, or DG, CHP, and absorption cooling capability. In the model, each technology is simply a “box” that produces one of the four combinations of electricity, heat, and cooling capacity each hour with representative costs. In reality, the actual systems may not be able to be integrated without additional electrical and mechanical equipment. The integrated packages included in the model represent only a few of the many combinations of CHP technologies possible.
• For some of the case study sites DER-CAM was used to estimate the cost of a DER system with
CHP or absorption chilling. In these cases, the CHP systems were considered retrofits to the existing heating and cooling systems in each building. However, the capital cost of a DER system with CHP or absorption chilling, in dollars per kW, was estimated based on knowledge of the installed cost of these systems from some of the sites where that particular information was available. It is assumed that each customer uses a natural-gas-fired boiler or furnace to meet residual heating loads, and a compressor driven air conditioning system is used to meet cooling loads. It is assumed this equipment for meeting residual loads operates at average efficiency.
• In this model absorption cooling is used to displace compressor cooling. However, in order to
avoid altering the cooling load input data, the absorption cooling is also assigned a certain “phantom” electrical output at zero cost. This should result in the model accurately representing the capital and operating costs, and the performance characteristics of absorption cooling equipment while simultaneously substituting for electricity powered cooling equipment without affecting the electrical load data. The electrical load data are input to the model and mixed integer programming optimization models are not able to modify the input data.
• Since typically the performance of the CHP systems was given only at maximum capacity in the
specification sheets, it was assumed that each CHP unit operated at constant efficiency and COP over the range of output. That is, the amount of heating or cooling a unit produced was proportionally related to the percent of electrical capacity the unit is producing. The ratio of

Distributed Energy Resources in Practice
27
heating output, or cooling output, per unit of electric output is also assumed fixed. In other words, the efficiency of fuel input and energy outputs per unit of electricity production capacity are assumed fixed throughout the technology’s operating capacity.
• In the process of developing the heating and cooling loads for each particular site, only those
loads from the total heating and cooling loads that could be met by CHP systems were selected. Other loads were included in the model as “natural-gas-only loads.” Another assumption is that the heating and cooling loads developed for this model accurately reflect the heating and cooling loads of the buildings being modeled. In other words, the DOE-2 model accurately estimated the heating and cooling loads and the specific portions of that load that are able to be met with CHP were able to be selected.
• The manufacturer performance specifications are assumed to be correct and the price estimates
from the manufacturer are assumed to be representative for the area and time period studied. Capital costs in $/kW are assumed to be turnkey costs, that is the total cost of system design and the purchase and installation costs.
• Heat flow is modeled using kW (power) on an hourly basis. Heat is all the same quality, it
flows where it is directed to and it is delivered with efficiency of parameter γ to loads, where γ is equal to 0.8 for CHP served heating loads and 0.11 for absorption chiller served cooling loads. The temperatures, flow rates, and pressures of the heat transfer mediums are ignored. The specific type and capacity of the thermal end-use, temperatures, flow rates, distances, pressures, efficiency curves, become important in a specific application but were not included in this model. For example, the inlet temperatures of the hot water (cooling loop) or the chilled water (absorption cooling) are assumed to be ideal.
• The DER equipment is able to maintain a load-following capability. That is, electric loads are
met with DER output and heating and cooling needs are able to be met with a combination of CHP output (which is also based on electricity production) and assistance from the supplementary heating and cooling systems.
• Ancillary loads of absorption chillers are ignored. This is a reasonable assumption since for a
standard absorption cooling system there are only two water pumps. Pumping a liquid requires substantially less energy than a compressor cooling system.
• There is no storage in the building of thermal heat, the constraints to meet heating and cooling
load with production has to be met for each hour of the day. In other words, the building does not have thermal mass and cannot “inventory” heat from one hour to the next. However, heating and cooling loads can be reduced during off peak hours to reflect the reduced demand for energy at those times.
• A number of parameter assumptions were used in the model. The sensitivity analysis in Section
2.7, discusses how sensitive the model is to some of these parameters with respect to energy efficiency. Residual heat is converted to useful heat at an efficiency of 0.8. Purchased natural gas is converted to useful heat at an efficiency of 0.85. Absorption chillers are estimated to reduce electrical cooling load with an efficiency of 20% due to the approximation that an

Distributed Energy Resources in Practice
28
electric, compressor driven air-conditioning systems has a COP of 5.0 verses a COP of 0.7 for absorption chillers. Hence, it takes five times more thermal energy input for an absorption chiller to produce the same amount of cooling as an electric compressor driven chiller. An estimated cost function for these technology combinations produced the cost of various combinations of DG, CHP, and absorption chiller technologies. The technology lifetimes are considered to be 12.5 years for most technologies except the photovoltaic panels, which are assumed to last for 20 years. Discounting cash flows to the present value is done at a nominal interest rate of 0.075 unless the specific interest rate used in financial calculations at a particular site was known.
• Diesel limitations were assumed to be 100 hours in all cases. In reality, the regulations vary
between environmental conservation divisions and even within utility service territories. There may be diesel restrictions for hours of operation for maintenance purposes, for emergency backup power and for backup power during stage 1, 2, or 3 alerts in addition to restrictions for use as supplemental power. The hours may also vary by technology type. For example, if a diesel engine demonstrates it passes emissions tests then it may be allowed to operate in certain regions.
2.9 Including Rebates and Grants for DER Technologies in Model
This section describes some of the rebates and grants for which DER systems are eligible. Projects that receive money automatically after meeting specific criteria are referred to as rebates. Grants here refer to financial awards that must be applied for after meeting appropriate criteria. The rebate and grant money received by a site was typically considered in DER-CAM to be a reduction in the capital cost of the eligible technologies for test sites that had applied for and received them. If the subsidy had not yet been received, but the site indicated that they met the criteria, they were considered eligible for the grants or rebates in this analysis. Under the Federal Energy Regulatory Committee (FERC) regulations individual states determine incentives for QFs in their state, which may include rebates on DER project costs and/or energy tariff reductions. Determining which incentives were available to each site proved difficult. Some of the organizations contacted include the FERC, the New York State Public Service Commission (NY PSC), Long Island Power Authority (LIPA), KeySpan, California Energy Commission (CEC), California Public Utilities Commission (CPUC), Pacific Gas and Electric (PG&E), Southern California Edison (SCE), San Diego Gas and Electric (SDG&E), and other energy consultants. 2.9.1 CPUC Self-generation Incentive Program10, 11:
As part of California Assembly Bill 970, CPUC approved a statewide self-generation incentive program in September 2000. The self-generation program provides financial incentives to customers that install new, qualifying self-generation equipment to provide all or a portion of their electrical needs. Funding is provided for self-generation up to 1 MW. The program is administered
10 CPUC Self-Generation Incentive Program July-December 2001 Status Report, http://www.cpuc.ca.gov/published/report/13690.htm 11 San Diego Regional Energy Office, San Diego SELFGEN Program Frequently Asked Questions, http://www.sdenergy.org/docs/SELFGEN_FAQs.pdf

Distributed Energy Resources in Practice
29
by Pacific Gas and Electric (PG&E), Southern California Edison (SCE), Southern California Gas Company (SoCalGas) and the San Diego Regional Energy Office (SDREO, serving SDG&E customers), and provides $125 million annually statewide. Table 15: Technologies Eligible for CPUC Self-Generation Rebates12
Incentive Category
Incentive Offered
Maximum % of
Project Cost
Minimum System Size
Maximum System Size*
Eligible Technologies
Level 1 $4500 / kW 50% 30 kW 1.5 MW Photovoltaics, fuel cells operating on renewable fuel, and wind turbines
Level 2 $2500 / kW 40% None 1.5 MW Fuel Cells operating on non-renewable fuel and utilizing sufficient waste heat recovery
Level 3 $1000 / kW 30% None 1.5 MW
Microturbines, small gas turbines, internal combustion engines, using sufficient waste heat recovery and meeting reliability criteria
* Maximum system size 1.5 MW, but rebate funding only available up to a 1 MW cap For purposes of the program, self-generation refers to “clean distributed generation technologies,” such as microturbines, fuel cells, photovoltaic, small gas turbines, wind turbines, and internal combustion engines, that meet the following criteria: • At least 5% of the power system’s total energy output is in the form of useful thermal energy. • Where useful thermal energy results from power production, the useful annual electrical output
plus one-half the annual useful thermal energy output equals not less than 42.5% of any natural gas and oil energy input.
• In the case of microturbines, small gas turbines, and internal combustion engines, the following power quality and reliability requirements must be met:
The self-generating facility must be designed to operate in power factor mode
such that the generator operates between 0.95 power factor loading and 0.90 power factor leading.
Sites with greater than 200 kW generating capability must coordinate maintenance schedules with the local utility, and in general can only schedule maintenance from October to March, and if necessary only during off peak or weekend hours between April and September.
12 San Diego Regional Energy Office, San Diego SELFGEN Program Frequently Asked Questions, http://www.sdenergy.org/docs/SELFGEN_FAQs.pdf

Distributed Energy Resources in Practice
30
The funding from this program is available as a secondary source after other sources have been fully tapped. The CPUC funding limits are decreased by the amount of alternate funding. In other words, the limits set out by the CPUC represent a cap to funding available to qualifying sites in California. It is assumed, therefore, that the test sites located in California that indicated they are applying for or have received CPUC self-generation funding are qualifying facilities, and will receive funding up to the limits set by the CPUC in this program. 2.9.2 New York State Funding for Energy Efficiency and DER
In New York State the Public Service Commission (PSC) has implemented a systems benefits charge (SBC) on electric rates for the purposes of increasing energy efficiency and providing public goods programs. The program has been expanded to include transmission and distribution issues due to increasing difficulties of providing energy services in “load pockets.”13 The money collected from the SBC is distributed to New York State Energy Research and Development Authority (NYSERDA) 75%, and the remainder to the electric utilities for their own programs. NYSERDA’s programs are called “Energy$mart” and include low interest loans, and targeted energy efficiency programs for schools, agriculture, homes, communities, and pollution control and monitoring for air water and solid waste emissions. In the area of DER and CHP, NYSERDA offers funding for projects that demonstrate the use of DER technologies in industrial, commercial, municipal, and institutional organizations. NYSERDA’s DER programs provide approximately $12 million annually statewide for 2002 through 2006.14 Table 16: NYSERDA DER Program Funding
Funding Allocation 2001 2002-2006 Total Distributed Generation Combined Heat and Power
$8,637,233 $58,445,839 $67,083,072
2.9.3 DOD and CERL Climate Change Fuel Cell program
The DOD’s Climate Change Fuel Cell program was initiated in 1995 and provides up to $1,000/kW for fuel cell installations with a capacity of at least 3 kW.15 The fund is administered through the US Army Corps of Engineers Construction Engineering Research Lab (CERL). The funding level for fiscal year 2002 is expected to be $3 million.
13 John McLaughlin, Public Service Commission, personal communication, October 2002. 14 NYSERDA, System Benefits Charge: Revised Operating Plan for New York Energy $mart Programs 2002-2006, June 12, 2002. http://www.dps.state.ny.us/sbc.htm 15 Department of Defense (DOD) and Construction Engineering Research Lab (CERL) website September 2002. http://www.dodfuelcell.com/climate/

Distributed Energy Resources in Practice
31
3. The Test Cases
3.1 Summary of the Test Cases
The values in Table 17 are derived from costs and savings as estimated by the test site energy developer. These values are with respect to the overall cost of the DER project not the financial arrangement actually used at each site. That is, these values may be different from the costs and benefits of the project from the perspective of the site’s owner due to contract agreements (e.g. shared savings or loans) with the energy developer. Estimated values below were not available from the site but derived using DER-CAM data. The payback period from DER-CAM was calculated by dividing the project cost (provided by the site or, if not available, estimated from DER-CAM) by the annual benefit without capital cost. Table 17: Summary of Project Costs and Benefits at Test Sites
Source of Financial Estimates
Project Cost Grants Received
Annual Benefit (without capital cost)
Net Present Value (NPV) (including grants)
Payback (including grants)
A&P $145,000 $95,000 $8,312 $51,826 6 years A&P DER-CAM
$145,000 $95,000 $11,777 $94,274 4.2 years
GSB $4,353,375 $2,100,000 NA NA NA GSB DER-CAM
$4,353,375 $2,100,000 $218,495 $(518,466) 10.3 years
The Orchid NA $0 $700,000 $2,917,754 estimate
3.8 years
The Orchid DER-CAM
$2,636,109 $0 $732,124 $3,091,430 3.7 years
BD Biosciences Pharmingen
Confidential $112,500 $103,085 $530,000 estimate
2.5 years
BD Biosciences Pharmingen DER-CAM
Confidential $112,500 $96,888 $506,218 2.7 years
USPS DG only
$480,000 $0 $75,000 $115,057 6.4 years
USPS DG only DER-CAM
$480,000 $0 $217,544 $1,246,014 2.2 years
USPS Absorption Cooling
$680,000 $0 ($204,000 potential)
$159,000 $581,520 4.3 years

Distributed Energy Resources in Practice
32
Source of Financial Estimates
Project Cost Grants Received
Annual Benefit (without capital cost)
Net Present Value (NPV) (including grants)
Payback (including grants)
USPS Abs. DER-CAM
$680,000 $0 ($204,000 potential)
$303,695 $1,729,543 2.2 years
NA = not available Estimated values are derived from DER-CAM data rather than information provided directly from site.

Distributed Energy Resources in Practice
33
3.2 Case A: A&P Waldbaum’s Supermarket, Hauppauge, NY
This newly opened supermarket in the Long Island town of Hauppauge has installed a 60 kW Capstone Microturbine, a Unifin Microgen heat recovery unit, a Munters HVAC unit, and desiccant dehumidification. The 5,300 m2 (57,000 ft2) supermarket is a typical full-sized grocery store, opened in July 2002. The Waldbaum’s store is owned by A&P Supermarkets (also known as The Great Atlantic & Pacific Tea Company, founded in 1959). A&P has approximately 760 stores in the Northeast, Atlantic, and Midwest regions of the United States and Ontario Canada. CDH Energy from Cazenovia New York provided the development and engineering services for the DER system. The sponsors of the project include NYSERDA, KeySpan Gas R&D, Oak Ridge National Laboratory, and National Renewable Energy Laboratory. Other organizations involved include National Accounts Energy Alliance (NAEA), Exergy Partners, AGA, and GTI. CDH Energy is the only organization to conduct an engineering or economic analysis to date for this site.
Figure 12: A&P Waldbaum’s Supermarket, Long Island, NY
This site was chosen for multiple reasons. First, it is situated on Long Island, which is an area that is experiencing a rapid increase in transmission system congestion from demand exceeding both local supply and import transmission capacity. Long Island, the most heavily congested electricity area of New York State, set a monthly record for electricity consumption in July 2002 by consuming more than 2.5 TWh of electricity, a 21% increase over July 2001.16 Increasing residential development, a decrease in electricity rates relative to nearby locations, and problems obtaining additional transmission import capacity and siting new power plants have exacerbated the power problems in the area.17 One way of measuring transmission system congestion is by the level of positive congestion charge. Positive congestion charges result when demand on Long Island results in generation being taken out of economic order (i.e. cheaper generation cannot be used to satisfy load because of physical transmission constraints). Prices on Long Island experience an increase relative to the Reference 16 New York Times, Power Official Cites Long Island Needs, August 9, 2002. 17 New York Times, L.I. Power Official Warns of Dire Need for New Plants, August 9, 2002.
Distributed Energy Resources in Practice
34
Bus price (the calculated price of electricity in the state if there were no congestion) and the difference is considered a positive congestion charge.18 In 2001 Long Island had positive congestion charges in the Day Ahead market 62% of the time and positive congestion charges in the Real Time market 81% of the time. In 2002 Long Island had positive congestion charges in the Day Ahead market 82% of the time and positive congestion charges 78% of the time in the Real Time market.19 The second reason for selecting this site is that the grocery store has thermal requirements that can utilize CHP all year round. In the summer, there is dehumidification of the incoming air to reduce energy consumption of the electric air conditioning units and to control ambient humidity. In the winter, there are substantial heating loads. A third reason for selecting this site is the high degree of replication of a DER system, along with knowledge of the design, implementation, and technologies, at other grocery stores. The energy requirements of this site are typical of grocery stores of this size. There are over 1000 grocery stores in New York State presenting a large market for DER systems with CHP and desiccant dehumidification capabilities. Nationwide, about 1000 grocery stores have installed a desiccant dehumidification system. This project is attractive to A&P, NAEA, and the other sponsors because an economic application of DER would be highly replicable both in New York State and nationally. Fourth, this site represents a highly competitive, low-margin business with a high level of attention to minimizing costs and increasing efficiency in all areas. This competitiveness is reassuring to other businesses considering DER systems for their operations that are dependent upon minimizing costs and maintaining a high level of energy services and power quality. Fifth, this site was selected based on the interesting technologies installed: a Capstone 60 kW turbine, a Microgen heat recovery unit, and a Munters HVAC unit. The Munters HVAC unit provides heating, cooling, and dehumidification. This type of business is a viable application for DER systems because of the electric, cooling, and thermal loads involved. Supermarkets also serve as applicable sites for absorption chillers to serve both cooling and refrigeration loads. Lastly, the engineers and developers at the site were willing to share with us their design analysis and answer questions about the DER system. They were confident enough in their work to allow an independent team to review it and revisit the decision analysis with a separate model. Granted, this level of confidence may have resulted from their selecting the technology prior to performing an economic analysis, rendering their decision immune to subsequent economic analyses that might suggest other technologies to be more economical.
18 Emily Bartholomew, LBNL, personal communication, October 2002. 19 New York Independent System Operator (NYISO) Open Access Same Time Information System (OASIS) web site September 2002.

Distributed Energy Resources in Practice
35
3.2.1 The Decision-Making Process
The decision to install a DER system at the A&P Waldbaum’s supermarket was the result of partnership between several energy research organizations. The National Accounts Energy Alliance (NAEA) is a consortium of the American Gas Foundation, the US DOE, the American Gas Association, natural gas utilities, the Gas Technology Institute and national chains of retailers, restaurants, grocery stores, hospitality, and healthcare facilities. The partnership offers assistance to energy managers who offer to use their facilities as test sites for DER systems. The NAEA seeks to install DER systems in energy-intensive business sites with the potential for national replication. The sectors the NAEA focuses on are supermarkets, restaurants, retail stores, health care facilities, hotels, and hospitals. The NAEA is working to install DER technologies in numerous sites through contacts with regional partner organizations. In addition to the A&P grocery store site, the NAEA is sponsoring DER projects in different regions of the country including one at a HEB supermarket in south Texas. Walter Woods is the managing director of commercial markets at NAEA and helped to coordinate conferences and interactions between national account customers (the retail stores) interested in implementing DER projects and partnership organizations interested in sponsoring DER projects. Steve DePalo was the person responsible for enlisting the A&P site into the program. KeySpan and NAEA saw A&P as an attractive site due to the potential for replication, and the variety of heating, cooling, and dehumidification loads at the site. To attract A&P to participate in the project the NAEA was able to offer a number of incentives. These incentives included grants for the project from a number of sponsors including New York State Energy Research and Development Authority (NYSERDA), KeySpan, and the National Renewable Energy Laboratory (NREL) and Oak Ridge National Laboratory (ORNL). Besides funding for a DER project, NAEA also offered a central organization for disseminating information about DER systems in grocery stores and the knowledge obtained from other system installations. In particular, the NAEA sought to share knowledge of system integration technologies and designs with A&P to reduce the installation costs. However, since the partnership is new the site is also adding to the knowledge base of the organizations involved. The decision to install the DER system still came too late to be integrated effectively into the site design process. If the DER system had been integrated into the architectural and engineering design of the store from the start it might have reduced the installation costs by two thirds saving several thousand dollars according to Hugh Henderson, principal at CDH Energy. Installing a DER system after the store was designed and built added duplication of effort to many tasks, such as electrical and HVAC system design, and increased the overall expense.

Distributed Energy Resources in Practice
36
3.2.1.1 Economic Analysis
The engineering analysis performed by CDH Energy estimated the benefits and costs to A&P Waldbaum’s. Assumptions as listed in Table 18 were made in the engineering analysis done by CDH Energy: Table 18: CDH Energy Assumptions for Engineering Analysis at A&P Waldbaum’s
Maintenance 0.013 $/kWh NYSERDA Payback 0.01 $/kWh Displaced natural gas loads 0.027 $/kWh Turbine natural gas input 0.026 $/kWh Electricity cost 0.11 $/kW Net turbine output 56 kW Natural gas input (per hour) 215 kW thermalPercent annual operating time 90% These values can be used to estimate the amount of electricity generated, and the quantity and cost of natural gas used by the microturbine over a year. The system is expected to produce 441,504 kWh of electricity and consume 1700 kWh of natural gas with the total cost of this gas consumption being $43,467. These are based on the assumptions that the turbine is operating 90% of the time producing 56 kW of power and has a natural gas input requirement of 215 kW with gas costing $0.026 per kWh. Table 19: CDH Energy Annual Savings (Costs) at A&P Waldbaum’s
Savings (Costs) $/year
Gas Costs $ (43,467) Maintenance Costs $ (5,740) NYSERDA Payment $(4,415) Electric Savings $ 48,565 Heat Recovery Savings $ 13,368 Net Savings $ 8,312 The grants that were provided for this project heavily influenced the decision and the financial benefit for A&P Waldbaum’s. The grants were covered much of the equipment cost and the engineering installation costs so this project was described as a “gift to A&P.”20 The A&P project team provided $95,000 in grants and another $45,000 loan. Some of NYSERDA’s funding was in the form of a load that is paid back at the rate of one cent per kWh generated, or $4,415 per year. The total installation costs for design, installation, and equipment is $145,000. Money originally budgeted for maintenance during the first six years was used for extra costs associated with the installation. As a result, A&P will cover the maintenance costs, which total approximately $35,000 for six years of maintenance and estimated to be $5,740 per year. 20 Hugh Henderson, personal communication, June 2002.

Distributed Energy Resources in Practice
37
The major project expenditures are summarized in Table 20 below.21
Table 20: Major Project Expenditures at A&P Waldbaum’s
Item Cost and Funding Organization Capstone & Heat Recovery unit Engineering and Installation Munters Coils
$ 95,000 paid to A&P by project team plus a $ 45,000 loan
Maintenance Costs $ 35,000 for first 6 years, paid by A&P $5,740 per year in remaining years
NYSERDA Loan Payment $4,415 per year for 10 years ($0.01/kWh) The net present value (NPV) of the project (ten years at 3%), as estimated by data from CDH Energy, is $52,000. This value is based on A&P’s paying $5000 up front for a control system, gas costs of $43,467 per year, $5,740 per year maintenance costs, $48,565 electric savings, $13,368 heat recovery savings, and $4,415 annual payment to NYSERDA. The net benefit was then $8,312 per year without capital costs and $4,400 including capital costs. The resulting payback for the system, without grants, is roughly 17 years given an installation cost of $145,000 for the technology, design, and installation and an annual benefit is estimated to be $4,400 per year. The payback period is six years with the grants included. Table 21 presents the financial costs, NPV, and Payback as estimated by data from the site and as a result of the DER-CAM analysis. The project benefits are without capital costs payments. That is, the benefits resulting from the reduction in annual energy system costs, including operation and maintenance costs. This is equivalent to considering that the project cost was paid up front and therefore does not include loan payments on the capital cost of the DER equipment and installation. Table 21: Net Present Value and Payback Analysis for A&P Waldbaum’s
Site DER Project Cost ($)
DER Project Annual Benefits ($/year)
Net Present Value and Payback of project including grants received
A&P $145,000 $8,312
$52,000 6 years
A&P DER-CAM $145,000 $11,777 $94,000 4 years
21 CDH Energy, Costs and Savings for A&P, July 2002.

Distributed Energy Resources in Practice
38
3.2.1.2 Engineering Analysis
The Capstone microturbine system considered for this site has a 60 kW capacity. A typical grocery store of this size has a demand of about 500 kW. As a result, the microturbine will either be running at full capacity or off, hence selling electricity back to the utility was not considered. Electricity-only loads that peak around 300 kW throughout the year characterize this site. The site’s electric and thermal loads are presented in Appendix K. The cooling load requirements rise to 120 kW in the summer and are between 5 kW to 60 kW the rest of the year. This is due to all the refrigeration and freezer space in the store that provides space cooling when the doors are opened. The condensers for these refrigerators are located on the roof, hence they provide air conditioning to the interior space. In the winter (December through February) between about 6 am and 10 am the space heating loads vary between 300 kW and 800 kW, drop down below 100 kW during the day, and then rise to about half of their morning peak during an hour at night. The rest of the time there is negligible space heating loads. Water heating and natural-gas-only loads are also negligible. The DER engineering analysis performed by CDH Energy focused on the thermal loads and the technologies needed to make use of the residual heat from the microturbine to meet heating and dehumidification loads. CDH Energy helped A&P decide between two DER system designs given the installation of a Capstone 60 kW microturbine. These system designs concern the use of the residual heat from the microturbine for either space heating or dehumidification. The two alternative designs were: 1. Direct exhaust heat to a Unifin MicroGen heat recovery unit—Effective for space heating but
less effective for dehumidification. 2. Direct exhaust heat to a Munters HVAC system regeneration coil (for desiccant
dehumidification)—Effective for dehumidification but less effective for space heating. These options are described schematically by Figure 13.

Distributed Energy Resources in Practice
39
Figure 13: Schematic of Heat Recovery Options for A&P (Source: CDH Energy)22
In option #1, the Unifin MicroGen device converts the exhaust gas from the microturbine into hot water. This hot water can then be used for space heating or be heated to a higher temperature to use for dehumidification. In option #2, the exhaust gas is used directly in the Munters HVAC unit to provide desiccant dehumidification and space heating with the addition of regeneration and space heating coils to the Munters unit. (The Munters HVAC system would be installed with space cooling capabilities regardless of the DER system.) Specifically it provides 350 kW per hour of heating, 210 kW (60 tons) of cooling, and 120 kg per hour (263 lbs/h) dehumidification. The Munters unit can provide either heating, or simultaneous cooling and dehumidification. Manufactures’ performance specifications for the Capstone Turbine, Unifin HX heat exchanger, and Munters HVAC unit with 22 CDH Energy, Supermarket Load Analysis, July 2002.

Distributed Energy Resources in Practice
40
regeneration and space heating coils were used by CDH Energy to complete an energy and economic analysis of the performance of each system.
Figure 14: Roof-mounted DER Equipment (Microturbine and Heat Exchanger)
Desiccant dehumidification works well in supermarkets because the lower humidity improves the energy efficiency and lowers operating cost of the refrigeration equipment in the store. A desiccant system can also reduce refrigerator fogging, freezer frost build up, and improve comfort in a potentially muggy area such as Long Island in the summer. In addition, dehumidification allows customers to be comfortable at higher temperatures.23 The natural gas consumption and cost are shown for the three options of base case (that is, no installation in DER), purchasing a Unifin heat exchanger for the microturbine’s residual heat, and using the microturbine’s residual heat directly in the Munters HVAC and desiccant system. Space heating is about 2/3 of total annual gas costs and the desiccant unit is the remaining 1/3. The table shows that the estimated savings are over $13,000 per year, mostly due to space heating energy use reductions from CHP heat use. With the Unifin system the exhaust heat exits at 82 °C (180 °F) and it must be reheated, by burning natural gas, to 120 °C (250 °F) for dehumidification use. The performance of two alternative CHP systems as estimated by CDH Energy prior to the installation of the DER system:
23 Munters, www.muntersamerica.com

Distributed Energy Resources in Practice
41
Table 22: Estimated Thermal Energy Use at A&P for Alternative CHP Systems
Space Heating Dehumidification Total Space
heating demand (kWh thermal annual)
Cost per year
Dehumidification demand (kWh thermal annual)
Cost per year
Total demand (kWh thermal annual natural gas demand)
Cost per year
Base case (without DER)
466,550 $12,738 196,700 $5,370 663,240 $18,108
Unifin heat exchanger
72,200 $1,971 101,400 $2,769 173,632 $4,740
Direct exhaust to Munters unit
157,100 $4,290 0 $0 157,100 $4,290
Source: CDH Energy, Cazenovia, NY, Supermarket Load Analysis, July 2002. In the direct exhaust case the turbine exhaust is used directly in the Munters unit for heating and desiccant dehumidification. The residual heat exits the microturbine at 272 °C (522 °F) and enters the Munters unit at 120 °C (250 °F) for dehumidification and 82 °C (180 °F) for space heating. As Table 22 shows the direct exhaust method eliminates all supplemental gas use for desiccant dehumidification. However, since the direct exhaust method is less effective at space heating than the Unifin heat exchanger, gas use for space heating increases compared to the Unifin system. The direct exhaust case, using the Munters technology, would reduce the space heating load by 66% and the entire dehumidification load. The Unifin system would reduce the space-heating load by about 85% but the dehumidification load would be reduced by only 50%. The two options end up with approximately the same annual cost for natural gas. The Unifin heat exchanger system adds about $25,000 to the capital cost of the project while the additional cost of the Munters coils (to use the residual heat in an existing Munters unit) would be about $6,500. One drawback to the direct exhaust method is that using the Munters unit for heating may create dry air in the wintertime (since it is using the desiccant wheel for heating). A decision was made to install the Unifin heat exchanger system and install the Munters regeneration and heating coils to evaluate its performance while obtaining data on the residual heat temperature and flow rates. 3.2.1.3 Utility Relationship
The Long Island Power Authority (LIPA) provides electricity to Long Island. LIPA is a corporate municipal instrument of the State of New York. LIPA functions as a corporation except that the governor appoints the chairman and the board of directors. It was created by state legislation in 1986 to resolve the problems with the cancelled Shoreham Nuclear Power Plant and attempt to lower electricity rates that were some of the highest in the country.

Distributed Energy Resources in Practice
42
Long Island is also a “load pocket” with constrained transmission into the area from other parts of New York. This constraint makes distributed energy resources more valuable by reducing the dependency on the transmission and distribution network. KeySpan Energy provides natural gas in the area. KeySpan is a gas marketing company that is actively promoting the research and development of distributed energy resources in the New York City region through sponsoring the design and installation of DER systems. 3.2.1.4 Decision Making Software Tools, etc.
CDH Energy systems performed the initial energy analysis and the engineering design of the DER system. Their analysis tools consisted of spreadsheets and typical year hourly weather data. Assumptions were made about the heating energy use in the store at peak heating demand (coldest outdoor temperature) and the temperature of the balance point (that is, the outdoor temperature for which no energy for heating or cooling the building is needed). A linear relationship was used to estimate the energy use between these two conditions. The same estimation procedure was used to compute the dehumidification loads at the peak and at the balance point (no dehumidification needed). 3.2.2 Description of the Data Collection Process
Since this is a new grocery store there were no historic electric and thermal loads to use for DER system sizing and design. The electric loads for the new store were estimated by CDH Energy based on the technologies being installed in the store for lighting, cooling, refrigeration and freezers, and miscellaneous loads. The heating and dehumidification load estimates were based on experience with other supermarkets. These load estimates were provided by CDH Energy, along with their estimates for the savings due to installing either the Unifin heat exchanger or the Munters regeneration and heating coils. This energy data are presented in Table 22. The peak power demand was estimated to be approximately 500 kW for the store. Since historic electrical data and thermal loads were not available for analysis, DOE-2 was used to generate loads in the four categories typically used in DER-CAM: electric-only, space cooling, space heating, water heating, and natural-gas-only loads. Each of these loads was then divided into weekday and weekend loads. Average loads for each hour, month, day type, and each load were calculated to create a load curve. It is assumed that these average loads represent the actual loads in the site or loads that the designers were considering when sizing the DER system. The DOE-2 heating loads were scaled up by a factor of 7.5 in order to have them compare to the estimates of total natural gas burned each year at A&P for space heating. It is unclear why the DOE-2 model is off so far from the estimates made by CDH Energy. One potential reason is that DOE-2 did not take into account the presence of refrigeration and freezers within the store that, in effect, provide between 180 to 350 kW (50 to 100 tons) of cooling to the store all year. It would lead to greater heating loads and lower cooling loads than output from DOE-2. DOE-2 did have low heating loads but the accuracy of the cooling loads is unknown.

Distributed Energy Resources in Practice
43
The water heating loads were scaled up by a factor of 22 to use water heating loads as a proxy for desiccant dehumidification loads. This is necessary because DOE-2 does not consider the presence of a desiccant dehumidification unit when calculating energy consumption. The total of space heating and water heating then equaled the estimated total annual gas consumption for the building. The loads for the grocery store were developed in DOE-2 for each hour of the year. DER-CAM was used with average hourly loads for each month, weekday and weekend. Average loads will result in lower demand charges than actual loads since the peak demands will be reduced to the average. To compensate for this effect the demand charges were increased by 14% in summer and 25% in winter. The basis for these increases is described below. An analysis of the DOE-2 output examined the peak kW for electric-only loads and cooling loads for each hour per month, for each day type, and compared it to the maximum average electric-only load and maximum average cooling load per month. (An average monthly load is generated by averaging, for each hour, over all the days in the month for that hour. The maximum average is the highest of all these values for a month.) These two values were then added to obtain the peak total electric load and the maximum average electric load peak. This assumes that the two loads are coincident and peak at the same time. From inspection of the DOE-2 load profiles this seems an accurate assumption, both loads peak at about 15:00 to 16:00 hours for a grocery store with New York City weather. A comparison of DOE-2 peak hourly loads and the maximum average load per month and day type is presented in Table 23. The average percent difference between DOE-2 peak cooling load and the average cooling load peak is 20% for weekdays and weekends. Hence the base case annual energy cost prediction will be low if demand tariff rates are not adjusted. The average cooling load values are used by DER-CAM to compute the cost of demand charges. The season in which these differences occur is also important in estimating the demand charge calculation error since there are different tariff demand charges in summer and winter months. As expected, the cooling loads tend to be more volatile, and hence deviate more from the average than the electric-only loads. Cooling loads, however, are generally less than the electric-only loads and contribute proportionally less to the difference between hourly peak and maximum average loads, moderating their effect. To include these characteristics in DER-CAM the summer month demand charges were increase by 14% (the average summer percent difference) and the winter month demand charges were increased by 25% (the winter average percent difference).

Distributed Energy Resources in Practice
44
Table 23: DOE-2 Peak Verses Maximum Average for A&P Waldbaum’s
The capital costs for microturbine units in the model were provided by Capstone and reflect typical turnkey costs. The microturbine capital and operating costs, along with the heat rate, are presented in Table 24. MTL stands for microturbine with low pressure gas and MTH is a high pressure microturbine. The price of the CHP unit was adjusted from $1,675/kW to $2,358/kW to reflect the actual site costs at A&P. This actual capital cost includes a Munters HVAC unit in the total price. The cost of the Munters coils was $6,500. Table 24: Capstone Microturbine Capital and Operating Costs
Capital Cost
($/kW) OM Fixed
($/kW) OM Variable
($/kWh) Heat Rate (kJ/kWh)
MTL-C-30 1862 0 0.015 14,400 MTH-C-30 1862 0 0.015 13,800 MT-C-60 1290 0 0.015 12,900 MTL-C-30 with CHP 2546 0 0.015 14,400 MTH-C-30 with CHP 2546 0 0.015 13,800 MT-C-60 with CHP 2358 0 0.013 12,900 MTL-C-30 with absorption chiller
3351.6 0 0.015 14,400
MTH-C-30 absorption 3351.6 0 0.015 13,800 MT-C-60 absorption 2322 0 0.015 12,900 MTL-C-30 CHP and abs. 5897.6 0 0.015 14,400 MTH-C-30 CHP and abs. 5897.6 0 0.015 13,800 MT-C-60 CHP and abs. 3997 0 0.015 12,900
Month (weekdays) DOE-2 Peak Hourly Total Electric Load (kW)
Maximum Average Total Electric Load (kW)
Percent Difference (kW)
January 220 220 0% February 220 220 0% March 372 235 37% April 417 259 38% May 511 377 26% June 545 468 14% July 580 504 14% August 540 485 10% September 536 441 18% October 430 331 23% November 350 225 36% December 367 226 39%

Distributed Energy Resources in Practice
45
CDH Energy is now collecting extensive data on the system performance and intends to make these data publicly available through NYSERDA. There are multiple meters installed to help understand the energy uses within the system. Incorporation of grants was done in two stages. First the grants were applied to the installed technology, but this made the technology free (a cost of $1 was used to avoid problems with a zero) and caused the model to purchase seven Capstone 60 kW CHP units, distorting the true representation of the grant. Changes were made to the model code to allow for one rebated purchase of the technology and additional units at full price. This is not a perfect representation of costs since the Unifin CHP system would already be installed leading to a cost reduction for additional units. Furthermore, much of the engineering and installation costs have a fixed component that would be split among additional generating units of capacity (put another way, these costs would be paid for by the installation of the first unit, leading to cost reductions for the second unit). This is a common problem with DER-CAM’s modeling of CHP equipment. Ideally, a nonlinear cost function would be used for multiple units of a DER system with additional technologies such as CHP equipment. This issue is discussed in Section 8 on improvements to DER-CAM. It was learned later that some of the grant money was actually a loan to be paid back at $4,415 per year for 10 years. This should have been counted as a project cost and not a loan. Due to the other grants for this project it probably would not affect technology adoption decisions for any of the scenarios. It would simply increase the DER annual operating cost (the objective function of each of the model runs) by approximately $4,415. In addition to the previously mentioned changes made to DER-CAM the following parameters were changed based on the financial and engineering analysis done by CDH Energy and the LIPA tariff structure. These changes, along with the DER-CAM default parameters, are listed in Table 25. Table 25: Parameter Modifications in DER-CAM for A&P Waldbaum’s
A&P parameter DER-CAM default Interest rate nominal annual rate 3 % 7.5 % Standby charge of $/kW $2.46 / kW Site specific (zero if
unknown) Variable maintenance cost ($/kW) $0.013/kW $0.015 / kW 3.2.3 Assumptions of Modeling Process
• Lack of historic load, demand, or cost data prevented the comparison of the results of the base case model run (no investment) to the actual numbers from the supermarket. As a result, the base case costs derived from A&P’s load estimates at time of construction, are assumed to be accurate.

Distributed Energy Resources in Practice
46
• Base-line consumption data are estimated rather than based on actual loads. Estimates from the site were not detailed: thermal load is an annual total energy use and electric load is assumed to be approximately 500 kW peak.
• The desiccant dehumidification load is assumed to have the same shape as the water heating
load profile generated in DOE-2 for a grocery store. These loads tend to plateau during the day, and hence, may provide a reasonable approximation. However, there is not much seasonal variation in hot water loads, and therefore they are similar throughout the year, unlike dehumidification loads. The $6,500 marginal capital cost for the desiccant coils, however, was included in the capital cost for the Capstone units.
• DOE-2 thermal loads (space heating, water heating, and natural gas only) had to be scaled up by
a factor of 7.5 to be roughly equivalent to the annual space heating thermal load estimates provided by CDH Energy. It is not clear why the DOE-2 model is so different than the estimates used by CDH Energy.
• The exact tariff structure for A&P is unknown. A business of this size is likely to be a LIPA
service classification 2L either time-of-use rate or flat rate. It is assumed A&P would select the flat rate given their daytime peaking loads.
• The demand charges were increased by 14% in summer and 25% in winter to compensate for
the use of average load data rather than actual peak demands. • Natural gas prices from KeySpan energy were used for the New York City region rather than
site-specific natural gas prices. • Treatment of grants in the model: The model code was modified to allow the purchase of one
Capstone at subsidized rates but additional units at full price. This model was used for sensitivity analysis. This method, however, does not account for the per unit cost reduction that would result from fixed costs being shared among all units or variable costs that increased less for additional units.
• A loan from NYSERDA for the project was treated as a grant reducing the capital cost of the
project. The $4,415 annual payment from A&P to NYSERDA should have been included as a project cost to be consistent with the treatment of loans at other sites.
3.2.4 Model Results
The results in Figure 15 and Table 26 below are from DER-CAM runs without grants at a 3% nominal interest rate. This is the interest rate used by CDH Energy to evaluate the cost effectiveness of the DER system for A&P and other interested organizations. These results reflect the costs A&P would incur if they paid for the DER system. Scenario 5 and 6 were not needed since in Scenario 4 the model installed the same capacity level as the actual site and electricity was generated from the units in the model, hence, the results for Scenario 5 would be the same as Scenario 4.

Distributed Energy Resources in Practice
47
Figure 15: Scenario Results for A&P Without Grants

Distributed Energy Resources in Practice
48
Table 26: Scenario results for A&P Without Grants
The information presented in Figure 16 and Table 27 are the results of the three scenarios after including the grants received by A&P for the project into the capital cost of the Capstone CHP technology. At the time the grants were considered equal to the project’s cost for A&P so this required some changes to the modeling strategy. The CHP version of the Capstone 60 kW turbine capital cost was changed to $1. At this price the optimal solution installed seven units in Scenario 2 for a total capacity of 420 kW. However, this grant money was for only one Capstone unit and not seven. It is apparent that Scenario 3 results would also provide the same optimal solution as Scenario 2 if further restrictions were not made on the model. For Scenario 3, the model code was modified to allow the purchase of one Capstone at subsidized rates but additional units at full price. This version of the model best replicates site’s situation and was used for sensitivity analysis. Scenario 4A, B, C, and D are the cost without grants of investing in various configurations of the Capstone DER system. The four configurations are with a Capstone 60 kW microturbine, with CHP capability, with absorption cooling capability, and with both CHP and absorption cooling capability.

Distributed Energy Resources in Practice
49
Figure 16: Scenario Results for A&P With Grants
$-
$50,000
$100,000
$150,000
$200,000
$250,000
$300,000
1: No Invest 2: UnlimitedInvest (no
grant)
3: UnlimitedInvest in MT's,
all units atgrant-level
price
3: One 60 kWMT w/ CHPcovered by
grant,additional units
full price
4: Forcedminimum
investment in60 kW MT(gen. only)
4: Forcedminimum
investment in60 kW MT w/
CHP
4: Forcedminimum
investment in60 kW MT w/abs. cooling
4: Forcedminimum
investment in60 kW MT w/CHP and abs.
cooling
4: Forcedminimum
investment in60 kW MT w/CHP (all at
grant-reducedcost)
5: Forcedinvestment in
60 kW MT withCHP
0%
20%
40%
60%
80%
100%
120%
Perc
ent o
f No
Inve
st c
ase
cost
Self generation costsNatural gas purchasesElectricity purchases

Distributed Energy Resources in Practice
50
Table 27: Scenario Results for A&P With Grants
CASETechnologies Selected
Annual energy cost
Percentage of base case cost
Annual savings over base case
Electricity purchases
Natural gas purchases
Self generation costs
1: No Invest 245,468$ $ 220,550 $ 24,918 $ -
2: One 60 kW MT w/CHP covered by grant, additional units full price
60 kW Capstone with CHP 234,767$ 96% $ 10,701 195,042$ 34,927$ $ 4,798
3: Unlimited Invest in MT's, all units at grant-level price
7x 60 kW Capstone microturbine with CHP 226,111$ 92% $ 19,357 $ 134,828 70,572$ $ 20,711
3: One 60 kW MT w/ CHP covered by grant, additional units full price
60 kW Capstone with CHP 234,767$ 96% $ 10,701 195,042$ 34,927$ $ 4,798
4: Forced minimum investment in 60 kW MT (gen. only) 1x 60 kW Capstone 249,783$ 102% $ (4,315) 210,089$ 29,713$ $ 9,981 4: Forced minimum investment in 60 kW MT w/ CHP
1x 60 kW Capstone with CHP 248,501$ 101% $ (3,033) 195,042$ 34,927$ $ 18,532
4: Forced minimum investment in 60 kW MT w/ abs. cooling
1x 60 kW Capstone with abs. cooling 253,709$ 103% $ (8,241) 199,859$ 36,771$ $ 17,079
4: Forced minimum investment in 60 kW MT w/ CHP and abs. cooling
1x 60 kW Capstone with CHP and abs. cooling 256,917$ 105% $ (11,449) 186,824$ 40,688$ $ 29,405
4: Forced minimum investment in 60 kW MT w/ CHP (all at grant-reduced cost)
7x 60 kW Capstone microturbine with CHP 226,111$ 92% $ 19,357 134,828$ 70,572$ $ 20,711
5: Forced investment in 60 kW MT with CHP
60 kW Capstone with CHP 234,767$ 96% $ 10,701 $ 195,042 34,927$ $ 4,798
3.2.5 Discussion of Results
A discussion is presented below of the results for the multiple scenarios run for A&P Waldbaum’s, as well as a discussion of the sensitivity of these results to grants and rebates, the spark spread (gas prices relative to electricity prices), standby charges, and peak pricing vs. flat rates. Dividing the total dollars spent on electricity in Scenario 1 by the number of kWh derives a flat rate for electricity purchased. The flat rate electricity analysis uses this rate for all kWh’s and sets the demand charge and standby charge to zero.

Distributed Energy Resources in Practice
51
The Scenarios: The results are presented without grants (Figure 15) and with grants (Figure 16) to highlight the influence of the grants on the DER investment and the cost of the system. The fact that no investment was recommended in the unlimited investment scenario was a surprising result. A sensitivity analysis, described below, was conducted to determine the influential factors. Comparison of results with and without grants Overall, the results are unusual due to the lack of investment in Scenario 2 without grants, the small size of the DER system capacity, and the extreme influence of the grants that made the cost of purchasing one unit of the DER system essentially free. The results indicate that when the DER system is installed for free the balance of electricity and gas prices leads to economic savings of about $10,000 per year. Without grants • Base Case cost is $245,000 per year (all loads met with utility purchased electricity and gas); • Annual cost of DER system is $3000 more per year than the Base Case; • CHP system is least expensive DER option and adding absorption cooling increases cost; • With grants (one microturbine at no cost, others available at full cost); • Annual cost of DER system is $10,000 less than the Base Case; • Total annual cost is 96% of Base Case cost; • Having unlimited grants (multiple units installed free) results in 7 x 60 kW microturbines;
installed (420 kW) or 84% of peak load capacity and a savings of $20,000 per year. The unlimited grant scenario is unrealistic and done for evaluation purposes. At A&P, the grant money was used to cover the expenses involved with designing and installing a DER system in addition to the technology capital costs and covered nearly 100% of the DER installation expenses. Comparison with Site Analysis Table 28 depicts the differences in some of the model parameters used for A&P’s estimate and those used in DER-CAM. DER-CAM, for example, assumes a technology will be 100% reliable and available and also running at 100% capacity. This is an unrealistic, but simplifying assumption. As one electrician stated, “You never want to run any electrical component at its full capacity all the time.”24 The maximum capacity will also decline with increasing temperature. CDH Energy assumed that the microturbine would produce 56 kW during operation. The Capstone 60 kW microturbine is also assumed to have a more efficient heat rate in DER-CAM, per the Capstone specifications, than was assumed at A&P. The reason is that Hugh Henderson used higher heating value (HHV) and DER-CAM uses the manufacturer specification that is typically cited in lower
24 Ken McCormic, Electric Motor Shop, personal communication, October 2002.

Distributed Energy Resources in Practice
52
heating value (LHV). Higher heating value was used because that is what the customer is paying for.25 This will provide about an apparent 10% increase in efficiency (7.4% in this case) over actual operation. This difference, and the use of LHV in DER-CAM, may have influenced all the case study results. Even given these performance enhancements, however, the microturbine only produced 44% of its maximum potential energy output. Given that the electric load on site is always much larger than 60 kW the model must have determined it is not economical to run the microturbine during some times of the day or periods of the year. Table 28: Comparison of A&P Assumptions and Annual Cost Estimates With DER-CAM
A&P DER-CAM Scenario 3 Grant for one unit
Parameter constants Capacity 56 kW 60 kW Heat rate kJ/kWh 13,850 12,900 Cost of electricity ($/kWh) 0.11 0.10 Availability 90% 100 % Computed results KWh produced (annual) 441,504 232,367 Potential kWh capacity 441,504 525,600 Percent of max kWh potential produced
100 % 44%
Gas Costs (annual) $ (43,467) $ (24,076) Maintenance Costs (annual) $ (5,740) $ (600) NYSERDA loan payment $(4,415) $ 0 Electric Savings (annual) $ 48,565 $ 25,508 Heat Recovery Savings (annual) $ 13,368 $ 10,508
389,201 kWh Net Savings (annual) $ 8,312 $ 11,777 The result from Table 28 shows that the microturbine is operated at 44% of its potential. This is probably due to the economic considerations above, and that seasonal prices and available thermal loads influence the operating of the microturbines. A comparison of the results between the Base Case and Scenario 3 with seven installed units (that is, unlimited and free microturbines) indicates the model found it favorable to use the microturbines during the peak hours and but not often during the mid-peak and off-peak hours. (Although A&P is modeled as a flat-rate tariff structure the day is still segmented into different periods.) The off-peak electricity purchases indicate that electricity purchases were still 87% of the level of the base case. The mid-peak electricity purchases were 84% of the level of the base case. On-peak electricity 25 Hugh Henderson, personal communication, November 2002.

Distributed Energy Resources in Practice
53
purchases were 12% of the Base Case. In Scenario 3 with seven installed units (unlimited and free microturbines) the total electricity output was 17% of maximum potential kWh electrical output. This indicates that operating the microturbines was often not cost effective given the prevailing prices of electricity and gas in the region. The Sensitivities: The sensitivity analyses for A&P were influenced by the large grant for the one microturbine unit and the lack of investment in other technologies not covered by the grant. As a result, in general, they do not provide much insight in to the effect of influential parameters on the investment level in microturbines. Also, sensitivity analysis was performed on the microturbine system (the site selected technology to be consistent with the other cases), and as a result the sensitivity analysis does not provide much insight into the adoption of natural gas engine DER technologies either. A spark spread sensitivity analysis determined that gas prices would have to drop by 50% of their existing levels (a spark spread rate of seven) before an additional Capstone 60 kW unit with CHP would be installed (along with the one installed for $1). The result of the sensitivity analysis to gas prices is presented graphically in Figure 17 below.
Figure 17: Spark Spread Sensitivity for A&P
Standby charges ranging from $0/kW to $20/kW do not have an effect on DER capacity installed. No additional units are installed with a standby charge of zero, and the one free unit is installed for a range of standby charges up to $20/kW. The sensitivity to standby charges is presented graphically in Figure 18 below. The large gap between the cost of the first and the second unit of microturbines is responsible for this result. Performing standby sensitivities on Scenario 2 instead

Distributed Energy Resources in Practice
54
of Scenario 3 would perhaps result in the selection of natural gas turbines in the optimal solution and result in a more interesting sensitivity analysis.
Figure 18: Standby Sensitivity for A&P
A final result is the optimal solution of DER-CAM when the electricity tariffs are converted to a flat rate for all kWh’s regardless of time of use. These results are presented graphically in Figure 19. The characteristics of this site make this not the appropriate test of the sensitivity analysis. For this analysis the technology was constrained to be the technology selected at the site with the grants included in the capital cost. The flat rate tariff didn’t result in any changes in installed capacity after these constraints were included. The total cost of providing energy services drops slightly (4%) with a flat rate utility tariff.

Distributed Energy Resources in Practice
55
Figure 19: Flat Rate Electricity Sensitivity for A&P
Sensitivity of DER investment Initially it was suspected that the high demand charges were causing the lack of investment. However, the demand charges were eliminated and the model still did not invest in DER technologies. The next suspect was the high price of natural gas. The generators with the least expensive capital costs run on natural gas as fuel. If natural gas prices are 80% of their estimated current value (reduced by 20%) then the model installs a 55 kW natural gas engine with CHP capability. The total yearly energy costs at this level of natural gas prices is $239,821. 3.2.6 Limitations of this Analysis
The model’s ability to validate base case cost of utility purchases was hindered by the lack historic load data for electricity and gas. However, DER-CAM base case estimates were compared to those of the site engineers. Thus, DER-CAM and the site made costs estimates and decisions based on the same information. This test site highlights the problems of including grant information into DER-CAM. In this case, the grant covered the cost of DG and CHP technology plus the design and installation costs. DER-CAM, however, still includes these costs into the remaining marginal units. Not enough is known about how to allocate the costs to additional units when the first unit, in essence, has paid for much of the design and installation work. Furthermore, some of the equipment, such as the CHP unit, and electronic controls, piping, etc. can be used for some number of additional units at low cost.

Distributed Energy Resources in Practice
56
The technology selection process was heavily influenced by grants, the preferences of energy developers, and constraints not considered in DER-CAM. Hugh Henderson of CDH Energy helped select microturbines for this project, in conjunction with the other members of the consortium. One reason that microturbines were chosen over other technologies such as natural gas engines is that the DER system is installed on a roof and machines using oil lubricants and cooling systems can potentially foul up the roof.26 While DER-CAM assumes that all technologies are of equal consideration, the selection process here considered one technology that was actively offered to the site. Therefore only two of three criteria described in Section 1.3.3 are modeled: the technology selection process could not be modeled with DER-CAM. The analysis done by CDH Energy assumes that the Capstone microturbine DER system is available 90% of the time. This provides about 36 days per year to perform maintenance. DER-CAM assumes that technologies are available 100% of the time leaving no time for maintenance. This is especially important in a DER system with only one microturbine since there are not other sources of generation that can be rotated through active duty and have scheduled maintenance performed during off peak hours. Since DER system operating costs are similar to the base case cost of purchasing electricity and gas then this difference may not be great for this case. The desiccant loads were modeled in A&P by increasing the water heating loads until the total thermal load for the year matched the estimates by CDH Energy. It is assumed these water heating loads occur at the same time as the desiccant loads. From inspection of the water heating load curves, this is a fair assumption since the water heating plateaus from 6 am to 4 pm with a lower plateau in the evening. In this analysis DOE-2 used California building code standards for all buildings, independent of the location chosen for the weather file. Given constraints for this study and the difficulty of changing the DOE-2 code it was impractical to conduct a sufficiently careful building simulation. Scaling of DOE2 load shapes is done so that total consumption values in DER-CAM match details provided from the site. It is assumed that load shapes scale linearly, but this might not be true. 3.2.7 Observed Outcomes of Installed Technology
The Capstone microturbine started operating in August but has been frequently switched on and off as the developers complete the piping connections for the Munters HVAC unit. Steady operation has not been achieved with enough time to evaluate the system performance. CDH Energy is currently working with A&P on signing the interconnection agreement. 3.2.8 Conclusions from A&P Test Site Analysis
Although the grants for this DER project were higher than most other sites (65% funded as opposed to 40% for sites in California) the fact that the site’s tariffs and energy loads are near the point of a DER system being economical provided an interesting opportunity to learn about the factors affecting DER adoption in these conditions. The unique aspect of modeling the CHP and desiccant technologies involved, along with the choice of the different CHP energy use options, made this an interesting and worthwhile case study. The model provided interesting results about how the 26 Hugh Henderson, personal communication, November 2002.

Distributed Energy Resources in Practice
57
microturbines respond to changes in electricity rates and thermal loads. This case analysis also provided insight into the drawbacks of the current method of incorporating grants into the model and provided an incentive to improve upon it. Due to the way grants were included in the model and the choice to perform sensitivity analysis on Scenario 3 as opposed to Scenario 2, provided uninteresting sensitivity results. The sensitivity of technology adoption to changes in standby charges and natural gas prices was a useful result at a site that did not invest in any DER without receiving grants. This provided knowledge of what changes would be necessary before the site installs DER of any type. It is unknown if the operation of the microturbine is being affected more by the high electricity prices in the summer or the heating loads in the winter. It is clear that the operating pattern is not driven by time-of-use rates since A&P was assumed to have a flat electric rate. There may be a seasonal effect in that the microturbines are operating more in summer, when electricity prices are higher and there is a desiccant dehumidification load, than in winter. From inspection of the end-use load curves during different times of the year this appears to be the case, but since DER-CAM does not separate DER output by season, it cannot be confirmed. In the model, on-peak summer hours make up approximately 15% of the year. It appears the heat loads are necessary for cost-effective operation of the microturbines. The single microturbine operates more often than the scenario where seven microturbines are installed apparently because the heat loads are large enough to support the operation of one microturbine but not seven microturbines. From all of these results it is clear that the electricity and gas price conditions are near the balance point of economic operating costs of the microturbines for this site. This is deduced from the fact that a microturbine installed at no cost operates roughly half of the time. Also of note is that the thermal load estimates were increased substantially from the DOE-2 estimates. Overall, the assumptions made by the DER-CAM modeling process were optimistic (not conservative) and results would favor the adoption and economic performance of the microturbine DER system. A&P Waldbaum’s may determine, however, that it is achieving financial savings from operating the DER system a majority of the time. This would provide an opportunity to improve DER-CAM optimization results. The energy analysis and economic results should be available from A&P by the summer of 2003.


Distributed Energy Resources in Practice
59
3.3 Case B: Guarantee Savings Building, Fresno California
The Guarantee Savings Building, in Fresno, California, is a twelve-story, 8,600 m2 (93,000 ft2) commercial office building that is currently completing a major renovation to improve energy efficiency and installation of a DER system. Once complete, it will be home to three 200 kW United Technology Corporation (UTC) Phosphoric Acid Fuel Cells (PAFC), CHP heat use, and 350 kW (100 tons) of absorption cooling. Built in 1921 by Austin Thompson, this one-time bank building is now being converted to commercial office space, to be occupied by the Internal Revenue Service (IRS) and the Immigration and Naturalization Service (INS). The IRS will occupy floors nine, ten, eleven and half of twelve. The INS will occupy floors one through eight as well as a basement detention center. Ron Allison, the grandson of the original builder who bought the building in 1997, convinced the new tenants to move in based on his description of the renovations to be done, the energy systems to be installed, and the desire by the two government departments to be located downtown to help revitalize the downtown area and demonstrate civic support for the city. Mr. Allison is the head of the developing company for the project, Zahra Properties.
Figure 20: Guaranteed Savings Building, Fresno, CA
During the renovation of the building, the energy systems were completely replaced. The old double hung windows were replaced with double-pane, double-hung, argon-filled windows. The new windows were a double hung design to satisfy the historic preservation organization. The 550 wood and metal frame windows cost $1 million. The old lights in the building were replaced throughout with T-8 fixtures in a lighting retrofit that cost $120,000, and used 18,000 ballasts and 48,000 lamps. The lighted signs on the roof are currently using approximately 600 150-watt incandescent lamps that will be replaced with light emitting diodes (LEDs). The previous air conditioning system using R12 refrigerant as the working fluid also needed to be replaced.
Distributed Energy Resources in Practice
60
Insulation was installed in walls (R24 value) where there had previously been no insulation. A building energy management system was installed to replace individual control switches. As a result, there are now 77 zones of HVAC, allowing the system to heat and cool simultaneously. Ron Allison estimated that these combined measures will have a five-year payback and will reduce utility bills by 70%. The estimated date for energy production from the fuel cells is July 2003. As of August 1st 2002, they were about two weeks away from completing their cement pad. A new parking garage is being built adjacent to the building to accommodate the increased parking needs of the INS and IRS. The fuel cells are to be located in an alley between the parking garage and GSB’s office building. Some of the delays are attributed to the process of having a project approved by the local development committee. In addition, the alley is about one hundred years old, and there are no available plans for the electric and gas lines under it. Much of the work is being done by hand digging tools to avoid hitting the wires and gas lines that supply utilities to 20 other neighboring businesses. Currently the site is operating on 100% grid power and the building owners are renting a 350 kW (100 ton) electric chiller to cool the building until the fuel cells and absorption chiller system are on line. As of November 2002 the estimated operation date for the fuel cells is mid April 2003. A number of people helped in the design and implementation of this project. Ron Allison, head of Zahra Properties in Fresno, CA, was the property developer of the site. Logan Energy Corporation was the project developer and is responsible for the fuel cell project design and conceptual analysis. Sam Logan, President of Logan Energy, reports that the company installed and maintained a nationwide fleet of PAFC and PEMFC installations. Logan Provided $600,000 in DOD Climate Change FC grants and has gained approval for $1.5 million in CPUC SELFGEN project grants. Jack Payne, principal of an energy service company called Nova Greening, was responsible for performing the initial energy audit and lighting retrofits. Ann Heiniger, a mechanical engineer with Champion Industrial contractors, was responsible for the mechanical system and HVAC design. Dick Caglia, along with Ken McCormic and Ray Keith of the Electric Motor Shop, a 3rd family generation engineering design company in Fresno, provided engineering design support for the DER and other energy systems, and also helped facilitate the interconnection agreement with PG&E. Frank Holcolm at the Construction Engineering Research Lab (CERL), the engineering research and development center at the US Army Corps of Engineers, provided FC operating data from the DOD FC test program to assist Ron Allison in evaluating FC technology for the GSB building. This site was chosen for this case study analysis because it selected an innovative DER system, fuel cells coupled with absorption cooling, heat pumps for additional heating and cooling, implemented together with an extensive energy efficiency retrofit. The developers of Guarantee Savings Building chose to install fuel cells for economic and reliability reasons. At the time the project was conceived, California’s energy prices and reliability was considered highly chaotic. Furthermore, this project was a way to ensure certainty in financial budgeting for the developer and the tenants. This project is located in California’s central valley, which has some of the strictest air quality standards in the state. The desire to avoid the air quality permitting process was another factor in the selection of fuel cells for this project. Fuel cells are not a combustion technology and have cleaner emissions than natural gas engines or microturbines. These air quality issues are another interesting factor to consider in this case study report and future analyses.

Distributed Energy Resources in Practice
61
Figure 21: NOx Emissions of DER Equipment27
3.3.1 The Decision-Making Process
“Bottom line financial issues” drove the implementation of energy efficiency projects and installation of a fuel cell DER system at Guarantee Savings Building according to Sam Logan. The project focused on the benefits to clients and to the city center, as much as on the technology. It was a unique opportunity to renovate a historic building and help revitalize the downtown area. The issues of economics, power reliability, and community relations are what convinced the two government agencies to sign a ten-year lease for the site. Ron Allison made the decision to install the fuel cells due to a combination of economic, reliability, and regulatory factors. Fuel cells were attractive because of the financing available, and because they would be able to assume control of power reliability. The future cost of electricity and reliability was seen as highly uncertain and variable because of the problems with the wholesale market and financial stability of PG&E during 2000. Furthermore, strict air quality requirements in the San Joaquin Valley Air Pollution Control District (APCD) would require the purchase of Emission Reduction Credits (ERCs) if a combustion technology were to be used full-time.28 This would increase the cost of full-time generation above that for fuel cells. Sam Logan knew of the funding available from the Department of Defense’s (DOD) Construction Engineering Research Lab to install fuel cell systems dedicated toward a government office. This project funding carried an expiration date, however, and it was important to identify an appropriate installation site. The GSB site was appropriate because it was, at the time, being renovated and all the building’s energy systems including the HVAC, lighting, internal electrical systems, and the building’s shell, were being redesigned. The design team rapidly adapted their ongoing work to include the fuel cell and absorption chiller system into the energy system design. As a result, the DOD made the funding for the fuel cells available.
27 Sources: Diesel Engines: Katolight product information, http://www.katolight.com/ All other technologies: Combined Heat & Power: A Federal Manager's Resource Guide Aspen Systems Corporation, Rockville, MD March 2000. 28The San Joaquin Valley APCD provides information on their permitting process, fees, and historical sale prices for Emission Reduction Credits (ERCs): http://www.valleyair.org/busind/pto/permits_idx.htm

Distributed Energy Resources in Practice
62
3.3.1.1 Economic Analysis
The Guarantee Savings Building was being renovated with its energy systems completely redesigned to improve comfort and energy efficiency. The energy use for the building’s heating, ventilation, and air conditioning was expected to drop substantially. However, there would be completely new internal loads from computers, copy machines, and other electronic equipment from the IRS and INS. A complete window retrofit cost $1 million and the lighting retrofit cost $120,000 for the entire building. Ron Allison estimated that these combined measures will have a five-year payback and reduce operating costs by 70%. The fuel cells, PC 25C 200 kW units from United Technology Corporation (UTC) each cost $825,000 for a total of $2,475,000. The absorption chiller cost $180,000 for the equipment. Adding in design and installation costs brought the total cost for the fuel cell DER project, not including the energy efficiency improvements, to $4,353,375. This is the funding estimate used in the DER-CAM analysis. The total project cost was subject to change during the installation and later increased to $4.7 million. The project has received reservation confirmation of $1,500,000 in grants from the California SELFGEN program pending construction, startup, and operational certification. This program provides grants up to 40% of project costs for qualifying facilities having efficiencies over 42.5%. These awards are developed through the California Public Utility Commission, and administered through the utilities and are described further in Section 2.9. The DOD’s Climate Change Fuel Cell program provided $600,000. This program was initiated in 1995 to provide up to $1,000/kW for fuel cell installations.29 The remaining project funding for $2,600,000 was provided by loans from United Technology Corporation, thus avoiding the need for direct bank loans. The developer, Zahra Properties, took responsibility for providing energy services to the leasing organization, the U.S. General Services Administration (GSA). The GSA agreed to purchase electricity at a flat rate for 10 years at $0.35 per kWh in order to eliminate the risks of future price fluctuations and make budgeting easier. This was done during the energy crises of 2001 when wholesale electricity prices were high and thought likely to increase due to the financial problems of PG&E. Table 29 presents the financial costs, NPV, and Payback as estimated by data from the site and as a result of the DER-CAM analysis. The project benefits in the third column are without capital costs payments.
29 Climate Change Fuel Cell Program, presentation notes by Dr. M.J. Binder (USACERL) and W.C. Smith (DOE/FETC), August 1999.

Distributed Energy Resources in Practice
63
Table 29: Net Present Value and Payback Analysis for GSB
Site DER Project Cost ($)
DER Project Annual Benefit ($/year)
Net Present Value and Payback of project including grants received
Guarantee Savings Building
$4,353,375 NA
NA NA
DER-CAM estimates $4,353,375 $218,495 $(518,000) 10 years 3.3.1.2 Engineering Analysis
The engineering energy system analysis was complicated by the lack of historic electric and thermal load data for the site. Even though it is a historic building, the complete renovation and energy efficiency improvements, along with the new tenants and the energy consumption internal to their operations, will create entirely new electric and thermal energy demands. For example, the IRS is expected to have over 1200 computers in the building. The INS will occupy floors one through eight and the basement will be turned into a detention center. The buses with INS detainees will drive into a fenced-in area on the basement of the garage; the detainees will walk through an underground tunnel into the detention center in the basement of the Guarantee Savings Building. The detention center has special energy requirements. For example, the HVAC system has to use 100% outside air, as opposed to mixing in re-circulated air, and must run twenty-four hours a day. Electricity for a six-story parking garage will be added to the electric load. This will help increase the load factor by providing an evening lighting load. The DER system to be installed is comprised of three 200 kW phosphoric acid fuel cells which will be synchronized with the grid. The size of the DER installation was dictated by the critical loads, which were supplied by a separate power circuit. When the grid fails, everything but the critical loads goes dark. The building was estimated to have a peak power demand of 600 kW. After INS provided a tenant improvement plan the estimate was changed to 900 kW for normal operation, 1200 kW for peak load, and 275-300 kW for the night load. The parking garage and mechanical yard were also added to the system and are included in the above estimates. A 200 kW PAFC, the PC-25 from UTC was the first to enter the commercial market in 1992, and there are now over 225 installations worldwide.30 These units achieve 40% electrical efficiency and 80% overall energy efficiency in CHP applications. The thermal energy production is 740,000 kJ/h at 60 °C (700,000 BTU/h at 140 °F). A high-grade heat exchanger provides 369,000 kJ/h at 120 °C (350,000 BTU/h at 250 °F), and a low-grade heat exchanger provides 369,000 kJ/h at 60 °C (350,000 BTU/h at 140 °F). The thermal energy may be used for water or space heating, or low-pressure steam.31 Measured emissions from the PAFC unit are <1 ppm of NOx, 4 ppm of CO, and <1 ppm of reactive organic gases (non-methane) and are so low that the plant is exempt from air permitting in some of
30 Sam Logan, Logan Energy, personal communication, February 2003. 31 U.S. DOE, Fuel Cell Handbook, 5th edition, October 2000.

Distributed Energy Resources in Practice
64
California’s Air Quality Management Districts, which have the most stringent limits in the U.S.32 The sound pressure level is 62 dBA at 9 meters (30 feet) from the unit (roughly the level of normal conversation).33 The average availability of the fleet is over 95%.34 At GSB, Sam Logan estimates the reliability of the three fuel cells should be 97% as a system (at least one running). They considered the reliability of the grid to be 98%. This provides a reliability of the two systems operating in parallel to be 99.9% for the building’s electrical system. GSB uses the heat flows for two different CHP applications with the high-grade heat exchanger option. The lower temperature heat at 60 °C (140 °F) is dedicated to the heat pump units for providing space heating and cooling, and the higher temperature heat at 120 °C (240 °F) is available as pressurized hot water and for heating the four-pipe system which supplies the 350 kW (100 ton) adsorption chiller and domestic hot water. Heat not delivered through the high-grade heat exchanger is available at the standard heat exchanger. GSB has two separate HVAC systems. The basement and first two floors are served by a four-pipe system. In general, four-pipe systems are able to heat and cool simultaneously in different zones of the building using water as the heat transfer medium. This brings the benefit of added temperature control for internal spaces. The drawback is the increased cost due to extra equipment for the independent water systems and extra air handling equipment or operable windows are necessary for supplying fresh air. Chilled water is supplied by a 350 kW (104 ton) HIJC adsorption chiller. Hot water is provided by the fuel cell high-grade heat exchanger loop. Floors three through twelve are heated and cooled by six water source heat pumps on each floor that are supplied by the condenser water system. During the heating cycle, the heat pumps utilize thermal energy that is provided by the fuel cell low-grade heat loop. With this system, the building has the advantage of being able to simultaneously heat and/or cool different zones depending upon local conditions. The GSB building meets qualifying facility (QF) criteria with an efficiency rating of 44.1%. This efficiency rating was critical for achieving the QF status and making CPUC funding available for the project. Without the $1.5 million from the state, the fuel cell project would not have been viable. 3.3.1.3 Utility Issues
According to Ron Allison, PG&E had never dealt with a fuel cell installation before. Consequently, working with PG&E on the interconnection agreements and determining the needed technology to meet their interconnection requirements was “like trying to get a hold of a bowl of Jell-O.” The energy development team had difficulty determining the technical requirements, and consulting with people qualified to answer questions and provide consistent criteria to meet. They were not able to make progress with PG&E until colleagues at the Electric Motor Shop, a 100-year-old company with three generations of family ownership based in Fresno, used their contacts with PG&E to find the right person to make this project go forward. As it was, they exchanged approximately 12 iterations of the DG interconnection plans. Ken McCormic with the Electric Motor Shop, thought the interactions with PG&E on the system installation were very smooth.
32 U.S. DOE, Fuel Cell Handbook, 4th edition, November 1998. 33 Description of decibel scale: www.howstuffworks.com/question124.htm 34 U.S. DOE, Fuel Cell Handbook, 4th edition, November 1998.

Distributed Energy Resources in Practice
65
Sam Logan also sought assistance with the process of applying for QF status. They were having trouble getting the engineer at PG&E to approve their calculation for the 42.5% efficiency rating the facility needed to obtain QF status. The QF status would allow them to obtain a large grant from PG&E that would be critical for the project’s implementation. Sam Logan and Ann Heiniger eventually were able to receive approval for QF status from PG&E after submitting two system efficiency calculations both over the 42.5% efficiency requirement. (A representative at PG&E said he was “uncomfortable” with the first calculation.). Appendix L presents the second QF calculation. 3.3.1.4 Decision-Making Software Tools
The economics and available financing for the fuel cells, reliability issues, and the electric and thermal loads at the site drove the technology adoption decision. The load analysis was done by evaluating the various end-use loads at the site and estimating how much they would be used. Financial analysis was done using spreadsheets. The energy system load modeling was done using DOE-2 and EnergyPro with the results used in the QF calculation for PG&E. The decision at GSB seemed to be whether to go ahead with the fuel cell project or not, and how many units to install, based on their critical loads and the availability of funding. 3.3.2 Description of Data Collection Process
Jack Payne at Nova Greening provided preliminary load estimates for GSB. Ann Heiniger at Champion Industrial, the Electric Motor Shop, and Logan Energy provided later refinements. These estimates were of peak power consumption and annual energy consumption. Ann Heiniger also prepared a DOE-2 analysis that provided detailed information about subsections of the energy systems for the building. These subsections included thermal energy consumption estimates for the four-pipe heating and cooling system, the heat pump system, and domestic hot water system. The total electricity consumption of the building was also provided. An independent DOE-2 analysis was performed to bring energy loads into agreement with information provided by the site. As a result, electric-only loads were scaled by a factor of 0.9 (reduced by 10%), cooling loads were scaled by a factor of 0.5, and space-heating, water-heating and natural-gas-only loads were held constant. The scaling factors were estimated based on knowledge of the peak load of the building and of the total annual electricity consumption. However, there was conflicting information about the size of the peak power load for the building perhaps due to changing decisions as to whether the parking garage will be connected to the fuel cell system. The loads for the Guarantee Savings Building were developed in DOE-2 for each hour of the year. DER-CAM uses average hourly loads for each month and weekday and weekends. Average loads will result in lower demand charges than actual loads since the peak demands will be reduced to the average. To compensate for this effect, the demand charges are increased by 10%. This is based on an estimate of how much our monthly peak demand is being reduced due to using average loads for each hour in DER-CAM. A comparison of demand charges from DER-CAM with those of actual data at San Bernardino indicated that the DER-CAM demand charges were about 12.6% below the actual demand charges.

Distributed Energy Resources in Practice
66
A subsequent analysis of the DOE-2 output examined the peak kW for electric-only loads and cooling loads for each hour per month, for each day type, and compared it to the maximum average electric-only load and maximum average cooling load per month. These two values were then added to obtain the peak total electric load and the maximum average electric load. This assumes that the two loads are coincident and peak at the same time. From inspection of the DOE-2 load profiles this seems an accurate assumption, both loads peak at about 16:00 hours for an office building in Fresno, CA. A comparison of DOE-2 peak hourly loads and the maximum average load per month and day type is presented in the table below. The end-use loads for GSB are presented in Appendix K. From this table it appears the adjustment is under-representing the demand charges the site would experience, at least prior to installing DER. The average percent difference between DOE-2 peak cooling load and the average cooling load peak is 16% for weekdays and weekends. Therefore, the base case annual energy cost prediction will be low because the average cooling load values are used by DER-CAM to compute demand charges. The season in which these differences occur is also important in estimating the demand charge calculation error since there are different tariff demand charges in summer and winter months. The average summer difference is 7% and the average winter difference is 25%. As expected, the cooling loads tend to be peakier, and hence, farther away from the average than the electric-only loads. Cooling loads, however, are generally less than the electric-only loads and contribute proportionally less to the difference between hourly peak and maximum average loads, thereby moderating their effect. Table 11: DOE-2 Peak Verses Maximum Average for GSB
Month (weekdays) DOE-2 Peak Hourly Total Electric Load (kW)
Maximum Average Total Electric Load (kW)
Percent Difference (kW)
January 634 474 25 February 929 618 33 March 1006 767 24 April 1008 862 15 May 1030 932 9 June 1045 981 6 July 1068 991 7 August 1085 1039 4 September 1079 1014 6 October 1030 939 9 November 877 658 25 December 626 467 25
Distributed Energy Resources in Practice
67
3.3.3 Assumptions of Modeling Process
• Tariff rates were changed to incorporate energy surcharges on January 1st 2001 and June 1st 2001. These rates include adjustments as a result of PG&E’s bankruptcy filing in 2000. These adjustments were increases of $0.01 and $0.06042/kWh respectively and increased PG&E customer class A-10 by 80% to $0.16/kWh in summer. The winter adjustments, increases of $0.01 and $0.02888/kWh respectively, increased winter energy rates by 50% to $0.11/kWh. It is not clear if the developers knew about these rate adjustments during their economic analysis.
• Treatment of grants in the model: All technologies in the DER-CAM technology table that are
eligible for a SELFGEN rebate had their capital costs reduced to the appropriate level. For GSB the fuel cells had additional grants and these were applied to the capital costs for the four versions of fuel cells in the model: that is, the fuel cell (FC), FC with CHP, FC with absorption chiller, and FC with CHP and absorption chiller. Sensitivity analysis was performed on the model with the technology costs at subsidized levels.
• The loads for the building were developed using DOE-2 and scaled to reflect the available
estimates for the building. Since the energy systems and shell of the building were all new, it was essentially a new building, and the development team estimated the loads. Hence, no historic loads were available. The exact estimate for building energy use and peak power depended upon the different analyses done and whether the parking garage was included in the loads. This analysis does not include the parking garage although it will be included in the actual system. This may provide the site with a higher load factor, due to the load being primarily nighttime lighting, and perhaps more residual heat for powering adsorption cooling equipment.
• Operation and Maintenance costs for combustion technologies do not include the cost of
purchasing Emission Reduction Credits. This would increase the total energy costs of incorporating those technologies.
3.3.4 Model Results
The results in Figure 22 and Table 30 below are from DER-CAM runs without grants at a 7.5% nominal interest rate (an estimated interest rate since the actual value used was unknown). Each scenario was run without grants and with grants to understand the influence of the funding on the installation decisions at the site and the financial profitability of various DER configurations. Figure 23 and Table 30 below are from DER-CAM runs with grants at a 7.5% interest rate.

Distributed Energy Resources in Practice
68
Figure 22: Scenario Results for Guaranteed Savings Building Without Grants
Table 30: Results for GSB Without Grants
CASETechnologies Selected
Annual energy cost
Percentage of base case cost
Annual savings over base case
Electricity purchases
Natural gas purchases
Self generation costs
1:No Investment $ 489,524 $462,806 $26,718 $0
2: Unlimited Investment
500 kW natural gas engine, 1 x 55 kW natural gas engines with CHP $ 429,977 88% $ 59,547 $147,505 $176,286 $106,186
3: Unlimited Investment in PAFC
No installation of DER $ 489,524 100% $ - $462,806 $26,718 $0
4: Forced Minimun Investment in PAFC
200 kW PAFC with CHP and absorption chiller $ 576,618 118% $ (87,094) $273,101 $96,643 $206,874
5: PAFC 600 kW with Abs Cooling and CHP
3 x 200 kW PAFC with CHP and absorption chiller $ 835,910 171% $ (346,386) $65,912 $168,724 $601,274

Distributed Energy Resources in Practice
69
Figure 23: Scenario Results for Guaranteed Savings Building With Grants
Table 31: Scenario Results for Guaranteed Savings Building With Grants
CASETechnologies Selected
Annual energy cost
Percentage of base case cost
Annual savings over base case
Electricity purchases
Natural gas purchases
Self generation costs
1: No Invest 489,524$ $ 462,806 $ 26,718 $ -
2: Unlimited Invest
1 x 100 kW PV 3 x 55 kW natural gas engines with CHP 1 x 500 kW natural gas engine with absorption chiller 402,756$ 82% $ 86,768 $ 43,217 198,280$ $ 161,259
3: Unlimited Invest in PAFCs
200 kW PAFC with CHP 471,495$ 96% $ 18,029 $ 283,230 97,271$ $ 90,994
4: Forced minimum investment in 200 kW PAFC with CHP and Abs. Chiller
200 kW PAFC with CHP 488,341$ 100% $ 1,183 273,101$ 96,643$ $ 118,597
5: Forced duplication of site decision: 3x 200 kW PAFC with CHP and Abs. Chiller
3x 200 kW PAFC with CHP and abs. chiller 571,078$ 117% $ (81,554) $ 65,912 178,724$ $ 326,442

Distributed Energy Resources in Practice
70
3.3.5 Discussion of Results
A discussion of the results for the scenarios run for Guarantee Savings Building, as well as a discussion of the sensitivity of these results to grants and rebates, the spark spread (gas prices relative to electricity prices), standby charges, and peak pricing vs. flat rates, is presented below. Dividing the total dollars spent on electricity in Scenario1 by the number of kWh derives a flat rate for electricity purchased. The flat rate electricity analysis uses this rate for all kWh’s and sets the demand charge and standby charge to zero. The Scenarios: Results for the Scenarios without (Figure 22 and Table 30) and with (Figure 23 and Table 31) grants are presented above. It is not surprising that without grants a natural gas engine was selected to supply power and heat to the building. Including potential grants in the project, however, showed that adding absorption cooling to the 500 kW natural gas engine, and additional 2 x 55 kW of natural gas engines with CHP, and 100 kW of photovoltaic would be the most cost effective DER system for the site. Comparison of results with and without grants Without grants: • Base Case cost is $490,000 per year (all loads met with utility purchased electricity and gas); • Annual cost of 600 kW fuel cell DER system is $836,000 ($346,000 increase per year); • Scenario 2: least expensive DER system is $430,000 per year with 500 kW NG engine and 55
kW NG engine with CHP saving $60,000 per year. With grants: • Annual energy cost of installed DER system is $571,000 ($82,000 increase over base case); • A 200 kW fuel cell with CHP is cost effective, providing $18,000 per year savings and reducing
electricity consumption by 40%; • A 200 kW fuel cell with CHP and absorption cooling is also cost effective, but savings are only
$1000 per year; • Scenario 2 (unlimited investment) has annual cost of $403,000 saving $87,000 per year total and
electricity bills by $420,000 per year; • DER technologies installed for Scenario 2 include 500 kW NG engine, 3 x 55 kW NG engine
with CHP, and 100 kW PV. Total installed capacity is 765 kW. These graphs show the site’s energy costs dominated by electricity in the base case with little space-heating, water-heating, or natural-gas-only loads. The unlimited investment, Scenario 2, shows a switch to natural gas expenses and capital costs for the DER equipment with little utility electricity expense. Scenario 2 total installed capacity is 765 kW including the 100 kW of PV. The comparison of Scenario 1 and Scenario 2 has significant implications for policy development if it is desirable to reduce reliance on the utility grid or preserve air quality in the region. This analysis did not incorporate the cost of obtaining air pollution permits for the natural gas engines. The adoption

Distributed Energy Resources in Practice
71
of the PV capacity, when the available funding was included in the capital cost, was a surprising result of this scenario. Of the five sites modeled in this report, GSB is the only site to have PV in an optimal DER-CAM solution of the unconstrained optimization of Scenario 2. Scenario 3 and Scenario 4 invest in a 200 kW fuel cell increasing the electricity purchases compared to the unrestricted scenario since the installed DER capacity drops by 565 kW. These results are significant in that they show that the purchase of a FC unit is cost effective compared to the Base Case. The installation of one 200 kW FC unit also indicates that the results for Scenario 5, where multiple units with CHP, and absorption chilling capacity are installed, will be less cost effective (and, in fact, this is the result obtained). The model in Scenario 4 chose from the technologies selected on site, fuel cell with CHP and absorption chiller, with the option of any capacity level. The optimal solution was to install 200 kW of capacity of this system (one unit). This resulted in annual costs roughly the same as the base case but with a 40% drop in electricity expenditures and an increase in gas expenses by a factor of three. Scenario 5 required the model to install the configuration actually being installed at Guarantee Savings. This DER system resulted in a 17% increase in cost over the base case for an additional $81,000 per year additional expense. Electricity expenditures fall by $400,000 per year and gas costs increase by $142,000 per year. The additional expenses come from the amortized capital cost and the operating and maintenance costs. These DER-CAM results state that the installed system is not cost effective given the basic constraints of energy balances etc. This suggests that there are currently not significant enough thermal loads, or off-peak electricity costs, to support a larger DER system consisting of 600 kW capacity with absorption cooling and CHP capabilities. This may be one reason why the energy developers have decided to connect the parking garage to the DER system as it would provide a steady off-peak lighting load. It should be noted that Scenario 5 is an attempt to replicate the costs of the technologies installed at the site, not the cost effectiveness of the financial agreements that covered the provision of energy services from the DER system. In other words, DER-CAM, as used in this analysis, provides a means of checking the cost of the DER technologies installed, but not the cost effectiveness of share savings contracts, or energy providing contracts such as used by GSB. Scenario 5 replicates the decision made at Guarantee Savings and depicts a switch to DER capital-intensive operations with reduced electricity consumption. This operating strategy will bring many benefits to the local electricity grid and reduce air pollution and noise to the surrounding community when compared to alternatives such as natural gas engines. From this analysis, however, it appears the site developer and the tenants will be bearing some of the costs of these community benefits (although the project received 40% of its funding from the CPUC and DOD). Incorporating other constraints into the model, such as the cost of required air pollution permits for combustion technologies may make natural gas engines more expensive but would not affect the results of the Base Case verses the FC technologies.

Distributed Energy Resources in Practice
72
The Sensitivities: A spark spread sensitivity analysis determined that a decrease in gas prices of between 50% and 70% (spark spread rates of 14 and 10 respectively) results in the installation of 2 x 200 kW of fuel cell CHP systems. Gas prices would have to increase 140% (a spark spread rate of 5) before no fuel cell CHP installation would occur. The sensitivity of installed capacity to gas prices is presented graphically in Figure 24 below.
Figure 24: Spark Spread Sensitivity for Guaranteed Savings Building

Distributed Energy Resources in Practice
73
Standby charges would have to increase beyond $8 per kW of installed capacity before fuel cell CHP installation would be uneconomic. Also of note is that eliminating the standby rate does not lead to increased capacity installation. The sensitivity of cost and capacity to standby rates is presented graphically Figure 25 below:
Figure 25: Standby Sensitivity for Guaranteed Savings Building

Distributed Energy Resources in Practice
74
The switch from a tariff schedule that includes demand charges to a pure flat rate tariff schedule reduced annual energy expenses $14,000, or 3%, to $389,000. Annual electricity purchases increase by 40% or $16,000 per year. Natural gas purchases drop slightly and self-generation costs fall by about $18,000 per year. The installed capacity drops from 765 kW to 650 kW. This is significant because in the absence of a demand charge the customer does not find it cost effective to install additional capacity to reduce their peak demand. The DER system technology selection is 500 kW NG engine with CHP, and 150 kW of photovoltaic. If the standby charges are also eliminated the annual costs fall to $371,000 and the DER system expands to 800 kW comprised of 500 kW NG engine with CHP and 300 kW of photovoltaic. The results of converting electricity prices to a flat rate per kWh are presented graphically Figure 26 below:
Figure 26: Flat Rate Electricity Sensitivity for Guaranteed Savings Building
3.3.6 Limitations of this Analysis
These results attempted to predict base case utility costs, DER system costs, and to replicate site decisions. However, the limitations of DER-CAM should be considered when analyzing the results. These results were arrived at by approaching the problem from the viewpoint of the cost effectiveness of the DER as a system, rather than the cost effectiveness of the financial package of the installed system. A financial analysis of the installed system should include loans and energy contracts and this DER-CAM analysis included neither. DER-CAM is intended for an ideal system with known load and financial information. The points below describe how the GSB site differed from the ideal modeling process. • Since the offer of fuel cells came before the decision to install fuel cells, it is difficult to
replicate the decision making process at GSB.

Distributed Energy Resources in Practice
75
• The DER system is being installed in an historic building that has undergone a complete retrofit. Therefore no applicable energy use records exist by which the model’s base case can be verified for accuracy. Without historic records, there is no way of validating the model without using other models such as DOE-2, which introduces increased uncertainty.
• The model requires complete project and operating costs, as well as a prediction of future fuel costs. These data are incomplete, however, since the technology has not yet been fully installed, and project costs are not yet available. As a result, future energy costs can only be estimated based on past costs. Hence, the model is limited for uncompleted projects due to its reliance on estimated information.
• DOE-2 load shape generators used to create hourly load profiles were difficult to adapt to different technologies. In the case of GSB, heat pumps were installed in the building for space heating, which changes the energy consumption model: heating loads become electric loads. This was not quantitatively considered in DOE-2, however, it was considered when the loads were scaled.
3.3.7 Observed Outcomes of Installed Technology
The technology is currently being installed. No results are available at this time. 3.3.8 Conclusions from GSB Test Site Analysis
Although fuel cells are not an economic choice in DER-CAM’s cost-optimization model, they are cost effective for this site. This analysis did not consider any of the financial or performance enhancements obtained through the use of fuel cells in the contract between Zahra Properties and the General Services Administration. The fixed price contract for electricity, for example, creates budgeting certainty for the tenants. Furthermore, the fuel cell DER system provides benefits in electricity reliability, the regulatory and permitting process, the utility’s network, and environmental emissions that are all highly valuable but difficult to quantify with certainty. In reality for GSB the base case electricity price that Zahra Properties is competing against with their fuel cell power is the contracted electricity priced at $0.35/kWh. DER-CAM results show that Zahra’s average cost for generating electricity via the fuel cells is only $0.20/kWh with an average variable cost of approximately $0.08/kWh and this provides a considerable profit margin for fuel cell generated electricity. In this case the developer (Zahra Properties) was strongly inclined towards fuel cells because of environmental concerns and regulations, which the simple cost minimization of DER-CAM clearly would not predict. The use of combustion technologies would require an investment in time and money to obtain the required operating permits in this air quality district. Hence the natural gas engine technologies, in reality, are eliminated from consideration. These costs and restrictions should be included in any future DER-CAM modeling of the GSB site. Fuel cells become an attractive technology when emissions from more traditional DER technologies are unacceptable. This DER system also provides considerable benefits to the utility and, as a result, to all the customers of the utility. By freeing up 600 kW of existing capacity the fuel cells also provide

Distributed Energy Resources in Practice
76
highly valuable electricity to PG&E which they can wheel outside of the region at critical periods and obtain $600-800 /kW in the wholesale market.35 The fuel cells add reliability to the system, which also has value to the IRS and INS tenants. This value is reflected in the financial price paid to the Zahra Properties. The fixed electricity price of $0.35/kWh is much higher than the current PG&E tariff rate (about twice as high per kWh) and considering this in the analysis would have also improved the project’s profitability. The difference in cost represents the value (perceived by Government Services Administration) of stable electricity prices and high electricity reliability. Zahra Properties therefore obtains financial benefits from the fuel cell project but these are not considered in this analysis. The site is also achieving substantial environmental and public health benefits by installing a low emission fuel cell DER system. These benefits have not been quantified in the case study analysis. Zahra Properties is helping to provide these environmental and social benefits by the installation of the fuel cell DER system.
35 Sam Logan, Logan Energy, personal communication, November 2002.

Distributed Energy Resources in Practice
77
3.4 Case C: The Orchid Resort, Mauna Lani, Hawaii
The Orchid at Mauna Lani is a luxury resort hotel located on the west coast of the Big Island of Hawaii. The resort consists of 539 rooms within 513,000 m2 (5,520,000 ft2) of interior space and situated on 13 km2 of land.36 The resort includes a golf course, spa, pools, restaurants, shops, and other amenities. Starwood Hotels and Resorts Worldwide, Inc. operates the resort for owners Colony Capital LLC, but is currently in the process of being sold. Located approximately 70 km north of Kona, The Orchid and its neighboring luxury resorts form the only development in the area, although ground has been broken for a major housing development adjacent to the resort. Temperatures at the site range from an average high of 26 °C (80 °F) to an average low of 16 °C (60 °F), with an average rainfall of 160 centimeters a year. Due to the relatively warm conditions, space heating is used infrequently, but pool heating and air conditioning are used year round. The Hawaii Electric Light Company (HELCO) supports a small, isolated grid on the island, which experienced peak electrical demand of 171 MW in 2000. HELCO’s utility network has an evening peak electricity demand that strains the transmission system. Electricity prices are also extremely high, approaching $0.20 per kWh. The Orchid Resort at Mauna Lani has installed four 200 kW Hess Microgen propane fired reciprocating engines and absorption cooling to reduce costs, provide grid back-up, and reduce the environmental impact of the resort. Hess Microgen developed the project in conjunction with Orville Thompson of The Orchid Resort. Hess Microgen paid for, installed, and operates 800 kW of synchronous, continuous-duty power and 843 kW (240 tons) of absorption chilling. Hess Microgen, a subsidiary of Amerada Hess Corporation, designs, builds, and installs cogeneration and distributed generation systems. The Orchid Resort was chosen as a test case for several reasons: • High energy prices provided an economical market for DER. • The technology was among those of interest for this DER-CAM project. • The location added geographic diversity to the project.
36 As reported by Orville Thompson, retired resort chief facilities engineer, and as rated by the American Academy of Hospitality Sciences, July 2002.

Distributed Energy Resources in Practice
78
Figure 27: The Orchid Resort, Mauna Lani, Hawaii
3.4.1 The Decision-Making Process
When Starwood assumed management responsibility for The Orchid resort, they required the resort operators to cut energy costs by 5% without any capital outlay. This was described as a tall order for The Orchid, as they had already performed many energy efficiency upgrades such as installing compact fluorescent lighting. The Orchid’s engineering crew, led by Orville Thompson, believed installing onsite co-generation was the next logical step to reduce energy expenses. Onsite managers had to be convinced that the construction and end product would not diminish the experience of the guests. The owners (Colony Capital) had purchased the hotel with a short-term, five-year outlook, and it did not want to invest in any projects that would not add value to their property in the short term. HELCO offered the hotel a PUC-approved $100,000 per year “customer retention discount” not to install onsite generation, and, after the technology was installed, imposed standby charges of $11.40/kW/month of onsite generation capability that has resulted in an additional $9,120.00 in monthly costs to the resort. The resort owners were convinced by the financial analysis: if discounted at 10%, the present value of the guaranteed annual $200,000 energy savings directly increased their bottom line and translated into an extra two million dollars of property value today.37 Hess Microgen provided the full onsite cogeneration facility at no cost to the resort, creating a very positive financial case. The onsite managers asked the questions listed in Table 32. With assurance that the answer to each was “no,” and when told that the new facility would actually increase the amount of useable space on the resort property (by elimination of the large cooling towers through the addition of a saltwater well-driven heat exchange cooling loop), they agreed to allow the construction to begin.
37 The 10% discount rate referred to here is an approximation provided by Orville Thompson for illustrative purposes. A discount rate of 7.5% in the DER-CAM analysis of The Orchid.

Distributed Energy Resources in Practice
79
Table 32: Managerial Concerns About Installing Onsite Generation at The Orchid Resort
1. Would there be any guest service impacts during the installation and startup sequence?2. Would the ongoing operation have any negative impacts on the operation of the hotel if there were equipment failures within the cogeneration plant? 3. Would there be visual impacts during construction or after commissioning? 4. Would there be noise impacts during construction or after commissioning? 5. Would there be air quality impacts resulting from operation of the cogeneration plant? 6. Would periodic maintenance or repairs have any disruptive impacts to the hotel operation?
According to Orville Thompson of The Orchid, the resort management believed that installation of onsite generation would decrease emissions per kWh compared to generation at the utility. In addition, they believed that their DER installation would reduce the demand on the grid, and help to decrease the need for expanded centralized utility power generation. Each of these benefits of onsite generation was deemed to improve the surrounding environment and to make the resort guests’ experience more pleasant, each of which is seen as crucial to attracting guests to the resort. It is unclear whether these claims have been the subject of investigation, or if they have proven true. Faced with the benefits of onsite generation, The Orchid turned down the utility’s customer retention discount. They contracted Hess Microgen to install 800 kW of synchronous, continuous-duty power from four 200 kW diesel engines converted to run on propane and 840 kW (240 tons) of absorption chilling. Propane was chosen due to its high availability on the islands since it is a by-product of the Oahu oil refining industry normally exported to the mainland. 3.4.1.1 Economic Analysis
The Starwood corporate managers mandated The Orchid Resort to decrease their energy costs by 5% without incurring any capital costs. Through Hess Microgen, The Orchid has decreased energy costs by 15% with no capital costs incurred. Their shared savings program guarantees The Orchid 15% savings of electrical power and boiler fuel costs. Hess Microgen covers the capital costs for the equipment used to provide electricity and cooling to the resort, selling it to The Orchid at 15% less than what they could buy electricity for from the grid. The price paid to Hess for electricity (approximately $0.16/kWh based on today’s electricity prices of $0.1908/kWh) provides enough revenue to cover capital costs, operation and maintenance, fuel, and a profit margin. Under this agreement, there is a seven-year payback period, after which The Orchid has the option to purchase the equipment for $1. A sensitivity analysis on gas and electric rates was performed prior to the decision to install in order to determine the overall effect of changing rates on the project economics. It was determined that there are inherent hedging benefits of cogeneration, such as those against the cost of gas increases. The value of cogeneration increases with increasing gas costs and at least offsets the increased cost of additional gas purchases, to a range of ± 20% fluctuation in prices. Hence, even if electricity prices drop by as much as 20%, and gas prices increase as much as 20%, the increased cost of gas

Distributed Energy Resources in Practice
80
will be offset by the decreased needs after CHP has utilized the system’s waste heat, as long as there is substantial use for co-generated hot water. According to The Orchid and Hess Microgen, at the time of the DER installation decision electricity was $0.16/kWh, and is now $0.1908/kWh. Propane was $9.95GJ ($1.05/therm), but is now at $13.7/GJ ($1.449/therm). Although The Orchid is still saving 15% on its energy bills, the dollar value of those electricity and gas savings have increased by 19% and 38% respectively. In other words, as the prices of electricity and propane increase over the years, the value of DER to The Orchid also increases. Table 33 presents the financial costs, NPV, and Payback as estimated by data from the site and as a result of the DER-CAM analysis. The project benefits are prior to capital costs payments. In reality, The Orchid did not have to make capital cost payments since Hess Microgen covers those costs and is compensated for them by receiving a portion of the site’s energy savings. However, the financial analysis of this report evaluates the financial cost and benefits of the DER system not the financial arrangements made by the proprietor and the energy developer. Table 33: Net Present Value and Payback Analysis for The Orchid
Site DER Project Cost ($)
DER Project Annual Benefit ($/year)
Net Present Value and Payback of project including grants received
Orchid’s estimates Unavailable due to confidentiality
$700,000 NA $2,900,000 estimate
NA
DER-CAM estimates $2,636,000 $732,000 $3,091,000 5 years 3.7 years with tariff increase
Since the DER project was designed utility rates have increased roughly 20%. This creates two different sets of costs and benefits: those for low and high tariffs. Since the benefit values provided from The Orchid are for the high (current) tariff rates any comparison between DER-CAM estimates and the site’s estimates is based on these higher tariff rates when possible. The initial DER-CAM study attempted to replicate the decision process at the initial stages of the project and hence relied on the low (older) tariff rates. This is one example of how tariff rate changes may affect the cost and benefits of a DER project from the time it is designed to the time it is in operating. These figures are displayed in Table 35 below. The costs and benefits from DER-CAM are with respect to Scenario 5.

Distributed Energy Resources in Practice
81
Table 34: Comparison of Costs and Benefits for The Orchid at Different Tariff Rates
Site Estimate at
Low Tariff DER-CAM Low Tariff ($0.16/kWh)
DER-CAM High Tariff ($0.19/kWh)
Base Case Utility Costs ($/year)
$1,333,000 (estimated based on site and DER-CAM)
$1,474,000 $1,700,000
DER System Annual Cost. ($/year) Including Capital and Operating Costs
$965,000 (estimated based on site and DER-CAM)
$1,278,000 $1,300,000
DER Project Benefit including capital cost ($/year)
$368,000 (estimated based on site and DER-CAM)
$196,000 $400,000
DER Project Benefit without capital cost ($/year)
$700,000 site’s estimated savings at current tariff rates
$528,000 $732,000
3.4.1.2 Engineering Analysis
There are significant heating (675 kW heat) and cooling (450 kWe) loads at the resort, to which waste heat from the propane generators can be applied. Recovered heat produces 1 MW (300 tons) of chilled water for air conditioning, domestic hot water at 50 °C (120 °F), kitchen hot water at 60 °C (140 °F), laundry hot water at 70 °C (160 °F), and hot water to maintain the temperature of the swimming pool at 30 °C (86 °F). The CHP system meets 75% of the resort’s electrical demand, 100% of its laundry hot water demand, 100% of its kitchen hot water demand, 50% of the resort’s guest room hot water demand, and 35% of its chilled water demand. One of the two original 840 kW (240-ton) Millennium Centrifugal chillers is being kept on-line to provide for the resort’s cooling needs unmet by the new absorption chiller. The other original chiller is maintained as a back-up. The original boilers used for producing hot water are also kept for backup, as is the original backup diesel generator. This provides the resort with three sources of electricity: onsite from propane, from the grid, and if the need arises, onsite from the diesel generator. The system is synchronous, but can island, i.e. the resort can generate electricity in parallel with the grid when the grid is operational and generate independently when the grid is down. The Orchid is currently installing a salt-water well that will provide cooling water that will be used in conjunction with heat exchangers, eliminating the need for the large cooling towers currently onsite. This will make available approximately 260 m2 of much needed space for on-site storage and workshop space. In addition, the resort’s water features will be converted to utilize the post-heat exchange water, reducing the need for fresh water at the remote site. Microturbines and fuel cell solutions were also considered for the site. Microturbines were thought to be too inefficient, to have a “prohibitively high” heat rate, to be too costly to maintain, to be an unproven technology, and to create too many siting issues related to noise and the high gas pressure

Distributed Energy Resources in Practice
82
requirements (minimum 41.36 kilopascals (60 psig), or else a compressor is required). Fuel cells were considered to be a cost-prohibitive developmental technology. 3.4.1.3 Utility Issues
According to Orville Thompson of The Orchid, Hawaii Electric and Light Company (HELCO), the local utility, has not been supportive of the Orchid’s switch to onsite generation. HELCO offered a PUC approved $100,000/year “customer retention discount” if the resort didn’t install onsite generation capacity. When The Orchid turned down the offer, HELCO increased their offer to $200,000/year. HELCO also created interconnection barriers and, according to Orville Thompson, proposed retroactive standby charges of $11.40/kW of onsite generation capacity (approved by Hawaii’s PUC). 3.4.1.4 Decision Making Software Tools, etc.
Hess Microgen employs a proprietary Energy Management and remote monitoring system. A detailed description of this system is unavailable at this time. 3.4.2 Description of Data Collection Process
Since Hess could only provide average yearly energy demand, energy load profiles for the hotel used in DER-CAM were estimated. DOE-2 was used to estimate the hourly electrical, thermal and cooling loads for a hotel of this size in its location. Due to restrictions in the DOE-2 model, California building codes and standard construction was used as a representation of the building codes for Hawaii, which is similar in its year round moderate temperatures. The DOE-2 results were scaled based on information from the resort, such as average yearly demand and the size of the cooling system. Hess was able to provide monthly data on electricity, heat, and cooling provided by the co-generation system. Electricity-only loads were scaled by a multiple of 0.62 and cooling loads were scaled by a multiple of 0.00021. It is not clear why the cooling load, in particular, is so far off actual data. It may have been due to the use of an inappropriate climate for Mauna Lani on the west coast of Hawaii. DOE-2 used Hilo, which is located on the east coast of Hawaii, as the climate, and east and western coasts of Hawaii have dramatically different climates. Another possibility for the difference in energy consumption estimates is a non-linearity problem within DOE-2. Because the size of the resort, 513,000 m2 (5,520,000 ft2), is 2.2 times larger than the default value for an average hotel, the results may be been inappropriately factored or increased exponentially within the model. Modeling The Orchid in the DER-CAM team version of DOE-2 illustrates the cautionary approach to DOE-2 results required: while they provide useful load-profile shapes, the relative values must be questioned. Total yearly energy cost for the resort was estimated from the quoted $200,000 yearly savings that constituted the guaranteed 15% savings from Hess. This suggested a total yearly energy expenditure of approximately $1.3 million. The difference between peak load and maximum average load was approximately 7.5% in the case of The Orchid after the loads were scaled. Table 35 lists the difference between these two types of load peaks for each month of the year. In the model for The Orchid, the demand charges were not

Distributed Energy Resources in Practice
83
increased as in other cases so it is estimated that DER-CAM underestimates the utility demand charges by about 7.5%. Table 35: DOE-2 Peak Verses Maximum Average for The Orchid
3.4.3 Assumptions of Modeling Process
Certain information was either considered confidential or not known by Hess Microgen and The Orchid. Hence, some assumptions were necessary to compensate for this unavailable information. • Because the 15% guaranteed savings was quoted as $200,000 per year, total yearly energy costs
were assumed to be $1,333,000. Neither the resort nor Hess Microgen would confirm this number.
• The load shapes for the DOE-2 hotel model were assumed to be correct and linearly scalable. • Although the HELCO tariffs suggest that the electricity rates were $0.12/kWh at the time The
Orchid’s installation decision was made, the Orchid and Hess Microgen quoted $0.16/kWh as the price they were paying for electricity at that time and $0.19/kWh at present. The $0.16/kWh was used as the standard for each of the six scenarios to best replicate the DER adoption decision. Model runs were also done using the current electricity prices to determine current savings on the past decision.
• In answering the questionnaire, The Orchid Resort quoted propane prices to be $9.95/GJ
($1.05/therm) at the time the decision was made to install DER, and currently $13.7/GJ ($1.449/therm). According to The Gas Company, The Orchid’s propane supplier, propane prices for the resort at the time of the installation were $12.9/GJ and dropped to $11.9/GJ once the resort had purchased over 102,195 GJ (or about 378.5 m3 or 100,000 gallons), or $1,318,315 of propane. Propane prices as quoted by The Orchid Resort were used in this analysis.
Month (weekdays) DOE-2 Peak Hourly Total Electric Load (kW)
Maximum Average Total Electric Load (kW)
Percent Difference (kW)
January 1252 1181 6% February 1253 1175 6% March 1314 1191 9% April 1352 1197 11% May 1341 1260 6% June 1381 1303 6% July 1430 1314 8% August 1406 1340 5% September 1433 1348 6% October 1416 1262 11% November 1327 1220 8% December 1313 1210 8%
Distributed Energy Resources in Practice
84
• Hess Microgen provided technology costs for 200kW reciprocating engine, 194 kW (55 ton) chiller, and per-ton cost for cooling towers, under agreement that these costs would not be published. These costs were extrapolated to determine the costs of other sizes of reciprocating engines as required by our model.
• The engines purchased by Hess for The Orchid are 200 kW diesel engines that have been
converted to run on propane. Propane engines are not a technology that has been considered in DER-CAM. To incorporate propane engines into the model, natural gas engine data previously used in DER-CAM was modified to represent propane engines. Engine costs were adjusted to match data provided by Hess. Heat rates for the natural gas engines were lowered by 5% (efficiency raised by 5%) based on a 5% variation in ideal efficiencies for the two engines (different compression rations). The details of these adjustments are described in Appendix M Orchid Natural Gas to Propane Engine Conversion.
• Treatment of grants in the model: It was assumed that The Orchid Resort did not receive any
grants for this project, as none were revealed during our discussions with The Orchid or Hess Microgen. Furthermore, according to the State of Hawaii Energy, Resources, and Technology Web site, there are no incentives available for on-site generation technologies other than solar and for certain high-tech business.38
3.4.4 Model Results
Results for the model runs for The Orchid are presented in Figure 28 and Table 36. Having determined that results from DER-CAM were in relative agreement with the estimates of the Orchid’s total yearly energy expenditure, a full set of DER-CAM runs was performed. A summary of results is presented graphically in Figure 28 below. Note that at the Orchid, any unmet cooling need is met through the electrically driven Millenium centrifugal chiller.
38 http://www.hawaii.gov/dbedt/ert/incentives.html

Distributed Energy Resources in Practice
85
Figure 28: Scenario Results for The Orchid

Distributed Energy Resources in Practice
86
Table 36: Scenario Results for The Orchid
CASE Technologies SelectedAnnual energy cost
Percentage of base case cost
Annual savings over base case
Electricity purchases
Propane purchases
Self generation costs
1: No Invest 1,474,339$ $ 1,304,144 $ 170,195 $ -
2: Unlimited Invest
2x 200 kW converted propane engine with CHP, 1 x 500 kW converted propane engine with abs. cooling 1,253,405$ 85% $ 220,934 $ 101,333 801,459$ $ 350,613
3: Unlimited Invest in converted propane engines
2x 200 kW converted propane engine with CHP, 1 x 500 kW converted propane engine with abs. cooling 1,253,405$ 85% $ 220,934 $ 101,333 $ 801,459 $ 350,613
4: Forced minimum investment in 200 kW converted propane engines with CHP and 200 kW converted propane engines with abs. cooling
3x 200 kW converted propane engine with CHP, 1x 200 kW converted propane engine with abs. cooling 1,273,867$ 86% $ 200,472 203,546$ 737,867$ $ 332,454
5: Forced duplication of site decision (2 x 200 kW engine w/ CHP, 2x 200 kW w/ abs. cooling)
2x 200 kW converted propane engine with CHP, 2x 200 kW converted propane engine with abs. cooling 1,277,673$ 87% $ 196,666 179,675$ 755,513$ $ 342,485
5: Forced duplication of site decision (1 x 200 kW engine w/ CHP, 3x 200 kW w/ abs. cooling)
1x 200 kW converted propane engine with CHP, 3x 200 kW converted propane engine with abs. cooling 1,310,159$ 89% $ 164,180 156,713$ 800,930$ $ 352,516
5: Forced duplication of site decision (3 x 200 kW engine w/ CHP, 1x 200 kW w/ abs. cooling)
3x 200 kW converted propane engine with CHP, 1x 200 kW converted propane engine with abs. cooling $ 1,273,867 86% $ 200,472 $ 203,546 $ 737,867 $ 332,454
Graphs displaying the daily average source (e.g. utility or DER) of electric or heating end-use loads for each day type and month may be developed from DER-CAM’s output. These daily consumption graphs for The Orchid’s electric-only, cooling, space-heating, and water-heating loads in January and July are presented in Appendix B. 3.4.5 Discussion of Results
A discussion of the results for the scenarios run for The Orchid, as well as a discussion of the sensitivity of these results to grants and rebates, the spark spread (gas prices relative to electricity prices), standby charges, and peak pricing vs. flat rates, are presented below. Dividing the total dollars spent on electricity in Scenario 1 by the number of kWh derives a flat rate for electricity purchased. The flat rate electricity analysis uses this rate for all kWh’s and sets the demand charge and standby charge to zero.

Distributed Energy Resources in Practice
87
The Scenarios: The Scenario 1 model (no investment) provided an annual energy cost of $1.5 million, with $1.3 million of electricity purchase. These values were in agreement with the rough estimate of $1.333 million costs derived from limited information provided by The Orchid and Hess Microgen. Further scenarios were examined after satisfactory results for Scenario 1 were obtained. In Scenario 2 (unlimited investment) and Scenario 3 (unlimited investment in propane engines), DER-CAM selected 900 kW of onsite generating capacity from propane engines, with CHP and absorption cooling, for an annual amortized cost of $1.25 million. These optimal results from DER-CAM are in close agreement with the actual decision made by Hess: 800 kW of capacity with CHP and absorption cooling. Scenario 5 (model same technology as site) with ¾ of the heat recovery being used for CHP and ¼ for absorption cooling raised the annual amortized cost a marginal $0.02 million. From these results, it is seen that DER-CAM and Hess made quite similar decisions. The Scenario 5 model run, however, shows savings over Scenario 1 of 14%. This is approximately the 15% savings that The Orchid is seeing, however, it is unclear where Hess profits in this project. The Sensitivities: Analysis of the sensitivity to gas price fluctuations (the spark spread sensitivity) reveals how utility pricing would influence decision making. For fixed electricity rates and propane prices slightly above the given rates (110%) to propane prices drastically below the given rates (50%), purchase decisions are mostly constant: 400 kW of CHP capable propane engines and 400kW to 500 kW of absorption cooling capable propane engines. However, as propane prices continue to increase slightly (120% of normal rate), absorption cooling no longer becomes economic, and less total generation capacity is selected. When propane prices are raised to 140%, only 300 kW of capacity are selected, and no generation capacity is selected after propane prices reach 180% of normal rates. These results are presented graphically in Figure 29 below.

Distributed Energy Resources in Practice
88
Figure 29: Spark Spread Sensitivity for The Orchid
Monthly standby charges have a similar affect as spark spread on installation decisions: as they increase, they first make generation with absorption cooling uneconomic (at $24/kW) and then gradually reducing the amount of generation with CHP that is economic. However, installation decisions do not change significantly for monthly standby charges from $0/kW to $20/kW. It is unlikely that standby charges would exceed $20/kW, as the $11.40/kW standby charge by HELCO is already quite high. This sensitivity shows that the imposition of large standby charges on The Orchid is an ineffective way to inhibit installation. These results are presented graphically in Figure 30 below.
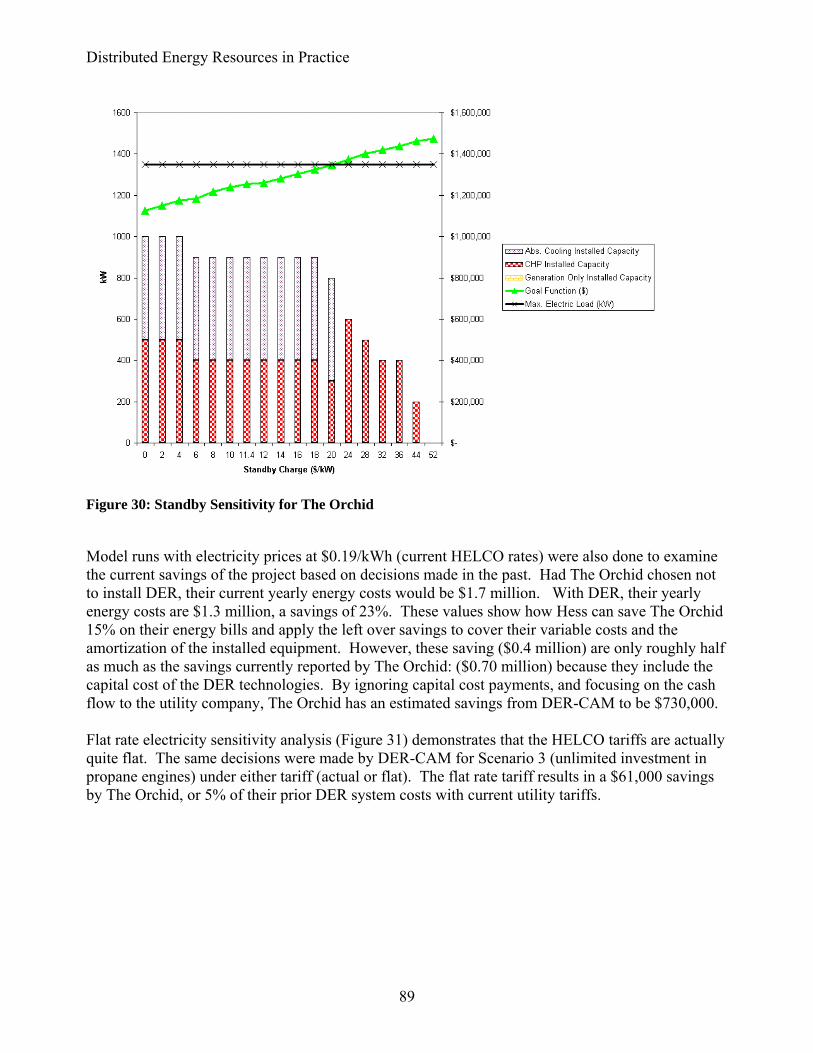
Distributed Energy Resources in Practice
89
Figure 30: Standby Sensitivity for The Orchid
Model runs with electricity prices at $0.19/kWh (current HELCO rates) were also done to examine the current savings of the project based on decisions made in the past. Had The Orchid chosen not to install DER, their current yearly energy costs would be $1.7 million. With DER, their yearly energy costs are $1.3 million, a savings of 23%. These values show how Hess can save The Orchid 15% on their energy bills and apply the left over savings to cover their variable costs and the amortization of the installed equipment. However, these saving ($0.4 million) are only roughly half as much as the savings currently reported by The Orchid: ($0.70 million) because they include the capital cost of the DER technologies. By ignoring capital cost payments, and focusing on the cash flow to the utility company, The Orchid has an estimated savings from DER-CAM to be $730,000. Flat rate electricity sensitivity analysis (Figure 31) demonstrates that the HELCO tariffs are actually quite flat. The same decisions were made by DER-CAM for Scenario 3 (unlimited investment in propane engines) under either tariff (actual or flat). The flat rate tariff results in a $61,000 savings by The Orchid, or 5% of their prior DER system costs with current utility tariffs.

Distributed Energy Resources in Practice
90
Figure 31: Flat Rate Electricity Sensitivity for The Orchid
3.4.6 Limitations of this Analysis
The lack of data from the site on the DER system cost, The Orchid’s electrical and thermal loads, The Orchid’s base case utility bills, and the expected financial savings from the DER system were the most prominent limitations in this case. The only data available at this site is the type of DER technologies installed, leading to estimates of the other necessary information. • No clear method for choosing which data to use when conflicting data is provided. The model is
reliant on the “best data available data” which for the purpose of replicating decision-making, is the data that was used by the decision makers at the time of the decision. The data provided by Hess Microgen and The Orchid Resort varied from that received from the local utilities.
• The model requires a solid base case to which the optimized base case can be compared to
understand the accuracy of all other cases. Hess Microgen required complete confidentiality for the release of their cost information to Berkeley Lab. This prevented the development of an accurate comparison point for the optimized base case analysis, and hence increases the uncertainty of the other scenario results for this test site.
• Cost data for the DER system installation, along with detailed energy cost and load data, were
unavailable due to the above confidentiality agreement.
Distributed Energy Resources in Practice
91
3.4.7 Observed Outcomes of Installed Technology:
Total savings have reached a reported $700,000 per year. The Hess propane fired reciprocating engines are operating as expected, but the absorption cooler has not been running according to original specifications (it has not been producing as much cooling as expected). The resort’s water temperature requirements have decreased due to a change in the resort’s operations. This decrease in water temperature requirements allows more high temperature water to reach the absorption cooler so that it is better able to meet the cooling needs of the resort. According to the resort, noise has not interfered with the guest experience. 3.4.8 Conclusions from The Orchid Resort Test Site Analysis
DER-CAM decisions for this site are in agreement with Hess decisions. However, savings estimates between the two vary. The Orchid and Hess provided only rough energy consumption estimates and their electrical and propane costs vary from those quoted by HELCO and The Gas Company. Therefore, it is unclear how close DER-CAM results are to actual savings. HELCO made a significant effort to halt the DER project at The Orchid. However, standby sensitivities show that imposing large standby charges on The Orchid is an ineffective strategy for discouraging DER at this site. Spark-spread sensitivity results suggest that electricity rates would have to be reduced by approximately 40% before DER becomes uneconomic for The Orchid. Orville Thompson believes that installing DER at The Orchid was the right decision to make, a strategy that is confirmed by DER-CAM.


Distributed Energy Resources in Practice
93
3.5 Case D: BD Biosciences Pharmingen
The BD Biosciences Pharmingen site (BD) in northern San Diego is in the process of installing two 150 kW natural gas reciprocating engines with CHP capability, to cover this biotechnology firm’s electricity load and the occasional space cooling needs of their manufacturing facility. The equipment is owned and operated by the developer Clarus Energy Partners. BD, a business unit of BD Biosciences (a Fortune 500 company), is a biotechnology company producing products for immunology, cell biology, neurosciences, molecular biology, and protein expression systems. Primarily, the company manufactures protein-based re-agents for the life sciences research industry. BD is the fourth largest biotechnology employer in San Diego. BD Biosciences operates multiple sites in the US, with buildings ranging from administrative offices to manufacturing sites to warehouses. This San Diego site consists of two buildings: one is dedicated to administrative office space and R&D, and the other, 10995 Torreyana Road, is a manufacturing facility. At the later site, a 3,700 m2 (40,000 ft2) manufacturing facility, Clarus Energy is installing two 150 kW natural gas fired reciprocating engines with CHP to cover the building’s base electrical load and thermal requirements. The climate at the site is very moderate (average yearly high and low temperature are 20 °C (70 °F) and 14 °C (57 °F) respectively). Due to its close proximity to the Pacific Ocean, this location typically experiences fog for at least a few hours a day. Consequently, the outside temperature is often below desired indoor temperature. In addition, BD must constantly flush out the building air and bring in new, fresh air from outside due to chemical use at the site. For health and safety reasons, this procedure continues 24 hours a day (even though most manufacturing occurs from 9 am to 5 pm). As a result, heating is required almost all year round and around the clock (the facility must remain within a narrow temperature range to preserve its chemical supplies and products).
Figure 32: BD Biosciences Pharmingen, Torrey Pines, California

Distributed Energy Resources in Practice
94
Headquartered in San Diego, Clarus Energy Partners, L.P. provides electricity to energy-intensive businesses, promising higher reliability of electricity delivery and lower average costs. Clarus Energy is acting as an “alternate utility” to BD by providing them with electricity and heat for a $/kWh price via a generation facility on the site. BD was chosen as a test case for this research project due to the size of the installation (multiple generation units falling between 5 and 500 kW each), the use of CHP, and that they are a private industrial business making their onsite energy generation decisions for financial reasons. 3.5.1 The Decision-Making Process:
BD decided to consider distributed generation to reduce costs and increase power quality and availability. At the time, BD believed that they were facing rising energy costs and sought options to mitigate this price risk. They did not, however, want to increase their exposure to operation, maintenance, or capital expenditure risks that accompany ownership of generation facilities. BD sought to continue only to buy electricity, as if from a utility. BD had been experiencing an average of ten electrical outages a year, lasting from one minute to 14 hours each. Some outages had been scheduled (though occasionally lasting up to eight hours longer than scheduled), while others were due to construction mishaps or weather related damage. Rolling blackouts were becoming a more frequent cause of outages. While BD does have backup diesel generation for critical loads (such as refrigeration), this generator is not large enough to maintain manufacturing schedules and can generate at full power for only up to twelve hours on a full tank. In the event of an earthquake or fire, their contracted diesel fuel provider may not be able to reach the facility to re-fill the tanks, creating a 12-hour limit on reserve power. In fact, they have already experienced a scheduled outage that lasted 14 hours. BD faced four significant barriers to the decision to install DER technologies: 1. Structure of the contract. BD wanted to decrease energy bills without increasing their exposure
to risk, and so looked to a third party to provide energy services. The challenge came when they discovered that the typical contract contains minimum usage and increasing usage guarantees. For example, an energy contract may stipulate that the customer must consume at least 500 kW of electricity – this would be their base – and that this base must increase by a certain percentage each year. These stipulations are included to protect the energy developer against operating cost and fuel price risk. This type of agreement was unacceptable to BD, which is actively working to decrease its energy use and energy intensity.
2. Lopsided Demand Profile. Most developers seek customers who run their operations 24/7 and who have constant energy loads in order to minimize the levelized energy cost of the DER equipment they install. BD’s manufacturing operation at the site runs only one shift and has a base demand of only one half of their peak.
3. Small size of project. Most developers seek larger projects, where margins and profits can be larger. At 300 kW, BD was having a difficult time finding a developer interested in their project.
4. Resistance from Internal Decision-Makers. As project instigator and champion, Bob Schultze had to convince the internal decision-makers that this was the best course of action. It is easier, they claimed, to blame the utility than themselves for outages. Also, it was believed to be

Distributed Energy Resources in Practice
95
preferable to suffer the same rate increases as the competition and to float costs to these electricity prices rather than to risk paying more for electricity than their competitors. Additionally, the proposal to sign a contract for electricity in an off balance sheet transaction raised some ethical concerns.
Clarus Energy was the only company willing to provide BD a contract that matched their demands. According to Bob Schultze, the minimum-use guarantees in the contract are so low that no matter how energy efficient their operations become, they will not have a problem meeting the minimum standards. In addition, escalation fees were minimized by tying usage increases only to the escalation of natural gas prices (mitigated by Clarus Energy’s long-term purchase contracts), not to operating costs or to maintenance costs. Based on the low minimum guarantees and the minimized escalation factors of the Power Purchase Agreement (PPA), BD pays for only the energy they use and not an artificially and contractually driven increasing amount. By downsizing the onsite generation capacity, BD was able to work around the lopsided demand profile barrier. They now sought a system that could provide their 300 kW base load 24/7. This contributed to barrier number three, in that their project was now even smaller. Clarus Energy was willing to work with them, in part because of the potential for follow-on projects at BD Biosciences’ other sites. Bob Schultze championed the project on multiple fronts: energy savings, corporate responsibility, power reliability, and the environment. He staked his reputation on the validity and accuracy of the cost numbers and the expected increase in reliability. Ultimately, the decision to install onsite generation with CHP was approved. 3.5.1.1 Economic Analysis
BD’s economic incentive for this project was to stem the increasing costs of energy and to reap the benefits of a more reliable and available energy supply. An in-house conservative estimate based on stable energy prices, shows them saving $70,000/year on their $315,000 yearly energy bill. Based on their experiences with the San Diego rate shocks, they are counting on future rises in energy costs to increase these savings (estimated by BD to reach $120,000/year).39 Figure 33 shows that over a seven-year period (the length of the contract with Clarus Energy), BD determined that, at the then-current rates, they would save at least $434,000 on total utility expense (electricity and gas), under their Power Purchase Agreement with Clarus Energy, at maximum escalation rates. If rates had increased by $0.02/kWh as the California Public Utility Commission had proposed, BD’s savings would have almost doubled to $813,000. Even if rates went down to pre-deregulation levels ($0.08/kWh used by BD in this analysis), they would break even as long as rates didn’t drop earlier than 32 months after equipment installation. Thus, their rate exposure was limited to fewer than three of the seven years. BD hasn’t yet quantified the benefits of not having to shut down their manufacturing line due to power outages, but doing so would only increase the potential payback from this project.
39 Electricity rates from SDG&E more than tripled after deregulation beginning in July 2000. The San Francisco Chronicle has a website dedicated to the California Energy Crisis: http://www.sfgate.com/energy/

Distributed Energy Resources in Practice
96
Figure 33: Cumulative Energy Expense Projections from BD Biosciences Pharmingen
When proposing on-site generation to BD, Schultze decided to ignore the financial benefits of thermal load savings. This was to keep the argument simple, and also because his experience suggests that getting all parties to agree on the value of thermal loads is often difficult. Instead, Schultze presented the straightforward argument that onsite generation of electricity is cheaper to BD than purchasing grid electricity. Reliability increases and reduced energy consumption due to CHP aside, he was able to present a winning economic argument in favor of on-site, distributed energy generation. Figure 34 presents the annual cost estimates disaggregated by utility gas and electric, and power purchase agreement. Table 37 lists the benefits, NPV, and payback for the project with the grants received. This project, by meeting the CPUC standards for a level three qualifying co-generation facility (see Table 15 for a description of the CPUC standards for a level three QF) received the Self Generation Rebate of 30% of project costs and is exempt from standby charges.

Distributed Energy Resources in Practice
97
Figure 34: Aggregated Yearly Energy Cost Estimates from BD Biosciences Pharmingen
Table 37: Net Present Value and Payback Analysis for BD Biosciences Pharmingen
Site Project Cost
If CPUC QF: Project Rebate Max %
Project Costs after Rebate
DER Project Annual Net Benefit ($/year)
Net Present Value including rebates received
Simple Payback Period (years) for BD Biosciences Pharmingen
Simple Payback Period after Rebate (years) for Clarus Energy
BD Biosciences Pharmingen
Confidential $112,500 NA $ 70,000*
$ 555,000 1
NA (estimate 2.5 for project)
DER-CAM Confidential $112,500 NA $ 68,000
$ 506,000
3 years for DER project
* As reported by site. This value includes the payments to cover capital costs. 3.5.1.2 Engineering Analysis
Currently, BD’s manufacturing facility in San Diego has a 300 kW base electricity demand, a 600 kW peak, and has a peaky demand profile due to its nine-to-five manufacturing schedule. A 4 million kJ (4 Mbtu) capacity boiler is use for space heating. Two 0.55 MW boilers provide medium pressure steam to meet the facilities hot water needs. The site has a 350 kW diesel backup generator for critical loads, with twelve hours of diesel fuel storage. Backup diesel power is sufficient to cover

Distributed Energy Resources in Practice
98
critical loads, such as refrigeration, but is not sufficient to keep the manufacturing facility operating. Diesel storage presents a potential upper limit to backup generation, since despite supplier contracts to provide filling services as frequently as needed, in a large-scale disaster, diesel delivery may be impossible. Utility power availability has been faulty, with outages that range from one minute to fourteen hours, and occurring about ten times a year. Reasons for power outages include: • Construction: scheduled down time for construction and upgrades, • “Find-it-when-you-hit-it” accidents, • Fires, • Rolling blackouts, and • Random outages. In the summer of 2002, Clarus Energy installed two 150 kW natural gas induction generators manufactured by Coastintelligen. Having two smaller generators instead of one large generator reduces the risk of an entire system failure and minimizes the demand charges associated with such a failure. Maintenance will be done during off-peak hours to avoid large on-peak demand charges (and as required under the CPUC Self-Generation Rebate Program agreement). The generators have load following capability (they vary electrical generation with the demand of the site). The generators are in parallel with the utility and the mechanical equipment, to avoid any over generation of electricity and possible supply to the grid, thereby avoiding net-metering issues. Excess heat captured from the generators is used in the building-heating loop. Due to the requirement to circulate fresh air continuously into the building and the moderate climate of San Diego, the building needs continuous heating except during the hottest summer days. For the same reasons, there is only a minimal air-cooling load for the building. This cooling load was not significant enough or consistent enough to warrant the implementation of absorption cooling to make use of waste heat from the installed engines. Microturbine and photovoltaic (PV) systems were considered for the site as well. In comparing microturbines to natural gas engines, Clarus Energy favored the low cost and perceived higher reliability of natural gas engines over microturbines. Although Clarus Energy felt that reciprocating engines have higher maintenance costs (based on the scheduled maintenance required to obtain higher reliability), they are still more efficient and economical than microturbines. PV was quickly eliminated from consideration on the grounds that the Torrey Pines site gets at least some fog cover 80% of days. 3.5.1.3 Utility Issues:
San Diego Gas and Electric (SDG&E) did not pose any barriers to this project, and while Clarus Energy saw some delay on the part of the utility involving the delivery and configuration of metering technology, the relationship has been quite smooth to date. Due to the site’s self-generation qualifying status, SDG&E did not impose standby charges.
Distributed Energy Resources in Practice
99
California is one of the first states to have adopted interconnection standards for self-generating facilities. As such, SDG&E is enforcing Rule 21, Interconnection Standards for Non-Utility Owned Generation, which has been updated (in December 2000) to specify standard interconnection, operating, and metering requirements of DER operators. The required protective functions (such as voltage and frequency sensing equipment), circuit breakers and other interrupting devices, and other protective equipment required under Rule 21, add cost to the project. 3.5.1.4 Decision-Making Software Tools, etc.
Using proprietary software, Clarus Energy performed an analysis of the benefits to BD that included a look at the site’s thermal requirements, TOU data to determine demand and consumption, and a recalculation of energy bills at current rates. Once Clarus Energy had determined that they could provide BD electricity at a lower $/kWh price than the utility, they performed a more detailed an on-site analysis to further determine physical and logistical feasibility.
3.5.2 Description of Data Collection Process
Mr. Schultze provided detailed graphs on historic electricity use, electricity peak demand, average monthly electric rates, natural gas use, and natural gas rates. He provided electric demand profiles for their facility for the months of February through June 2001. From this information, overall electric loads could be directly generated and overall natural gas loads could be generated by multiplying gas use by a factor of 0.8 (to represent an estimate of efficiency of conversion from point of consumption at the meter to the load). Mr. Schultze also provided cost projections generated for internal presentation. The graphical information provided by Mr. Schultze is included in Appendix N. Cooling loads were approximated using information from the overall electric load data. Monthly electric load profiles were consistent from November through May. It was assumed that no air conditioning was done during these months. These months were then used as a base that was subtracted from the remaining months. The remainder was taken as the cooling load during the months of June through October. This estimation required the assumption that other electrical loads didn’t vary by season. Due to the competitive bidding nature of their business, for this report Clarus Energy was not able to provide equipment costs, turnkey costs or the $/kWh price they are charging BD. Therefore, assumptions have been made that the technology and implementation costs previously developed for DER-CAM, and updated with information collected from other sites studied for this project, are representative of the costs Clarus Energy is experiencing. 3.5.3 Assumptions of Modeling Process
The following assumptions were needed to make the transition between available data and the data necessary for performing an analysis in DER-CAM. • According to Clarus Energy and BD, this project qualified for the CPUC Self-Generation
Rebate (see Section 2.9 for a description of the rebate program). Based on the CPUC program criteria, this was assume to be a Level 3 project, and as such to qualify for a rebate as described

Distributed Energy Resources in Practice
100
in this report in Section 2.9.1, CPUC Self-generation Incentive Program, : (for natural gas engines with heat recovery, 30% of project costs). Project costs for competing technologies considered in the model that, if implemented at the site, could qualify for rebates were also discounted by the appropriate rebate (see Table 15).
• BD provided detailed hourly electrical demand profiles for the period of February 2001 to June 2001 (see Appendix N). From this data hourly electricity demand profiles were extrapolated for the remaining months of the year.
• BD provided monthly natural gas use from October 1999 to July 2002. From this information, from local climate data, and from descriptions of the business and heat use, hourly thermal loads were estimated.
3.5.4 Model Results
Note: The natural gas engine data used for analyses in this report was collected by the LBL DER team based on specification sheets for a sampling of natural gas engines on the market. It was later learned that the natural gas engines considered and purchased by Clarus Energy from Coastintelligen were significantly more efficient that those represented in DER-CAM. Although discovered after the writing of this report, a separate report looks at the BD Biosciences Pharmingen project in more detail and includes DER-CAM results using modified natural gas engine electrical efficiency data to match that of engines offered by Coastintelligen. That report is titled A Business Case For On-Site Generation: The BD Biosciences Pharmingen Project. Please refer to Appendix T for a comparison of results with updated natural gas engine efficiency data. The results from the initial study and natural gas engine efficiency data are presented in this section.

Distributed Energy Resources in Practice
101
These results from the DER-CAM runs are presented in Figure 35 and Table 38 below.
Figure 35: Scenario Results for BD Biosciences Pharmingen

Distributed Energy Resources in Practice
102
Table 38: Scenario Results for BD Biosciences Pharmingen
CASETechnologies Selected
Annual energy cost
Percentage of base case cost
Annual savings over base case
Electricity purchases
Natural gas purchases
Self generation costs
1: No Invest 333,733$ $ 273,085 $ 60,648 $ 0
2: Unlimited Invest
1x 500 kW nat. gas engine with CHP 233,886$ 70% $ 99,847 $ 1,707 160,477$ $ 71,702
3: Unlimited Invest in nat. gas engines
1x 500 kW nat. gas engine with CHP 233,886$ 70% $ 99,847 $ 1,707 160,477$ $ 71,702
4: Forced minimum investment in 150 kW nat. gas engines (gen. only)
3x 150 kW nat. gas engine 275,710$ 83% $ 58,023 64,481$ 144,043$ $ 67,186
4: Forced minimum investment in 150 kW nat. gas engines with CHP
3x 150 kW nat gas engine with CHP 258,495$ 77% $ 75,238 $ 32,842 160,516$ $ 65,137
4: Forced minimum investment in 150 kW nat. gas engines (gen. Only) and 150 kW nat. gas engines with CHP
1x 150 kW nat gas engine, 2x 150 nat. gas engine with CHP 261,109$ 78% $ 72,624 32,842$ 160,521$ $ 67,746
5: Forced duplication of site decision: 2x 150 kW nat. gas engines with CHP
2x 150 kW nat gas engines with CHP 266,162$ 80% $ 67,571 66,614$ 150,735$ $ 48,813
Graphs displaying the daily average source (e.g. utility or DER) of electric or heating end-use loads for each day type and month may be developed from DER-CAM’s output. These daily consumption graphs for BD’s electric-only, cooling, space-heating, and water-heating loads in January and July are presented in Appendix B: Summary of Results. 3.5.5 Discussion of Results
A discussion of the results for the scenarios run for BD Biosciences Pharmingen, as well as a discussion of the sensitivity of these results to grants and rebates, the spark spread (gas prices
Distributed Energy Resources in Practice
103
relative to electricity prices), standby charges, and peak pricing vs. flat rates, are presented below. Dividing the total dollars spent on electricity in Scenario 1 by the number of kWh derives a flat rate for electricity purchased. The flat rate electricity analysis uses this rate for all kWh’s and sets the demand charge and standby charge to zero. The Scenarios: Replicating the site decision (Scenario 5) results in savings of 20% of the no-invest scenario (Scenario 1), while increasing the installed capacity to 500kW increases savings to 30% of base case. If DER is not installed, BD would be more sensitive to electricity prices (82% of yearly energy costs) than in the unlimited installation choice in Scenario 2, where they are seen to be more sensitive to natural gas prices (68% of yearly energy costs). This sensitivity is based on the percentage of total energy costs accounted for by electricity vs. natural gas. The Sensitivities: In the spark spread range presented in Figure 36 below, from 14.3 (where gas costs are decreased by 50% relative to the price of grid electricity) to 3.6 (where gas costs are increased by 200% relative to the price of grid electricity), the relative price of natural gas as compared to the price of electricity does not have an effect on the level of CHP installed capacity. A flat rate electricity tariff encourages less installation, deceasing by 30% (330 kW instead of 500 kW for current tariff structure), as represented graphically in Figure 37 below. BD would no longer have the incentive to install additional capacity to meet the peak demand from the electric-only and cooling loads which peak during the day. See Appendix K for BD’s load profiles.

Distributed Energy Resources in Practice
104
Figure 36: Spark Spread Sensitivity for BD Biosciences Pharmingen

Distributed Energy Resources in Practice
105
Figure 37: Flat Rate Electricity Sensitivity for BD Biosciences Pharmingen
Standby charges of $4/kW and less do not affect the level of CHP capacity installed. CHP capacity installed decreases as standby charges rise above $4. Installed capacity gradually decreases as standby charges increase. DER becomes entirely uneconomic when standby charges exceed $28/kW. Standby charges near $4/kW are not unreasonable: SDG&E can have a significant influence on DER implementation via standby charges. However, qualifying facility status would exempt DER adopters from standby charges.40 The results of the standby sensitivity are presented in Figure 38 below. This graph shows a decreasing investment, as expected, as standby charges increase. What is surprising from these results is the high level of standby charge required before DER is no longer cost effective. Also of note is the sharper rate of increase in yearly energy costs after the site begins to reduce DER capacity at a standby charge of $6/kW.
40 Being a Qualifying Facility (QF) makes a site eligible for the time of use (TOU) schedule AL-TOU-DER, which is the same schedule as AL-TOU (the general TOU schedule) except that it excludes the standby charges defined in Schedule S. Accepting the QF schedule, however, subjects that site to a charge larger than the demand charge should their self-generation capacity be compromised and the full electricity load of the site be drawn from SDG&E. For tariff schedules, see: http://www.sdge.com/tariff/

Distributed Energy Resources in Practice
106
Figure 38: Standby Charge Sensitivity for BD Biosciences Pharmingen
Sensitivity to CPUC rebate incentives: BD was eligible for a CPUC rebate up to 30% of project cost for a total rebate of $112,500 (see 2.9.1). Removing the available California rebate increases optimal yearly energy costs from $230K to $270K, an increase of 15%. Installed capacities drops from 500 kW to 330 kW if the current subsidies are removed. Despite the difference in installed capacity, there is only a small difference in total electricity generation for the two scenarios: without the rebate, 1.76 GWhe are generated on site, and 1.82 GWhe are generated onsite with the rebate. This suggests that project cost rebates may encourage installation of DER technologies rather than the production of energy. This capacity may be used to reduce peak loads rather than as a substitute for grid energy. This result has interesting implications for policy designed to direct money toward either reducing grid congestion and peak load reduction or reducing total energy consumption and reliance on the grid. 3.5.6 Limitations of this Analysis
BD and Clarus Energy were reluctant to provide financial information that may provide their competitors with information on their operations and facilities. Furthermore, the project is ongoing and this results in dual goals of attempting to model estimated costs and actual costs. • The BD project is subject to changing project costs as delays and re-works add cost to the
project. The model, at best, can only be as good as the information provided. Since the site provided estimates of complete project costs, it is difficult to validate the model against actual

Distributed Energy Resources in Practice
107
costs. Hence DER-CAM results are subject to inaccuracies in modeling projects that are not yet complete.
• The model requires complete project and operating costs, as well as a prediction of future fuel
costs. The technology has not yet been fully installed and project costs are not yet available, and future energy costs can only be estimated based on past costs.
3.5.7 Observed Outcomes of Installed Technology
The DER system became operational in October, 2002. The system has been 99% reliable (October 2002 through December 2002) and has performed as expected. Clarus Energy provided the performance summary of Table 39. Table 39: System Performance Data Provided By Clarus Energy
BD Bioscience Annual FERC Efficiency Summary
Fuel Gas Total Waste Heat Waste Heat Used Engine Heat Rate FERC Eff.
Total kWh Therms Therms Therms BTU/kWh %
October 124,167 13,384 5,018 3,367 10,779 44.3%November 131,784 14,387 6,371 3,947 10,917 45.0%
December 129,797 16,439 7,489 5,587 12,665 44.0%
Total 385,748 44,210 18,878 12,901 11,461 44.4%
Note: "Total kWh" comes from the SDG&E generator output meter. It is total kwh generated minus the parasitic loads." Fuel Gas" comes from the SDG&E gas meter. "Fuel Gas" is the total amount of fuel gas supplied to the generators. " Total Waste Heat" and "Waste Heat Used" come from the on board monitoring system.
3.5.8 Conclusions from BD Biosciences Pharmingen Test Site Analysis
Based on the results from this case study, the San Diego area is a good location for DER projects when sites have a significant base load and use for waste heat. Robustness of installation capacity to spark spread variations suggest that electricity is significantly overpriced, making DER an economically attractive decision.


Distributed Energy Resources in Practice
109
3.6 Case E: San Bernardino USPS Handling Facility, Redlands, California
The San Bernardino United States Postal Service (USPS) mail sorting facility has decided to install a 500 kW natural gas generator. Feasibility studies of CHP and absorption cooling applications are currently underway. The San Bernardino site processes mail for a 100,000 km2 area surrounding San Bernardino, California. Machines systematically sort mail by type and size, read addresses, apply bar codes labels, and sort mail by region and location. Mail is collected during the day; the majority of the mail is processed during the evening and early morning hours. Power for air conditioning up to 400 kWe (summer evenings) is required to offset the heat generated by the processing machines. Processing machines handle 30,000- 40,000 pieces of mail per hour and can generate up to 20 kW of heat per machine. The facility handles up to 2 million pieces of mail per day. Mail handling equipment is standard in the USPS, although the size of individual handling facilities varies according to the quantities of equipment required to handle a particular regions mail. The San Bernardino site is comprised of a 25,000 m2 single story main building and a 7,000 m2 single story annex. The main building also houses a small amount of office space for the site’s administrative operations. Several energy efficiency improvements have been implemented at the site. The lighting in the facility has been upgraded to T8 fluorescents and high-pressure sodium (installed by Southern California Edison). Day-lighting windows have been installed in the roof. The roof has been painted white to reduce the cooling load of the building. The capital cost of the lighting efficiency improvements were paid for by SCE, and they recover their costs by an additional charge on San Bernardino’s utility bill. Distributed generation was attractive to the facility because of a desire to offset the cost of planned and unplanned utility power outages. Project feasibility was aided by incentives offered by DOE and their natural gas utility’s (Southern California Gas Company) willingness to provide the capital for the project in exchange for increased natural gas rates. The facility has previously benefited from utility-provided capital during California energy deregulation times when their electric utility, Southern California Edison (SCE), installed energy-efficient lighting in the facility in exchange for an eight-year contract. The San Bernardino USPS was chosen as a test case study for this research for the following reasons: • Industrial operations, • Atypical load profile (evening/night peak), • Significant year round cooling loads attractive for absorption cooling, and • Chosen generation capacity: 500 kW.

Distributed Energy Resources in Practice
110
Figure 39: San Bernardino USPS, Redlands, CA
3.6.1 The Decision Process:
The San Bernardino USPS cannot afford down-time. Maintenance manager Steve Szychulda said that even an hour without electricity would be too much. Concerned about utility reliability due to increasing frequency of blackout alerts and the utility’s financial crises, the facility was interested in generation capability of its own. The Department of Energy (DOE) was offering assistance for USPS DER implementation, which has provided for the engineering analysis currently underway. Since San Bernardino USPS lacked the capital required to install DG, creating a partnership with Southern California Gas Company created a win-win situation: the utility will sell more gas (the natural gas load for the generator will replace the electric load), and the San Bernardino USPS will lower their energy bill while increasing their reliability for 500 kW of critical load. The reliability is increased because the natural gas generator can provide electricity during electric utility outages. A 500kW natural gas reciprocating engine has been selected as the DG technology. Feasibility studies regarding the use of residual heat are still in progress. Initially it was determined that the waste heat from the engine was not worth recovering. Later, utilization of waste heat for absorption cooling in the annex was determined to be beneficial. Most recently, utilization of waste heat for heating needs is being considered. Szychulda was enthusiastic about the project after visiting similar, successful projects: a diesel generator in the Ontario, CA United Parcels Service (UPS) facility and a natural gas engine (with CHP) in the Mount San Antonio hospital in Upland, CA. Szychulda perceived the natural gas engine as a reliable, proven technology that is simple to maintain and fix. He was confident about installing a reciprocating engine CHP system at USPS after seeing these others in operation. The

Distributed Energy Resources in Practice
111
facility’s ample roof area and the large amount of solar insolation characteristic of the eastern California desert invite the consideration of photovoltaics (PV). Szychulda had a negative attitude towards PV that was shaped by the poor performance of the Rancho Mirage, CA USPS PV project (1987) and general skepticism about large-scale PV projects. 3.6.1.1 Economic Analysis
Current annual electric bills at the facility are near $1.3 million. The Southern California Gas Company prepared a study of the project and report average annual savings of $75,000 for electricity generation only, or $159,000 for electricity and absorption cooling. This is based on twenty-year lifetime of the project. In either case, the projects pay for themselves in three to six and a half years. Table 40 presents the DER project cost, the annual benefits (without capital cost), and the net present value and payback of grants. Table 40: Net Present Value and Payback for San Bernardino USPS
Site DER Project Cost
($) DER Project Annual Benefits ($/year)
Net Present Value and Payback of project including grants received
San Bernardino US Postal Service DG only
$480,000 $75,000 $115,000 6.4 years
DER-CAM DG only
$480,000 $218,000 $1,246,000 2.2 years
SB USPS with absorption cooling
$680,000 $159,000 $582,000 4.3 years
DER-CAM absorption cooling
$680,000 $304,000 $1,730,000 2.2 years
3.6.1.2 Engineering Analysis
There is a 600 kW base electric load at the site and a 1600 kW peak load. Peak loads occur in the evening and night, when most of the processing equipment is running (and cooling is required to offset thermal output of the equipment). There is currently no backup generation on site. No minimum needs assessment has been made, nor has the cost of a power outage been estimated. The load profiles for USPS are presented in Appendix K. Natural gas heating loads are minor. For example, electric point-of-use water heaters provide hot water and the handling machines generate enough heat that even in the winter, there is a space cooling load rather than a space-heating load. The only significant heating load is space heating of the administrative offices. Air conditioning in the main building is handled by two 1.2 MW (350 ton) chillers (250 kWe at rated load). These chillers were installed in February 2002 to replace a less environmentally sound cooling system. The cost of the chillers was provided by USPS headquarters, rather than at the

Distributed Energy Resources in Practice
112
facility level. Purchase and installation was done prior to a DER decision because the facility did not want to risk losing this funding by delaying purchase. By doing so, however, the facility risks not attaining qualifying facility (QF) status and not being eligible for the SELFGEN rebates if the residual heat from the DER equipment cannot be used for additional cooling or space heating. Since the headquarters’ funding was larger than the financial benefits that could be obtained by utilizing more residual heat with an absorption chiller and applying for SELFGEN funding, this was acceptable. The installation of new electric chillers eliminates the consideration of absorption cooling of the main building. In the annex, four 141 kW (40 ton) chillers (28 kWe at rated load) meet the cooling load. These chillers have not been replaced by more environmentally sound chillers. Absorption chilling for the annex has been considered for the DER project. Most water heating is done with point-of-use electric heaters. There are two 2.1 GJ (2 Mbtu) boilers. Only one is in operation, used mainly for space heating in the administrative parts of the main building. The facility is considering installing a 500 kW natural gas reciprocating engine, possibly in conjunction with 564 kW (160 tons) of absorption cooling (with natural gas used to supplement recovered heat). Costs for the electricity-only project and the combined electricity and absorption-cooling project are estimated at $450,000 and $625,000 respectively. 3.6.1.3 Utility Relationship
The San Bernardino USPS site is served by electric and gas utilities that are independent of one another and to some degree compete to meet customers’ energy needs. The gas utility’s proposed project would take away business from the electric utility. San Bernardino USPS received good cooperation from the gas company. It is questionable whether such utility cooperation would occur if the area were served by a joint gas and electricity utility. 3.6.1.4 Decision Making Software Tools, etc.
At time of this study, preliminary system analyses had been carried out by Southern California Gas Company. 3.6.2 Description of the Data Collection Process
The report prepared by Southern California Gas Company entitled “Evaluation of Proposed On-Site Power Generation Installation” contained electric load data and electricity cost data summarized from utility bills. The time-of-use (TOU) data were used as a basis for generating hourly loads. Load profiles were generated based on building operation estimates given by Szychulda and were adjusted to match the TOU data. Starting in May, 2002, several California USPS sites have had their electric meters monitored (and sub-metered in some cases), with daily load profiles and other statistics available to certain parties. These profiles were obtained and were in agreement with the generated profiles. Operation logs have been kept for the new electric chillers (in the main building) since their installation in February 2002. Operation levels in the form of percentage of rated electric current of

Distributed Energy Resources in Practice
113
the coolers were recorded every two hours each day (see Appendix O). From these data, electric cooling loads for the main building could be determined. Cooling loads were scaled to include the additional cooling required by the annex. Cooling loads for months not included in the chiller data were assumed, based on a compilation of existent cooling load profiles, yearly weather data, and yearly facility operation information. Hot water heating is included in the electric load data due to the point-of-use heaters. Space heating is rarely required in the main building in annex because of the large thermal generation of the processing equipment. The administrative offices, however, do require space heating. DOE-2 was used to simulate an office building in region of San Bernardino, California, and these space-heating results were used in DER-CAM. Project costs for the scenarios of electric generation only and electric generation with absorption cooling were estimated. These project costs were used to modify DER-CAM’s natural gas reciprocating engine costs. 3.6.3 Assumptions of Modeling Process
• Rebates for DER projects were included in capital costs in accordance with the CPUC rebates described in Section 2.9.1. Incentives were included only for absorption cooling DER projects for this site and not for CHP projects: the small heating loads of the site would not make the system’s overall efficiency high enough to be a qualifying facility.
• The DER-CAM analysis did not consider the reluctance of the facility to purchase an absorption chiller for their main building (see Section 3.6.1.2: Engineering Analysis). The cooling load was modeled as if the entire load was available for absorption cooling despite the recent installation of an electric chiller at the facility. DER-CAM assumes that an absorption chiller must be purchased when it selects absorption chilling but in reality this system would be redundant (but perhaps still cost effective). The cooling loads in the main building could have been translated into electric-only loads for the purposes of DER-CAM to represent the site’s hesitation to buy absorption chillers after recently installing new electric chillers.
• Installing DER would not cause the facility to be moved to a new tariff structure. 3.6.4 Model Results
Several DER-CAM results could be checked against data provided by the Southern California Gas Company. Table 41 summarizes the comparable results.
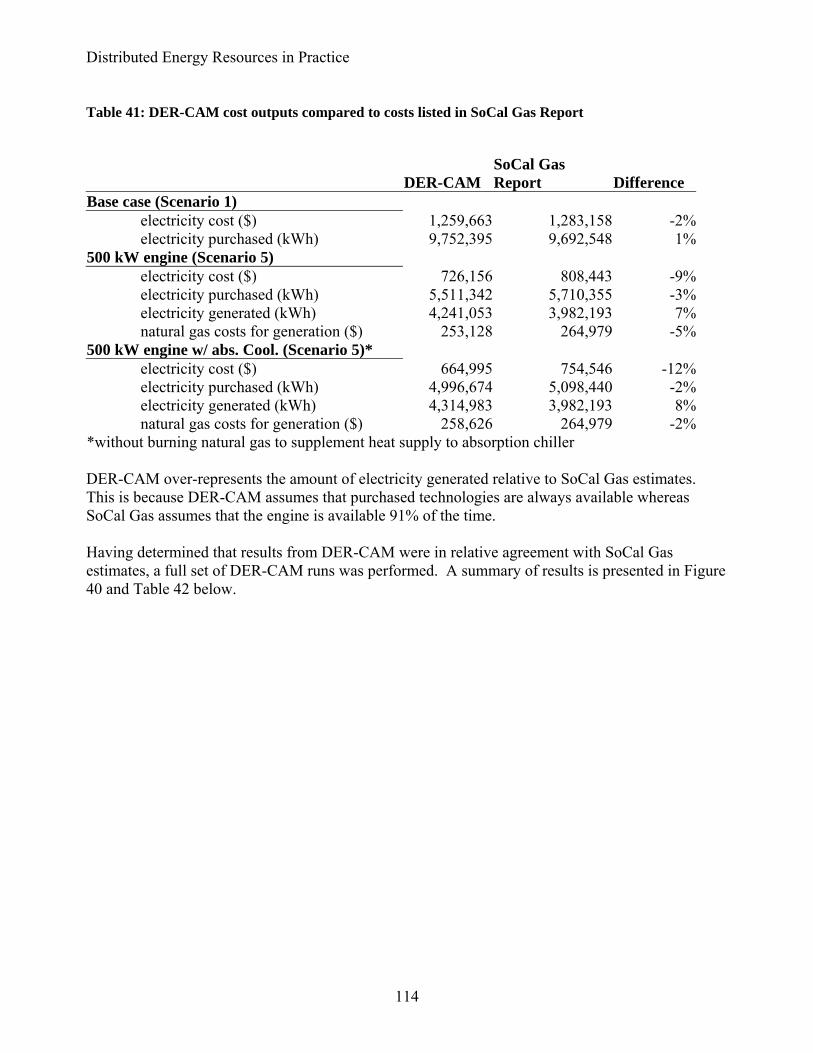
Distributed Energy Resources in Practice
114
Table 41: DER-CAM cost outputs compared to costs listed in SoCal Gas Report
DER-CAM SoCal Gas Report Difference
Base case (Scenario 1) electricity cost ($) 1,259,663 1,283,158 -2% electricity purchased (kWh) 9,752,395 9,692,548 1%500 kW engine (Scenario 5) electricity cost ($) 726,156 808,443 -9% electricity purchased (kWh) 5,511,342 5,710,355 -3% electricity generated (kWh) 4,241,053 3,982,193 7% natural gas costs for generation ($) 253,128 264,979 -5%500 kW engine w/ abs. Cool. (Scenario 5)* electricity cost ($) 664,995 754,546 -12% electricity purchased (kWh) 4,996,674 5,098,440 -2% electricity generated (kWh) 4,314,983 3,982,193 8% natural gas costs for generation ($) 258,626 264,979 -2%*without burning natural gas to supplement heat supply to absorption chiller DER-CAM over-represents the amount of electricity generated relative to SoCal Gas estimates. This is because DER-CAM assumes that purchased technologies are always available whereas SoCal Gas assumes that the engine is available 91% of the time. Having determined that results from DER-CAM were in relative agreement with SoCal Gas estimates, a full set of DER-CAM runs was performed. A summary of results is presented in Figure 40 and Table 42 below.

Distributed Energy Resources in Practice
115
Figure 40: Scenario Results for San Bernardino USPS

Distributed Energy Resources in Practice
116
Table 42: Scenario Results for San Bernardino USPS
CASETechnologies Selected
Annual energy cost
Percentage of base case cost
Annual savings over base case
Electricity purchases
Natural gas purchases
Self generation costs
1: No Invest 1,260,537$ $ 1,259,663 $ 874 $ -
2: Unlimited Invest
2x 500 kW nat. gas engine with abs. cooling, 2x 60 kW microturbine with abs. cooling 911,830$ 72% $ 348,707 $ 32,078 526,357$ $ 353,395
3: Unlimited Invest in natural gas engines
2x 500 kW nat. gas engine with abs. cooling, 2x 55 kW nat. gas engine 916,350$ 73% $ 344,187 $ 41,762 $ 531,421 $ 343,167
4: Forced minimum investment in natural gas engines (generation only)
3x 500 kW nat. gas engine 1,011,283$ 80% $ 249,254 6,410$ 578,115$ $ 426,758
4: Forced minimum investment in natural gas engines with abs. cooling
2x 500 kW nat. gas engine with abs. Cooling 921,461$ 73% $ 339,076 62,276$ 515,873$ $ 343,312
4: Forced minimum investment in natural gas engines with CHP
3x 500 kW nat. gas engine with CHP 1,039,368$ 82% $ 221,169 6,411$ 577,842$ $ 455,115
5: Forced duplication of site decision (1x 500 kW nat. gas engine (generation only) )
1x 500 kW nat gas engine $ 1,137,328 90% $ 123,209 $ 726,156 $ 254,011 $ 157,161
5: Forced duplication of site decision (1x 500 kW nat. gas engine with CHP )
1x 500 kW nat gas engine with CHP 1,146,515$ 91% $ 114,022 726,105$ 253,788$ $ 166,622
5: Forced duplication of site decision (1x 500 kW nat. gas engine with abs. cooling )
1x 500 kW nat gas engine with abs. cooling $ 1,053,810 84% $ 206,727 $ 587,775 $ 304,481 $ 161,554
Note that these results allow the burning of natural gas to supplement recovered heat for absorption cooling purposes. The study by the Southern California Gas Company considers only the use of recovered heat for absorption cooling and the use of existing electric chillers to provide the supplemental cooling required. 3.6.5 Discussion of Results
A discussion of the results for the scenarios run for San Bernardino, as well as a discussion of the sensitivity of these results to grants and rebates, the spark spread (gas prices relative to electricity prices), standby charges, and peak pricing vs. flat rates, are presented below. Dividing the total dollars spent on electricity in Scenario1 by the number of kWh derives a flat rate for electricity purchased. The flat rate electricity analysis uses this rate for all kWh’s and sets the demand charge and standby charge to zero.

Distributed Energy Resources in Practice
117
The Scenarios: Several observations of interest can be made from Table 42: • In the unlimited investment (Scenario 2), a large amount of investment is selected, reducing
electricity purchases to 4% of what they were before installation. • The purchase of one 500 kW natural gas engine with absorption cooling gives the most balanced
dependence on electricity (56%) and natural gas (29%). • The small heating loads make CHP for space heating uneconomical. • Absorption cooling saves an additional $93,000/year over generation-only if one 500 kW engine
is purchased. • An additional $142,000/year could be saved by installing 2 x 500 kW engines instead of one
(this is an additional 12% of the base case energy costs). The Sensitivities: Spark spread sensitivity results show that the DER decision is relatively insensitive to variations in current natural gas prices ranging from 50% to 160% of current prices. Beyond 160% of current natural gas prices, DER becomes less economic, and if natural gas prices are doubled, DER is entirely uneconomic. These results are presented graphically in Figure 41 below.
Figure 41: Spark Spread Sensitivity for San Bernardino USPS
Standby charge sensitivity results show that the DER decision is not heavily affected by standby charges. The current standby charge for the facility is $6.60/kW. For monthly standby charges

Distributed Energy Resources in Practice
118
ranging from $0/kW to $25/kW, the only affect of standby charges is a gradual decrease from 155 kW of generation-only (at $0/kW) to no generation-only capacity (at $16/kW). Within this range, 1000 kW of capacity with absorption cooling is always selected. Exorbitant standby charges of $30/kW would be required to reduce the amount of generation with absorption cooling that is economic to install. These results are presented graphically in Figure 42 below
Figure 42: Standby Sensitivity for San Bernardino USPS
The flat rate electricity sensitivity results show that costs and decisions are not significantly affected by changing to a flat-rate tariff structure. There is slightly more electricity purchased and slightly less on-site generation. These results are presented graphically in Figure 43 below. The flat rate tariff has little effect on DER system costs because the USPS has a relatively flat load already with late evening and nighttime peak loads (see Appendix K). Hence, the peak loads occur in off-peak hours and the relative flat load leads to lower demand charges. Removing these demand charges does not change the results greatly.

Distributed Energy Resources in Practice
119
Figure 43: Flat Rate Electricity Sensitivity Results for San Bernardino USPS
California subsidies, as described in Section 2.9.1, could save the site $52,000 annually (for Scenario 3: Unlimited investment in natural gas engines). However, the subsidies do not significantly affect the DER installation decision: with subsidies, 1110 kW of installation is selected, and without subsidies, 1055 kW of installation is selected. These results are presented in Table 43 below. Table 43: Effects of California Project Cost Subsidies on DER-CAM Decision
The San Bernardino USPS site is an excellent PV candidate because of its large roof area and sunny location. Additional sensitivities were performed for this site on PV subsidies to determine how
with CA subsidy without CA subsidyAnnual energy costs ($) $916,350 $967,914Installed capacity (kW) 1110 1055
Installation choice
2x 55 kW natural gas engine, 2x 500 kW natural gas engine with absorption cooling
1x 55 kW natural gas engine, 2x 500 kW natural gas engine with absorption cooling

Distributed Energy Resources in Practice
120
much rebate on PV would be required to make them an economic DER choice for this site. Current PV turnkey capital costs for installations in the 100’s of kW range in southern California were estimated in the $6 to $8/W range41. PV capital costs already in DER-CAM were within this range ($6.68/W for 100 kW systems), and so values were not changed. With current PV incentives described in Section 2.9.1 of this report, $3.34/W (50% of cost) would be refunded by the State of California. If the 50% cap was lifted and subsidies were raised to $5.50/W, PV would become part of the optimal DER solution for this site. Note, however, that this is an 82% refund of PV costs. At $6/W rebate, 950 kW of PV are part of the optimal DER solution. These results are presented graphically in Figure 44 below.
Figure 44: Photovoltaic Rebate Sensitivity for San Bernardino USPS
3.6.6 Limitations of this Analysis
Load information is particularly accurate for the San Bernardino case because of the amount of data received from the site. However, performance data of technologies considered are less accurate. In this particular case, where absorption cooling is of considerable benefit, it should be noted that absorption chiller performance is generalized in DER-CAM. While absorption chillers are less effective at part load, DER-CAM assumes effectiveness remains at rated load effectiveness.
41 PV project costs confirmed via phone conversation (September, 2002) with PowerLight, Berkeley California for PV projects in the 100’s of kW range in Southern California. http://www.powerlight.com

Distributed Energy Resources in Practice
121
Cost estimates for absorption cooling are skewed when allowing natural gas burning to supplement recovered heat supplied to the absorption chiller. This happens because absorption chiller technology costs are tied to generator costs, and the chiller is sized according to the generator output. However, larger chillers would be required if larger heat quantities (heat from natural gas burning in addition to recovered heat) were provided. The increased cost due to increased chiller capacity is not reflected in the model. The cooling loads at San Bernardino are the full cooling loads for the building. The DER-CAM analysis assumes that the absorption chiller would be installed in conjunction with the recently installed electric chiller system (and reduce the capacity requirement of the electric chiller). Another option for San Bernardino is to add additional (and smaller) cooling capacity to their existing cooling system. It is not known how the economics of these two options compare. A further limitation of this analysis is the assumption that purchased technologies are always available. In reality, equipment will be unavailable due to unscheduled mechanical failures and scheduled maintenance. Unavailability increases electricity purchase and decreases generation costs. To some extent (but not completely), these cost differences will offset each other. 3.6.7 Observed Outcomes of Installed Technology.
The managers at USPS have not decided the type of DER system to install at this point and no DER technologies have been installed. A new electric chiller was installed at the site to take advantage of facility improvement funding and this chiller is the source of the chiller operation logs in Appendix O. 3.6.8 Conclusions from San Bernardino Test Site Analysis
The San Bernardino USPS site has large potential for financial savings by installing DER technology onsite. High electricity rates and a large cooling load make absorption cooling profitable choice for installation. High electricity rates make a large installed capacity DER system (1000 kWe) with absorption cooling economic for natural gas prices ranging from 50% to 160% or current prices. The PV sensitivity shows that the State of California could make PV installations an optimal DER choice for the San Bernardino USPS facility by raising the current rebate to approximately $5.50/W.


Distributed Energy Resources in Practice
123
4. Other Test Cases
To narrow down our test case selections to those described above, initial studies on a number of other sites were performed. Summary information on these sites is presented below. A few of these sites provided us with enough data to perform a full analysis, notably AA Dairy, East Bay Municipal Utility District, Greater Rochester International Airport and Wyoming County Community Hospital. Information on the decision making process and DER system costs information was also provided by Byron Bergen Schools, First National Bank of Omaha, PC Richards, and Sea Crest Health Care facility. The table below summarizes the lessons learned from some of the other sites considered in this case study analysis but not analyzed in full detail. As a result of this case study project much information was obtained about real-world DER decision making and implementation factors such as the DER design process, technology integration and interconnection issues, the drivers and hurdles of DER adoption, and the factors involved with matching electric and thermal loads to DER capacity, energy production, and distribution. Furthermore this study highlighted the complexities of tariffs with regard to DER systems and the importance of grants for improving the economics of DER systems. Table 44: Lessons Learned from Sites Not Fully Studied
Site Notable issues learned AA Dairy The economics of using cow manure on a dairy farm for operating a biogas
powered DER system to produce electricity and heat. The digester system also helps resolve a solid waste disposal issue and simultaneously opens new business opportunities such as selling high-quality compost and operating a greenhouse for growing tomatoes.
Alaska USPS The utility was closely involved with the DER system analysis but had an unfavorable opinion of the economics of the DER system. Utility involvement may help to limit DER adoption to the most economic project opportunities.
Byron Bergen Schools
This is a grid-independent high school in upstate NY running on mix of natural gas and diesel generators. The project resulted from efforts to reduce utility costs and take advantage of an on-site natural gas well.
Cortland Memorial Hospital
The first grid-independent hospital in New York State. DER system consists of 3 x 560 kW Waukesha engines with diesel generator backup.
East Bay Municipal Utility District EBMUD
They shut down 4 of 10 microturbines during off-peak hours and use absorption chillers to meet QF status. With QF status they are able to obtain funding through CPUC’s SELFGEN program.
First National Bank Omaha
The energy service company HDR designed the fuel cell powered DER system to be highly reliable and replicable although it is not known if other sites have been willing to implement this system.
Rochester International Airport
The cogeneration system has an energy efficiency rating of 59%. The Waukesha engine and generator set failed shortly after going into operating. It was noted that the engine (from Waukesha) and the generator (from another company) are tested independently and when operating as a unit are subject to vibration and misalignment problems that are not
Distributed Energy Resources in Practice
124
apparent in the separate tests. Harbec Plastics This plastic manufacturing company is powered almost exclusively by
Capstone microturbines. They needed to integrate their DER system into a plant expansion in order to secure a bank loan. They had numerous rejections for funding from banks when the project was described as solely a DER installation.
Sea Crest Health Care
All Systems Energy, an energy service company on Long Island, provided numerous details about their cogeneration project and also the thought process behind installing natural gas engines. NG engines are preferred because of the well-understood technology, their competitive capital costs, and the large amount of heat they produce make them attractive for CHP applications. In addition, the engineers at All Systems believe the typical mechanical failures with NG engines tend to be well understood and easier to repair than the failures with other types of DER systems.
Wyoming County Hospital
This hospital is negotiating with the utility company (NYSEG) to avoid having to pay demand charges when their DER system is tripped off line as a result of an interruption in utility power. The restructuring of the utility industry in NY and the fear of having difficulty of obtaining economic and reliable power supplies lead them to investigate a DER system.
A description of the DER site and the information gained from contacting each site are presented below. Sites with little or no additional information, besides the technical characteristics of the DER system, may have been eliminated from consideration because they were too close to a demonstration project, or did not have enough of the interesting characteristics sought for this case study project described in Section 2.1. 4.1 AA Dairy
Type of organization Dairy farm Location Candor, NY (near Ithaca) DER system Digester system with 130 kW converted diesel engine Developer Environomics
Resource Conservation Management Contact person(s) Bob Aman
Richard Mattocks Mark Moser
Note Considering adding tomato greenhouse heated by CHP as a facility expansion Site visit in spring 2002 Good summary of system with photos available. A net metering bill for farms passed recently in NY. If they pay 9 cents per kWh they can sell to the utility for 9 cents per kWh. Data available
AA Dairy is a 500-cow dairy farm in Candor NY. The DER system is based on a cow manure digester system that produces biogas used to fuel a 130 kW converted diesel engine. The DER

Distributed Energy Resources in Practice
125
system, however, typically produces about 70 kW of power since biogas is 40-50% CO2 and this dilutes the methane. There is also a backup diesel generator to help avoid standby charges if the digester system goes down. The motivation for this project came from the need to find a way to dispose of cow manure from the dairy farm without negatively affecting the neighbors with odor or truck traffic. Many subsequent benefits resulted, including the ability to meet the majority of the dairy farm’s electricity loads, the production of high quality compost that can be sold, the elimination of most pathogens in the waste so liquids can be spread on the surrounding fields, the reduction in methane gas as it is converted to less potent carbon dioxide, and, with the passing of a net metering for farms law in New York state, the ability to sell electricity back to the utility company at retail prices. This site provided substantial data in terms of system cost and aggregate electricity and thermal load consumption data. Analysis of the digester system economics, along with the feasibility of expanding the system to 1000 cows, can be found in Minott (2002). 4.2 Alaska USPS
Type of organization Post Office Location Anchorage, Alaska DER system 5 x 200 kW Fuel cells with CHP Developer Magnetek Contact person(s) Jim Buckley (consultant),
Peter Poray (Chugach Utility) This site was not studied because of the difficulty in getting approval for the release of data from Chugach Electric, the local utility, the possibility it was a demonstration project, and the overlap with USPS San Bernardino. The DER system is designed to supply 100% of the electric and heating load for the facility. 4.3 Byron Bergen Schools
Type of organization Middle and High School campus Location Central NY State south of Rochester, Finger Lakes region
DER system 8 different engines. 7 diesel, 1 natural gas, 2 absorption chillers, on site natural gas well and two boilers.
Developer IEC Engineering Contact person(s) Mike List and Bill Cristofaro Note Site visit 6 September 2002
Grid independent Byron Bergen is a grid-independent junior high and high school complex in a rural area of upstate New York. The goal of the project was to respond to budget reductions by lowering energy costs without compromising reliability. Bill Cristofaro of IEC Engineering was the engineering designer for the DER system. The facility manager for the school, Mike List, estimated they would have

Distributed Energy Resources in Practice
126
been paying about $325,000 to $350,000 per year for electricity (due to a 10% increase in electricity rates) for the school plus $35,000-50,000 for diesel fuel for the boilers and maintenance. They currently spend $174,000 per year on diesel fuel for the engines and boilers. They now are completely grid independent, and they have not lost power since they started this system earlier last year. The project’s total capital cost was $3 million but the local taxpayers directly paid 8 cents per dollar since the state had a capital improvement program for the rest of the project cost. Total cost was then $240,000 to the local taxpayers directly (although they also pay indirectly through state taxes). The DER system consists of mostly diesel engines and one natural gas engine. The diesel engines are manufactured by either John Deere or Volvo and are equipped and packaged with generators by SDMO of France. The DER system at Byron Bergen consists of the following technologies: • 4 x 250 kW diesel • 1 x 130 kW diesel • 1 x 120 kW diesel • 1 x 50 kW diesel (in bus repair garage) • 1 x 150 kW natural gas Waukesha engine • an on site gas well produces enough gas for the natural gas engine but not enough for the boilers • 2 new cooling towers, • dry coolers (to exhaust extra, low quality heat) • 2 new boilers • 4 ton absorption chiller • 5 ton absorption chiller The diesel units are not producing as much heat as expected because of exhaust fouling problems. Reconfiguring the design to incorporate an easy flushing system to clean the exhaust system would avoid the need to rebuild the exhaust system each time they are cleaned. Bill Cristofaro mentioned that the diesel units are as clean as a natural gas engine and that they passed all the emissions tests and operate within local air quality regulations. 4.4 Compudye
Type of organization Fabric dyeing company Location Maspeth, NY DER system 2 duel-fuel NG engines, Volvo 450 kW Developer ITAC (Industrial Technology and Assistance Company) Contact person(s) Morton Greenberg Note Presented at NYSERDA conference in June 2002 Compudye received NYSERDA funding for their project and Morton Greenberg described it on behalf of ITAC at NYSERDA’s CHP conference in June 2002. However, Compudye was not able to provide details on the system cost or load data by the fall of 2002 and hence was not further

Distributed Energy Resources in Practice
127
studied. Compudye is a large textile dyer established in 1994 and employing 45 people at a 5,300 m2 (57,000 ft2) facility. They have 10 large dyeing machines, extractors, 60 steam tumble dryers and use up to 340 million liters (90 million gallons) of water per year and over 900,000 kWh per year of electricity. They have three gas-fired boilers generating steam to heat water and feed Ajax dryers. For the plant to be competitive in New York City they need to reduce their water and sewer costs. To reduce these costs Compudye attempted to recycle 80% of water using a reverse osmosis system. The DER system powered the reverse osmosis system since the system is electricity intensive. The 450 kW requirement was based on 192 kW peak demand, 135 kW reverse osmosis system, 50 kW pumping requirements, and 73 kW efficiency losses and safety factor. A 40 kW (50 HP) boiler using waste heat was used to preheat water. The dual fuel system runs on the most economic choice of fuel mixture for the facility providing operating flexibility. The project was estimated to produce a net benefit on electric and thermal energy of over $300,000 per year for a simple payback of 2-3 years. The information from this project will be disseminated to NY State dyers, large laundry and washing facilities, textile, chemical, and food processing companies. 4.5 Conde Nast
Type of organization Commercial office building Location 4 Times Square New York City DER system Fuel Cell with CHP Developer The Durst Organization Contact person(s) Bob Fox, Fox and Fowle Architects
Todd Coulard, The Durst Organization Note Some cost and design data provided Bob Fox and Todd Coulard provided information and offered a site visit to see this DER system, but this site was not considered because of the large amount of exposure this site has already received due to the nature of a fuel cell DER system and the Times Square location. 4.6 Cortland Memorial Hospital
Type of organization Hospital Location Cortland, New York (upstate) DER system 3 x 540 kW Waukesha natural gas engines Developer Entrust Contact person(s) Dave Schilling Note First grid independent hospital in New York State
Site visit in July 2002 Presented at NYSERDA conference in June 2002
Cortland Memorial Hospital is located about 1 hour south of Syracuse, NY. They are the first grid-independent hospital in New York State. The on-line date for the DER system was August 19th 2002. The hospital owns the system and Entrust is operating it for the hospital. The project was

Distributed Energy Resources in Practice
128
successful because of the commitment from the top management and their assistance with the many design changes that needed to be made along the way. This site has Niagara Mohawk electric service (notorious for the problems they cause DER projects both intentionally and unintentionally) and the hospital tariff schedule changed during the project. The gas transportation service is provided by NYSEG at a standard rate for commercial users. Diesel generators provide emergency backup power. The peak electric load is 1.25 MW and the system’s energy efficiency is estimated to be 70%. The project payback is estimated at about four and a half years. According to Dave Schilling, they are collecting detailed load profile data on an hourly basis. Entergy provided an energy service contract to the hospital with the hospital carrying the risk associated with fuel costs. Cortland Hospital has three 540 kW Waukesha engines, two vapor phase heat recovery steam generators 926,000 kJ/hr (878,000 BTU/hr), and one 1,183,000 kJ/hr (1,121,000 BTU/hr) vapor phase heat recovery steam generator. There are also three 500 kW SDMO diesel engines as backup to the primary DER system. 4.7 East Bay Municipal Utility District
Type of organization Municipal utility commercial administration building Location Oakland, CA DER system 10 x 60 kW Capstone microturbines 530 kW (150) ton
absorption chiller, at administration center 2 x 60 kW MT at Adeline Maintenance Center, 30x kW PV
Developer Contact person(s) Diosdado V. Hernandez: Associate Electrical Engineer
Infrastructure Management Section Frank Pizzimenti, Assistant ME James Hankins, sr. Facility Technician
Note East Bay Municipal Utility District decided to install a DER system at their commercial administration building in downtown Oakland. The DER system consists of ten 60 kW Capstone microturbines and a 530 kW (150 ton) absorption chiller. They also have installed two 60 kW microturbines at the Adeline Maintenance Center along with a 30 kW PV system. The motivation for the project was to reduce energy costs and increase reliability as the electric utility industry experienced financial and technical turbulence. The selection of microturbines was driven by the air quality restrictions in downtown Oakland. Fuel cells were also considered despite higher capital costs but were considered too heavy for the roof. The roof already had to support the weight of the boilers and chillers for the facility. The evening load is 600 kW and the ten microturbines would be able to meet this base load and rely on the utility electricity to meet the remaining peak load. The thermal analysis first focused on reducing the heating loads and improving the efficiency of boilers that serve them. The residual

Distributed Energy Resources in Practice
129
heat from the microturbines could then supplement the heating loops from the boilers. The efficiency of serving the heating loads was critical to obtaining a 42.5% overall energy efficiency rating. This energy efficiency level was necessary to obtain QF status and allow the site to receive state funding as part of the CPUC’s SELFGEN program. EBMUD had to design the system to operate the individual microturbines only when there is sufficient heating or cooling loads to meet this level of efficiency. At times, some of the microturbines will be shut down if there is not a sufficient thermal load regardless of the availability of the electrical loads. It was estimated that the DER system will produce enough residual heat to power the adsorption chiller to meet 60% of the existing cooling load that is currently met by two 880 kW (250 ton) centrifugal chillers. The DER system is expected to reduce the building’s electrical costs by 50% or $500,000 per year with an increase in gas costs of $100,000 per year. EBMUD received a $685,000 grant and $2,000,000 loan at 3% interest for 11 years. The DER system costs for the projects at the two facilities are as follows: • $1,300,000 for 12 capstones • $285,000 for solar • $185,000 for absorption chillers • $145,000 for EMS • $100,000 for design • The inverter is included in the cost of the microturbine but not the compressor. This system uses an adsorption chiller, which has a lower coefficient (0.7) than absorption chillers (1.0). Adsorption chillers, however, were thought to have instant on and off ability, where as absorption chillers were thought to freeze if they were turned off and require three hours to restart. 4.8 First National Bank of Omaha
Type of organization Bank Location Omaha, NE DER system Fuel cell with flywheels, CHP Developer HDR, Sure Power Contact person(s) Tom Ditoro et al. Note First National Bank of Omaha desired a high level of reliability, 99.99999% or seven 9’s, and the utility could offer them only five 9’s reliability. The DER system consists of five fuel cells, flywheels, and battery backup. The DER system provides 400 kW of primary power for data center and supplemental power to the rest of the facility. The residual heat from the CHP system is used to heat the building and melt snow. The DER system was implemented in April 1999. The fuel cell system was designed with a capacity of 800 kW to provide additional back up power. In the event that half of the fuel cells go out they can still provide primary power to the facility. The developers, HDR and Sure Power, have started a high-reliability server farm due to the large demand for highly reliable power that resulted from this project. The motivation for investing in a

Distributed Energy Resources in Practice
130
DER system was a power failure that shut down the bank and the desire to avoid that from happening in the future. It is not known if they have been successful marketing this type of DER system to other customers with high reliability requirements. 4.9 Greater Rochester International Airport
Type of organization Airport Location Rochester, New York DER system 2 x 750 kW natural gas engines, CHP and absorption cooling Developer Siemens Contact person(s) Patrick Corrigan, Ms. Chris Vitt Note Site visit 5 September 2002. Full cost and engineering design
data was provided. Presented at NYSERDA conference in June 2002
The Greater Rochester International Airport installed a DER system with an official start up date of August 1st 2002. Bill Cristofaro with IEC Engineering was the designer and Siemens was the developer. The project cost $4.3 million with an estimated annual savings of about $500,000 to $700,000 per year on utility bills. Siemens provided a guaranteed savings of $500,000. Although the airport was not able to obtain a bank loan, Siemens Financial Solutions (a division of Siemens) financed the project because they were familiar with CHP projects. Because one of the two natural engines is currently broken, Siemens is losing $5000 per month according to Patrick Corrigan. It is estimated to be down for 1.5 to 2 months of repair and rebuilding work. The other engine has been working fine since their official start up 1 August 2002. The cost per kWh of producing electricity is four cents per kWh compared to ten cents from the utility company. The airport also saves money through the displaced gas as a result of the CHP system. The lighting retrofit performed earlier is saving $15,000-$20,000 per month and “they are not done yet.” Bill Cristofaro noted that an energy audit and energy efficiency projects should always be the first step in a DER project. As Cristofaro stated, “It always pays to be energy efficient first and then cogen on top of that.” The airport is currently adding new loads to the DER system in an effort to reduce utility costs and use the DER system efficiently. They are considering adding a parking garage (a night lighting load) and a nearby hotel to the DER system. The airport has a system energy efficiency rating of 59% and has attained QF status.42 In this region, however, they do not receive any additional benefits for being a QF (such as elimination of standby charges) as a facility would in Con Edison territory. Currently RG&E is proposing a new tariff (SC-14) that will cost them about $30,000 per year in standby charges. It may come up for PSC approval in November of 2002.
42 Bill Cristofaro, IEC Engineering, Presentation to Rochester Airport management and facility staff, Sept. 5, 2002.

Distributed Energy Resources in Practice
131
People involved with the Rochester Airport project also provided insight into some issues involved with operating a DER system during a September 2002 site visit. CHP system efficiency is the lowest when the outside air temperature is around 12 °C (55 °F). On these days the air handlers can be used to cool the building and therefore the boilers and chillers do not need to be used, eliminating the usefulness of residual heat. On the operations side, it may be difficult to get people in facilities to change their habits (e.g. the temperature set points in the water loops) after integrating a CHP system and can result in an inefficient, start and stop operation of the boilers and chillers. 4.10 Green Mountain Coffee
Type of organization Coffee manufacturer Location Burlington, Vermont (check) DER system Developer Northern Power Systems Contact person(s) Phyllis Gray Note This site was contacted because it is an industrial DER system located at a coffee roaster in Vermont. However, it was difficult to obtain information on the system through Northern Power Systems and hence was not considered for this study. 4.11 Harbec Plastics
Type of organization Plastics manufacturing company Location Ontario, NY DER system 25 x 30 kW Capstone turbines
700 kW Carrier absorption chiller Developer Modern Energy Technology Contact person(s) Robert (Bob) Bechtold
John DeFrees, Modern Energy Technology Note ~99% electric generation on site
Site visit and met with Bob Presented at NYSERDA conference in June 2002
Robert Bechtold is the president of Harbec Plastics located in Ontario New York about 30 minutes east of Rochester. Harbec is a plastics manufacturing plant using precision injection molding technology. The environmental benefits, the financial savings, and reliability improvements were motivating factors in installing a DER system to provide nearly all the power for the facility. Harbec is ISO 14,001 certified and their goal is to eliminate the waste streams from lubricants, filters, and coolants. Harbec installed twenty-five 30 kW Capstone units. They have a Carrier 700 kW (200 ton) chiller, a lithium bromide based system, which is running closer to 350 kW (100 tons). The microturbines

Distributed Energy Resources in Practice
132
are not being run as efficiently as possible due to fluctuating load and high temperatures in the room. They have a 40% load factor and approximately 60% of heat is recovered. The site also has three 10 HP CNG rotary compressor to increase the natural gas pressure. The factory work areas have day lighting and radiant floor heating. The administration offices are cooled with nine 5-ton package electric chillers. The microturbines create a loud fan noise (in addition to the large fans in the room) but it is still possible to carry on a conversation without shouting. Two large fans provided air movement and additional cooling is planned for the space to improve combustion efficiency. Harbec did not need to hire any additional staff to operate or maintain the DER system. Training for the facility managers was obtained by sending maintenance people to Capstone’s O&M school for a week. The local utility, Rochester Gas and Electric (RG&E) provided numerous barriers and resistance to implementing the DER system, although they accommodated Harbec on the issue of installing gas pressurizing equipment to the site. Keeping to the company’s goal of implementing environmental improvements wherever feasible, Mr. Bechtold would like to expand the DER system to include a wind turbine in the future. Originally the project started out as a wind and diesel project. However, it was determined that the positive environmental advantages of the wind turbines would have been offset by the diesel component. Furthermore, the local utility company’s (RG&E) resistance at implementing the wind and diesel project and the inability of local IC engine suppliers to provide a comprehensive proposal turned the project toward microturbines. Harbec had more than 30 bank rejections for the project before combining it with a plant expansion to receive financing. The banks wanted a 3-5 year payback and Harbec was estimating a 7-10 year payback. However, this payback period considered only electricity and not useful heat obtained from the microturbines. Operation and maintenance cost estimates are about one hour per 4000 hours of run time at $50 per hour. 4.12 International Paper
Type of organization Pulp and Paper Mill Location Oswego, NY DER system CHP system Developer Onsite Energy Contact person(s) Note Feasibility study sent from NYSERDA NYSERDA sent a feasibility study of large-scale cogeneration project at this pulp and paper mill. However, the plant has since closed and the site was larger than the microgrid sites sought and therefore was not considered. The plant has a 7.4 MW peak load and a 6.8 MW average load (83% load factor). A Solar Taurus 70 natural gas engine with a 7.5 MW capacity was being considered for this site.

Distributed Energy Resources in Practice
133
4.13 PC Richards
Type of organization Warehouse for Electronics Retailer Location Farmingdale, NY DER system 300 kW or 450 kW natural gas fired cogeneration units with or
without an absorption cooling system proposed Developer IEC Engineering Contact person(s) Bill Cristofaro Note Sent completed proposal. Same development company for
Victoria Packaging and Rochester Airport
IEC Engineering sent information on this warehouse DER project in September 2002. The warehouse is 60,000 m2 (650,000 ft2) and located in LIPA service territory. The DER system design is for two 150 kW natural gas engines with absorption cooling for the office spaces. 4.14 Resource Conservation Management
Type of organization Consultant for digester systems Location Berkeley, CA DER system Developer Contact person(s) Mark Moser Note Offered site visit of digester systems in Bay area Mr. Moser offered a site visit to see a digester system installed in the Bay area. The site was not analyzed further because of the high quality data received from AA Dairy and their digester DER system in Candor NY. 4.15 Sea Crest Health Care Facility
Type of organization Health care Location Coney Island, NY (near NYC) DER system 60 kW CHP Ford NG engine Developer All Systems Cogeneration
KeySpan Engineering Contact people Gregg Giampaolo
John Franceschina Note Using heat from four places: exhaust, oil pan, manifold, and
jacket Limited data (but enough to model) from site visit Site visit after NYSERDA conference in June 2002
Sea Crest Health Care Facility is located on Coney Island (Brooklyn, NY). It is a 320 bed health care facility. Gregg Giampaolo and Rick Cincotta with All Systems Cogeneration Inc. designed and installed Sea Crest’s system in only six months. The heat is used in the kitchen, laundry and the
Distributed Energy Resources in Practice
134
heating systems, as well as for domestic hot water. The site is not sponsored by NYSERDA and did not receive NYSERDA funding. The DER system consists of a Ford 7,500 cc (460 cubic inch), 60 kW natural gas engine installed in January 1999 parallel to Con-Edison electric grid. The installed cost was $225,000 with an annual savings of approximately $64,000 providing a 3.4 year payback. Actual 2001 savings totaled $80,067 after all expenses. CHP heat is collected from four places, exhaust, oil pan, manifold, and jacket, and sent to a 7,500 liter (2000 gallon) hot water tank for the kitchen, laundry, and heating systems. The residual heat produces 80 °C (180 °F) water at 100 liters (30 gallons) per minute producing 475,000 kJ/hr (450,000 BTU/hr). Natural gas costs $0.00502/MJ ($0.53/therm) and electricity is $0.105/kWh. Maintenance cost is $10,000 per year (or 1-1.5 cents/kWh according to the experience at Wyoming Hospital) and they can monitor status of system over the phone. The DER system has achieved an availability of 97% since its installation. Rick Cincotta described their design process. They treat all the energy supply and demands as one system. They examine the thermal loads and try to see if the hot water storage tanks are adequate as heat sinks. Historic electric bills are obtained for one year. The CHP systems are often sized on base load. All Systems Energy Services maintains the DER system and hence they typically install a technology that is reliable and that they are familiar with—natural gas engines. Rick felt that the problems you experience with natural gas engines are not as extreme as problems you would see with other technologies. He has also observed a fuel cell DER system and had an unfavorable opinion of it because of the cost, complexity, and heat output. For 4-6 kWe fuel cell system a large amount of hardware needs to be installed. Cincotta thought that microturbines look attractive and produce a reasonable amount of electricity but he felt that they do not produce as much heat as a reciprocating engine. It’s also a new technology and still a little pricey. The benefits of natural gas engines are that they run hot and they do not require fuel storage tanks (as required for diesel). 4.16 Southern Container
Type of organization Cardboard container manufacturer Location Hauppauge, NY (Long Island) DER system 850 kW Saturn 1200 (NG engine) Developer KeySpan Engineering Contact person(s) Robert Braun and Bruce Schadler Note Presented at NYSERDA conference in June 2002 This site was considered interesting because it is an industrial DER system. Although KeySpan Engineering was willing to provide information for this study it was difficult to contact Southern Container and obtain permission to release their electric and thermal load data along with the economic analysis of the DER system. The DER system has allowed Southern Container to obtain QF status allowing them to avoid paying standby charges. KeySpan Engineering considered two months of outage time per year for scheduled and unscheduled maintenance in their financial analysis. The site is an excellent candidate for CHP because it uses a large amount of electricity and steam. The cost of electricity

Distributed Energy Resources in Practice
135
was typically $500,000 per year with an average power demand of 740 kW. The past history of 25 power interruptions helped stimulate the installation of a DER system. 4.17 State University of New York, Buffalo
Type of organization University Location Buffalo, NY DER system 2 x 60 kW Capstone microturbines Developer SUNY facilities Contact person(s) Fred Smeader Note All electric part of campus
Presented at NYSERDA conference in June 2002 Fred Smeader described their facility managements’ work on this DER system at the NYSERDA CHP conference in June 2002. The North Campus facilities are electrically heated due to the regulation of natural gas sales in the early 1980’s. The older part of campus from the late 1800’s has steam heat. The North Campus includes swimming pools with load factors near 100% to maintain constant temperature. They are installing two 60 kW Capstone microturbines and expect to achieve a 60% fuel conversion efficiency. The pools require two 40 kW (50 HP) pumps to cycle four million liters (one million gallons) of water from two pools (a two million liter pool (600,000 gallons) and a 1.5 million liter (400,000 gallon) diving pool) through the heaters and filters. They expect to receive 12,900 kJ thermal/kWh electric (12,200 BTU/kWh) or 571,000 kJ/hr (541,000 BTU/hr) thermal energy output from the microturbines. Smeader assumed 32% recovery of exhaust heat and 62% overall efficiency of fuel use. 4.18 Synagro
Type of organization Municipal energy/water facility Location Chino, CA DER system 4 Capstone 330 turbines, 1 MW and 850 kW Waukesha NG
engines. Biogas fuel from digester. Developer Synagro Digestion LLC Contact person(s) Poe Tyler Note Not pursuing This site was contacted as a result of contacts obtained through Cornell University’s work on agricultural digester systems. Poe Tyler is the manager of the digester system and noted that it would be difficult to obtain financial information from Synagro because of the competitive nature of this business. They are using biogas from cow manure to produce electricity to provide a small portion of supplemental power to a municipal desalination plant. 4.19 Twin Birch Farm
Type of organization Dairy farm

Distributed Energy Resources in Practice
136
Location DER system Digester with 4 Capstone 330 turbines Developer Energy Co-opportunity Contact person(s) Kamyar Zadeh Note Presented at NYSERDA CHP conference in June 2002 This site was not pursued due to overlap with the digester based DER system installed at AA Dairy. 4.20 Victoria Packing Corp.
Type of organization Container manufacturer Location DER system 300 kW Cummins engine set Developer IEC Engineering Contact person(s) William (Bill) Cristofaro Note Presented at NYSERDA conference in June 2002 Bill Cristofaro of IEC Engineering thought this project was too early in the development process to release information about the feasibility study and system design. Information on PC Richards was sent in its place. 4.21 Wyoming County Community Hospital
Type of organization Hospital Location Central NY state south of Rochester, Finger Lakes region near
Letchworth State Park DER system 560 kW natural gas engine Developer Gerster Trane Contact person(s) Steve Aughey and Leon Kuczmarski Note Site visit 6 September
Presented at NYSERDA conference in June 2002 Wyoming County Community Hospital is located in central New York about 90 minutes south of Rochester. Leon Kuczmarski is the director of the hospital and Ted Fritz is the facility manager. Steve Aughey provided engineering design services on behalf of Trane, the energy developer. The motivator for the project was the uncertainties resulting from utility restructuring and the fear of having a their electricity shut off due to better prices for suppliers selling to New York City. Also the region has had two severe ice storms since 1991 (the 1991 ice storm caused widespread power outages for a week or two in Rochester, NY) and they complained of poor power quality. The hospital used the option to install diesel generators as leverage when negotiating rates with Rochester Gas and Electric. The DER system provides about 90% of the hospital’s electrical energy loads and the CHP capabilities of the system contribute to serving the heating and cooling demands.

Distributed Energy Resources in Practice
137
System details include: • 560 kW Waukesha natural gas engine; • CHP system consists of recovered jacket water & exhaust heat recovery device to channel heat
to the domestic hot water and glycol heating loop; • System operates in parallel to grid operation but can operate grid isolated; • Cooling loads are served by absorption and electric chillers in series; • System efficiency of 55% HHV (typical average daytime efficiency); • Thermal energy efficiency of 72%; • Computer works on day ahead prices; • Energy flows of the DER system are metered for performance analysis; • Energy Management System to be installed along with CHP; • A 30 year-old back-up electrical generator was replaced and a new boiler installed. Leon Kuczmarski provided information resulting from the NYSERDA sponsored $25,000 feasibility study. Kuczmarski is hoping to receive an alternative analysis from Berkeley Lab about the system and that has contributed to their desire to participate in the case study analysis. They have a performance agreement contract with Trane but have hired an independent auditor to collect data to avoid "the fox counting the chickens." Trane guaranteed a $225,000 annual savings for the hospital with a ten-year energy performance contract and a guaranteed construction cost. The contract is structured so that the hospital caries the risk of natural gas price fluctuations. Trane guarantees a certain amount of delivered kWh electric and kWh thermal each month. They also have information on the amount of heat collected from the exhaust verses the heat collected from the jacket-cooling loop. The thermal recovery efficiency is 72%. Information from the feasibility study: WCCH spent as a base case $517,645 for electricity and natural gas in 1997 and $510,000 from August 1998 to July 1999. The DER system is estimated by Trane to cost $1,013,690 and to reduce annual energy bills by $215,000 with a maintenance cost of $83,266. The cost of capital for the hospital was estimated by Trane to be 5%. The hospital has had many problems with the Waukesha engine. The bearings are supposed to last 30,000 hours but they have failed 5 or 6 times (they are losing count) since it was installed a year ago. On the plus side, the maintenance people (contracted by Trane) are getting good at changing bearings. It used to take 2 weeks to perform a bearing change and now they have the time down to a week. It costs $20,000 per bearing change. During a site visit in September 2002, Kuczmarski noted that they go about eight weeks running per one week of maintenance downtime. Wyoming Hospital has a complex utility structure for standby charges. They have five weeks of maintenance down time allotted for the year that do not count against their utility demand charges. After five weeks that they start receiving the demand charges. At the rate they have been going they use up their five weeks rapidly and it takes a while to build up their maintenance time again (the DER system needs to run without interruption for a while to build up the time). The standby

Distributed Energy Resources in Practice
138
charge is $12/kW. Kuczmarski mentioned that they pay $8,000 per month if they go offline for more than 15 minutes, even if it is a problem with the utility’s distribution system that cause the hospital’s generators to go offline. The longer they go without needing utility power the lower the demand charge gets but it would take a year without drawing electricity from the utility before the price would be reduced. Also Kuczmarski thought that the way the laws are structured it is not possible for a hospital to be utility independent in New York State although there is a grid-independent DER system at Cortland Community Hospital. One problem for the hospital is if the utility has a momentary disruption of service (e.g. a car hitting utility pole) it causes the CHP system to go offline and the hospital connects to the grid. Since the hospital can’t physically or prudently get the CHP system back into operation while maintaining network safety within the 15-minute utility meter sampling period they often get hit with a demand charge of approximately $8,000 per month. Furthermore, their time without drawing power will be reduced to zero again. They are still saving money even with all the problems. If the CHP system gets tripped and goes offline the hospital has backup power but not for the air conditioning system. The chilled water temperature rises quickly and the electric chillers are needed to bring it down again. The absorption chiller has a hard time catching up, compared to the electric chillers, if the water temperature climbs too fast due to a downtime event. The Wyoming hospital provided more data to us than any site in this case study report. They provided a lot of data about the analysis prior to installing a DER system and follow up data on the cost and performance of the system after it began operating. Wyoming County Community Hospital provided the following data: Co-generation analysis: - Jacket Water Only - Jacket Water and Exhaust Recovery Gas utilization analysis: - Gas Distribution - Gas Consumption - Miscellaneous Gas Utilization - Historic cost of natural gas bulk purchases ($3.50 per dekatherm plus 90 cents delivery charge
per dekatherm). Steam Utilization Analysis: - Steam Plant Log Data - Steam Plant Production - Miscellaneous Steam Utilization Hydronic Analysis: - HW Reheat and Glycol Preheat Log Data - Hydronic Load Analysis - Hydronic min/max Loads HW Load vs. O.A. Temperature

Distributed Energy Resources in Practice
139
- Glycol Load vs. O.A. Temperature Domestic Hot Water Analysis: - DHW Demand (June 1998) - DHW Demand (June 1998)

Distributed Energy Resources in Practice
141
5. Lessons in Decision-Making and DER Adoption
The process of completing this report provided valuable insight into how DER adoption decisions are made in the real world, and the perceptions, data, and analysis that supports those decisions. This insight came through working with many of the sites to obtain information on their energy systems and operations, the DER adoption decision, and their energy costs prior to DER installation, and expected or actual annual energy costs after DER installation. Site visits provided knowledge of how the DER systems were integrated into operations, and the necessary technologies for DG, CHP, absorption and compressor chilling, boilers, and control systems. These site visits allowed for questions about what was working and what pitfalls to avoid. The lessons learned from each site modeled in this report have been added to the individual case descriptions. A general finding of this report is that the decision-making process for DER adoption often appears to proceed in the opposite direction of the DER-CAM modeling work. That is, frequently the technology is selected first through prior knowledge the decision maker has about the costs, performance, benefits and drawbacks of various DER technologies. This knowledge may have come from years of experience installing DER systems or through site visits and discussions with energy consultants. The fact that a large amount of comparable data on the performance of different DER systems is hard to access makes this personal knowledge-based technology-selection process necessary. Since this part of the adoption decision at actual sites is performed without documentation, it appears that the technology is selected first and then an engineering and economic evaluation of the proposed system is performed. The DER-CAM process includes more data on technologies’ performance and cost characteristics, and more detailed load profiles than often used in actual DER system design. However, DER-CAM has much less information about actual site layout and required equipment than would be included in a site-specific engineering analysis. Also, the detailed hourly load profiles developed for DER-CAM are based on many assumptions and estimations, thereby losing some accuracy. Furthermore, these hourly load profiles are then averaged and any accurate detail about the variations of the loads that did exist is then removed. It appears the engineering analyses at sites are often performed using 6 to 12 months of prior utility bill data. End-use load data were sometimes obtained from operating histories of mechanical systems such as boilers, electric chillers, and other HVAC equipment. The primary data for site design appeared to be monthly energy use and peak energy demand for the various mechanical systems at a site rather than generated averaged hourly load profiles. It is not clear whether one method provides better results than another. Spreadsheets, rather than mixed integer optimization models, seem to be the tool of choice for energy engineers designing DER systems. These spreadsheets include the assumptions and relevant parameters, along with detailed information on the costs and energy use of important aspects of the system. The financial analysis tool of choice was frequently simple payback method despite the numerous limitations of this technique. Payback method was probably used because of its simplicity and its way of leaving risk evaluation open to interpretation. That is, a longer payback period exposes the project to increased risk of having prices or other economic conditions change

Distributed Energy Resources in Practice
142
that negatively affect the project’s financial benefits. It is up to the individual decision-makers to interpret the risks between a three and a seven-year payback for example. This study also contributed to understanding the site’s relationship with its utility when installing a DER system. The interactions ranged from helpful, to adverse. Examples of utility barriers include constantly changing criteria, paperwork, lack of a consistent contact person, and financial penalties. Many other lessons were obtained through this analysis. The importance of a project champion, for seeing the project through from conception to completion, was the key factor in the success of many DER projects. Motivated and coordinated teamwork is also important in the success of these DER projects when the project is of a large scale and many contractors are involved. The innovation required for installing technologies such as fuel cells and microturbines also seemed to provide additional interest for design teams. Reliable and serviceable technologies are important for organizations making what they consider to be a risky decision to invest in DER. These decisions are based on perceptions of the costs, performance, and reliability of various technologies. These perceptions should be checked against technology cost and performance information being gathered in this study as well as in DER applications around the United States. Issues related to risk and reliability are critical factors in DER adoption decisions. The issue of reliability for power and the uncertainty over future electricity prices (assumed to increase) drove many of the DER adoption decisions. It appears that the “energy crises” of 2000 sparked much interest in DER in California and New York. The value associated with the risk of power outages or DER equipment failure was hard to quantify but likely to be part of a facility manager’s internal risk assessment when considering DER system implementation. This risk level often influenced the number of technology units to purchase and whether to become completely grid independent. The hassle factors involved with DER system design, contractor selection, and permitting issues were apparent in the decision process at some of the sites although it is hard to quantify these costs. This report involved studying DER projects that were moving forward, not those that were scuttled, so this bias overlooked the cases where the project ended because of financial and institutional barriers. There are probably many sites that considered a DER project but abandoned the idea because of these barriers. However, the selection process used searched for sites that had made a positive DER adoption decision and, with the one exception of a McDonald’s in Brooklyn, did not find those that decided it was best not to install a DER system. Local development authorities could also cause problems and delays in DER projects by making site building permit process complicated and drawn out. There was no evidence that this was influenced by the addition of a DER system however. It may be a standard part of any construction process and not unique to DER projects. Banks apparently often want a three-year payback on projects but most of these projects have paybacks in the range of five to ten years. As a result, financing for the test sites’ DER projects was

Distributed Energy Resources in Practice
143
difficult to obtain. One way to avoid this need for a rapid payback was to combine the DER project with a plant expansion. This moves the DER project into another category of financing in which longer payback periods are acceptable. This was the method used by Harbec Plastics to obtain financing for their Capstone microturbine system. One important insight obtained from these site visits is related to the reliability of natural gas engines, considered a reliable standard by many DER energy developers. According to an engineer from Siemens associated with the Rochester Airport project, Waukesha makes the engine but not the generator. The engine and generator are tested independently but not together leading to many problems occurring after they are joined. In the airport’s case, the generator was slightly misaligned with the engine shaft and the vibrations caused the shaft to bend, and either the bearings were burning out or pieces of metal were wearing away and getting into the engine. It will be down for an estimated 6 to 8 weeks. This leads to the observation by Bill Cristofaro of IEC Engineering that the DER industry is a “service industry” that requires substantial design work, installation labor, and preventative and repair maintenance. DER systems often malfunction, need turning, adjustments and refinements. All of these maintenance issues should be considered in the cost and logistics of planning a DER system. Information on the likely target market for DER projects was obtained by talking with energy engineers during the site visits. Some engineers feel that mid-sized customers are a big market for cogeneration because these sites do not have in house expertise to design and implement their own DER system. Utilities know that they are not sophisticated enough to be a threat to self generate so they are able to raise rates higher than those customers with more bargaining power. These customers with high rates and sizable energy loads are good candidates for plug-and-play DER installations. Those customers with more bargaining power are able to use the option of DER systems to obtain rate reductions or other benefits from the utility company. It can also be viewed as the utility providing rate reductions in order to keep these customers from obtaining the financial benefits of a DER system. According to Cristofaro, a utility may be limited in the amount of rate reductions it can provide to, say, a university. However, the utility may give the university a large donation for research purposes. The transactions can be explained as unrelated but this approach may be common.


Distributed Energy Resources in Practice
145
6. Discussion of Overall Results
This case study and model validation project set out with five goals: 1. Analyze, describe, and disseminate DER site project experience 2. Describe real-world issues involved with DER adoption decision-making and system design 3. Validate DER-CAM financial estimates and technology adoption decisions with respect to:
a. Base Case utility bills, b. Estimated DER system annual cost, c. Estimated DER system annual benefit, and d. Technology adoption decision.
4. Improve DER-CAM accuracy and expand its capabilities based on real-world experience 5. Establish contacts with relevant DER sites for future research. This report gathered substantial amounts of information on the technology costs and DER system performance for ten case study sites, five of which were analyzed in depth. This report and the information obtained to date help to accomplish the first two goals. The results found in the case study site analyses describe the success of validating DER-CAM to the costs and technology adoption decision. DER-CAM was able to match the base case utility bills within a few percent. A comparison of the actual (or estimated by the site) base case utility bills and DER-CAM’s estimate of base case utility bills is presented in Table 45 and Figure 45. This is more significant and difficult than it may appear given the importance of accurately modeling the loads and tariff structures of various facilities. Some of the sites selected, however, did not have historic energy bills, and therefore could not be used for comparison. The sites with historic data often had enough to reproduce their entire load profile for different end uses. As a result, the loads accurately matched the site loads and accurately modeling the tariff structure and bill calculations became the primary concern. DOE-2 was used to generate end-use load profiles for all loads at three of the five sites. Of these three sites, none had actual base case utility bills that could be used for validation purposes. (The Orchid provided a rough estimate of their annual energy expenses.) Hence, this analysis did not provide a conclusive validation of the ability of DOE-2 to accurately model loads and to provide some support for its use as the major component in developing base case utility bills. Table 45: Validation of Base Case Cost of Utility Bills Prior to DER Adoption
Base Case Utility Costs ($/year) Site Actual DER-CAM Ratio A&P New building $245,000 GSB New building $490,000 The Orchid $1,333,000 (estimate) $1,474,000 1.11 BD $315,000 $334,000 1.06 USPS 1,283,000 1,261,000 0.98

Distributed Energy Resources in Practice
146
The validation of Base Case results were as follows:
0
200
400
600
800
1000
1200
1400
1600
A&P GSB The Orchid Pharmingen USPS SanBernardino
k$
Site DER-CAM
Figure 45: Validation of Base Case of Utility Bills Prior to DER Adoption
As expected, as the cost calculations became more complicated and involved more assumptions the results from the site analysis and DER-CAM’s estimated cost of the site’s selected technology (Scenario 5) diverged to a greater extent than in the base case validation. In the validation of DER system costs between the site’s estimate and DER-CAM, the DER-CAM estimates were about 86% to 90% of the costs estimated by the site. A comparison of DER system costs as estimated by the site and by DER-CAM in Scenario 5 is presented in Table 46 and Figure 46. The DER system costs are the annualized cost of the capital equipment plus the annual operating and maintenance costs, plus the cost of utility purchases for electricity and natural gas. Again, missing information on DER costs or historic bills hindered the comparison between site data and DER-CAM in three of the five sites and therefore some of these values for the site were estimated either from other data from the site (BD Biosciences Pharmingen) or using some data from DER-CAM (such as DER-CAM’s estimate of the annualized capital cost of the DER technologies for The Orchid). The differences in the representation of costs in DER-CAM may be due to the lack of detail in the tariff structure with respect to DER related charges, and additional installation and design costs will be required to implement DER projects.

Distributed Energy Resources in Practice
147
Table 46: Validation of DER System Annual Costs
DER Annual Costs ($/year) Site Actual Site Estimate DER-CAM Ratio A&P $241,000 $235,000 0.98 GSB NA $571,000 The Orchid $965,000 $1,278,000 1.32 BD $245,000 $266,000 1.09 USPS $1,269,000 $1,137,000 0.90 USPS with absorption chiller
$1,210,000 $1,054,000 0.87
0
200
400
600
800
1000
1200
1400
A&P GSB The Orchid Pharmingen USPS DG only
USPSAbsorption
Cooling
k$
Site DER-CAM
Figure 46: Validation of DER System Annual Costs
Some sites, notably A&P and The Orchid, provided estimates of their expected annual benefits obtained by installing a DER system. This information could be used to compare estimated annual benefits from DER-CAM without access to historic energy bills. There are two types of benefits reported: including capital costs and those without capital costs. Benefits including capital costs are the net reduction of costs considering both the post-DER system operating costs and the loan payments to cover the capital cost of the DER system installation. This is found by subtracting all subtracting all DER related costs (utility electricity and gas purchases, loan payments, O&M, etc.) from the base case utility bills. The benefits without capital cost are the difference between the base

Distributed Energy Resources in Practice
148
case utility bills and the annual operating costs without considering capital cost payments. The benefits including capital costs are presented below. Table 47: Validation of DER Annual Net Benefits (Including Capital Costs)
DER Annual Net Benefits ($/year) Site Actual Site Estimate DER-CAM Ratio A&P $4,359 $10,000 2.3 GSB NA $(81,000) NA The Orchid $368,000 $196,000 0.53 BD $70,000 $68,000 0.97 USPS $14,000 $124,000 8.86 USPS with absorption chiller
$73,000 $207,000 2.84
-150
-100
-50
0
50
100
150
200
250
300
350
400
A&P GSB The Orchid Pharmingen USPS DG only
USPSAbsorption
Cooling
k$
Site DER-CAM
Figure 47: Validation of DER Annual Net Benefits (Including Capital Costs)
The comparison of benefits without capital costs was also done to validate the benefits computed from DER-CAM results from three of the five test sites. The comparison of annual benefits (without capital costs) is presented in Table 48 and Figure 48. The Orchid’s results are given the tariff rate ($0.16/kWh, also referred to as the low rate) they had at the time of their DER decision although their value of estimated benefits is from current (high) tariff rates ($0.19/kWh).

Distributed Energy Resources in Practice
149
The benefits here are defined as the reduction in utility bills for electricity and natural gas without considering annuity payments on the capital cost of DER technologies. DER-CAM often had over-estimated the benefits of DER by as much as 200%. This may result from the optimistic technology performance in DER-CAM, such as 100% availability and assumptions that over-estimate the ease of use of residual heat to serve thermal loads. That is, simply because a thermal load exists within a facility does not mean that it is feasible, let alone economical, to serve this thermal load with CHP heat. It cannot be concluded, however, that the site’s estimates are more accurate than estimates in DER-CAM since all of these sites have not had enough operating experience to collect data and calculate their actual savings. The sites below compare benefits without considering the payments for capital costs. Table 48: Validation of DER Annual Benefits (Without Capital Costs)
DER Annual Benefits ($/year) Site Actual Site Estimate DER-CAM Ratio A&P $8,312 $11,777 1.44 GSB NA $218,495 NA The Orchid $700,000 $528,251 0.75 BD $103,000 $97,000 0.94 USPS $75,000 $217,544 2.9 USPS with absorption chiller
$159,000 $303,695 1.9
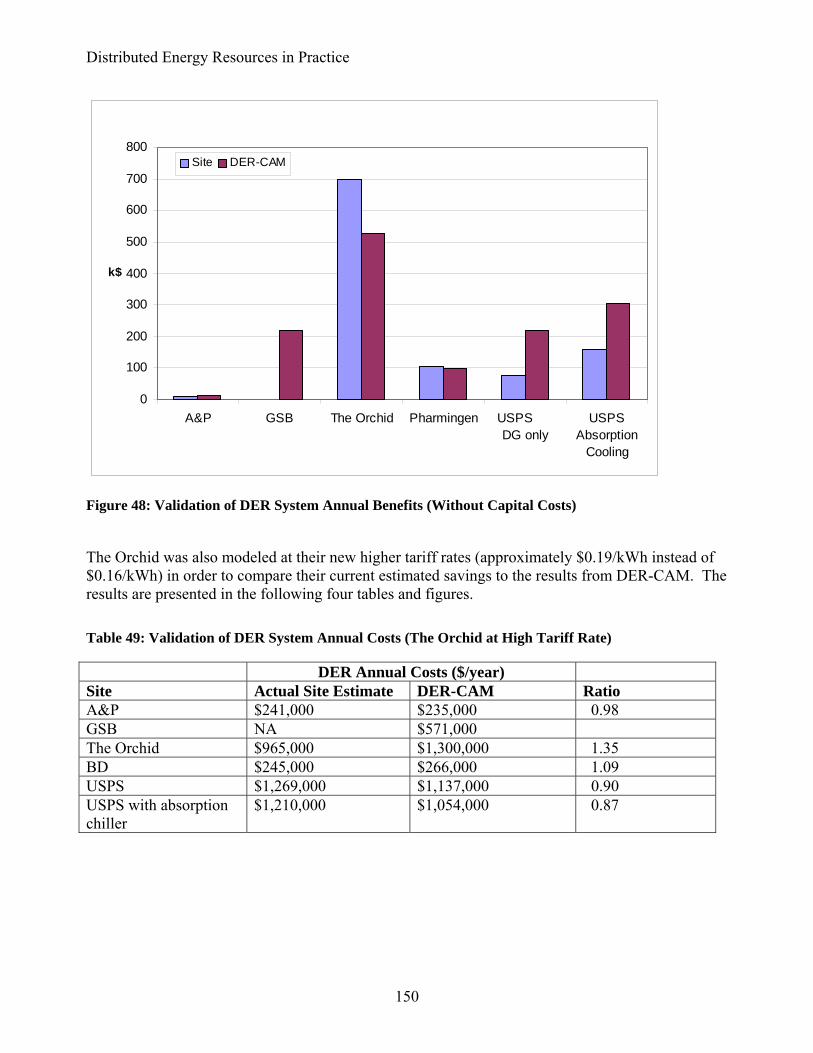
Distributed Energy Resources in Practice
150
0
100
200
300
400
500
600
700
800
A&P GSB The Orchid Pharmingen USPS DG only
USPSAbsorption
Cooling
k$
Site DER-CAM
Figure 48: Validation of DER System Annual Benefits (Without Capital Costs)
The Orchid was also modeled at their new higher tariff rates (approximately $0.19/kWh instead of $0.16/kWh) in order to compare their current estimated savings to the results from DER-CAM. The results are presented in the following four tables and figures. Table 49: Validation of DER System Annual Costs (The Orchid at High Tariff Rate)
DER Annual Costs ($/year) Site Actual Site Estimate DER-CAM Ratio A&P $241,000 $235,000 0.98 GSB NA $571,000 The Orchid $965,000 $1,300,000 1.35 BD $245,000 $266,000 1.09 USPS $1,269,000 $1,137,000 0.90 USPS with absorption chiller
$1,210,000 $1,054,000 0.87

Distributed Energy Resources in Practice
151
0
200
400
600
800
1000
1200
1400
A&P GSB The Orchid Pharmingen USPS DG only
USPSAbsorption
Cooling
k$
Site DER-CAM
Figure 49: Validation of DER System Annual Costs (The Orchid at High Tariff Rate)

Distributed Energy Resources in Practice
152
Table 50: Validation of DER Annual Net Benefits (Including Capital Costs, The Orchid at High Tariff Rate)
DER Annual Net Benefits ($/year) Site Actual Site Estimate DER-CAM Ratio A&P $4,359 $10,000 2.3 GSB NA $(81,000) NA The Orchid $368,000 $400,000 1.1 BD $70,000 $68,000 0.97 USPS $14,000 $124,000 8.86 USPS with absorption chiller
$73,000 $207,000 2.84
-200
-100
0
100
200
300
400
500
A&P GSB The Orchid Pharmingen USPS DG only
USPSAbsorption
Cooling
k$
Site DER-CAM
Figure 50: Validation of DER Annual Net Benefits (Including Capital Costs, The Orchid at High Tariff Rate)

Distributed Energy Resources in Practice
153
Table 51: Validation of DER Annual Benefits (Without Capital Costs and The Orchid at High Tariff Rate)
DER Annual Benefits ($/year) Site Actual Site Estimate DER-CAM Ratio A&P $8,312 $11,777 1.44 GSB NA $218,495 NA The Orchid $700,000 $732,124 1.05 BD $103,000 $97,000 0.94 USPS $75,000 $217,544 2.9 USPS with absorption chiller
$159,000 $303,695 1.9
0
100
200
300
400
500
600
700
800
A&P GSB The Orchid Pharmingen USPS DG only
USPSAbsorption
Cooling
k$
Site DER-CAM
Figure 51: Validation of DER Annual Benefits (Without Capital Costs and The Orchid at High Tariff Rate)
Further analysis comparing the site’s estimated costs and benefits with DER-CAM results from Scenario 2 (unlimited constraints on technology type or capacity) is presented in Appendix D. The financial analysis evaluated the total costs and benefits of the DER project itself. It did not consider the structure of the financial contracts established in the process of implementing the DER system. That is, it was not a financial analysis of the details of shared savings programs (e.g. The

Distributed Energy Resources in Practice
154
Orchid, BD, and to some extent A&P and USPS), or energy contracts (e.g. GSB), or the terms of any loan payments to cover capital costs. The payback period from DER-CAM was calculated by dividing the project cost (provided by the site or, if not available, estimated from DER-CAM) by the annual benefit without capital cost. Table 52: DER System Project Cost and Benefit: Comparison Between Site and DER-CAM’s Estimates
Source of Financial Estimates
Project Cost Grants Received
Annual Benefit (without capital cost)
Net Present Value (NPV) (including grants)
Payback (including grants)
A&P $145,000 $95,000 $8,312 $51,826 6 years A&P DER-CAM
$145,000 $95,000 $11,777 $94,274 4.2 years
GSB $4,353,375 $2,100,000 NA NA NA GSB DER-CAM
$4,353,375 $2,100,000 $218,495 $(518,466) 10.3 years
The Orchid NA $0 $700,000 $2,917,754 estimate
3.8 years
The Orchid DER-CAM
$2,636,109 $0 $732,124 $3,091,430 3.7 years
BD Confidential $112,500 $103,085 $530,000 estimate
2.5 years
BD DER-CAM
Confidential $112,500 $96,888 $506,218 2.7 years
USPS DG only
$480,000 $0 $75,000 $115,057 6.4 years
USPS DG only DER-CAM
$480,000 $0 $217,544 $1,246,014 2.2 years
USPS Absorption Cooling
$680,000 $0 ($204,000 potential)
$159,000 $581,520 4.3 years
USPS Abs. DER-CAM
$680,000 $0 ($204,000 potential)
$303,695 $1,729,543 2.2 years
This report also sought to compare the DER installation decision at each test site with those obtained by DER-CAM’s recommended technology set. In this aspect of validation it was possible in three of the five cases to compare the technology decision with the least-cost solution from DER-CAM. The exceptions were USPS San Bernardino, which has not decided upon its ability to utilize residual heat, and The Orchid where it was not known how much of their residual heat it is using for CHP and for absorption cooling.

Distributed Energy Resources in Practice
155
Table 53: Comparison of Site DER System Selection Decisions
Site Actual DER system DER-CAM optimal solution A&P 60 kW
Microturbine (60 kW) with CHP
60 kW Microturbine (60 kW) with CHP
GSB 600 kW Fuel Cells 600 kW capacity: (3 x 200 kW) with CHP and absorption chiller
765 kW PV (1 x 100 kW), natural gas engines (3 x 55 kW) with CHP, and natural gas engine (1 x 500 kW) with absorption chiller
The Orchid 800 kW Propane engine (4 x 200 kW) with CHP and absorption chiller
900 kW Propane engines (2 x 200 kW) with CHP, (1 x 500 kW) with absorption chiller
BD Biosciences Pharmingen 300 kW Natural gas engines (2 x 150 kW) with CHP
500 kW Natural gas engine (1 x 500 kW) with CHP
USPS San Bernardino 500 kW Natural gas engines (1 x 500 kW) no CHP, electric chiller, perhaps additional absorption chiller
1120 kW Natural gas engine (2 x 500) kW with absorption chiller, and microturbines (2 x 60 kW) with absorption chiller
It was difficult to model a test site’s decision because there are so many considerations that cannot be included into a computer model. Issues such as changing tariff rates and the availability of grants, for example, necessitate making assumptions about what the decision-makers knew and when they knew it when they made their decision to install a DER system. The fourth goal of this report is to improve DER-CAM accuracy and expand its capabilities based on real-world experience. This was accomplished to a large extent by the development of the Automation Manager. This Visual Basic front end allows for a rapid change of input parameters such as the site loads, technology data, and tariff information. This facilitates sensitivity analysis and aids in the iterative process that is a part of a test site model validation study. Furthermore, the validation of base-case loads against actual utility bills provided a means for checking the various aspects of demand and energy charges to ensure they are accounted for properly in the model’s cost calculations. This comparison led to the discovery of a limitation in using average loads in DER-CAM. The DOE-2 load data could be used to determine the difference between the peak load and the maximum average load and quantify the difference between them. It turned out to be a substantial difference at some sites, 20% at A&P, 16% at GSB, and 7.5% at The Orchid, and demand charges were adjusted accordingly. As part of this process of improving DER-CAM’s accuracy, improved DER technology data were obtained. These data came from each site investigated in this report and from other sites that were not fully analyzed. Turnkey cost information was obtained from a number of different facility

Distributed Energy Resources in Practice
156
types, DER technology systems, facility types, capacities, and regional locations. A number of potential improvements and enhancements to DER-CAM were conceived for future generations of the model. Some of these suggested enhancements were simple, such as improving the output data so that more information is accessible for calculations, and others were more difficult, such as including probabilities of utility or DER system failures into the cost calculations. The more accurate a model is at estimating future costs and technology adoption decisions the more powerful a tool it will be at finding opportunities for economic and environmental improvements and providing insight into likely DER adoption decisions. Although selected DER technologies do not always match up with DER-CAM results, the model is a good tool for finding least-cost energy solutions. Assuming most organizations are rational and have good information about DER technologies, this leads to greater correlation between DER-CAM results and real-world DER installation decisions. As a result, DER-CAM can be used to understand DER system installation on a larger scale and understand how utility, State, and Federal policies will influence these adoption decisions. The final goal for this report, to establish contacts with sites interesting for future work, is an ongoing process. The sites selected for in depth analysis were chosen because of their willingness to work with us, answer questions, return phone calls, and provide data on their DER system costs, load estimates, and expected benefits. In addition, they also shared their knowledge of the benefits and drawbacks of DER systems, the potential pitfalls, the mistakes made, lessons learned, joys and frustrations encountered, and the excitement of working on a developing area of energy design. The results of this report may influence some of these relationships, but to date these sites have been willing to provide information beneficial for future research and others working on DER systems.

Distributed Energy Resources in Practice
157
7. Limitations of Analysis
There are many complications involved in modeling DER systems. These difficulties can be understood in part by reviewing the assumptions, described above, necessary to complete the model. The major limitations of this model are described below. The first two limitations are associated with the application of the model, and the rest are associated with the limitations of the model itself. Prediction of what customers should do vs. what they will do One major limitation of the model used in this analysis is its ability to accurately predict customer adoption patterns. That is, the model comes closer to determining what the customers should do than what they will do. Even if this model were able to accurately estimate, from an energy engineering standpoint, the packages of DER technologies that are able to meet a customer’s need for power, heating, and cooling, it may not provide enough insight on how customers are likely to behave in the real world. This is due to changing prices and changing costs of technologies, perceptions about DER technologies, specifics of customer sites that vary in ways not included in the model, energy and environmental policy regulations and incentives, and regional availability of technologies and expertise. The model sees only static costs and equipment efficiencies. However, the model will still play a useful role in exploring the sensitivities of DER technology adoption decisions to factors that are included in the model. DER-CAM can be used as a tool to explore scenarios involving various forms of DER policy initiatives, technology performance improvements, and economic conditions. Financial costs and benefits are a snapshot in time This study focused in part on validating DER system costs and benefit estimates from the site and from DER-CAM. However these values often were changing as the project was being designed, installed, or operated. One energy developer, when asked if he had DER system cost estimates, said that the costs were “fluid” because the site requirements, and the potential for grants received changed frequently. There are many points at which costs may be estimated: • At the initial DER installation feasibility study; • At time of DER adoption decision; • At start of project or during project installation (includes some installation overruns); • After the project is installed and operating (includes O&M overruns). The difference between reported costs and true costs (e.g. asking someone what they spend for O&M compared to real O&M costs) may be large even if they keep detailed records and are trying to be accurate. Similarly, what a company thinks it's utility rates are and what they actually are may be different. The model requires a snapshot in time be taken via the data gathering and that all data gathered refer to the same time period. Often all types of required data are not available for one given period. Additionally, the snapshot approach disallows for the variation of costs and other conditions across time. This can be summarized by the old presidential question of trying to determine what the decision-maker knew and when they knew it. Grants and grants that were eligible for other technologies not chosen by the test site are not included in DER-CAM. This is due to the difficulty
Distributed Energy Resources in Practice
158
of knowing what information the decision makers at each site had at the time they made their decision. The perception of a DER system cost and its reliability may be more important than the actual cost and performance. Due to the difficulty in obtaining accurate performance data the decision making process is often influenced by perceptions of how technologies perform. These perceptions may be influenced by years of DER experience, energy developers, technology vendors, site visits, or information from colleagues. Other limitations are the result of limitations of the structure of DER-CAM. Treatment of CHP heat output has many forms and qualities This model assumes that all heat is the same. However, in a real CHP system, the specific type and capacity of the thermal end-use, temperatures, flow rates, distances, pressures, and efficiency curves, become important in a specific application. A thermodynamic model would need all of these parameters to be specified. However, because of the limitations of data available, this level of detail was not able to be provided. Specific applications determine technology performance and cost of retrofits Many of the difficult details of designing and installing a DER system were not included in the model. The extra plumbing and electrical hardware needed to operate these systems could involve substantial costs and hassle. Hidden costs of maintaining the DER systems were not included (such as finding a turbine refurbishment specialist). Also, these heat distribution networks were assumed to operate at 100% efficiencies, where as they would really involve some losses along the way. Heat production varies functionally with electric production Each CHP technology does not have fixed efficiency for converting fuel consumption to useful heat or cooling power. However, because of the difficulties of obtaining all of these data and incorporating it into the model, fixed efficiencies are assumed in the forms of the parameters α,β, and γ. Nevertheless, this may not be a drastic limitation since many technologies stay near their optimal efficiencies at a wide rage of operating capacities. The DOE-2 building modeling software did not account for thermal mass The DOE-2 model did not consider each building’s thermal mass characteristics and its influence on energy consumption. DOE-2 has the capability to consider some thermal mass and thermal energy storage, but it does not do it well even when the input is done correctly. This input depends on specific geometric parameters from the modeled buildings, increasing the complexity of the model. For example, in the DOE-2 model used for this analysis, generic floor densities were defined (e.g., low, medium, high) which do not accurately represent thermal storage. The next version of the building energy simulation model, EnergyPlus, is supposed to correct for this issue. Theoretical bundling of technologies The model assumes that CHP and cooling are necessarily packaged together with generation capacity, and are not separate technologies requiring distinct capacity decisions and cost considerations. The costs of the CHP and cooling are considered, in the sense that they are added to the cost of generation capacity if selected through the mode. However, if you want to install 800

Distributed Energy Resources in Practice
159
kW of generation capacity and enough CHP and cooling to take full advantage of the waste heat generated, the model will select two generators with CHP and two generators with cooling, as opposed to selecting generators sized to minimize generation costs (but taking into consideration heat and cooling loads), and then separately selecting CHP and cooling to minimize those costs (again, while considering the waste heat available). Each combination of technologies is included in the model’s database. Only a small subset of available technologies is included in the model Assuming a competitive market for DER technologies, the subset may be representative of costs across the market. For nascent technologies, such as microturbines and fuel cells, however, choice of the brand in the market may not be sufficient to force competitive pricing. Risk associated with not waiting to purchase DER at a later date Whenever a technology is purchased, there is always a risk that a better, cheaper or more reliable technology will become available at a later date, perhaps even the next day. This risk has not been quantified here and has not been considered in the model. This can also be seen as an option value. The decision to do a project is an option and by completing the DER project that option is lost. This results from DER projects not being “liquid” and hard to reverse. The sensitivity of the DER system costs to fluctuations in natural gas prices (e.g. spark spread rates), standby charges, and demand charges is provided for each site. Reliability of equipment not considered The model assumes that all equipment is 100% reliable and available, where as real reliability may vary between technologies, or even within them. Future costs predicted by past costs Since future costs for electricity, gas, and capital expenditures are not and cannot be perfectly known, they are predicted by past costs. Although use of past costs to predict future costs may be the best available method, it is not perfect. Potential fluctuations in prices are not done for any given model. These price fluctuations were handled by sensitivity analysis. Technology costs may be site specific Due to logistical and physical differences from site to site, the actual cost of technologies (including installation, etc.) may vary from between sites. The model does not take into account inter-site variances in technology costs. There will also be regional differences for turnkey costs. Since design and installation costs are at typically at least as much as technology costs, these prices will vary by region. Construction costs on Long Island, for example, are noted to be “twice as high” as elsewhere.43 When available, a site’s turnkey DER system costs were used. Information on technologies not chosen by sites not available While the sites often provided detailed information on the technologies they did select, they did not possess information on the technologies they did not choose. Technologies not chosen did not, therefore, include the site-specific adjustments accorded to the chosen technology. DER-CAM, therefore, was run using the site’s capital cost for the technology installed, but the general cost for
43 Hugh Henderson, CDH Energy, personal communication, September 2002.
Distributed Energy Resources in Practice
160
technologies not installed at the site. Rebates were included into the capital costs of any eligible technologies at a particular site. Effectiveness of Sales and Marketing not taken in to account Occasionally, through the sales and marketing efforts of a technology manufacturer or developer, the technology would be presented to the customer, bundled with rebates and discounts, or at no cost at all but as part of a “revenue share” or “guaranteed savings program.” The effectiveness of such promotions in influencing the decision-making process is not factored into the model. Also, a manufacturer’s or developer’s sales and marketing efforts will often be aimed at promoting a technology in which they have particular expertise, rather than a promotion of DER technologies in general. Data requirements sometimes impossible to meet: assumptions must be made Due to the stringent requirements of the model for data, including hourly electricity, heat and cooling data that are often not available, assumptions must be made. Modeling programs such as DOE-2, or in the future EnergyPlus, that must be used to estimate hourly loads, introduce added uncertainty into the model. Likewise, dependency on accurate tariffs, which again are sometimes unavailable in within realistic time frames, introduces a limitation on the model. Using site or developer provided data to predict decision-making Sites and developer provided data occasionally differs from third party data, such as from utilities or manufactures. While a reliance on site and developer provided data is be appropriate in replicating there technology decision, it may not be for determining validity of our model to the greater world. Champion problem DER-CAM and this validation study often rely on the DER project champion for information about the decision-making process, the technologies installed, and data. The champion has a vested interest in projecting the project in the best light. This holds true if the champion is an internal member of the company installing the DER system or an energy consultant. Some champions may want to selectively release information in order to protect their interests or the image in the particular DER system of their preference.

Distributed Energy Resources in Practice
161
8. Areas for DER-CAM Improvement and Further Study
The study and intensive use of DER-CAM for validation of actual site cost and energy load data provided numerous ideas for improving the model. These improvements to DER-CAM are summarized into three main categories: interface features to add, data to obtain, and capabilities to add to DER-CAM. 8.1.1 Interface features to add to DER-CAM
Interface features are improvements to the modeling interface and ability of DER-CAM to accept acquired data in an understandable or easy to import format. Improving the tariff interface in DER-CAM would make the model easier to include tariff information from utilities into DER-CAM. Many tariffs, for example, have unique structures of demand charges (e.g. coincident and non-coincident) that make entering the tariff into DER-CAM confusing. This feature should take into account the peak load when computing demand charges. Typically, demand charges were increased by 10% to 20% to compensate for the lack of peak loads in the model (average loads are used for each month). The level of increase in demand charges was arrived at through an analysis of the difference between the peak loads in DOE-2 and the average loads developed for input to DER-CAM. DER-CAM is also not able to handle directly time of use tariffs where there are not three periods per day. Some tariffs, for example, do not have a peak time period in the winter. The model can be adjusted to compensate for this issue. The output, however, in terms of electricity purchased on-peak, mid-peak, and off-peak for the year, will be less accurate. Also DER-CAM output displays the level of electricity purchases for each time period but not seasonally, and hence seasonal differences will not be detected. 8.1.2 Additional data to obtain for DER-CAM
Improving the quality of input data for DER-CAM is an ongoing process. Turnkey cost information was obtained from a number of different facility types, DER technology systems, facility types, capacities, and regional locations. The technology table, listing each technology type, capacity, fuel, efficiency, capital and operating costs, was updated for many of the technologies in the process of completing this report as improved information is obtained. Obtaining improved data on utility tariffs including their standby charges and special rates for qualifying facilities has proved difficult. This is because the QF benefits and standby charges vary between utilities and each case study is within a different service territory. Competitive transition charges in California are also a consideration, including the effective period they are considered. 8.1.3 Capabilities to add to DER-CAM
A number of potential improvements and enhancements to DER-CAM were conceived for future generations of the model. Some of these suggested enhancements were simple, such as improving the output data so that more information is accessible for calculations, and others

Distributed Energy Resources in Practice
162
were more difficult, such as including probabilities of utility or DER system failures into the cost calculations. The more accurate a model is at estimating future costs and technology adoption decisions the more powerful a tool it will be at finding opportunities for economic and environmental improvements and providing insight into likely DER adoption decisions. Although customer-selected DER technologies do not always match up with DER-CAM results, the model is a good tool for finding least-cost energy solutions. Assuming most organizations are rational and have good information about DER technologies, this leads to greater correlation between DER-CAM results and real-world DER installation decisions. As a result, DER-CAM can be used to understand DER system installation on a larger scale and understand how utility, State, and Federal policies will influence these adoption decisions. Capability additions are completely new functions of DER-CAM that improve the modeling process or allow modeling of issues that were not previously considered. Capabilities that should be added to DER-CAM include considering technology costs as individual units with some marginal cost value (that is, the capital cost of the next unit depends on the number of units installed) and another cost function for the design and installation costs. In short, this capability will allow nonlinear cost functions to be used in the model. Another capability DER-CAM should have is the ability to accurately model technologies operating at partial capacities. Currently, efficiency is constant throughout all capacity levels of a technology. The model should consider reliability and stochastic variables to simulate the effects of power outages and equipment failures. This may need to be approached using different modeling software or by finding a way to simulate random variables by using non-random variables. The tariff structure in DER-CAM does not include taxes. This results in energy charges being off by about 8%, depending on the level of state taxes. Project grants are also difficult to include into the current DER-CAM set up. Grants have to be applied in a case-by-case basis and may involve multiple iterations to ensure that the grants are not distorting the project in terms of the number of units that may be purchased for the amount of grant money provided. For example, adjusting the capital cost of microturbines in a model due to a grant for a DER project with one microturbine may cause the model to choose multiple microturbines although the grant was only available for one unit. This may be corrected through coding in the model and renaming certain technologies in the technology table but a new capability would make this process easier. Currently there is a conservation of DER technologies principle in DER-CAM or at least in the Automation Manager Visual Basic front end. New technologies cannot be added to the database without removing another technology (in a sense, technologies cannot be created or destroyed, they only change form). In effect, technologies can only be renamed and their characteristics changed. This causes difficulties if it is necessary to add new technologies to the table and to see how these technologies compare to others in the model.

Distributed Energy Resources in Practice
163
DER-CAM currently provides only one year of cost information and the decision analysis is for the upcoming year. It would be useful to add multiple year capabilities to the model. There are many areas for additional research. Better data both on the technology specifications, and the thermal load data need to be obtained. Including the installation and retrofit costs of CHP systems for different applications would make this result more accurate of the true costs facing businesses contemplating these systems. Examining buildings with substantial thermal loads, such as hospitals and hotels, and the thermodynamic performance in these applications would provide more information about areas CHP technologies are likely to be employed. The previous assumptions and limitations sections also provide for many areas of research to improve this model and the results. Further areas for expansion of this model include: • Incorporating GIS into the model to determine different levels of desirability of DER systems
based on energy prices, utility infrastructure, building codes, environmental regulations, environmental quality conditions such as air quality, types of businesses in commercial and industrial areas, and existing and planned development patterns.
• Displaying the results of the technology adoption model, including estimates for pollution emissions, in a GIS format in order to assist in analyzing regional DER adoption patterns and their effect on energy planning and environmental protection. Emissions information (CO2, NOx, PM10, VOCs) could be included for additional technologies in DER-CAM. This information could be used for future air quality studies or to compare the impacts of DER and central plant emissions.
• Include interruptible loads and direct load controls into the model both as a customer option and utility level control mechanism.
• Incorporate tax incentives and depreciation schedule changes. • Consider the potential for energy storage technologies and the thermal storage of heat loads
within buildings. • Run a longer term simulation with estimates about future energy prices, volatilities, and
technology costs and performance. • Consider modeling the costs and effects of utility power outages on the desirability of DER
systems. • Include additional information about energy efficiency and renewable energy into DER-
CAM. Estimate potential savings by installing standard packages of energy efficiency technologies.
• Include a customer adoption of real-time pricing signals into the customer’s energy demands. This may involve changing the model to a dynamic programming model to incorporate changing input data.
• Investigate the reliability and power quality benefits of DER and CHP systems. • Integrate DER-CAM into a utility capacity expansion-planning model. Examining how DER
adoption patterns are likely to evolve in a given region will provide information for distribution company planning. Integrating these two models will result in a more systematic planning process and increased efficiency of natural resource use.

Distributed Energy Resources in Practice
165
9. Conclusion
This analysis had better success at achieving the first two parts of the third goal of this paper that dealt with validating the more quantitative aspects of energy systems. That is, using DER-CAM to compare the base case costs prior to a technology adoption decision, and then using DER-CAM to predict costs of a particular DER system. The more qualitative aspects of deciding upon a specific package of technologies, and the influences on those decisions, were more difficult to model. DER-CAM provides more guidance into what organizations should do rather than what they will do. The desire to maintain diversity in the types of organizations in this study, their regional distribution, and the types of technologies installed led us to focus on selecting the five sites studied. A lack of historic data from some sites is balanced by their openness and willing to provide information and answer questions about their DER system and the design and installation process. It is possible that additional data on the projects’ benefits and performance will be available as the systems are installed and operational. The site selection and data gathering process were proceeding roughly simultaneously with some data arriving after the site selection process was completed. The result is some excellent data for sites that are not among the five sites thoroughly analyzed. With the benefit of this hindsight it may have been beneficial to include other sites into this analysis in order to provide further validation of DOE-2’s modeling accuracy, obtain historic data on base case energy bills, and, most importantly, compare actual DER system costs, after the system is operating, with estimates made by the site and by DER-CAM. Although the number of sites used to validate DER-CAM itself was small, the results were positive enough to indicate that DER-CAM is a useful policy tool and potentially a useful engineering design tool for providing beneficial technology sets for specific facility sites. In the process of completing this report much insight was gained about the strengths and weaknesses of DER-CAM and opportunities to improve the model. In addition, this study provided an opportunity to learn about the details of the DER system design, installation, and the performance of various technologies in difference applications. The relationships developed through the process of completing this report may provide a testing ground for future research such as work on system design, integration, reliability analysis, control system software development, emissions testing, and other areas. The knowledge gained by different sites sub-metering their systems will also prove extremely valuable to understand, for example, the potential residual heat available of different technologies, their availability and patterns of outages, and the ability to serve thermal loads with this residual heat. This knowledge will help to formulate enhanced versions of DER-CAM in the future and provide better tools for policy making and forecasting DER adoption patterns in many regions.


Distributed Energy Resources in Practice
167
10. References
Bailey, Owen, and Boubékeur Ouaglal, Emily Bartholomew, Chris Marnay, and Norman Bourassa (2002). An Engineering Economic Analysis of Combined Heat and Power Technologies in a µGrid Application. Electricity Markets and Policy Group, Lawrence Berkeley National Lab:LBNL-50023. March. Edwards, Jennifer L., Chris Marnay, Emily Bartholomew, Boubékeur Ouaglal, Afzal S. Siddiqui, and Kristina LaCommare (2002). Assessment of µGrid Distributed Energy Resource Potential Using DER-CAM and GIS, Electricity Markets and Policy Group, Lawrence Berkeley National Lab: LBNL-50132. January. Marnay, Chris, Jennifer L. Edwards, Afzal Siddiqui, and Michael Stadler (2002). Economic Parameters of µGrid Distributed Energy Resource Adoption. Electricity Markets and Policy Group, Lawrence Berkeley National Lab (in press). Marnay, Chris, Jennifer Edwards, Ryan Firestone, Srijay Ghosh, Afzal Siddiqui, and Michael Stadler (2002). Effects of a Carbon Tax on Combined Heat and Power Adoption by a Microgrid, LBNL-51771. Presented at the Second International Symposium on Distributed Generation, Stockholm, Sweden. October 2-4 2002. Minott, Jason Stefan (2002). Feasibility of Fuel Cells for Energy Conversion on the Dairy Farm. Master of Science thesis in Biological and Environmental Engineering at Cornell University. May. Newnan, Donald G. and Jerome P. Lavelle (1998). Engineering Economic Analysis, 8 Newnan, Donald G. and Jerome P. Lavelle (1998). Engineering Economic Analysis, Seventh Edition. Engineering Press. Austin, Texas. Payne, Christopher, Anthoney Radspieler, and Jack Payne (2002). Hurdling Barriers Through Market Uncertainty: Case Studies in Innovative Technology Adoption. Electricity Markets and Policy Group, Lawrence Berkeley National Lab. August. U.S. Department of Energy (US DOE, 2000), Report of the US DOE’s Power Outage Study Team: Findings and Recommendations to Enhance Reliability from the Summer of 1999. Final Report. March.